GIS Methods - Maine Sea Grant
37
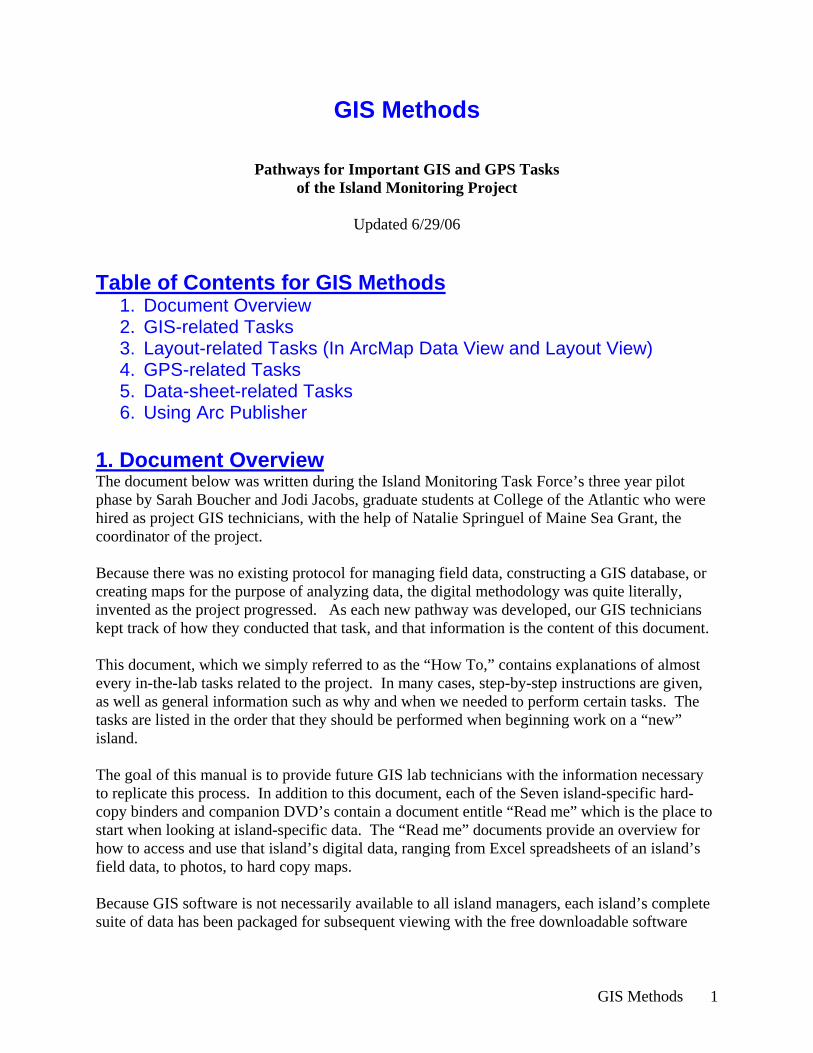
GIS Methods 1 GIS Methods Pathways for Important GIS and GPS Tasks of the Island Monitoring Project Updated 6/29/06 Table of Contents for GIS Methods 1. Document Overview 2. GIS-related Tasks 3. Layout-related Tasks (In ArcMap Data View and Layout View) 4. GPS-related Tasks 5. Data-sheet-related Tasks 6. Using Arc Publisher 1. Document Overview The document below was written during the Island Monitoring Task Force’s three year pilot phase by Sarah Boucher and Jodi Jacobs, graduate students at College of the Atlantic who were hired as project GIS technicians, with the help of Natalie Springuel of Maine Sea Grant, the coordinator of the project. Because there was no existing protocol for managing field data, constructing a GIS database, or creating maps for the purpose of analyzing data, the digital methodology was quite literally, invented as the project progressed. As each new pathway was developed, our GIS technicians kept track of how they conducted that task, and that information is the content of this document. This document, which we simply referred to as the “How To,” contains explanations of almost every in-the-lab tasks related to the project. In many cases, step-by-step instructions are given, as well as general information such as why and when we needed to perform certain tasks. The tasks are listed in the order that they should be performed when beginning work on a “new” island. The goal of this manual is to provide future GIS lab technicians with the information necessary to replicate this process. In addition to this document, each of the Seven island-specific hard- copy binders and companion DVD’s contain a document entitle “Read me” which is the place to start when looking at island-specific data. The “Read me” documents provide an overview for how to access and use that island’s digital data, ranging from Excel spreadsheets of an island’s field data, to photos, to hard copy maps. Because GIS software is not necessarily available to all island managers, each island’s complete suite of data has been packaged for subsequent viewing with the free downloadable software
-
Upload
khangminh22 -
Category
Documents
-
view
1 -
download
0
Transcript of GIS Methods - Maine Sea Grant
GIS Methods 1
GIS Methods
Pathways for Important GIS and GPS Tasks of the Island Monitoring Project
Updated 6/29/06
Table of Contents for GIS Methods
1. Document Overview 2. GIS-related Tasks 3. Layout-related Tasks (In ArcMap Data View and Layout View) 4. GPS-related Tasks 5. Data-sheet-related Tasks 6. Using Arc Publisher
1. Document Overview The document below was written during the Island Monitoring Task Force’s three year pilot phase by Sarah Boucher and Jodi Jacobs, graduate students at College of the Atlantic who were hired as project GIS technicians, with the help of Natalie Springuel of Maine Sea Grant, the coordinator of the project. Because there was no existing protocol for managing field data, constructing a GIS database, or creating maps for the purpose of analyzing data, the digital methodology was quite literally, invented as the project progressed. As each new pathway was developed, our GIS technicians kept track of how they conducted that task, and that information is the content of this document. This document, which we simply referred to as the “How To,” contains explanations of almost every in-the-lab tasks related to the project. In many cases, step-by-step instructions are given, as well as general information such as why and when we needed to perform certain tasks. The tasks are listed in the order that they should be performed when beginning work on a “new” island. The goal of this manual is to provide future GIS lab technicians with the information necessary to replicate this process. In addition to this document, each of the Seven island-specific hard-copy binders and companion DVD’s contain a document entitle “Read me” which is the place to start when looking at island-specific data. The “Read me” documents provide an overview for how to access and use that island’s digital data, ranging from Excel spreadsheets of an island’s field data, to photos, to hard copy maps. Because GIS software is not necessarily available to all island managers, each island’s complete suite of data has been packaged for subsequent viewing with the free downloadable software

GIS Methods 2
ArcReader (the “Read me” file explains how to do that, and this document explains how to replicate the publishing of future data.) Finally, each island also contains another GIS-related text document, separate from this one, entitled “documentation.” That document is quite specifically a chronological tracking of all GIS-related tasks that were undertaken on that island. This was necessary to prevent confusion with three people working on the GIS files. It will also prove useful for future GIS technicians as they review an island’s GIS files for the purpose of adding new data. All GIS tasks were performed in the GIS lab at College of the Atlantic (COA), thus pathnames are specific to the Lab, but can be changed as appropriate. We received extensive help from Gordon Longsworth, the Director of COA’s GIS lab. Evaluating the Use of GIS in Monitoring Islands There are opportunities and challenges inherent in utilizing GIS technology and mapping capabilities for the purpose of monitoring recreational impact on islands. One of the graduate students involved in this project, Jodi Jacobs, conducted her graduate thesis on this topic. While analyzing the potential and pitfalls of mapping in general, she specifically analyzed the GIS-related work of the Island Monitoring Task Force as her primary case-study. This student was involved in the project from field to lab. Thus, anyone who undertakes the use of GIS for monitoring islands should refer to her thesis because it provides an extensive analysis that is grounded in active project implementation. Her work stands alone as a valuable evaluation of the use of GIS in this project. Her final thesis was sent to MITA in 2006 and is also available from Natalie Springuel at Maine Sea Grant.

GIS Methods 3
2. GIS-related Tasks
To map your computer to the J: drive The J drive has been set up on the GIS lab computers and contains this project’s files only.
1. Right click Windows start. 2. Choose Explore. 3. On the toolbar, Click on Tools/Map Network Drive. 4. Click on the dropdown menu for the Drive: tab. 5. You will see all the possible drive letters. Wherever there is a path name that means the
drive is in use. Notice the J with our SG data. Click on that. 6. Next, Click Browse next to the Folder: tab and navigate to the Sea Grant folder on
GIS/H2o/... 7. Be sure "Reconnect at logon" is checked.
To name the islands with the Coastal Island Registry Number (CIREG).
1. Add the Maine Coast layer to a new map in Arc Map 2. The CIREG can be found in the Maine Coast layer by choosing select by attribute in the
Selection menu, typing in the island name (in quotations), and scrolling down in table to see where it selected it and look in CIREG column. That number is what we use to name islands.
To find an island’s CIREG when the island name is not listed
1. Open a new mxd and add the ‘mcst7_83 polygon.’ 2. Using the zoom and Identify keys, sort through islands that would be in proximity to
the one you are searching out. 3. Turn on the ‘label features’ by right clicking on the mcst7_83 polygon or whatever
layer you are analyzing. This will also make identifying the island easier. 4. Once you have secured your location, keep using the identify button, the MITA book,
Delorme atlas etc to zero in on the island in question. 5. Once your island is identified use the ‘Select features’ key to highlight your island. 6. Either open the attribute table, and show the ‘selected feature only’ or use the identify
button to gain the CIREG number. 7. If possible, update the attribute table with the island name in the ISNAME column.
Using the insert/text key add in the island name Georeferencing To reference the island to an actual point in space in the Gulf of Maine
Getting Aerial photos from Maine Office of GIS 1. Identify which quad the islands are in: From the base layers folder in Arc Catalogue, paste the following two layers in Arc Map: usgs24kindex and mcst7_83. Make mcst7_83 transparent at 80 percent so you can see both the quads and the coast. Use the Identify tool to click on all the quads that the island overlaps to see which quads you need to download. (One island may overlap in more than one quad. For example Long Island is in three quads: Blue Hill, Brooklin and Bartlett).

GIS Methods 4
2. Search for Aerial photos from Maine Office of GIS website: http://apollo.ogis.state.me.us/catalog/catalog.asp?state=2&extent=24k
1. Data > 24Ktile > medoq > next > pick the quad(s) you want > show data > download > save to desktop (it will automatically be named “medoq” )
2. In the DOQQ folder in base layers (Digital orthoquarterquad, means photo is exactly from above). Create a folder for the island.
3. Unzip the file by double clicking on it and selecting “use evaluation version” > then click on the “extract” icon and extract to location in DOQQ island folder > rename in ArcCatalog to Island name. You may need to restart ArcCatalog before the files appear.
Georeferencing
1. Import aerial photo (click on file in ArcCatalog and drag it into Table of Contents of a new map document)
2. Right click photo’s layer and choose Zoom to Layer 3. Zoom in so that the island fills the screen
a. Save this display – in View, choose Bookmarks, and rename the view with the island’s name (this allows you to see this particular view at any time)
4. Import scanned image (field map) 5. Activate georeferencing toolbar (in view > toolbars)
a. Right-click gray area on screen, click georeferencing 6. Select the scanned image name in layer drop-down menu 7. Under georeferencing drop-down, choose Fit to display
a. Make sure scanned image is in top of aerial photo in Table of Contents b. Make scanned image transparent
i. Right-click layer, Properties, Display, Transparency (75% or so) 8. Click on Add Control Points icon to make links 9. Click on scan first, then the corresponding point on the aerial photo to make control
points a. Make a minimum of 3 links b. You can delete a set of points by clicking on the table icon and deleting the
row you just created 10. When satisfied with the line-up, choose Update georeferencing from the
georeferencing drop-down menu 11. From the georeferencing drop-down menu, choose Rectify
a. Save the new image something like “rectify_coastal island registry number, DMR(or location).tif” Always use underscores, not spaces
b. Save the new image in the scans folder Creating New Shapefiles in ArcCatalog
1. Click on the folder in which you want a new feature - the folder icon opens 2. Under File, New, choose shapefile (or desired feature) 3. Name the new feature something meaningful using underbars instead of spaces 4. Under feature type, choose line, point, or polygon, etc. 5. Click the Edit… button to set the spatial reference, then click Import

GIS Methods 5
a. Browse to the feature with known spatial reference data that corresponds with the map – for this project, choose mcst7_83 and click Add 6. Click OK – you can then click on the new feature in ArcCatalog and drag it into either the map view window or the Table of Contents in ArcMap to add it to the map 7. It is a good idea to give all newly created shapefiles metadata. See the section in this doc that reviews metadata.
To set the coordinate system for a shapefile In the case that the shapefile has been downloaded from a GPS with an unknown coordinate system, as in the case of the ANP Trimble 1. Open Arc Catalogue 2. In Arc Catalogue, right-click on the shapefile whose coordinate system you want to
set > properties 3. select the tab “fields” and highlight the “shapes” row 4. When it shows you the Field Properties dialogue box, at the row for spatial reference,
click the little box with the ellipses “…” 5. In the spatial reference properties dialogue box, click import and 6. Browse to the feature with known spatial reference data that corresponds with the
map – for this project, choose mcst7_83 and click Add 7. Click OK – you can then click on the new feature in ArcCatalog and drag it into
either the map view window or the Table of Contents in ArcMap to add it to the map
Snapping To truly connect lines – this is the only method by which you can be sure lines meet. For instance, Snapping is to be used when you are drawing any ray from a campsite center point. 1. Activate the Editor toolbar 2. Be sure that the layer you wish to work with is shown in the pull-down menu at the top of the display 3. Under the Editor toolbar, click Start Editing 4. To create a new feature, select this from the second pull-down menu at the top of the display 5. Choose snapping from the Editor toolbar 6. Check the boxes in the new window that you would like to “snap” to – for the case of drawing in the initial survey zones, this includes both the layer itself and the shore layer 7. Use the sketch tool to make the lines – hover the mouse over the shore outline to activate the snapping action. Double-click when you reach the last point of the line to create it. Creating Radial Transect Rays from a Campsite
1. Create a shapefile in Arc Catalogue for the campsite center point (need to have this data in UTM/NAD83)
2. Create a second shapefile (this one a polyline) for the rays from the radial transect data and do all the following on that second shapefile.
3. Click on the attribute table icon to update the attribute table and create attributes as needed

GIS Methods 6
a. Note: if you are changing the attribute table this way, you need to add the desired fields to the layer’s attribute table before entering an editing session. Do this before starting to insert the radials. (Open layer’s attribute table and click on options then Add field, make the type be text) 4. Set up the editing
a. Select layer to edit b. Under snapping, choose snap to Campsite A layer. Choose all three (vertex, edge,
end). c. Under options in editor, in Units Tab, change Direction Type to North Azimuth;
change directions units to Degrees, Minutes, Seconds d. Note: the Direction Offset does not need to be taken into consideration in the case
for HHA (and perhaps for the other islands) as the aerial photo takes care of the correction.
5. Using the pencil tool, click on the campsite and move away from it slightly in the general desired direction
6. Right click and choose Direction/Length. For direction: use dash instead of “.” for ex: 70.5 degrees should be 70-5) and for length use “.” (as in 4.27meters)
7. Set the direction and length. Click Enter. 8. Right click and choose Finish Sketch 9. Under Editor, choose Save Edits (just in case!) 10. Repeat Process for other rays 11. Stop edit session and save 12. Connect the end of each ray to create the boundary line of the campsite
a. Set up the editing i. Select layer to edit
ii. Under snapping, choose snap to Radial Transect layer iii. Connect the end of the rays iv. Click “Finish Sketch” v. Return to the edit toolbar and chose save edits and then choose stop
editing vi. Save map
Breaking down Radial Layer into Separate Rays – Converting to a Coverage File * This process was needed since we originally made all of the rays one feature – in order to make them separate so they each have their own associated attributes, we performed the following. In doing so, we were also able to have a separate layer for the outline and then could make the campsite polygon. *
1. In ArcCatalog, right click the layer of the radials used to find flagged points on campsite boundary (may be something like, radial_trans)
2. Choose Export, then to Coverage a. Name the coverage radial_new (2 or 3 in the case of Bangs Island with
multiple radial layers) (this may be the default name) 3. Bring the Coverage file to the map 4. Select the individual rays (called arcs) using the shift key
GIS Methods 7
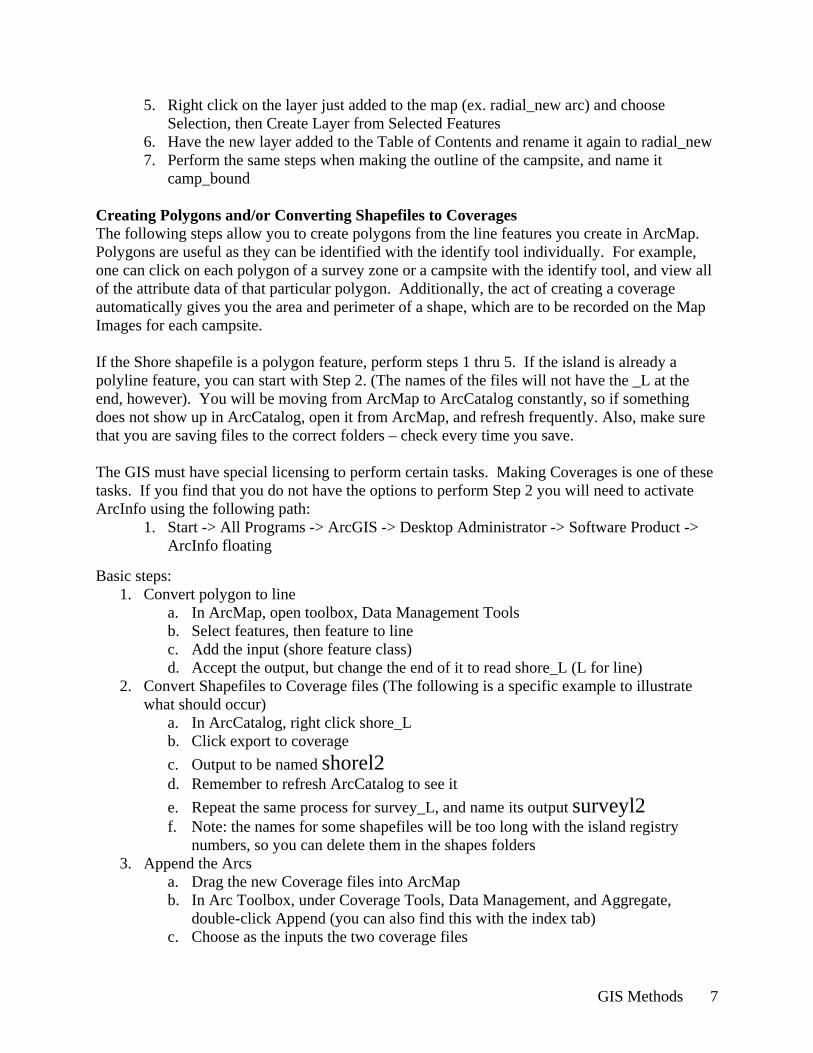
5. Right click on the layer just added to the map (ex. radial_new arc) and choose Selection, then Create Layer from Selected Features
6. Have the new layer added to the Table of Contents and rename it again to radial_new 7. Perform the same steps when making the outline of the campsite, and name it
camp_bound Creating Polygons and/or Converting Shapefiles to Coverages The following steps allow you to create polygons from the line features you create in ArcMap. Polygons are useful as they can be identified with the identify tool individually. For example, one can click on each polygon of a survey zone or a campsite with the identify tool, and view all of the attribute data of that particular polygon. Additionally, the act of creating a coverage automatically gives you the area and perimeter of a shape, which are to be recorded on the Map Images for each campsite. If the Shore shapefile is a polygon feature, perform steps 1 thru 5. If the island is already a polyline feature, you can start with Step 2. (The names of the files will not have the _L at the end, however). You will be moving from ArcMap to ArcCatalog constantly, so if something does not show up in ArcCatalog, open it from ArcMap, and refresh frequently. Also, make sure that you are saving files to the correct folders – check every time you save. The GIS must have special licensing to perform certain tasks. Making Coverages is one of these tasks. If you find that you do not have the options to perform Step 2 you will need to activate ArcInfo using the following path:
1. Start -> All Programs -> ArcGIS -> Desktop Administrator -> Software Product -> ArcInfo floating
Basic steps: 1. Convert polygon to line
a. In ArcMap, open toolbox, Data Management Tools b. Select features, then feature to line c. Add the input (shore feature class) d. Accept the output, but change the end of it to read shore_L (L for line)
2. Convert Shapefiles to Coverage files (The following is a specific example to illustrate what should occur)
a. In ArcCatalog, right click shore_L b. Click export to coverage c. Output to be named shorel2 d. Remember to refresh ArcCatalog to see it e. Repeat the same process for survey_L, and name its output surveyl2 f. Note: the names for some shapefiles will be too long with the island registry
numbers, so you can delete them in the shapes folders 3. Append the Arcs
a. Drag the new Coverage files into ArcMap b. In Arc Toolbox, under Coverage Tools, Data Management, and Aggregate,
double-click Append (you can also find this with the index tab) c. Choose as the inputs the two coverage files

GIS Methods 8
d. Name the output file survey_area 4. Clean
a. In Arc Catalogue, right click on survey_area b. Click Properties c. Click Clean (you may need to increase the numbers in the window to clean the
data – keep cleaning until polygons are created) 5. Build
a. Click on the line with “polygon” and click Build b. Choose polygons (poly) c. Add survey_area to the map
i. Note: Sometimes the “Clean” step makes it so that not all the polygons show up. You may get a pop up box that says something like: “points must be made into line features before they can be polygons,” or “an overlap occurred.” If this happens, simply increase the number in the Clean text box until all polygons are visible. This may take some trial and error.
Coding Polygons 1. Right click on polygon layer 2. Open the attribute table 3. Select one of the rows 4. Right click on ID in the ID column 5. Click calculate values, choose yes 6. Type corresponding value in field calculator for each polygon
Obtaining the Area and Perimeter Values of a Polygon 1. Convert the polygon shapefile to a Coverage
a. Right-click on the layer in ArcCatalog, choose export, and To Coverage b. If you do not have the Coverage option, you may need to switch the licensing.
Under the Start menu and Desktop Administrator, click the box next to ArcInfo. Try the conversion again.
2. Once the coverage shapefile is created, drag it into the Table of Contents and simply open its attribute table to view the area and perimeter values.
Final Note: The act of creating coverages and building polygons leaves you with multiple files in the shapes folder. Coverages themselves contain an arc, tic, label, and after the build, polygon files. We are unsure of the importance of these smaller files, so they should all be kept in the shapes folder for each feature. It is important that they go into a logical folder, as the default names of these files are not often useful. To separate features from one shapefile into two separate shapefiles (or to export selected features into a new shapefile)
1. In attribute table, select the features that you want to move to a new shapefile 2. Right click on that layer in the TOC 3. Chose selection, then “create layer from selected feature”

GIS Methods 9
4. It will ask if you want that new selection layer in your map, say yes (you can always remove later) 5. The right click on new layer, and chose DATA, then Export as shapefile and give it the final name you want it to have
Joining a Table to a Shapefile Some of the data from the field data sheets (such as the survey data and inventory indicators data) are too numerous to manually type into an attribute table. In this case, you can create a table that can be joined to the shapefile in Arc Map.
2. Save the Excel Document as DBaseIII a. Make sure to rid of odd characters (commas, spaces, etc.), change cell width as
needed, change cell format to general, etc. b. You will need to stretch out the cell width until all the information in each field is
visible across the line horizontally (do not wrap text) so that all characters/words will show up in the attribute table in ArcMap, other wise it will cut off that data. The .dbf only shows what is visibly when you save it, it does not save the data that you cannot see.
c. Label the field names something meaningful as they will be transferred to the table (the attribute table also has a limit to the number of characters that can be in a field name)
3. Drag new file into the table of contents 4. Right click on the layer to which you wish to add the new table (in this case, the polygon
layer), click Joins and Relates, and Join 5. Choose join attributes from a table in the first drop-down menu 6. Choose the table layer from the third drop-down menu 7. Choose the field name that is common to both layers you are joining
Note: Table only shows up in the table of contents when the source tab is selected. 8. Click ok. 9. Read Database Troubleshooting if the join does not work.
Database Troubleshooting: When the Table fails to join Joining a database table to a shapefile does not always work, and the reason why may not be clear. 1. Be sure you have followed the instructions in Joining a Table to a Shapefile, specifically #1 2. Try another computer. Some computers in COA’s GIS lab do not perform these types of joins.
To edit the Table after it is created
You may find that you need to edit a table after you have done the join. For example, you may see that you should shorten the field names so that they make more sense in the new attribute table.
1. Always do edits in the excel table, not the database table. Also, there are the original Excel documents that are the field worksheets in the dbf folders. Do not make changes to these documents. Copy and paste the data from these originals into a new
GIS Methods 10
Excel spreadsheet, and name it the same name with “_ your name” after the island registry number.
2. Some of the field worksheets do not transfer well to a database sheet; i.e. the Intertidal sheets. Use the Excel table in the dbf folder of Steves called 59_897_Sarah_Intertidal_A_Data_07_08_05.xls as a template for the Intertidal files.
3. Again, only perform editing in the excel file labeled with your name. After you have performed your edits, save it as a DbaseIII file.
4. * This step is important. Close the Excel file you are working on. The program will prompt you with numerous command boxes. Say ok to all of them, which will save the changes again, limit the file to one sheet, keep it in the same format, replace what you have already saved, etc.
5. * Also important: Refresh or close and reopen ArcCatalog before proceeding. 6. Then perform the steps in Joining a Table to a Shapefile. 7. If you find that you must make edits to the Excel file, do so in the file with your
name, however add a number in series to the name – example, Sarah2_. Then make a new database file. In the map, right click on the layer with the previous join and choose “Remove Join” and “Remove all Joins” before joining the newly edited table.
8. When your table has joined and is correct, erase the files that are no longer needed in ArcCatalog.
Exporting Shapefiles to Secure the Join This is to be done after a join in order to both secure the join and to simplify the table so that it is more readable. 1. In your map’s Table of Contents, right-click on the layer you’d like to export, choose Data, and then Export Data. 2. In the window, browse to where you’d like to save the file (in shapes folder) 3. When prompted, name the file the same name it had, but add _join to the end
Updating the Attribute Table after a Feature is Created In the Case of Hell’s Half Acre, this occurred after the creation of the radial layer
1. Added a field to the attribute table of a new shapefile called flags – this new field was called Bring_Dist – Note: you can use the values in this field to label the radial lines on the map 2.Added points to the radial_new endpoints – used the snapping tool to get the points on the ends of the line 3.Changed attribute tables individually after each point was created using the attribute table icon 4.Merged tables from survey_new layer to flags layer for the attributes
Linking Photos to Features on the Map
1. Open the attribute table of the layer containing the features to which you want to link photos.
a. If the table had another table joined to it, remove the join (right click layer, choose Joins and Relates, Remove all joins)
GIS Methods 11
2. Add a field to the table (Click on Options, Add Field), change the type to text, make the length of the field 250, and name the field Photo_path.
3. Double click the layer and choose properties. 4. Under display, click on the Support Hyperlinks box, choose the correct field
(Photo_path). Click on “Doc.” option. 5. Since the pathway is long, you can copy the path name for each picture right out of Arc
Catalogue at the top next to Location. • Make sure all photos had their “pyramids” built before transferring. This is something
Sarah and I assumed would be needed for successful opening of image. When pyramids are created the ArcMap program automatically creates extra file extensions that may not appear immediately useful to you but are needed for the program to function. Common extensions are .aux, .rrd, and .xml.
• For example, the photo path looks like this when you hit copy in ArcCatalog: \\H2o\gis_lab\project\SeaGrant_Islands\Little_Snow\Photos\Little_Snow_10_13_05\Little_Snow_10_13_05_Nikon\LSI_Campsite_A\LSI_A_general\LSI_046_Oct_10_05.JPG
• Paste this into attribute table and then alter to read: \Little_Snow\Photos\Little_Snow_10_13_05\Little_Snow_10_13_05_Nikon\LSI_Campsite_A\LSI_A_general\LSI_046_Oct_10_05.JPG
6. Add link to one cell at a time by using the editor toolbar. Select the shapefile, open attribute table, and highlight a row in the attribute table. 7. Start an editing session, chose the correct target, and then click on the Editor attribute option tab. Enter data here in the editor attribute tab! 8. Save edits and save map. You may need to refresh to see changes. 9. To see the picture, click on the feature to which you linked the photo with the hyperlink tool (the lightning bolt). 10. Add any joins back again.
If the pictures do not show up and the pathname is correct, go to File, Map Properties, and Data Source Options. Make sure “Store relative path names” is selected. If pictures still do not show up, try right clicking on the layer whose features have photos, click on Properties and then Display. Try clicking the box next to “Support hyperlinks” a few times (and tell it what field: photo_path), click Apply, then Ok. And finally, some joins may still prevent the photos from showing up – remove joins again, then under Properties for the layer with photos, check the box beside Support Hyperlinks, etc. Creating the Shoreline or Intertidal Transect Line Associated with the Use Areas
1. Place the endpoints, A & B a. Using the same radial method used to draw point A (See Creating Radial
Transect Rays from a Campsite). Create Point B from Point A. Use the value recorded for “Bearing along transect line” on the field worksheet instead of the “Bearing and distances from campsite center point to A,B, or C” values.
b. Label the points A, B, or C for less confusion – right click on the layer name (Shore_trans_endpts), then Properties and click on the Label tab, choosing the Endpt_ID field (or the field with desired labels) and click the box at the top left to label the features.
2. Draw in the transect line
GIS Methods 12
a. Before doing this, create a column on the Shoreline Monitoring Form field worksheet labeled Segment Length. Convert the lengths from Distance From A to the segment lengths by subtracting the cell from the cell above.
• Note: You may not need to do this, depending on what form the data are in. You may be able to simply click on point A, choose direction/length, specify the angle written on the field worksheet from A to B, and write in 10m (or segment length) for the length value. Set snapping to the transect_line layer. Begin the next segment after the first, repeating the same steps.
b. Set snapping to the Shore_trans_endpts layer c. Start the editing session with Shore_transect_line as your target, and begin
drawing a segment from point A by clicking on it. Then move the other end of the line over point B and right click. Choose Direction/Length. Do not change the direction seen in the box, but specify the new length you calculated in the Segment Length column of the field worksheet. Hit Enter. Right click near the line, and choose Finish Sketch. Then modify the attribute table as needed by clicking on its icon.
d. For subsequent segments, perform the same process, but first, set the snapping to include the Shore_transect_line layer for END only.
For Shoreline Data 1. Create the perpendicular lines
a. With snapping still at the ends of the transect line, create the Shore_perp_lines layer by clicking on the ends of the segments, right clicking and choosing Direction/Length, changing direction to the angle from A to B MINUS 90 degrees, and specifying the desired length from the transect line recorded on the worksheets. Also choose Finish Sketch after each and update the attribute table (You can join the Shore_transect_line’s attribute table to this layer, but add a Perp_Dist field. (Note: Instead of adding a field for the flag number, just make these the ID numbers).
2. Connect the ends of the perpendicular lines b. In an editing session with Shore_A (or the campsite ID) as the target, simply connect the ends of the perpendiculars (using snapping to the ends of this layer) and the shore_A_perp_line layer.
To export a shapefile and all the affiliated files Using the example of exporting the mcst7_83 file (this file is needed for the CIREG number and it also has our base coordinate system for the whole project)
1. Create a folder to receive all the files 2. Open a .mxd that has that layer loaded and open. 3. Right click on file name in table of contents > data > export data 4. When given the option, chose to save as a Shapefile (assuming that is what you want your end product to be) 5. Browse to where you want to save it and give it a name (in the new folder created in step 1)

GIS Methods 13
6. It will begin and complete export and ask if you want to save it as a new layer. Say No. 7. Using ArcCatalog, scroll to your file (if you use Windows Explorer, you will find multiple files. The advantage of Arc Catalog is that the files get automatically linked as a shapefile)
To move already snapped data in order to correct its UTM position Assuming there is the corrected UTM position already in a shapefile/ArcMap usable format, proceed as follows:
1. General tips before starting: o You can’t move subfolders together. Each folder must be moved separately o You don’t need to create any new shapefiles for the move. o Metadata will require comments about the move o Check the source tab to be sure all the files needed are in the right folder. o BACK-UP shapefile that you want to move by using File/Export Data/Save As,
but do not add this to the map. You will need to name the back up something different. We were moving Campsite A and called the back-up file “CampsiteA_Center_Point_Original”
o Coverages won’t move with the rest of the file. You will need to convert these to polygons,etc.
To begin the work: 1. Copy/Rename shapefiles into one folder. We have created the folder “Editing”+ for this purpose.
2. Rename for Campsite A, B, shore, etc. They must be unique. 3. Add all shapefiles to a new map. 4. Start Editing. Under Editor, Snapping, set snapping so that the NEW and OLD point can be snapped to. 5. On the map, use the Selection tool (you can also use the Edit Tool found next to the Editor drop-down tool bar) and drag a box to select all features (EXCEPT for the point you want to snap TO. You do not want to move that, so you may want it turned off until the next part.) For example, if dealing with campsite ctr pts like we did for HHA, select all except Campsite A and Trimble A. 6. Zoom into center points as close as possible. 7. Be sure your target is set to ‘MODIFY FEATURE’ of the shapefile being moved. You may need to do multiple edit sessions (Stop an edit session and Start it again) to be able to choose the correct target. 8. Use the pointer to move EVERYTHING at once. Move, by dragging, the OLD point to the New point. The cursor should snap on to the old point and all of the selected features should move too until the cursor snaps to the New point. Even though you can’t see the center pt (the one being moved) once it is selected with the other features, the snapping tool, when working correctly, will find the center pt. Keep zooming in on the new ctr point and repeat move until you are happy with the location. 9. Save edits. Move is complete. 10. Decide if you want to separate data back out into subfolders (campsite a, campsite b, etc). 11. You will need to re-establish links on former maps after you have completed this move.
GIS Methods 14
a. To do this Open ArcMap with layouts b. Set data sources to the new names and locations (Properties, Source Tab, Set Data Source)
Added Note: In some cases, you may be able to move features without copying the shapefiles as explained above. (We are not yet clear on when it is appropriate to do so). In the case where you’d like to move a whole campsite and do not have the XY coordinates:
a. Start an editing session. Choose the campsite center point layer as the target. b. In the TOC, click on all features associated with (or snapped to) that center
point. c. Select these features. For a faster way to select all associated features, click
on the selection tool (the black arrow next to the drawing tool) and draw a box around the features you wish to select, again
i. Be sure that you haven’t selected other features such as the shoreline or the access trails, which you will probably be using for references in cases where you do not have specific XY coordinates. If they are selected, you can go into their attribute tables and clear the selection.
d. Simply click on the center point with the small black arrow beside the pencil and drag your mouse to the desired location. Unclick, and save changes.
Creating Trails on the Map Using New TRAIL Monitoring Form Background Info: Trails have been created previously by georeferencing the scanned field map with the shore/survey zones for an island and tracing the lines indicating trail locations in an editing session. These lines have previously been in the same layer as Survey (think of them as extensions of the survey lines), however the new trails will be drawn according to the GPS tracks, and will therefore be their own shapefile. The Steps:
1. Georeference scanned image of field map with trail access points drawn to map view (an alternative to Step 1 and 2 is to consider if they are needed. If the sketch map is a print of the exact same map that is used on the GIS computer, such that both are the same sources of info for the tide lines, it might be worth it to consider if its more efficient to eyeball where the trails should be)
3. In ArcCatalog, create a new shapefile entitled access_trails. Add it to the map, begin an editing session, and use the drawing tool to draw in the trails from the scanned field map onto the map – these will help guide the directions in which to draw the 3m lines, and where to place the access trail points on the shore.
4. Create new shapefiles called access_trails_3m and access_trails_pts. Remember to add Metadata. 5. To draw the access trail points, begin an edit session. Since it is most important to snap to
the Shore, set the snapping to Shore. Zoom in until the access_trails features disappear, go back one extent (by clicking on the blue “previous extent” button) and draw the point closest to the true intersection of the shore and access trails.
6. Begin an edit session for access_trails_3m. Set the snapping to access_trails_pts. Hold the drawing tool (line tool) over the access points and right click. Choose Length, and

GIS Methods 15
specify 3m. This will give you a radius of 3 meters. Point the line tool over the access_trails feature, and double click when the two lines coincide.
7. Add new fields to access_trails_pt and access_trails_3m layers for the join: Trail_ID, CondCl_pt and CondCl_3m. (Note: the condition class field can be deleted from the excel table so you only have table that may join to both layers).
8. There is much modification to be done to the excel sheet to be able to convert it to a DbaseIII version that will be able to be joined to the newly created layers. In the Steves Island Stonington folder, under the dbf folder, use 59-897_Trails_Sarah_10_03_05 as a template.
a. Attach the new DBaseIII version of the table to both the access_trails_pt layer and access_trails_3m
e. Export both layers as new shapefiles in the shapes folder so that the tables are
permanently joined to the layers, which will then be called: access_trails_pt_join and access_trails_3m_join
9. To display the condition classes on the map, right click on the trail layer, choose Properties, and Symbology. Under Categories on the left side, click on Unique Values. Under Value Field, choose the condition class field (CondCl or CondCl_3m) and click Add all Values.
a. Make sure that Values 0 through 5 are represented. If there are values missing, click on Add Values. In the lower box, type in the value you’d like to show (example: 3). Click Add to List, then click Ok.
b. Under Color Scheme, choose the scheme that starts with green and fades to red. Make sure that the highest number is red, the lowest, green. If it does not automatically assign the colors to the right values, keep clicking on the color scheme and the order will change.
c. You may alter the size and shape of the dots or lines by double clicking on them. Make sure they are all the same size and shape.
d. Click Apply, and Ok. e. Note: In cases where the condition class was determined to be “1 to 2,” for
example, assign the trail the higher number. In the Comments field of the table, write that the condition class was between 1 and 2 and why (if this information is available on the field worksheets)
Creating a Legend in the Table of Contents in data view This should be done for layers such as Trails on Little Snow Island, which are represented by different colors associated with condition class values. 1. Right click the layer for which you would like to make a legend, click Properties and then the Symbology tab 2. Choose categories, and unique values 3. Choose the field from the attribute table in which the cells that you would like to code 4. Click Add all Values 5. Uncheck the box beside “all other values” and remove the “null” values
6. Click OK

GIS Methods 16
Creating the Intertidal Zones
1. Create a new polygon shapefile in ArcCatalog. (IZ_Box_(IZ ID)) 2. Begin editing the new shapefile. 3. Set snapping to transect endpoints. 4. As of Nov. 1, 2005, Natalie has decided to create a rectangle around the transect line. From the line to each edge of the box should be 20 meters on either side. The next few steps require a little math. You will be working with angles, so it is good to have a pencil and paper nearby.
a. Click on one endpoint of the transect (A or B) with the pencil tool. Draw the line at 90° to the endpoint (add or subtract 90 from the angle from A to B), for 20 meters. You can do this by right clicking, selecting Direction/Length, and writing in the correct values. b. Click to draw this point. Right click. Set the new direction and length, and continue drawing the polygon. After the second vertex is created, write in 40 for the length to extend the polygon below the transect line.
5. Cut the polygon into separate polygons to represent each IZ. a. Begin editing the new polygon. b. Set snapping to the transect line and to the new polygon. c. Select the IZ Box layer features and the first segment of the transect line (select each segment as you do each pair of polygons) d. Choose “Cut polygon features” from the editor toolbar. e. With the pencil tool, start tracing each individual polygon, making sure to snap to all the edges, one of which will be a segment of the transect. Simply click each vertex until you have traced the whole shapefile, which will separate the new polygon from the large, original polygon.
Note: After clicking on a vertex, you may right click and choose “perpendicular” to get right-angled rectangles.
f. Click on the Attribute Table Icon after each new polygon is made and give each an ID number.
1. Polygon #1 is attached to transect segment one, inland. Two is adjacent to it, toward the intertidal. Three is attached to segment 2 and inland, etc. 2. These numbers correspond to a table that was created especially for the join.
a. If you have trouble numbering each polygon directly after it is created, you can select each polygon with the selection tool and number it after you create them all.
ii. Modify the table, and join to the newly created polygon layer (which now has all the smaller polygons in one table.)
1. This table can be found in the Steves dbf folder, in the Intertidal_A_E folder. Use the table called Intertidal_Polygons. Copy and paste it into a new worksheet, clear the contents, and fill in the information from the field data sheets.
a. I found that transferring the data to the table was easier if I made the ID column read 1a, 1b, 2a, 2b, etc. instead of 1, 2, 3. This allows you to use the same headings,
GIS Methods 17
but to enter the “Y”s from the “U” columns in the “a” rows, and the Y's from the D columns in the b rows.
b. Not all the headings may be there, since the blank columns were deleted to make the conversion from excel to DBaseIII easier. You may need to add them in, depending on the data.
c. Delete all the empty columns before converting the excel sheet to a DBaseIII file.
d. Remember to change the ID values back to 1, 2, 3, 4, etc. for the join.
e. Do the conversion, do the join.
Dealing with Metadata The following protocol outlines how we should deal with metadata with every new shapefile created:
• The purpose of the metadata is to document the shapefiles you have created and note the sort of inaccuracies or relevance that data may have, etc. For example, HHA was moved using the snapping tool and this move is registered automatically in the metadata. Any additional information would also go into the metadata so anyone interested in the data would know any potential glitches.
• All metadata is created/edited in ArcCatalog, in the metadata tab. Toward the upper right on the horizontal toolbars, you will find five (5) lined paper icons with different smaller icons on each image. If not, then View > Tools > Metadata to turn on this toolbar. Click on a shapefile, and then click on the metadata tab (as opposed to the content or preview tab) and then click on the first paper icon “edit metadata.”
• Editing Metadata: This is a general guideline for this project. o When creating or editing text for metadata, try to cross-tabulate island specific
names with layer names (for example, in the Keywords) o The following sections should be completed, remembering the goal is to keep
meta data light and basic: Blue is what should be updated for each new shapefile’s metadata, after it has been imported from that island’s metadata template.
o Probably the most important to update for each file is TIME PERIOD (Make sure to list here the date that the data was collected! Not the date that you are working on the data)
Identification Tab • General;
o Abstract, o Purpose, o Supplemental information (For our purposes, supplemental
information can be used when there are multiple dates for when this data was collected on the ground, if the “Time Period” tab is not clear.)
• Contact; For now, use Nat’s contact info. • Citation – the program defaults to place the ArcMap title but you
should add detail to create a title that would make sense to

GIS Methods 18
someone not looking at the map; At the very least, give it the name of the island, the use area and then the name of the shapefile that it defaults to. Remember to be consistent with naming. For example: FlagLI1a is the default name, this should be expanded to say Long Island FlagLI1a
• Time Period Enter ground condition and the date the data was collected. In the event the shapefile has data for more than one date, then make sure to clarify that here. If is still seems confusing, then clarify that in the Supplemental information above.
• Status; What is the status when you are entering the data (mostly it will be Progress In Work, and Update Frequency as needed.)
• Keywords – only fill out the theme section which is the first section in that tab; type in the word and then click on the + tab to add your new entry. For each file, add the key word of what that shape is (i.e. Center point, radial transect, Garmin GPS high tide line etc, and if there is a need for any other keywords such as the Island name etc)
Spatial Reference – this section will inherit the data from the shapefile itself;
Entity Attribute – in this section don’t describe each # but maybe describe codes
The Data Quality Tab is an important one. For example, with some GPS data we will be moving points and it may behoove us to include that change of data in the section Data Quality, perhaps in accuracy of attributes and/or positional to have complete metadata descriptions. Update this as needed.
o According to Gordon, the following sections can be skipped for now in the different tabs: In Identification: Spatial Domain, Browse Graphic, Security, Cross reference. All of Data Quality, all of Data Organization, all of Distribution, all of Metadata Reference.
• When you are done filling in the metadata, SAVE! Saving will only save the changes you made to the metadata for that file. It will not change anything in any other file unless you first export the metadata you just created to a folder, and then go to the new file whose metadata you want to update, and import the metadata you just exported to a folder.
• We have created master templates of Metadata for each island, stored in the general Sea Grant Islands/project folder on the GIS server. The file is called ‘Meta Data’ and is in txt. format.’ You can import that file for others. Be sure to use the txt format when exporting. For importing, you will need to choose file type as All files.
• Specific instructions on Exporting and Importing Metadata o Exporting metadata (This is useful, for example, to create templates for each
island, which are stored in the Sea Grant folder in a folder called Meta_Data.) 1. In the Catalog tree, click the item for which you want to export metadata. 2. Click the Metadata tab.

GIS Methods 19
3. Click the Export Metadata button on the Metadata toolbar. 4. Click the Browse button. 5. Navigate to the folder in which the exported metadata should reside, type
a name for the new metadata file, then click Save. (If it is to be used as a template, then put it in the Meta_Data folder)
6. Click the Format dropdown arrow and click the format in which you want to export the metadata. (For our purposes, use .txt)
7. Click OK. 8. A new file containing a copy of the item's metadata is created in the
appropriate format. o Importing metadata (this is what we should do whenever we create a new
Shapefile, in order to give it metadata immediately. Note the sections we will always fill out, pay particular attention to changes that need to be made regarding DATE that data was collected and other blue sections above.)
1. In the Catalog tree, click the item for which you want to import metadata. 2. Click the Metadata tab. 3. Click the Import Metadata button on the Metadata toolbar. 4. Click the Format dropdown arrow and click the format of the metadata
that you will be importing. Chose the format type .txt 5. Click the Browse button. 6. Navigate to and click the metadata file whose contents you want to import,
and then click Open. 7. If you don't want ArcCatalog to update the metadata with the current
properties of the data, uncheck Enable automatic update of metadata. 8. Click OK. 9. The imported metadata appears in the Metadata tab.
• Extra comments on Metadata
Use the Tools/Options tab to add/remove metadata labels visible in the Contents tab in ArcCatalog
HTML files can not import into metadata directly but links can be established to the html file
The lat/long info does not take on the exported, data but uses the data of where it is being imported.

GIS Methods 20
3. Layout-related Tasks (in GIS and not) Adding legends to map layout
1. Open map in ArcMap, click on map layout option (bottom of screen, between data view and refresh icons)
2. Under Insert menu, choose legend then define which legend items from your table of contents that you want to appear on you map legend.
3. Right click on new legend click properties to define appearance of legend. 4. Note: legend will only appear in layout view, not in Data view, and will appear in layout
view regardless of which layers you have on. 5. The name for each layer will automatically be the name that is in the table of contents,
which, unless you have changed it, is the name of the file that was created originally in Arc Catalogue. For simplicity and lack of confusion, it is best to have the file/layer names in Arc Catalogue and Arc Map match, but you may want a more descriptive name in your legend. You can change the name in the table of contents but note that this will mean that it will no longer match the files in Catalogue. An alternative is to add a label appearing next to symbol or add a descriptor in the legend:
a. Right click on the layer name, chose properties, symbology b. Enter a label in the box for a label c. If you want more details in the legend, click Description and type what you want
in the box, click Ok. 6. To add text in the map, manually (not connected to the legend), click on the “new Text”
icon (the letter A with a drop down arrow in upper left of toolbars). Then add the text and format it.
Adding multiple data frames to layout This is useful when you want to have several scales of on island in one layout. For example for Long Island, we wanted a frame with a close up view of the triangulation points at one campsite and also a big picture Long Island frame to show where the campsite is on Long island.
1. In ArcMap, Insert > new data frame 2. Then copy the data you want from the original frame (or drag and drop from
ArcCatalog). 3. Tell ArcMap which data frame should be activated (only one is visible in Data view) by
right clicking > activate (you can give the new data frame a name too). NOTE: when you insert a scale bar in layout view, it will automatically use the scale of the data frame that is activated in data view.
4. In layout view, both frames will be visible and can be resized. Adding attribute table information to map layout
1. Double click on the layer whose attribute table has information you want to show on the map, choose the Fields tab 2. Chose which of the attribute table’s fields you want to show clicking on the check boxes. Click ok.
GIS Methods 21
3. Right-click the appropriate layer and open its attribute table. It will only show those fields you marked. 4. Click options and “add table to layout”. It will appear in layout view (not in data view) 5. Another option is to copy and paste information directly out of Excel
a. Open the Excel file b. If you don’t want all the info, but just some, copy it into a new Excel file (so you
don’t risk messing up the original data) c. Format the data as you would like to see it in the layout of the map d. Copy the cells you want e. Paste onto the map in Arc Map layout view and your table will appear exactly as
you had it in Excel. Exporting maps (with or without legends) to show in Power Point or other programs
1. Save layout as .mxd document – for the name, keep the Island Registry number with the date and add: _ trails or campsites, for example. Save to map images folder for the correct island. Now export the layout as a Jpeg file to map_images.
a. File, export map, navigate to the map_images folder for the island whose map you are working on, keep the name the same as above, and choose jpeg format (jpg) from dropdown menu. Make sure that the Resolution is at 300 dpi.
2. You are ready to use these in images in any program such as Power Point Making Presentable Map Layouts You can move to layout view at any point during your map building by clicking on the small icon in the bottom left corner of the map – it looks like a piece of paper. (It is between the world icon and the refresh icon). The map layout will display the image exactly as it appears in the map view. Use the map images for Little Snow Island to see standard layout design, including placement of layout features, sizing, borders, etc. 1. The first task I generally perform is to enlarge the view to an adequate size. This is of course to everyone’s discretion, but a good rule to follow may be to have the image as large as possible with all the other objects on the map. You can enlarge the image by clicking once on it, and “pulling” the corners with the pointer tool. I recommend pulling the box slightly over the image of the paper. This seems to eliminated lines on the map layout. (At any point, you can go to File and Print Preview to see what your layout looks like in print form – I highly recommend doing this before printing.) 2. In the map layout, label the features with meaningful labels that can be correlated to a table added to the map layout. These labels are often the ID, and for the transect lines, BringDist. To label features, double click on the layer and choose Labels. Choose the Label field, click on the box at the top of the page to label all features, and change the font, boldness, or placement of labels to what’s desired. For example, I would label endpoints with A and B in a bold and size 10 font. Bearing and Distance labels look best when horizontal to the lines, and in size 10 font. 3. Depending on what your map needs, the following steps can be done in any order. Each map needs to have a North Arrow and Scale Bar, which can be inserted by clicking on the Insert menu and choosing which to add. Again, the style is up to the creator of the layout, but it should be consistent for both in a series of maps.

GIS Methods 22
4. Each map should also have a general title (always with the island name and campsite name, if this applies), a more descriptive, specific title if needed (such as “Triangulation for Campsite Center”), the Data collection date, the map date, and the names of the people involved in creating the map. You can insert a title by clicking on Insert and Title, and typing into the Title box given. If you double click on this box, you are shown more options for the title including location of the text, font, etc. Clicking and holding down the mouse button and moving it to the desired location can move anything you add to the map. 5. To add a legend, click again on Insert and Legend. This will bring you to a Legend Wizard showing numerous options. The first information box will show you the layers that you started with – all those layers that you activated on the map that were transferred over to the layout view. Using the arrow buttons, you can remove or add layers to the legend. Keep clicking next until you can click Finish, and the legend comes on the screen. a. To change the names beside the legend characters, double-click on the corresponding layers in the Table of Contents and click the Symbology tab. Add the label in the white box under Legend, and click Ok.
5. To add a table to the map, use the Excel files from the dbf folders for each island. Copy the desired cells into a new Excel document, and format them so that they look neat and easy to read. This may require deleting empty cells or cells with unnecessary data (Example: if the bearing and distance is labeled on the layout already, you do not need to add these columns to the table in the map layout). You may also need to move cells around so the table is aesthetically pleasing. Also rewrite the headings on the field worksheets so they accurately represent what is on the map. An example of this would be changing the heading “#” to “Flag Number.” When the table looks as you want it, simply use cut and paste – select the whole table, choose Edit and Cut, and in the ArcMap window, choose Edit and paste. (You cannot simply right click on the layout and choose paste).
6. Add map notes when applicable.
Layer Names The following layer names should appear on the Master Map’s Table of Contents in roughly this order (depending on the shapes made for each island): Note: The names of shapefiles should ideally be the same in ArcCatalog and on the map. The shapes in ArcCatalog don’t necessarily have to have the island initials, but it should be clear what shapefiles they are. In ArcCatalog, keep all the “join” parts of the names, but remove them from the layer names in the Table of Contents. IMPORTANT NOTE: When you change a name in ArcCatalog, be sure you resource the layer in the Table of Contents to the new name. The shapefiles should live in separate folders in the shapes folder of each island: Make the following folders (if applicable): Base_Layers Campsite_ID Intertidal_Zone MITA_Designated (or ANP Designated if this is the case) Shore_Survey Shoreline_Transect Trails
GIS Methods 23
Layer Names in Table of Contents:
1. (Island Initials – such as LSI or LI)_Campsite_(ID) ID_Campsite_Centerpoint ID_Triang_Pts
ID_Triang_Rays ID_Radial_Trans ID_Campsite_Boundary ID_Flags ID_TrailInt_Pts ID_TrailInt_Rays
ID_Campsite_Photo_Pts ID_Campsite_Photo_Rays ID_Campsite_Boundary 2. (Island Initials)_MITA(or ANP)_Designated ID_Designated_Sites 3. (Island Initials) Shoreline_Transect (This is the Shoreline Photo Transect) ID_Shore_Trans_Endpts ID_Shore_EndptID1_Triang_Pts ID_Shore_EndptID1_Triang_Rays ID_Shore_EndptID2_Triang_Pts ID_Shore_EndptID2_Triang_Rays ID_Shore_Transect ID_Shore_Photo_Points ID_Shore_Photo_Rays 4. (Island Initials) Intertidal_ZoneID same as above with “IZ” instead of “Shore” ID_IZ_Box 5. (Island Initials) Trails Points of Access Condition Class 3m into Access Trail Condition Class 6. (Island Initials) Survey_Checklist Survey_Polygons 7. (Island Initials) Garmin_GPS_High_Low (if these are GPSed – if estimated, write that) GPS_High_Tide_Line GPS_Low_Tide_Line 8. (Island Initials) Base_Layers mcst7_83 polygon any rectified image
Map Contents The following maps should be created for each island, and saved into the
GIS Methods 24
Final_Maps_2006 folder of each island in JPEG and PDF formats. (see Creating JPEG and PDF files from the Map Images – For users without ArcMap below) Legends for Map Images should have all of these shapefiles listed in this order and with simple names such as “Campsite A Centerpoint,” or “Triangulation Points” or “Radial Transects” or “Campsite Boundary.” Refer to Little Snow Map Images if needed. 1. (Island Abbreviation)_Overview_Map a. Island high tide line and low tide line b. Survey data, with sections numbered c. Campsite center points d. Radial transects of each campsite e. Campsite polygons f. Campsites should be labeled g. Intertidal transect lines with endpoints and IZ Box h. Shoreline transect lines with endpoints i. Trails NOTE: You may need to bump up the width of the Low Tide Line to 4, as the Survey Polygons layer hides the symbol (even when the low tide line is above the survey polygon layer in the table of contents). You should also change the outline width of the Survey Polygon symbol to 0.01. 2. (Island Abbreviation)_Campsite_(Label) a. Campsite area and perimeter b. Campsite center point c. Campsite triangulation points and rays, labeled with bearing and distances d. Flags e. Photo points f. Areas of special concern g. Trail Intersection Points h. Campsite boundary ~NOTE: The campsite boundary should be its own line shapefile. If it is included in the Radial Transects layer, select it, right click on the layer, choose Selection and Create layer from Selected Feature. Then, export the file so that it remains a shapefile, and not simply a layer file. If the boundary isn’t in Radial Transects, you can create it quickly by creating a new shapefile called Campsite_Boundary and snapping to the ends of the Radial Transects. In the legend, you do not need to add Campsite Boundary, as it is the same color as the radial transects, and it is pretty much implied. i. Radial transects j. Island high tide line/low tide line depending on whether or not they are visible in the layout view of the campsite 3. (Island Abbreviation)_Trails a. Island high tide line b. Radial transects (including campsite boundaries) – depending on data this may or may not be included c. Interior Trails d. Points of Access e. 3m into Access Trail 4. (Island Abbreviation)_Intertidal_Zone
GIS Methods 25
a. Intertidal Transect Endpoints, labeled with Endpt ID in bold, size 14, Arial b. Intertidal Transect Line, labeled with Distance (10m, 20m, etc.) in bold, size 12, Arial c. Endpoint Triangulation Points, labeled with Triang ID in bold, size 11, Arial d. Endpoint Triangulation Rays e. IZ Box (see next section for labeling) f. Island high tide line g. Island low tide line 5. (Island Abbreviation)_Shoreline_Photo_Transect a. Shoreline Transect Endpoints b. Shoreline Transect c. High Tide Line d. Low Tide Line 6. (Island Abbreviation)_MITA or ANP_Designated a. High tide and low tide lines b. Campsite Centerpoints c. Designated Features d. Any other shapefile that shows actual location of a designated feature - A Note on Island Reference – Adding Data Frames: This may only refer to Long Island, but may be important for other islands. Long Island is so large that the area in which data were collected should be pointed out or referenced on a larger image of the island. Create a new Data Frame and add the high and low tides. This will add the frame to the map layout. You may activate the frame to work on it by right clicking and choosing “activate.” Draw a red box around the area in which data were collected. Refer to above section on Data Frames for more information. - A Note on Map Notes: When map notes come to mind, write them in the Documentation and Highlight them in green. Be sure they are transferred to the map image at the bottom of the page. Left justify them, keep the default font, and make sure they fit the page (by double clicking on the text box to get the Properties box, and hitting return where necessary). Standards for Final Map Layouts To be used for maps in their final stages that will be published in ArcReader. The following map features to be standardized are listed alphabetically. Areas of Special Concern: Star 1, size 18, black Campsite/Area Label: Arial, size 12; precision to the tenths Campsite Boundary: Highway, width 1, Seville Orange Campsite Center point: Triangle 1, size 18, Poinsettia Red Campsite Triangulation Points: Triangle 1, size 14, Anemone Violet Campsite Triangulation Rays: Highway, width 1, Anemone Violet; Labels: Bring_Dist,
Arial, size 9, bold Flags: School 1, size 20, Black; Labeled with ID, Arial, size 14, bold Intertidal Transect Endpoints: Circle 1, size 14, Ultra Blue; Labels: Arial, 12 Intertidal Transect Line: Highway, width 1, Peony Pink

GIS Methods 26
Intertidal Transect Rays: Highway, width 1, Ultra Blue Intertidal Triangulation Points: Circle 1, size 14, Violet Dust; Labels: Arial, 10, bold Intertidal Triangulation Rays: Highway, width 1, Violet Dust Intertidal Zone Box: Fill color none, outline width 0.40, outline color Gray 30%; Labels:
BernhardMot BT, size 11, bold and in italics Legend: Border size 1, Black; Gap size 5 for X and Y Map Notes: Arial, 10.2 Photo Points: Square 1, size 14, Apatite Blue Photo Rays: Highway, size 1, Apatite Blue Radial Transects: Highway, width 1, Seville Orange Shore/High Tide Line: Highway, width 1, Black Shore (of Shoreline Transect): Highway, width 1, Chrysophase Shoreline Perpendicular Lines: Highway, width 1, Beryl Green Shoreline Photo Points: Diamond 1, 18, Macaw Green Shoreline Transect: Highway, width 1, Leaf Green Shoreline Transect Endpoints: Diamond 1, 18, Leaf Green Shoreline Transect Rays: Highway, width 1, Malachite Green Shoreline Triangulation Points/Rays: Diamond 1, 18, Tree Deciduous Top (RGB: 182, 239, 127) Survey: Dashed with 1 dot, black Survey Labels (Number of polygon): Arial, 10.2, in Italics Survey Lines: Dash 2:2 for survey lines Title Font: default text, 16 Trail Condition Classes: CC:0 Cretean Blue; CC:1 Macaw Green; CC:2 to
206,237,0 (Go to “more colors” for this); CC:3 to Electron Gold; CC:4 to Mars Red; CC:5 to Dark Amethyst. Trail points are Circle 1, size 12. 3m Inland lines are Highway.
*Important Note: To keep the customized colors, you need to save the layer as a layer file. Click on the layer name (Points of Access), and choose Save as Layer File. Save it to the Trails folder in the Shapes folder. I saved them as Points_of_Access.lyr and 3m_Into_Access_Trail.lyr.
Campsite Trail Intersections: Trail, size 20 for final map image, size 14 for final mxd Trail Rays/Interior Trails: Dashed 4:4, black Transparency for medoq aerial photo layer seems to be best at 30% Creating JPEG and PDF files from the Map Images – For users without ArcMap The final map images in ArcMap format should be converted to JPEG and PDF files so that they can be easily printed or imported into Microsoft PowerPoint. 1. Open the map image you would like to convert and choose Save As. Choose the JPEG or PDF extensions. 2. Name the file with a simple, logical name: i.e. using Little Snow shapefiles as examples: LSI_Overview_Map, or LSI_Campsite A; save to a Final_Maps_2006 folder
For Use in PowerPoint The PDF files will open to Acrobat Reader by default, and look better when printed straight from Acrobat Reader. JPEG files open in Photoshop by default.

GIS Methods 27
1. Simply insert the JPEG into PowerPoint (Insert, Picture from file) 2. Open the PDF file in Photoshop, save it as a TIFF file, insert into PowerPoint as above What the Map View Should Look Like When Opened All layers and symbols should be closed in the Table of Contents so that only the main groups are visible. The high and low tides should be visible, as well as the campsite centerpoints and polygons. All of the other boxes should be checked (except for in the campsite group), but the main box of the group (i.e. LSI_Intertidal_Zone) should not be checked. This makes it so that when the user checks this box, he or she will see all features affiliated with the Intertidal Zone. Do not check the boxes of the features so that the symbols are showing. Erase anything from the map layout view: legend, north arrow, title, etc.

GIS Methods 28
4.GPS-related Tasks
If you need more support for the GPS Garmin downloads, etc there are two options. • First is check out the MN DNR website for a section called DNRGarminWIKI. WIKI is a
Q and A for users of the Garmin and ArcMap software. http://www.dnr.state.mn.us/mis/gis/tools/arcview/extensions/DNRGarmin/DNRGarmin.html
• I established two contacts at the MN DNR – Chris Pouliot, Specialist, and Tim Loesch, Manager and Specialist. Both of them created the Garmin software. Tim is at 651-296-0654 and Chris is at 651-297-2916. Both are exceptionally helpful and patient.
To set up the GPS (Garmin 76) so that data is usable in GIS
a. Settings > units > meters b. Location > location format (same as “projection”) > UTM UPS c. To switch back to navigate mode with Latitude and longitude, scroll to top of list and
find correct degrees, minutes, seconds.) d. Map Datum > NAD 83
• Default for this GPS to use in Navigation is WGS84. The GPS will sometimes return to the defaults.
e. For Example: Coordinate off of Bar Harbor in Lat/long:
N44deg 23min 51.2sec W068deg 12min 04.9sec
Same Coordinate using UTM UPS and NAD 83 19T 0563601 UTM 4916340 This is a reading in Meters in unit 19T. To do Tracks on the GPS (Garmin 76)
• Main Menu, select Tracks, Enter • At the Tracks screen, hit Menu > Set up Track Log >Enter • Opens Track log setup
a. Recording: Wrap When Full (will copy over first ones when full) b. Enter
• Back at Tracks Screen: Save (will save the ones listed and not get wrapped over.) • When you have to get multiple tracks in a row (such as Trail mapping), turn the
machine OFF when you walk from one track to the next, or it will just keep on tracking.
Downloading GPS points to GIS readable formats (handheld Garmin 76) (see another way below) The purpose is to create shapefiles of your data and save it to computer.
GIS Methods 29
1. Garmin 5.1.1 is a free software from Minnesota DNR website that we used for the GPS data. www.dnr.state.mn.us/mis/gis/tools/arcview/extensions/DNRGarmin/DNRGarmin.html
2. This program had to be on the computer before beginning the download process. 3. Connect the GPS unit to the computer and turn on the GPS unit. This requires the correct
cable. The GPS unit must be on to download the data. 4. Open the Garmin software program. 5. Click on Waypoints, Tracks, or Routes depending on how you collected the GPS points.
These are found on the Garmin software page that should pop up once the GPS and the computer are connected.
6. With all three of the options, the next step would be to click on Download. 7. To save, go to File/Save to/File. Your file type should first be saved as a txt file. 8. Give the download a name. Your txt file will be the raw data back up. 9. Sometimes the program will reject the most reasonable name for no reason that we can
trace. Just keep giving the file a name until the program accepts it (or “successfully writes the file” as is the lingo used by the computer).
10. Go back to File/Save to/File. This time save your file type as ArcView shapefile unprojected (.shp). Give the download a name and save to the appropriate folder. This is the shapefile you will bring into your map.
10. FOR TRACKS, once you click on Save, a screen will pop up called Output shape. Depending on your data, you can choose b/w a line or a polygon. Trails would be a line (more often) while a low-tide island circumnavigation can be a line or a polygon, for example. If you know your data has some unnecessary twists and turns in it (i.e.: the GPS unit was left on after the track was completed) then choose line for your download of tracks. By choosing line, you are able to move vertexes and drag out the unwanted twist and turn data. Click OK. 10. After saving the file, open up ArcCatalog. 11. In ArcCatalog, locate your new shapefile and examine the attribute table to be sure the data transferred accurately. 12. In ArcCatalog open up the Toolbox 13. Click on the folder: Data Management Tools 14. Click on Projections and Transformations 15. If you are working with vector data click on Feature/Project. For raster images, click on Raster/Project Raster. 16. In either case, for the “Input Data” drag in the new shapefile. It will automatically fill in the second section with that same file. 17. For the “Output Coordinate System,” click on the icon of a hand holding a rectangular object 18. Click on Import 18. Import prj_83 (coverage) from \...Shapes\ Base_Layers 19. Click OK 20. For “Geographic Transformation (optional),” chose the fifth option – NAD1983_To_WGS1984_5. You will notice there are five options. The fifth is the most accurate geographic transformation. This step may not always be necessary but at the time MN DNR reported a glitch with the NAD83 projection. 21. Click OK
GIS Methods 30
22. Your new shapefile will have the word “projected” on the end, or some variation of the word depending on how long your file name is already. This IS the shapefile you want to work with because this one now has a projection. 23. Drag your new projected shapefile from ArcCatalog into ArcMap. 24. At this point you can separate different sets of tracks or waypoints, saving them each as their own shapefile. For example, if you collected four waypoints and you don’t want them all to appear on the map at the same time, you will need to save the data four different times each with its own shapefile name. 25. For each track, a new track has the word True is in the new_seg field. 26. If you have more than one track from a day in the field (the names don’t transfer with the data) or unnamed waypoints, you will have to identify each. To do this you use the Select Features tool or the Identify tool (in ArcMap). Click on the track or waypoint with either tool. The data point/line should now be highlighted. 27. Once you have highlighted the individual waypoint or track, click on that shapefile in the Table of Contents. 28. Right click and select Data/Export Data. 29. The default Save As will look something like this: \...Export_Output.shp. Remove the Export_Output text and replace with an appropriate file name. 30. Click OK 31. You will then have the option of adding the new file to your map. 32. Add the new file and examine the data. 33. The next step would be to drag/move/delete vertexes if your tracks were not perfect as is. IF your data needed adjusting, adjust as directed below and then, if needed, open Arc Toolbox and convert the line to a polygon. 34. Each time you separate out a track or waypoint, follow the same process.
Note from Nat after taking mini-GPS training Not sure if it is because it is new software but we downloaded in a very simple way using DNR
• Open DNR program with GOS attached to computer • File > Set Projection > Load Projection (WGS84, Geographic; UTM, projected) • Download Tracks • File > save to ArcMap > shapefile • Close DNR • RE-open and do the same thing for Tracks and/or Routes. Do the three downloads
sperately. • Your shapefiles can now be used in Map.
Move/Drag/Delete a GPS vertex in ArcMap with the Editor Toolbar This description was found in the ArcMap help menu under ‘vertex tool/moving vertices’
1. Turn on editor and chose the correct layer. 2. Click the Current Task dropdown arrow and click Modify Task/Modify Feature. Be sure
the correct Target is set (aka: the file you want to be working on) 3. Zoom into the location that needs adjusting. 4. Click the Edit tool and click the line or polygon whose vertex you want to move. 5. Click to select the vertex you want to move.

GIS Methods 31
6. Position the pointer over the vertex until the pointer changes. 7. Click and drag the vertex to the desired location. 8. Right-click any part of the sketch and click Finish Sketch. 9. The feature is now reshaped. 10. If you need to move more than one vertex, you will you to keep resetting the Current
Task dropdown arrow to Modify Feature. For some reason it switches back to Create New Feature after each vertex is moved.
Converting txt files to excel
1. Open the txt doc. Click on File/ Save As… In the Save as Type drop down, choose All files.
2. Open up excel, and open your newly saved document. In the Files of type drop down, choose All Files. You will be prompted to navigate through three (3) screens of questions about your txt. which is in delimited format (Text Import Wizard).
3. choose accordingly, and hit save 4. You will then have your data in excel.
Dealing with Received GPS Data (in this case, the GPS was ANP’s survey grade Trimble GPS) In the case that someone else converts GPS points into shapefiles and sends them to you (this happened for Hell’s Half Acre data at the end of May 2005. Karen Anderson from ANP sent us the new shapefiles).
1. In the event that the sender of the data simply attaches them to an email, right click on the icons or list (depending on the form of display), and choose Save As. Then locate the folder into which you would like to save them. If the files are shapefiles, you can open a new ArcMap document and simply click on the shapefiles and drag them into the new document. Or, you can click the Add Data button on the new document and browse for the files. 2. It is likely that one layer will contain all point files taken with the GPS data logger, and layer will contain all the line files. To separate out the data into new layers, do the following:
a. In ArcMap, Review the Attribute table to choose the correct value to symbolize – here we used ‘datafile’ column in the attribute table. b. Show all values of existing GPS data shapefile by right clicking on Properties/Symbology/Categories/Unique Values. c. Highlight the GPS data shapefile, Open its Attribute table and highlight the GPS
field(s) you want to separate out. d. Returning to the merged GPS data shapefile, right click and choose Data/Export Data and give file a folder destination. (Do NOT do this from the Attribute table or it will save a database rather than a shapefile) Click yes to add layer to map. e. Go to Selection/Clear selected features Your new shapefile should now appear on the mxd
Notes from Nat re GPS and GIS This is not exactly HOW TO, it is more about troubleshooting which occurred when attempting to download GPS data off the Garmin 76… some of this has been further clarified into real HOW TO sections above.
GIS Methods 32
7_15_05 1. After downloading the new DNR Garmin software, spent time extracting the Garmin 76
GPS data for the separate islands 2. Created new folders in the GPS_points
a. Garmin76_routes b. Garmin 76_tracks c. Garmin76_waypts
3. Garmin76_waypts folder includes master back up in both *.txt and *.shp, and it also has the final extracted waypoint files for each of the separate islands, named for example Bangs_Garmin76_2005
4. How these were pulled out of the larger data file is explained in the HOW TO 5. They are NOT yet loaded into the appropriate maps or tested for accuracy. 6. Each of these island waypoint files includes all the data that was specifically named in
the GPS by that islands naming system. 7. They also, in most cases, included “numbered points” or points that were taken in the
field but were never named, so the GPS automatically gave them a number. To get the correct numbers, I flipped back and forth between the GPS and the GIS maps (with the number files loaded in each) and the DNR Garmin and the Garmin Mapsource software to identify which numbers were in the vicinity of each island.
8. I also created a file that was just my old navigation points off the Garmin76 and separated that file from the rest.
9. I spent some time cleaning out the GPS so that only the NAMED files are left in it (including some island named files that I will likely delete since they are backed up) All of the numbered files have been deleted since they have been saved to their appropriate island, and to save memory space on the GP
10. In the DNR Garmin software, when you download tracks, it highlights in blue the point that starts the track and labels it as TRUE in the New_seg field. (The ones that don’t start a track are NOT highlighted and say false)
a. Tracks may be created by using the “create a log” feature in ArcMap’s “GPS” tool bar, need to check that out more.
b. Using the Mapsource Garmin software helps because you can actually select the tracks on a crude map.
Lessons learned: ALWAYS name the GPS files at the time the point is entered in the field. Finding the
numbered points was extremely laborious and chances are I missed some. We should probable decide that if a point is not named, than the numbered point is probably not valuable data.
As of now at least, always name the downloaded filed with the GPS unit that the points came from so that we can easily have a sense of how accurate those points are. (i.e. if they came from ANP_Trimble, they will be much more accurate than Garmin76)
GIS Methods 33
5. Data-sheet-related tasks
Entering data from field data sheets to electronic Excel sheets Filling out these sheets is a pretty self-explanatory task, however these are some things to remember so that all data sheets are consistent.
1. Naming the file: Save the data sheet with a name that includes the date that the data was collected and not with the date you are entering the data. Try not to use hyphens, but underscores instead. Create names with foresight to islands having multiple campsites and shorelines, etc. Be sure to delineate Shoreline A, etc.
2. For all fields where the data have already been entered into an attribute table, after you fill in the data, state in the same section of the Excel data sheet in which layers attribute table the information exists. Use the exact layer name as it appears on the maps.
3. Italicize all entries 4. Left justify descriptions and longer entries 5. Center all other entries 6. To put in a degrees symbol, copy it from a Word document and paste it into the cell 7. When the words do not fit into the visible cells, right click on them and choose “Format
Cells,” select the Alignment tab, then select the options for wrapping text and/or merge cells. In the event that the words still do not fit, or there is only 1 cell available to write in, shrink the font until it fits. (In the event that lowering the font makes it unreadable, merge one or two more cells.)
8. Enter data just as it appears (omitting capital letters where appropriate and fixing spelling if needed), including punctuation.
a. Still use + and = signs as and they appear in the field worksheets b. Substitute commas for slashes if the cells go into “automatic date” mode c. Omit methodological comments, conversion factors and other non-relevant marks
from the electronic data sheets i. Add relevant information from margins/additional descriptions to the
Comments cells in parentheses d. For cells on the field worksheets that read “same,” write out what the “same” is
referring to, except in the cases where you cannot figure that out – in this case, write “same.”
9. General Information section may look better centered instead of left-justified, except on Intertidal sheet (this is just an aesthetics thing that can be adjusted) 10. Always add m for meters after distance values, even if they do not appear on the field worksheets
Continuous Page Numbers on Excel Spreadsheets:
1. Page numbers are given using the Footer tool a. Go to View/Header and Footer. Click on customize footer. b. Use the following formula: Page &[Page] of & # c. INSTEAD OF THE # literally place in how many pages total are in the document. So in the end the formula will look as so for a 4 pg. spreadsheet: Page &[Page] of & 4

GIS Methods 34
d. To start numbering pages with a number other than 1, use &[Page]+ or &[Page]- followed by the number you want to add or subtract from the actual page number. For example, to print starting with number 3 on the first page, type &[Page]+2. To print page 4 with number 3, type &[Page]-1.
Title of Data Sheets:
1. This most probably was created using the Header tool. a. Go to View/Header and Footer. Click on customize header. Title should be BOLDED and 10-font
Reformatting Data Sheets:
1. Always place a new date on the updated form. a. Go to View/Header and Footer. Click on customize header.
The date is placed under the title using ITALICS and 8-font 2. Save your revised form with the revision date in the title
ie:Trails05_06_05

GIS Methods 35
6. Arc Publisher and ArcReader ArcPublisher is an ArcGIS extension and ArcReader is a free, downloadable program from ESRI.com. In order to view maps and their associated data at a source different from where the data was created (i.e.: viewing from a CD of the project), the map must first be packaged and published in ArcGIS ArcPublisher. “To package” a map means to capture the image on the screen. After packaging, the map must then be published. “To publish the map,” means the data and the image are now bundled into a distributable format. Both steps are required. Because we were giving this project to stakeholders without ArcGIS software, we needed to find a suitable viewing program. ArcReader was chosen because it allows the user to see attributes, zoom in and turn on and off layers, and open up linked photos. Below describes both the ArcPublisher and the ArcReader process. The first step is using the ArcPublisher extension in ArcGIS. Using ArcPublisher:
1. Open your final map. 2. Install the Arc Publisher extension into ArcMap. This is done in two steps. First click on
Tools/Extensions and check off Arc Publisher. Second, go to View/Toolbars and click on Publisher. If you receive an error message, your computer may not have the Arc Publisher license. Check in with Gordon to get the code.
3. Go to File/Map Properties. At the bottom right, click on Data Source Options. Set to “store as relative path names.” Click OK.
4. Check your map for any broken links. Broken links are identified by a red exclamation mark, and the shapefile text is a muted gray. If your links are broken, right click on the shapefile, go to Set Data Source and re-connect the shapefile to its data. What happened was that somehow the data and the shape became disconnected, often when files are renamed or moved into different folders this will happen.
5. Go to the Publisher Toolbar. Click on the drop down and choose “Publish Map.” Create a new folder called: Arc Publisher
6. Save map with an appropriate name. 7. NOTE: This first map does not contain data, it only captures the image. Eventually you
can delete this .pmf and the folder, BUT only after the next steps (# 7 - 9a/b) 8. Return to the Arc Publisher Toolbar. Click on the second icon, “Package Data for
Published Maps” 9. Navigate to the saved map. A new frame will automatically open up. Click on the folder
icon on the right, and create new folder: call it ArcReader. Leave the Options section unchecked.
10. Next, click on the Vector tab. 11. OPTION 1 or 2 depending on how you want to package your data:
a. Option 1. i. This option packages only the data that intersects the data frame.
ii. Click on the Vector tab, upper left. Choose Shapefile from the dropdown and then choose the next tab accordingly. The Data Copy will tend not to be checked.

GIS Methods 36
iii. Click on the Raster tab now. Choose the first option- Clip the raster to the data frame. Again leave the data copy section unchecked.
iv. Click OK. v. Wait to see the pop-up frame indicating your files were successfully
published. Click OK. b. Option 2
i. This option packages all data associated with map. (use this for package a whole island to CD)
ii. For vector and raster use the data copy box and check off copy data into package.
iii. Click OK. iv. Wait to see the pop-up frame indicating your files were successfully
published. Click OK. 12. Go to the ArcReader folder and check out the data. Your map should be in the pmf folder
and your data in the data folder. This packaged .pmf file (the one that the program automatically placed into a pmf folder) is the map you keep. You can now delete the .pmf created when you published (the one in the ArcPublisher folder).
13. You can now save to a disc, etc.
Accessing ArcReader: 1. We placed ArcReader on each island CD. We found the free download at
http://www.esri.com/software/arcgis/arcreader/index.html 2. Also on each island CD is an Islandname_Readme.doc (i.e. LSI_Readme.doc) that
gives an overview on how to access the data within ArcReader. Included in the folder is also an ESRI tutorial on using ArcReader.
3. Each island CD was given an Interactive_Map folder. This is where the ArcReader program, and the packaged map and packaged data were placed.
4. On certain computers, after the program was installed, we had to open the ArcReader program first in order to view the. pmf map. On other computers, we simply clicked on the .pmf to view it.
Some helpful hints for immediately using ArcReader:
1. On certain computers, after the program was installed, we had to open the ArcReader program first in order to view the. pmf map. On other computers, we simply clicked on the .pmf to view it.
2. Access the photo links by clicking on the yellow lightening bolt icon found in the Toolbar. When you activate this icon you will notice a blue circle on top of the features. Click on the blue circle and the photo will open. The blue photo links will appear even if that layer is not checked. Photo attributes can be accessed using the identify tool, also in the Toolbar. The raw data is found on the CD in the folder \…dbf, and the original photos can be found at \…Photos.
3. To view data associated with the survey checklist, use the identify tool to click on any of the different polygons in the survey layer. To figure out the field names which may be truncated by the GIS program, go to the raw data found in \…dbf. The identify tool can also be used to view data affiliated with any feature on the map by simply clicking that feature.

GIS Methods 37
4. ArcReader is a powerful yet user-friendly program for viewing data, and is very quick to learn. Please refer to the Tutorial for more information.