Online Professional Development Getting started. Getting better.
Upload
khangminh22Category
view
0download
0
3
Introduction
Welcome to Getting Started with ArcGIS. This book is intended to help youget started using ESRI® ArcGIS® software and to illustrate the methods andprocedures involved in conducting a geographic information system (GIS)project. If you are new to GIS, this book is a great place to start—you canlearn how to use a GIS to solve problems while you are learning to useArcGIS.This book is divided into two sections. The first section, ‘Getting to knowArcGIS’, discusses the basics of ArcGIS and GIS data. The second section,‘Conducting a GIS project’, begins with Chapter 4, ‘Planning a GIS project’,and is a sample GIS project that you can work through. The project isdesigned to let you work at your own pace, without the need of additionalhelp. Readers who wish to complete the entire GIS project section of thebook should plan to spend about eight hours of focused time on the project.In order to get started, you will need ArcGIS installed on a Windows®
machine. You will also need to install the ArcTutor tutorial data on yourmachine or on a networked drive. Proceed to Chapter 1, ‘Welcome toArcGIS’, when you are ready to get started.
Introduction.pmd 2/12/2004, 11:55 AM3

Introduction.pmd 2/12/2004, 11:55 AM4
IN THIS CHAPTER
5
Welcome to ArcGIS 1• What can you do with ArcGIS?
• Unique projects to daily business
• Tasks you perform with ArcGIS
• Tips on learning ArcGIS
Welcome to ArcGIS, ESRI’s premier GIS software. You can do virtuallyany GIS job at any scale of complexity with ArcGIS, from conducting asingle analysis project on your own to implementing a vast, multiuser,enterprisewide GIS for your organization.Use this book to learn what GIS is all about, and in just a short time you canbegin to apply ArcGIS for all of your GIS needs.Today, GIS is used by thousands of different organizations and hundreds ofthousands of individuals to access and manage fantastically varied sets ofgeographically related information.In this chapter, you will find samples of real-world uses of ArcGIS, a briefdiscussion of the different ways GIS is used, some examples of howArcGIS lets you use central GIS functions, and finally, some directions forlearning more about ArcGIS.
Ch01.pmd 2/12/2004, 11:56 AM5
6 GETTING STARTED WITH ARCGIS
What can you do with ArcGIS?
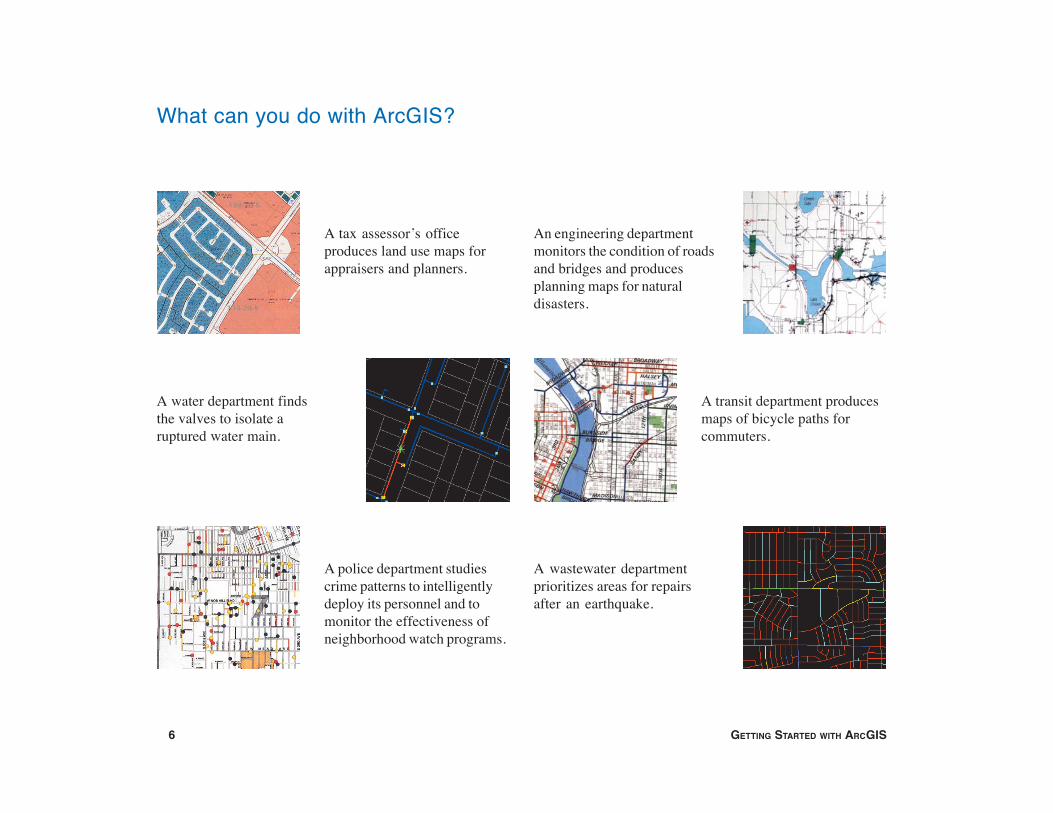
A wastewater departmentprioritizes areas for repairsafter an earthquake.
A transit department producesmaps of bicycle paths forcommuters.
An engineering departmentmonitors the condition of roadsand bridges and producesplanning maps for naturaldisasters.
A police department studiescrime patterns to intelligentlydeploy its personnel and tomonitor the effectiveness ofneighborhood watch programs.
A water department findsthe valves to isolate aruptured water main.
A tax assessor’s officeproduces land use maps forappraisers and planners.
Ch01.pmd 2/12/2004, 11:56 AM6
WELCOME TO ARCGIS 7
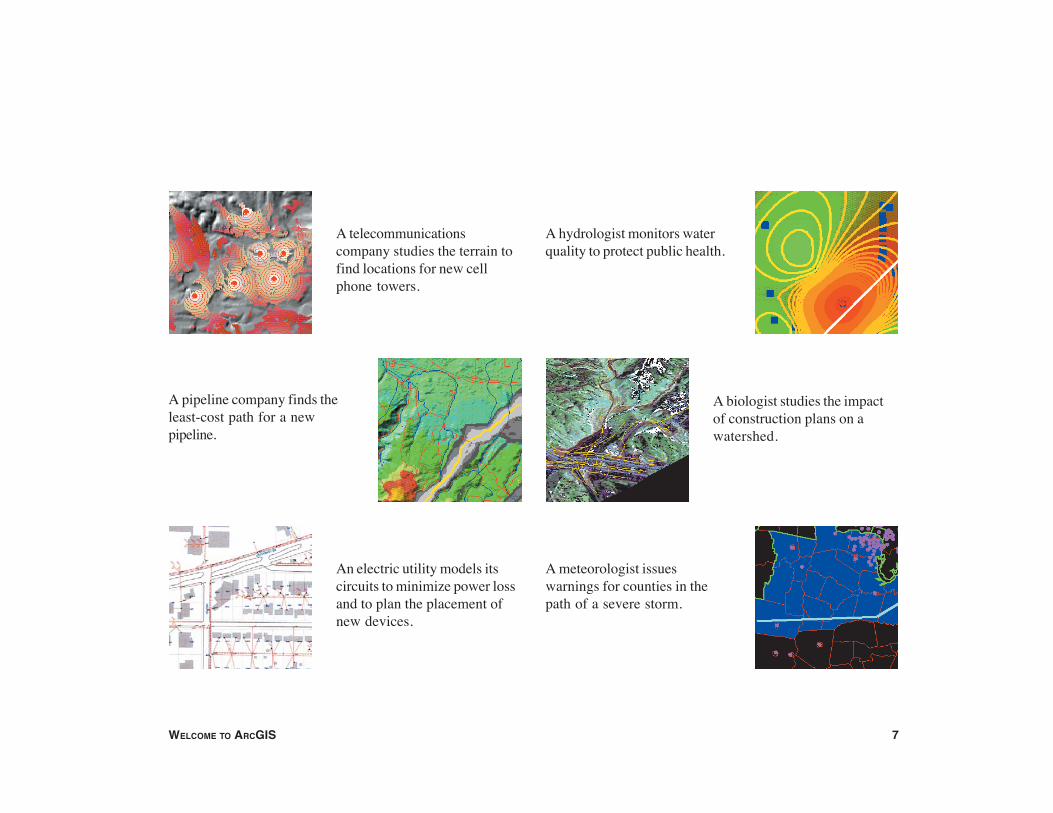
A meteorologist issueswarnings for counties in thepath of a severe storm.
A biologist studies the impactof construction plans on awatershed.
A hydrologist monitors waterquality to protect public health.
An electric utility models itscircuits to minimize power lossand to plan the placement ofnew devices.
A pipeline company finds theleast-cost path for a newpipeline.
A telecommunicationscompany studies the terrain tofind locations for new cellphone towers.
Ch01.pmd 2/12/2004, 11:56 AM7
8 GETTING STARTED WITH ARCGIS
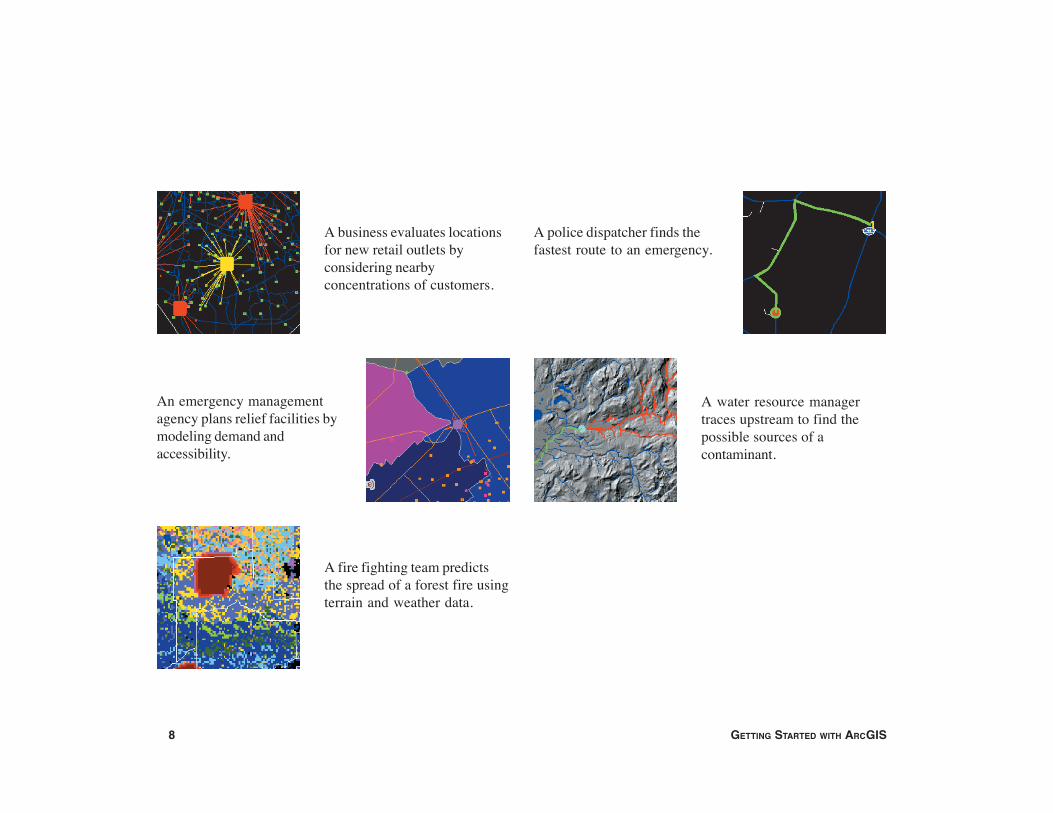
A business evaluates locationsfor new retail outlets byconsidering nearbyconcentrations of customers.
A water resource managertraces upstream to find thepossible sources of acontaminant.
A police dispatcher finds thefastest route to an emergency.
A fire fighting team predictsthe spread of a forest fire usingterrain and weather data.
An emergency managementagency plans relief facilities bymodeling demand andaccessibility.
Ch01.pmd 2/12/2004, 11:56 AM8
WELCOME TO ARCGIS 9
You can use ArcGIS in different ways, depending on thecomplexity of your needs.Some people use ArcGIS primarily as a single-user mappingand analysis tool, usually in the context of a well-defined,finite project. This common use of ArcGIS is sometimescalled project GIS. Other people use ArcGIS in a multiusersystem designed to serve an organization’s ongoing needsfor geographic information. Multiuser GIS is sometimesdivided into departmental and enterprise GIS according to asystem’s level of complexity and integration with the day-to-day operation of an organization.This book presents ArcGIS in the context of project GISbecause a project is a good, self-contained way to explore avariety of basic GIS functions.
Project GISIn a GIS analysis project, an analyst faces a variety of tasksthat can be grouped into four basic steps.The first step is to convert a question, such as “Where isthe best place for a new building?” or “How many potentialcustomers are near this store?”, into a GIS database designand analysis plan. This involves breaking the question intological parts, identifying what layers of data will be neededto answer each part, and developing a strategy forcombining the answers to each part of the question into afinal answer.The next step is to create a database that contains thegeographic data required to answer the question. This mayinvolve digitizing existing maps, obtaining and translatingelectronic data from a variety of sources and formats,
making sure the layers are of adequate quality for the task,making sure the layers are in the same coordinate systemand will overlay correctly, and adding items to the data totrack analysis result values. Personal workspaces of file-based data and personal geodatabases are used to organizeproject GIS geodatabases.The next step is to analyze the data. This usually involvesoverlaying different layers, querying attributes and featurelocations to answer each logical part of the question,storing the answers to the logical parts of the question, andretrieving and combining those answers to provide acomplete answer to the question.The final step in a project-based analysis is tocommunicate the results of the analysis, usually to peoplewho do not use GIS and who have different levels ofexperience in dealing with maps. Maps, reports, and graphsare all used, often together, to communicate the answer tothe question.
Multiuser GISIn a multiuser GIS, people in an organization—from a fewin a single office to hundreds in different branches—useGIS in different ways to support their daily tasks.Departmental GIS refers to systems developed within asingle department to support a key function of thedepartment. For example, a planning department mightroutinely use GIS to notify property owners of proposedzoning changes near their property.A departmental GIS is usually managed within thedepartment and often has specialists devoted to different
Unique projects to daily business
Ch01.pmd 2/12/2004, 11:56 AM9
10 GETTING STARTED WITH ARCGIS
tasks. For example, a department might have its ownsystem administrator, digitizer, and GIS analyst.Departmental GIS is often customized to automate andstreamline procedures. For example, a planning departmentcould use a GIS application that finds the names andaddresses of parcel owners within a designated area andautomatically generates notification letters.An enterprise GIS spans departments in an organization.These large systems support multiple functions of anorganization, from daily business to strategic planning. Anenterprise GIS is usually managed as a part of theorganization’s information technology infrastructure. Forexample, a city’s enterprise GIS integrates the businessfunctions of building and maintaining the city. Theengineering department builds the infrastructure for asubdivision using the same geodatabase that the planningdepartment and assessor use to do their jobs.An organization’s entire network becomes the platform foran enterprise GIS. To provide access to many users, anenterprise GIS stores data in commercial relationaldatabase management systems (RDBMSs), such asOracle®, Informix® Dynamic Server, andMicrosoft® SQL Server™, that have been spatially enabledby ESRI’s ArcSDE® (formerly SDE®) software.Using ArcSDE allows GIS data to be viewed and edited bymany people simultaneously. To make the most of anetworked system’s capabilities, multiple seats of keyapplications, such as ArcCatalog™, ArcMap™, andArcToolbox™, are deployed on desktop machines acrossan organization. Servers supply them with data and performprocessor-intensive tasks.
The functions of a multiuser GIS are similar to those of aproject GIS but on a larger scale and operating in acontinuous, cyclical fashion. Planning is crucial for multiusersystems, but the rewards—including increased operationalefficiency, better allocation of scarce resources,consistency of information, and better-informeddecisions—are tremendous.
Ch01.pmd 2/12/2004, 11:56 AM10
WELCOME TO ARCGIS 11
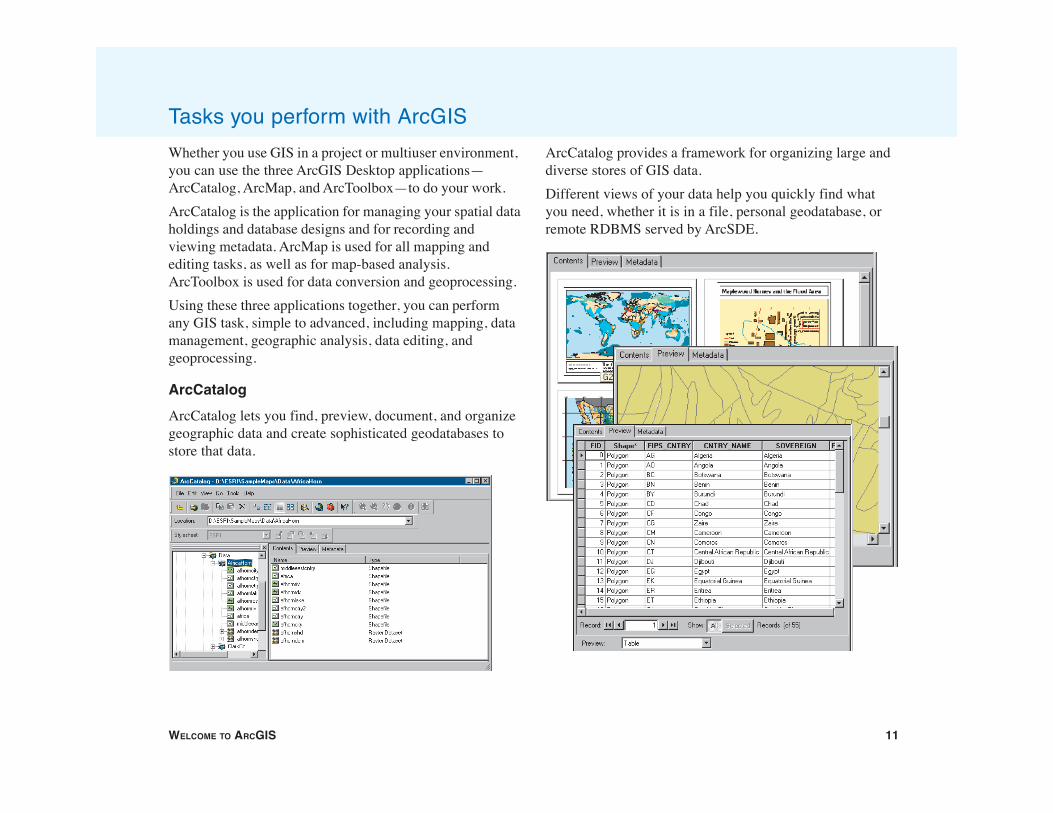
Whether you use GIS in a project or multiuser environment,you can use the three ArcGIS Desktop applications—ArcCatalog, ArcMap, and ArcToolbox—to do your work.ArcCatalog is the application for managing your spatial dataholdings and database designs and for recording andviewing metadata. ArcMap is used for all mapping andediting tasks, as well as for map-based analysis.ArcToolbox is used for data conversion and geoprocessing.Using these three applications together, you can performany GIS task, simple to advanced, including mapping, datamanagement, geographic analysis, data editing, andgeoprocessing.
ArcCatalogArcCatalog lets you find, preview, document, and organizegeographic data and create sophisticated geodatabases tostore that data.
ArcCatalog provides a framework for organizing large anddiverse stores of GIS data.Different views of your data help you quickly find whatyou need, whether it is in a file, personal geodatabase, orremote RDBMS served by ArcSDE.
Tasks you perform with ArcGIS
Ch01.pmd 2/12/2004, 11:56 AM11
12 GETTING STARTED WITH ARCGIS
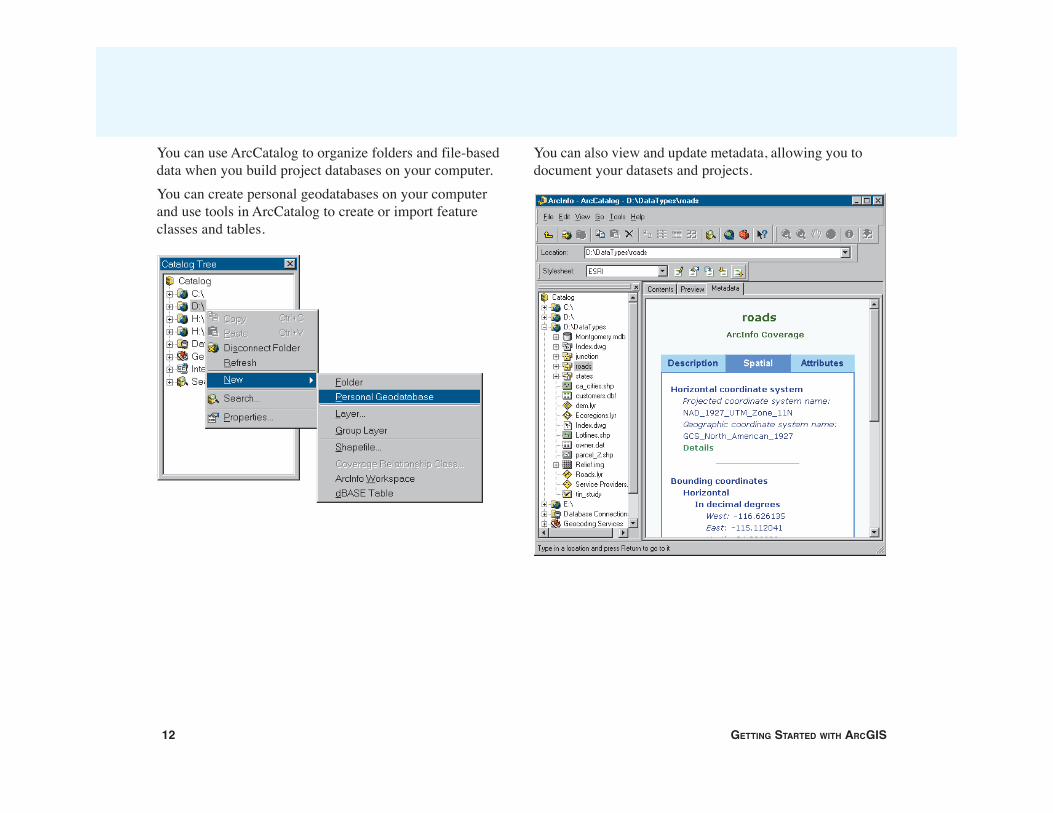
You can use ArcCatalog to organize folders and file-baseddata when you build project databases on your computer.You can create personal geodatabases on your computerand use tools in ArcCatalog to create or import featureclasses and tables.
You can also view and update metadata, allowing you todocument your datasets and projects.
Ch01.pmd 2/12/2004, 11:56 AM12
WELCOME TO ARCGIS 13
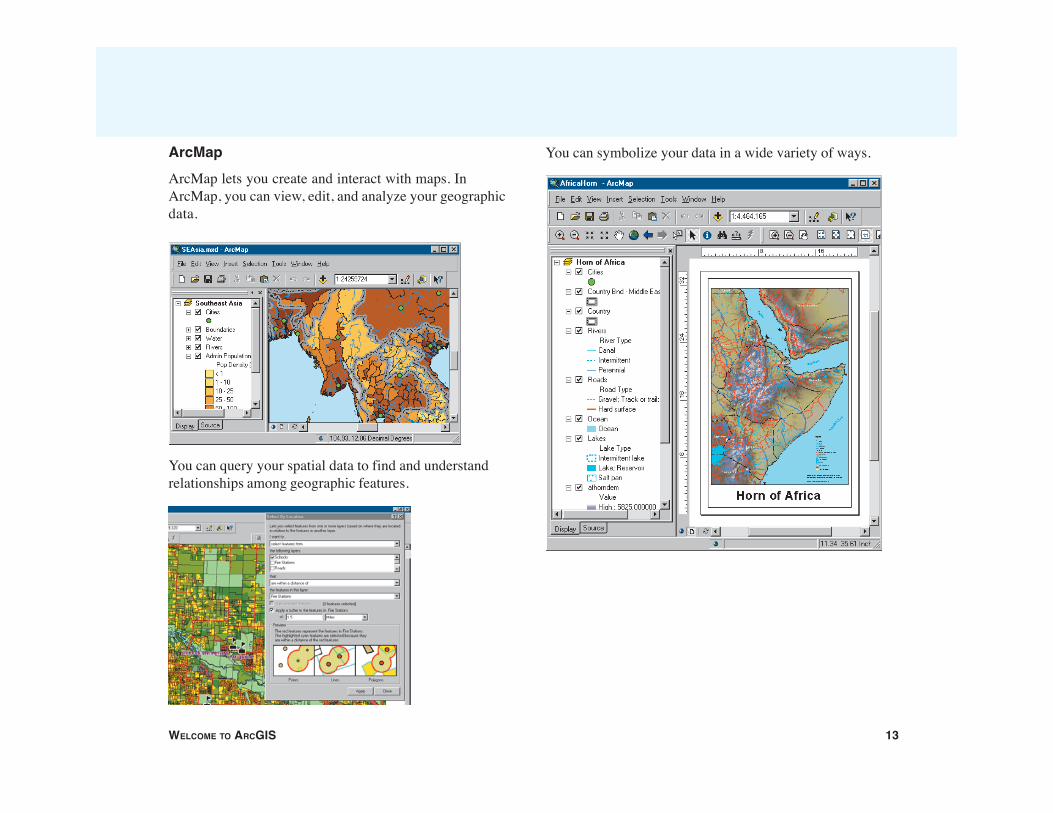
ArcMapArcMap lets you create and interact with maps. InArcMap, you can view, edit, and analyze your geographicdata.
You can query your spatial data to find and understandrelationships among geographic features.
You can symbolize your data in a wide variety of ways.
Ch01.pmd 2/12/2004, 11:56 AM13
14 GETTING STARTED WITH ARCGIS
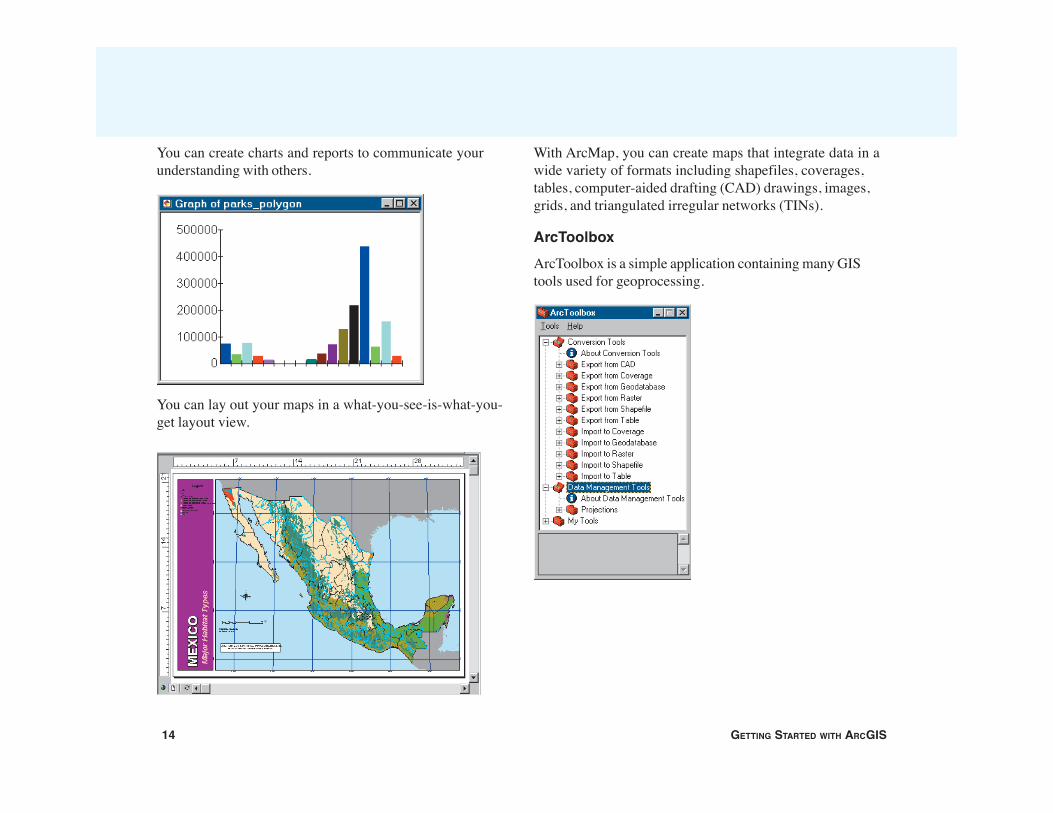
You can create charts and reports to communicate yourunderstanding with others.
You can lay out your maps in a what-you-see-is-what-you-get layout view.
With ArcMap, you can create maps that integrate data in awide variety of formats including shapefiles, coverages,tables, computer-aided drafting (CAD) drawings, images,grids, and triangulated irregular networks (TINs).
ArcToolboxArcToolbox is a simple application containing many GIStools used for geoprocessing.
Ch01.pmd 2/12/2004, 11:56 AM14
WELCOME TO ARCGIS 15
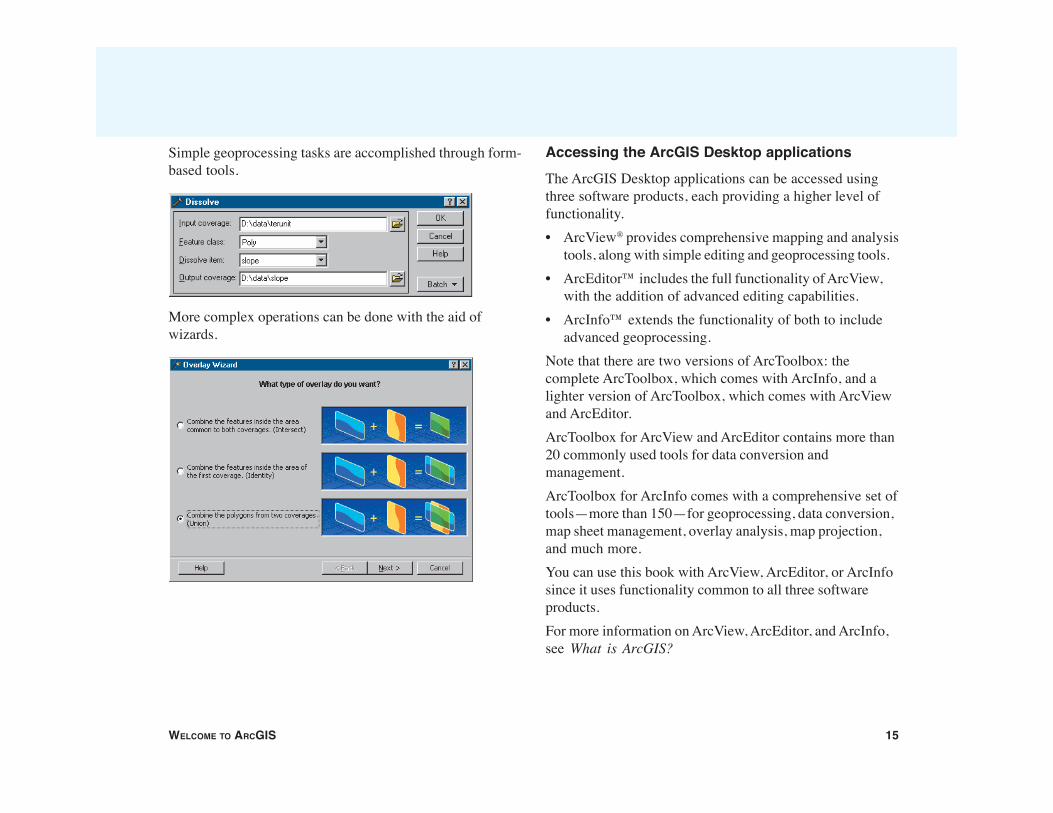
Simple geoprocessing tasks are accomplished through form-based tools.
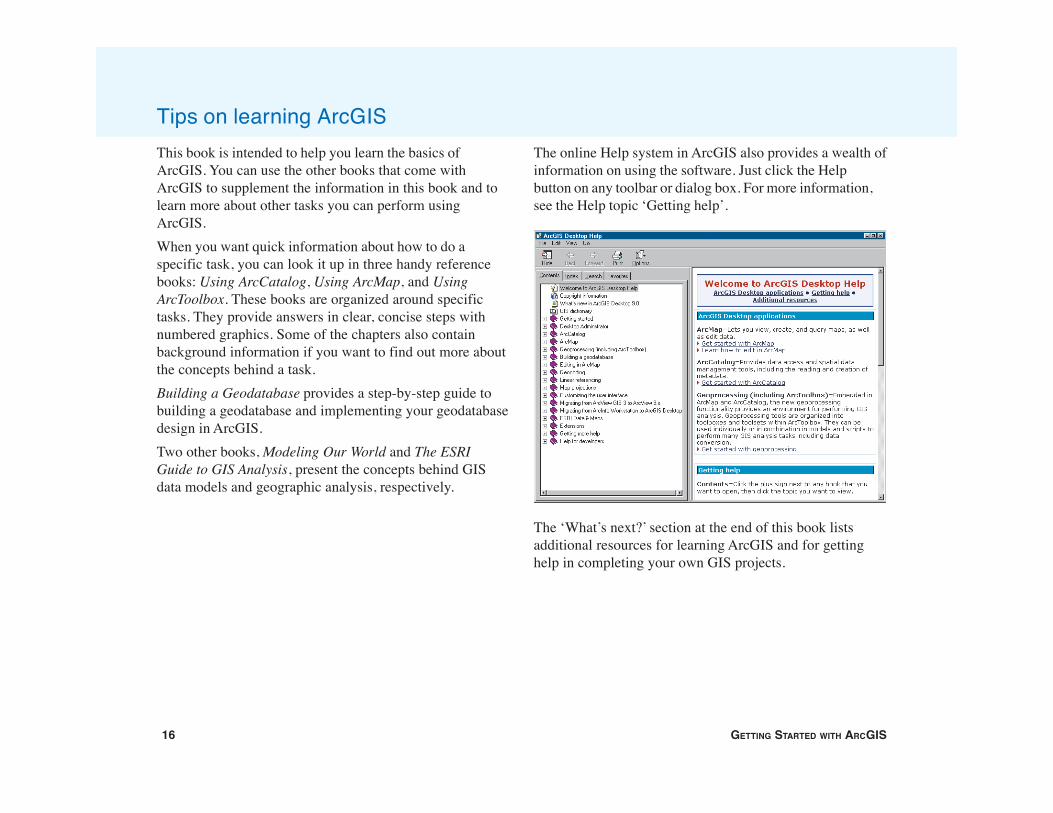
More complex operations can be done with the aid ofwizards.
Accessing the ArcGIS Desktop applicationsThe ArcGIS Desktop applications can be accessed usingthree software products, each providing a higher level offunctionality.• ArcView® provides comprehensive mapping and analysis
tools, along with simple editing and geoprocessing tools.• ArcEditor™ includes the full functionality of ArcView,
with the addition of advanced editing capabilities.• ArcInfo™ extends the functionality of both to include
advanced geoprocessing.Note that there are two versions of ArcToolbox: thecomplete ArcToolbox, which comes with ArcInfo, and alighter version of ArcToolbox, which comes with ArcViewand ArcEditor.ArcToolbox for ArcView and ArcEditor contains more than20 commonly used tools for data conversion andmanagement.ArcToolbox for ArcInfo comes with a comprehensive set oftools—more than 150—for geoprocessing, data conversion,map sheet management, overlay analysis, map projection,and much more.You can use this book with ArcView, ArcEditor, or ArcInfosince it uses functionality common to all three softwareproducts.For more information on ArcView, ArcEditor, and ArcInfo,see What is ArcGIS?
Ch01.pmd 2/12/2004, 11:56 AM15
16 GETTING STARTED WITH ARCGIS
This book is intended to help you learn the basics ofArcGIS. You can use the other books that come withArcGIS to supplement the information in this book and tolearn more about other tasks you can perform usingArcGIS.When you want quick information about how to do aspecific task, you can look it up in three handy referencebooks: Using ArcCatalog, Using ArcMap, and UsingArcToolbox. These books are organized around specifictasks. They provide answers in clear, concise steps withnumbered graphics. Some of the chapters also containbackground information if you want to find out more aboutthe concepts behind a task.Building a Geodatabase provides a step-by-step guide tobuilding a geodatabase and implementing your geodatabasedesign in ArcGIS.Two other books, Modeling Our World and The ESRIGuide to GIS Analysis, present the concepts behind GISdata models and geographic analysis, respectively.
Tips on learning ArcGISThe online Help system in ArcGIS also provides a wealth ofinformation on using the software. Just click the Helpbutton on any toolbar or dialog box. For more information,see the Help topic ‘Getting help’.
The ‘What’s next?’ section at the end of this book listsadditional resources for learning ArcGIS and for gettinghelp in completing your own GIS projects.
Ch01.pmd 2/12/2004, 11:56 AM16
IN THIS CHAPTER
17
Exploring ArcCatalog and ArcMap 2• Introducing ArcCatalog
• Viewing data in ArcCatalog
• Connecting to data
• Introducing ArcMap
• Working with maps
• Exploring a map
• Adding a layer to a map
• Adding features from a database
• Changing how features are drawn
• Adding labels to a map
• Working with the map layout
• Saving a map
• Printing a map
• What’s next?
Maps are the most commonly used tools for understanding spatial informa-tion. Whether you do analysis or editing, produce wall maps or illustratereports, design GIS databases or manage them—when you work with GISyou work with maps. ArcMap allows you to work with all of your geo-graphic data in maps, regardless of the format or location of the underlyingdata. With ArcMap, you can assemble a map quickly from predefinedlayers, or you can add data from coverages, shapefiles, geodatabases, grids,TINs, images, and tables of coordinates or addresses.Two other GIS applications—ArcCatalog and ArcToolbox—are designed towork with ArcMap. In ArcCatalog, you can browse, organize, and documentyour data and easily drag and drop it onto an existing map in ArcMap. Usingthe tools in ArcToolbox, you can project and convert data. If you are work-ing in ArcInfo, ArcToolbox also has tools for sophisticated geoprocessing. Ithas never been easier to use the power of GIS.In this chapter, you will create a map for a planning meeting of theGreenvalley City council. You will use ArcCatalog to find the data andproduce the map in ArcMap.
Ch02.pmd 2/12/2004, 12:03 PM17
18 GETTING STARTED WITH ARCGIS
Introducing ArcCatalogArcCatalog is the tool for browsing, organizing, distributing,and documenting an organization’s GIS data holdings.In this exercise you work for the (fictitious) city ofGreenvalley. The city council is debating a proposal to buildadditional water mains downtown. As part of the process,the council is reviewing water use in the downtown area.You have been asked to make a map that shows the watermains in downtown Greenvalley and the relative water useat each parcel downtown.To make the map easy to read, you will add the data to ageneral-purpose map of the town.
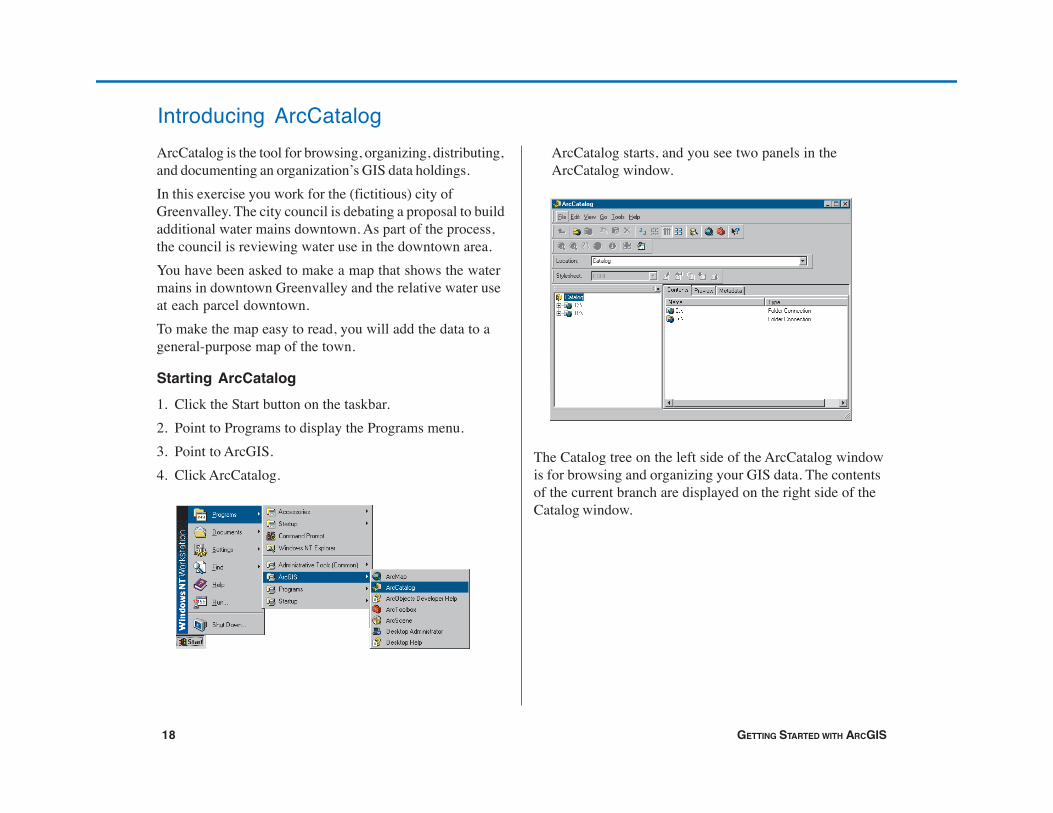
Starting ArcCatalog1. Click the Start button on the taskbar.2. Point to Programs to display the Programs menu.3. Point to ArcGIS.4. Click ArcCatalog.
ArcCatalog starts, and you see two panels in theArcCatalog window.
The Catalog tree on the left side of the ArcCatalog windowis for browsing and organizing your GIS data. The contentsof the current branch are displayed on the right side of theCatalog window.
Ch02.pmd 2/12/2004, 12:03 PM18
EXPLORING ARCCATALOG AND ARCMAP 19
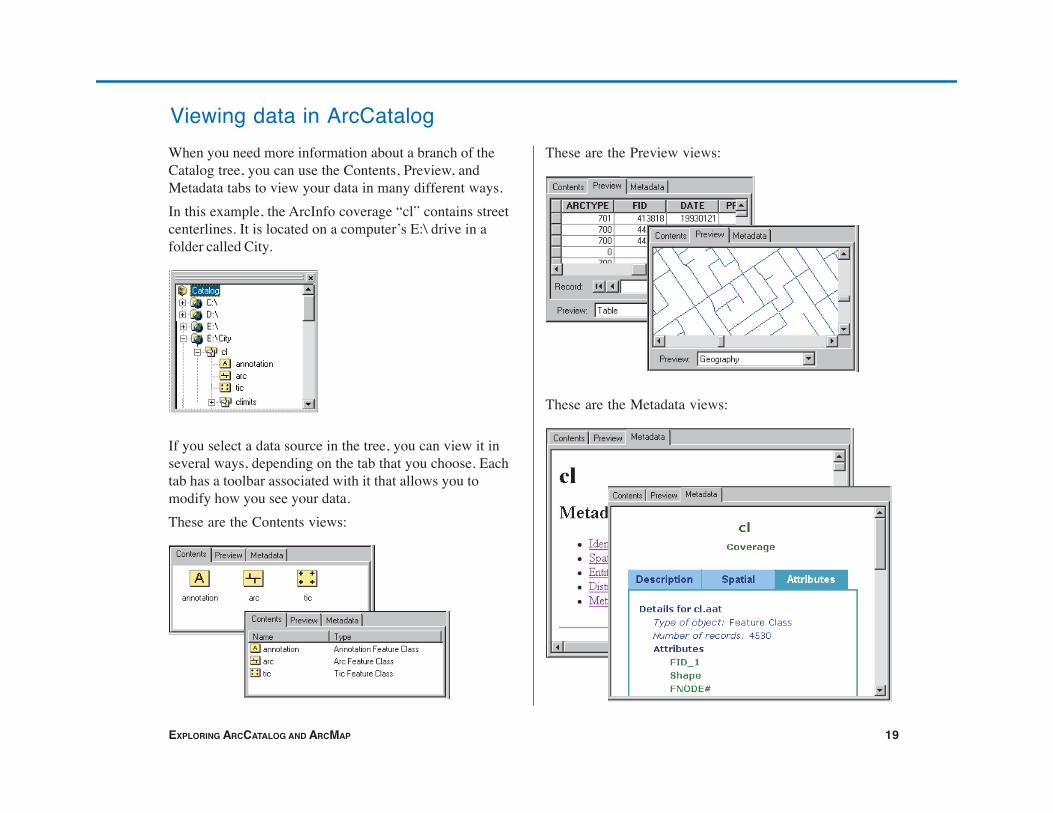
When you need more information about a branch of theCatalog tree, you can use the Contents, Preview, andMetadata tabs to view your data in many different ways.In this example, the ArcInfo coverage “cl” contains streetcenterlines. It is located on a computer’s E:\ drive in afolder called City.
If you select a data source in the tree, you can view it inseveral ways, depending on the tab that you choose. Eachtab has a toolbar associated with it that allows you tomodify how you see your data.These are the Contents views:
Viewing data in ArcCatalogThese are the Preview views:
These are the Metadata views:
Ch02.pmd 2/12/2004, 12:03 PM19
20 GETTING STARTED WITH ARCGIS
When you start ArcCatalog for the first time, the Catalogtree has a branch for each local hard drive. Branches forcoordinate systems, database connections, geocodingservices, Internet servers, and search results can be addedby clicking the Tools menu and clicking Options, thenchecking the check boxes next to the branches you want toadd to the Catalog. You can view the contents of a branchby double-clicking it or by clicking the plus sign beside it.You can also create new branches in the Catalog tree tomake it easier to navigate to your data. These branches arecalled connections.Before continuing, you will need to know where the tutorialdata has been installed on your system.
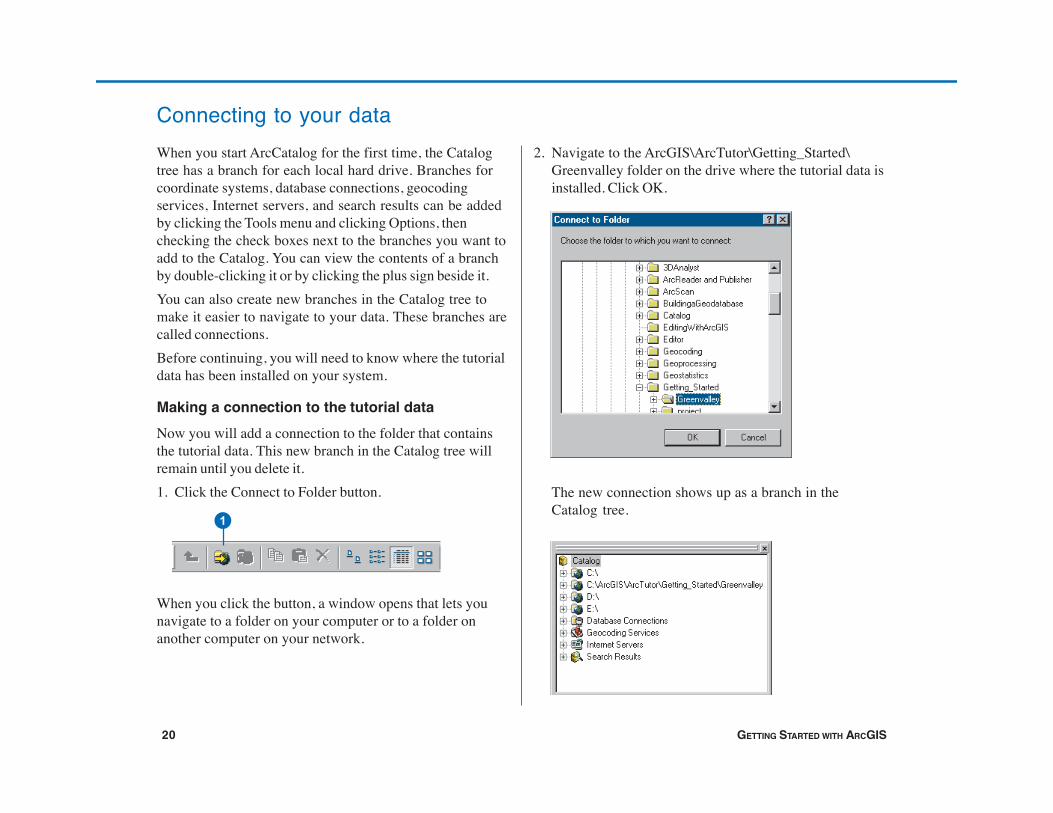
Making a connection to the tutorial dataNow you will add a connection to the folder that containsthe tutorial data. This new branch in the Catalog tree willremain until you delete it.1. Click the Connect to Folder button.
When you click the button, a window opens that lets younavigate to a folder on your computer or to a folder onanother computer on your network.
2. Navigate to the ArcGIS\ArcTutor\Getting_Started\Greenvalley folder on the drive where the tutorial data isinstalled. Click OK.
The new connection shows up as a branch in theCatalog tree.
Connecting to your data
1
Ch02.pmd 2/12/2004, 12:03 PM20
EXPLORING ARCCATALOG AND ARCMAP 21
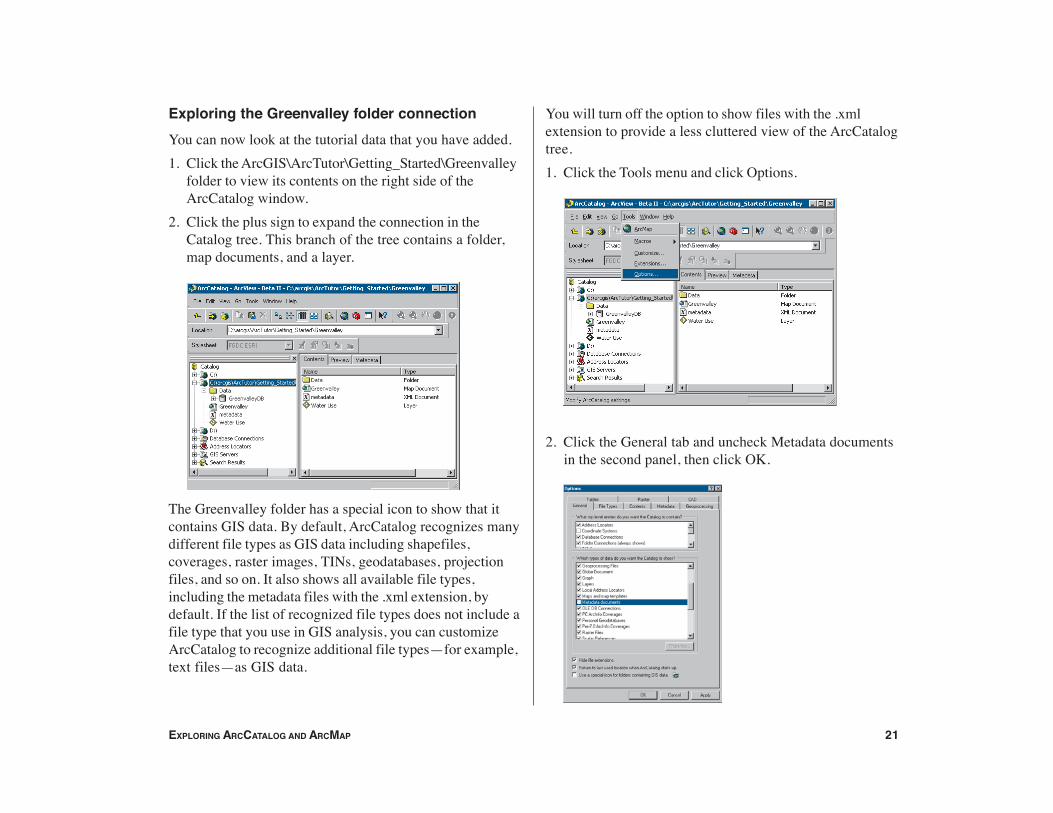
Exploring the Greenvalley folder connectionYou can now look at the tutorial data that you have added.1. Click the ArcGIS\ArcTutor\Getting_Started\Greenvalley
folder to view its contents on the right side of theArcCatalog window.
2. Click the plus sign to expand the connection in theCatalog tree. This branch of the tree contains a folder,map documents, and a layer.
The Greenvalley folder has a special icon to show that itcontains GIS data. By default, ArcCatalog recognizes manydifferent file types as GIS data including shapefiles,coverages, raster images, TINs, geodatabases, projectionfiles, and so on. It also shows all available file types,including the metadata files with the .xml extension, bydefault. If the list of recognized file types does not include afile type that you use in GIS analysis, you can customizeArcCatalog to recognize additional file types—for example,text files—as GIS data.
You will turn off the option to show files with the .xmlextension to provide a less cluttered view of the ArcCatalogtree.1. Click the Tools menu and click Options.
2. Click the General tab and uncheck Metadata documentsin the second panel, then click OK.
Ch02.pmd 2/12/2004, 12:03 PM21
22 GETTING STARTED WITH ARCGIS
The Greenvalley map document is a general-purpose mapof the city.The Water Use layer shows a set of parcels in Greenvalleywith a color scheme that indicates relative water use ateach parcel.
Maps and layersMaps and layers are important ways of organizing anddisplaying data in ArcGIS.Maps, such as everyday paper maps, can contain manykinds of data. The data on a map is organized into layers,which are drawn on the map in a particular order. Eachmap contains a page layout where graphic elements, suchas legends, North arrows, scalebars, text, and othergraphics, are arranged. The layout shows the map page asit will be printed.Layers define how a set of geographic features will bedrawn when they are added to a map. They also act asshortcuts to the place where the data is actually stored—not necessarily the same place as where the layer file isstored. In this case, both the map and the layer refer to datathat is stored in the Data folder.If you store your geographic data in a central database, youcan create maps and layers that refer to the database. Thismakes it easy to share maps and layers within anorganization and eliminates the need to make duplicatecopies of your data.
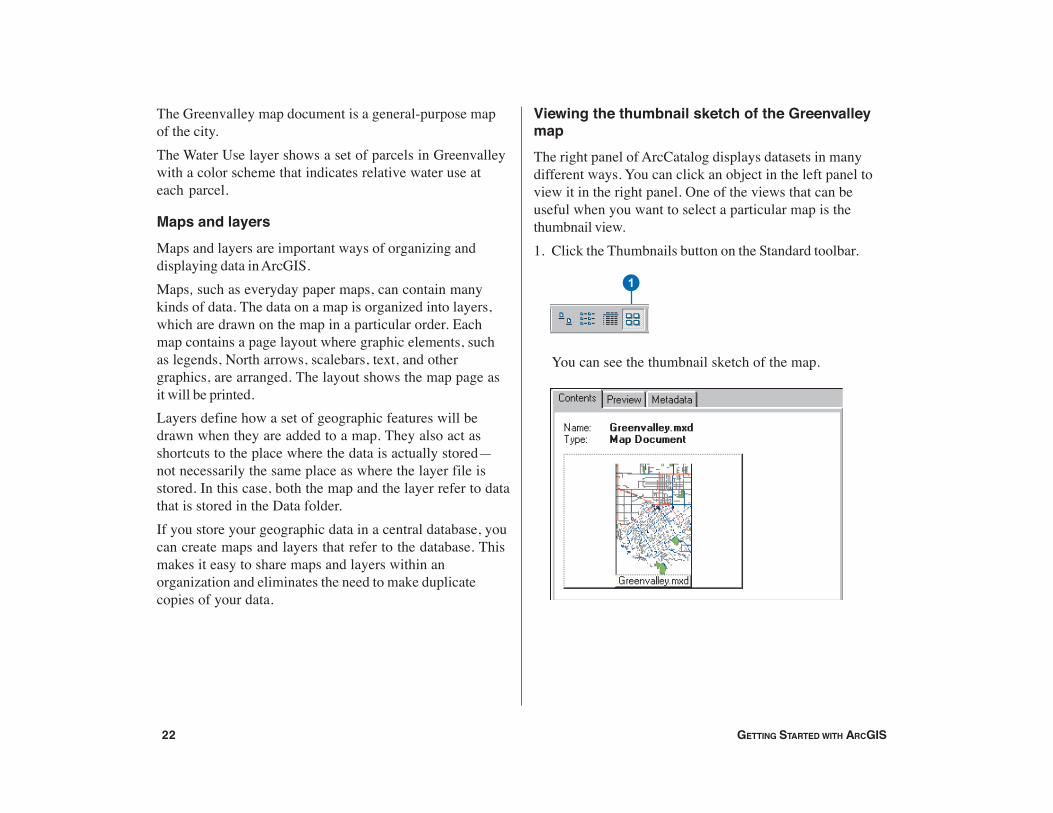
Viewing the thumbnail sketch of the GreenvalleymapThe right panel of ArcCatalog displays datasets in manydifferent ways. You can click an object in the left panel toview it in the right panel. One of the views that can beuseful when you want to select a particular map is thethumbnail view.1. Click the Thumbnails button on the Standard toolbar.
You can see the thumbnail sketch of the map.
1
Ch02.pmd 2/12/2004, 12:03 PM22
EXPLORING ARCCATALOG AND ARCMAP 23
Launch ArcMap button
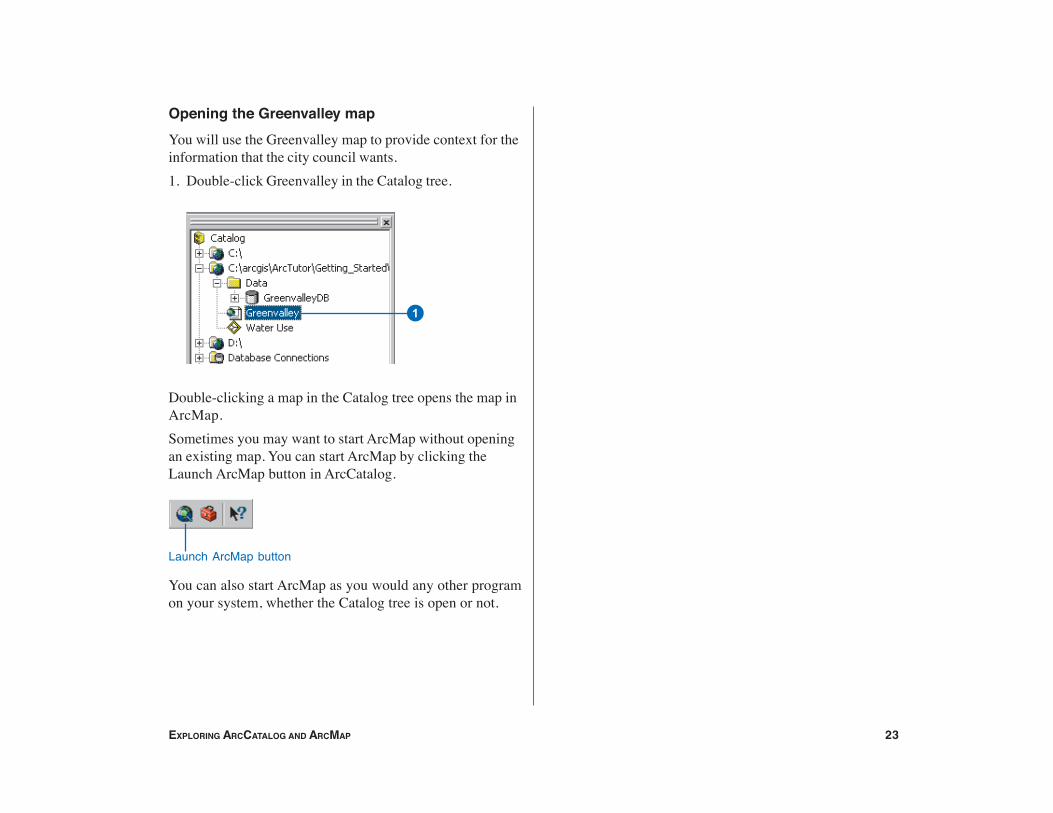
Opening the Greenvalley mapYou will use the Greenvalley map to provide context for theinformation that the city council wants.1. Double-click Greenvalley in the Catalog tree.
Double-clicking a map in the Catalog tree opens the map inArcMap.Sometimes you may want to start ArcMap without openingan existing map. You can start ArcMap by clicking theLaunch ArcMap button in ArcCatalog.
You can also start ArcMap as you would any other programon your system, whether the Catalog tree is open or not.
1
Ch02.pmd 2/12/2004, 12:03 PM23
24 GETTING STARTED WITH ARCGIS
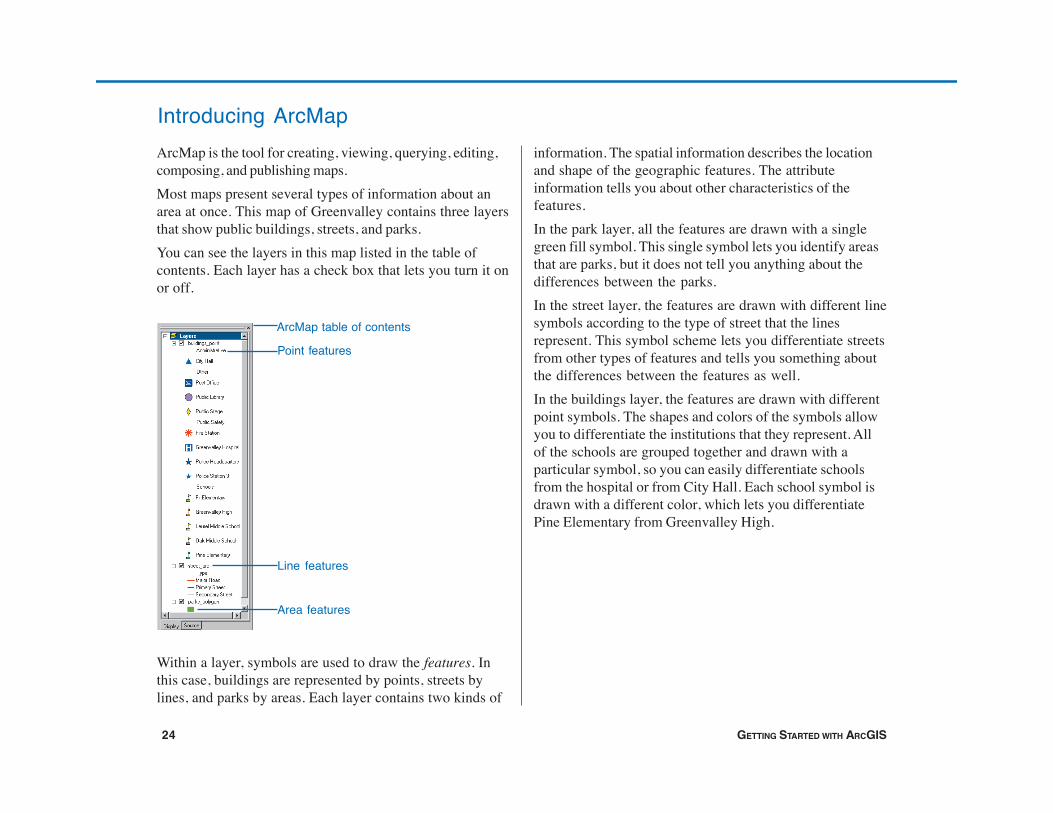
Introducing ArcMapArcMap is the tool for creating, viewing, querying, editing,composing, and publishing maps.Most maps present several types of information about anarea at once. This map of Greenvalley contains three layersthat show public buildings, streets, and parks.You can see the layers in this map listed in the table ofcontents. Each layer has a check box that lets you turn it onor off.
Within a layer, symbols are used to draw the features. Inthis case, buildings are represented by points, streets bylines, and parks by areas. Each layer contains two kinds of
information. The spatial information describes the locationand shape of the geographic features. The attributeinformation tells you about other characteristics of thefeatures.In the park layer, all the features are drawn with a singlegreen fill symbol. This single symbol lets you identify areasthat are parks, but it does not tell you anything about thedifferences between the parks.In the street layer, the features are drawn with different linesymbols according to the type of street that the linesrepresent. This symbol scheme lets you differentiate streetsfrom other types of features and tells you something aboutthe differences between the features as well.In the buildings layer, the features are drawn with differentpoint symbols. The shapes and colors of the symbols allowyou to differentiate the institutions that they represent. Allof the schools are grouped together and drawn with aparticular symbol, so you can easily differentiate schoolsfrom the hospital or from City Hall. Each school symbol isdrawn with a different color, which lets you differentiatePine Elementary from Greenvalley High.
ArcMap table of contents
Point features
Line features
Area features
Ch02.pmd 2/12/2004, 12:03 PM24
EXPLORING ARCCATALOG AND ARCMAP 25
ArcMap offers many ways to interact with maps.
ExploringMaps let you see and interpret the spatial relationshipsamong features. You could use the map you have justopened to find City Hall, to identify parks near schools, or todetermine the names of the streets around the library.
AnalyzingYou can create new information and find hidden patterns byadding layers to a map. For example, if you added a layerof demographic information to the Greenvalley map, youmight use the resulting map to define school districts or findpotential customers. If you added layers of geology andsurface slope, you might use the map to identify areas atrisk for landslides.
Presenting resultsArcMap makes it easy to lay out your maps for printing,embedding in other documents, or electronic publishing. Youcan quickly make great maps of your data. When you savea map, all of your layout work, symbols, text, and graphicsare preserved.ArcMap includes a vast array of tools for creating andusing maps. In the rest of this chapter, you will use some ofthese tools.
Working with mapsCustomizingMaps are tools for getting a job done. You can create mapsthat have exactly the tools you need to help you completeyour job quickly. You can easily customize the ArcMapinterface by adding or removing tools to or from existingtoolbars or by creating custom toolbars. You can save thesechanges to the interface with a particular map or for everymap that you open.You can also use the Visual Basic® for Applications (VBA)programming language included in ArcMap to create newtools and interfaces. For example, you can create a VBAtool to make a table of the addresses of houses in aselected area. Once the tool is created, you can associate itwith a custom toolbar and save it with a map for anyone touse.
ProgrammingYou can build completely new interfaces for interactingwith your maps and create new, specialized classes offeatures. ArcGIS is built using Microsoft’s ComponentObject Model (COM); all of the COM components areavailable to developers using a COM-compliantprogramming language. For more information aboutcustomizing ArcMap and ArcCatalog, refer to ExploringArcObjects.
Ch02.pmd 2/12/2004, 12:03 PM25
26 GETTING STARTED WITH ARCGIS
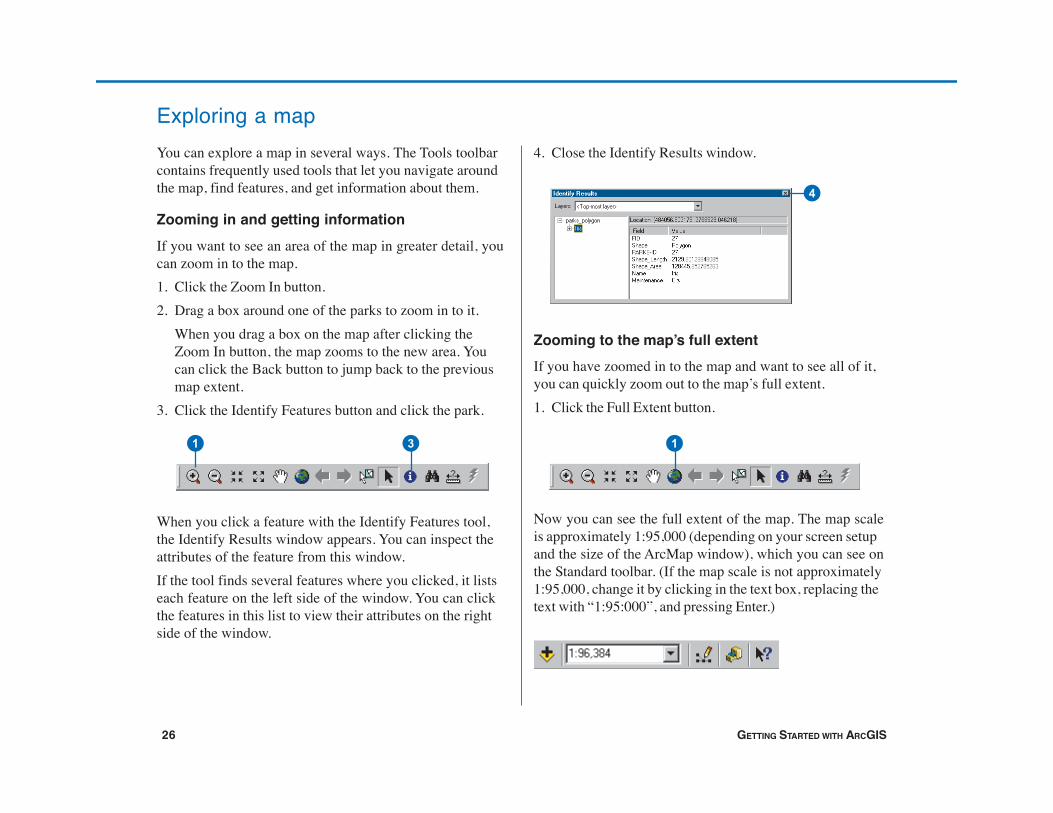
Exploring a mapYou can explore a map in several ways. The Tools toolbarcontains frequently used tools that let you navigate aroundthe map, find features, and get information about them.
Zooming in and getting informationIf you want to see an area of the map in greater detail, youcan zoom in to the map.1. Click the Zoom In button.2. Drag a box around one of the parks to zoom in to it.
When you drag a box on the map after clicking theZoom In button, the map zooms to the new area. Youcan click the Back button to jump back to the previousmap extent.
3. Click the Identify Features button and click the park.
When you click a feature with the Identify Features tool,the Identify Results window appears. You can inspect theattributes of the feature from this window.If the tool finds several features where you clicked, it listseach feature on the left side of the window. You can clickthe features in this list to view their attributes on the rightside of the window.
4. Close the Identify Results window.
Zooming to the map’s full extentIf you have zoomed in to the map and want to see all of it,you can quickly zoom out to the map’s full extent.1. Click the Full Extent button.
Now you can see the full extent of the map. The map scaleis approximately 1:95,000 (depending on your screen setupand the size of the ArcMap window), which you can see onthe Standard toolbar. (If the map scale is not approximately1:95,000, change it by clicking in the text box, replacing thetext with “1:95:000”, and pressing Enter.)
1 3 1
4
Ch02.pmd 2/12/2004, 12:03 PM26
EXPLORING ARCCATALOG AND ARCMAP 27
At this scale, the building symbols are not visible. TheMaximum Visible Scale property of this layer has been setto 1:70,000. You will change some of the properties of alayer later in this chapter.
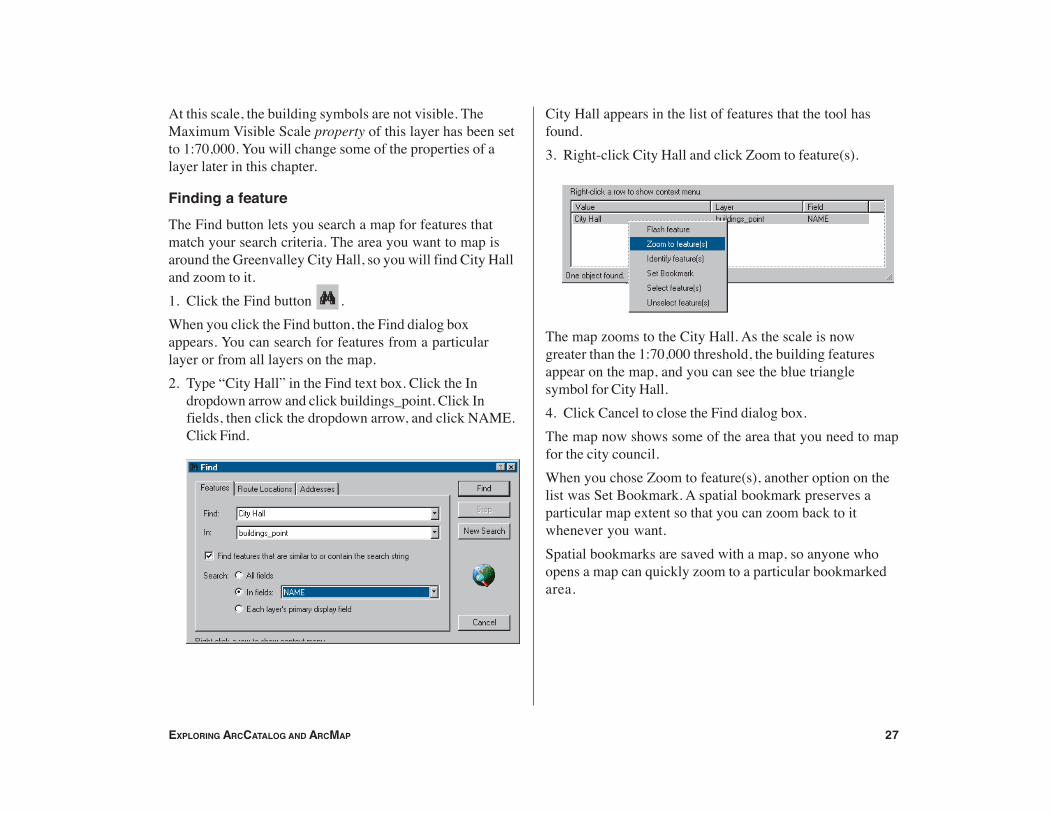
Finding a featureThe Find button lets you search a map for features thatmatch your search criteria. The area you want to map isaround the Greenvalley City Hall, so you will find City Halland zoom to it.1. Click the Find button .When you click the Find button, the Find dialog boxappears. You can search for features from a particularlayer or from all layers on the map.2. Type “City Hall” in the Find text box. Click the In
dropdown arrow and click buildings_point. Click Infields, then click the dropdown arrow, and click NAME.Click Find.
City Hall appears in the list of features that the tool hasfound.3. Right-click City Hall and click Zoom to feature(s).
The map zooms to the City Hall. As the scale is nowgreater than the 1:70,000 threshold, the building featuresappear on the map, and you can see the blue trianglesymbol for City Hall.4. Click Cancel to close the Find dialog box.The map now shows some of the area that you need to mapfor the city council.When you chose Zoom to feature(s), another option on thelist was Set Bookmark. A spatial bookmark preserves aparticular map extent so that you can zoom back to itwhenever you want.Spatial bookmarks are saved with a map, so anyone whoopens a map can quickly zoom to a particular bookmarkedarea.
Ch02.pmd 2/12/2004, 12:03 PM27
28 GETTING STARTED WITH ARCGIS
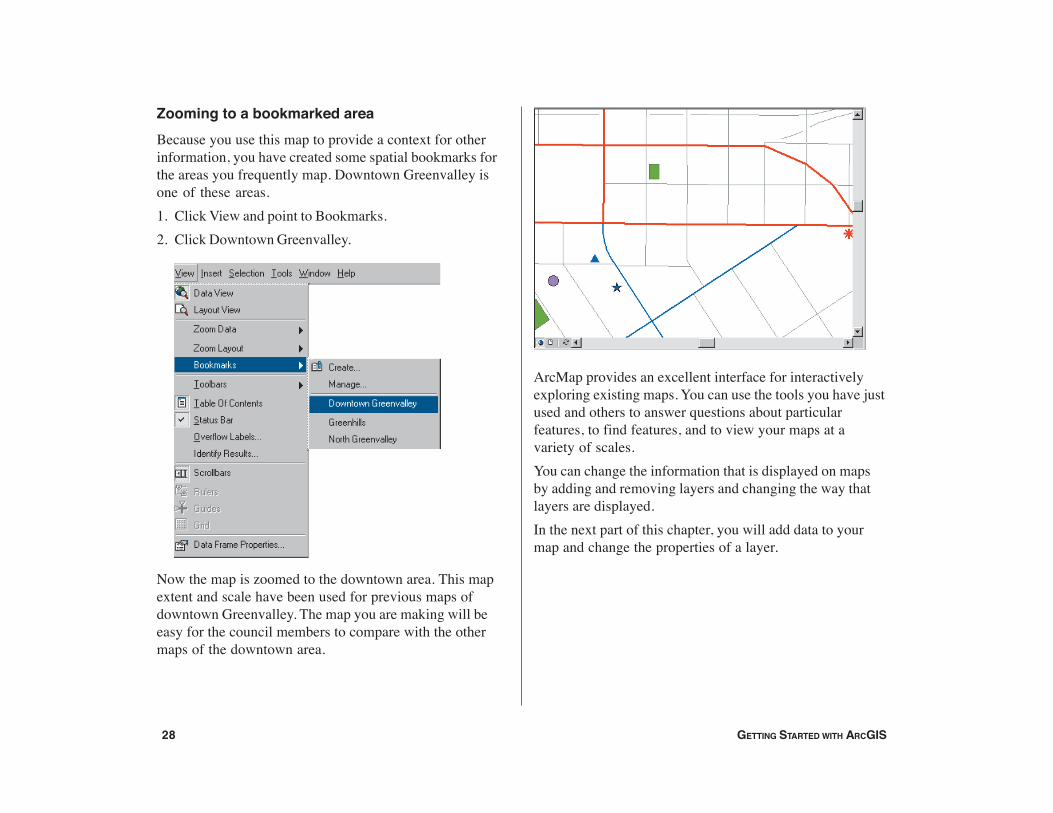
Zooming to a bookmarked areaBecause you use this map to provide a context for otherinformation, you have created some spatial bookmarks forthe areas you frequently map. Downtown Greenvalley isone of these areas.1. Click View and point to Bookmarks.2. Click Downtown Greenvalley.
Now the map is zoomed to the downtown area. This mapextent and scale have been used for previous maps ofdowntown Greenvalley. The map you are making will beeasy for the council members to compare with the othermaps of the downtown area.
ArcMap provides an excellent interface for interactivelyexploring existing maps. You can use the tools you have justused and others to answer questions about particularfeatures, to find features, and to view your maps at avariety of scales.You can change the information that is displayed on mapsby adding and removing layers and changing the way thatlayers are displayed.In the next part of this chapter, you will add data to yourmap and change the properties of a layer.
Ch02.pmd 2/12/2004, 12:03 PM28
EXPLORING ARCCATALOG AND ARCMAP 29
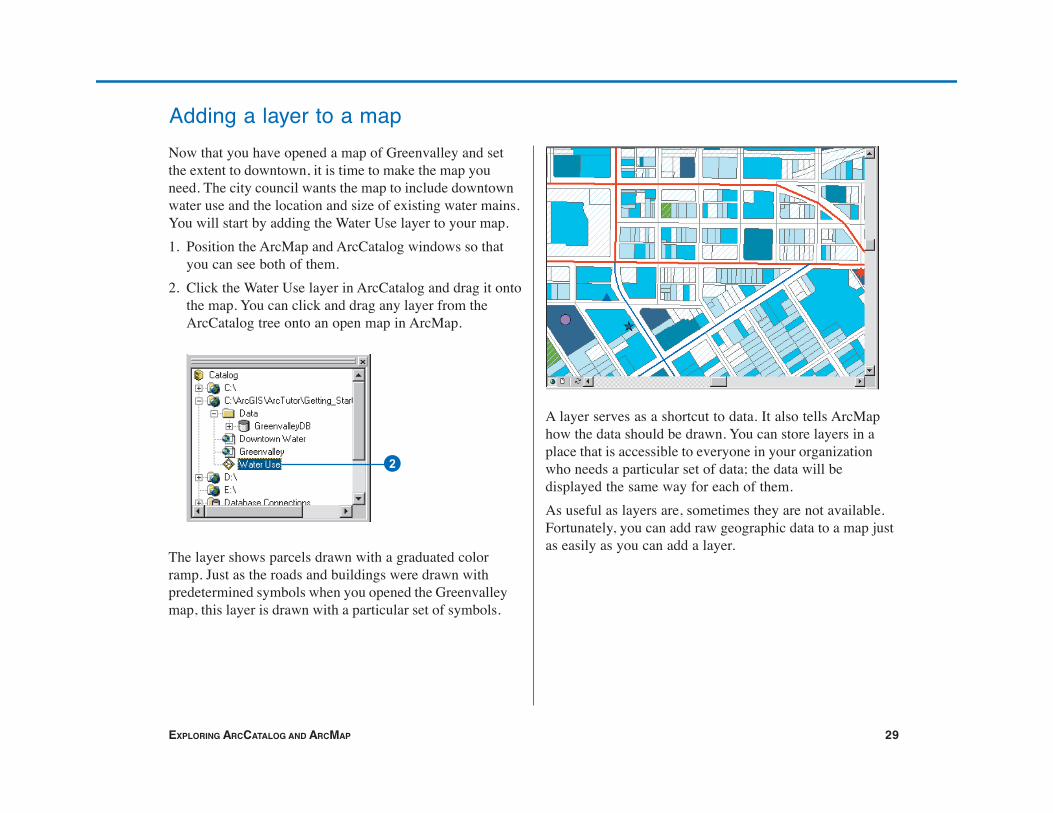
Adding a layer to a mapNow that you have opened a map of Greenvalley and setthe extent to downtown, it is time to make the map youneed. The city council wants the map to include downtownwater use and the location and size of existing water mains.You will start by adding the Water Use layer to your map.1. Position the ArcMap and ArcCatalog windows so that
you can see both of them.2. Click the Water Use layer in ArcCatalog and drag it onto
the map. You can click and drag any layer from theArcCatalog tree onto an open map in ArcMap.
The layer shows parcels drawn with a graduated colorramp. Just as the roads and buildings were drawn withpredetermined symbols when you opened the Greenvalleymap, this layer is drawn with a particular set of symbols.
2
A layer serves as a shortcut to data. It also tells ArcMaphow the data should be drawn. You can store layers in aplace that is accessible to everyone in your organizationwho needs a particular set of data; the data will bedisplayed the same way for each of them.As useful as layers are, sometimes they are not available.Fortunately, you can add raw geographic data to a map justas easily as you can add a layer.
Ch02.pmd 2/12/2004, 12:03 PM29
30 GETTING STARTED WITH ARCGIS
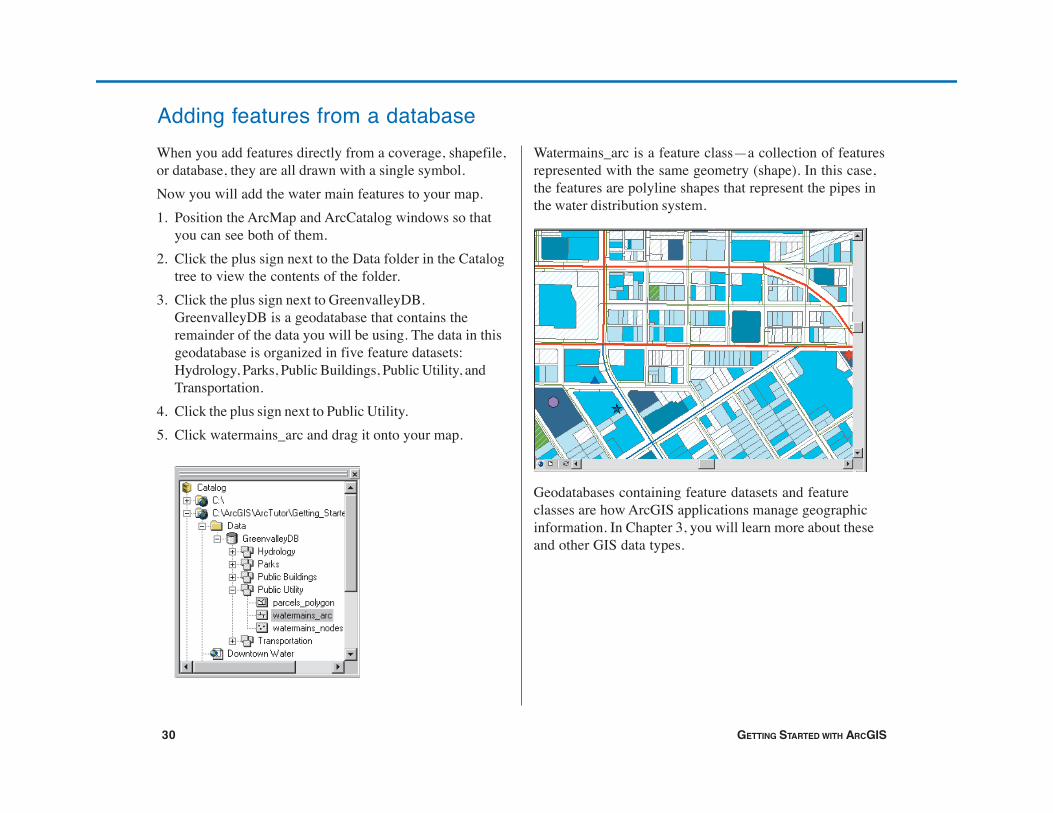
Adding features from a databaseWhen you add features directly from a coverage, shapefile,or database, they are all drawn with a single symbol.Now you will add the water main features to your map.1. Position the ArcMap and ArcCatalog windows so that
you can see both of them.2. Click the plus sign next to the Data folder in the Catalog
tree to view the contents of the folder.3. Click the plus sign next to GreenvalleyDB.
GreenvalleyDB is a geodatabase that contains theremainder of the data you will be using. The data in thisgeodatabase is organized in five feature datasets:Hydrology, Parks, Public Buildings, Public Utility, andTransportation.
4. Click the plus sign next to Public Utility.5. Click watermains_arc and drag it onto your map.
Watermains_arc is a feature class—a collection of featuresrepresented with the same geometry (shape). In this case,the features are polyline shapes that represent the pipes inthe water distribution system.
Geodatabases containing feature datasets and featureclasses are how ArcGIS applications manage geographicinformation. In Chapter 3, you will learn more about theseand other GIS data types.
Ch02.pmd 2/12/2004, 12:03 PM30
EXPLORING ARCCATALOG AND ARCMAP 31
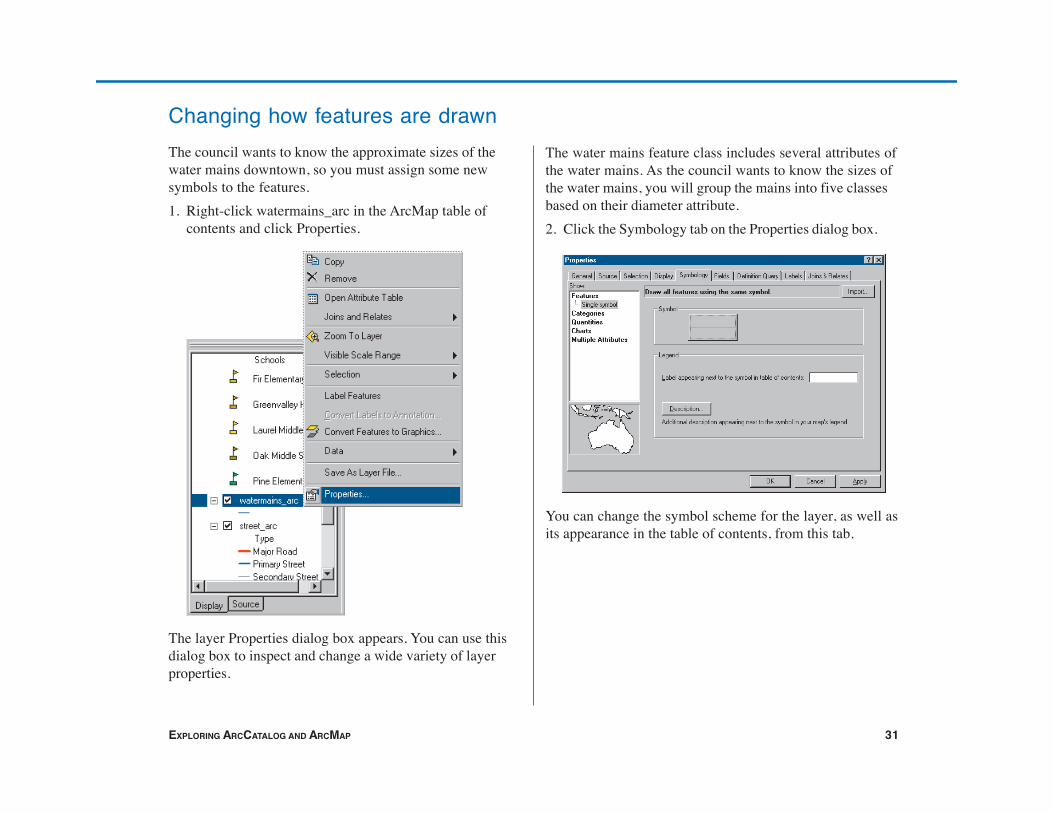
Changing how features are drawnThe council wants to know the approximate sizes of thewater mains downtown, so you must assign some newsymbols to the features.1. Right-click watermains_arc in the ArcMap table of
contents and click Properties.
The layer Properties dialog box appears. You can use thisdialog box to inspect and change a wide variety of layerproperties.
The water mains feature class includes several attributes ofthe water mains. As the council wants to know the sizes ofthe water mains, you will group the mains into five classesbased on their diameter attribute.2. Click the Symbology tab on the Properties dialog box.
You can change the symbol scheme for the layer, as well asits appearance in the table of contents, from this tab.
Ch02.pmd 2/12/2004, 12:03 PM31
32 GETTING STARTED WITH ARCGIS
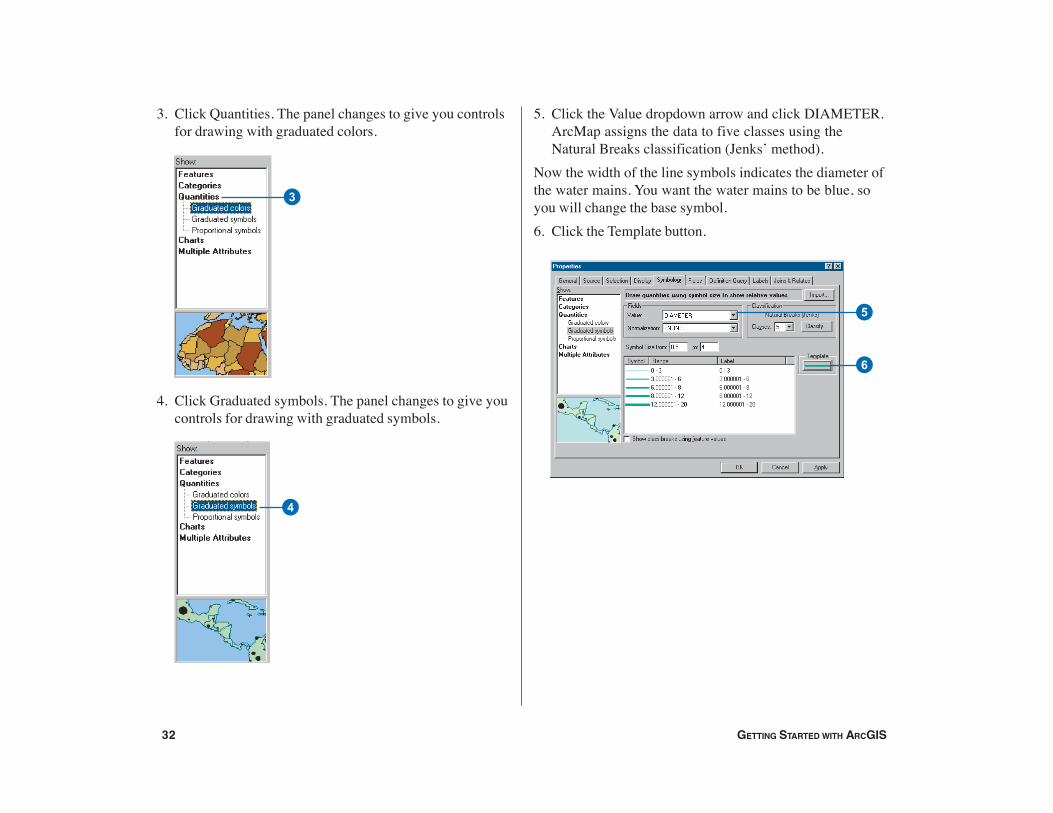
3. Click Quantities. The panel changes to give you controlsfor drawing with graduated colors.
4. Click Graduated symbols. The panel changes to give youcontrols for drawing with graduated symbols.
4
5. Click the Value dropdown arrow and click DIAMETER.ArcMap assigns the data to five classes using theNatural Breaks classification (Jenks’ method).
Now the width of the line symbols indicates the diameter ofthe water mains. You want the water mains to be blue, soyou will change the base symbol.6. Click the Template button.
3
5
6
Ch02.pmd 2/12/2004, 12:03 PM32
EXPLORING ARCCATALOG AND ARCMAP 33
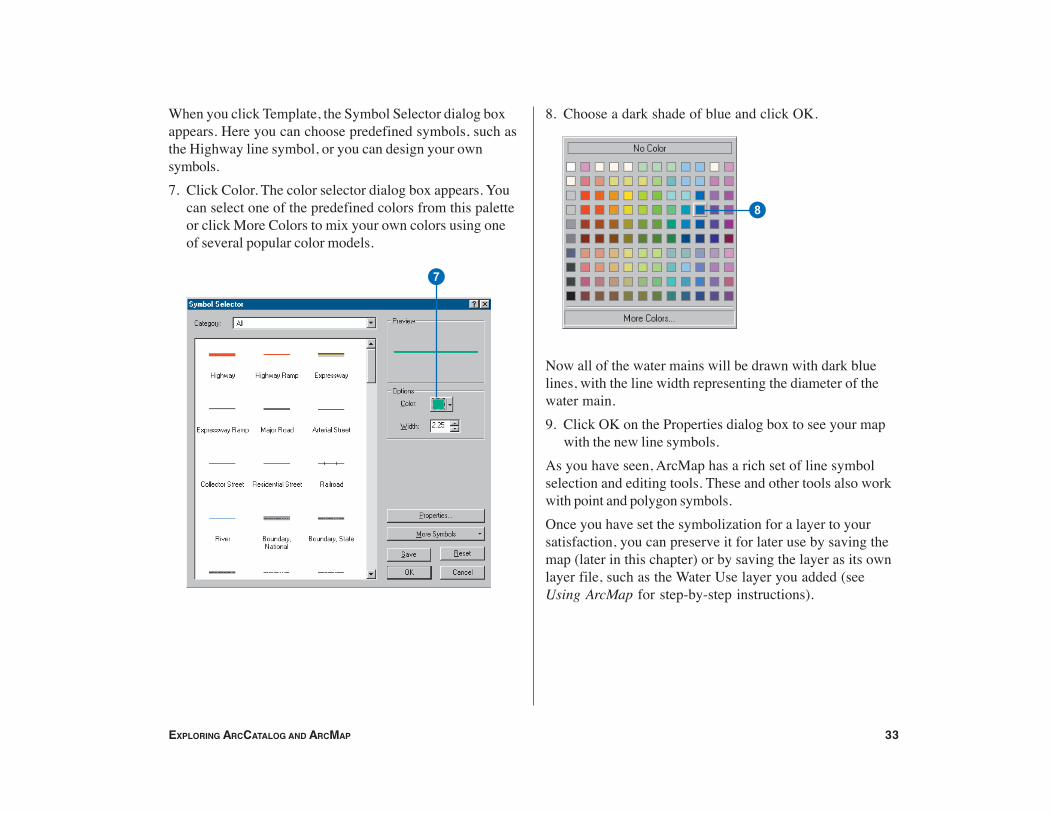
When you click Template, the Symbol Selector dialog boxappears. Here you can choose predefined symbols, such asthe Highway line symbol, or you can design your ownsymbols.7. Click Color. The color selector dialog box appears. You
can select one of the predefined colors from this paletteor click More Colors to mix your own colors using oneof several popular color models.
8
8. Choose a dark shade of blue and click OK.
Now all of the water mains will be drawn with dark bluelines, with the line width representing the diameter of thewater main.9. Click OK on the Properties dialog box to see your map
with the new line symbols.As you have seen, ArcMap has a rich set of line symbolselection and editing tools. These and other tools also workwith point and polygon symbols.Once you have set the symbolization for a layer to yoursatisfaction, you can preserve it for later use by saving themap (later in this chapter) or by saving the layer as its ownlayer file, such as the Water Use layer you added (seeUsing ArcMap for step-by-step instructions).
7
Ch02.pmd 2/12/2004, 12:03 PM33
34 GETTING STARTED WITH ARCGIS
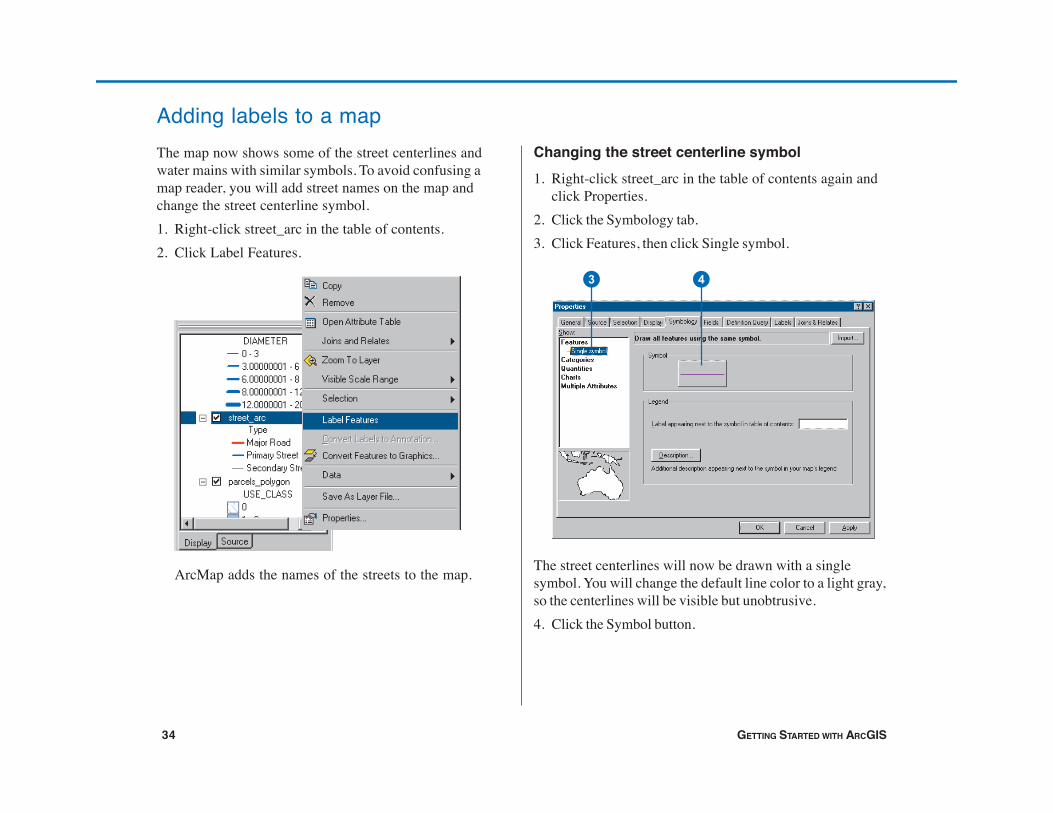
Adding labels to a mapThe map now shows some of the street centerlines andwater mains with similar symbols. To avoid confusing amap reader, you will add street names on the map andchange the street centerline symbol.1. Right-click street_arc in the table of contents.2. Click Label Features.
ArcMap adds the names of the streets to the map.
Changing the street centerline symbol1. Right-click street_arc in the table of contents again and
click Properties.2. Click the Symbology tab.3. Click Features, then click Single symbol.
The street centerlines will now be drawn with a singlesymbol. You will change the default line color to a light gray,so the centerlines will be visible but unobtrusive.4. Click the Symbol button.
3 4
Ch02.pmd 2/12/2004, 12:03 PM34
EXPLORING ARCCATALOG AND ARCMAP 35
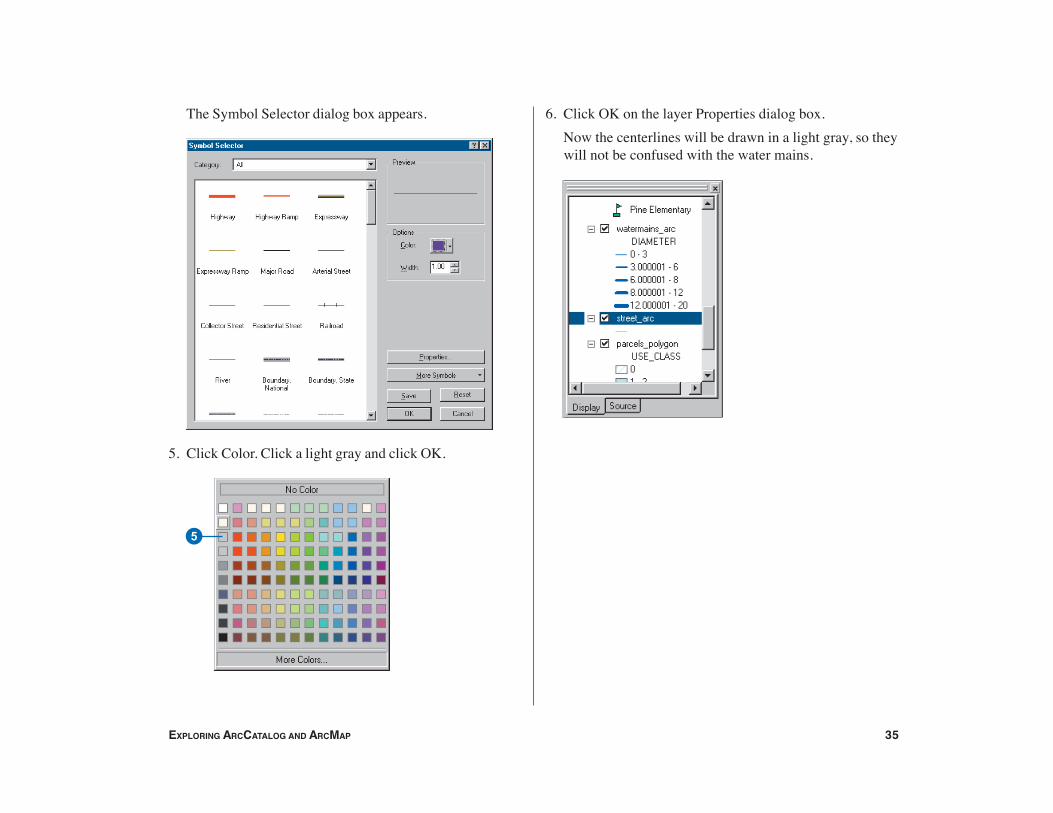
The Symbol Selector dialog box appears.
5. Click Color. Click a light gray and click OK.
6. Click OK on the layer Properties dialog box.Now the centerlines will be drawn in a light gray, so theywill not be confused with the water mains.
5
Ch02.pmd 2/12/2004, 12:03 PM35
36 GETTING STARTED WITH ARCGIS
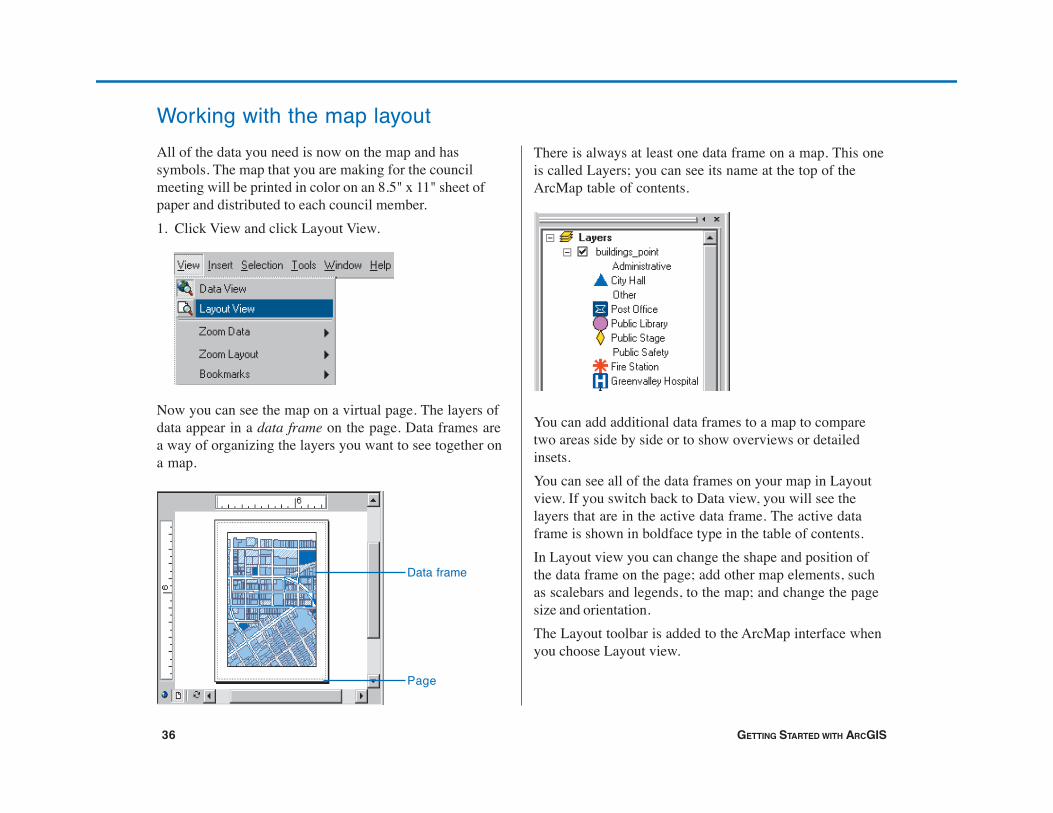
Working with the map layoutAll of the data you need is now on the map and hassymbols. The map that you are making for the councilmeeting will be printed in color on an 8.5" x 11" sheet ofpaper and distributed to each council member.1. Click View and click Layout View.
Now you can see the map on a virtual page. The layers ofdata appear in a data frame on the page. Data frames area way of organizing the layers you want to see together ona map.
There is always at least one data frame on a map. This oneis called Layers; you can see its name at the top of theArcMap table of contents.
You can add additional data frames to a map to comparetwo areas side by side or to show overviews or detailedinsets.You can see all of the data frames on your map in Layoutview. If you switch back to Data view, you will see thelayers that are in the active data frame. The active dataframe is shown in boldface type in the table of contents.In Layout view you can change the shape and position ofthe data frame on the page; add other map elements, suchas scalebars and legends, to the map; and change the pagesize and orientation.The Layout toolbar is added to the ArcMap interface whenyou choose Layout view.
Data frame
Page
Ch02.pmd 2/12/2004, 12:03 PM36
EXPLORING ARCCATALOG AND ARCMAP 37
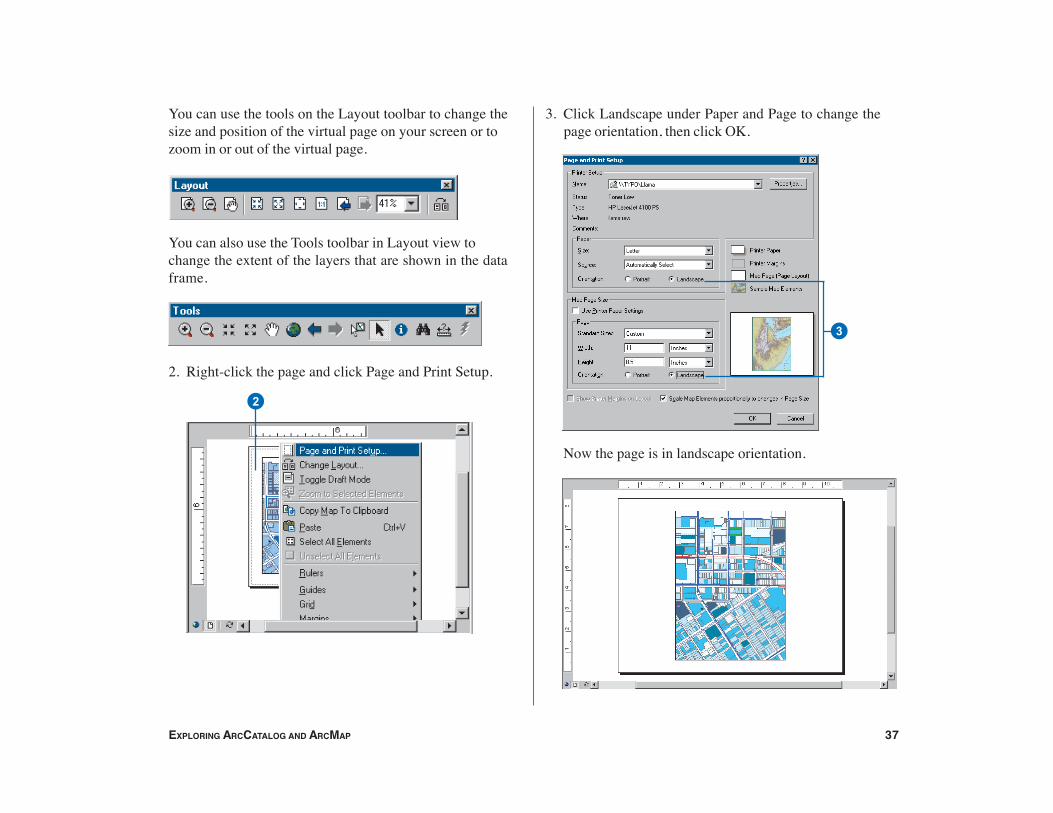
You can use the tools on the Layout toolbar to change thesize and position of the virtual page on your screen or tozoom in or out of the virtual page.
You can also use the Tools toolbar in Layout view tochange the extent of the layers that are shown in the dataframe.
2. Right-click the page and click Page and Print Setup.
3. Click Landscape under Paper and Page to change thepage orientation, then click OK.
Now the page is in landscape orientation.
3
2
Ch02.pmd 2/13/2004, 4:56 PM37
38 GETTING STARTED WITH ARCGIS
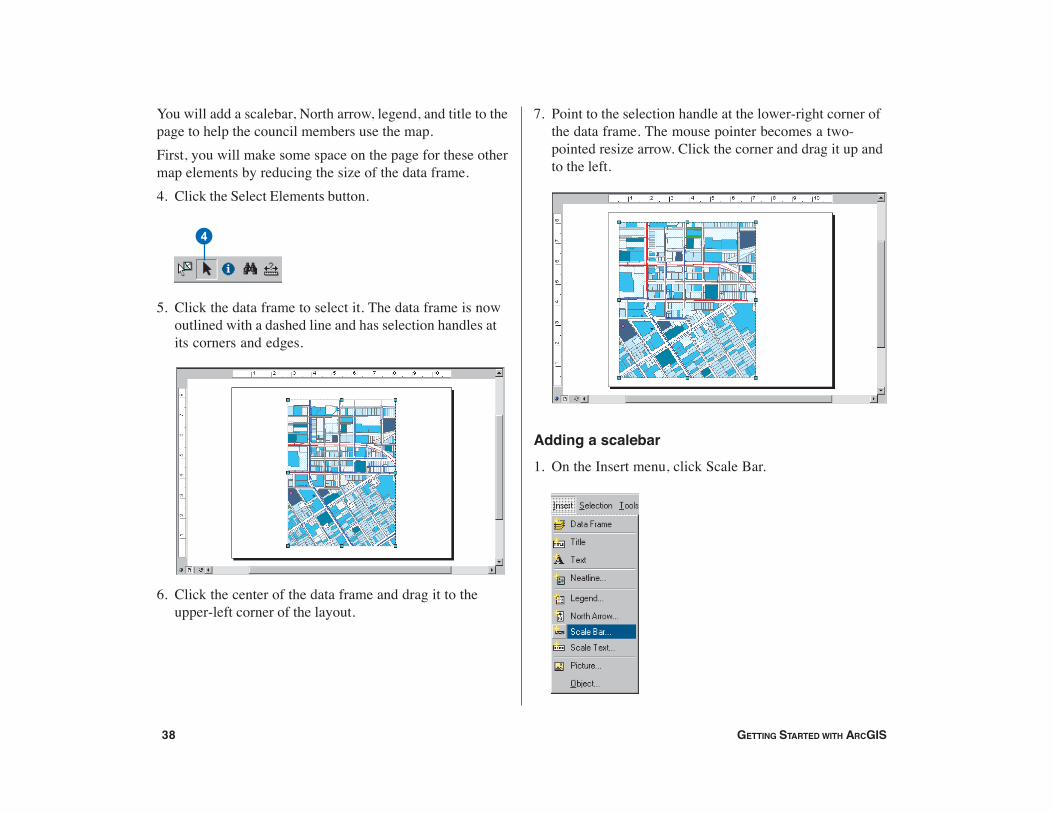
You will add a scalebar, North arrow, legend, and title to thepage to help the council members use the map.First, you will make some space on the page for these othermap elements by reducing the size of the data frame.4. Click the Select Elements button.
5. Click the data frame to select it. The data frame is nowoutlined with a dashed line and has selection handles atits corners and edges.
6. Click the center of the data frame and drag it to theupper-left corner of the layout.
7. Point to the selection handle at the lower-right corner ofthe data frame. The mouse pointer becomes a two-pointed resize arrow. Click the corner and drag it up andto the left.
Adding a scalebar1. On the Insert menu, click Scale Bar.
4
Ch02.pmd 2/12/2004, 12:03 PM38
Copyright © 2022 FDOKUMEN