Gestation Length, Mode of Delivery and Neonatal Line Thickness Variation
20
BioOne sees sustainable scholarly publishing as an inherently collaborative enterprise connecting authors, nonprofit publishers, academic institutions, research libraries, and research funders in the common goal of maximizing access to critical research. PersonIdentityServiceImpl Gestation Length, Mode of Delivery, and Neonatal Line-Thickness Variation Author(s) :Clément Zanolli, Luca Bondioli, Franz Manni, Paola Rossi, and Roberto Macchiarelli Source: Human Biology, 83(6):695-713. 2011. Published By: Wayne State University Press DOI: URL: http://www.bioone.org/doi/full/10.3378/027.083.0603 BioOne (www.bioone.org ) is a nonprofit, online aggregation of core research in the biological, ecological, and environmental sciences. BioOne provides a sustainable online platform for over 170 journals and books published by nonprofit societies, associations, museums, institutions, and presses. Your use of this PDF, the BioOne Web site, and all posted and associated content indicates your acceptance of BioOne’s Terms of Use, available at www.bioone.org/page/terms_of_use . Usage of BioOne content is strictly limited to personal, educational, and non-commercial use. Commercial inquiries or rights and permissions requests should be directed to the individual publisher as copyright holder.
-
Upload
univ-bordeaux -
Category
Documents
-
view
3 -
download
0
Transcript of Gestation Length, Mode of Delivery and Neonatal Line Thickness Variation
BioOne sees sustainable scholarly publishing as an inherently collaborative enterprise connecting authors,nonprofit publishers, academic institutions, research libraries, and research funders in the common goal ofmaximizing access to critical research.
PersonIdentityServiceImpl
Gestation Length, Mode of Delivery, and NeonatalLine-Thickness VariationAuthor(s) :Clément Zanolli, Luca Bondioli, Franz Manni, PaolaRossi, and Roberto MacchiarelliSource: Human Biology, 83(6):695-713. 2011.Published By: Wayne State University PressDOI:URL: http://www.bioone.org/doi/full/10.3378/027.083.0603
BioOne (www.bioone.org) is a nonprofit, online aggregation of coreresearch in the biological, ecological, and environmental sciences. BioOneprovides a sustainable online platform for over 170 journals and bookspublished by nonprofit societies, associations, museums, institutions, andpresses.
Your use of this PDF, the BioOne Web site, and all posted and associatedcontent indicates your acceptance of BioOne’s Terms of Use, available atwww.bioone.org/page/terms_of_use.
Usage of BioOne content is strictly limited to personal, educational, andnon-commercial use. Commercial inquiries or rights and permissionsrequests should be directed to the individual publisher as copyright holder.
Gestation Length, Mode of Delivery, and NeonatalLine-Thickness Variation
CLÉMENT ZANOLLI,1*LUCA BONDIOLI,2 FRANZ MANNI,3 PAOLA ROSSI,2
AND ROBERTO MACCHIARELLI1,4
Abstract The transition from an intra- to extra-uterine environment leaves itsmark in deciduous teeth (and first permanent molars) as an accentuated enamelincremental ring called the neonatal line (NL). This prominent microfeatureseparates the enamel formed during intrauterine life from that formed afterleaving the womb. However, while the physical structure of this scar is wellknown, the bases of its formation are still a matter of investigation. In particular,besides the influence of the birth-related abrupt environmental and dietarychanges and the role played by physiological factors such as hypocalcaemia, adirect relationship between NL thickness variation and the physical was traumaimplied by the birth dynamics, the Caesarean, and the operative modes areapparently associated with the thinnest and the thickest lines, respectively.
By using the histological record from a deciduous dental sample(exfoliated crowns) of 100 modern healthy school-aged children (47 malesand 53 females) of reported birth histories (normal delivery mode: 55 cases;Caesarean: 40; operative: 5), we investigated the relationships between birthdynamics and NL thickness variation. The Tukey Honest SignificantDifference method was used to test the differences between the means of thegrouping levels.
The results of our histo-morphological investigation do not support thesuggestion that Caesarean-born children display, on average, a thinnerenamel scar compared to children associated to a normal delivery mode.Rather, our study points to the influence exerted by factors intimately relatedto gestational length variation on the degree of expression of the line.
The birth process leaves its mark on dental enamel in the form of a ring, anaccentuated incremental line called the “Neonatal Line” (NL) (Rushton 1933;Schour 1936). This prominent microfeature, occasionally visible also in the
1Departement de Prehistoire, UMR 7194 CNRS, Museum National d’Histoire Naturelle, 75,005 Paris, France.2Sezione di Antropologia, Museo Nazionale Preistorico Etnografico “L. Pigorini,” 00,144 Rome, Italy.3Departement Hommes, natures, societes, UMR 7206 CNRS, Museum National d’Histoire Naturelle,
75,005 Paris, France.4Departement Geosciences, Universite de Poitiers, 86,000 Poitiers, France.*Correspondence to: Clement Zanolli, Departement de Prehistoire, UMR 7194 CNRS, Museum National
d’Histoire Naturelle, 75,005 Paris, France. E-mail: [email protected].
Human Biology, December 2011, v. 83, no. 6, pp. 695–713.Copyright © 2011 Wayne State University Press, Detroit, Michigan 48201-1309
KEY WORDS: HUMAN BIRTH, DELIVERY MODE, GESTATION LENGTH, DECIDUOUS
TEETH, DENTAL ENAMEL STRUCTURE, INCREMENTAL MARKERS, NEONATAL LINE.
dentine (Schour 1936; Skinner 1992), separates the enamel formed duringintrauterine life from that formed after leaving the womb. In modern humans,the NL is usually present in all crowns forming at birth, that is, all theelements of the primary dentition and the first permanent molars (mesiobuc-cal cusp) (Christensen and Kraus 1965, Deutsch and Pe’er 1982; Deutsch etal. 1985; Kraus 1959; Levine et al. 1979). Occasionally, a macroscopichypoplasia is detected in correspondence with the NL, but it is usually wornaway (Massler et al. 1941; Moss-Salentijn and Hendricks-Klyvert 1985;Schroeder 1991; Skinner 1992).
At birth, the enamel is only partially mineralized and continues to increasein thickness by apposition of additional centripetal layers secreted by theameloblasts at the level of the enamel-dentine junction (EDJ) to a circadianrhythm of 4—5 �m in extant humans (Antoine et al. 2009; Shellis 1984), whilein extant great apes and early fossil hominins this rhythm accelerates rapidly(Dean 2006, 2010; Dean et al. 2001; Lacruz et al. 2008). The circadian growthprocess produces a repetitive microstructural pattern of the enamel, calledprismatic cross-striations (short-period lines). In longitudinal crown sections(physical or virtual at high resolution), it is possible to identify another enamelstriation mode linked to the crown formation, but with a longer periodicity (onaverage, seven days), parallel to the EDJ and crossing the prism decussation,called Retzius lines, which terminate on the tooth surface as perikymata (Boyde1989; Guatelli-Steinberg 2009; Hillson 1996; Simmer et al. 2010). Eachperturbation in “normal” development exceeding a critical individual thresholdremains imprinted in the enamel as a larger stria of Retzius, called Wilson band(Hillson 1996; Risnes 2001; Rossi et al. 1999). This accentuated line correspondsto the position of the developing enamel (or dentine) front that relates to astressor experienced during tooth development, as opposed to an intrinsic rhythm(Smith et al. 2010a). Marking the transition from an intra- to extra-uterineenvironment, the NL can be recorded as the first accentuated enamel microstruc-ture (Gustafson and Gustafson 1967; Risnes 2001).
This scar can be distinctly recognized because of the differences in qualitybetween pre- and postnatal enamel (Humphrey et al. 2007; Kodaka et al. 1996;Thomas and Lee 2003; Wilson and Beynon 1989), as well as due to itscharacteristic location, specific for each tooth class (Rossi et al. 1999; Skinner1992; Skinner and Dupras 1993). The NL, whose variable thickness in humansmay reach or even exceed 30 �m (Rossi et al. 1999; Schour 1936; Weber andEisenmann 1971), is distinguishable from a Wilson band because it is moreprominent and displays a more clearly discernible prism disturbance (Kodaka etal. 1996; Rushton 1939; Skinner 1992; Skinner and Dupras 1993; Thomas andLee 2003; Wilson and Beynon 1989). High-resolution histological investigationsreveal that it corresponds to an abrupt change in prism orientation and tostructural changes within each prism (Mishra et al. 2009; Weber and Eisenmann1971; Whittaker and Richards 1978; Wilson and Shroff 1970).
696 / ZANOLLI ET AL.

Regarding its topographic position, which is affected by the gestationlength (Kronfeld and Schour 1939; Skinner 1992; Skinner and Dupras 1993), inincisors the NL usually extends from the cervical third of the EDJ toward theenamel surface, leaving only a small portion of postnatally formed enamel, whilein canines and molars it is located more toward the incisal/occlusal part of theenamel, with only a small portion of prenatally formed enamel present (Rossi etal. 1999; Rushton 1939; Schour 1936; Teivens et al. 1996).
Besides human and nonhuman primates, such as the chimpanzee (Smith etal. 2010b) and the macaque (Bowman 1991; Smith 2004), for example, the NLis reported in different terrestrial, semi-aquatic, and also exclusive marinemammals, including the sika deer (Cervus nippon; Iinuma et al. 2004), theelephant seal (Mirounga leonina; Laws 1952) and the ringed seal (Phocahispida; Stewart et al. 1998), the bottlenose dolphin (Tursiops sp.; Perrin et al.2008), the harbour porpoise (Phocoena phocoena; Perrin et al. 2008), the spermwhale (Physeter macrocephalus; Hillson 2005).
This marker is routinely used in forensic investigations (e.g., Gustafson1966; Skinner and Dupras 1993; Stavrianos et al. 2010; Whittaker and Richards1978), and its presence/absence, position and variation patterns are also increas-ingly considered in studies on population samples from archaeological sites (e.g.,Alexandersen et al. 1998; Antoine et al. 2009; Bondioli and Macchiarelli 1999;FitzGerald and Saunders 2005; FitzGerald et al. 1999, 2006; Macchiarelli andBondioli 2000; Macchiarelli et al. 2006a; Rossi et al. 1997, 1999; Schwartz et al.2010; Smith and Avishai 2005; Smith et al. 2011). However, likely because ofmethodological constraints related to the only recent availability of noninvasivehigh-resolution investigative methods in paleobiology (e.g., Macchiarelli et al.2004, 2008; Mazurier et al. 2006; Smith and Tafforeau 2008; Tafforeau 2004;Tafforeau et al. 2006;), its use in the study of the human fossil record is still verylimited (e.g., Macchiarelli et al. 2006b; Smith and Tafforeau 2008; Smith et al.2010a; Tafforeau and Smith 2008; Zanolli et al. 2011).
While the physical structure of the NL is now well-known (rev. in Simmeret al. 2010), the bases of its formation are not yet fully understood and, as rightlypointed out by Smith (2004), “The study of the NL will benefit from additionallongitudinal studies of individuals with known records of birth, illness, stress, lifehistory events, and environmental factors” (Smith 2004: 77).
Goals of the Study. The NL formation was at first assumed to directly resultfrom the birth-related abrupt environmental and dietary changes (e.g., Massler etal. 1941). Bouyssou and co-workers (1958, cit. by Wilson and Shroff 1970) wereprobably the first to hypothesize that also some systemic influences could affectits appearance, even if the first studies did not produce evidence of a clearrelationship between NL width and accentuated enamel lines related to systemicperinatal disturbances (Godt 1963; Wilson and Shroff 1970). Later on, the roleplayed by some physiological parameters, notably by the decrease in plasmacalcium occurring during the first 48 to 72 hr after birth (hypocalcaemia), was
Neonatal Line-Thickness Variation / 697
taken into account (Noren 1983, 1984; Ranggard et al. 1994; Seow 1986). Infacts, infants born from diabetic mothers prone to hypocalcaemia show thickerand less mineralized NLs compared to those from healthy mothers (Noren 1984).
A relationship between NL thickness variation and the physical traumaimplied by the birth dynamics was suggested by Gustafson and Gustafson (1967).Eli and co-authors (1989) investigated the relationships between the method ofdelivery and NL thickness in a sample of 147 children of known birth history.Their results showed that: (1) operative deliveries (17 cases) were associatedwith wider lines (13–24 �m); (2) normal deliveries (125 cases) resulted inintermediate thickness values (7–17 �m); and (3) Caesarean sections (5 cases)resulted in thinner lines (6–9 �m). Even if the last category was the leastrepresented in their investigated sample, in principle these results support theconclusion that, in addition to the physiological drop in blood-serum calcium,both environmental changes and the birth process itself significantly contribute tothe growth disruption responsible for the formation of the NL (Eli et al. 1989).
By using a series of enamel histological sections from a representativedeciduous dental sample of modern healthy school-aged children of reportedbirth histories, here we investigate the relationships between gestation length,delivery mode, and NL thickness variation. More specifically, because of thecomposition and characteristics of the available sample, we test the hypothesisthat, on average, Caesarean sections result in thinner scars.
Materials and Methods
The Fatina Sample. The histological dental sample used in this study consistsof 100 deciduous crown sections representing as many individuals of both sexes(47 males, 53 females) selected from the so-called Fatina (“tooth fairy”) modernhuman reference collection. Fatina includes a whole of 250 exfoliated primaryteeth from 225 healthy children, most of European (Italian) origin, aged 6–10yrs, sampled in 1996–1997 in four primary schools of Rome (“Agatarco,” “C.Corradi,” “C. Forlanini,” “Pirgotele”). The realization of this collection wasconceived and set by the Section of Anthropology of the National PrehistoricEthnographic “L. Pigorini” Museum, Rome, with the specific aim to create amodern reference record based on controlled and standardized histologicalsections to be used in paleobiological studies dealing with tooth microstructuralgrowth markers and infant health assessment (e.g., Antoine et al. 2009; Dean2006; FitzGerald and Rose 2000; FitzGerald et al. 1999, 2006; Geusa et al. 1999;Goodman and Rose 1990; Levine et al. 1979; Rose 1979; Rose et al. 1978; Rossiet al. 1999; Shellis 1984).
In agreement with the school authorities, on a voluntary basis, the parentsof the children available to provide for invasive analysis at least one exfoliatedtooth from their primary dentition were requested to fill out an anonymousinformation form about the original “owner” of the specimen and his/her mother.In the forms, basic questions concerned: sex, gestational age, delivery mode,weight and length at birth, health problems occurred during pregnancy and/or
698 / ZANOLLI ET AL.
along the first six months after birth, lactation, and weaning time. Following apreliminary gross screening for the preservation quality of the collected speci-mens (consisting at least of the entire crown, even if partially worn), only aportion of the original sample was subsequently considered for histologicalanalysis. However, even in this selected sample currently forming the Fatinacollection, not all the tooth sections are systematically accompanied by anexhaustive individual information record. Besides few exceptions where confi-dentiality was not requested by the interviewed parents, of course in no case aquality control on the reliability of the data accompanying the collectedspecimens was possible. In a limited number of cases, more than one tooth (from2 to a maximum of 13 specimens) is available from a single individual.
Sectioning Procedures. The sectioning of the Fatina sample followed theconventional procedures for dental thin-section preparation extensively detailed inCaropreso et al. (2000), FitzGerald and Saunders (2005), FitzGerald et al. (1999,2006), and Rossi et al. (1997, 1999). At least two longitudinal sections, approxi-mately 70–150 �m thick, passing through the buccolingual (labiolingual) plane andcutting the tip of the dentin horn (for the molars, that of at least one mesial cusp) weretaken from the midsection of each crown preliminarily embedded in an epoxy resinblock using a diamond blade microtome (Leica 1600, Leica AG). As noted byAntoine et al. (2009: 46), the exact section plane varies between tooth types; it isstrictly a radial plane in incisors and canines, while in molars it does not include theaxis of rotation of the tooth but is a tangential section centered through the tips ofboth the buccal and lingual cusps and the underlying dentine horns.
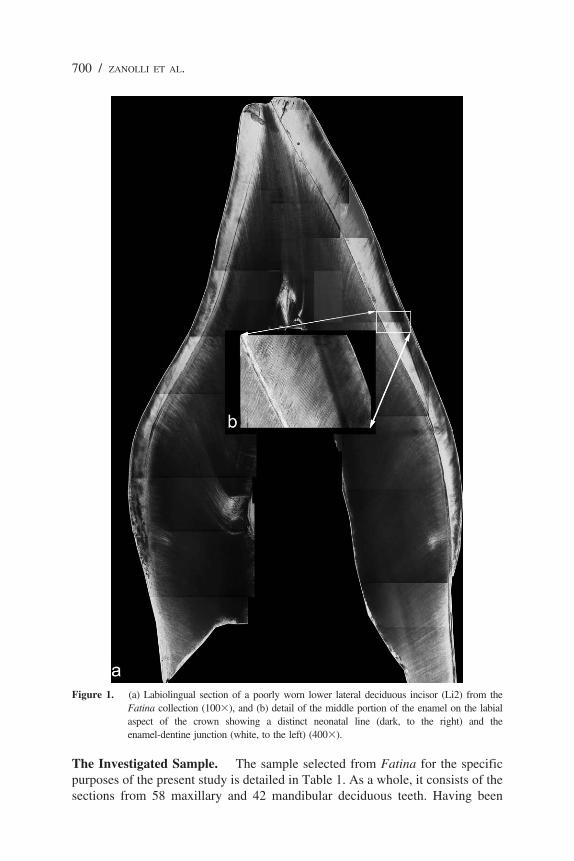
Digital Image Processing. To evaluate the general quality of the enamelmicrofeatures and the presence and position of the NL on both buccal (labial) andlingual crown aspects, each section was first scrutinized under polarized light at100� (Figure 1a), and then the NL was observed at a higher magnification (400�)(Figure 1b). While many teeth had two or more sections cut from them, only oneslide from each tooth showing the best discernibility of the NL was selected foranalysis. Images at 100� and 400� were captured with a high-resolution digitalcamera (Polaroid Digital Microscope Camera, DMC 1) attached to an opticaltransmitted light microscope (Laborlux S, Leica AG) and exported into AdobePhotoshop, which was used to assemble montages of relevant areas of tooth sectionsfrom adjacent images. Contrast enhancement convolution filters (3�3 and 5�5kernels) achieved sharper detail, and a change in the look-up table function increasedsite-specific contrasts of intensity profiles (Rossi et al. 1999; Schwartz et al. 2010).Depending on individual tooth size, each cross-section was reconstructed in a digitalphotomosaic of 10 or so (up to 15) partial images. Spatial resolution is 0.971�m/pixel for the images captured at 100� and 0.241 �m/pixel for the digital recordat 400�.
The ImageJ 1.43 (National Institutes of Health, USA) software was usedfor digital image processing and measurements.
Neonatal Line-Thickness Variation / 699
The Investigated Sample. The sample selected from Fatina for the specificpurposes of the present study is detailed in Table 1. As a whole, it consists of thesections from 58 maxillary and 42 mandibular deciduous teeth. Having been
Figure 1. (a) Labiolingual section of a poorly worn lower lateral deciduous incisor (Li2) from theFatina collection (100�), and (b) detail of the middle portion of the enamel on the labialaspect of the crown showing a distinct neonatal line (dark, to the right) and theenamel-dentine junction (white, to the left) (400�).
700 / ZANOLLI ET AL.
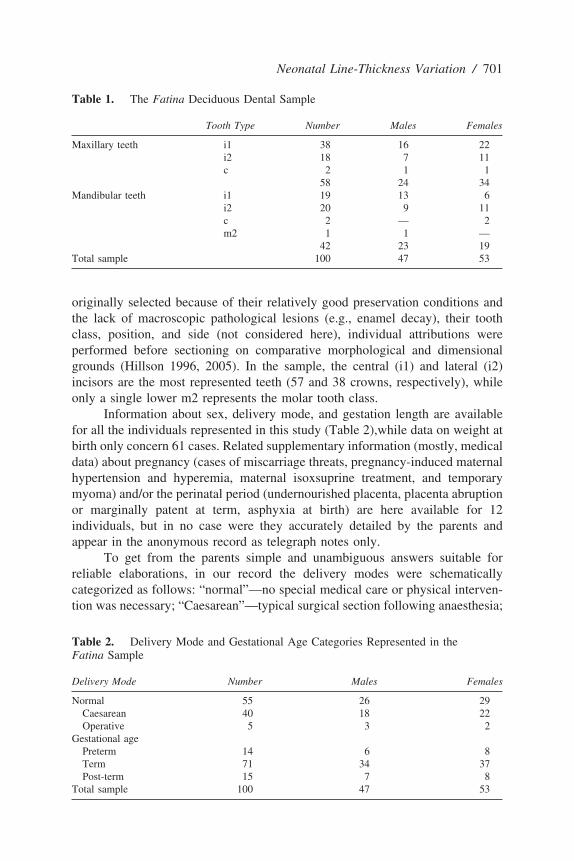
originally selected because of their relatively good preservation conditions andthe lack of macroscopic pathological lesions (e.g., enamel decay), their toothclass, position, and side (not considered here), individual attributions wereperformed before sectioning on comparative morphological and dimensionalgrounds (Hillson 1996, 2005). In the sample, the central (i1) and lateral (i2)incisors are the most represented teeth (57 and 38 crowns, respectively), whileonly a single lower m2 represents the molar tooth class.
Information about sex, delivery mode, and gestation length are availablefor all the individuals represented in this study (Table 2),while data on weight atbirth only concern 61 cases. Related supplementary information (mostly, medicaldata) about pregnancy (cases of miscarriage threats, pregnancy-induced maternalhypertension and hyperemia, maternal isoxsuprine treatment, and temporarymyoma) and/or the perinatal period (undernourished placenta, placenta abruptionor marginally patent at term, asphyxia at birth) are here available for 12individuals, but in no case were they accurately detailed by the parents andappear in the anonymous record as telegraph notes only.
To get from the parents simple and unambiguous answers suitable forreliable elaborations, in our record the delivery modes were schematicallycategorized as follows: “normal”—no special medical care or physical interven-tion was necessary; “Caesarean”—typical surgical section following anaesthesia;
Table 1. The Fatina Deciduous Dental Sample
Tooth Type Number Males Females
Maxillary teeth i1 38 16 22i2 18 7 11c 2 1 1
58 24 34Mandibular teeth i1 19 13 6
i2 20 9 11c 2 — 2m2 1 1 —
42 23 19Total sample 100 47 53
Table 2. Delivery Mode and Gestational Age Categories Represented in theFatina Sample
Delivery Mode Number Males Females
Normal 55 26 29Caesarean 40 18 22Operative 5 3 2
Gestational agePreterm 14 6 8Term 71 34 37Post-term 15 7 8
Total sample 100 47 53
Neonatal Line-Thickness Variation / 701

“operative”—some kind of active outside intervention had taken place (e.g.,breech, forceps, or vacuum delivery) because of labor complications (malpre-sentation, failure of descent of the fetal head through the pelvic brim or theinterspinous diameter, poor uterine contraction strength, active phase arrest,cephalic-pelvic disproportions, shoulder dystocia, etc.). In this respect, thepresent sample mostly represents normal55 and Caesarean40 deliveries, whilecomplicated deliveries apparently occurred in 5 cases only (Table 2).
With reference to the gestational age, the deliveries were categorized hasfollows: at “term”—occurred within 37–41 wk after fertilization; “preterm”—before the beginning of the 37th week; and “post-term”—over the beginning ofthe 42th week. In our sample, the first category is largely the most represented(71 cases), while the remaining cases are almost equally distributed betweenpreterm14 and post-term15 deliveries (Table 2).
A synthetic picture of the investigated sample in terms of sex, deliverymode, and gestational-age representativeness is provided by the mosaic plotshown in Figure 2. A mosaic plot is basically an area-proportional visualizationof observed frequencies, composed of tiles (corresponding to the cells) created byrecursive vertical and horizontal splits of a rectangle. Thus, the area of each tilein Figure 2 is proportional to the corresponding cell entry given the dimensionsof previous splits (Friendly 1994).
Neonatal Line Thickness. The NL is an optical phenomenon due to alterationsin height and degree of mineralization of the enamel prisms (Sabel et al. 2008). In allcases used in the present work, its identification and outline assessment at 100� wasunambiguous, as this scar clearly divides the smooth course of prenatal enamelmatrix formation from the “normal” structure of postnatal enamel matrix (Antoine etal. 2009; FitzGerald et al. 2006; Kodaka et al. 1996; Mishra et al. 2009; Risnes 2001;Rossi et al. 1999; Rushton 1939; Sabel et al. 2008; Schour 1936; Schour and Massler1937; Skinner 1992; Skinner and Dupras 1993; Szpringer-Nodzak 1984; Weber andEinsenmann 1971; Whittaker and Richards 1978). To measure the NL width, threeimages were originally taken at 400� in three different positions, preferably alongthe buccal (labial) aspect: (1) close to the EDJ; (2) in the middle of the dental crown;and (3) close to the apex. After having carefully marked the outline of the NL on thedigital photomontages, at least six measurements were realized at each spot by twoto three independent expert observers, and the site-specific average thickness valuecalculated. However, as the enamel secretion rate slightly varies depending on crowntopography (Birch and Dean 2009; Mahoney 2008), here we specifically used themean estimates pertaining only to the middle portions (Figure 1b). Following aquantitatively significant experience developed in the NL assessment on recent andarchaeological samples and the realization of repeated tests for intra- and interob-server concordance in analyzing the histomorphometric dental record (e.g., FitzGer-ald et al. 2006; Macchiarelli and Bondioli 2000; Rossi et al. 1999; Schwartz et al.2010), in none among the 100 thin sections used here did the discrepancy among therepeated measures exceed 6%.
702 / ZANOLLI ET AL.

Statistical Analyses. To compare the NL width and the weight at birth meansamong the groups defined by the delivery mode, the sex, and the gestation length,we used the analysis of variance with an incomplete model with three factors(sex, delivery mode, and gestation length) and two interactions (sex by gestationlength and sex by delivery mode). The Tukey Honest Significant Difference(HSD) method was used to test the differences between the means of thegrouping levels. We used this method because, when comparing the means forthe levels of a factor in an analysis of variance, a simple comparison using ttestswould inflate the probability of declaring a significant difference when it is notin fact present (Yandell 1997).
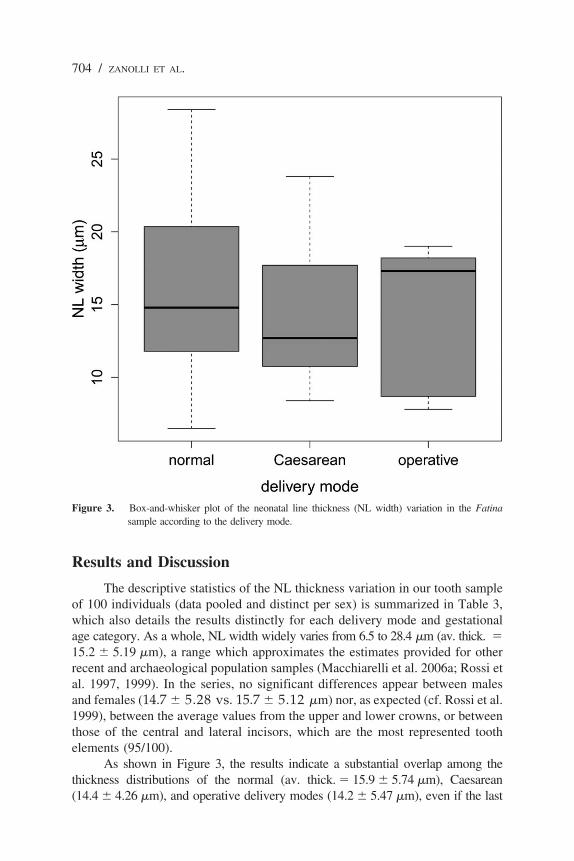
Statistical analyses and graphs were realized with the R v.2.13.1 language(R Development Core Team 2011), with the support of the package vcd (Meyeret al. 2006). The box-and-whisker plots in Figures 3, 4, and 5 systematicallyshow (from bottom to top): the minimum value, the 1st quartile, the median, the3rd quartile, and the maximum value recorded in our series of observations.
Figure 2. Mosaic plot describing the composition of the investigated deciduous dental sample from theFatina collection in terms of sex, delivery mode (normal, Caesarean, operative), andgestational age representativeness (preterm, term, and post-term). m: males; f: females.
Neonatal Line-Thickness Variation / 703
Results and Discussion
The descriptive statistics of the NL thickness variation in our tooth sampleof 100 individuals (data pooled and distinct per sex) is summarized in Table 3,which also details the results distinctly for each delivery mode and gestationalage category. As a whole, NL width widely varies from 6.5 to 28.4 �m (av. thick. �15.2 � 5.19 �m), a range which approximates the estimates provided for otherrecent and archaeological population samples (Macchiarelli et al. 2006a; Rossi etal. 1997, 1999). In the series, no significant differences appear between malesand females (14.7 � 5.28 vs. 15.7 � 5.12 �m) nor, as expected (cf. Rossi et al.1999), between the average values from the upper and lower crowns, or betweenthose of the central and lateral incisors, which are the most represented toothelements (95/100).
As shown in Figure 3, the results indicate a substantial overlap among thethickness distributions of the normal (av. thick. � 15.9 � 5.74 �m), Caesarean(14.4 � 4.26 �m), and operative delivery modes (14.2 � 5.47 �m), even if the last
Figure 3. Box-and-whisker plot of the neonatal line thickness (NL width) variation in the Fatinasample according to the delivery mode.
704 / ZANOLLI ET AL.

category is only represented by 5/100 cases (Table 3). In this regard, noteably,according to our record, the individuals showing a NL width �24 �m (7 cases, 3males/4 females) were apparently all born without active external intervention(“normal” delivery). However, two among them, a preterm and a post-term child,correspond to a case of asphyxia at birth and of marginally patent placenta,respectively. Among the 11 cases of minimal (�9 �m) NL thickness measured inour series (7 m/4 f), none being associated to a particular condition or medical recordavailable to us, all three delivery categories are represented (6 normal, 2 Caesarean,2 operative).
The results illustrated above differ from the analytical figures reported byEli et al. (1989) in their study of a similar sample of school-aged children, wherea distinct trend of relative NL thickness increase was found from the categoryelective Caesarean sections (6–9 �m vs. 8.4–23.8 �m in Fatina) to thatoperative (13–24 �m vs. 7.8–19.0 �m) through the normal delivery pattern(7–17 �m vs. 6.5–28.4 �m). One reason for these differences likely relates to theheterogeneous proportions of delivery modes represented in the two samples. In
Figure 4. Box-and-whisker plot of the neonatal line thickness (NL width) variation in the Fatinasample according to the gestational age.
Neonatal Line-Thickness Variation / 705

fact, while in Fatina the normal and the Caesarean are the most representedmodes (55 and 40 individuals, respectively), the sample examined by Eli andco-workers (1989) mostly includes normal125 and operative17 cases. In otherwords, while our results clearly do not support the existence of a statisticallysignificant difference in NL width between children born “normally” and thosehaving left the uterus following a typical Caesarean intervention, the poorrepresentativeness in our Fatina’s subsample of the operative category (5 cases)does not legitimate any conclusion on a comparative basis. In our view, the sameshould be the case for the sample of 5 teeth representing the category “electiveCaesarean sections” measured by Eli et al. (1989). However, we should alsoevoke the different nature of the two original records among the additionalfactors potentially responsible for such discrepancies. In fact, while in Eli andco-workers (1989) all technical and medical information details about the birthhistories, including type of delivery and the condition of the newborn, wereobtained from hospitals, in Fatina they are from parental sources, which makesproblematic a direct comparison of the two records, notably in the cases of
Figure 5. Box-and-whisker plot of the weight variation at birth in the Fatina sample according to thegestational age.
706 / ZANOLLI ET AL.

“normal” and “complicated” (operative) deliveries. Additionally, no systematicinformation is available in Fatina about the causal factors related to theCaesarean surgical sections.
Differently from the picture offered by the delivery pattern, in the Fatina seriessome difference in NL thickness emerges when gestational weeks are considered(Figure 4, Table 3). In particular, here the estimates for the preterm-born children (av.thick. � 18.5 � 4.78 �m) clearly exceed those associated to both term(14.5 � 4.78 �m) and post-term (15.8 � 6.45 �m) subsamples. In this case, however,only one preterm individual is included among those showing an NL width �24 �m (thealready mentioned case of asphyxia at birth), while none is found among the 11 cases ofminimal (�9 �m) NL thickness. So, in our investigated sample, gestational ageapparently more strictly relates to NL width than delivery modalities.
The results of the analysis of variance of the NL thickness variationglobally run with respect to the sex, delivery mode, and gestational age factors(Table 4) show a statistically significant contrast (P � 0.03) for this lattervariable only (pooled sexes). More precisely, as revealed by the Tukey HSDmethod used to test the differences between the means of the grouping levels, astatistically significant difference exists between the average values of thepreterm and term male subsamples (Table 5). Accordingly, preterm-bornchildren, notably of male sex, tend to have a thicker enamel NL, independentlyfrom their experienced delivery dynamics. However, the sample size of our
Table 3. Neonatal Line Thickness (width) Variation (in �m) in the Fatina Sample
Number Mean SD Min. Max.
Total sample 100 15.2 5.19 6.5 28.4Males 47 14.7 5.28 6.5 28.4Females 53 15.7 5.12 7.8 26.8
Delivery modeNormal 55 15.9 5.74 6.5 28.4Males 26 15.3 5.80 6.5 28.4Females 29 16.5 5.71 7.8 26.8
Caesarean 40 14.4 4.26 8.4 23.8Males 18 14.5 4.42 8.4 23.8Females 22 14.4 4.24 9.0 21.6
Operative 5 14.2 5.47 7.8 19.0Males 3 11.6 — 7.8 18.2Females 2 18.2 — 17.3 19.0
Gestational agePreterm 14 18.5 4.78 11.9 28.4Males 6 20.0 5.72 13.1 28.4Females 8 17.3 3.92 11.9 22.4
Term 71 14.5 4.78 6.5 26.8Males 34 13.4 4.53 6.5 24.3Females 37 15.5 4.86 8.3 26.8
Post-term 15 15.8 6.45 7.8 26.6Males 7 16.4 5.71 8.4 26.6Females 8 15.2 7.38 7.8 24.8
Neonatal Line-Thickness Variation / 707

currently available preterm subsample (14 cases, 6 m/8 f) does not allow for anyreliable conclusion about a possible sex-related influence of the number ofgestational weeks on NL thickness, a subject which certainly deserves additionalinvestigations.
While in this study we did not use scanning electron microscopy to detailvariations in porosity between pre- and postnatal enamel or prism disruption patterns,some studies on primary teeth from low-birth weight preterm individuals reported theoccurrence of a high frequency of mineralization disturbances, notably the presenceof a distinct hypomineralized postnatal zone (Noren 1983; Rythen et al. 2008), acondition compatible with the evidence from Fatina of a sometime thicker NL.However, in evaluating the possible relationships between NL width and thevariables considered in Table 4, take into account that the deciduous tooth sectionsused in the present histo-morphological study were selected from the Fatinacollection exactly because of the unambiguous presence of the NL. In other words,the present sample is unable to provide any information about a possible differentiallack of this mark, for example, in individuals distributed according to the categoriesassessed here, nor to any other additional variable available to us.
Another parameter intimately related to gestational age, thus of possiblerelevance in such kind of studies dealing with NL thickness variation, isrepresented by the weight at birth. In this respect, our record concerns only61/100 cases (31 m/30 f). The individual values range from 2.35 to 4 kg(av. � 3.33 � 0.41 kg), with no significant differences between males
Table 4. Analysis of Variance (F) of the Neonatal Thickness in the Fatina Samplewith Respect to Sex, Delivery Mode (DM), and Gestational Age (GA)a
d.f. F P
Sex 1 0.90 0.35GA 2 3.63 0.03*DM 2 0.70 0.50Sex by GA 2 2.02 0.14Sex by DM 2 0.64 0.53
a. d.f.: degrees of freedom.
Table 5. Results of the Tukey Honest Significant Difference (HSD) Method Used toTest the Differences Between the Means of the Grouping Levels for the Analysis ofVariance Presented in Table 4. Only the Significant Differences (P 0.05)Are Reporteda
Diff. Lower Upper P adj
GAPreterm - term 3.92 0.40 7.43 0.03
Sex by GAMales preterm - males term 6.72 0.22 13.22 0.04
a. GA: gestational age; diff.: difference in the observed means; lower: the lower end point of theconfidence interval; upper: the upper end point of the confidence interval; P adj: theprobability value after adjustment for the multiple comparisons.
708 / ZANOLLI ET AL.
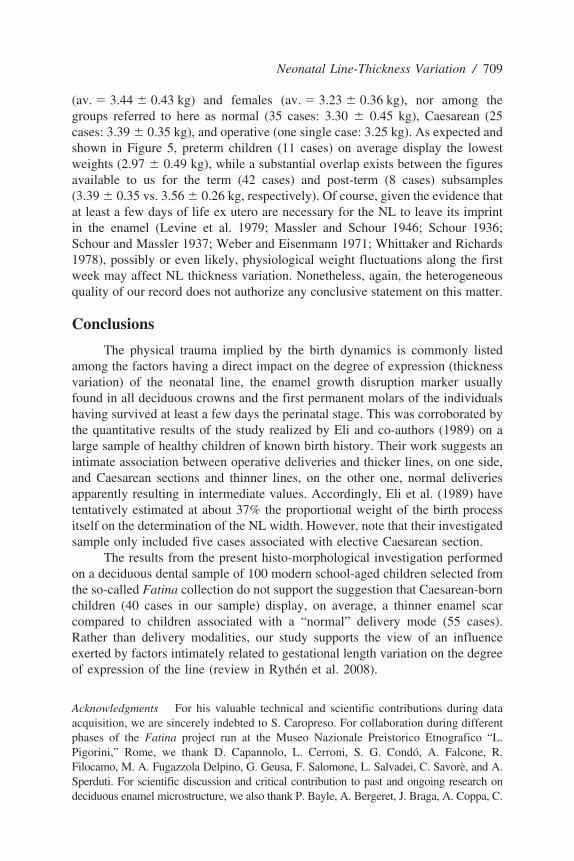
(av. � 3.44 � 0.43 kg) and females (av. � 3.23 � 0.36 kg), nor among thegroups referred to here as normal (35 cases: 3.30 � 0.45 kg), Caesarean (25cases: 3.39 � 0.35 kg), and operative (one single case: 3.25 kg). As expected andshown in Figure 5, preterm children (11 cases) on average display the lowestweights (2.97 � 0.49 kg), while a substantial overlap exists between the figuresavailable to us for the term (42 cases) and post-term (8 cases) subsamples(3.39 � 0.35 vs. 3.56 � 0.26 kg, respectively). Of course, given the evidence thatat least a few days of life ex utero are necessary for the NL to leave its imprintin the enamel (Levine et al. 1979; Massler and Schour 1946; Schour 1936;Schour and Massler 1937; Weber and Eisenmann 1971; Whittaker and Richards1978), possibly or even likely, physiological weight fluctuations along the firstweek may affect NL thickness variation. Nonetheless, again, the heterogeneousquality of our record does not authorize any conclusive statement on this matter.
Conclusions
The physical trauma implied by the birth dynamics is commonly listedamong the factors having a direct impact on the degree of expression (thicknessvariation) of the neonatal line, the enamel growth disruption marker usuallyfound in all deciduous crowns and the first permanent molars of the individualshaving survived at least a few days the perinatal stage. This was corroborated bythe quantitative results of the study realized by Eli and co-authors (1989) on alarge sample of healthy children of known birth history. Their work suggests anintimate association between operative deliveries and thicker lines, on one side,and Caesarean sections and thinner lines, on the other one, normal deliveriesapparently resulting in intermediate values. Accordingly, Eli et al. (1989) havetentatively estimated at about 37% the proportional weight of the birth processitself on the determination of the NL width. However, note that their investigatedsample only included five cases associated with elective Caesarean section.
The results from the present histo-morphological investigation performedon a deciduous dental sample of 100 modern school-aged children selected fromthe so-called Fatina collection do not support the suggestion that Caesarean-bornchildren (40 cases in our sample) display, on average, a thinner enamel scarcompared to children associated with a “normal” delivery mode (55 cases).Rather than delivery modalities, our study supports the view of an influenceexerted by factors intimately related to gestational length variation on the degreeof expression of the line (review in Rythen et al. 2008).
Acknowledgments For his valuable technical and scientific contributions during dataacquisition, we are sincerely indebted to S. Caropreso. For collaboration during differentphases of the Fatina project run at the Museo Nazionale Preistorico Etnografico “L.Pigorini,” Rome, we thank D. Capannolo, L. Cerroni, S. G. Condo, A. Falcone, R.Filocamo, M. A. Fugazzola Delpino, G. Geusa, F. Salomone, L. Salvadei, C. Savore, and A.Sperduti. For scientific discussion and critical contribution to past and ongoing research ondeciduous enamel microstructure, we also thank P. Bayle, A. Bergeret, J. Braga, A. Coppa, C.
Neonatal Line-Thickness Variation / 709
Dean, C. Duarte, C. FitzGerald, D. Frayer, O. Kullmer, L. Mancini, B. Maureille, A. Mazurier,M. Nakatsukasa, A. J. Olejniczak, T. Prowse, L. Rook, S. R. Saunders, J. H. Schwartz, P.Smith, D. S. Stout, A.-M. Tillier, J.-F. Tournepiche, C. Tuniz, and D. S. Weaver. This paperbenefited from comments kindly provided by H. Sarnat. Without the enthusiastic helpprovided by the children of the “Agatarco,” “C. Corradi”, “C. Forlanini”, and “Pirgotele”primary schools of Rome, this work would have never been possible.
To avoid any possible conflict of interests, the editorial process of this article hasbeen secured outside the Editorial Office of the Human Biology by Alfredo Coppa(University La Sapienza, Rome, Italy).
Received 15 September 2011; revision accepted for publication 3 October 2011.
Literature CitedAlexandersen, V., J. G. Noren, I. Hoyer et al. 1998. Aspects of teeth from archaelogic sites in Sweden
and Denmark. Acta. Odontol. Scand. 56:14–19.Antoine, D., S. Hillson, and M. C. Dean. 2009. The developmental clock of dental enamel: a test for
the periodicity of prism cross-striations in modern humans and an evaluation of the mostlikely sources of error in histological studies of this kind. J. Anat. 214:45–55.
Birch, W., and M. C. Dean. 2009. Rates of enamel formation in human deciduous teeth. InComparative Dental Morphology. Frontiers Oral Biology 13, T. Koppe, G. Meyer, and K. W.Alt, eds. Basel: Karger, 116–120.
Bondioli, L., and R. Macchiarelli. 1999. Neonatal line thickness and delivery at Isola Sacra (2nd–3rdcent. AD, Rome, Italy). Am. J. Phys. Anthrop. suppl. 28:94–95.
Bouyssou, M., H. Bouissou, and S. Teulie. 1958. L’influence de la naissance et de la periode neonatalesur les structures dentaires a l’etat normal et pathologique. Cahiers Odonto-Stomat. 8:15–55.
Bowman, J. E. 1991. Life history, growth and dental development in young primates: A study usingcaptive Rhesus macaques. Ph.D. diss. Cambridge: University of Cambridge.
Boyde, A. 1989. Enamel. In Handbook of Microscopic Anatomy, Vol. 6: Teeth, A. Oksche and L.Vollrath, eds. Berlin: Springer, 309–473.
Caropreso, S., L. Bondioli, D. Capannolo et al. 2000. Thin sections for hard tissues histology: a newprocedure. J. Microsc. 199:244–247.
Christensen, G. J., and B. S. Kraus. 1965. Initial calcification of the human permanent first molar.J. Dent. Res. 44:1338–1342.
Dean, M. C. 2006. Tooth microstructure tracks the pace of human life-history evolution. Proc. Roy.Soc. B. 273:2799–2808.
Dean, M. C. 2010. Retrieving chronological age from dental remains of early fossil hominins toreconstruct human growth in the past. Phil. Trans. R. Soc. B. 365:3397–3410.
Dean, M. C., M. G. Leakey, D. J. Reid et al. 2001. Growth processes in teeth distinguish modernhumans from Homo erectus and earlier hominins. Nature. 414:628–631.
Deutsch, D., and E. Pe’er. 1982. Development of enamel in human fetal teeth. J. Dent. Res.61:1543–1551.
Deutsch, D., O. Tam, and M. V. Stack. 1985. Postnatal changes in size, morphology and weight ofdeveloping postnatal deciduous anterior teeth. Growth. 49:202–217.
Eli, I., H. Sarnat, and E. Talmi. 1989. Effect of the birth process on the neonatal line in primary toothenamel. Pediat. Dentist. 11:220–223.
FitzGerald, C. M., and J. Rose. 2000. Reading between the lines: dental development and subadult ageassessment using the microstructural growth markers of teeth. In Biological Anthropology of theHuman Skeleton, M. A. Katzenberg and S. R. Saunders, eds. London: Wiley-Liss, 163–186.
FitzGerald, C. M., and S. R. Saunders. 2005. A test of histological methods of determining thechronology of accentuated striae in deciduous teeth. Am. J. Phys. Anthropol. 127:277–290.
710 / ZANOLLI ET AL.
FitzGerald, C. M., S. Saunders, L. Bondioli et al. 2006. Health of infants in an Imperial Roman skeletalsample: perspective from dental microstructure. Am. J. Phys. Anthropol. 130:179–189.
FitzGerald, C. M., S. R. Saunders, R. Macchiarelli et al. 1999. Large scale histological assessment ofdeciduous crown formation. In Dental Morphology 1998, J. T. Mayhall and T. Heikkinen, eds.Oulu: Oulu University Press, 92–101.
Friendly, M. 1994. Mosaic displays for multi-way contingency tables. J. Am. Stat. Ass. 89:190–200.Geusa, G., L. Bondioli, E. Capucci et al. 1999. Osteodental biology of the people of Portus Romae
(Necropolis of Isola Sacra, 2nd–3rd Cent. AD). II. Dental cementum annulations and age atdeath estimates. In Digital Archives of Human Paleobiology 2, L. Bondioli and R.Macchiarelli, eds. Rome: Museo Naz. “L. Pigorini” (CD-Rom, E-LISA, Milano).
Godt, H. 1963. Uber das Auftreten und die Briete der Retziusschen Parallelstreifen im prae- undpostnatalen Schmelz. Deut. Zahnarztl. Z. 18:1148–1153.
Goodman, A. H., and J. C. Rose. 1990. Assessment of systemic physiological perturbations from dentalenamel hypoplasias and associated histological structures. Yearb. Phys. Anthropol. 33:59–110.
Guatelli-Steinberg, D. 2009. Recent studies of dental development in Neanderthals: implications forNeanderthal life histories. Evol. Anthropol. 18:9–20.
Gustafson, G. 1966. Forensic Odontology. London: Staples Press.Gustafson, G., and A. G. Gustafson. 1967. Microanatomy and histochemistry of enamel. In Structural
and Chemical Organization of Teeth, A. E. W. Miles, ed. London: Academic Press, 75–134.Hillson, S. W. 1996. Dental Anthropology. Cambridge: Cambridge University Press.Hillson, S. W. 2005. Teeth. 2nd Ed. Cambridge: Cambridge University Press.Humphrey, L. T., M. C. Dean, and T. E. Jeffries. 2007. An evaluation of changes in
strontium/calcium ratios across the neonatal line in human deciduous teeth. In DentalPerspectives on Human Evolution. State-of-the-Art Research in Dental Paleoanthropology,S. E. Bailey and J.-J. Hublin, eds. Dordrecht: Springer, 303–319.
Iinuma, Y. M., M. Suzuki, Y. Matsuura et al. 2004. Identification and morphological characteristicsof dental neonatal line in sika deer (Cervus nippon). Japan. J. Vet. Res. 51:161–166.
Kodaka, T., T. Sano, and S. Higashi. 1996. Structural and calcification patterns of the neonatal linein the enamel of human deciduous teeth. Scann. Microsc. 10:737–744.
Kraus, B. S. 1959. Differentiated calcification rates in the human primary dentition. Arch. Oral. Biol.1:133–144.
Kronfeld, R., and I. Schour. 1939. Neonatal dental hypoplasia. J. Am. Dent. Assoc. 26:18–20.Lacruz, R. S., M. C. Dean, F. Ramirez-Rozzi et al. 2008. Megadontia, striae periodicity and patterns
of enamel secretion in Plio-Pleistocene fossil hominins. J. Anat. 213:148–158.Laws, R. M. 1952. A new method of age determination for mammals. Nature. 169:972–973.Levine, R. S., E. P. Turner, and J. Dobbing. 1979. Deciduous teeth contain histories of developmental
disturbances. Early Hum. Dev. 3:211–220.Macchiarelli, R., and L. Bondioli. 2000. Multimedia dissemination of the “Isola Sacra” human
paleobiological project: reconstructing lives, habits, and deaths of the “ancient Romanpeople” by means of advanced investigative methods. In Proceedings of 2nd InternationalCongress on Science and Technology for the Safeguard of Cultural Heritage in theMediterranean Basin vol. 2, A. Guarino, ed. Paris: Elsevier, 1075–1080.
Macchiarelli, R., L. Bondioli, S. Caropreso et al. 2006a. The oldest human remains from the BeagleChannel region, Tierra del Fuego. Int. J. Osteoarch. 16:328–337.
Macchiarelli, R., L. Bondioli, A. Debenath et al. 2006b. How Neanderthal molar teeth grew. Nature.444:748–751.
Macchiarelli, R., L. Bondioli, D. Falk et al. 2004. Early Pliocene hominid tooth from Galili, SomaliRegion, Ethiopia. Coll. Antropol. 28:65–76.
Macchiarelli, R., L. Bondioli, and A. Mazurier. 2008. Virtual dentitions: touching the hiddenevidence. In Technique and Application in Dental Anthropology, J. D. Irish and G. C. Nelson,eds. Cambridge: Cambridge University Press, 426–448.
Mahoney, P. 2008. Intraspecific variation in M1 enamel development in modern humans: implica-tions for human evolution. J. Hum. Evol. 55:131–147.
Neonatal Line-Thickness Variation / 711
Massler, M., and I. Schour. 1946. The appositional life span of the enamel and dentin-forming cells.J. Dent. Res. 25:145–150.
Massler, M., I. Schour, and H. G. Poncher. 1941. Developmental pattern of the child as reflected inthe calcification pattern of the teeth. Am. J. Dis. Child. 629:33–67.
Mazurier, A., V. Volpato, and R. Macchiarelli. 2006. Improved noninvasive microstructural analysisof fossil tissues by means of SR-microtomography. Appl. Phys. A Mat. Sc. Proces. 83:229–233.
Meyer, D., A. Zeileis, and K. Hornik. 2006. The strucplot framework: visualizing multi-waycontingency tables with vcd. J. Stat. Softw. 17:1–48.
Mishra, S., H. F. Thomas, J. M. Fearne et al. 2009. Comparison of demineralisation rates in pre- andpostnatal enamel and at the neonatal line. Arch. Oral Biol. S 1:S101–S106.
Moss-Salentijn, L., and M. Hendricks-Klyvert. 1985. Dental and Oral Tissues. An Introduction, 3rd
ed. Philadelphia: Lea and Febiger.Noren, J. G. 1983. Enamel structure in deciduous teeth from low-birth-weight infants. Acta. Odontol.
Scand. 41:355–362.Noren, J. G. 1984. Microscopic study of enamel defects in deciduous teeth of infants of diabetic
mothers. Acta. Odontol. Scand. 42:153–156.Perrin, W. F., B. Wursig, and J. G. M. Thewissen, eds. 2008. Encyclopedia of Marine Mammals. 2nd
Ed. New York: Academic Press.R Development Core Team. 2011. R: A language and environment for statistical computing. Vienna:
R Foundation for Statistical Computing (available at: http://www.R-project.org.).Ranggard, L., J. G. Noren, and N. Nelson. 1994. Clinical and histologic appearance in enamel of
primary teeth in relation to neonatal blood ionized calcium values. Scand. J. Dent. Res.102:254–259.
Risnes, S. 2001. Methodological considerations in studying the neonatal line with the scanningelectron microscope. In Dental Morphology 2001: 12th International Symposium on DentalMorphology, A. Brook, ed. Sheffield: Sheffield Academic Press, 211–218.
Rose, J. C. 1979. Morphological variations of enamel prisms within abnormal striae of Retzius. Hum.Biol. 51:139–151.
Rose, J. C., G. J. Armelagos, and J. W. Lallo. 1978. Histological enamel indicator of childhood stressin prehistoric skeletal samples. Am. J. Phys. Anthropol. 49:511–516.
Rossi, P. F., L. Bondioli, S. G. Condo et al. 1997. Linea neonatale dello smalto e dinamiche dellanascita: evidenze archeo-istologiche dalla Roma imperiale. Odontostomat. 23:546–553.
Rossi, P. F., L. Bondioli, G. Geusa et al. 1999. Osteodental biology of the people of Portus Romae(Necropolis of Isola Sacra, 2nd–3rd Cent. AD). I. Enamel microstructure and developmentaldefects of the primary dentition. In Digital Archives of Human Paleobiology 1, L. Bondioliand R. Macchiarelli, eds. Rome: Museo Naz. “L. Pigorini” (CD-Rom, E-LISA, Milano).
Rushton, M. A. 1933. On the fine contour lines of the enamel of milk teeth. Dent. Rec. 53:170–171.Rushton, M. A. 1939. The birefringence of deciduous tooth enamel formed before and after birth.
Brit. Dent. J. 67:1–10.Rythen M., J. G. Noren, N. Sabel et al. 2008. Morphological aspects of dental hard tissues in primary
teeth from preterm infants. Int. J. Paed. Dent. 18:397–406.Sabel, N., C. Johansson, J. Kuhnisch et al. 2008. Neonatal lines in the enamel of primary teeth. A
morphological and scanning electron microscopic investigation. Arch. Oral Biol. 53:954–963.Schour, I. 1936. The neonatal line in the enamel and dentin of human deciduous teeth and first
permanent molar. J. Am. Dent. Assoc. 23:1946–1955.Schour, I., and M. Massler. 1937. Rate and gradient of growth in human deciduous teeth, with special
reference to the neonatal ring. J. Dent. Res. 16:349–350.Schroeder, H. E. 1991. Oral Structural Biology. New York: Thieme Medical Publishers.Schwartz, J.H., F. Houghton, R. Macchiarelli et al. 2010. Skeletal remains from Punic Carthage do
not support systematic sacrifice of infants. PLoS ONE. 5:1–12.Seow, W. K. 1986. Oral implication of premature birth. Aust. Dent. J. 31:23–29.Shellis, R. P. 1984. Variations in growth of the enamel crown in human teeth and a possible
relationship between growth and enamel structure. Arch. Oral Biol. 29:697–705.
712 / ZANOLLI ET AL.

Simmer, J. P., P. Papagerakis, C. E. Smith et al. 2010. Regulation of dental enamel shape andhardness. J. Dent. Res. 89:1024–1038.
Skinner, M. F. 1992. Gestation length and the location of the neonatal line in human enamel. InRecent Contribution to the Study of Enamel Developmental Defects, A. H. Goodman and L.Capasso, eds. Chieti: Associazione Antropologica Abruzzese, 41–50.
Skinner, M. F., and T. Dupras. 1993. Variation in birth timing and location of the neonatal line inhuman enamel. J. Forensic Sci. 38:1383–1390.
Smith, P., and G. Avishai. 2005. The use of dental criteria for estimating postnatal survival in skeletalremains of infants. J. Archaeol. Sci. 32:83–89.
Smith, P., G. Avishai, J. A. Greene et al. 2011. Aging cremated infants: the problem of sacrifice atthe Tophet of Carthage. Antiquity. 85:859–874.
Smith, T. M. 2004. Incremental development of primate dental enamel. Ph.D. diss. New York: StonyBrook University.
Smith, T. M., B. H. Smith, D. J. Reid et al. 2010b. Dental development of the Taï Forest chimpanzeesrevisited. J. Hum. Evol. 58:363–373.
Smith, T. M., and P. Tafforeau. 2008. New visions of dental tissue research: tooth development,chemistry, and structure. Evol. Anthropol. 17:213–226.
Smith, T. M., P. Tafforeau, D. J. Reid et al. 2010a. Dental evidence for ontogenetic differencesbetween modern humans and Neanderthals. Proc. Natl. Acad. Sci. USA. 107:20923–20928.
Stavrianos, C., C. Papadopoulos, L. Vasiliadis et al. 2010. Enamel structure and forensic use. Res.J. Biol. Sc. 5:650–655.
Stewart, B. E., S. Innes, and E. A. Stewart. 1998. Mandibular dental ontogeny of ringed seals (Phocahispida). Mar. Mam. Sci. 14:221–231.
Szpringer-Nodzak, M. 1984. The location of the neonatal line in human enamel. J. Int. Assoc. Dent.Child. 15:1–6.
Tafforeau, P. 2004. Phylogenetic and functional aspects of tooth enamel microstructure andthree-dimensional structure of modern and fossil primate molars. Ph.D. diss. Montpellier:Montpellier University II.
Tafforeau, P., R. Boistel, E. Boller et al. 2006. Applications of X-ray synchrotron microtomographyfor non-destructive 3D studies of paleontological specimens. Appl. Phys. A Mat. Sc. Proces.83:195–202.
Tafforeau, P., and T. M. Smith. 2008. Nondestructive imaging of hominoid dental microstructureusing phase contrast X-ray synchrotron microtomography. J. Hum. Evol. 54:272–278.
Teivens, A., H. Mornstad, J. G. Noren et al. 1996. Enamel incremental lines as recorders for diseasein infancy and their relation to the diagnosis of SIDS. Forensic Sci. Int. 81:175–183.
Thomas, H. F., and D. Lee. 2003. Relative amounts of pre-natal and postnatal enamel in humanprimary incisors. 32nd Annual Meeting and Exhibition of the IADR (abstract 1188).
Weber, D. F., and D. R. Eisenmann. 1971. Microscopy of the neonatal line in developing humanenamel. Am. J. Anat. 132:375–391.
Whittaker, D. K., and D. Richards. 1978. Scanning electron microscopy of the neonatal line in humanenamel. Arch. Oral Biol. 21:45–50.
Wilson, P. R., and A. D. Beynon. 1989. Mineralization differences between human deciduous andpermanent enamel measured by quantitative microradiography. Arch. Oral Biol. 34:85–88.
Wilson, D. F., and F. R. Shroff. 1970. The nature of the striae of Retzius as seen with the opticalmicroscope. Aust. Dent. J. 15:162–171.
Yandell, B. S. 1997. Practical Data Analysis for Designed Experiments. London: Chapman & Hall.Zanolli, C., L. Bondioli, L. Mancini et al. 2011. Two human fossil deciduous molars from the
Sangiran Dome (Java, Indonesia): outer and inner morphology. Am. J. Phys. Anthropol.(under revision).
Neonatal Line-Thickness Variation / 713