Geospasial Indonesia: The Utilization of Spatial Data Through ...
40
SIT Graduate Institute/SIT Study Abroad SIT Digital Collections Independent Study Project (ISP) Collection SIT Study Abroad Fall 2016 Geospasial Indonesia: e Utilization of Spatial Data rough Geographic Information Systems Across Indonesia in Various Environmental Contexts Kaitlyn Bretz SIT Study Abroad Follow this and additional works at: hps://digitalcollections.sit.edu/isp_collection Part of the Community-Based Research Commons , Geographic Information Sciences Commons , Other Geography Commons , Physical and Environmental Geography Commons , Place and Environment Commons , and the Urban Studies and Planning Commons is Unpublished Paper is brought to you for free and open access by the SIT Study Abroad at SIT Digital Collections. It has been accepted for inclusion in Independent Study Project (ISP) Collection by an authorized administrator of SIT Digital Collections. For more information, please contact [email protected]. Recommended Citation Bretz, Kaitlyn, "Geospasial Indonesia: e Utilization of Spatial Data rough Geographic Information Systems Across Indonesia in Various Environmental Contexts" (2016). Independent Study Project (ISP) Collection. 2588. hps://digitalcollections.sit.edu/isp_collection/2588
-
Upload
khangminh22 -
Category
Documents
-
view
0 -
download
0
Transcript of Geospasial Indonesia: The Utilization of Spatial Data Through ...

SIT Graduate Institute/SIT Study AbroadSIT Digital Collections
Independent Study Project (ISP) Collection SIT Study Abroad
Fall 2016
Geospasial Indonesia: The Utilization of SpatialData Through Geographic Information SystemsAcross Indonesia in Various EnvironmentalContextsKaitlyn BretzSIT Study Abroad
Follow this and additional works at: https://digitalcollections.sit.edu/isp_collection
Part of the Community-Based Research Commons, Geographic Information SciencesCommons, Other Geography Commons, Physical and Environmental Geography Commons, Placeand Environment Commons, and the Urban Studies and Planning Commons
This Unpublished Paper is brought to you for free and open access by the SIT Study Abroad at SIT Digital Collections. It has been accepted forinclusion in Independent Study Project (ISP) Collection by an authorized administrator of SIT Digital Collections. For more information, pleasecontact [email protected].
Recommended CitationBretz, Kaitlyn, "Geospasial Indonesia: The Utilization of Spatial Data Through Geographic Information Systems Across Indonesia inVarious Environmental Contexts" (2016). Independent Study Project (ISP) Collection. 2588.https://digitalcollections.sit.edu/isp_collection/2588

Geospasial Indonesia The Utilization of Spatial Data Through Geographic Information Systems
Across Indonesia in Various Environmental Contexts
Kaitlyn Bretz Gede Ngurah Surya Anaya, Activist & Director of Bali Fokus SIT Study Abroad Indonesia: Arts, Religion, and Social Change Fall 2016

1
Table of Contents
Acknowledgements ................................................................................................................................... 2
Abstract ...................................................................................................................................................... 3
Introduction ............................................................................................................................................... 4
Background ................................................................................................................................................ 6
The Problem ........................................................................................................................................... 6
Land Use in Indonesia ............................................................................................................................ 6
One Map Policy .................................................................................................................................... 11
Geographic Information Systems ............................................................................................................ 13
What is GIS? ......................................................................................................................................... 13
Land-Use Planning in Papua New Guinea ........................................................................................... 14
Identifying Degraded Land for Sustainable Palm Oil ........................................................................... 16
Eco-Tourism ......................................................................................................................................... 19
Waste Management ............................................................................................................................ 20
Open Source Data via Mobile Apps ..................................................................................................... 22
Critiques: the Issue of Proper Framing .................................................................................................... 24
Perspectives ......................................................................................................................................... 24
Relations of Power ............................................................................................................................... 25
Stories and Narratives ......................................................................................................................... 27
Personal Observations ............................................................................................................................. 29
Indonesia and the United States .......................................................................................................... 29
Data Networking.................................................................................................................................. 29
Final Thoughts: Future Applications of GIS ............................................................................................. 30
Conclusions .............................................................................................................................................. 31
Recommendations for Further Study ...................................................................................................... 32
Bibliography ............................................................................................................................................. 33
Appendix: Profiles of Environmental Groups .......................................................................................... 37

2
Acknowledgements I owe so many people for having the opportunity to be a part of this amazing program and for helping me throughout this entire ISP period! I would first like to thank my professor, Prof. David Kneas for telling me that SIT Study Abroad existed and for pushing me to apply to the Indonesia program. Without you, I probably wouldn’t have studied abroad and missed out on this amazing opportunity. Next I would like to thank SIT Study Abroad for accepting my application and allowing me to participate in your amazing program! Thank you to Kirra Hughes for putting up with my emails and phone calls about my application. I never would have been able to travel this far without having someone willing to support me. With that said, I want to thank my amazing little brother, Logan, for lending me money so that I could actually eat food while in Indonesia! Without you my time in Bali would have been much more stressful. I also want to thank the Walker Institute at the University of South Carolina for awarding me the Ceny Walker Undergraduate Fellowship -- your support has been helpful, and I am so thankful for your willingness to fund my proposed project. Lastly, I would like to thank the National Oceanic and Atmospheric Administration (NOAA) for allowing my scholarship to continue even when I am abroad. I would not have even been able to think about studying abroad had it not been for your award. For emotional support, I would like to thank Bu Ary, for being an absolute goddess and making SIT Bali hands down the best program. You are amazing and I have no idea how you manage to herd us students around Bali and Java while simultaneously directing the program and having your own life. Terima kasih to Pak Yudi and Edo for all of their hard work and dedication for teaching us Bahasa Indonesia. You are both amazing teachers and this program is so lucky to have you! Thank you to my Bapak and Ibu in Kerambitan, and my little siblings, Sinta and Turah. You will forever be in my heart and my home is always open to you if you are ever in the United States. You helped me when I was missing my home and family and I cannot thank you enough for being there for me. I also want to shout out to all of my peers for their amazing support, freely given hugs, and just for being all-around awesome people. This semester has been a fantastic rollercoaster and I’m so glad we were all there for each other for the ups as well as the downs. For my ISP, thank you to my mentor, Pak Surya for being willing to take on this random SIT student and help with a topic that was completely new to you! Your support and contacts with environmental organizations proved invaluable. Thank you to all of the people I interviewed for your time and patience for sitting through my questions and endless emails. You are the most important part of this project and I cannot thank you enough for your cooperation. I also want to thank Pak Jon for being willing to read through several awful first drafts and providing good critiques and suggestions. Lastly, I want to thank my family for taking me seriously when I said I wanted to study in Bali! Thank you Mom and Dad for making me into the person I am today, who is willing and able to jump on a plane and live across the world for a few months. I owe you both so much and can only hope that I make you proud. Much love to everyone here and to anyone I missed (it probably happened and to whoever I forgot, I am so sorry!). This semester has been absolutely phenomenal and I am so glad I came on this program. I have grown as a person and am so thankful for having this opportunity. So, one last time -- Terima kasih banyak!

3
Abstract
Spatial planning and mapping in Indonesia have had a precarious history for the past several decades. Laws controlling the creation of maps for land use planning have fluctuated greatly between executive administrations and the country is still struggling to create a single, unified national map. With the One Map Policy the future of mapping is optimistic, but in the meantime spatial data analyses are lacking. Geographic information systems (GIS) is a computerized system for the capture, storage, querying, analysis, and display of spatial data, and is used predominately by the government, private companies, and nongovernmental organizations (NGOs) across Indonesia. Community mapping, the process of sketching out and digitizing community land claims, is also quite common around the archipelago and fills an important gap of information: the local field-based perspective that is often lost when conducting GIS with remote data. This balance of perspective and relation of power are important critiques of GIS and need to be considered with every GIS-related project. Spatial planning is especially important with the onset of climate change and the worsening of Indonesia’s numerous environmental problems. Most environmentally-focused NGOs use GIS routinely because protecting the environment often means proper land use planning. The environmental NGO community in Indonesia – particularly in Bali – is tight-knit, and they often partner with each other on projects. The scope of this project was to explore the way environmental NGOs utilize GIS in their work and to characterize the network between stakeholders.
4
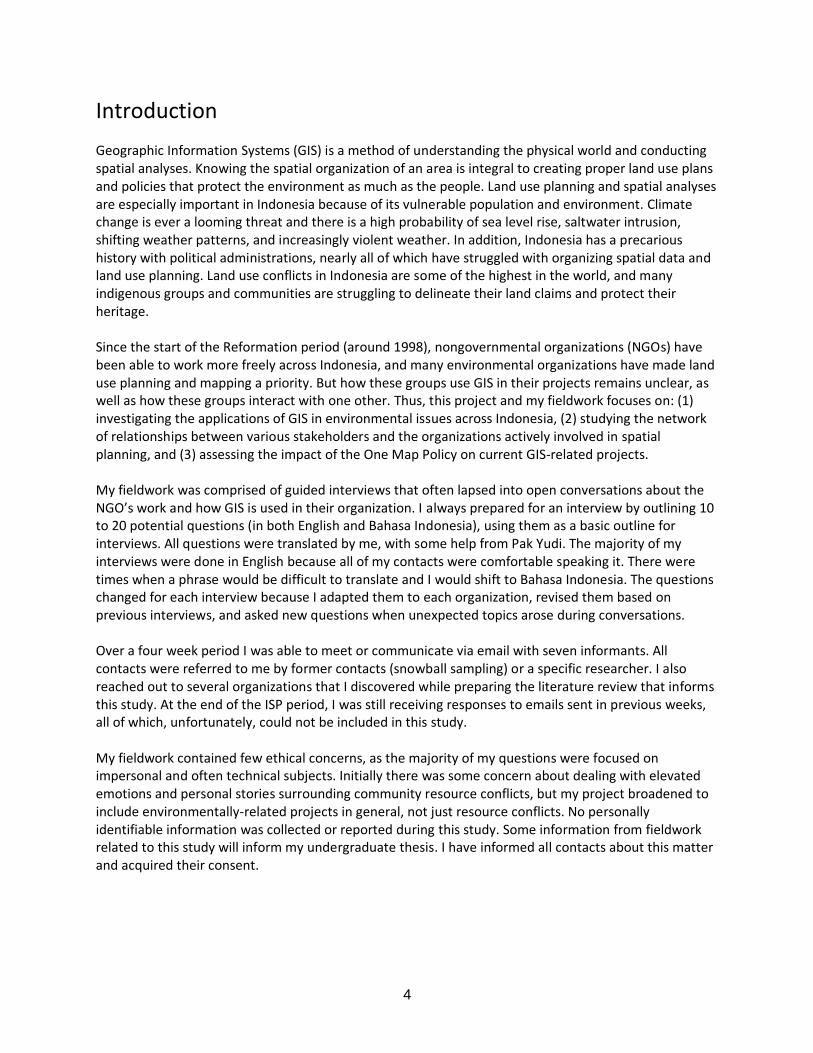
Introduction Geographic Information Systems (GIS) is a method of understanding the physical world and conducting spatial analyses. Knowing the spatial organization of an area is integral to creating proper land use plans and policies that protect the environment as much as the people. Land use planning and spatial analyses are especially important in Indonesia because of its vulnerable population and environment. Climate change is ever a looming threat and there is a high probability of sea level rise, saltwater intrusion, shifting weather patterns, and increasingly violent weather. In addition, Indonesia has a precarious history with political administrations, nearly all of which have struggled with organizing spatial data and land use planning. Land use conflicts in Indonesia are some of the highest in the world, and many indigenous groups and communities are struggling to delineate their land claims and protect their heritage. Since the start of the Reformation period (around 1998), nongovernmental organizations (NGOs) have been able to work more freely across Indonesia, and many environmental organizations have made land use planning and mapping a priority. But how these groups use GIS in their projects remains unclear, as well as how these groups interact with one other. Thus, this project and my fieldwork focuses on: (1) investigating the applications of GIS in environmental issues across Indonesia, (2) studying the network of relationships between various stakeholders and the organizations actively involved in spatial planning, and (3) assessing the impact of the One Map Policy on current GIS-related projects. My fieldwork was comprised of guided interviews that often lapsed into open conversations about the NGO’s work and how GIS is used in their organization. I always prepared for an interview by outlining 10 to 20 potential questions (in both English and Bahasa Indonesia), using them as a basic outline for interviews. All questions were translated by me, with some help from Pak Yudi. The majority of my interviews were done in English because all of my contacts were comfortable speaking it. There were times when a phrase would be difficult to translate and I would shift to Bahasa Indonesia. The questions changed for each interview because I adapted them to each organization, revised them based on previous interviews, and asked new questions when unexpected topics arose during conversations. Over a four week period I was able to meet or communicate via email with seven informants. All contacts were referred to me by former contacts (snowball sampling) or a specific researcher. I also reached out to several organizations that I discovered while preparing the literature review that informs this study. At the end of the ISP period, I was still receiving responses to emails sent in previous weeks, all of which, unfortunately, could not be included in this study. My fieldwork contained few ethical concerns, as the majority of my questions were focused on impersonal and often technical subjects. Initially there was some concern about dealing with elevated emotions and personal stories surrounding community resource conflicts, but my project broadened to include environmentally-related projects in general, not just resource conflicts. No personally identifiable information was collected or reported during this study. Some information from fieldwork related to this study will inform my undergraduate thesis. I have informed all contacts about this matter and acquired their consent.

5
As a final note, I want to reiterate that the work below is entirely my own and I take full responsibility for any misinformation or misquotes. I apologize in advance if I have misinterpreted or misrepresented anyone. The interviews described below were done with individuals from separate organizations and are by no means representative of environmental groups as a whole. My skills in Bahasa Indonesia are limited and the majority of my interviews were conducted in English with only small phrases or terms recorded in Bahasa Indonesia. Any mistranslations are my own.
6
Background
The Problem In 1969 the Geospatial Information Agency of Indonesia, Badan Informasi Geospasial (BIG), was created to manage spatial data and mapping for the national government. On their homepage, the bolded header reads “geospatial information builds and enriches our knowledge to solve problems” (“informasi geospatial menambah dan memperkuat pengetahuan kita mengatasi masalah keruangan”). This optimistic phrase succinctly outlines the ultimate goal of spatial data analyses: to better equip groups to solve spatial problems and to learn about the surrounding land. However, Indonesia’s history with spatial data and maps has been far from positive. Since achieving independence in 1945, Indonesia has struggled with outlining its geographic boundaries and settling land claim disputes. What land belongs to the government? What lands are culturally significant to the people? What land belongs to indigenous groups? Land use is the process of understanding the various functions, processes, and complexities in a landscape contributing to poverty alleviation, livelihood improvement, and environmental services (Lubis & Langston, 2015). In order to mediate land claim disputes, the various land uses of a certain area need to be analyzed and considered during spatial planning. This is done by creating maps delineating land use categories and outlining boundaries appropriate for future development (environmental, economic, social, or otherwise). The Indonesian government’s numerous agencies are infamous for creating different maps for various purposes, with few corresponding boundaries. (Oxford Business Group, 2016; Kurniawan, 2016). As recently as 2015, different agencies were still using their own maps and boundaries: as the Minister of Planning (Menteri PPN/Kepala Bappenas) Sofyan Djalil said in November 2015, “forestry has a map, agriculture has a map, transmigration has a map, the local government has a map...these maps are not consistent with each other (“perhutanan punya peta, perkebunan punya peta, transmigrasi punya peta, pemerintah daerah punya peta, peta-peta ini satu sama lain tidak konsisten”; Jannah, 2015)”.
Land Use in Indonesia Indonesia hasn’t always struggled with land use planning. The first nationwide attempt at land use planning (according to a literature review conducted by the World Resources Institute; Rosenbarger, 2013b) was in 1981, with the Agreed Map on Forest Functions (Tata Guna Hutan Kesepakatan, TGHK). This map was created by consolidating data from the Ministry of Forestry and other partner government agencies (i.e., Ministry of Agrarian Affairs, the Ministry of Internal Affairs, etc.) and delineated land categorized as Forest Estate. The TGHK was further updated in 1987 when the United Kingdom’s Overseas Development Administration funded a second mapping effort, called the ‘Regional Physical Planning Project for Transmigration (Rosenbarger, 2013b). The national ministries controlled land use planning in Indonesia up into the 1990s, until Law 24 of 1992 was created, decentralizing the spatial planning process. Land use planning was made available to the provincial and sometimes district level government offices. The maps created post-Law 24 often overlapped and conflicted with the official TGHK map. Multiple plans to integrate these maps failed (Rosenbarger, 2013b).
7
Law No. 26 of 2007 was created to replace the 1992 spatial planning law and sought to create a national set of spatial plans that were coordinated between all levels of government, district through national. Each level is still permitted to create their own spatial plans; however the national-level plans are required to be made first and to serve as a reference for provincial-level plans, which further serve as a reference for the district-level plans. Other problems like definitions and scale standards were also clarified. All spatial plans created under Law No. 26 of 2007 are valid for 20 years and are supposed to be reviewed every five years (Rosenbarger, 2013b). Nearly every informant repeated the terms “overlapping,” “mismatch,” and “corresponding borders” when speaking about spatial data around Indonesia. The World Resources Institute (WRI) is currently helping compile spatial data and reduce land use conflict between different Indonesian stakeholders. By launching a platform for discussion, WRI can facilitate multi-stakeholder meetings to improve communication and policy making (Anne Rosenbarger, personal communication (pc), 30 Nov 2016). SEKALA is a company that actively works with communities and the Indonesian government to map out certain regions and determine their proper boundaries (Widiastuti, pc, 9 Nov 2016). After preliminary data collection and the presentation of mismatched data, the Indonesian government has the final say in what boundaries are formally created (Ketut, pc, 29 Nov 2016). A common theme in the mapping process outlined above is the compilation and subsequent discussion of spatial data by multiple stakeholders. While the inclusion of all potential land claims is important, it complicates the process of creating a uniform spatial database. Lubis and Langston (2015) studied landscape change using GIS in North Sulawesi and firstly established how landscapes and land use patterns should be considered, both physically and temporally:
“Understanding development and dynamics at a landscape scale has been seen as a bridge to accommodate and assist natural resource managers, policy makers, planners, and local communities to explore options for suitable development. Landscape dynamics refer to a process of landscape evolution that involves tracing the relationship between humankind and the natural environment. A landscape provides key livelihood resources for people such as agriculture, forestry, fisheries, extractive industries, and other productive land uses. It is the space in which dynamic and evolving nature-human interactions occur (p. 207)”.
Different stakeholders, including the natural resource managers, policy makers, planners, and local communities often have dissimilar opinions on what a landscape is and its proper land use. Not having a unified view of a geographic region creates socio-political tension, which can escalate into land use conflicts. These conflicts, more specifically agrarian land use conflicts, are defined by the Konsorsium Pembaruan Agraria (KPA) as “conflicts arising from policies created by public authorities that have caused widespread social, economic, and political problems (2015).” For example, the Indonesian government has been recorded instigating social conflict through the expropriation of land for agricultural plantations that local people have controlled for generations (Harwell, 2000; Tagliarino, 2016). These conflicts have even attracted the attention of large international nongovernmental organizations (NGOs) like Conservation International, the Nature Conservancy, and the World Wildlife Fund, all of whom are campaigning for land sovereignty in the face of palm oil plantations.

8
The total number of land use conflicts is often overshadowed by the select incidents being advocated for by large international NGOs, however other groups have dedicated themselves to tracking land use conflicts across Indonesia, whether they result from palm oil production or not. KPA is such an organization. Established in Jakarta in 1994, KPA’s official mission is to “create a just agrarian system and ensure equitable allocation of agrarian resources to all people of Indonesia; to guarantee ownership, control, and use of agrarian resources for farmers, fishermen, and indigenous peoples; and to improve the welfare of the poor (Profil, http://www.kpa.or.id)”. KPA has been tracking land use conflicts around Indonesia for years and has officially published data for conflicts that arose between 2004 and 2015. Since 2004, several alarming trends have been recorded. For example, over the past 11 years, the number of land-use conflicts has increased 234% (Figure 1), the area of disputed land grew exponentially (Figure 2), and the number of injuries and arrests increased 159% and 271% respectively (Figure 3).
Figure 1. Total land conflicts in Indonesia from 2004 through 2015. Data shown here are conservative estimates due to the nature of the data: only conflicts reported to KPA by officials, recorded by local communities, and/or published in the media are recorded, thus unreported conflicts may be missing. Source: KPA, 2014; KPA, 2015

9
Figure 2. Total acreage of disputed land in Indonesia and the number of families involved in the conflicts from 2004 through 2015. Data shown here are conservative estimates due to the nature of the data: only conflicts reported to KPA by officials, recorded by local communities, and/or published in the media are recorded, thus unreported conflicts may be missing. Note that the number of people involved in the conflicts remains relatively stable while the number of conflicts varies dramatically from year to year. *denotes calculated averages of collected data. The acres of disputed land and number of families involved in land conflicts for 2005-2008 were published collectively, not by year. Source: KPA, 2014; KPA, 2015

10
Figure 3. Total number of deaths, injuries, and arrests in Indonesia from 2004 through 2015. Data shown here are conservative estimates due to the nature of the data: only conflicts reported to KPA by officials, recorded by local communities, and/or published in the media are recorded, thus unreported conflicts may be missing. *denotes calculated averages of collected data. The number of deaths from land conflicts for 2004-2006 and the number of injuries and arrests from 2010-2011 were published collectively, not by year. Source: KPA, 2014; KPA, 2015
It is unsurprising that such a large number of conflicts exist when you look at the policies and regulations on agrarian lands. According to Riggs et al., Indonesia has 634 recorded overlapping agrarian regulations, including the Basic Agrarian Law and the 1999 Forestry Law (2016; Nurdin, 2014). The permitting process is also just as tangled and confusing as the regulatory policies. Anne Rosenbarger, a researcher for the World Resources Institute, described the Indonesian resource concession permitting process as “a mess and wholly inaccurate (pc, 30 Nov 2016)”.

11
Further convoluting the crisis is the wide range of lands with disputed claims. Agricultural lands, while making up a large portion, do not include other land classifications, such as sacred lands, indigenous land claims, and designated conservation areas. Many other land conflicts have also been recorded by researchers investigating the impacts of cultural tourism. While various definitions exist, the general definition of cultural tourism is a sect of the tourism industry that focuses on attractions offered by local communities, such as cultural practices, rituals, religions, etc. (Picard, 1986; Lorenzen & Roth 2015). While found throughout Indonesia, cultural tourism is especially popular – and equally problematic – on the island of Bali. Here, the idea of sacred and/or cultural spaces, and the miscommunication of different conceptualizations of landscapes has fueled land use conflicts for the past three decades (Dalem, 2016; Strauß, 2015). As a whole, humanity sees and experiences the same physical space; however what those landscapes represent varies between different groups. For instance, in Bali there are three predominant landscape concepts: the Hindu-Balinese spiritual landscape often seen by local NGOs and supporters of cultural tourism, the conservation and sustainability landscape often seen by international environmental NGOs, and the material and economic landscape seen by potential investors (Strauß, 2015). These three conceptions of landscapes around Bali exist simultaneously between different stakeholders, each of which wants control of the same land, but for different reasons. The concern then is how to include all of these landscape concepts and values when creating land use policies. Further, can these different landscapes be represented properly on a map? Indonesia, especially Bali, has struggled with this problem, but in recent years has made progress on mapping the archipelago through the One Map Policy.
One Map Policy In 2010, President Susilo Bambang Yudhoyono proposed the One Map Policy (officially Law No. 4/2011) after seeing maps produced by the Ministry of the Environment and the Ministry of Forestry. Although these maps showed the same areas, the boundaries and forestry concessions outlined were completely different (Oxford Business Group, 2016). The One Map Policy was written in order to create a single map to be used as a base. This base map serves as a reference for all state agencies to use, with the goal of preventing overlapping land use claims (Kurniawan, 2016). Maps currently employed by state agencies were merged, and spatial data was harmonized to a ratio of 1:50,000 (i.e., one centimeter on a map equals 50,000 centimeters in real space). Spatial Informatics Group (SIG), an environmental think-tank based in the United States, was one of the groups approached by the Indonesian government to help assist BIG with meeting the goals outlined in the One Map Policy. SIG was first tasked with examining the “geospatial architecture, systems and national processes that could facilitate the right mix of technical alignment along within the national federation and geospatial databases already in place within Indonesia (One Map Indonesia, https://sig-gis.com).” Second, SIG created Indonesia’s “first participatory mapping portal that enables specific datasets to be openly shared by any user who desires to download the data, as well as is a place where a user can ‘create’ a map layer that incorporates elements of interest to themselves (One Map Indonesia, https://sig-gis.com)”.

12
With SIG’s assistance, Indonesia’s first basic geospatial map and thematic maps (e.g., national land-cover map, provincial mangrove map of Sumatra, national maritime characteristics map, and a national seagrass/shallow waterbed map) were published in 2014 after three years of data compilation(One Map Indonesia, https://sig-gis.com; Oxford Business Group, 2016). This data is available to the public on BIG’s site (http://tanahair.indonesia.go.id/home). This policy, though well-meaning, began to stall after only a few years. Anne Rosenberger spoke about how WRI is negotiating with government officials about becoming the official liaison for the One Map Policy. By working with the Ministry of Forestry and Environment and other stakeholders, WRI can facilitate discussions and help mediate the consolidation of spatial databases (pc, 30 Nov 2016). According to her, Indonesian policies change from administration to administration because the Ministries shift their priorities; thus the One Map Policy eventually fell out of favor with President Yudhoyono’s administration (pc, 30 Nov 2016). However, another informant with experience working with the government, Pak Ketut Deddy from SEKALA, said that the policies surrounding spatial data in Indonesia have not changed in recent years. Even if a new administration takes power, the problem of inconsistent boundary lines still exists in maps and will continue to hamper project development as long as it exists (pc, 29 Nov 2016). These two responses address the same issue – the Indonesian government and spatial mapping policies – but have distinctly different answers about the influence of politics. It should be noted however that Pak Ketut was at the time speaking on mapping discrepancies as a whole, and not just the One Map Policy. With that, it can tentatively be said that while the One Map Policy may have declined in favor with the Indonesian government, the overarching issue remains and will always challenge any new administration. In February 2016, President Joko Widodo (2014 - present) signed a Presidential Decree (No. 9/2016) to accelerate and expand the One Map Policy to help further his promised development and infrastructure projects (Jong, 2016; Anne Rosenbarger, pc, 30 Nov 2016). Under this decree, the uniform base map is proposed to not only clarify administrative boundaries, resolve land use conflicts and improve conservation and disaster management, but to also help the government create better spatial planning for economic development. The Jakarta Post reported in July 2016 that BIG aims to complete the integrated map of Kalimantan (Borneo) by the end of 2016, and to begin the maps for Sumatra and Sulawesi in 2017, Maluku and Papua in 2018, and lastly Java, Bali, and Nusa Tenggara in 2019. Widodo’s administration is pushing BIG to have all thematic maps completed and published by June 2019 (Kurniawan, 2016). To expedite this process, WRI is apparently helping facilitate the consolidation of spatial data but has yet to formally confirm their active involvement with the One Map Policy (Anne Rosenberg, pc, 30 Nov 2016). By the time BIG wants to publish the remaining thematic maps, it will have been a little under a decade since the initial policy was initially proposed. The One Map Policy is an ambitious and politically contentious initiative, so it is hardly surprising that it has taken so long to compile data and publish the maps for public use. The central barrier to this policy, as mentioned previously, is that so many different agencies have the authority to design their own sectoral maps (peta sektoral/tematik) but have no uniform base map to use (peta dasar; Oxford Business Group, 2016). The One Map Policy directly challenges the individual authority of governmental agencies accustomed to managing their own spatial data, while simultaneously tackling the heart of land ownership, land tenure, and land rights all across Indonesia (One Map Indonesia, https://sig-gis.com; Kurniawan, 2016).

13
The process of mapping and outlining boundaries is extremely political, and the One Map Policy is a move to make boundaries across Indonesia a more democratic process. In 2014, the Environment and Forestry Minister, Siti Nurbaya Bakar, was recorded saying that “the one-map policy could be considered as a form of democratic governance, whether by wiping away any hint of sectoral egotism or by involving international agencies like the Nature Conservancy” and that “the government needs to become the spearhead of negotiations, with the map as its instrument…[to] get rid of any sectoral egotism found on the map (Salim, 2014)”. As of July 2016, all of the governmental agencies have submitted their existing thematic maps and BIG is in the process of verifying the data and integrating it into their basic geospatial information map, published in 20141 (Jong, 2016).
Geographic Information Systems
What is GIS? The acronym GIS stands for “geographic information systems” and is commonly defined as “computerized systems of display and analysis of geographically referenced information (Harwell, 2000)”. If you investigate further however, the acronym GIS can stand for more than just a computerized system. Pickles described in 1995 how GIS can refer to as (1) “an approach to geographic inquiry and spatial data handling;” (2) “a series of technologies for collecting, manipulating, and representing spatial information;” (3) “a way of thinking about spatial data;” (4) “a commodified object that has monetary potential and value;” and (5) “a technical tool that has strategic value.” For the purpose of this study, the acronym GIS will refer to a computerized system for the capture, storage, querying, analysis, and display of spatial data (Chang, 2011 from Hodgson, 2015a) GIS is comprised of a series of datasets which contain two forms of data: geospatial and aspatial. Geospatial data is information about the relationship between objects existing in space at any scale (Pickles, 1995). Aspatial data refers to information collected about a certain area that can be referenced to a physical location, such as the population of Indonesian cities, income of different tourist activities around Bali, or the amount of rice produced by each subak association. Geospatial data can be collected a multitude of ways. Primary data capture is “the process of abstracting and recording the geographic position and attributes of features from their native source (i.e., surveying, remote sensing, and photo/lidar-grammetry) and is directly entered into the computerized GIS system (Hodgson, 2015b).” Data conversion is the “process of converting existing mapped geographic data into a digital format” including digitizing physical maps to be used on a computer (Hodgson, 2015b). Historically, geospatial data was collected by hand or derived mathematically, then visually displayed via maps. Today, satellite and imaging software is used to remotely collect most spatial data. Remote sensing is the method of measuring environmental processes, such as land cover change, land degradation, and the human footprint from a distance by digitally managing aerial photography and satellite imagery (Robbins, 2003).
1 For an exact list of agencies involved, what data they have authority over, and which agencies have adopted the
base map, see Oxford Business Group, 2016.

14
The unique aspect to GIS is that spatial analyses can be conducted within the system itself. A base map is created from spatial data, and then other geospatial and aspatial data are referenced to the base map in a series of layers. For instance, any map projection of Bali could be used as a base layer, and then layers of different data could be placed on top of that base, such as lines indicating major rivers, points identifying large settlements, and possibly even population data for each district. Any number of data layers can be referenced to a base map, making the number of GIS analyses limitless2. Indonesia, specifically Borneo, was one of the first places where GIS was used to not only investigate the causes and impacts of an environmental disaster, but to also find evidence used to bring companies to court (Harwell, 2000). The Indonesian fires of 1997-1998 burned a large (yet still undetermined) amount of land across the islands of Borneo and Sumatra. Different stakeholders blamed different causes, ranging from the natural cycle of El Niño, to swidden farmers, to palm oil plantations. Historically, environmental conditions and swidden farmers would catch the blame for starting the fires, however with the advent of open-source spatial data and publicly-available GIS programs, the door was opened to the NGO community who began using this data to pressure the government into changing their policies. In August 1997, the Environment Minister issued warnings of prosecution for plantation owners who used fire to clear their land and then attempted to make good on his threats the following October when he brought charges to the Minister of Forestry against 179 companies. While the majority of charges were dropped within the year, the simple fact that they were made at all indicates progress in disaster analysis (Harwell, 2000). Reading Harwell’s work, with its beginning quote “All I have to say about the fire crisis is -- Alhamdulillah (Thanks be to God). Because now everyone understands we need GIS” (said by an Indonesian official from the Agency of Forest Protection and Nature Conservation at a ‘Discussion on the Impacts of Forest Fires’ in Jakarta; 2000), I figured that GIS would be a common software in Indonesia. At the start of my fieldwork however, I quickly realized that very few people seemed to know what GIS is, what it is used for, or why an organization would use it, including my own advisor. Despite general public ignorance of GIS and all that it is used for, I found that it is used with relative frequency by a variety of actors throughout Indonesia, including government agencies, international NGOs, local NGOs, and consulting firms. Profiles of the environmental groups with whom I had contact during fieldwork in October and November 2016 can be found in the Appendix. This is by no means an exhaustive list of projects across Indonesia that have or are currently using GIS, and should be taken simply as selected examples.
Land-Use Planning in Papua New Guinea The Papua Province in eastern Indonesia is highly contested, with numerous stakeholders vying to control the rights to natural resources, particularly mineral resources. This conflict is particularly ambiguous in situations where extraction of one resource (e.g., mineral extraction) is at the expense of sustainable management and/or protection of another resource (e.g., forests or areas of high biodiversity conservation value; SEKALA, NCS & PCSSF, 2014). Further, there are some boundaries that remain disputed by indigenous people who maintain customary rights in Papua.
2 Computers and the accompanying technology make GIS limited only by the amount of space and computing power
available to the software. In 1995 Pickles wrote that “digital spatial data and GIS permit the infinite manipulation of data layers, the construction of an infinite sequencing of new views on the data landscape, new angles of view,
multiple overlays, and correlations of spatial data landscapes. Space and data have become fully manipulatable in
this virtual environment.” Recently, more and more companies are beginning to invest in ‘big data’ management, which may allow GIS to grow even further

15
In 2009, the provincial government requested a spatial assessment be conducted to outline spatial planning options for the area. SEKALA, along with Nordic Consulting Group and the Papuan Civil Society Strengthening Foundation (PCSSF), conducted a baseline assessment of the land, a stakeholder analysis (which included meeting and interviewing stakeholders to assess their interests and concerns about the plan), identified economic, environmental, and social priorities, and built potential scenarios for the Papua Province to use (SEKALA, NCS & PCSSF, 2014). GIS entailed a significant portion of these tasks, all of which were conducted by SEKALA employees, including Mbak Franciska Widiastuti and Mas Awan Gede (pc, 9 Nov 2016). First, base maps were selected, data layers on various environmental components were collected, compared, and then corrected, and lastly the various spatial analyses were conducted. A summary of their findings can be found in a formal report (SEKALA, NCS & PCSSF, 2014) but the results basically describe the biotic and abiotic ecosystem throughout the province. Participatory mapping also comprised a significant portion of the Papuan project. Pak Ketut described how community mapping begins with a simple sheet of paper, on which members sketch out their land, with their claims and current land use. This sketch is then transferred to an official paper map to clarify boundary claims and make the map more accurate. This map is then digitally rectified and uploaded into the GIS software for analyses (Hodgson, 2015b). These maps, produced with the help of local NGOs, are then used to protect community land claims and are presented to government officials for consideration (Ketut, pc, 29 Nov 2016). The process of sketching out land claims and land use categories with local communities can be argumentative. Gathering community members together and having them sketch out the local boundaries often causes conflicts (frequently pre-existing) and can complicate the process (Ketut, pc, 29 Nov 2016). Other unique obstacles can appear during participatory mapping when certain regions have never been mapped before. In Papua for instance, when identifying several rivers, the community members and government officials realized that their respective names for several rivers did not match at all because the official names of certain rivers were unrecognized by locals, who continued to call them by locally-used names (Ketut, pc, 29 Nov 2016). Local NGOs work with SEKALA and serve as liaisons between the consulting firm and communities. SEKALA works with these organizations throughout the spatial planning process. Educational workshops, including GIS coursework, are an important part of SEKALA's mission. SEKALA provided introductory GIS training during their Papua assessment by teaming up with the World Wildlife Foundation; however further training is required before Papuan stakeholders will have the capability of making informed spatial planning decisions and utilizing technology to create new spatial plans. Local community members usually do not have access to technology capable of managing GIS software, so training modules are aimed at NGOs and government officials (Ketut, pc, 29 Nov 2016; SEKALA, 2014). Looking forward, a significant concern is whether the political will to keep the government accountable to the spatial plans will remain. In their report, SEKALA directly mentions Bali because “government officials do not adhere to spatial plans and issue land to villa developments when it has been categorized for conservation or watershed management (2014)”. The final steps of the Papua land use planning project are currently in motion and a final report is in production (Ketut, pc, 29 Nov 2016).

16
Identifying Degraded Land for Sustainable Palm Oil Indonesia is the world’s leading producer and exporter of palm oil, with 33.4 billion tons of palm oil being produced in 2015 (Bergen, 2016). Palm oil has become associated with deforestation, social conflicts, and other environmental impacts across Indonesia, particularly in Kalimantan, Indonesia’s portion of Borneo. Though controversial, palm oil is a thriving industry and isn’t going away anytime soon. The Indonesian government has announced goals to expand palm oil production while also avoiding forest loss, social conflicts, and other environmental impacts. In order to do this, WRI writes that Indonesia’s ability to do this relies upon “where new oil palm plantations are established and whether local rights and interests are respected during site selection processes, which in turn depends upon the government’s spatial planning and permitting process (2013)”. To help promote the development of sustainable palm oil plantations, the POTICO project was created (WRI, Forests & Landscape Indonesia). Partnered with WRI, SEKALA developed a quick and cost-effective method for identifying potentially suitable areas for oil palm development that is designed in line with standards for sustainable palm oil production that includes applicable Indonesian policies and is similar to proposed national REDD+ strategies (WRI, 2014). This project was completed under Project POTICO (now known as Forests and Landscapes in Indonesia), a larger initiative to use new mapping techniques and community engagement to aid the transition of palm oil development from forested to already-degraded lands (WRI, Forests & Landscape Indonesia). The final product took SEKALA's GIS analysis and created a desktop program using readily available data and rapid field assessments. This desktop analysis, associated data, and other supplemental materials are currently published for public use (Gingold et al., 2012). On this site, users can create their own suitability maps by selecting their own parameters. The site, though available, likely does not have recent, accurate databases nor is it updated routinely (Ketut, pc, 29 Nov 2016). Site selection using a series of selected environmental, economic, social, and legal indicators proved to be a long process, with the spatial analysis of environmental parameters being the easiest step to complete. Due diligence activities, including community mapping to document community claims and rights, conducting high conservation value and social impact assessments, implementing comprehensive free prior and informed consent process, and fulfilling legal requirements, are required to confirm the suitability of a potential site for oil palm cultivation, but were outside the scope of the initial project (Figure 4).

17
Figure 4. Table outlining the data considered when identifying potential sites for sustainable palm oil production. Note that most environmental, quantitative data is done during the suitability mapping phase, and the economic and social data is done during the field survey phase. Quantitative data is done in GIS and uses previously collected data. Source: Gingold et al., 2012

18
Suitability mapping is done by combining selected thematic layers over a base map, and areas with optimal parameters are selected as potential development sites. For SEKALA’s project, three layers (carbon and biodiversity, soil and water protection, and crop productivity) with 13 individual indicators were selected for consideration (Figure 5). This data was aggregated from open source databases, which were verified by cross-checking databases and peer revision (Widiastuti, pc, 9 Nov 2016). The maps created with the above data (which is known to vary in quality) require further verification before being actively applied to the spatial plan; therefore, field assessments are required to identify and reclassify any sites that were misidentified. Under the desktop study, 14.6 million hectares of land were identified as being potentially suitable for palm oil expansion but 5.3 million hectares (36%) were not legally classified to allow for plantation development. On the other hand, 8.6 million hectares were found to not be suitable by the study, but were legally classified to allow conversion to oil palm plantations. For an example suitability map, see Figure 6. By using spatial analysis coupled with a review of legal classifications, WRI and SEKALA were able to identify a major inconsistency in Indonesian policy and environmental protection promises.
Figure 5. Table outlining the three data layers used for suitability mapping. Note there are only 13 total indicators for the entire project. Source: Gingold et al., 2012

19
Figure 6. Example map produced by WRI and SEKALA’s open-source desktop program. This image suggests certain areas that may potentially be suitable for sustainable palm oil development. Gold represents preliminary results for potential areas for development, but need to be ground-truthed prior to any formal development plans being proposed. Purple are unsuitable areas based off the user-selected specified criteria. Source: Suitability Mapper, http://www.wri.org/resources/
Eco-Tourism Bali is as famous for its environment as much as its culture and surfing locations. In recent years there has been a significant increase in demands for eco-tourism businesses to cater to environmentally-minded travelers. Seizing the opportunity, several communities around Bali have looked into creating eco-tourism opportunities near their villages. In order to facilitate this process and advise land use planning, Wisnu partnered with the Village Eco-Tourism Network (Jaringan Ekowisata Desa, JED) to help communities start their own eco-tourism businesses. During my fieldwork, Wisnu was actively working with community leaders in North Bali (villages Kiadan Pelaga, Dukuh Sibetan, Tenganan Pegringsingan, and Ceningan Island; Suarnatha, p.c., 16 Nov 2016) to map out potential development areas and create logical land use planning proposals, so no final products have yet been released. Wisnu employees physically traveled to these communities and conducted preliminary surveying (tripod instruments with global positioning system, or GPS, capabilities) in order to gather spatial data to be used to verify the selected base map. Spatial analyses in GIS are currently being conducted and have yet to be published. Data is expected by the end of 2016 (Atiek Kurnianingsih pc., 24 Nov 2016).
20
Waste Management A serious environmental concern in and around Indonesia is the management and disposal of organic and non-organic waste. The Indonesian government has struggled with this problem for decades and has recently made some policies in larger cities to reduce the amount of plastic waste (Vaesson, 2016). In the meantime, several groups have been working to identify and manage waste streams on a smaller scale. Gringgo, a small company in Bali, has been working since 2014 to develop solutions to the waste problem (Olivier Pouillion, pc, 15 Nov 2016). Gringgo started with the ‘old way’ of collecting data, presumably investigating waste management in person, and is currently in the process of updating their data collection. A large part of this system update is the implementation of GIS in order to manage the collected survey data (Olivier Pouillion, pc, 15 Nov 2016). Olivier Pouillion is the CEO and co-founder of Gringgo and has spent the last few years tackling the waste problem in South Bali. During our conversation, Olivier said “[we] need to first figure out what is actually going on” in regards to the waste management problem in Denpasar (pc, 15 Nov 2016). He then went on to describe the various network Gringgo works with, including independent workers (i.e., scavengers and entrepreneurs in waste management), private sectors (recycling companies), and the government (who “knows only a small piece of the picture….and are quite clueless”; Olivier Pouillion, pc, 15 Nov 2016). Gringgo has also partnered with Wisnu to gather spatial data on waste identification; in fact, it was Pak Suar, the director of Wisnu, who first showed me the Gringgo app and talked about community involvement in GIS (pc, 16 Nov 2016; Olivier Pouillion, pc, 15 Nov 2016). The next step in assessing the distribution of waste around Denpasar is to identify where waste is and record what type it is. Gringgo is currently in the beta stage of developing and formally publishing a self-titled app to allow volunteers (e.g., ‘citizen scientists’) to learn about the waste problem and opportunities around Denpasar (Olivier, pc, 25 Nov 2016). Using this app, volunteers can: (1) learn about proper recycling procedures for different materials; (2) to know where recycling centers and traders are located around Denpasar; and (3) to learn how to make money off certain items; (2) and to help find legal and illegal waste dumps (GooglePlay, 2016b). Even in its beta form, there are already 100 downloads from GooglePlay and an unreported number of downloads from the Apple Store (as of December 2016). Below are screenshots from the app, retrieved from GooglePlay (Figure 7). The app is easy to navigate and its layout is logical and informative. The GIS functions worked smoothly and the page for data submission makes geocoding locations of waste simple, which I believe will allow a greater audience to successfully use this app.

21
a. b.
C.
d. e. f.
Figure 7. Screenshots from Gringgo’s self-titled beta-app. Images were taken in November 2016 and illustrate the range of tasks the app provides that actively use GIS. (a) shows the opening screen, where you can select what task you want to complete. (b, c) the geolocation of the mobile device is located and available waste and recycling stations are indicated as points. (d, e) By clicking on a point, the name, address, contact information, and hours of operation for each center are displayed. (f) An option for geomarking observed waste deposits (this is where citizen-collected data is entered). Source: GooglePlay, 2016b

22
Open Source Data via Mobile Apps As part of the One Map Policy, the Jokono administration promised more transparency and to make more spatial data available to the public (Anne Rosenbarger, pc, 11.30.2016). In order to make spatial data more accessible, BIG has been developing a mobile app for public use, available to citizens from Indonesia (read: the app is unavailable if a foreign address is connected to a Google or Apple account; Figure 8). Without direct access to the platform, I personally have no comments to make about the mobile app, however on GooglePlay it has been downloaded at least a thousand times and received 26 reviews and a 4.3 star rating. Many reviews report bugs, but the only comment for the current version seems optimistic, reading “continues to improve” (“terus lanjutkan dan tingkatkan”; GooglePlay, 2016a). I am hopeful that this mobile app can continue to be developed and more data be made available to the Indonesian public.

23
a. b. c.
d. e. f.
Figure 8. Screenshots from BIG’s app, Geospasial Indonesia. Images were taken in November 2016 from the GooglePlay description screen. (a) Show the current version and basic description of the app. (b) an image depicting the options for base maps; all have the same data, just use different remote data to display it. (c) GIS function that allows you to search for a preloaded location and zooms in to that area at a smaller scale. (d) A second GIS function that allows users to place points on the base map and highlight areas for spatial analyses; this example show the square kilometers of the highlighted blue region. (e) Loading other data layers from thematic databases is an additional option for users, if the simple base map and associated data simply aren’t enough. (f) an example of a user-added thematic data layer. Source: GooglePlay, 2016a

24
Critiques: the Issue of Proper Framing At first glance, GIS seems to be a positive solution to land use planning by appearing to be both objective and modern. Remote sensing from satellites removes human error from the process and the actors involved receive identical data and imagery. When you investigate further however, the political nature of GIS (and mapping in general) emerges. The central critique of GIS is the issue of framing. What spatial data is selected for analysis, how an area is mapped, and what it represents to an audience all changes depending on three framing devices: chosen scales and perspectives, power relations between stakeholders, and the select histories being told by those in power. Each section below relates to the overarching issue of framing, and while they are intrinsically related, I shall attempt to piece apart how each is individually problematic.
Perspectives GIS work can be undertaken from any distance - even on the other side of the world. The ability to conduct spatial analyses on an internet platform means that a researcher needs only a computer and access to the data to work: field research in the initial stages of GIS is not required. In her article on the application of GIS during Indonesia’s wildfires in 1997-1998, Harwell writes that “donor organizations want to see capacity-building projects, not those that require long canoe trips and interviews with rice farmers (2000)”. Funding for fieldwork is thus often overlooked because of the time, effort, and monetary cost it takes to collect qualitative data from the field. When speaking with Pak Suar, the director of Wisnu, this oversight by larger organizations can be corrected through community mapping, where local NGOs such as Wisnu work with the public to help them map their lands (Suarnatha, pc, 16 Nov 2016). Harwell further argues that “remote sensing and GIS fit the bill perfectly as a high-prestige, highly-priced, high-modernity project that could provide both training and hardware for the host country, while minimally involving the donor in sticky political questions of policy reform, social conflict, and government corruption (2000).” Interestingly, Pak Ketut echoed these sentiments when he spoke about the process of competing for funding. When projects are released and companies bid for hire, smaller organizations like SEKALA are often passed over for larger international organizations such as the American International Group (AIG) and SIG. And then, grimly laughing, Pak Ketut added that after winning the bid the larger companies turn around and try to hire smaller companies like SEKALA to do their work for them (pc, 29 Nov 2016). SEKALA’s entire business model appears to revolve around the idea of scale, to the point where even their logo shows a series of scaled leaves embedded within one another. This was done intentionally to illustrate how SEKALA believes that spatial analyses need to be conducted at all scales, not just a select few (Ketut, pc, 29 Nov 2016). The name SEKALA also implies scale: sekala in Bahasa Indonesia literally translates to ‘scale.’ SEKALA’s frequent partner, WRI, holds a similar moral standard. WRI is a large international organization, but operates more as a think-tank rather than a for-profit company like those mentioned above (Anne Rosenberg, pc, 30 Nov 2016). After speaking with Anne Rosenbarger, I received the distinct impression that WRI goes out of its way to hire locals and spends a large amount of time conducting fieldwork.

25
Using remote sensing effectively expands the scale of analysis, removing the software user (i.e., NGOs) from political situations. Making macro-level assessments has thus become the preferred method of data collection rather than field data collected at the local-level. However, avoiding fieldwork means alternative perspectives of land and land use activities are lost, including experiences and opinions from local communities. Smaller scale conflicts, such as those between individual actors are also lost at such a large scale. In 1998, farmers in Borneo were underrepresented as their fields and forests burned. Instead, massive media coverage was flooded with satellite images and GIS statistics describing the crisis (Harwell, 2000). Satellite observations provide us a look at the Earth’s surface - sometimes with amazing detail and accuracy; however, we have to be careful about getting lost in the allure of macro-level analyses. Satellite images never tell the whole story, and multiple perspectives are always needed when doing spatial analyses.
Relations of Power Each perspective of GIS establishes a hierarchy of power and control: those that manage the data and create the maps determine what is shown on those maps and how they should be interpreted. “With centuries of distance and historical hindsight, we can see that error and bias, exploitation and colonialism, self-serving centrism and ecological harm can so easily be read into the subsoil of old maps and that they may as well be listed with symbols and explained in the legend (Pickles, 1995).” From early on in the development of GIS, many people were concerned about issues of access and power imbalances that they would create (Kyem, 2004). “Geography is the discipline of imperialists” is a cautionary phrase often repeated in political ecology courses. Maps are not simply pictures of the world, but depictions of land that can be shaped and manipulated (Pickles, 1995). For example, the use of cadastral mapping, or a land claims map, became popular in order to make complex patterns of local land use understandable by outsiders (i.e., government officials and tax collectors; Scott, 1998). Non-state forms of measurement and boundary delineation impede administrative authority, and so governments have been involved in defining scale and creating maps for centuries (Scott, 1998). Simplifying reality by making maps makes understanding the world easier but narrows our vision, sometimes to the point where we lose sight of other perspectives. The perspectives of those not involved in the mapping process are often lost and not considered in the analysis, which is why many organizations conduct multi-stakeholder meetings to make sure that the needs of different groups are heard. Representations of boundaries and land use categories actively reproduce particular value systems and principles of inclusion and exclusion, and mapping a single perspective gives power to a single actor while simultaneously silencing other groups of people (Harwell, 2000; Kyem, 2004). The political nature of mapping is rather clear from the previous discussion, in which the Indonesian government has become involved in spatial planning and is in the process of implementing the One Map Policy. During multi-stakeholder meetings, organizations such as WRI and SEKALA must be cognizant of the power between the different groups of people. Anne Rosenbarger put it simply: “you can’t put community members and government officials together in a board room and expect there to be an equal exchange of information (pc, 20 Nov 2016).” Different stakeholders therefore work with different “work streams” in order that all voices are heard equally (Anne Rosenbarger, pc, 30 Nov 2016).

26
WRI is heavily involved in oil palm production in Indonesia and has worked with the Indonesian government extensively. The permitting process for land concessions is a mess and often inaccurate. Government officials are also particular about how they receive spatial data, and have recently been pushing to create their own platform. This in turn takes power away from other stakeholders, namely the communities and interested companies who have produced their own spatial data and may not be too keen on openly sharing their data. At the same time, the One Map Policy has been employing outside organizations to aid in developing the base maps and associated thematic maps, but WRI is pushing for the government to become more involved in the mapping process itself and to take the lead in the next stage of the project. Administration changes are making this issue even more complex. Currently, the present administration is stepping back from their promise of transparency and open-source spatial data, frustrating WRI’s attempts to facilitate multi-stakeholder meetings (Anne Rosenbarger, pc, 30 Nov 2016). The unreliable nature of politics has led many communities to develop their own maps. This is represented by a range of names associated with mapping strategies, including participatory mapping, community mapping, counter-mapping, and bottom-up GIS, all of which involve identifying local resources, delineating land claims and current land use, and tracing historically/culturally significant areas (Warren, 2005; Robbins, 2003). By empowering communities who would otherwise be silenced, GIS can in fact be used to liberate marginalized groups (Pickles 1995; Robbins, 2003). The majority of organizations I contacted were involved in some way with participatory mapping: Wisnu uses it to plan community-managed eco-tourism businesses (Suarnatha, p.c., 16 Nov 2016); SEKALA uses it to help communities show current land use strategies (Widiastuti, pc, 9 Nov 2016; Ketut, pc, 29 Nov 2016); WRI uses it to protect community and indigenous rights and land claims (Anne Rosenbarger, pc, 30 Nov 2016). SEKALA was especially passionate about working with local communities and NGOs, even offering a GIS course for interested parties. The majority of participants are employees or volunteers from local NGOs and government officials from various offices (Ketut, pc, 29 Nov 2016; Widiastuti, pc, 9 Nov 2016). WRI is also heavily involved in community mapping. Anne Rosenbarger has worked with local communities before, but has taken a step back recently to work with the international corporate stakeholders. Her justification for removing herself from local mapping was that “as a foreigner, I am better suited to working with the corporate side of the issue...while working with community members is fun, it isn’t as productive (Anne Rosenbarger, pc, 30 Nov 2016)”. I was surprised to hear her say this and for her to realize what she represented to local communities: a foreigner coming in and mapping their lands without fully understanding their culture, history, and language. It is heartening to hear a researcher acknowledge their positionality, especially when it is about power and accountability between stakeholders. Pak Ketut additionally spoke about several weaknesses in SEKALA's GIS training course, specifically community access to technology and the feasibility of community members actively using GIS. GIS is a product of computers and the internet, and requires digital spatial data and electronic visual representations of that data (Pickles, 1995). Computers, data processing software, and servers are only a few of the supplies needed to use GIS in an analytical capacity, and thus access to this technology is limited to those with computers and telecommunications. GIS applications are subject to several restrictions, for example, groups with unequal experience with computers can create uneven relationships and undermine the ability to have fair and open discussions about the spatial data (Kyem, 2004).

27
In SEKALA's case, they work with local NGOs to use GIS on technology and software actually available to them, rather than relying on a group to purchase technology that they simply won’t use (which has happened previously when large international NGOs came to help certain groups by providing materials but no training; Ketut pc, 29 Nov 2016). While it is problematic that communities do not have access to GIS because of financial or educational barriers, it is also problematic for communities using GIS when they are unequipped to do so properly. Kyem devotes a large amount of time discussing the application of GIS within communities and on the new initiatives aimed to develop a system that will be “adaptable to inputs from ordinary citizens” and other nonofficial sources (2004). However, the “involvement of communities with little experience in the use of complex technologies (such as GIS) generated a great deal of concern among GIS scholars,” and may be detrimental to the participatory mapping movement (Kyem, 2004). If communities do not map properly, it is a waste of time, resources, and energy for all parties involved. Pak Ketut mentioned that several local NGOs and communities have mapped areas and presented their data to the government only to be rejected (sometimes multiple times; pc, 29 Nov 2016). GIS is a trailblazing tool but in the wrong hands can be misused, especially in situations of power imbalance between stakeholders. Spatial statistics and land use planning can be used to empower local communities and protect culturally important sites, but can also be used to isolate certain data, manipulate boundaries, and silence stakeholders.
Stories and Narratives “Until the lions have their historians, the history of the hunt will always glorify the hunter.” Maps become historical the instant they are created. Given the amount of time it takes to create a map, by the time it is finished something has changed. Stories and narratives about the world around us are not dissimilar from maps: they are a snapshot of the world as it is at some point in time, from one perspective that was chosen by its creator. Much like the narratives described by Cronon, “people [insist] on imposing their linear notions of progress on [Nature’s] cyclical pattern,” believing that environment can be static enough to be mapped accurately for a long period of time (1992). For instance, the Spatial Planning Law No. 26 of 2007 requires spatial plans to be evaluated every five years and revised every 20 years (Rosenbarger, 2013b). The environment and land use of a region can change dramatically in five years, especially with climate change. It is not just Indonesia that is affected by policies using inaccurate and/or outdated spatial data. In the United States, California’s water laws are based off spatial and environmental data from the 19th century (Madrigal, 2014). Not only is this data outdated, it is also outright incorrect because the data used to create those policies were collected during unusually wet years, so the recorded rainfall for those select years are inflated (above average; Madrigal, 2014). After looking into historic rainfall records, researchers discovered that water mismanagement was caused by the allocation of more water than physically existed to a growing number of stakeholders (Madrigal, 2014). Bad storytelling, or in this case bad map-making, has the potential to unbalance nature. Different actors can create wildly different interpretations from the exact same pictures and data because they are influenced by their values and beliefs, as well as their biases concerning what they want and/or expect to see in a map. As Cronon states: “where one chooses to begin and end a story profoundly alters its shape and meaning (1992).”

28
Harwell (2000) illustrates this point with a table outlining the official reported damages from the 1997-1998 Indonesian fire from different organizations (Figure 9). By having more groups involved in macro-scale mapping, these competing spatial analyses only served to increase uncertainty rather than decrease it. For example, the estimated area of burned land ranges from 96,000 hectares (Indonesian Government, Ministry of Forestry) to 8,170,000 hectares (Academic Organization, National University of Singapore: Center for Remote Sensing and Processing), an 8,410% difference.
Figure 9. Data reprinted from Harwell 2000 detailing the official size of fire-damaged lands by different groups in and outside of Indonesia. Identical imagery -- and thus identical databases -- produced these widely different estimates of burned area, indicating that spatial analyses like GIS are heavily influenced by the software user.
Storytelling is not only embodied in the map itself – at other times stories of an area accompany maps to provide context. Pak Suar talked about how Wisnu attempts to include multiple generations in the participatory planning in order to capture the history of an area as well as the younger generation’s perspective (pc, 16 Nov 2016). Maps are a way to protect and preserve a community’s stories alongside their lands.
29
These critiques are by no means reasons to cease using GIS or mapping communities; they are simply concerns to be kept in mind when using GIS during spatial planning. With or without realizing it, mapping is a very powerful tool and without due consideration can be detrimental to groups of people and/or the environment.
Personal Observations As previously mentioned, I was quite surprised how few people had heard of GIS and did not realize how often the software is used in everyday programs. The majority of the organizations I spoke with had been using GIS for the better part of 10 years and are continuing to use it to map communities across Indonesia.
Indonesia and the United States GIS is used across the United States and has been for many years. From personal experience, it is almost a requirement to getting a job in the environmental science field, and is applicable in almost any discipline. In comparison, the United States uses a much larger amount of technology and electronic devices than in Indonesia. Though nearly every Indonesian has a smartphone, very few cars or taxis have GPS, and few businesses have computers capable of analyzing large datasets. Even on university campuses there are not many computers. None of the boats I took had electronic navigation, whereas in the United States every boater, recreation, commercial, or otherwise has a GPS and/or sonar. These observations, while few, put the application of GIS in context. Studying geography at an American university puts me in a unique, albeit isolated, position. A great deal of the software I take for granted is difficult to access in Indonesia, if it is even available at all. Indonesian politics and the vast amount of land waiting to be mapped with GIS is daunting, whereas the United States has been mapped many times over. In the United States, finding open source data is very easy and there is little worry that the base maps do not correlate, unlike in Indonesia.
Data Networking At the start of my fieldwork I contacted two companies, and after only a few interviews I had contacts at many other groups around Bali. Pak Ketut from SEKALA spoke multiple times about his work with NGOs throughout Indonesia (Ketut, pc, 29 Nov 2016). In December 2016 he was coordinating a meeting with 13 to 15 different NGOs and always completes a project in partnership with dozens of other organizations. SEKALA appears to be a unique situation because it was created after Pak Ketut had created working relationships with NGOs because of his work with the World Wildlife Fund (WWF). Other organizations, including Wisnu, Gringgo, and BaliFokus have similar connections to NGOs around Indonesia but to a lesser degree than SEKALA. Below is a rough outline of the relationships I observed during my fieldwork (Figure 10). There is no way that I recorded all of their interactions nor did I come close to tracking all of the environmental organizations around Bali, let alone across Indonesia.

30
Figure 10. Network analysis of Environmental Groups in and around Bali, Indonesia. The two central stakeholders in most spatial planning scenario are the government and communities. Other organizations – the ones most likely to have and apply GIS software – are secondary actors and help facilitate the process of developing spatial plans and land use policies.
Final Thoughts: Future Applications of GIS As Harwell writes, “GIS has become the battleground and the very means by which different viewpoints are argued is a consequence, not of the inherent or ontological superiority of GIS as a source of ‘truth’, but of specific historical and social moments (2000).” Every application of GIS is socially driven, along with the maps produced by the analyses. Each map has a specific scale and perspective, a background of different stakeholders, and tells a unique story; by ignoring these aspects of a map and believing the data to be unbiased, it is highly likely that the map will be misunderstood or cause uncertainty in an analysis. Land maps in general are designed to simplify the complex, to focus the perspective, and to make the region legible to an outsider (Scott J, 1998). Those that need GIS the most are often the worst-equipped to deal with the technological and training demands required by the software. Few organizations, let alone communities or individuals, own computers strong enough to handle spatial analyses and have the time to dedicate to learning the software coding to properly use the system.
31
Because of these barriers, GIS is used disproportionately across different groups, with more users in international NGOs, the government, and private companies than in smaller NGOs or at the community level. It is important to remember the power spatial planning wields over an area and to consider all of the stakeholders equally. During the mapping process, it is important to note what scale you are working at and why. What perspectives are missing from the scale you are using? Can you use a different scale to better analyze the data? The data needs to be verified, and any stakeholder meetings need to be conducted in a fair environment (note that how to facilitate such a meeting is well beyond the scope of this paper). Ask about where your data came from; has it been compared to other datasets and /or verified? Do the stakeholders have equal influence on the spatial planning? And lastly, when producing visuals of spatial data, make sure the framing, the colors, and the visible data layers are appropriate and fit with the story you are trying to tell. Why did you conduct these spatial analyses? Do you see that in the final product? As helpful as GIS is in many research settings, the importance of field work and fine-scale research methodologies should not be forgotten. A balance needs to be found between technology and field-work, as both are important and offer different representations of the world around us. Technology should continue to be adapted to and applied to current issues, but ground-truthing should always be utilized so the ‘true’ picture is not lost. GIS may seem like the easy way out, but researchers have the obligation to make sure that everyone's’ voices are heard, which may often require canoe trips and talking to farmers in their fields. Before considering using GIS in your work, you need to consider the funding available to your organization and whether the cost of the license is worth the benefit of using a reliable platform. ESRI’s ArcGIS is one of the most widely-used platforms but costs thousands of dollars annually. There is interest in developing an open-source GIS platform, and Pak Ketut referenced me to quantum GIS (QGIS; Ketut, pc, 29 Nov 2016); however this platform is still in development and bugs likely persist, but updates are released regularly (QGIS, http://www.qgis.org/en/site/). It takes training to learn the interface for different GIS software as well as some coding experience, but tutorials are easy to find and universities generally offer courses. You also need access to spatial data, either open-source data available online, or collected by your organization. Making GIS publically accessible or using it to develop maps for public consumption requires further work, including map production, verifying open-source data, and/or developing GIS within an app (i.e., similar to Gringgo’s app, Figure 7). This technology is not going anywhere. In fact, it is still growing, both in scope and scale. Thus, it would be smart to get involved in GIS, as long as you have an active use for spatial analyses and are cognizant of the numerous critiques of GIS.
Conclusions GIS is one of the most versatile tools available to manage spatial analyses and a key component to land use planning and advising policy decisions. To use GIS properly, you need to understand the historical context of an area, the current land use policies influencing spatial planning, and the dynamics of interested stakeholders. Indonesia is a unique region in that it is relatively new to national-scale mapping and is still working to revise its policies and create a logical base map under the One Map Policy.

32
Land use planning across Indonesia is synonymous with stakeholder conflict and competition, often involving communities struggling to claim their lands and investors working to find lands to develop, and between them is the government, who has promoted both economic development and the protection of community rights. A significant reason this problem remains unsolved is that technologies like GIS cannot be easily applied to issue involving ideological conflicts sustained by values (Kyem, 2004). Stakeholders – and the organizations facilitating spatial planning – need to realize that GIS is not a solution to every problem. In fact, there are several key concerns that need to be considered whenever utilizing GIS. From three weeks of fieldwork, I learned that GIS is widely used across Indonesia, but only by companies, NGOs, and governmental agencies. Even then, not many people immediately recognize the name or purpose of GIS. Of the organizations using GIS, the majority appear to be cognizant of the weaknesses of GIS: namely, issues of proper scale, relations of power between stakeholders, and the similarity and influence of narratives and maps. While this make me optimistic that GIS will continue to be used ethically, the possibility still exists that it may be used to favor one group over another in future years. How GIS is used within and between organizations needs to continue to be assessed. All of the organizations that I spoke with have relatively consistent interactions with one another, which will likely make each individual organization accountable. The future of GIS is uncertain, but like nearly all technology, it will probably change consistently for many years to come. Traditional platforms are being replaced by open-source platforms like Q-GIS. Though free and open to the public, they have not yet replaced the original GIS software platforms such as Google and ESRI. Organizations across Indonesia should continue to be involved in community mapping and spatial data collection in order to develop the best spatial plans and land use strategies.
Recommendations for Further Study GIS will continue to grow and expand its capabilities in the near future, so continuing to investigate how organizations utilize this software, including how GIS has changed over time, is highly recommended. The issues Indonesia faces regarding spatial analyses and land use planning are not going to disappear any time soon, if not become even worse. Environmental issues are infamous for their longevity and delayed impact, and climate change will continue to threaten Indonesia's spatial plans and development projects. Further, understanding how to use GIS more efficiently can help save organizations time, energy, and money. The One Map Policy will continue to be a very interesting avenue of research, especially in upcoming years. The Indonesian government is still working to create its base map and its accompanying thematic data layers, and whether they will meet their goal in 2019 has yet to be seen. On a personal note, I plan to continue this project as my honors senior thesis for the South Carolina Honors College. I will be staying in contact with my informants and continuing to email those organizations I have yet to hear back from. I may choose to expand my project to include American NGOs, to compare how they use GIS with my fieldwork in Indonesia. I hope to use this report as a springboard for my senior thesis, and to investigate the One Map Policy further and describe the NGOs’ projects in further detail.

33
Bibliography
Personal Communications Gede, Awan personal communication, 9 November 2016, SEKALA Office: Seminyak, Bali (Ketut) Muliastra, Yohanes I Ketut Deddy, personal communication, 29 November 2016, SEKALA Office:
Seminyak, Bali Kurnianingsih, Atiek. Personal communication, 24 November 2016, Email
Kurniawan, Nanang Indra. Personal communication, 24 November 2016, Email Pouillion, Oliver. Personal communication, 15 November 2016, Telephone Rosenbarger, Anne. Personal communication, 30 November 2016, Nook Café: Seminyak, Bali Suarnatha,I Made. Personal communication, 16 November 2016, Wisnu Office: Seminyak, Bali Widiastuti, Franciska. Personal communication, 9 November 2016, SEKALA Office: Seminyak, Bali Widiastuti, Franciska. Personal communication, 11 November 2016, Email Widiastuti, Franciska. Personal communication, 14 November 2016, Email Widiastuti, Franciska. Personal communication, 15 November 2016, Email
Sources Cited Badan Informasi Geospasial, BIG (2016). Home. Accessed Nov 2016.
<http://tanahair.indonesia.go.id/home> Bergen, M. (4 October 2016). What you need to know about palm oil in 5 charts. Human Nature:
Conservation International Blog. <http://blog.conservation.org/2016/10/what-you-need-to-know-about-palm-oil-in-5-charts>
Cronon, W. (1992). A place for stories: Nature, history, and narrative. Journal of American History. 78(4):
1347-1376 Dalem, A.G. R. Lecture “Cultural Tourism,” 18 October 2016, SIT Bali Program Center, Kerambitan
Gingold, Beth, A. Rosenbarger, Y. I. K. D. Muliastra, F. Stolle, I. M. Sudana, M. D. M. Manessa, A.
Murdimanto, S. B. Tiangga, C. C. Madusari, and P. Douard. 2012. “How to identify degraded land for sustainable palm oil in Indonesia.” Working Paper. World Resources Institute and Sekala, Washington D.C. Available online at http://wri.org/ publication/identifying-degraded-land-sustainable-palm-oil-indonesia.
34
GooglePlay (2016a). Geospasial Indonesia. Accessed Nov 2016. <https://play.google.com/store/apps/details?id=com.khairu.habib.inageoportal&hl=en>
GooglePlay (2016b). Gringgo. Accessed Nov 2016.
<https://play.google.com/store/apps/details?id=co.gringgo.gringgomobile&hl=en> Harwell, E. (2000). Remote sensibilities: Discourses of technology and the making of Indonesia’s natural
disaster. Development and Change. 31: 307-340. Hodgson, M.(2015a). Lecture “Introduction to GIS,” 24 August 2015, University of South Carolina –
Columbia Hodgson, M. (2015b). Lecture “Data Sources,” 9 Sept ember 2015, University of South Carolina –
Columbia Jannah, K. (10 November 2015). Indonesia bakal punya one map policy, apa itu? Economy.
<http://economy.okezone.com/read/2015/11/10/320/1246914/indonesia-bakal-punya-one-map-policy-apa-itu>
Jong, H. (22 July 2016). One map policy success hinges on local involvement. Jakarta Post.
<http://www.thejakartapost.com/news/2016/07/22/one-map-policy-s-success-hinges-local-involvement.html>
Konsorsium Pembaruan Agraria, KPA . About. Accessed Nov 2016.
<http://www.kpa.or.id/news/organisasi/profil-singkat-konsorsium-pembaruan-agraria> Konsorsium Pembaruan Agraria, KPA. (2012). Laporan Akhir Tahun 2012 . “Terkuburnya keadilan
agrarian bagi rakyat melalui reforma agrarian.” Konsorsium Pembaruan Agraria, KPA. (2013). Laporan Akhir Tahun 2013. “Warisan buruk masalah
agrarian di bawah kekuasaan SBY.” Konsorsium Pembaruan Agraria, KPA. (2014). Catatan Akhir Tahun 2014. “Membenahi masalah agrarian:
Prioritas kerja Jokowi-JK Pada 2015.” Konsorsium Pembaruan Agraria, KPA. (2015). Catatan Akhir Tahun 2015 . “Reforma agrarian dan
penyelesaian konflik agrarian disandera birokrasi.” Kurniawan, N. I. (12 May 2016). Getting the One Map Policy Right. Indonesia at Melbourne.
<http://indonesiaatmelbourne.unimelb.edu.au/getting-one-map-policy-right/> Kyem, P.A. (2004). Of intractable conflicts and participatory GIS applications: The search for consensus
amidst competing claims and institutional demands. Annals of the Association of American Geographers. 94(1): 37-57
Lorenzen, R. & Roth, D. (2015). Paradise contested: Culture, politics, and changing land and water use in
Bali. The Asia Pacific Journal of Anthropology. 16(2): 99-105

35
Lubis, M. and Langston, J. (2015). Understanding landscape change using participatory mapping and geographic information systems: Case study in North Sulawesi, Indonesia. Proecedia Environmental Sciences. 24: 206-214
Madrigal, A. (2014) American Aqueduct: The Great California Water Saga. The Atlantic, February 24,
2013. Nurdin, I. (2014). Resolving agrarian conflict through implementation of land reform by collaboration of
CO and local government in Indonesia. In: Paper Presented at the 2014 World Bank Conference of Land and Poverty, Washington DC.
Oxford Business Group. (2015). Indonesia introduces one map policy as a solution to overlapping land
claims. <https://www.oxfordbusinessgroup.com/overview/indonesia-introduces-one-map-policy-solution-overlapping-land-claims>
Picard, M. (1986). “Cultural tourism” in Bali: Cultural performances as tourist attraction. Revised Paper
initially presented at the International Workshop on Indonesian Studies, Balinese State and Society: Historical, Textual, and Anthropological Approaches. Leiden, April 21-24, 1986.
Pickles, J. (1995). “Representations in an electronic age: Geography, GIS, and democracy”. Chapter in
Ground Truth: The Social Implications of Geographic Information Systems. New York: The Guilford Press
Riggs, R. et al. (2016). Forest tenure and conflict in Indonesia: Contested right in Rempek Village,
Lombok. Land Use Policy. 57: 241-249 QGIS. Home. Accessed Nov 2016. <http://www.qgis.org/en/site> Robbins, P. (2003). Beyond ground truth: GIS and the environmental knowledge of herders, professional
foresters, and other traditional communities. Human Ecology. 31(2): 233-253 Rosenbarger, A., et al. (2013a). Issue Brief: How to change legal land use classifications to support more
sustainable palm oil in Indonesia. World Resources Institute. Rosenbarger, A., et al. (2013b). Appendices A-C: How to change legal land use classifications to support
more sustainable palm oil in Indonesia. World Resources Institute. Salim, T. (26 December 2014). One map policy helps resolve land disputes and overlapping permits.
Jakarta Post. <http://www.thejakartapost.com/news/2014/12/26/one-map-policy-helps-resolve-land-disputes-overlapping-permits.html>
Scott, J.C. (1998). “Nature and Space.” Chapter in Seeing Like a State. New Haven: Yale University Press SEKALA, Nordic Consulting Group, & Papuan Civil Society Strengthening Foundation (2008). A strategic
assessment of spatial planning options for Papua province. SEKALA (2014). Modul pelatihan dasar SIG dengan quantum GIS 2.4.0 Chugiak.

36
Spatial Informatics Group. One Map-Indonesia. Accessed Nov 2016. <https://sig-gis.com/projects/one-map-indonesia>
Strauβ, S. (2015). Alliances across Ideologies: Networking with NGOs in a Tourism Dispute in Northern
Bali. The Asia Pacific Journal of Anthropology. 16(2): 123-140. Tagliarino, N. (2016). Working Paper: Encroaching on land and livelihoods: How national expropriation
laws measure up against international standards. World Resources Institute. Vaessen, S. (15 September 2016). Indonesia: Plastic tax to curb rubbish dumped in rivers. Al Jazeera
Correspondent. <http://www.aljazeera.com/news/2016/09/indonesiaplastictaxcurbrubbishdumpedrivers160915073853961.html>
Warren, C. (2005). Community mapping, local planning, and alternative land use strategies in Bali.
Geografisk Tidsskrift-Danish Journal of Geography. 105(1): 29-41. World Resources Institute. Forest and Landscapes Indonesia. Accessed Nov 2016.
<http://www.wri.org/our-work/project/forests-and-landscapes-indonesia> World Resources Institute. Suitability Mapper. Accessed Nov 2016.
<http://www.wri.org/resources/maps/suitability-mapper>
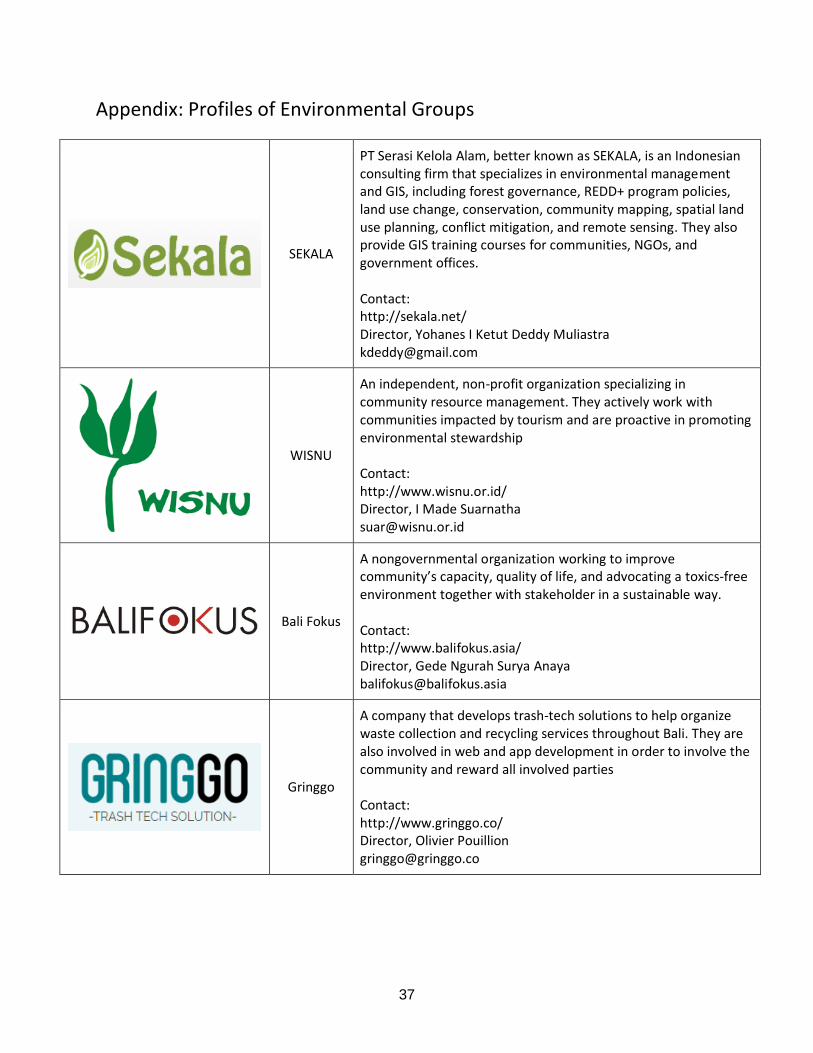
37
Appendix: Profiles of Environmental Groups
SEKALA
PT Serasi Kelola Alam, better known as SEKALA, is an Indonesian consulting firm that specializes in environmental management and GIS, including forest governance, REDD+ program policies, land use change, conservation, community mapping, spatial land use planning, conflict mitigation, and remote sensing. They also provide GIS training courses for communities, NGOs, and government offices. Contact: http://sekala.net/ Director, Yohanes I Ketut Deddy Muliastra [email protected]
WISNU
An independent, non-profit organization specializing in community resource management. They actively work with communities impacted by tourism and are proactive in promoting environmental stewardship Contact: http://www.wisnu.or.id/ Director, I Made Suarnatha [email protected]
Bali Fokus
A nongovernmental organization working to improve community’s capacity, quality of life, and advocating a toxics-free environment together with stakeholder in a sustainable way. Contact: http://www.balifokus.asia/ Director, Gede Ngurah Surya Anaya [email protected]
Gringgo
A company that develops trash-tech solutions to help organize waste collection and recycling services throughout Bali. They are also involved in web and app development in order to involve the community and reward all involved parties Contact: http://www.gringgo.co/ Director, Olivier Pouillion [email protected]
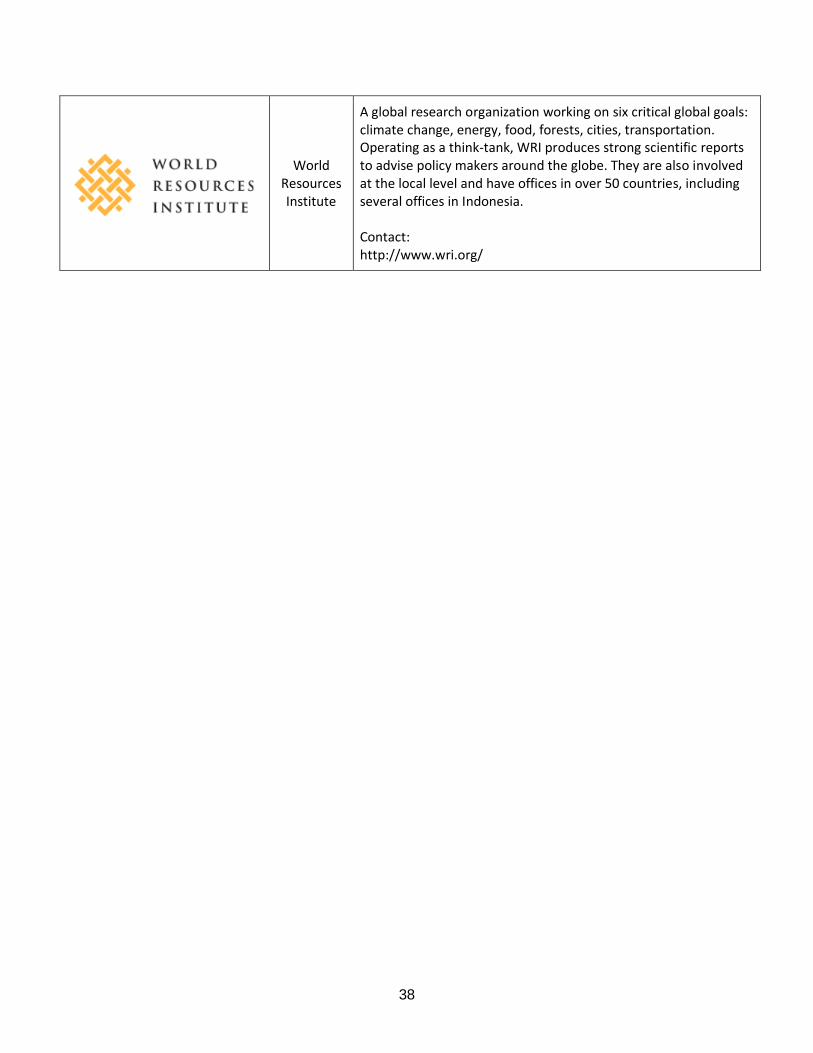
38
World Resources Institute
A global research organization working on six critical global goals: climate change, energy, food, forests, cities, transportation. Operating as a think-tank, WRI produces strong scientific reports to advise policy makers around the globe. They are also involved at the local level and have offices in over 50 countries, including several offices in Indonesia. Contact: http://www.wri.org/


![Transmission Distribution and Utilization [15EE52T]](https://static.fdokumen.com/doc/165x107/6328d58109048e4b7c061729/transmission-distribution-and-utilization-15ee52t.jpg)