geosciences - MDPI
33
geosciences Article Are We There Yet? A Review and Assessment of Archaeological Passive Airborne Optical Imaging Approaches in the Light of Landscape Archaeology Geert J. Verhoeven ID Ludwig Boltzmann Institute for Archaeological Prospection & Virtual Archaeology (LBI ArchPro), Franz-Klein-Gasse 1, A-1190 Vienna, Austria; [email protected] Received: 18 August 2017; Accepted: 11 September 2017; Published: 14 September 2017 Abstract: Archaeologists often rely on passive airborne optical remote sensing to deliver some of the core data for (European) landscape archaeology projects. Despite the many technological and theoretical evolutions that have characterised this field of archaeology, the dominant aerial photographic surveys, but also less common approaches to archaeological airborne reconnaissance, still suffer from many inherent biases imposed by sub-par sampling strategies, cost, instrument availability and post-processing issues. This paper starts with the concept of landscape (archaeology) and uses it to frame archaeological airborne remote sensing. After introducing the need for bias reduction when sampling an already distorted archaeological population and expanding on the ‘theory-neutral’ claim of aerial survey, the paper presents eight key characteristics that all have the potential to increase or decrease the subjectivity and bias when collecting airborne optical imagery with passive sensors. Within this setting, the paper then offers some technological-methodological reflection on the various passive airborne optical imaging solutions that landscape archaeology has come to rely upon in the past decades. In doing so, it calls into question the effectiveness and suitability of these highly subjective approaches for landscape archaeology. Finally, the paper proposes a new, more objective approach to aerial optical image acquisition with passive sensors. In the discussion, the text argues that the suggested exhaustive (or total) airborne sampling of the preserved archaeological record might transcend particular theoretical paradigms, while the data generated could span various interpretational perspectives and oppositional analytical approaches in landscape archaeology. Keywords: aerial archaeology; aerial photography; aerial reconnaissance; airborne imaging spectroscopy; archaeological record; archaeological theory; bias; landscape archaeology; multispectral imaging; survey bias 1. Setting the Scene Archaeology becomes more specialised by the day as it continuously integrates new subjects and methods. To properly combine and integrate these methods, reflection is needed. This reflectivity means to assess data acquisition and the grounds on which archaeological interpretations rest [1]. Although some have criticised the general lack of theoretical reflexivity in remote sensing archaeology [2], this specific discipline has seen reflection by archaeologists working in the field. They tried to critically assess how the interpretation of remotely-sensed data can shape the understanding of past cultural and physical landscapes, identify pitfalls in current and future practice and question why things are done the way they are done (e.g., [3–9]). Most papers that tackled the use of remote sensing products in the wider framework of landscape archaeology have thus approached the subject from a more interpretational angle rather than a purely methodological-technological one. Geosciences 2017, 7, 86; doi:10.3390/geosciences7030086 www.mdpi.com/journal/geosciences
-
Upload
khangminh22 -
Category
Documents
-
view
0 -
download
0
Transcript of geosciences - MDPI

geosciences
Article
Are We There Yet? A Review and Assessmentof Archaeological Passive Airborne Optical ImagingApproaches in the Light of Landscape Archaeology
Geert J. Verhoeven ID
Ludwig Boltzmann Institute for Archaeological Prospection & Virtual Archaeology (LBI ArchPro),Franz-Klein-Gasse 1, A-1190 Vienna, Austria; [email protected]
Received: 18 August 2017; Accepted: 11 September 2017; Published: 14 September 2017
Abstract: Archaeologists often rely on passive airborne optical remote sensing to deliver someof the core data for (European) landscape archaeology projects. Despite the many technologicaland theoretical evolutions that have characterised this field of archaeology, the dominant aerialphotographic surveys, but also less common approaches to archaeological airborne reconnaissance,still suffer from many inherent biases imposed by sub-par sampling strategies, cost, instrumentavailability and post-processing issues. This paper starts with the concept of landscape (archaeology)and uses it to frame archaeological airborne remote sensing. After introducing the need for biasreduction when sampling an already distorted archaeological population and expanding on the‘theory-neutral’ claim of aerial survey, the paper presents eight key characteristics that all have thepotential to increase or decrease the subjectivity and bias when collecting airborne optical imagerywith passive sensors. Within this setting, the paper then offers some technological-methodologicalreflection on the various passive airborne optical imaging solutions that landscape archaeologyhas come to rely upon in the past decades. In doing so, it calls into question the effectivenessand suitability of these highly subjective approaches for landscape archaeology. Finally, the paperproposes a new, more objective approach to aerial optical image acquisition with passive sensors.In the discussion, the text argues that the suggested exhaustive (or total) airborne sampling of thepreserved archaeological record might transcend particular theoretical paradigms, while the datagenerated could span various interpretational perspectives and oppositional analytical approaches inlandscape archaeology.
Keywords: aerial archaeology; aerial photography; aerial reconnaissance; airborne imagingspectroscopy; archaeological record; archaeological theory; bias; landscape archaeology; multispectralimaging; survey bias
1. Setting the Scene
Archaeology becomes more specialised by the day as it continuously integrates new subjects andmethods. To properly combine and integrate these methods, reflection is needed. This reflectivitymeans to assess data acquisition and the grounds on which archaeological interpretations rest [1].Although some have criticised the general lack of theoretical reflexivity in remote sensingarchaeology [2], this specific discipline has seen reflection by archaeologists working in the field.They tried to critically assess how the interpretation of remotely-sensed data can shape theunderstanding of past cultural and physical landscapes, identify pitfalls in current and future practiceand question why things are done the way they are done (e.g., [3–9]). Most papers that tackled the useof remote sensing products in the wider framework of landscape archaeology have thus approachedthe subject from a more interpretational angle rather than a purely methodological-technological one.
Geosciences 2017, 7, 86; doi:10.3390/geosciences7030086 www.mdpi.com/journal/geosciences

Geosciences 2017, 7, 86 2 of 33
This paper tries to fill this gap. It results from the author’s more general concern with theeffectiveness of archaeological airborne reconnaissance (see also [10–12]). It reflects on how amore systematic approach to passive airborne optical imaging could yield data that can be usedby practitioners of different archaeological theoretical viewpoints. The intention of this paper is toreflect on—and encourage a critical approach to—passive airborne optical imaging for the benefitof landscape archaeology. The text is, however, not a simplistic manifesto to blindly enforce passiveoptical airborne imaging. Remote sensing data can never be a mandatory or sole source to investigatingthe landscape. Landscape archaeology must be holistic or ‘total’ by building up a complementarybody of data from multiple distinct survey approaches [13–15] which, when properly integrated,constitute a digital landscape [16] to explore. Obviously, some specific techniques such as pollenanalyses or toponymy may have greater importance than repeated airborne surveys dependingon the character of the area, the time and money available for the project and the questions beingasked [17,18]. These fitness-for-purpose issues are, however, not a part of this article’s core scope.The text simply assumes that if a given archaeological landscape project uses remotely sensed opticalimagery, they are considered a valid data source to help answer some of the project-specific questions,despite some uncontrollable environmental and climatological biases that might characterise thesedata. Nevertheless, this assumption does not mean that the subjectivity, which characterises manyof the controllable parameters of current passive airborne optical image acquisitions, should not becritiqued. Moreover, the author explains in the conclusion that much of the discussion about theappropriateness of existing airborne imaging methodologies is skewed exactly because of the failureto properly address and resolve the survey methodology issues that this paper tackles.
Overall, the author asks if an ‘optimisation’ of the dominant airborne sampling paradigmscan remove many of the current inherent, but controllable, biases and as such, render the airbornedata acquisition phase less subjective, and, in turn, yield a more consistent record to study ourpast? Thus, the article begins with an introduction to the often ambiguous concepts of landscape andlandscape archaeology, followed by a short overview of archaeological remote sensing. Both sectionswill introduce some key concepts that are vital to evaluate the remaining parts of the paper. Startingfrom a discussion of the archaeological record and the obligatory samples that are acquired from it,the paper then reviews all the main passive airborne optical imaging approaches that have been used inthe past decade. It identifies their strengths and weaknesses regarding eight particular key concepts tohighlight their inherent sampling shortcomings and major biases. Following this, the case is made for amore objective approach to aerial optical image acquisition with passive sensors, using a geographicaltotal coverage approach and consistent imaging in particular narrow spectral bands, combined with alarge degree of computer-based automation in post-processing. Although the perspective is rathertechnical-methodological, landscape archaeology frames this review. Also, the article considers andcomments on some of the different theoretical contexts surrounding these remote observations.
1.1. The Vogue but Vague Concepts of Landscape (Archaeology)
Depending upon research context, the definition and interpretation of the term ‘landscape’changes [19–22]. This disparity in definitions of, and views on, landscape makes it sometimesvery difficult to communicate clearly, certainly when the debate is focused on the archaeologicalstudy of landscapes. However, even among archaeologists, there is no consensus on the notion oflandscape, simply because it remains very challenging to theoretically define concepts of space andplace [23]. During the past decades, landscape has become an overused, integrated term, encapsulatinga certain amount of human as well as environmental aspects of a delimited area of land. This meansthat landscape not only includes the combined effects of fauna and flora, geology, topography,soils, waterways and climate, but it also incorporates the cumulative cultural imprints created bysettlement building, ploughing, herding, polluting and travelling [24]. This amalgam of environmentaland anthropogenic processes has constantly changed in proportion and intensity across space andthrough time, both very often at vastly different scales. As such, landscapes can be summarised as

Geosciences 2017, 7, 86 3 of 33
complex, vague, messy entities that are uninterruptedly shaped through human engagement withthem [25,26]; they only possess defined spatial and temporal limits when imposed by analyticalprocedures and intellectual traditions [27].
Notwithstanding their complexity and vagueness, ‘understanding landscapes’ is the central aimof landscape archaeology. This archaeological sub-discipline emerged in the mid-1970s [28] and ishere roughly defined as the study of all environmental and sociocultural variables influencing themutual interaction (both physical and perceptual) of humans with their natural environment [29,30].This means that landscape archaeology is “about what lies beyond the site, or the edge of theexcavation” [31] (p. 3), landscape being the physical reality comprising all anthropogenic features andtheir natural context that exist across space, collectively called ‘the land’. In other words, the culturalspaces or rather diffuse human traces such as roads, land division systems or isolated artefacts inbetween hot spots of activity (traditional ‘sites’) [32]. This perspective was framed in what becameknown as distributional archaeology [33], non-site archaeology [34], siteless archaeology [35,36] oroff-site archaeology [37].
This process of filling the gaps between the sites gradually became the practical implementationof landscape archaeology since the 1980s, providing valuable information about human exploitationof the environment. However, it also reminded archaeologists of all the possible, subtle or obvious,recursive and mutual interactions of human presence with the land through space and time as well asthe strict non-physical aspect of landscape. One that im- or explicitly relates to the various layers ofcultural meaning and human value [24,38,39]. Therefore, landscape archaeology is undoubtedly alsoabout how these physical realities are perceived, culturally and socially exploited, understood andgiven meaning (i.e., ‘land-scaped’) by past and current human presence [31,40–42]. Landscapes areaccepted as being polysemous: geometric, quantitative and economic, but also qualitative, subjectivelyperceived and socially constructed [43,44]. In other words: landscapes structure and are structured byus; landscapes move, and they move us too [26]. Finally, being the multi-temporal present product ofsuperpositioned and intermingled temporalities, landscapes should not be metaphorically described aspalimpsests. In a palimpsest, everything gets erased, but not necessarily so in a landscape. This giveslandscapes their cluttered, complex and messy character [45] in which function and meaning are notseparable [40].
Bringing the diverse intellectual trends in archaeological theory together with the fact that one candescribe landscape only contentiously and ambiguously, has led to several incarnations of landscapearchaeology. In other words, a broad array of practices, theories, and tools have emerged to produceknowledge about the physicality and meaning of landscapes in the past [46–49]. Despite this variety ofapproaches, much European archaeological landscape research has relied on (and still relies on) remotesensing data (although the incorporation of remote sensing methods in landscape archaeology is veryvariable when considered globally). This relationship should not come as a surprise. Even though theyare characterised by diffuse physical and cultural boundaries, a landscape implies a meaningful placefor everyday human living. Although the boundaries of these inhabiting and experiencing areas havechanged through time, landscape can be considered a concept with an intermediate spatial extent,representing a human scale of lived experience for most of history [24,50]. Being larger than a complexof sites, a landscape has the ideal spatial extent to be observed from above.
1.2. Archaeological Remote Sensing
Archaeology was one of the first disciplines to use remote sensing in scientific investigations [51].As soon as it became apparent that excavations alone did not provide sufficient clues for understandingthe various aspects of past settlements and their transformation over time, ‘auxiliary’ approaches suchas geophysical survey, surface artefact collection and airborne reconnaissance were brought in [52,53].Although these approaches initially focused on finding ‘sites’ for excavation, they were instrumentalin the development of landscape archaeology (see also Section 3). Today, there is a large consensusamong archaeologists that remote sensing encompasses a range of useful observational techniques
Geosciences 2017, 7, 86 4 of 33
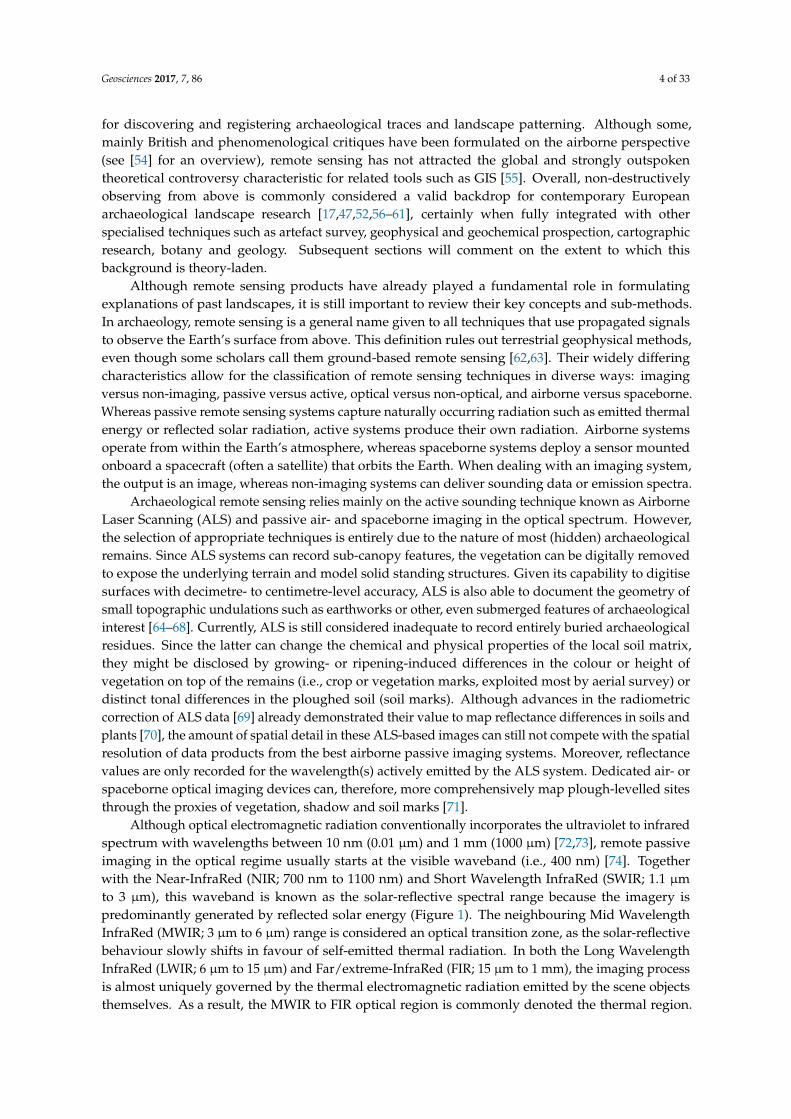
for discovering and registering archaeological traces and landscape patterning. Although some,mainly British and phenomenological critiques have been formulated on the airborne perspective(see [54] for an overview), remote sensing has not attracted the global and strongly outspokentheoretical controversy characteristic for related tools such as GIS [55]. Overall, non-destructivelyobserving from above is commonly considered a valid backdrop for contemporary Europeanarchaeological landscape research [17,47,52,56–61], certainly when fully integrated with otherspecialised techniques such as artefact survey, geophysical and geochemical prospection, cartographicresearch, botany and geology. Subsequent sections will comment on the extent to which thisbackground is theory-laden.
Although remote sensing products have already played a fundamental role in formulatingexplanations of past landscapes, it is still important to review their key concepts and sub-methods.In archaeology, remote sensing is a general name given to all techniques that use propagated signalsto observe the Earth’s surface from above. This definition rules out terrestrial geophysical methods,even though some scholars call them ground-based remote sensing [62,63]. Their widely differingcharacteristics allow for the classification of remote sensing techniques in diverse ways: imagingversus non-imaging, passive versus active, optical versus non-optical, and airborne versus spaceborne.Whereas passive remote sensing systems capture naturally occurring radiation such as emitted thermalenergy or reflected solar radiation, active systems produce their own radiation. Airborne systemsoperate from within the Earth’s atmosphere, whereas spaceborne systems deploy a sensor mountedonboard a spacecraft (often a satellite) that orbits the Earth. When dealing with an imaging system,the output is an image, whereas non-imaging systems can deliver sounding data or emission spectra.
Archaeological remote sensing relies mainly on the active sounding technique known as AirborneLaser Scanning (ALS) and passive air- and spaceborne imaging in the optical spectrum. However,the selection of appropriate techniques is entirely due to the nature of most (hidden) archaeologicalremains. Since ALS systems can record sub-canopy features, the vegetation can be digitally removedto expose the underlying terrain and model solid standing structures. Given its capability to digitisesurfaces with decimetre- to centimetre-level accuracy, ALS is also able to document the geometry ofsmall topographic undulations such as earthworks or other, even submerged features of archaeologicalinterest [64–68]. Currently, ALS is still considered inadequate to record entirely buried archaeologicalresidues. Since the latter can change the chemical and physical properties of the local soil matrix,they might be disclosed by growing- or ripening-induced differences in the colour or height ofvegetation on top of the remains (i.e., crop or vegetation marks, exploited most by aerial survey) ordistinct tonal differences in the ploughed soil (soil marks). Although advances in the radiometriccorrection of ALS data [69] already demonstrated their value to map reflectance differences in soils andplants [70], the amount of spatial detail in these ALS-based images can still not compete with the spatialresolution of data products from the best airborne passive imaging systems. Moreover, reflectancevalues are only recorded for the wavelength(s) actively emitted by the ALS system. Dedicated air- orspaceborne optical imaging devices can, therefore, more comprehensively map plough-levelled sitesthrough the proxies of vegetation, shadow and soil marks [71].
Although optical electromagnetic radiation conventionally incorporates the ultraviolet to infraredspectrum with wavelengths between 10 nm (0.01 µm) and 1 mm (1000 µm) [72,73], remote passiveimaging in the optical regime usually starts at the visible waveband (i.e., 400 nm) [74]. Togetherwith the Near-InfraRed (NIR; 700 nm to 1100 nm) and Short Wavelength InfraRed (SWIR; 1.1 µmto 3 µm), this waveband is known as the solar-reflective spectral range because the imagery ispredominantly generated by reflected solar energy (Figure 1). The neighbouring Mid WavelengthInfraRed (MWIR; 3 µm to 6 µm) range is considered an optical transition zone, as the solar-reflectivebehaviour slowly shifts in favour of self-emitted thermal radiation. In both the Long WavelengthInfraRed (LWIR; 6 µm to 15 µm) and Far/extreme-InfraRed (FIR; 15 µm to 1 mm), the imaging processis almost uniquely governed by the thermal electromagnetic radiation emitted by the scene objectsthemselves. As a result, the MWIR to FIR optical region is commonly denoted the thermal region.

Geosciences 2017, 7, 86 5 of 33
When the imager uses different spectral bands or channels to capture the reflected or thermal energy,the terms ‘multi-’ or ‘hyper-’ spectral apply.
Geosciences 2017, 7, 86 5 of 33
When the imager uses different spectral bands or channels to capture the reflected or thermal energy, the terms ‘multi-’ or ‘hyper-’ spectral apply.
Figure 1. The divisions of the optical electromagnetic spectrum (* VUV does not perfectly correspond to UV-D. While VUV runs from 10 nm to 200 nm and FUV from 200 nm to 280 nm, UV-D encompasses the 10 nm to 100 nm region and UV-C the 100 nm to 280 nm zone).
Archaeology relies often on multi-spectral satellite sensors to record archaeologically-induced reflectance differences in soil and vegetation [75–79]. It is the combination of an ever increasing spatial and spectral resolving power combined with the frequency by which they can cover large areas of interest and their inherent synoptic perspective (i.e., footage with an extensive spatial coverage) that provide many interesting opportunities for landscape archaeologists when compared to conventional aerial imagery. Besides, satellite sensors can image areas that have limited or no access due to airspace restrictions, bureaucratic red tape or other obstacles to reconnaissance. However, the comparatively limited spatial resolution of spaceborne imagery limits its utility for the discovery and detailed recording of smaller landscape features. When one needs to spatially resolve the soil and vegetation marks that result from small features (such as pits and postholes), an airborne vantage point remains still superior. As a result, satellite reconnaissance is better suited for mapping large-scale and broad landscape features such as paleochannels or detecting upstanding monuments in semi-arid environments, while airborne imaging remains the preferred approach for a detailed study of past geo-cultural activity. Hence, this paper will target only passive airborne optical imaging approaches when presenting methodological reflections and deconstruct existing practices. Moreover, the text implicitly assumes manned platforms.
1.3. Sampling the Archaeological Record
The discipline of archaeology relies by default and as a whole on very limited data, which are from an analytical viewpoint called samples in statistics [80]. In the words of Clarke: “Archaeology in essence then is the discipline with the theory and practice for the recovery of unobservable hominid behaviour patterns from indirect traces in bad samples.” [81] (p. 17). With bad samples, Clarke indicates that archaeology does not just simply rely on a sample of the complete, untouched record of all tangible and intangible geo-cultural traces that ever occurred (called the population in statistics and here denoted the potential or target archaeological record). Rather, archaeology and the explanations it tries to construct, rely on a heavily sampled version of an already inherently sampled and thus imperfectly preserved archaeological record, which by itself is only a partial representation of the initial archaeological record (Figure 2).
Figure 1. The divisions of the optical electromagnetic spectrum (* VUV does not perfectly correspondto UV-D. While VUV runs from 10 nm to 200 nm and FUV from 200 nm to 280 nm, UV-D encompassesthe 10 nm to 100 nm region and UV-C the 100 nm to 280 nm zone).
Archaeology relies often on multi-spectral satellite sensors to record archaeologically-inducedreflectance differences in soil and vegetation [75–79]. It is the combination of an ever increasingspatial and spectral resolving power combined with the frequency by which they can cover largeareas of interest and their inherent synoptic perspective (i.e., footage with an extensive spatialcoverage) that provide many interesting opportunities for landscape archaeologists when compared toconventional aerial imagery. Besides, satellite sensors can image areas that have limited or no accessdue to airspace restrictions, bureaucratic red tape or other obstacles to reconnaissance. However,the comparatively limited spatial resolution of spaceborne imagery limits its utility for the discoveryand detailed recording of smaller landscape features. When one needs to spatially resolve the soiland vegetation marks that result from small features (such as pits and postholes), an airborne vantagepoint remains still superior. As a result, satellite reconnaissance is better suited for mapping large-scaleand broad landscape features such as paleochannels or detecting upstanding monuments in semi-aridenvironments, while airborne imaging remains the preferred approach for a detailed study of pastgeo-cultural activity. Hence, this paper will target only passive airborne optical imaging approacheswhen presenting methodological reflections and deconstruct existing practices. Moreover, the textimplicitly assumes manned platforms.
1.3. Sampling the Archaeological Record
The discipline of archaeology relies by default and as a whole on very limited data, which are froman analytical viewpoint called samples in statistics [80]. In the words of Clarke: “Archaeology in essencethen is the discipline with the theory and practice for the recovery of unobservable hominid behaviourpatterns from indirect traces in bad samples.” [81] (p. 17). With bad samples, Clarke indicates thatarchaeology does not just simply rely on a sample of the complete, untouched record of all tangibleand intangible geo-cultural traces that ever occurred (called the population in statistics and heredenoted the potential or target archaeological record). Rather, archaeology and the explanationsit tries to construct, rely on a heavily sampled version of an already inherently sampled and thus

Geosciences 2017, 7, 86 6 of 33
imperfectly preserved archaeological record, which by itself is only a partial representation of theinitial archaeological record (Figure 2).Geosciences 2017, 7, 86 6 of 33
Figure 2. Explanations about the past are based on the deficient and biased archaeological data at our disposal. These data, the archaeological sample (or recovered archaeological record), are only a small subset of all present remains of past human behaviour.
In landscape archaeology, scholars research the continuous record of traces created by human and environmental activity (and their mutual interrelation) that the many post-depositional agencies in that environment (including anthropogenic disturbance) have allowed to be preserved through time. Landscapes are the framework that contain all these testimonies and patterns of human behaviour. The latter, here collectively called the preserved archaeological record, is never pristine. It constitutes only a very limited subset of all those accumulative geo-cultural manifestations and engagements that were included in the initial archaeological record, the latter being only a sample of all possible tangible and intangible human responses to cultural, demographic, environmental and social opportunities that were originally present at a certain moment in time. Depending on the view of the archaeologist, potential, initial and preserved archaeological record can be denoted the ‘archaeological record’ or the statistical population about which archaeologists want to draw conclusions. Cowgill, for instance, distinguished between a so-called ‘physical consequences’ population (the initial archaeological record) and a ‘physical finds’ population (a combination of the preserved and recovered archaeological record) [82]. Both the initial and preserved archaeological populations are thus residual consequences of countless spatio-temporally varying and interacting cultural and natural processes that all act as agents of sampling bias [82–84].
In the fields of metrology and engineering, bias is due to a systematic error and as such an estimate for the closeness of agreement with the unknown ‘true’ value [85]. Statistically speaking, bias results from an unfair or faulty sampling and is a measure of accuracy. More generally, the concept of bias often denotes the partiality or one-sidedness or unfairness of (one or more) observations, which thus renders that observation also inaccurate according to a third party. Regardless of field, highly accurate observations thus always have a small bias. In archaeology, biased data are characterised by ambiguity, unfair tendencies (systematic over or under representation) and partiality (i.e., inappropriate recovery rate). That is why the preserved archaeological record is by default a progressively biased, distorted and lacking remnant of a once functioning but unknown whole [86].
However, if the past is accessible at all, it can only be understood as a secondary construct that has to be established on the basis of this biased preserved archaeological continuous record. To access this continuum, archaeologist still must rely on finite archaeological samples to infer information about this biased population since observing the totality of a particular aspect of the preserved archaeological record is usually practically impossible or utterly expensive. Lack of consistency and errors in these archaeological sampling processes just add additional bias. It is the latter that archaeologists want to minimise, because the inadequacies in the preserved archaeological record can only be dealt with conceptually.
Since the rise of the processual paradigm, the complex and controversial topic of sampling has received increasing attention in archaeology [87–89]. Although archaeologists always sample according to both theoretical and methodological biases [90], it is generally agreed upon that large samples offer improved accuracy over small samples [91]. It is, therefore, sensible to revise any sampling strategy that knowingly and unnecessarily limits the recovered archaeological record. Only then can these unfortunate and needless constraints on the collected data be mitigated.
Figure 2. Explanations about the past are based on the deficient and biased archaeological data at ourdisposal. These data, the archaeological sample (or recovered archaeological record), are only a smallsubset of all present remains of past human behaviour.
In landscape archaeology, scholars research the continuous record of traces created by human andenvironmental activity (and their mutual interrelation) that the many post-depositional agencies inthat environment (including anthropogenic disturbance) have allowed to be preserved through time.Landscapes are the framework that contain all these testimonies and patterns of human behaviour.The latter, here collectively called the preserved archaeological record, is never pristine. It constitutesonly a very limited subset of all those accumulative geo-cultural manifestations and engagements thatwere included in the initial archaeological record, the latter being only a sample of all possible tangibleand intangible human responses to cultural, demographic, environmental and social opportunitiesthat were originally present at a certain moment in time. Depending on the view of the archaeologist,potential, initial and preserved archaeological record can be denoted the ‘archaeological record’ orthe statistical population about which archaeologists want to draw conclusions. Cowgill, for instance,distinguished between a so-called ‘physical consequences’ population (the initial archaeologicalrecord) and a ‘physical finds’ population (a combination of the preserved and recovered archaeologicalrecord) [82]. Both the initial and preserved archaeological populations are thus residual consequencesof countless spatio-temporally varying and interacting cultural and natural processes that all act asagents of sampling bias [82–84].
In the fields of metrology and engineering, bias is due to a systematic error and as such an estimatefor the closeness of agreement with the unknown ‘true’ value [85]. Statistically speaking, bias resultsfrom an unfair or faulty sampling and is a measure of accuracy. More generally, the concept of biasoften denotes the partiality or one-sidedness or unfairness of (one or more) observations, which thusrenders that observation also inaccurate according to a third party. Regardless of field, highly accurateobservations thus always have a small bias. In archaeology, biased data are characterised by ambiguity,unfair tendencies (systematic over or under representation) and partiality (i.e., inappropriate recoveryrate). That is why the preserved archaeological record is by default a progressively biased, distortedand lacking remnant of a once functioning but unknown whole [86].
However, if the past is accessible at all, it can only be understood as a secondary construct that hasto be established on the basis of this biased preserved archaeological continuous record. To access thiscontinuum, archaeologist still must rely on finite archaeological samples to infer information about thisbiased population since observing the totality of a particular aspect of the preserved archaeologicalrecord is usually practically impossible or utterly expensive. Lack of consistency and errors in thesearchaeological sampling processes just add additional bias. It is the latter that archaeologists wantto minimise, because the inadequacies in the preserved archaeological record can only be dealtwith conceptually.
Since the rise of the processual paradigm, the complex and controversial topic of sampling hasreceived increasing attention in archaeology [87–89]. Although archaeologists always sample according

Geosciences 2017, 7, 86 7 of 33
to both theoretical and methodological biases [90], it is generally agreed upon that large samples offerimproved accuracy over small samples [91]. It is, therefore, sensible to revise any sampling strategythat knowingly and unnecessarily limits the recovered archaeological record. Only then can theseunfortunate and needless constraints on the collected data be mitigated.
The consistent nature of observing is one of the main underpinnings to increase the relevanceand accuracy of archaeological data gathering. In other words, only systematic recording in variousdimensions can eliminate measurement bias to a large extent and render the archaeological dataanalytically and interpretationally useful [91,92]. However, lack of consistency is exactly whatcharacterises the most common archaeological optical remote imaging approaches. This is the mainrationale that drives this paper and its methodological-technical reflection on (and revision of) currentairborne optical sampling approaches.
Finally, it remains important to stress once more the point made at the very beginning of this text.Although this paper acknowledges that topography, soil and vegetation type, land use and climatelargely govern (and thus bias) the data generated by passive aerial optical imaging, the article doesnot provide an in-depth reflection upon these uncontrollable variables since they are inherent to theworking principles of airborne passive imaging approaches. In contrast, the text pulls the variablesthat one can control during the image acquisition into sharp focus. This approach will also make itpossible (in Section 8) to juxtapose airborne imaging with excavations and geophysical surveys andcriticise some of the general reservations about the fitness-for-purpose of passive aerial optical imagingfor the benefit of landscape archaeology.
1.4. Which Theory to Follow?
Reflecting on data acquisition in archaeology necessitates the contextualising of this archaeologicalpractice. In addition, the latter requires some archaeological theory. However, this is a difficultbalance and one must take care “to avoid overt theorising which loses touch with the empirical basis;to avoid swinging back too far from theoretical debate into the empirical, and starting bean-countingagain” [1] (p. 65). Over the past century, but mainly during the past six decades, successive movementsin archaeological theory have influenced archaeological research practices [93]. All of these differingtheoretical reflections, of which most seem to originate in other disciplines, stem from the doubtsarchaeologists have regarding their ability to yield valid inferences about past societies. However,all possible theoretical and methodological stances and their reciprocal relationships have undergonesignificant changes and multiple critiques to the extent that archaeology still possesses little agreementon theoretical core concepts [94–96]. Or, as Pearce states: theory has become bricolage [97].
When going back to the above-mentioned practical level of landscape archaeology as the studyof the geo-cultural spaces between (and incorporating) the sites, remote sensing is in many researchcontexts a valid means to accomplish this. However, remote sensing data (and the tools to interact withthem) stem from the worlds of quantification and generalisation, to which the qualitative and subjectiveaspects of humanity defended by the broadly labelled post-processual movement, represents a partialreaction [23]. Post-processual archaeologists mainly critiqued the scientific, analytical approach toreach objective conclusions. In that light, it is unsurprising that remote sensing was generally of littleinterest to them. However, it is not because certain schools of thought will more readily adopt airborneoptical imaging that opposing theoretical schools cannot rely on airborne observations and learn fromthem. Post-processualism, for instance, questioned the relationships between the observed and theobject of study. From this point of view, aerial imaging has quite some notions to contribute. It alsoindicates that most theories relate to the interpretive framework of (landscape) archaeology. They areconcerned by how information (and in a later stadium knowledge) are gained from archaeologicaldata and why certain data are gathered. They widely disagree on the extent to which archaeologicaldata are theory-laden, but debate only to a lesser degree the data collection procedures themselves.In contrast to what some might believe, deciding upon a specific method does not necessarily assumea particular theoretical orientation. Many archaeologists even (implicitly) believe that remote sensing

Geosciences 2017, 7, 86 8 of 33
is independent of any theoretical foundations, that it is ‘theory-neutral’ when it comes to landscapearchaeology [2,98].
This aura of theoretical neutrality stems from the beginning of the 20th century and the fact thatremote sensing methods were often developed outside the main theoretical reflections. However,any aerial image is an archaeological piece of data just like any other source such as a ceramic bowl.Both the photograph and the ceramic bowl are mere samples of the preserved archaeological record(see Section 1.3) and have to be the subject of a particular theory-driven interpretation, the outcomeof which is affected by many underlying assumptions and pre-understandings [99]. Although thetheoretical interpretational frameworks that enable the reading and narrativising of aerial imagesare not a part of this paper, it must be clear that the archaeological function of airborne imagery(or any remote sensing output for that matter) are far from being culturally unbiased and theoreticallyneutral [2,100]. Moreover, also the application of a specific method is governed by theory, since onealways consciously chooses airborne remote sensing as (one of) the data collection methods to answeran (often tacit) theory-based research problem. Again, this does not mean that the choice for airborneimaging automatically assumes a particular theoretical orientation, certainly not in a time where theoryseems to have become less partisan and more pragmatic.
Any aerial image only depicts a few dimensions of the contemporary, preserved archaeologicalrecord, most of it through proxies like soil, shadow and vegetation marks. The values of and relationsbetween the individual pixels must still undergo an evidential interpretational stage (which in itselfposes still many problems in archaeology [101]). The very process of passive airborne imagingshould, however, be executed as exhaustively and systematically as possible (given the contemporarytechnological constraints of observing various dimensions). Whether the landscape is consideredabstract, quantifiable, static and neutral or rather seen as a humanised, qualitative, dynamic andcontextual entity [39], landscape archaeology is always about totality: it is about all kinds of peopleand the superposition and intermingling of all possible landscapes. This paper will, therefore, explorethe need for a more holistic approach to airborne data collection in all feasible dimensions (being spatial,spectral and temporal among others). It proposes several improvements to the current dominantoptical aerial imaging approaches so that the airborne data gathering stage can become of undeniableuse to many possible theoretical perspectives on landscape.
In this way, the dominant form of archaeological airborne remote sensing can move beyondits traditional cultural-historical point-based approach and provide data that are deeper and moreexplicitly rooted within the application of landscape archaeology. Moreover, removing much of theexisting selectivity from the airborne data collection phase essentially mitigates major sampling biasesand largely ignores the social context and pre-understandings of the aerial archaeologist, therebyallowing optical aerial imaging to transcend theoretical perspectives and become less theory-laden.Too often, incorporating (new) digital technologies in archaeology while lacking any theoreticalframework is said to be meaningless. Albeit correct to some extent, this paper hopes to show thateven the best conceptual framework will not prevent any biased and incompetent use of technology(hard-plus software) and methodology. Fancy theories can still lead to the acquisition of useless datafrom which insupportable, meaningless and even erroneous conclusions are drawn.
In this light, the next section will present eight particular characteristics that apply to all passiveoptical airborne imaging approaches. Afterwards, this paper will outline the methodological-technologicalpros and cons of the main passive airborne optical imaging approaches applied in archaeology.Using these eight features, it can be shown that all airborne imaging techniques are—implicitlyor explicitly—sub-par samplers of one or more dimensions of the preserved archaeological record,thereby introducing major bias and subjectivity into the collected data. It is important to mention oncemore that this assessment does not equal the often implicitly accepted (and during cultural-historicaland processual times outspoken) objective and neutral nature of remotely sensed imagery. The choiceof a specific study region, aircraft, flying height, pilot, imager, lens and image acquisition time areall very subjective decisions. However, subjectivity should only take its leading role after the data

Geosciences 2017, 7, 86 9 of 33
acquisition stage, when experience, intuition and knowledge govern data processing, visualisation,interpretation and information synthesis.
2. Capturing Multi-Dimensionality in Eight Key Characteristics
2.1. Bias Versus Cumulativety
Earlier (Section 1.3), the case was made for a consistent recording of airborne data to eliminatemeasurement bias as much as possible. This text also argues for an airborne approach that maximallyexcludes potential data partiality by exhaustive sampling. In other words, the recovery rate of thepreserved archaeological record should be as high as possible. When the airborne observation doesnot adhere to both conditions, it is denoted biased. Not that this concept of archaeological biasstrongly deviates from the metrological idea. In its strict mathematical sense, bias cannot be reduced,let alone eliminated, by acquiring more samples. Since it is the difference between the mean ofmany observations and the true value, a single measurement is also considered unbiased in a strictstatistical sense.
However, aerial archaeological survey is a strange animal. Not only should it seek to minimisepartiality by an exhaustive sampling scheme (which equals in some aspects a total coverageapproach—see Section 3), it should also be executed repeatedly. Although the proponents of theempirical approach would always advocate repeatable aerial data collection sorties as they believethat more data will lead to greater veracity, even those following deductive approaches have to resortto repeated surveys if they want the aerial data collection to be effective. Even with a total approach,the visibility of (predominantly) vegetation marks in a specific part of the electromagnetic spectrumdepends on numerous variables: geology, land use, plant species, soil humidity, erosion processesand weather conditions during the flight among numerous others. Since the interactions between themany conditions do often not yield conditions that are ideal for observing crop, shadow and soil markfeatures with a specific imaging setup, a cumulative approach to partially resolve these uncontrollablebiases is imperative [102].
2.2. The Usual Suspects
Spatial, temporal, spectral and radiometric resolving power are the first four characteristics thatcan express how much a specific airborne data collection strategy is prone to induce bias in the imageryrecorded. They stem from the fact that digital imaging sensors always represent averages of the spatial,temporal and spectral dimensions. The macroscopic space we live in is—according to Newtonianphysics—four-dimensional. Any ‘event’ in the universe can be defined by a location (x, y, z) and a timeof occurrence (t), making this event a four-dimensional entity [103]. However, in addition to this onetemporal and three spatial dimensions of the universe, more or less every variable can sensu strictobe thought of as a dimension [104]. Just as time is a variable, the same goes for colour, temperatureor the number or pottery sherds per metre squared. For remote sensing data, a sampled spectral andradiometric dimension is usually defined in addition to the temporal and spatial ones. Note thatresolving power denotes the characteristic of the imaging system, while the term resolution is usedwhen talking about the image itself.
Spatial resolving power refers to the ability of an instrument to distinguish between neighbouringobjects. It is expressed as the reciprocal of spatial resolution [105]. Although the final spatial resolutionof an image depends on many factors, one of the key factors is the so-called GSD or Ground SamplingDistance. Most imaging sensors have a sensor that consists of individual photosites (see Figure 3).The distance from the centre of one photosite to the centre of the neighbouring photosite is denoted thedetector pitch. The GSD is the corresponding distance projected in object space, stating the horizontallyor vertically measured scene distance ∆x between two consecutive sample locations. Although thedetector pitch is a fixed property of a sensor, it can generate images with different GSDs. Among otherfactors, the GSD is determined by the scene’s local topography, the distance of the camera to the scene

Geosciences 2017, 7, 86 10 of 33
and the focal length of the lens. To counteract observational bias towards larger features, smaller GSDsare important.Geosciences 2017, 7, 86 10 of 33
Figure 3. The working principles of a typical digital image sensor inside a photo camera. The relative spectral response curves obtained from a Nikon D200 without internal blocking filter reveal that the Blue, Green and Red channels have a FWHM of 80 nm, 75 nm and 160 nm, respectively. Note that the red channel of an unmodified camera will have a FWHM of about 50 nm since the camera will not be responsive in the invisible near-ultraviolet and near-infrared regions (both indicated in grey). With maxima at 460 nm, 530 nm and 600 nm, all bands are separated by 70 nm.
Sampling the time dimension is related to the imager’s integration time or shutter speed during image acquisition. However, the temporal resolving power of an imaging system generally refers to the repeat period or the capability to view the same scene at regular intervals. This characteristic was included here since repeated airborne observations are key to build up a cumulative data record.
The spectral resolving power quantifies the spectral details that can be resolved by the imaging sensor. The Full Width at Half Maximum or FWHM is usually applied as the measure of spectral resolving power. The FWHM of a spectral band quantifies its spectral bandwidth at 50% of its peak responsitivity. Commonly, FWHM is expressed as a wavelength difference range ∆λ and measured in nanometre or micrometre (see Figure 3). To preserve spectral details, the spectral pass band (in terms of FWHM) should have a width smaller or comparable to the spectral details in the signal. Broad spectral bands just integrate over a too wide range. They average subtle spectral details away and create ambiguity. To sufficiently resolve small spectral features, the placement of the spectral bands—expressed as an interval in nm—is as important as the spectral bandwidth. Not being able to record the contrast exhibited by vegetation and soil marks will thus automatically lead to biased data.
Besides these three sampling processes, digitising an analogue signal also encompasses quantising the sample values to a discrete Digital/Data Number (DN). The total possible range of different DNs or quantisation values an imager can create is termed the tonal range. An image´s tonal range is thus fully determined by the bit depth of this quantisation process: quantisation with N bits maps samples onto a discrete set of 2N values. This quantisation (or radiometric sampling) provides images with a radiometric resolution. The radiometric resolving power of an imaging sensor refers to the capability of that sensor to discriminate two targets based on their emittance or reflectance, a value that is among other factors dependent on the imager’s bit depth. Digital images are thus sampled and quantised representations of a scene, defined by a multi-dimensional matrix of numbers [106]. If their spatial, temporal, spectral and radiometric resolution becomes too coarse, they create ambiguity. Since all four characteristics are the result of finite interval sampling processes, a digital
Figure 3. The working principles of a typical digital image sensor inside a photo camera. The relativespectral response curves obtained from a Nikon D200 without internal blocking filter reveal that theBlue, Green and Red channels have a FWHM of 80 nm, 75 nm and 160 nm, respectively. Note thatthe red channel of an unmodified camera will have a FWHM of about 50 nm since the camera willnot be responsive in the invisible near-ultraviolet and near-infrared regions (both indicated in grey).With maxima at 460 nm, 530 nm and 600 nm, all bands are separated by 70 nm.
Sampling the time dimension is related to the imager’s integration time or shutter speed duringimage acquisition. However, the temporal resolving power of an imaging system generally refers tothe repeat period or the capability to view the same scene at regular intervals. This characteristic wasincluded here since repeated airborne observations are key to build up a cumulative data record.
The spectral resolving power quantifies the spectral details that can be resolved by the imagingsensor. The Full Width at Half Maximum or FWHM is usually applied as the measure of spectralresolving power. The FWHM of a spectral band quantifies its spectral bandwidth at 50% of its peakresponsitivity. Commonly, FWHM is expressed as a wavelength difference range ∆λ and measuredin nanometre or micrometre (see Figure 3). To preserve spectral details, the spectral pass band(in terms of FWHM) should have a width smaller or comparable to the spectral details in the signal.Broad spectral bands just integrate over a too wide range. They average subtle spectral details awayand create ambiguity. To sufficiently resolve small spectral features, the placement of the spectralbands—expressed as an interval in nm—is as important as the spectral bandwidth. Not being able torecord the contrast exhibited by vegetation and soil marks will thus automatically lead to biased data.
Besides these three sampling processes, digitising an analogue signal also encompasses quantisingthe sample values to a discrete Digital/Data Number (DN). The total possible range of different DNsor quantisation values an imager can create is termed the tonal range. An image´s tonal range isthus fully determined by the bit depth of this quantisation process: quantisation with N bits mapssamples onto a discrete set of 2N values. This quantisation (or radiometric sampling) provides imageswith a radiometric resolution. The radiometric resolving power of an imaging sensor refers to the

Geosciences 2017, 7, 86 11 of 33
capability of that sensor to discriminate two targets based on their emittance or reflectance, a valuethat is among other factors dependent on the imager’s bit depth. Digital images are thus sampledand quantised representations of a scene, defined by a multi-dimensional matrix of numbers [106].If their spatial, temporal, spectral and radiometric resolution becomes too coarse, they create ambiguity.Since all four characteristics are the result of finite interval sampling processes, a digital image willthus always induce partiality. The smaller the sampling unit becomes (i.e., the more exhaustive thesampling gets), the less biased archaeological image data will be (note again that this does not relate tothe unique meaning of bias in measurement theory). Key is to minimise this partiality and ambiguityby optimising all four key characteristics.
2.3. From Availability to Processing Complexity
While an imaging sensor´s resolving power and the resolution of an image are thus quoted in thespatial, spectral, temporal and radiometric measurement dimensions, this paper defines four additionalbut equally important properties to describe an aerial archaeological imaging solution that are not partof the usual remote sensing suspects: cost, availability, geographical bias and processing complexity.
Cost refers to the financial cost of acquiring the imaging system as well as its operational costs.Availability indicates how easy it is to have the system in operation at a certain place and a certain time.Systems that are very affordable or whose handling is straightforward, are generally easy to comeby and will, therefore, be much more available than their expensive, highly specialised counterparts.When an imaging system is not available or operational funds are lacking, no data are collected or atleast not when initially planned (e.g., when the conditions are favourable to record vegetation stress).Both factors might prevent the vital cumulative approach to data collection and even induce strongbiases by limiting the area and the time frame in which the survey can be carried out.
The main problem with much existing aerial imagery is, however, its strong geographical,observer-related bias. The latter refers to the coverage of the scene during the data acquisitionphase: is every part of the study area covered or are only selected views obtained? When airborneimagery exhibits a geographical bias, space becomes anything but neutral and remote sensing datafar from a contiguous objective-like background. Since this type of bias is prevalent and of highimportance, the next section covers it at length.
Finally, processing complexity encompasses all the geometric and radiometric correctionsthat should be executed before any of the interpretational processes can start. Highly complexpost-processing chains prevent data from being considered as a relevant source in landscapearchaeology, as such creating one more type of bias. Of course, one could always epistemologicallyargue that only archaeological research itself produces lacking data since archaeological datathemselves are complete and data gaps only emerge once those samples are considered evidence ofsomething [86]. However, since aerial image-based interpretations are used in landscape archaeologyto grasp complex aspects like human behaviour, passive airborne optical imaging approach(es) shouldfrom the very start minimise data deficiencies and additional unnecessary biases. This can be obtainedby maximising instrument availability and the amount of systematic observations in the variousdimensions on the one hand, and minimising their operational costs, geographical bias and processingcomplexity on the other. The next sections will delve deeper into all individual techniques forarchaeological passive airborne optical imaging, being: observer-directed aerial photography, blanketaerial photography, multispectral imaging and airborne imaging spectroscopy. All four will be assessedin the light of these eight key concepts (although less stress will be put on the radiometric and temporalresolving power of the systems given their overall good to excellent performance). A tabulatedoverview of these accounts can also be found in Table 1. Along the way, some thoughts on equipment-and terminology-related issues will be provided as well.

Geosciences 2017, 7, 86 12 of 33
Table 1. Overview of the main passive imaging solutions in the optical domain and how they scorefor the eight key characteristics. +, 0 and − indicate good, neutral and bad, respectively. Scoring isspecifically for archaeological purposes and established by mutually weighing all solutions.
Method Spatial Spectral Temporal Radiom. Cost Availability Geo-bias Processing
Observer-directed aerial photography + − + + + + − 0Blanket aerial
photography/multi-spectral imaging +/0 −/0 0 + 0 0 + +
Airborne imaging spectroscopy 0 + 0 + − − + −
3. How It All Started: Observer-Directed Aerial Photography
Concerning the first phase of archaeological aerial prospection from manned platforms,much credit must go to Osbert Guy Stanhope Crawford (1886–1957). This Englishman is consideredto be the inventor of scientific aerial archaeological reconnaissance, and his work in the 1920s andbeyond was the basis for the future development of the discipline that became known as aerialarchaeology [107–109]. Thanks to Crawford’s leading role, archaeologists recognised the potentialand convenience of straightforward aerial observations to unravel and study the past. His positivistperspective made Crawford consider aerial photographs as a neutral representation of objectivelyexisting archaeological sources. Despite the processual archaeology-inspired discussions on variousaspects of the method, the currently dominating practice of archaeological aerial photographicreconnaissance has not witnessed major changes since the work of Crawford. In general, aerialphotographers engaged in this type of prospection acquire photographs from the cabin of a low-flying(anywhere between 300 m and higher), preferably high-wing aircraft with lift-windows to obtain awide, unobstructed view of the scene below them. For a maximum working angle, the passenger doormight be removed as well. A small- or medium-format photographic/still frame camera is hand-heldand equipped with a lens that is commonly uncalibrated [110,111]. Once airborne, the archaeologistflies over targeted areas, trying to detect possible archaeologically-induced landscape features. After anarchaeological or environmental feature of interest is detected, it is orbited and photographed fromvarious positions. Although a photographer might create near vertical photographs (or simply‘verticals’) during such an archaeological reconnaissance sortie, the vast majority of the photographswill be oblique in nature in that the optical axis of the imager intentionally deviates more than threedegrees from the vertical to the earth’s surface (Figure 4).
Geosciences 2017, 7, 86 12 of 33
Table 1. Overview of the main passive imaging solutions in the optical domain and how they score for the eight key characteristics. +, 0 and − indicate good, neutral and bad, respectively. Scoring is specifically for archaeological purposes and established by mutually weighing all solutions.
Method Spatial Spectral Temporal Radiom. Cost Availability Geo-bias Processing Observer-directed aerial photography
+ − + + + + − 0
Blanket aerial photography/multi-
spectral imaging +/0 −/0 0 + 0 0 + +
Airborne imaging spectroscopy
0 + 0 + − − + −
3. How It All Started: Observer-Directed Aerial Photography
Concerning the first phase of archaeological aerial prospection from manned platforms, much credit must go to Osbert Guy Stanhope Crawford (1886–1957). This Englishman is considered to be the inventor of scientific aerial archaeological reconnaissance, and his work in the 1920s and beyond was the basis for the future development of the discipline that became known as aerial archaeology [107–109]. Thanks to Crawford’s leading role, archaeologists recognised the potential and convenience of straightforward aerial observations to unravel and study the past. His positivist perspective made Crawford consider aerial photographs as a neutral representation of objectively existing archaeological sources. Despite the processual archaeology-inspired discussions on various aspects of the method, the currently dominating practice of archaeological aerial photographic reconnaissance has not witnessed major changes since the work of Crawford. In general, aerial photographers engaged in this type of prospection acquire photographs from the cabin of a low-flying (anywhere between 300 m and higher), preferably high-wing aircraft with lift-windows to obtain a wide, unobstructed view of the scene below them. For a maximum working angle, the passenger door might be removed as well. A small- or medium-format photographic/still frame camera is hand-held and equipped with a lens that is commonly uncalibrated [110,111]. Once airborne, the archaeologist flies over targeted areas, trying to detect possible archaeologically-induced landscape features. After an archaeological or environmental feature of interest is detected, it is orbited and photographed from various positions. Although a photographer might create near vertical photographs (or simply ‘verticals’) during such an archaeological reconnaissance sortie, the vast majority of the photographs will be oblique in nature in that the optical axis of the imager intentionally deviates more than three degrees from the vertical to the earth’s surface (Figure 4).
Figure 4. Vertical versus oblique aerial imaging.
Depending on the visibility of the apparent horizon, the image is then further classified as low oblique (i.e., the horizon is not included) or high oblique [112]. Sometimes, the threshold between low and high oblique photographs is also quantified at 30° [113]. Since this type of archaeological aerial prospection primarily generates oblique images (or simply ‘obliques’) of archaeological
Figure 4. Vertical versus oblique aerial imaging.
Depending on the visibility of the apparent horizon, the image is then further classified as lowoblique (i.e., the horizon is not included) or high oblique [112]. Sometimes, the threshold betweenlow and high oblique photographs is also quantified at 30◦ [113]. Since this type of archaeologicalaerial prospection primarily generates oblique images (or simply ‘obliques’) of archaeological interest,

Geosciences 2017, 7, 86 13 of 33
archaeologists in Great Britain but also in other parts of Europe have used ‘oblique survey’ as shorthandfor this type of observer-directed or observer-biased survey strategy (the latter terms coined byPalmer [114]). In the mapping and surveying community, this kind of photography is sometimesdenoted free-camera oblique photography, being “ . . . an enjoyable and to some extent creative formof aerial photography . . . where the pilot and photographer have the task of photographing randomtargets on a speculative basis” [115].
Since the 1930s, this free-camera, observer-directed aerial surveying has been the workhorse ofall archaeological airborne remote sensing techniques. Its success lies mainly in its straightforwardexecution as well as the abundant availability and moderate cost of small aeroplanes and photocameras. The combination of its capacity to repeatedly cover relatively large areas with ample spatialdetail (typically a GSD of 5 cm to 10 cm) turns it into one of the most cost-effective methods for sitediscovery—or at least, that is what it is often told to be e.g., [116,117].
Despite its efficiency in certain areas and periods, the main disadvantage of this reconnaissanceapproach lies in its observer-directed nature which generates extremely selective, pre-interpreted [6]and thus utterly biased data that are completely dependent on an airborne photographer recognisingarchaeological phenomena at a relatively high air-to-ground speed. Subsurface soil disturbances thatare visually imperceptible at the time of flying, or those that are simply overlooked, will not make itinto a photograph. Moreover, the observer might fail to record certain features, even when lookedat, because he/she is too tired or they are not part of his/her expectations or repertoire of knownsites (see Cowley [18] for a more thorough discussion of this topic). Alternatively, the surveyor mightsimply ignore existing features and create false patterning by flying where the archaeological ‘hot spots’(a.k.a. ‘honey-pots’) or the ‘familiar stuff’ can be found [4,118,119]. Aerial archaeological pioneers suchas John Kenneth Sinclair St Joseph (1912–1994) are (in)famous for pursuing mainly Roman militaryarchaeology [120,121]. To them, but also too many of their successors, taking aerial photographs is likecollecting stamps. In a sense, observer-based archaeological aerial photography is still pursuing thesame goals as those of the first decades of the 20th century. This site-based approach contrasts withthe inherent complexity of landscapes and their internal relationships landscape archaeology tries tounravel. Also, pre-interpreting the object of study before collecting data about it renders this type ofaerial observations entirely subjective.
Airborne imagery acquired during an observer-directed sortie is thus nothing but an arbitrarysample, based on the perception, interest, motivation, knowledge, expectation and logistical capabilitiesof the person behind a highly unoptimised data recording system called photo camera. When alsotaking the indispensable need for favourable interactions between all the uncontrollable variablesas an additional bias into account [17,122], one can call into question the appropriateness of suchhaphazardly collected data to make inferences about the landscape as a whole. Yet, these biased dataand the knowledge created from this century-old approach to aerial imaging continues to frame muchof the research in landscape archaeology.
To counteract any of these obvious geographical biases, several scholars have already questionedthis particular reconnaissance strategy over the past two decades. Although flying higher and/orwith a shorter focal length can draw more of the landscape into the photograph and a secondobserver/photographer onboard might certainly increase the archaeological detection rate, several papersalso pointed out the advantage of a geographical ‘total coverage’ or ‘seamless’ approach [114,123–129].Moreover, since photographs that result from such a blanket survey are much better suited for automatedimage processing workflows, they also mitigate the prevalent bias that is created by simply not usingthese aerial observations.
4. Removing the Camera-Angle Delusion: Total Coverage Aerial Photography
During a total coverage or block survey sortie, photographs will predominantly be acquiredwith expensive, accurately calibrated, built-in (versus hand-held), gyro-stabilised and low distortionmapping frame cameras (often referred to as metric or cartographic cameras [130]) to make sure that all

Geosciences 2017, 7, 86 14 of 33
photographs are nadir/vertical images. These cameras are solidly housed and operated in bigger andhigher flying aeroplanes. Images feature a GSD of 25 cm or smaller and are acquired in parallel stripsat regular intervals, generally with a substantial frame overlap: in one flight strip, each photograph hasa generally accepted degree of overlap of circa 60 ± 5% (figures to 90% can be found as well, see [113])with the following and preceding image (longitudinal overlap). Adjacent strips have on average anoverlap of 25% to 40% (lateral overlap) [115]. The camera is pointing directly down to the earth toacquire (near) nadir photographs. Because a perfect vertical is seldom achieved, an image with anangle of less than or equal to 3◦ is called vertical [131]. Analogous to the oblique survey approach,archaeologists began to use ‘vertical survey’ as shorthand for such total area coverage flying strategies.Although one could indeed argue that both flying strategies primarily deliver these types of images,this archaeological habit remains a very inappropriate way of categorising aerial survey approaches.
Just as the observer-directed flying strategy can yield vertical imagery, these aerial block surveyscan deliver oblique imagery as well. This has never been more evident than in the past fifteen years,during which the geospatial community re-introduced oblique imagery for measuring applications.Although tilted views had been very popular in the 1920s to 1940s for mapping, surveillance andreconnaissance purposes [132], extracting accurate geometry from aerial images has been limited toblocks of vertical images afterwards. The recent revival of the tilted views—acquired during totalcoverage mapping surveys—was mainly triggered by Pictometry. Since this New York-based imagingcompany introduced in 2000 its PentaView capture system consisting of five cameras (of which fourwere taking oblique images, while the central one was directed nadir [133]), the properties of theacquired oblique imagery have been opening many eyes. As a result, a strong movement towardsmapping approaches that integrated oblique images with the more traditional vertical ones wascreated [134,135]. This trend is now exemplified by the growing number of manufacturers that createdigital multi-camera systems in which the vertical mapping camera is complemented by one or moreoblique mapping cameras—for example IGI’s Penta DigiCAM [136] or Microsoft’s UltraCam Ospreyfamily [137] (Figure 5).
Geosciences 2017, 7, 86 14 of 33
strips at regular intervals, generally with a substantial frame overlap: in one flight strip, each photograph has a generally accepted degree of overlap of circa 60% ± 5% (figures to 90% can be found as well, see [113]) with the following and preceding image (longitudinal overlap). Adjacent strips have on average an overlap of 25% to 40% (lateral overlap) [115]. The camera is pointing directly down to the earth to acquire (near) nadir photographs. Because a perfect vertical is seldom achieved, an image with an angle of less than or equal to 3° is called vertical [131]. Analogous to the oblique survey approach, archaeologists began to use ‘vertical survey’ as shorthand for such total area coverage flying strategies. Although one could indeed argue that both flying strategies primarily deliver these types of images, this archaeological habit remains a very inappropriate way of categorising aerial survey approaches.
Just as the observer-directed flying strategy can yield vertical imagery, these aerial block surveys can deliver oblique imagery as well. This has never been more evident than in the past fifteen years, during which the geospatial community re-introduced oblique imagery for measuring applications. Although tilted views had been very popular in the 1920s to 1940s for mapping, surveillance and reconnaissance purposes [132], extracting accurate geometry from aerial images has been limited to blocks of vertical images afterwards. The recent revival of the tilted views—acquired during total coverage mapping surveys—was mainly triggered by Pictometry. Since this New York-based imaging company introduced in 2000 its PentaView capture system consisting of five cameras (of which four were taking oblique images, while the central one was directed nadir [133]), the properties of the acquired oblique imagery have been opening many eyes. As a result, a strong movement towards mapping approaches that integrated oblique images with the more traditional vertical ones was created [134,135]. This trend is now exemplified by the growing number of manufacturers that create digital multi-camera systems in which the vertical mapping camera is complemented by one or more oblique mapping cameras—for example IGI’s Penta DigiCAM [136] or Microsoft’s UltraCam Osprey family [137] (Figure 5).
Figure 5. The Microsoft/Vexcel UltraCam Osprey Prime II for combined nadir and oblique image capture. Image source: https://ultracam.files.wordpress.com/2014/04/ucop_2.png.
Although the current evolution and use of these systems are mainly driven by the major developments in the fields of computer vision and photogrammetry [138], the resulting imagery is
Figure 5. The Microsoft/Vexcel UltraCam Osprey Prime II for combined nadir and oblique imagecapture. Image source: https://ultracam.files.wordpress.com/2014/04/ucop_2.png.

Geosciences 2017, 7, 86 15 of 33
Although the current evolution and use of these systems are mainly driven by the majordevelopments in the fields of computer vision and photogrammetry [138], the resulting imageryis also an excellent source of geo-information for many other fields. The strongest selling point of theseobliques is their intuitive nature and rich content: not only do they come close to the standard humanperception of objects or scenes while standing on a hill or in a high tower [139,140], they also make iteasier to map façades of houses, hence providing a complete description of built-up areas [141,142].Although parts of vertical structures such as houses, electricity pylons, trees and lamp post mightindeed remain occluded in a vertical view, the information that oblique imagery delivers about verticalstructures is only of minor importance in most landscape archaeology projects. The reasons for theenthusiastic revival of the slanted viewing geometry in the geospatial industry do thus not hold(or only to a minor extent and in specific cases) for most archaeological landscape projects. Moreover,nadir views provide a more than satisfying alternative to the extremes of oblique imaging for renderingshadow and colour-difference based marks [10].
From the statements above, it should be clear that the traditional archaeological remote sensingdichotomy between oblique and vertical aerial photographic reconnaissance—in which either type toooften indicates a specific flying approach—is a highly inappropriate one. This terminology shouldbe left behind in favour of observer-directed versus total coverage or block survey, both capable ofgenerating oblique as well as vertical aerial photographs. Although the terms biased versus unbiasedaerial survey are sometimes coined [114,143], their usage is also discouraged since many other biasesremain. If used, one could refer to these survey strategies as being geographically unbiased—as wasalso done by Mills [125]. That is, geographically unbiased at least inside the survey area itself, since thespecific choice of the latter is also governed by many personal and practical factors.
5. Increasing the Spectral Dimensions: VNIR Aerial Imaging
Despite many advantages, both geographically biased and unbiased aerial photographyare typically characterised by major spectral shortcomings. In archaeological observer-biasedaerial photography, the human visual system governs the survey working principles. However,both the human eye and a standard photo camera only create useful data streams using light(i.e., the visible electromagnetic spectrum). Although several archaeologists have at a certain pointin their career experimented with false-colour or pure Near-InfraRed (NIR) airborne imaging(consider [144] for an extensive overview) or even imaging in the near-ultraviolet [145,146], the majorityof aerial footage has been acquired with photographic media that were sensitised to wavelengthsbetween approximately 400 nm and 700 nm. Although striking and revealing images have beenobtained in this way, the detection of vegetation marks (and to a certain extent soil and other marks)becomes impossible in less-than-optimal circumstances. The slight differentials of height and colourin crops might simply exhibit too low contrast with the surrounding matrix to be noticed in thevisible spectrum (Figure 6). As a result, the aerial observer will never orbit nor document visuallyimperceptible soil and crop disturbances.
Since most mapping cameras are multispectral devices that capture imagery in one NIR and threevisible channels (encompassing the so-called VNIR spectrum), NIR blanket coverage generated duringa block sortie tackles the issue mentioned above. However, both standard photographic solutionsas well as multi-spectral imagers capture reflected solar radiation in spectrally broad wavebands.A typical colour photograph records the visible spectrum in three wide Red, Green and Blue channels(with their FWHM approximately 80 nm; Figure 3), while a NIR image generally encompasses a 200 nmwaveband. From the perspective of feature recovery-rate, this is a subpar approach since particulardiagnostic spectral vegetation features are often only a few nanometres wide. (Note again that this textmainly focuses on vegetation marks due to their abundance and potential to disclose very detailedmorphological information about the totally buried archaeological features).
This makes acquisition of data with a high spectral resolution necessary when one seeks toassess small variations in—for example—plant physiology and minimise spectrally-induced ambiguity

Geosciences 2017, 7, 86 16 of 33
in the data. Vertical and oblique photography, even when executed beyond the visible waveband,thus significantly reduce the diagnostic accuracy of vegetation investigation. Despite their potentiallyhigh spatial resolving power, they spectrally undersample the at-sensor radiation and mask the spectralfeatures that are too narrow to be distinguished [11,147]. Although more dedicated multispectralsensors like the Daedalus 1268 Airborne Thematic Mapper have been developed and used profusely inarchaeological research [148–152], those cameras commonly lack the high spatial resolution advocatedabove. They are also ill-suited for fast deployment in the small two- to four-seat aircraft that aretypically used for an archaeological aerial survey. Nevertheless, the resulting images enable thegeneration of radiometrically corrected orthophotographs and Digital Surface Models (DSMs).
Geosciences 2017, 7, 86 16 of 33
features that are too narrow to be distinguished [11,147]. Although more dedicated multispectral sensors like the Daedalus 1268 Airborne Thematic Mapper have been developed and used profusely in archaeological research [148–152], those cameras commonly lack the high spatial resolution advocated above. They are also ill-suited for fast deployment in the small two- to four-seat aircraft that are typically used for an archaeological aerial survey. Nevertheless, the resulting images enable the generation of radiometrically corrected orthophotographs and Digital Surface Models (DSMs).
Figure 6. Visible (A) and NIR photograph (B) of the same area in Portus, Italy (N 41°46′30″, E 12°15′51″—WGS84). Note the many features that are visible in the NIR image but go undetected in the conventional photograph.
6. Overcoming the Spectral Delusion: Airborne Imaging Spectroscopy
To resolve this spectral resolution issue, archaeologists have started to investigate Airborne Imaging Spectroscopy (AIS), also known as Airborne Hyperspectral Scanning (AHS). AIS is a passive remote sensing technique that digitises the earth’s upwelling electromagnetic radiation in a multitude of small spectral bands. Compared to most multispectral sensors, hyperspectral sensors have a higher spectral resolving power (typically an FWHM of around 10 nm in the VNIR range) and capture more and (nearly) contiguous (i.e., adjacent and not overlapping) spectra [153]. Although the borderline between multi- and hyperspectral imaging is rather discipline dependent, ten to twelve spectral bands is often taken as the threshold [154]. In other words: tens to hundreds of small bands of electromagnetic radiant energy are captured per pixel location (Figure 7). Through a combination of all spectral data acquired from a particular spatial location, every pixel of the final image holds the spectral signature of the material that was sampled at that specific location.
AIS is typically used to image entire areas without having geographical data gaps. So far, AIS has been used in several archaeological projects, for example [150,155–168]. The success rate regarding archaeological subsurface structure detection is, however, variable and less effective applications seem to be connected with the lower spatial resolutions of the acquired datasets (in most cases the GSD ranges from 1 m to 4 m). Although the current generation of AIS sensors easily enables a GSD below 50 cm when flown low and slow enough, the visible image detail is still not comparable with conventional three-band aerial photographs.
Figure 6. Visible (A) and NIR photograph (B) of the same area in Portus, Italy (41◦46′30′′N,12◦15′51′′E—WGS84). Note the many features that are visible in the NIR image but go undetected inthe conventional photograph.
6. Overcoming the Spectral Delusion: Airborne Imaging Spectroscopy
To resolve this spectral resolution issue, archaeologists have started to investigate AirborneImaging Spectroscopy (AIS), also known as Airborne Hyperspectral Scanning (AHS). AIS is a passiveremote sensing technique that digitises the earth’s upwelling electromagnetic radiation in a multitudeof small spectral bands. Compared to most multispectral sensors, hyperspectral sensors have a higherspectral resolving power (typically an FWHM of around 10 nm in the VNIR range) and capture moreand (nearly) contiguous (i.e., adjacent and not overlapping) spectra [153]. Although the borderlinebetween multi- and hyperspectral imaging is rather discipline dependent, ten to twelve spectral bandsis often taken as the threshold [154]. In other words: tens to hundreds of small bands of electromagneticradiant energy are captured per pixel location (Figure 7). Through a combination of all spectral dataacquired from a particular spatial location, every pixel of the final image holds the spectral signatureof the material that was sampled at that specific location.
AIS is typically used to image entire areas without having geographical data gaps. So far, AIS hasbeen used in several archaeological projects, for example [150,155–168]. The success rate regardingarchaeological subsurface structure detection is, however, variable and less effective applicationsseem to be connected with the lower spatial resolutions of the acquired datasets (in most cases theGSD ranges from 1 m to 4 m). Although the current generation of AIS sensors easily enables a GSDbelow 50 cm when flown low and slow enough, the visible image detail is still not comparable withconventional three-band aerial photographs.
Despite better spectral resolution and improving spatial resolution, working with AIS datanecessitates a certain amount of expert knowledge and specialised software. Assuming that the imagegeometry and georeferencing can be handled correctly—which is far from a trivial task—one needs todeal with the data quality and dimensional overload by denoising procedures and intelligent datamining approaches. Even though specific archaeological tools such as the MATLAB-based ARCTIStoolbox [169] have been developed to answer these needs, the issues mentioned above are still alimiting (i.e., biasing) factor for the widespread application of AIS in archaeology. Finally, the cost

Geosciences 2017, 7, 86 17 of 33
of an AIS flight still places it out of reach of most institutions, despite the steadily decreasing pricesdue to increased demand in non-archaeological communities. If, however, hyperspectral data witha high spatial resolution are used in combination with powerful processing algorithms, AIS doescertainly have a clear potential in areas where vegetation marks do not appear clearly in broad-bandmulti-spectral setups (e.g., [158,168]).
Geosciences 2017, 7, 86 17 of 33
Figure 7. Visualisation of an airborne imaging spectroscopy data cube.
Despite better spectral resolution and improving spatial resolution, working with AIS data necessitates a certain amount of expert knowledge and specialised software. Assuming that the image geometry and georeferencing can be handled correctly—which is far from a trivial task—one needs to deal with the data quality and dimensional overload by denoising procedures and intelligent data mining approaches. Even though specific archaeological tools such as the MATLAB-based ARCTIS toolbox [169] have been developed to answer these needs, the issues mentioned above are still a limiting (i.e., biasing) factor for the widespread application of AIS in archaeology. Finally, the cost of an AIS flight still places it out of reach of most institutions, despite the steadily decreasing prices due to increased demand in non-archaeological communities. If, however, hyperspectral data with a high spatial resolution are used in combination with powerful processing algorithms, AIS does certainly have a clear potential in areas where vegetation marks do not appear clearly in broad-band multi-spectral setups (e.g., [158,168]).
7. Take the Best, Leave the Rest. A Discussion
After this reflexive approach, it thus seems that, despite a hundred years of technological evolutions and methodological developments, many observational shortcomings still hamper passive airborne optical imaging to truly benefit the many flavours of landscape archaeology. This results in a wide variety of biases, both in the data and the subsequent usage of them:
Figure 7. Visualisation of an airborne imaging spectroscopy data cube.
7. Take the Best, Leave the Rest. A Discussion
After this reflexive approach, it thus seems that, despite a hundred years of technologicalevolutions and methodological developments, many observational shortcomings still hamper passiveairborne optical imaging to truly benefit the many flavours of landscape archaeology. This results in awide variety of biases, both in the data and the subsequent usage of them:
• spaceborne data, consistently acquired over extended areas and often in invisible wavebands,might tackle the observer-directed and visible-radiation-limited biases. However, the data areless (or not at all) suited for the discovery and detailed recording of small archaeological features,as the spatial resolving power of the sensors exceeds one metre in all but a few panchromaticcases (a panchromatic image is a greyscale image created by one spectral band that is sensitiveto more or less all (‘pan’) wavelengths (or colours, hence ‘chroma’) of visible electromagneticenergy). Moreover, the spectral bands of older spaceborne imagers (i.e., those whose products are

Geosciences 2017, 7, 86 18 of 33
freely available) are generally too broad or misplaced spectrally to truly detect the plant stressthat governs vegetation marks [170];
• conventional airborne photographic imaging approaches are dominantly observer-directed,creating a strong geographical bias. They also lack the spectral resolving capabilities that areneeded to digitise subtle reflectance features;
• existing multispectral solutions are often limited to four broad bands while the instrumentation isexpensive and impossible to easily (de)mount into a light aircraft;
• hyperspectral imaging sensors do acquire data in narrow wavebands and are usually flown with atotal coverage strategy in mind, but the combination of affordability, availability, data complexity,moderate temporal resolution and generally lower spatial resolving power also significantlyrestrict its frequent use (even of existing data) in archaeological research. Various biases and alack of cumulative data are the result;
These remarks are not to diminish the importance of data collection strategies used so far, but thetools and knowledge are now here to eliminate several of these shortcomings. At the turn of the 21stcentury, Bewley and Raczkowski stated that “in examining future developments it is becoming clearthat we must hold on to the best of the old and embrace the best of the new” [171] (p. 4). From thestatements above, it seems that a more technologically adept archaeological airborne reconnaissancesystem would combine the cost-effectiveness (from a hardware point of view), availability andoperating flexibility as well as the spatial and temporal resolving power of the observed-directedphotographic approach. In addition, it should allow a geographically unbiased total coverage in aselection of narrow visible and invisible spectral wavebands that are suitable for detecting vegetationand soil marks.
In the author’s view, the last two characteristics are crucial if the aerial archaeological communitywants to evolve to an improved airborne data acquisition that aims at a more consistent record ofour past. The next sections outline a proposal to that end. In short, the text further details why arather dense airborne sampling of various dimensions of the preserved archaeological record couldnaturally span several perspectives and oppositional analytical approaches that are commonplace inlandscape archaeology. As such, this observational (i.e., data gathering) phase might to a large extenttranscend major theoretical paradigms. This proposal does not have to stay a purely hypothetical one,as Verhoeven and Sevara [12] have recently shown how this could be materialised and put into practice.
7.1. Geographically Unbiased and Vertical
From a technological point of view, geographical total coverage aerial imaging is not novel atall. However, it becomes innovative in archaeology as soon as it is executed with the same intensityas observer-directed aerial surveys. When total coverage passive aerial optical imaging would beperformed by default, the uniformity of the aerial archaeological data sets would benefit enormously.Passive airborne optical image collections would be freed of (most of) their inherent weaknessessuch as the observer’s experience, a priori knowledge and many other methodological biases [4,18],although Wilson claims them to be unavoidable features of aerial reconnaissance [119].
The acceptance and implementation of such a strategy can, however, only be fruitful if onedistances themselves from the common approaches by which block surveys are executed. It still holdstrue that most archaeological features appear on vertical photographs (acquired during a block survey)through what has been denoted the serendipity effect [172]. This is principally because high-levelvertical block surveys have generally been executed to acquire basic material for (orthophoto)mapgeneration rather than for archaeological purposes. Even then, much valuable information has beenextracted from such blanket photography. Also, most of the usual arguments to not fly (or even use)verticals from a block survey sortie (see [117,173–175]) have been countered on many occasions byvarious authors [10,114,176,177].
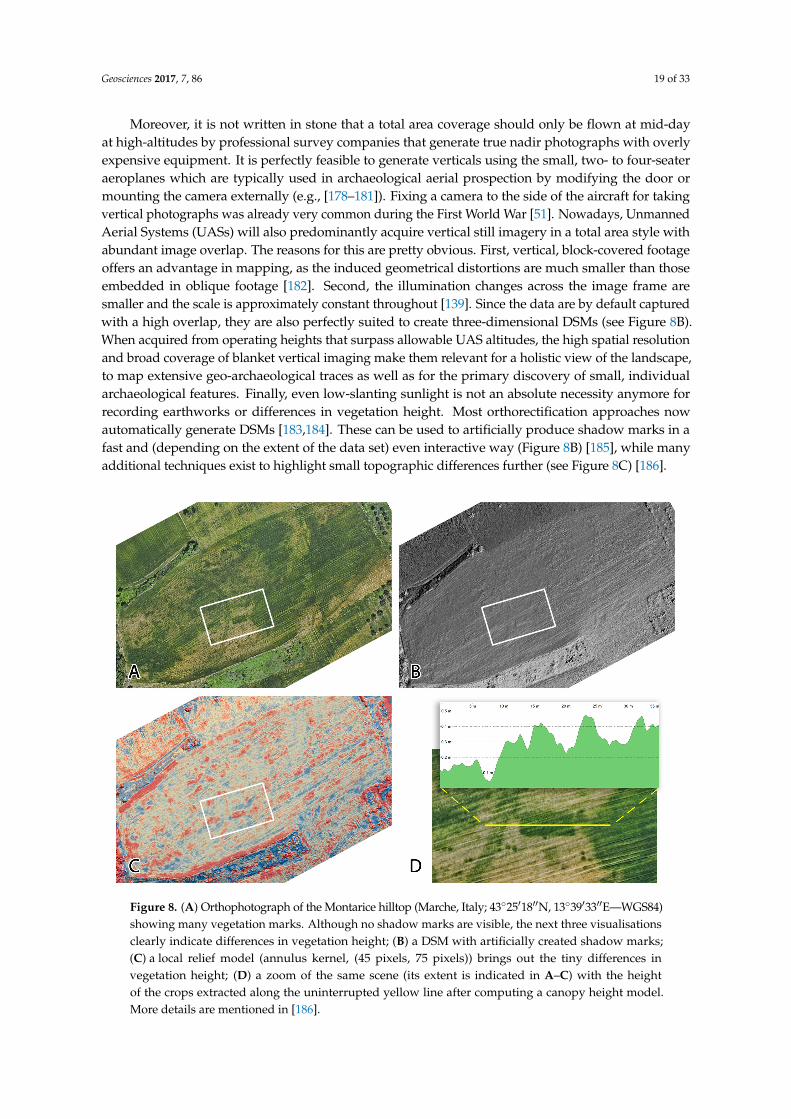
Geosciences 2017, 7, 86 19 of 33
Moreover, it is not written in stone that a total area coverage should only be flown at mid-dayat high-altitudes by professional survey companies that generate true nadir photographs with overlyexpensive equipment. It is perfectly feasible to generate verticals using the small, two- to four-seateraeroplanes which are typically used in archaeological aerial prospection by modifying the door ormounting the camera externally (e.g., [178–181]). Fixing a camera to the side of the aircraft for takingvertical photographs was already very common during the First World War [51]. Nowadays, UnmannedAerial Systems (UASs) will also predominantly acquire vertical still imagery in a total area style withabundant image overlap. The reasons for this are pretty obvious. First, vertical, block-covered footageoffers an advantage in mapping, as the induced geometrical distortions are much smaller than thoseembedded in oblique footage [182]. Second, the illumination changes across the image frame aresmaller and the scale is approximately constant throughout [139]. Since the data are by default capturedwith a high overlap, they are also perfectly suited to create three-dimensional DSMs (see Figure 8B).When acquired from operating heights that surpass allowable UAS altitudes, the high spatial resolutionand broad coverage of blanket vertical imaging make them relevant for a holistic view of the landscape,to map extensive geo-archaeological traces as well as for the primary discovery of small, individualarchaeological features. Finally, even low-slanting sunlight is not an absolute necessity anymore forrecording earthworks or differences in vegetation height. Most orthorectification approaches nowautomatically generate DSMs [183,184]. These can be used to artificially produce shadow marks in afast and (depending on the extent of the data set) even interactive way (Figure 8B) [185], while manyadditional techniques exist to highlight small topographic differences further (see Figure 8C) [186].
Geosciences 2017, 7, 86 20 of 33
Figure 8. (A) Orthophotograph of the Montarice hilltop (Marche, Italy; N 43°25′18″, E 13°39′33″—WGS84) showing many vegetation marks. Although no shadow marks are visible, the next three visualisations clearly indicate differences in vegetation height; (B) a DSM with artificially created shadow marks; (C) a local relief model (annulus kernel, (45 pixels, 75 pixels)) brings out the tiny differences in vegetation height; (D) a zoom of the same scene (its extent is indicated in A–C) with the height of the crops extracted along the uninterrupted yellow line after computing a canopy height model. More details are mentioned in [186].
7.2. Multispectral and Portable
It is also deemed of the utmost importance to acquire spectral data in a handful of small, vegetation and soil mark-sensitive spectral bands as well as in the very common broad wavebands of the visible spectrum, since the interpretation of the former will greatly benefit from the latter [11]. Ideally, imagery could be acquired in the green peak at 550 nm (30 nm FWHM), the red edge at 705 nm (30 nm FWHM) and the NIR shoulder at 820 nm (100 nm FWHM). Those three spectral bands have repeatedly been shown to be strongly related to biophysical changes caused by plant stress [190–193]. They are, therefore, well-suited for assessing crop (and by extension vegetation) characteristics, while the combination of the 820 nm NIR band and the 705 nm Red Edge band has already proven its potential in archaeological prospection [156,194,195]. Additionally, the potential information captured in the NIR band is not solely restricted to vegetation marks. Since water heavily absorbs NIR [196] and existing soil moisture differences are often characteristic of soil marks [197,198], discerning the latter becomes easier in the NIR as compared to the visible range. Moreover, all three bands exhibit relatively small anisotropic reflectance effects [199]. This approach also omits the overload of highly correlated spectral data that is characteristic for conventional AIS approaches, while a high spatial resolution can be combined with a high spectral resolution (be it in less spectral bands). To measure the incoming visible spectrum, a normal state-of the-art camera can be flown alongside.
When the imaging solution is also transportable and easy to mount on a variety of light airplanes (e.g., Cessna 152, Cessna 162 Skycatcher, Cessna 172 Skyhawk and Cessna 182 Skylane), repetitive,
Figure 8. (A) Orthophotograph of the Montarice hilltop (Marche, Italy; 43◦25′18′′N, 13◦39′33′′E—WGS84)showing many vegetation marks. Although no shadow marks are visible, the next three visualisationsclearly indicate differences in vegetation height; (B) a DSM with artificially created shadow marks;(C) a local relief model (annulus kernel, (45 pixels, 75 pixels)) brings out the tiny differences invegetation height; (D) a zoom of the same scene (its extent is indicated in A–C) with the heightof the crops extracted along the uninterrupted yellow line after computing a canopy height model.More details are mentioned in [186].

Geosciences 2017, 7, 86 20 of 33
Of course, this does not mean that observer-directed flights in favourable light conditions shouldbe discarded. In between total coverage approaches, one can certainly think of a few targetedobserved-led sorties to acquire additional image material. However, observer-directed flights asa means to better understand the recorded features or the area under study might make subsequentinterpretations of landscape organisation problematic if one assumes that past people also had asimilar ‘aerial (over)view’ concept of the landscape. In contrast, the photographs that are possible withobserver-based obliques are also still valid if one flies for artistic satisfaction or documenting standingremains (certainly when those are to be found environments such as deserts; e.g., [187]). However, it isthe author’s firm conviction that these flights should be rather the exception than the rule.
Though Campana argues to “supplement oblique aerial survey with some form of ‘total’ recordingat those times when archaeological visibility is at its best” [188] (p. 12), he arguably makes a falseassumption that archaeological aerial archaeological photographic reconnaissance cannot escape itsinherent subjectivity and selectivity. On the contrary, it does not take all that much effort to replace theobserver led approach with a reconnaissance strategy involving cumulative total coverage surveys,with or without oblique camera observation angles, executed from the same light aircraft commonlyused for archaeological airborne prospection. Of course, a certain amount of subjectivity will alwaysexist (such as choice of pilot, aircraft, flying height, time of data acquisition), but the main dataselectivity actors are not that hard to weed out. Maybe one of the key arguments in realising thenecessary change in archaeological mindset lies in the fact that information about soil type, hydrology,land use and vegetation cover—which is all extractable from continuous airborne coverage—can evenhelp to detect bias in other data sources [189].
7.2. Multispectral and Portable
It is also deemed of the utmost importance to acquire spectral data in a handful of small, vegetationand soil mark-sensitive spectral bands as well as in the very common broad wavebands of the visiblespectrum, since the interpretation of the former will greatly benefit from the latter [11]. Ideally, imagerycould be acquired in the green peak at 550 nm (30 nm FWHM), the red edge at 705 nm (30 nmFWHM) and the NIR shoulder at 820 nm (100 nm FWHM). Those three spectral bands have repeatedlybeen shown to be strongly related to biophysical changes caused by plant stress [190–193]. They are,therefore, well-suited for assessing crop (and by extension vegetation) characteristics, while thecombination of the 820 nm NIR band and the 705 nm Red Edge band has already proven its potentialin archaeological prospection [156,194,195]. Additionally, the potential information captured in theNIR band is not solely restricted to vegetation marks. Since water heavily absorbs NIR [196] andexisting soil moisture differences are often characteristic of soil marks [197,198], discerning the latterbecomes easier in the NIR as compared to the visible range. Moreover, all three bands exhibit relativelysmall anisotropic reflectance effects [199]. This approach also omits the overload of highly correlatedspectral data that is characteristic for conventional AIS approaches, while a high spatial resolution canbe combined with a high spectral resolution (be it in less spectral bands). To measure the incomingvisible spectrum, a normal state-of the-art camera can be flown alongside.
When the imaging solution is also transportable and easy to mount on a variety of light airplanes(e.g., Cessna 152, Cessna 162 Skycatcher, Cessna 172 Skyhawk and Cessna 182 Skylane), repetitive,cost-effective and total coverage airborne survey will become commonplace, offering local researchersthe chance to have a high-end imaging system flown at very reasonable costs.
7.3. The Processing and Interpretation Back-End
Although it might seem that the need for the proposed passive optical imaging approach isparamount regardless of the data processing and interpretation pipeline, such drastic developmentscan not only stay limited to the acquisition phase. The predominant single-imaged based workflowsare just too slow and cumbersome to deal with the large amounts of aerial imagery that are constantlygenerated. As a result, millions of aerial photographs are simply stored in archives where they are at

Geosciences 2017, 7, 86 21 of 33
risk of loss or obscurity and their archaeological information cannot (or will not) be exploited efficiently(contributing to another form of bias).
The only solution is to leave the current post-acquisition workflows behind in favour of processingand interpretation pipelines that can deal with a multitude of images at once, thereby saving on thedemands for skill, money and time. Given the current failure to do so, the latter three are also oftenquoted as reasons to stay away from total area coverage [117]. As a result, new georeferencingapproaches, radiometry processing algorithms, management structures and interpretation strategiesmust be conceptualised, tested and implemented, not only to maximise the usability of aerial opticalimagery for landscape archaeology but to simply deal with the large amounts of airborne data thatwill result from the proposed image acquisition approach. Although it is sometimes said that studyinga sample with great care might yield more information than studying the complete population [80],advances in data storage, computational power, machine vision and deep learning start to render thisargument more or less invalid for these image collections. When the processing and interpretationalchains are properly set-up (see also [12,200,201]), dealing with several thousands of images should notbe much more of a burden than dealing with a few hundreds of them.
Although the technology is available, realising all these aspects will not come easy because the majorchallenge lies in the creation of a new methodological, analytical and interpretational mindset. Since thispaper does not want to suggest that a blind collection and accumulation of aerial data is the way to go,this new data collection strategy must go hand in hand with (the already partly ongoing) renewed practicaland theoretical reflections on the detection, identification, typological and chronological classification,perception and interpretation of landscape features [18,54,68,101,168,202–207]. These considerationsremain vital because archaeology still falls short of realising the full potential that digital data have tooffer [208]. However, instead of looking for the optimal solution according to one dogmatic paradigm, it isbest to accept that these aerial imaging products also have their limits. As such, this paper advocates thevision that archaeologists should try to combine the complementary strengths of different theoretical andanalytical methodologies while sticking to a healthy amount of source-criticism and scepticism. Only thencan the combination of computing power and this new digital imagery provide new archaeologicalinsights, regardless of the theoretical framework.
8. Conclusions
Archaeologists need to reflect on the ever-expanding array of specialised topics and methodsto continue their integration and to combine their different strands of thinking. In most of the cases,archaeologists try to build data by systematically observing the preserved archaeological record.The combination of any pre-existing intellectual perspective and the research problem ultimately—butoften unconsciously—determine which observations are made. Finally, the data collection tool that isused determines the exact nature of these observations. This paper has taken a reflexive approach tohow archaeologists with different (but often unknown) theoretical convictions have been acquiringpassive optical imagery from the air. Starting from the concept of landscape archaeology, the principlesof archaeological remote sensing and the need for bias reduction when sampling the archaeologicalrecord, the author has tried to assess all passive airborne optical imaging approaches in terms of eightessential characteristics, which all bear the potential to increase or decrease the subjectivity and bias inthe acquired image set.
Although archaeological optical imagery is never an ‘objective’ or theory-neutral dataset, it hasbeen shown that the amount of data favouritism and partiality can easily be significantly reduced.This reflection is not to diminish the importance of data collection strategies used so far. Even thoughthe observer-led passive airborne imaging approach of the early years was entirely appropriate,as “the imperative then was to record as many previously unknown monuments as quickly aspossible” [209] (p. 65), this essentially site-based methodology seems nowadays at odds with manycurrent core conceptions of landscape archaeology. However, also the conventional multi- andhyperspectral imaging approaches have proven to be inherently flawed, be it by their sampling

Geosciences 2017, 7, 86 22 of 33
design, cost, instrument availability or processing complexity. As a result, they also cannot preventhighly biased data collection and usage.
Can any form of meaningful insight about the past be obtained at all if biased remote sensingmethods continue to generate some of the key datasets in landscape archaeology? How can one argumentin a coherent way if the data at hand do not allow for a proper evaluation of the argumentation? Insteadof considering possible answers to these questions, this paper started from an intellectually-integrativeapproach to landscape archaeology to propose a new technological-methodological data acquisitionstrategy. This attempt is based on assumptions that (1) any lack of understanding all inherent airbornedata flaws will be prone to erroneous and unsupportable conclusions and that (2) remote sensing willbecome ever more integral to the process of understanding the human past and that (3) to “extractthe most complete understanding of the settlement dynamics of an extensive territory requires theapplication of special field methods” [52] (p. 23).
One might say that the attention for the method and the need to exhaustively and cumulativelycollect imagery exemplifies a positivistic, empirical approach to archaeology. However, the need tooptimise data collection in various dimensions does not hamper its interpretation. Although this paperadvocates in true processual style a standardisation of practice and aims at systematic, repeatableimaging surveys with better sampling characteristics, it does not advocate a separation betweenobservation and interpretation, between analytical and interpretive archaeologies. The attentiongiven to the analytical method of aerial survey does not prevent an interpretative approach to thedata, nor does it mean that one will automatically better know the past or that cognitive objectivityis assumed.
This ties directly into the question of the fitness-for-purpose of aerial imaging in landscapearchaeology and the seemingly logical follow-up argument that there is a need for an initial broad-brushlandscape characterisation approach to determine those portions of the study area for which passiveairborne imaging has archaeological potential [210]. First, a major part of this argument stems fromthe fact that broadband photography in the visible spectrum has always been the de facto way ofaerial imaging. This approach does indeed often fail in less-than-optimal circumstances (see Section 5).Despite the fact that Taylor already wrote forty years ago that “Continuous reconnaissance, using newtechniques, over areas normally regarded as poor or unrewarding is a basic need for future fieldarchaeology” [211] (p. 140), unrewarding or ‘unresponsive’ zones have seldom been targeted withmore specific imaging approaches such as those presented in this paper.
Second, this type of criticism regularly contrasts aerial optical imaging with geophysicalapproaches and excavation techniques (e.g., [17]), both of which are often considered to deliveruniform data sets that provide almost absolute knowledge about the archaeology hidden within thesoil matrix (excavations even more so that geophysics [212]). However, the chemical and physicalproperties of the soil with its embedded archaeological residues as well as the sensor characteristicsboth limit all three approaches to landscape investigation. It is a well-known but often neglected factthat excavations might fail to uncover archaeological features that are revealed by both remote sensingand geophysics [213,214]. Although this situation might cause serious incomprehension among manyarchaeologists, it is not difficult to understand that a geophysically measured contrast (such as anincrease in magnetic susceptibility) does not have to translate into a colour difference (which is thecontrast on which the human visible system or a standard photographic camera relies).
On the other hand, geophysical sensors might be unable to record archaeological features incertain conditions. For instance, high topsoil salinity or wet and clayish conditions can renderground-penetrating radar almost useless. As a result, archaeological features might show up inaerial photographs but not in geophysical datasets [215,216]. Since both excavations and geophysicalmethods can only recover some specific aspects of the preserved archaeological record, their data arethus by default also incomplete. While excavations and geophysical prospection usually have a betterreputation regarding their archaeological effectiveness and data consistency, they thus also suffer fromthe uncontrollable biases that characterise passive airborne optical imaging.

Geosciences 2017, 7, 86 23 of 33
Even though the number of data representativity issues might indeed be greater for airborneimaging, one should never consider the absence of any archaeological evidence as proof ofarchaeological absence for any of these three methods (or many other prospection methods for thatmatter). Despite the inherent biases in their recovered archaeological record, both excavation andgeophysical survey oriented archaeologists generally accept that dense sampling of large, continuousareas is key to properly understand what is going on at a site or landscape level [217–219]. This paperfollowed the same reasoning. Only when the sampling is done properly, one can combine the aerialimagery with colluvial, alluvial and aeolian records [149] or other data sources to assess and trulyunderstand the biases imposed by topography, environmental factors and land uses. Otherwise,any assessment of fitness-for-purpose of the aerial imagery for answering particular landscapearchaeology questions or any broad-brush landscape characterisation to matching survey methodologyto local context seems the wrong way around.
Since the proposed approach has the potential to remove many of the major and controllable datagathering biases, the resulting image sets should enable holders of rival theories to agree on the fact thatthese data are archaeologically useable. Finally, imagery collected in such a non- (or less) selective waycan also be of use to subsequent studies that might have largely different scopes. Or it can facilitatedata examination with oppositional analytical and interpretative approaches. In this way, it is hopedthat we can build, in combination with many other data sets, potentially novel, more robust andricher understandings of the landscapes that are diachronically and synchronically constituted by thereciprocal relationships between human and their environment.
Acknowledgments: The author would like to thank Seta Štuhec and three anonymous reviewers for their feedbackon the first draft of this paper. Not all the members of the author’s host institution, LBI ArchPro, necessarilyshare the opinions expressed in this article which are very much those of the author. The Ludwig BoltzmannInstitute for Archaeological Prospection and Virtual Archaeology (archpro.lbg.ac.at) is based on the internationalcooperation of the Ludwig Boltzmann Gesellschaft (A), the University of Vienna (A), the Vienna University ofTechnology (A), ZAMG, the Austrian Central Institute for Meteorology and Geodynamics (A), the Province ofLower Austria (A), Airborne Technologies (A), 7 reasons (A), the Austrian Academy of Sciences (A), the AustrianArchaeological Institute (A), RGZM, the Roman-Germanic Central Museum Mainz (D), the National HistoricalMuseums—Contract Archaeology Service (S), the University of Birmingham (GB), the Vestfold County Council(N) and NIKU, the Norwegian Institute for Cultural Heritage Research (N).
Author Contributions: Geert Verhoeven conceived and wrote the whole paper. He also created all illustrations.
Conflicts of Interest: The author declares no conflict of interest.
References
1. Gramsch, A. Theory in Central European Archaeology: Dead or alive? In The Death of Archaeological Theory;Bintliff, J.L., Pearce, M., Eds.; Oxbow: Oxford, UK, 2011; pp. 48–71.
2. Raczkowski, W. Archeologia Lotnicza. Metoda Wobec Teorii; Wydawnictwo Naukowe Uniwersytetu im.Adama Mickiewicza: Poznan, Poland, 2002.
3. Brophy, K.; Cowley, D.C. (Eds.) From the Air. Understanding Aerial Archaeology; Tempus: Stroud, UK, 2005.4. Cowley, D.C. What kind of gaps? Some approaches to understanding bias in remote sensing data.
Archeol. Aerea 2013, 7, 76–88.5. Hanson, W.S. The Future of Aerial Archaeology (or Are Algorithms the Answer?). In Remote Sensing for
Archaeology and Cultural Heritage Management, Proceedings of the 1st International EARSeL Workshop, CNR,Rome, 30 September–4 October 2008; Lasaponara, R., Masini, N., Eds.; Arracne: Rome, Italy, 2008; pp. 47–50.
6. Raczkowski, W. Beyond the technology: Do we need ‘meta-aerial archaeology’? In Aerial Archaeology:Developing Future Practice; Bewley, R.H., Raczkowski, W., Eds.; IOS Press: Amsterdam, The Netherlands,2002; pp. 311–327.
7. Raczkowski, W. Why interpretation?: Chairman’s Piece. AARGnews 2009, 39, 5–8.8. Raczkowski, W. Towards integration: Two prospection methods and some thoughts. In From Space to Place,
Proceedings of the 2nd International Conference on Remote Sensing in Archaeology, CNR, Rome, Italy, 4–7 December 2006;Campana, S., Forte, M., Eds.; Archaeopress: Oxford, UK, 2006; pp. 203–206.

Geosciences 2017, 7, 86 24 of 33
9. Campana, S. Sensing Ruralscapes. Third-Wave Archaeological Survey in the Mediterranean Area. In DigitalMethods and Remote Sensing in Archaeology: Archaeology in the Age of Sensing; Forte, M., Campana, S., Eds.;Springer: Cham, Switzerland, 2016; pp. 113–145.
10. Verhoeven, G.J.J. BRDF and Its Impact on Aerial Archaeological Photography. Archaeol. Prospect. 2017, 24,133–140. [CrossRef]
11. Verhoeven, G.J.J. Beyond Conventional Boundaries. New Technologies, Methodologies, and Procedures forthe Benefit of Aerial Archaeological Data Acquisition and Analysis. Ph.D. Dissertation, Ghent University,Zelzate, Belgium, 2009.
12. Verhoeven, G.J.J.; Sevara, C. Trying to Break New Ground in Aerial Archaeology. Remote Sens. 2016, 8, 918.[CrossRef]
13. Powlesland, D. Why bother? Large scale geomagnetic survey and the quest for “Real Archaeology”. In Seeingthe Unseen: Geophysics and Landscape Archaeology; Campana, S., Piro, S., Eds.; CRC Press/Balkema: Boca Raton,FL, USA; Leiden, The Netherlands, 2009; pp. 167–182.
14. Campana, S. ‘Total Archaeology’ to reduce the need for Rescue Archaeology: The BREBEMI Project (Italy).In Remote Sensing for Archaeological Heritage Management, Proceedings of the 11th EAC Heritage ManagementSymposium, Reykjavík, Iceland, 25–27 March 2010; Cowley, D.C., Ed.; Europae Archaeologia Consilium (EAC),Association Internationale sans But Lucratif (AISBL): Brussels, Belgium, 2011; pp. 33–41.
15. Taylor, C.C. Total Archaeology or studies in the history of the landscape. In Landscapes and Documents;Rogers, A., Rowley, T., Eds.; Bedford Square Press of the National Council of Social Service: London, UK,1974; pp. 15–26.
16. Lock, G. Using Computers in Archaeology: Towards Virtual Pasts; Routledge: London, UK; New York, NY,USA, 2003.
17. Cheetham, P.N. Noninvasive Subsurface Mapping Techniques, Satellite and Aerial Imagery in LandscapeArchaeology. In Handbook of Landscape Archaeology, 1st ed.; David, B., Thomas, J., Eds.; Left Coast:Walnut Creek, CA, USA, 2010; pp. 562–582.
18. Cowley, D.C. What Do the Patterns Mean? Archaeological Distributions and Bias in Survey Data. In DigitalMethods and Remote Sensing in Archaeology: Archaeology in the Age of Sensing; Forte, M., Campana, S., Eds.;Springer: Cham, Switzerland, 2016; pp. 147–170.
19. Rodaway, P. Sensuous Geographies: Body, Sense and Place; Routledge: New York, NY, USA, 1994.20. Wylie, J. Landscape; Routledge: Abingdon, UK, 2007.21. Bender, B. (Ed.) Landscape. Politics and Perspectives; Berg: Providence, RI, USA; Oxford, UK, 1993.22. Bruns, D.; Kühne, O.; Schönwald, A.; Theile, S. (Eds.) Landscape Culture—Culturing Landscapes. The Differentiated
Construction of Landscapes; Springer: Wiesbaden, Germany, 2015.23. Witcher, R.E. GIS and Landscapes of Perception. In Geographical Information Systems and Landscape Archaeology;
Gillings, M., Mattingly, D.J., van Dalen, J., Eds.; Oxbow Books: Oxford, UK, 1999; pp. 13–22.24. Denham, T. Landscape Archaeology. In Encyclopedia of Geoarchaeology; Gilbert, A.S., Goldberg, P.,
Holliday, V.T., Mandel, R.D., Sternberg, R.S., Eds.; Springer: Dordrecht, The Netherlands, 2016; pp. 464–468.25. Mlekuž, D. Messy landscapes: Lidar and the practices of landscaping. In Interpreting Archaeological Topography:
3D Data, Visualisation and Observation; Opitz, R.S., Cowley, D.C., Eds.; Oxbow Books: Oxford, UK; Oakville,ON, Canada, 2013; pp. 88–99.
26. Mlekuž, D. Messy landscapes manifesto. AARGnews 2012, 44, 22–23.27. Darvill, T. Pathways to a Panoramic Past: A Brief History of Landscape Archaeology in Europe. In Handbook
of Landscape Archaeology, 1st ed.; David, B., Thomas, J., Eds.; Left Coast: Walnut Creek, CA, USA, 2010;pp. 60–76.
28. Aston, M.; Rowley, T. Landscape Archaeology. An Introduction to Fieldwork Techniques on Post-Roman Landscapes;David and Charles: Newton Abbot, UK, 1974.
29. Yamin, R.; Metheny, K.B. Landscape Archaeology. Reading and Interpreting the American Historical Landscape;University of Tennessee Press: Knoxville, TN, USA, 1996.
30. Ingold, T. The temporality of the landscape. World Archaeol. 1993, 25, 152–174. [CrossRef]31. Johnson, M. Ideas of Landscape; Blackwell: Oxford, UK, 2007.32. Knapp, A.B.; Ashmore, W. Archaeological Landscapes: Constructed, Conceptualized, Ideational.
In Archaeologies of Landscape: Contemporary Perspectives; Ashmore, W., Knapp, A.B., Eds.; Blackwell: Malden,MA, USA, 1999; pp. 1–30.

Geosciences 2017, 7, 86 25 of 33
33. Ebert, J.I. Distributional Archaeology, 1st ed.; University of New Mexico Press: Albuquerque, NM, USA, 1992.34. Thomas, D.H. Nonsite Sampling in Archaeology: Up the Creek Without a Site? In Sampling in Archaeology;
Mueller, J.W., Ed.; University of Arizona Press: Tucson, AZ, USA, 1975; pp. 61–81.35. Dunnell, R.C. The Notion Site. In Space, Time, and Archaeological Landscapes; Rossignol, J., Wandsnider, L., Eds.;
Springer: Boston, MA, USA, 1992; pp. 21–41.36. Dunnell, R.C.; Dancey, W.S. The Siteless Survey: A regional Scale Data Collection Strategy. In Advances in
Archaeological Method and Theory; Schiffer, M.B., Ed.; Academia Press: New York, NY, USA, 1983; Volume 6,pp. 267–287.
37. Foley, R. Off-site archaeology: An alternative approach for the short-sited. In Pattern of the Past: Studies inHonour of David Clarke; Hodder, I., Isaac, G., Hammond, N., Eds.; Cambridge University Press: Cambridge,UK, 1981; pp. 157–183.
38. Bradley, R. An Archaeology of Natural Places; Routledge: Abingdon, UK, 2000.39. Tilley, C.Y. A Phenomenology of Landscape. Places, Paths, and Monuments; Berg: Oxford, UK, 1994.40. Gramsch, A. Landscape Archaeology: Of Making and Seeing. J. Eur. Archaeol. 2013, 4, 19–38. [CrossRef]41. Herring, P. The past informs the future; Landscape archaeology and historic landscape characterisation
in the UK. In Landscape Archaeology between Art and Science: From a Multi- to an Interdisciplinary Approach;Kluiving, S.J., Gutmann-Bond, E.B., Eds.; Amsterdam University Press: Amsterdam, The Netherlands, 2012;pp. 485–501.
42. Thomas, J. Archaeology, Landscape, and Dwelling. In Handbook of Landscape Archaeology, 1st ed.; David, B.,Thomas, J., Eds.; Left Coast: Walnut Creek, CA, USA, 2010; pp. 300–306.
43. Bender, B. Introduction: Landscape—Meaning and action. In Landscape: Politics and Perspectives; Bender, B., Ed.;Berg: Providence, RI, USA; Oxford, UK, 1993; pp. 1–18.
44. Boaz, J.S.; Uleberg, E. The potential of GIS-based studies of Iron Age cultural landscapes in eastern Norway.In Archaeology and Geographical Information Systems: A European Perspective; Lock, G.R., Stancic, Z., Eds.;Taylor & Francis: London, UK, 1995; pp. 249–259.
45. Mlekuž, D. Skin Deep: LiDAR and Good Practice of Landscape Archaeology. In Good Practice in ArchaeologicalDiagnostics: Non-Invasive Survey of Complex Archaeological Sites; Corsi, C., Slapšak, B., Vermeulen, F., Eds.;Springer: Cham, Switzerland, 2013; pp. 113–129.
46. David, B.; Thomas, J. (Eds.) Handbook of Landscape Archaeology, 1st ed.; Left Coast: Walnut Creek, CA, USA, 2010.47. Doneus, M. Die Hinterlassene Landschaft—Prospektion und Interpretation in der Landschaftsarchäologie;
Verlag der Österreichischen Akademie der Wissenschaften: Wien, Austria, 2013.48. Ashmore, W.; Knapp, A.B. (Eds.) Archaeologies of Landscape: Contemporary Perspectives; Blackwell: Malden,
MA, USA, 1999.49. Novakovic, P. Osvajanje Prostora. Razvoj Prostorske in Krajinske Arheologije; Filozofska Fakulteta: Ljubljana,
Slovenia, 2003.50. Denham, T. Environmental Archaeology: Interpreting Practices-in-the-Landscape through Geoarchaeology.
In Handbook of Landscape Archaeology, 1st ed.; David, B., Thomas, J., Eds.; Left Coast: Walnut Creek, CA, USA,2010; pp. 468–481.
51. Barber, M. A History of Aerial Photography and Archaeology. Mata Hari’s Glass Eye and Other Stories;English Heritage: Swindon, UK, 2011.
52. Gojda, M. (Ed.) Ancient Landscape, Settlement Dynamics and Non-Destructive Archaeology. Czech Research Project1997–2002 (Dávnoveká Krajina a Sídla ve Svetle Nedestruktivní Archeologie: Ceský Výzkumný Projekt 1997–2002);Academia: Prague, Czech Republic, 2004.
53. Sever, T.L. Remote Sensing Methods. In Science and Technology in Historic Preservation; Williamson, R.A.,Nickens, P.R., Eds.; Springer: New York, NY, USA, 2000; pp. 21–51.
54. Millican, K. The Outside Inside: Combining Aerial Photographs, Cropmarks and Landscape Experience.J. Archaeol. Method Theory 2012, 19, 548–563. [CrossRef]
55. Hu, D. Advancing Theory? Landscape Archaeology and Geographical Information Systems. Pap. Inst. Archaeol.2011, 21, 80–90. [CrossRef]
56. Pasquinucci, M.; Trément, F. (Eds.) Non-Destructive Techniques Applied to Landscape Archaeology; Oxbow Books:Oxford, UK, 2000.

Geosciences 2017, 7, 86 26 of 33
57. Frachetti, M. Digital archaeology and the scalar structure of pastoral landscapes: Modeling mobile societiesof prehistoric central Aasia. In Digital Archaeology: Bridging Method and Theory; Daly, P.T., Evans, T.L., Eds.;Routledge: London, UK, 2006; pp. 128–147.
58. Bowden, M. (Ed.) Unravelling the Landscape. An Inquisitive Approach to Archaeology; The History Press: Stroud,UK, 2013.
59. Haupt, P. Landschaftsarchäologie. Eine Einführung; WBG (Wissenschaftliche Buchgesellschaf): Darmstadt,Germany, 2012.
60. Campana, S. Towards mapping the archaeological continuum. New perspectives and current limitationsinPlanning-Led-Archaeology in Italy. In Looking to the Future, Caring for the Past: Preventive Archaeology inTheory and Practice; Boschi, F., Ed.; Bononia University Press: Bologna, Italy, 2016; pp. 27–40.
61. Vermeulen, F. Aerial survey in an Italian landscape: From archaeological site-detection and monitoring toprevention and management. In Looking to the Future, Caring for the Past: Preventive Archaeology in Theory andPractice; Boschi, F., Ed.; Bononia University Press: Bologna, Italy, 2016; pp. 135–146.
62. Johnson, J.K. (Ed.) Remote Sensing in Archaeology. An Explicitly North American Perspective; University ofAlabama Press: Tuscaloosa, AL, USA, 2006.
63. David, A. Finding Sites. In Archaeology in Practice: A Student Guide to Archaeological Analyses; Balme, J.,Paterson, A., Eds.; Blackwell Publishing: Malden, MA, USA, 2006; pp. 1–38.
64. Crutchley, S.; Crow, P. The Light Fantastic. Using Airborne Lidar in Archaeological Survey, 1st ed.;English Heritage: Swindon, UK, 2010.
65. Doneus, M.; Briese, C.; Fera, M.; Janner, M. Archaeological prospection of forested areas using full-waveformairborne laser scanning. J. Archaeol. Sci. 2008, 35, 882–893. [CrossRef]
66. Doneus, M.; Doneus, N.; Briese, C.; Pregesbauer, M.; Mandlburger, G.; Verhoeven, G.J.J. Airborne LaserBathymetry—Detecting and recording submerged archaeological sites from the air. J. Archaeol. Sci. 2013, 40,2136–2151. [CrossRef]
67. Doneus, M.; Briese, C. Airborne Laser Scanning in forested areas—Potential and limitations of anarchaeological prospection technique. In Remote Sensing for Archaeological Heritage Management, Proceedingsof the 11th EAC Heritage Management Symposium, Reykjavík, Iceland, 25–27 March 2010; Cowley, D.C., Ed.;Europae Archaeologia Consilium (EAC), Association Internationale sans But Lucratif (AISBL): Brussels,Belgium, 2011; pp. 59–76.
68. Opitz, R.S.; Cowley, D.C. (Eds.) Interpreting Archaeological Topography: 3D Data, Visualisation and Observation;Oxbow Books: Oxford, UK; Oakville, ON, Canada, 2013.
69. Briese, C.; Pfennigbauer, M.; Lehner, H.; Ullrich, A.; Wagner, W.; Pfeifer, N. Radiometric calibration ofmulti-wavelength airborne laser scanning data. In Proceedings of the XXII ISPRS Congress, TechnicalCommission VII. Imaging a Sustainable Future, Melbourne, Australia, 25 August–1 September 2012;Shortis, M.R., Wagner, W., Hyyppä, J., Eds.; International Society for Photogrammetry and Remote Sensing(ISPRS): Melbourne, Australia, 2012; pp. 335–340.
70. Briese, C.; Doneus, M.; Verhoeven, G.J.J. Radiometric calibration of ALS data for archaeological Interpretation.In Archaeological Prospection, Proceedings of the 10th International Conference on Archaeological Prospection, Vienna,Austria, 29 May–2 June 2013; Neubauer, W., Trinks, I., Salisbury, R.B., Einwögerer, C., Eds.; Austrian Academyof Sciences: Vienna, Austria, 2013; pp. 427–429.
71. Wilson, D.R. Air Photo Interpretation for Archaeologists, 2nd ed.; Tempus: Stroud, UK, 2000.72. Palmer, J.M.; Grant, B.G. The Art of Radiometry; SPIE Press: Bellingham, DC, USA, 2010.73. Ohno, Y. Basic concepts in photometry, radiometry and colorimetry. In Handbook of Optoelectronics; Dakin, J.P.,
Brown, R.G.W., Eds.; Taylor & Francis: Boca Raton, FL, USA, 2006; pp. 287–305.74. Schowengerdt, R.A. Remote Sensing. Models and Methods for Image Processing, 3rd ed.; Academic Press:
Burlington, ON, Canada, 2007.75. Lasaponara, R.; Masini, N. (Eds.) Satellite Remote Sensing. A New Tool for Archaeology; Springer: Dordrecht,
The Netherlands, 2012.76. Parcak, S.H. Satellite Remote Sensing for Archaeology; Routledge: London, UK; New York, NY, USA, 2009.77. Comer, D.C.; Harrower, M.J. (Eds.) Mapping Archaeological Landscapes from Space; Springer: New York, NY,
USA, 2013.78. Hanson, W.S.; Oltean, I.A. (Eds.) Archaeology from Historical Aerial and Satellite Archives; Springer: New York,
NY, USA, 2013.

Geosciences 2017, 7, 86 27 of 33
79. Scardozzi, G. An introduction to satellite remote sensing in archaeology: State of the art, methods,and applications. In Looking to the Future, Caring for the Past: Preventive Archaeology in Theory and Practice;Boschi, F., Ed.; Bononia University Press: Bologna, Italy, 2016; pp. 217–239.
80. Drennan, R.D. Statistics for Archaeologists. A Common Sense Approach, 2nd ed.; Springer: Dordrecht,The Netherlands, 2009.
81. Clarke, D.L. Archaeology: The loss of innocence. Antiquity 1973, 47, 6–18. [CrossRef]82. Cowgill, G.L. Some Sampling and Reliability Problems in Archaeology. In Archéologie et Calculateurs:
Problèmes Sémiologiques et Mathématiques, Proceedings of the Colloques Internationaux du Centre National de laRecherche Scientifique: Sciences Humaines, Marseille, France, 7–12 April 1969; Gardin, J.-C., Ed.; Centre Nationalde la Récherche Scientifique: Paris, France, 1970; pp. 161–175.
83. Collins, M.B. Sources of bias in processual data: An appraisal. In Sampling in Archaeology; Mueller, J.W., Ed.;University of Arizona Press: Tucson, AZ, USA, 1975; pp. 26–32.
84. Schiffer, M.B. Formation Processes of the Archaeological Record; University of Utah Press: Salt Lake City, UT,USA, 1996.
85. Grabe, M. Measurement Uncertainties in Science and Technology; Springer: Cham, Germany, 2014.86. Nativ, A. No Compensation Needed: On Archaeology and the Archaeological. J. Archaeol. Method Theory
2017, 24, 659–675. [CrossRef]87. Cherry, J.F.; Gamble, C.; Shennan, S. (Eds.) Sampling in Contemporary British Archaeology; British Archaeological
Reports (B.A.R.): Oxford, UK, 1978.88. Orton, C.R. Sampling in Archaeology; Cambridge University Press: Cambridge, UK, 2000.89. Mueller, J.W. (Ed.) Sampling in Archaeology; University of Arizona Press: Tucson, AZ, USA, 1975.90. Schiffer, M.B. Toward the Identification of Formation Processes. Am. Antiq. 1983, 48, 675–706. [CrossRef]91. VanPool, T.L.; Leonard, R.D. Quantitative Analysis in Archaeology; Wiley-Blackwell: Chichester, UK, 2011.92. Lyman, R.L.; VanPool, T.L. Metric Data in Archaeology: A Study of Intra-analyst and Inter-analyst Variation.
Am. Antiq. 2009, 74, 485–504. [CrossRef]93. Bentley, R.A.; Maschner, H.D.G.; Chippindale, C. (Eds.) Handbook of Archaeological Theories; AltaMira Press:
Lanham, MD, USA, 2008.94. Wallace, S. Contradictions of Archaeological Theory. Engaging Critical Realism and Archaeological Theory;
Routledge: Abingdon, UK; New York, NY, USA, 2011.95. Bintliff, J.L. The Death of Archaeological Theory? In The Death of Archaeological Theory; Bintliff, J.L.,
Pearce, M., Eds.; Oxbow: Oxford, UK, 2011; pp. 7–22.96. Johnson, M.H. On the nature of theoretical archaeology and archaeological theory. Archaeol. Dialogues 2006,
13, 117–132. [CrossRef]97. Pearce, M. Have Rumours of the ‘Death of Theory’ been Exaggerated? In The Death of Archaeological Theory;
Bintliff, J.L., Pearce, M., Eds.; Oxbow: Oxford, UK, 2011; pp. 80–89.98. Raczkowski, W. Aerial Archaeology. In Encyclopedia of Global Archaeology; Smith, C., Ed.; Springer: New York,
NY, USA, 2014; pp. 33–38.99. Hodder, I. The Archaeological Process. An Introduction; Blackwell: Oxford, UK, 1999.100. Banaszek, Ł. Przeszłe Krajobrazy w Chmurze Punktów; Wydawnictwo Naukowe Uniwersytetu im. Adama
Mickiewicza: Poznan, Poland, 2015.101. Chapman, R.; Wylie, A. Evidential Reasoning in Archaeology; Bloomsbury Academic: London, UK; New York,
NY, USA, 2016.102. Gojda, M. The Archaeology of Lowlands: A Few Remarks on the Methodology of Aerial Survey.
In Landscape Ideologies; Meier, T., Ed.; Archaeolingua Alapítvány: Budapest, Hungary, 2006; pp. 117–123.103. Muller, R.A. Now. The Physics of Time, 1st ed.; W.W. Norton & Company: New York, NY, USA, 2016.104. Stewart, I. One hundred and one dimensions. New Sci. 1995, 148, 28–31.105. Born, M.; Wolf, E. Principles of Optics. Electromagnetic Theory of Propagation, Interference and Diffraction of Light,
7th ed.; Cambridge University Press: Cambridge, UK, 1999.106. Verhoeven, G.J.J. Basics of photography for cultural heritage imaging. In 3D Recording, Documentation and
Management of Cultural Heritage; Stylianidis, E., Remondino, F., Eds.; Whittles Publishing: Caithness, UK,2016; pp. 127–251.
107. Crawford, O.G.S. Air Survey and Archaeology; Ordnance Survey: Southampton, UK, 1924.108. Crawford, O.G.S.; Keiller, A. Wessex from the Air; Oxford University Press: Oxford, UK, 1928.

Geosciences 2017, 7, 86 28 of 33
109. Crawford, O.G.S. Air Photographs of the Middle East: A Paper Read at the Evening Meeting of the Societyon 18 March 1929. Geogr. J. 1929, 73, 497–509. [CrossRef]
110. Wilson, D.R. Photographic Techniques in the Air. In Aerial Reconnaissance for Archaeology; Wilson, D.R., Ed.;Council for British Archaeology: London, UK, 1975; pp. 12–31.
111. Crawshaw, A. Oblique Aerial Photography-Aircraft, Cameras and Films. In Proceedings of the Luftbildarchäologiein Ost- und Mitteleuropa/Aerial Archaeoloy in Eastern and Central Europe: Internationales Symposium,Kleinmachnow, Germany, 26–30 September 1994; Kunow, J., Ed.; Verlag Brandenburgisches Landesmuseumfür Ur- und Frühgeschichte: Potsdam, Germany, 1995; pp. 67–76.
112. Harman, W.E., Jr.; Miller, R.H.; Park, W.S.; Webb, J.P. Aerial photography. In Manual of Photogrammetry,3rd ed.; Thompson, M.M., Eller, R.C., Radlinski, W.A., Speert, J.L., Eds.; American Society of Photogrammetry:Falls Church, VA, USA, 1966; Volume I, pp. 195–242.
113. Schneider, S. Luftbild und Luftbildinterpretation; Walter de Gruyter: Berlin, Germany; New York, NY,USA, 1974.
114. Palmer, R. If they used their own photographs they would not take them like that. In From the Air: UnderstandingAerial Archaeology; Brophy, K., Cowley, D.C., Eds.; Tempus: Stroud, UK, 2005; pp. 94–116.
115. Read, R.E.; Graham, R. Manual of Aerial Survey. Primary Data Acquisition; CRC Press/Whittles Publishing:Boca Raton, FL, USA, 2002.
116. The British Academy. Aerial Survey for Archaeology. Report of a British Academy Working Party 1999; The BritishAcademy: London, UK, 2001.
117. Musson, C.; Palmer, R.; Campana, S. Flights into the Past. Aerial Photography, Photo Interpretation and Mappingfor Archaeology; AARG—ArcLand: Heidelberg, Germany, 2013.
118. Palmer, R. Aerial archaeology and sampling. In Sampling in Contemporary British Archaeology; Cherry, J.F.,Gamble, C., Shennan, S., Eds.; British Archaeological Reports (B.A.R.): Oxford, UK, 1978; pp. 129–148.
119. Wilson, D.R. Bias in aerial reconnaissance. In From the Air: Understanding Aerial Archaeology; Brophy, K.,Cowley, D.C., Eds.; Tempus: Stroud, UK, 2005; pp. 64–72.
120. St Joseph, J.K.S. Air Reconnaissance of Roman Scotland, 1939-75. Glasg. Archaeol. J. 1976, 4, 1–28. [CrossRef]121. Jones, R.H. The advantages of bias in Roman studies. In From the Air: Understanding Aerial Archaeology;
Brophy, K., Cowley, D.C., Eds.; Tempus: Stroud, UK, 2005; pp. 86–93.122. Gould, R.A. Archaeological Survey by Air: A Case from the Australian Desert. J. Field Archaeol. 1987, 14,
431–443. [CrossRef]123. Coleman, S. Taking Advantage: Vertical Aerial Photographs Commissioned for Local Authorities.
In Populating Clay Landscapes; Mills, J., Palmer, R., Eds.; Tempus: Stroud, UK, 2007; pp. 28–33.124. Doneus, M. Vertical and Oblique Photographs. AARGnews 2000, 20, 33–39.125. Mills, J. Bias and the World of the Vertical Aerial Photograph. In From the Air: Understanding Aerial Archaeology;
Brophy, K., Cowley, D.C., Eds.; Tempus: Stroud, UK, 2005; pp. 117–126.126. Palmer, R. Seventy-Five Years v. Ninety Minutes: Implications of the 1996 Bedfordshire Vertical Aerial
Survey on our Perceptions of Clayland Archaeology. In Populating Clay Landscapes; Mills, J., Palmer, R., Eds.;Tempus: Stroud, UK, 2007; pp. 88–103.
127. Palmer, R. Editorial. AARGnews 1996, 13, 3. [CrossRef]128. Cowley, D.C. A case study in the analysis of patterns of aerial reconnaissance in a lowland area of southwest
Scotland. Archaeol. Prospect. 2002, 9, 255–265. [CrossRef]129. Doneus, M. On the archaeological use of vertical photographs. AARGnews 1997, 15, 23–27.130. Slater, P.N.; Doyle, F.J.; Fritz, N.L.; Welch, R. Photographic systems for remote sensing. In Manual of Remote
Sensing: Volume 1: Theory, Instruments and Techniques, 2nd ed.; Colwell, R.N., Simonett, D.S., Ulaby, F.T., Eds.;American Society of Photogrammetry: Falls Church, VA, USA, 1983; pp. 231–291.
131. Estes, J.E.; Hajic, E.J.; Tinney, L.R.; Carver, L.G.; Cosentino, M.J.; Mertz, F.C.; Pazner, M.I.; Ritter, L.R.;Sailer, C.T.; Stow, D.A.; et al. Fundamentals of Image Analyis: Analysis of Visible and Thermal InfraredData. In Manual of Remote Sensing: Theory, Instruments and Techniques, 2nd ed.; Colwell, R.N., Simonett, D.S.,Ulaby, F.T., Eds.; American Society of Photogrammetry: Falls Church, VA, USA, 1983; Volume 1, pp. 987–1124.
132. Spurr, S.H. Photogrammetry and Photo-Interpretation. With a Section on Applications to Forestry, 2nd ed.;The Ronald Press Company: New York, NY, USA, 1960.
133. Lemmens, M. Digital Oblique Aerial Cameras (1): A Survey of Features and Systems. GIM Int. 2014, 28,20–21, 23–25.

Geosciences 2017, 7, 86 29 of 33
134. Nurminen, K. Oblique aerial photographs—An “old-new” data source. Photogramm. J. Finl. 2015, 24, 1–19.[CrossRef]
135. Remondino, F.; Gerke, M. Oblique Aerial Imagery—A Review. In Photogrammetric Week 2015; Fritsch, D., Ed.;Wichmann/VDE Verlag: Belin/Offenbach, Germany, 2015; pp. 75–83.
136. IGI mbH. Penta DigiCAM. Available online: http://www.igi.eu/penta-digicam.html (accessed on 4 March 2016).137. Microsoft. UltraCam Osprey Prime II/Prime Lite. Available online: https://www.microsoft.com/en-us/
Ultracam/UltraCamOsprey.aspx (accessed on 4 March 2016).138. Rupnik, E.; Nex, F.; Toschi, I.; Remondino, F. Aerial multi-camera systems: Accuracy and block triangulation
issues. ISPRS J. Photogramm. Remote Sens. 2015, 101, 233–246. [CrossRef]139. Paine, D.P.; Kiser, J.D. Aerial Photography and Image Interpretation, 3rd ed.; Wiley: Hoboken, NJ, USA, 2012.140. General Staff. Notes on the Interpretation of Aeroplane Photographs; Revised March 1917; General Staff War Office:
London, UK, 1917.141. Haala, N.; Rothermel, M.; Cavegn, S. Extracting 3D urban models from oblique aerial images. In Proceedings
of the 2015 Joint Urban Remote Sensing Event (JURSE), Lausanne, Switzerland, 30 March–1 April 2015;IEEE: Piscataway, NJ, USA, 2015; pp. 1–4.
142. Xiao, J.; Gerke, M.; Vosselman, G. Building extraction from oblique airborne imagery based on robust façadedetection. ISPRS J. Photogramm. Remote Sens. 2012, 68, 56–68. [CrossRef]
143. Brophy, K.; Cowley, D.C. From the Air—An introduction. In From the Air: Understanding Aerial Archaeology;Brophy, K., Cowley, D.C., Eds.; Tempus: Stroud, UK, 2005; pp. 11–23.
144. Verhoeven, G.J.J. Near-Infrared Aerial Crop Mark Archaeology: From its Historical Use to Current DigitalImplementations. J. Archaeol. Method Theory 2012, 19, 132–160. [CrossRef]
145. Verhoeven, G.J.J. Exploring the Edges of the Unseen: An Attempt to Digital Aerial UV Photography. In RemoteSensing for Archaeology and Cultural Heritage Management, Proceedings of the 1st International EARSeL Workshop,CNR, Rome, 30 September–4 October 2008; Lasaponara, R., Masini, N., Eds.; Arracne: Rome, Italy, 2008; pp. 79–83.
146. Verhoeven, G.J.J.; Schmitt, K.D. An attempt to push back frontiers—Digital near-ultraviolet aerial archaeology.J. Archaeol. Sci. 2010, 37, 833–845. [CrossRef]
147. Carter, G.A.; Miller, R.L. Early detection of plant stress by digital imaging within narrow stress-sensitivewavebands. Remote Sens. Environ. 1994, 50, 295–302. [CrossRef]
148. Donoghue, D.N.M. Multispectral Remote Sensing for Archaeology. In Remote Sensing in Archaeology: XI Ciclodi Lezioni Sulla Ricerca Applicata in Archeologia, Certosa di Pontignano (Siena), 6–11 Dicembre 1999; Campana, S.,Forte, M., Eds.; All’Insegna del Giglio: Firenze, Italy, 2001; pp. 181–192.
149. Powlesland, D.; Lyall, J.; Hopkinson, G.; Donoghue, D.; Beck, M.; Harte, A.; Stott, D. Beneath the sand:Remote sensing, archaeology, aggregates and sustainability: A case study from Heslerton, the Vale ofPickering, North Yorkshire, UK. Archaeol. Prospect. 2006, 13, 291–299. [CrossRef]
150. Challis, K.; Kincey, M.; Howard, A.J. Airborne remote sensing of valley floor geoarchaeology using DaedalusATM and CASI. Archaeol. Prospect. 2009, 16, 17–33. [CrossRef]
151. Aqdus, S.A.; Drummond, J.; Hanson, W.S. Discovering Archaeological Cropmarks: A HyperspectralApproach. Int. Arch. Photogramm. Remote Sens. Spat. Inf. Sci. 2008, 37, 361–365.
152. Winterbottom, S.J.; Dawson, T. Airborne multi-spectral prospection for buried archaeology in mobile sanddominated systems. Archaeol. Prospect. 2005, 12, 205–219. [CrossRef]
153. Van der Meer, F.D.; de Jong, S.M. (Eds.) Imaging Spectrometry. Basic Principles and Prospective Applications;Kluwer Academic Publishers: Dordrecht, The Netherlands, 2001.
154. Shrestha, R.; Mansouri, A.; Hardeberg, J.Y. Multispectral imaging using a stereo camera: Concept, designand assessment. EURASIP J. Adv. Signal Process. 2011, 57, 1–15. [CrossRef]
155. Aqdus, S.A.; Hanson, W.S.; Drummond, J. The potential of hyperspectral and multi-spectral imagery toenhance archaeological cropmark detection: A comparative study. J. Archaeol. Sci. 2012, 39, 1915–1924.[CrossRef]
156. Bennett, R.; Welham, K.; Hill, R.A.; Ford, A.L.J. The Application of Vegetation Indices for the Prospection ofArchaeological Features in Grass-dominated Environments. Archaeol. Prospect. 2012, 19, 209–218. [CrossRef]
157. Cavalli, R.M.; Licciardi, G.A.; Chanussot, J. Detection of Anomalies Produced by Buried ArchaeologicalStructures Using Nonlinear Principal Component Analysis Applied to Airborne Hyperspectral Image. IEEE J.Sel. Top. Appl. Earth Obs. Remote Sens. 2012, 5, 1–12. [CrossRef]

Geosciences 2017, 7, 86 30 of 33
158. Verhoeven, G.J.J.; Doneus, M.; Atzberger, C.; Wess, M.; Ruš, M.; Pregesbauer, M.; Briese, C. New approachesfor archaeological feature extraction of airborne imaging spectroscopy data. In Archaeological Prospection,Proceedings of the 10th International Conference on Archaeological Prospection, Vienna, Austria, 29 May–2 June 2013;Neubauer, W., Trinks, I., Salisbury, R.B., Einwögerer, C., Eds.; Austrian Academy of Sciences: Vienna, Austria,2013; pp. 13–15.
159. Barnes, I. Aerial remote-sensing techniques used in the management of archaeological monuments on theBritish Army’s Salisbury Plain Training Area, Wiltshire, UK. Archaeol. Prospect. 2003, 10, 83–90. [CrossRef]
160. Bassani, C.; Cavalli, R.M.; Goffredo, R.; Palombo, A.; Pascucci, S.; Pignatti, S. Specific spectral bands fordifferent land cover contexts to improve the efficiency of remote sensing archaeological prospection: TheArpi case study. J. Cult. Herit. 2009, 10, e41–e48. [CrossRef]
161. Coren, F.; Visintini, D.; Prearo, G.; Sterzai, P. Integrating LiDAR Intensity Measures and Hyperspectral Data forExtracting of Cultural Heritage. In Proceedings of the Italy–Canada 2005 Workshop on 3D Digital imaging andModeling: Applications of Heritage, Industry, Medicine and Land, Padua, Italy, 17–18 March 2005.
162. Emmolo, D.; Franco, V.; Lo Brutto, M.; Orlando, P.; Villa, B. Hyperspectral Techniques and GIS for ArchaeologicalInvestigation. In Proceedings of the ISPRS 2004 Commission IV—Geo-Imagery Bridging Continents. XXthISPRS Congress, Istanbul, Turkey, 12–23 July 2004; Altan, O., Ed.; ISPRS: Istanbul, Turkey, 2004.
163. Forte, E.; Pipan, M.; Sugan, M. Integrated Geophysical Study of Archaeological Sites in the Aquileia Area.In Proceedings of the 1st Workshop on The New Technologies for Aquileia (NTA-2011), Aquileia, Italy,2 May 2011; Roberto, V., Ed.; Department of Mathematics and Computer Science, University of Udine:Udine, Italy, 2011.
164. Merola, P.; Allegrini, A.; Bajocco, S. Hyperspectral MIVIS data to investigate the Lilybaeum (Marsala)Archaeological Park. In Proceedings of the Remote Sensing for Environmental Monitoring, GIS Applications,and Geology V, Bruges, Belgium, 19 September 2005; Ehlers, M., Michel, U., Eds.; Society of Photo-OpticalInstrumentation Engineers (SPIE): Bellingham, WA, USA, 2005; pp. 212–222.
165. Pietrapertosa, C.; Vellico, M.; Sterzai, P.; Coren, F. Remote Sensing Applied to the Detection of ArchaeologicalBuried Structures in the Aquileia Site. In Proceedings of the 27◦ Convegno Nazionale GNGTS—2008,Trieste, Italy, 8 October 2008; pp. 368–372.
166. Traviglia, A. Integration of MIVIS Hyperspectral Remotely Sensed Data and Geographical InformationSystems to Study Ancient Landscapes: The Aquileia Case Study. Agri Centuriati 2005, 2, 139–170.
167. White, D.A. AVIRIS and Archaeology in Southern Arizona. In AVIRIS Proceedings; NASA Jet PropulsionLaboratory: Pasadena, CA, USA, 2003.
168. Doneus, M.; Verhoeven, G.J.J.; Atzberger, C.; Wess, M.; Ruš, M. New ways to extract archaeologicalinformation from hyperspectral pixels. J. Archaeol. Sci. 2014, 52, 84–96. [CrossRef]
169. Atzberger, C.; Wess, M.; Doneus, M.; Verhoeven, G.J.J. ARCTIS—A MATLAB® Toolbox for ArchaeologicalImaging Spectroscopy. Remote Sens. 2014, 6, 8617–8638. [CrossRef]
170. Carter, G.A. Ratios of leaf reflectances in narrow wavebands as indicators of plant stress. Int. J. Remote Sens.1994, 15, 697–703. [CrossRef]
171. Bewley, R.; Raczkowski, W. Past achievements and prospects for the future development of aerial archaeology:An introduction. In Aerial Archaeology: Developing Future Practice; Bewley, R.H., Raczkowski, W., Eds.; IOS Press:Amsterdam, The Netherlands, 2002; pp. 1–8.
172. Brugioni, D.A. The Serendipity Effect of Aerial Reconnaissance. Interdiscip. Sci. Rev. 1989, 14, 16–28.[CrossRef]
173. Crawshaw, A. Letter. AARGnews 1997, 14, 59.174. Gates, T. Recording upland landscapes: A personal account from Northumberland. In From the Air:
Understanding Aerial Archaeology; Brophy, K., Cowley, D.C., Eds.; Tempus: Stroud, UK, 2005; pp. 127–140.175. Wilson, D.R. Vertical versus oblique photography. AARGnews 2005, 20 (Suppl. S1), 32–34.176. Doody, M. Medium altitude aerial photographic survey in East Limerick and West Tipperary. J. Irish Archaeol.
2001, 10, 13–24.177. Doneus, M. Vom Luftbild zur Karte. In Aus der Luft-Bilder Unserer Geschichte: Luftbildarchäologie in
Zentraleuropa: Katalog zur Ausstellung; Oexle, J., Ed.; Landesamt für Archäologie mit Landesmuseum fürVorgeschichte: Dresden, Germany, 1997; pp. 38–45.
178. Warner, W.S.; Graham, R.W.; Read, R.E. Small Format Aerial Photography; Whittles Publishing: Caithness,UK, 1996.

Geosciences 2017, 7, 86 31 of 33
179. Graham, R.; Koh, A. Digital Aerial Survey. Theory and Practice; CRC Press/Whittles Publishing: Boca Raton,FL, USA, 2002.
180. Bäumker, M.; Brechtken, R.; Heimes, F.-J.; Richter, T. Practical Experiences with a High-Precision StabilisedCamera Platform Based on INS/(D)GPS. In Proceedings of the First North American Symposium on SmallFormat Aerial Photography, Cloquet, MN, USA, 14–17 October 1997; American Society for Photogrammetryand Remote Sensing: Bethesda, MD, USA, 1997; pp. 45–54.
181. Mills, J.P.; Newton, I.; Graham, R.W. Aerial Photography for Survey Purposes with a High Resolution,Small Format, Digital Camera. Photogramm. Rec. 1996, 15, 575–587. [CrossRef]
182. Imhof, R.K.; Doolittle, R.C. Mapping from oblique photographs. In Manual of Photogrammetry, 3rd ed.;Thompson, M.M., Eller, R.C., Radlinski, W.A., Speert, J.L., Eds.; American Society of Photogrammetry:Falls Church, VA, USA, 1966; Volume II, pp. 875–917.
183. Verhoeven, G.J.J.; Doneus, M.; Briese, C.; Vermeulen, F. Mapping by matching: A computer vision-basedapproach to fast and accurate georeferencing of archaeological aerial photographs. J. Archaeol. Sci. 2012, 39,2060–2070. [CrossRef]
184. Verhoeven, G.J.J.; Sevara, C.; Karel, W.; Ressl, C.; Doneus, M.; Briese, C. Undistorting the past:New techniques for orthorectification of archaeological aerial frame imagery. In Good Practice in ArchaeologicalDiagnostics: Non-Invasive Survey of Complex Archaeological Sites; Corsi, C., Slapšak, B., Vermeulen, F., Eds.;Springer: Cham, Switzerland, 2013; pp. 31–67.
185. Verhoeven, G.J.J. Mesh Is More—Using All Geometric Dimensions for the Archaeological Analysis andInterpretative Mapping of 3D Surfaces. J. Archaeol. Method Theory 2016, 1–35. [CrossRef]
186. Verhoeven, G.J.J.; Vermeulen, F. Engaging with the Canopy: Multi-Dimensional Vegetation MarkVisualisation Using Archived Aerial Images. Remote Sens. 2016, 8, 752. [CrossRef]
187. Kennedy, D.L.; Bewley, R.H. Ancient Jordan from the Air; Council for British Research in the Levant: London,UK, 2004.
188. Campana, S. Archaeological site detection and mapping: Some thoughts on differing scales of detail andarchaeological ‘non-visibility’. In Seeing the Unseen: Geophysics and Landscape Archaeology; Campana, S.,Piro, S., Eds.; CRC Press/Balkema: Boca Raton, FL, USA; Leiden, The Netherlands, 2009; pp. 5–26.
189. Deravignone, L.; Blankholm, H.P.; Pizziolo, G. Predictive Modeling and Artificial Neural Networks (ANN):From Model to Survey. In Mathematics and Archaeology; Barceló, J.A., Bogdanovic, I., Eds.; CRC Press:Boca Raton, FL, USA, 2015; pp. 335–351.
190. Buschmann, C.; Nagel, E. In vivo spectroscopy and internal optics of leaves as basis for remote sensing ofvegetation. Int. J. Remote Sens. 1993, 14, 711–722. [CrossRef]
191. Datt, B. Visible/near infrared reflectance and chlorophyll content in Eucalyptus leaves. Int. J. Remote Sens.1999, 20, 2741–2759. [CrossRef]
192. Gitelson, A.A.; Merzlyak, M.N. Quantitative estimation of chlorophyll-a using reflectance spectra:Experiments with autumn chestnut and maple leaves. J. Photochem. Photobiol. B Biol. 1994, 22, 247–252.[CrossRef]
193. Carter, G.A.; Estep, L.; Muttiah, R.S. General spectral characteristics of leaf reflectance responses to plantstress and their manifestation at the landscape scale. In From Laboratory Spectroscopy to Remotely Sensed Spectraof Terrestrial Ecosystems; Muttiah, R.S., Ed.; Kluwer Academic Publishers: Dordrecht, The Netherlands, 2002;pp. 271–293.
194. Agapiou, A.; Hadjimitsis, D.G.; Georgopoulos, A.; Sarris, A.; Alexakis, D.D. Towards an Archaeological Index:Identification of the Spectral Regions of Stress Vegetation due to Buried Archaeological Remains. In Progressin Cultural Heritage Preservation, Proceedings of the 4th International Conference, EuroMed 2012, Lemessos, Cyprus,29 October–3 November 2012; Ioannides, M., Fritsch, D., Leissner, J., Davies, R., Remondino, F., Caffo, R., Eds.;Springer: Berlin/Heidelberg, Germany, 2012; pp. 129–138.
195. Verhoeven, G.J.J.; Doneus, M. Balancing on the Borderline—A Low-cost Approach to Visualize the Red-edgeShift for the Benefit of Aerial Archaeology. Archaeol. Prospect. 2011, 18, 267–278. [CrossRef]
196. Curcio, J.A.; Petty, C.C. The Near-Infrared Absorption Spectrum of Liquid Water. J. Opt. Soc. Am. 1951, 41,302–304. [CrossRef]
197. Avery, T.E.; Lyons, T.R. Remote Sensing. Aerial and Terrestrial Photography for Archeologists; Cultural ResourcesManagement Division: Washington, DC, USA, 1981.

Geosciences 2017, 7, 86 32 of 33
198. Jones, R.J.A.; Evans, R. Soil and Crop Marks in the Recognition of Archaeological Sites by Air Photography.In Aerial Reconnaissance for Archaeology; Wilson, D.R., Ed.; Council for British Archaeology: London, UK,1975; pp. 1–11.
199. Sandmeier, S.R.; Itten, K.I. A Field Goniometer System (FIGOS) for Acquisition of Hyperspectral BRDF Data.IEEE Trans. Geosci. Remote Sens. 1999, 37, 978–986. [CrossRef]
200. Barceló, J.A. Computational Intelligence in Archaeology; Information Science Reference: Hershey, PA, USA, 2009.201. McCoy, M.D.; Ladefoged, T.N. New Developments in the Use of Spatial Technology in Archaeology.
J. Archaeol. Res. 2009, 17, 263–295. [CrossRef]202. Traviglia, A.; Cowley, D.C.; Lambers, K. Finding common ground: Human and computer vision in
archaeological prospection. AARGnews 2016, 53, 11–24.203. Bennett, R.; Cowley, D.C.; De Laet, V. The data explosion: Tackling the taboo of automatic feature recognition
in airborne survey data. Antiquity 2014, 88, 896–905. [CrossRef]204. Cowley, D.C. In with the new, out with the old? Auto-extraction for remote sensing archaeology.
In Proceedings of the Remote Sensing of the Ocean, Sea Ice, Coastal Waters, and Large Water Regions2012 Conference, Edinburgh, UK, 26–27 September 2012; Bostater, C.R., Jr., Mertikas, S.P., Neyt, X., Nichol, C.,Cowley, D.C., Bruyant, J.-P., Eds.; SPIE: Bellingham, DC, USA, 2012; p. 853206.
205. Lambers, K.; Zingman, I. Towards Detection of Archaeological Objects in High-Resolution Remotely SensedImages: The Silvretta Case Study. In Archaeology in the Digital Era. Volume II: E-Papers from the 40th Conferenceon Computer Applications and Quantitative Methods in Archaeology, Southampton, 26–30 March 2012; Earl, G.P.,Sly, T., Chrysanthi, A., Murrieta-Flores, P., Papadopoulos, C., Romanowska, I., Wheatley, D., Eds.; AmsterdamUniversity Press: Amsterdam, The Netherlands, 2013; pp. 781–791.
206. Hanson, W.S. The future of aerial archaeology in Europe. Photo Interprét. Eur. J. Appl. Remote Sens. 2010, 46, 3–11.207. Sevara, C.; Pregesbauer, M.; Doneus, M.; Verhoeven, G.J.J.; Trinks, I. Pixel versus object—A comparison of
strategies for the semi-automated mapping of archaeological features using airborne laser scanning data.J. Archaeol. Sci. 2016, 5, 485–498. [CrossRef]
208. Llobera, M. Working the digital: Some thoughts from landscape archaeology. In Material Evidence: Learningfrom Archaeological Practice; Chapman, R., Wylie, A., Eds.; Routledge: Abingdon, UK; New York, NY, USA,2015; pp. 173–188.
209. Cowley, D.C. Creating the Cropmark Archaeological Record in East Lothian, South-East Scotland.In Prehistory without Borders: The Prehistoric Archaeology of the Tyne-Forth Region; Crellin, R., Fowler, C.,Tipping, R., Eds.; Oxbox Books: Oxford, UK; Havertown, PA, USA, 2016; pp. 59–70.
210. Cowley, D.C. Remote sensing for archaeology and heritage management—Site discovery, interpretation andregistration. In Remote Sensing for Archaeological Heritage Management, Proceedings of the 11th EAC HeritageManagement Symposium, Reykjavík, Iceland, 25–27 March 2010; Cowley, D.C., Ed.; Europae ArchaeologiaConsilium (EAC), Association Internationale sans But Lucratif (AISBL): Brussels, Belgium, 2011; pp. 43–55.
211. Taylor, C.C. Aerial photography and the field archaeologist. In Aerial Reconnaissance for Archaeology;Wilson, D.R., Ed.; Council for British Archaeology: London, UK, 1975; pp. 136–141.
212. Löcker, K.; Kucera, M.; Trinks, I.; Neubauer, W. Successfully falsified . . . on epistomological problems ofarchaeological excavations and geophysical surveys. Archaeol. Pol. 2015, 53, 222–224.
213. Seren, S.; Trinks, I.; Hinterleitner, A.; Neubauer, W. The anomaly that wasn’t there—On the visibility ofarchaeological prospection anomalies and their causative structures in the subsurface. In ArchaeologicalProspection, Proceedings of the 10th International Conference on Archaeological Prospection, Vienna, Austria,29 May–2 June 2013; Neubauer, W., Trinks, I., Salisbury, R.B., Einwögerer, C., Eds.; Austrian Academyof Sciences: Vienna, Austria, 2013; pp. 252–254.
214. Fassbinder, J.W.E.; Irlinger, W.; Schleifer, N.; Stanjek, H. Methodische Untersuchungen zurMagnetometerprospektion: Das frühmittelalterliche Gräberfeld von Alburg, Stadt Straubing, Niederbayern.In Das archäologische Jahr in Bayern, 1998; Bayerisches Landesamt für Denkmalpflege, Ed.; Konrad TheissVerlag: Darmstadt, Germany, 1999; pp. 112–114.
215. Filzwieser, R.; Olesen, L.H.; Neubauer, W.; Trinks, I.; Mauritsen, E.S.; Schneidhofer, P.; Nau, E.; Gabler, M.Large-scale geophysical archaeological prospection pilot study at Viking Age and medieval sites in westJutland, Denmark. Archaeol. Prospect. 2017. [CrossRef]

Geosciences 2017, 7, 86 33 of 33
216. Filzwieser, R.; Olesen, L.H.; Verhoeven, G.J.J.; Mauritsen, E.S.; Neubauer, W.; Trinks, I.; Nowak, M.;Nowak, R.; Schneidhofer, P.; Nau, E.; et al. Integration of Complementary Archaeological ProspectionData from a Late Iron Age Settlement at Vesterager—Denmark. J. Archaeol. Method Theory 2017, 24, 1–21.[CrossRef]
217. David, A.; Linford, N.; Linford, P.; Martin, L.; Payne, A.; Jones, D.M. Geophysical Survey in Archaeological FieldEvaluation; English Heritage: Swindon, UK, 2008.
218. Roskams, S. Excavation; Cambridge University Press: Cambridge, UK, 2001.219. Wallner, M.; Löcker, K.; Neubauer, W.; Doneus, M.; Jansa, V.; Verhoeven, G.J.J.; Trinks, I.; Seren, S.; Gugl, C.;
Humer, F. ArchPro Carnuntum Project Large-scale non-invasive archaeological prospection of the Romantown of Carnuntum. Archaeol. Pol. 2015, 53, 400–403.
© 2017 by the author. Licensee MDPI, Basel, Switzerland. This article is an open accessarticle distributed under the terms and conditions of the Creative Commons Attribution(CC BY) license (http://creativecommons.org/licenses/by/4.0/).