Geohydrologic Conditions at the Nuclear-fuels Reprocessing Plant and Waste-management Facilities at...
55
GEOHYDROLOGIC CONDITIONS AT THE NUCLEAR-FUELS REPROCESSING PLANT AND WASTE-MANAGEMENT FACILITIES AT THE WESTERN NEW YORK NUCLEAR SERVICE CENTER, CATTARAUGUS COUNTY, NEW YORK by Marcel P. Bergeron, William M. Kappel, and Richard M. Yager U.S. GEOLOGICAL SURVEY Water-Resources Investigations Report 85-4145 Prepared in cooperation with UNITED STATES NUCLEAR REGULATORY COMMISSION Ithaca, New York 1987
-
Upload
independent -
Category
Documents
-
view
1 -
download
0
Transcript of Geohydrologic Conditions at the Nuclear-fuels Reprocessing Plant and Waste-management Facilities at...
GEOHYDROLOGIC CONDITIONS AT THE NUCLEAR-FUELS REPROCESSING PLANT AND
WASTE-MANAGEMENT FACILITIES AT THE WESTERN NEW YORK NUCLEAR SERVICE CENTER,
CATTARAUGUS COUNTY, NEW YORK
by Marcel P. Bergeron, William M. Kappel, and Richard M. Yager
U.S. GEOLOGICAL SURVEY
Water-Resources Investigations Report 85-4145
Prepared in cooperation with
UNITED STATES NUCLEAR REGULATORY COMMISSION
Ithaca, New York
1987
UNITED STATES DEPARTMENT OF THE INTERIOR
DONALD PAUL HODEL, Secretary
GEOLOGICAL SURVEY
Dallas L. Peck, Director
For additional information write to:
Subdistrict Chief U.S. Geological Survey 521 W. Seneca Street Ithaca, New York 14850 Telephone: (607) 272-8722
Copies of this report can be purchased from:
U.S. Geological Survey Books and Open-File Reports Federal Center, Bldg. 41 Box 25425 Denver, CO 80225 Telephone: (303) 236-7476
ii
CONTENTS
Page
Abstract ................................. 1Introduction ............................... 3
Purpose and scope.. ......................... 3Geologic setting. ........................... 5Climate ................................ 10
Surface-water hydrology. .........................12Drainage-area characteristics .....................12Streamflow monitoring ............. > . ..........12Flow characteristics. ......................... 14
Lagoon Road. ...........................14North plateau. ..........................14
Ground-water hydrology ..........................15Ground water on the north plateau ...................15
Recharge ............................. 15Ground-water movement in surficial sand and gravel ........15Influence of plant facilities on ground-water flow ........17Ground-water discharge ...................... 21Hydraulic conductivity of surficial gravel ............21
Ground water in the burial-ground areas ................23Ground-water movement. ......................23
Shallow till. ........................ 23Deeper till ......................... 23Below the till. ....................... 25
Infiltration of rainwater into burial pits ............ 28Hydraulic conductivity of the till ................ 30
Summary and conclusions. .........................34References cited .............................35
Appendix A. Description and discharges of notable seeps and springsin the north plateau area at the Western New York Nuclear Service Center. .......................38
Appendix B. Water-level altitudes in wells at the Western New YorkNuclear Service Center, 1981-84 ............... 41
Appendix C. Natural gamma and neutron-moisture information from selectedwells logged by Geological Survey on May 11, 1983 ...... 47
PLATE(in pocket)
Plate 1. Map showing locations of wells and test borings in vicinity ofthe nuclear-fuels reprocessing plant and related waste-management facilities near West Valley, N.Y.
iii
ILLUSTRATIONSPage
Figures 1-3. Maps showing:
1. Location of the Western New York Nuclear ServicesCenter ....................... 2
2. Location of the nuclear-fuels-reprocessing plant and related waste-management facilities within the Western New York Nuclear Services Center ...... 4
3. Relative position of nuclear-fuels-reprocessingplant and related waste-management facilities. ... 5
4. Generalized stratigraphic section of the West Valleysite .......................... 6
5. Map showing thickness of surficial sand and gravel inthe north plateau area ................. 7
6. Generalized geologic sections showing major lithologic units:
A. Section A-A 1 through the main plant area and thefacility's disposal area .............. 8
B. Section B-B' through the plant lagoon area andState-licensed waste-disposal area ......... 8
C. Section C-C' through the main-plant area to FranksCreek. ....................... 9
D. Section D-D f through the waste-disposal areas toButtermilk Creek .................. 9
7. Map showing bedrock-surface altitude within the WesternNew York Nuclear Service Center. ............ 11
8. Map showing tributary streams to Franks Creek and drainage-area boundaries of streamflow-monitoring stations ..... . 13
9. Schematic diagram of streamf low-mo nitoring-stationenclosure used at north plateau stations 1 and 3 .... 14
10. Map showing water-table altitude and direction ofground-water flow in the north plateau area on May 10,1984 .......................... 18
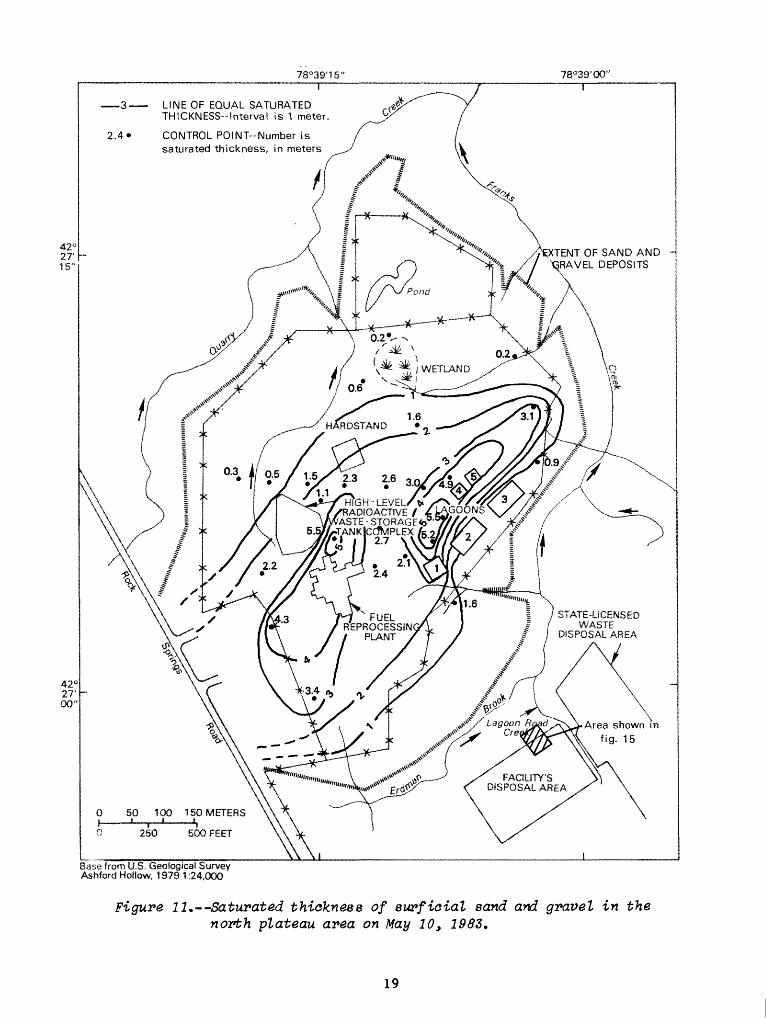
11. Map showing saturated thickness of surficial sand andgravel in the north plateau area on May 10, 1983 .... 19
12. Generalized geologic section of the surficial graveldeposit on the north plateau .............. 20
iv

ILLUSTRATIONS (CONTINUED)Page
Figure 13. Hydrographs of wells 80-8 and 80-4 on the north plateau,1982-83. ......................... 20
14. Plot showing calculation of hydraulic conductivity from slug-test data from well 80-8 by the method of Cooper (1967) .......................... 22
15. Map showing approximate extent of solvent migration in1984 from the facility's waste disposal area ....... 24
16. Map showing location of piezometers installed adjacent tothe facility's waste-disposal area ............ 26
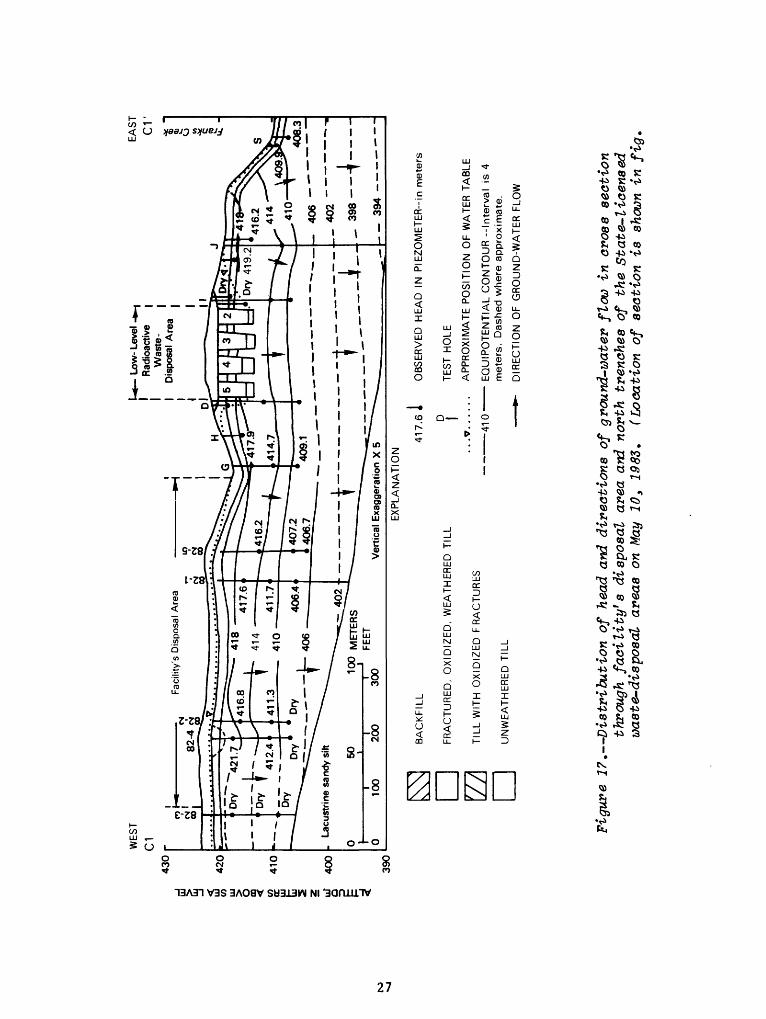
17. Vertical sections through the facility's waste-disposal area and the north trenches of the low-level waste- disposal area showing distribution of head and directions of ground-water flow on May 10, 1983 ........... 27
18. Map showing distribution of head within the lacustrineunit in September 1983 .................. 28
19. Schematic diagram of head relationships in bedrock testhole 83-4E, July 1983. .................. 29
20. Map showing location of 82-4 series piezometers andapproximate location of buried access ramp ........ 31
21. Geologic section from 82-4 series of piezometers to holeSH-9 showing inferred location of buried access ramp ... 32
Cl. Geophysical borehole logs from selected wells near the facility's waste-disposal area showing gamma radiation and neutron-moisture readings within the Lavery till, and lower units. ..................... 48
TABLES
Table 1. Records of wells drilled by the U.S. Geological Survey,1980-83. .......................... 16
2. Ground-water discharges from the north plateau, 1983 .... 21
3. Hydraulic conductivity of surficial gravel on the northplateau calculated from slug-test data by method of Cooperand others (1967). ..................... 23
4. Laboratory analysis of vertical hydraulic conductivity of selected till samples by constant-head permeability with back-pressure saturation tests ............... 33

TABLES (Continued)
Table 5. Laboratory analysis of vertical permeability of selected till samples under simulated overburden pressure ....
A-l. Altitudes and discharge measurements of seepage faces around the north plateau. .......
Page
33
40
CONVERSION FACTORS AND ABBREVIATIONS
Factors for converting the metric (International System) units used in this report to inch-pound units are shown below.
Divide metric units
centimeter (cm) meter (ra) kilometer (km)
By.
Length
2.54 .3048
1.609
To obtain
inch (in) foot (ft) mile (mi)
square kilometer (km 2 ) hectare (ha)
Area
2.590.405
square mile (mi 2 ) acre (a)
liter per second (L/s) liter per second (L/s) liter per second (L/s) cubic meters per second
(m 3 /s)
meter per day (ra/d)
meter per kilometer (m/km)
Flow
28.320.06309
43.810.0283
cubic foot per second (ft 3 /s) gallon per minute (gal/min) million gallons per day (Mgal/d) cubic foot per second (ft 3 /s)
Hydraulic Units
0.3048
0.1894
hydraulic conductivity,foot per day (ft/d)
foot per mile (ft/nd)
vi
Geohydrologic Conditions at the Nuclear-Fuels Reprocessing Plant and Waste-Management Facilities at the Western New York Nuclear
Service Center, Cattaraugus County, New York
By
Marcel P. Bergeron, William M. Kappel, and Richard M. Yager
Abstract
The Western New York Nuclear Service Center near West Valley, N.Y., con tains a nuclear-fuels-reprecessing plant, a high-level radioactive-liquid-waste- tank complex, and waste facilities. All are within about 100 hectares on a fairly level plateau on the western flank of the Buttermilk Creek valley. The plateau is underlain by a sequence of glacial and postglacial deposits that fill an ancestral bedrock valley.
The main facilities are on an elevated area referred to as the north plateau, which is mantled by alluvial and fluvial silty sand and gravel that range from 1 to 10 meters thick. Ground water in the north plateau moves laterally within the sand and gravel from an area southwest of the main building to the northeast, east, and southeast, where the sand and gravel either pinches out or is cut off by deeply incised stream-channel banks. The hydraulic conduc tivity of the sand and gravel, calculated from slug-test data, ranges from 0.1 to 7.9 meters per day.
Two separate burial grounds a 2.2-hectare disposal area previously licensed by the U.S. Nuclear Regulatory Commission for use by the site operator and a 4-hectare area licensed by the State of New York for disposal of commer cial waste--are about 320 meters from the main building. The burial grounds are excavated in a sequence of clay-rich till that ranges from 22 to 28 meters thick. Northward migration of an organic solvent from the disposal area for about 18 meters at shallow depths in the till suggests that the shallow, frac tured, oxidized, and weathered till is a significant pathway for lateral move ment of ground water. Below this zone, ground water moves vertically downward through the till to recharge saturated lacustrine silt and fine sand and kame- delta deposits. Limited potentiometrie-head data suggest that some of the water entering the fine sand and silt may continue downward to recharge lower units. Heads within the saturated parts of the silt and fine sand indicate that ground water moves laterally under a gradient of 0.02 meter per meter to the northeast and toward Buttermilk Creek.
Vertical hydraulic conductivity of the silty clay till, estimated from laboratory permeability analysis, ranges from 1.8 x 10~ 5 to 1.0 x 10"** m/d. Permeability of weathered, oxidized till and unweathered till samples averages 4.2 x 10~~ 5 and 2.45 x 10~ 5 m/d, respectively. Horizontal hydraulic conductivity of the till, estimated from analyses of recovery-test data, ranges from 6.9 x 10~6 to 8.64 x 1CT 5 m/d and averages 1.7 x 10" 5 m/d.

79°00'00 78° SO'OO"
NEW YORK-t I
Cattaraugus Co
ERIE COUNTY
Buttermilk Creek
WESTERN NEWYO NUCLEAR SERVICE CENTER
FRANKLINVILLE
CATTARAUGUS COUNTY
DRAINAGE-AREA BOUNDARY
COUNTY LINE
AREA DEPICTED IN FIGURE 3
PENNSYLVANIA 0 10 KILOMETERS
Base from U.S. Geological Survey, 1974 State of New York, 1:500.000
Figure 1. Location of the Western New York Nuclear Services Center.
INTRODUCTION
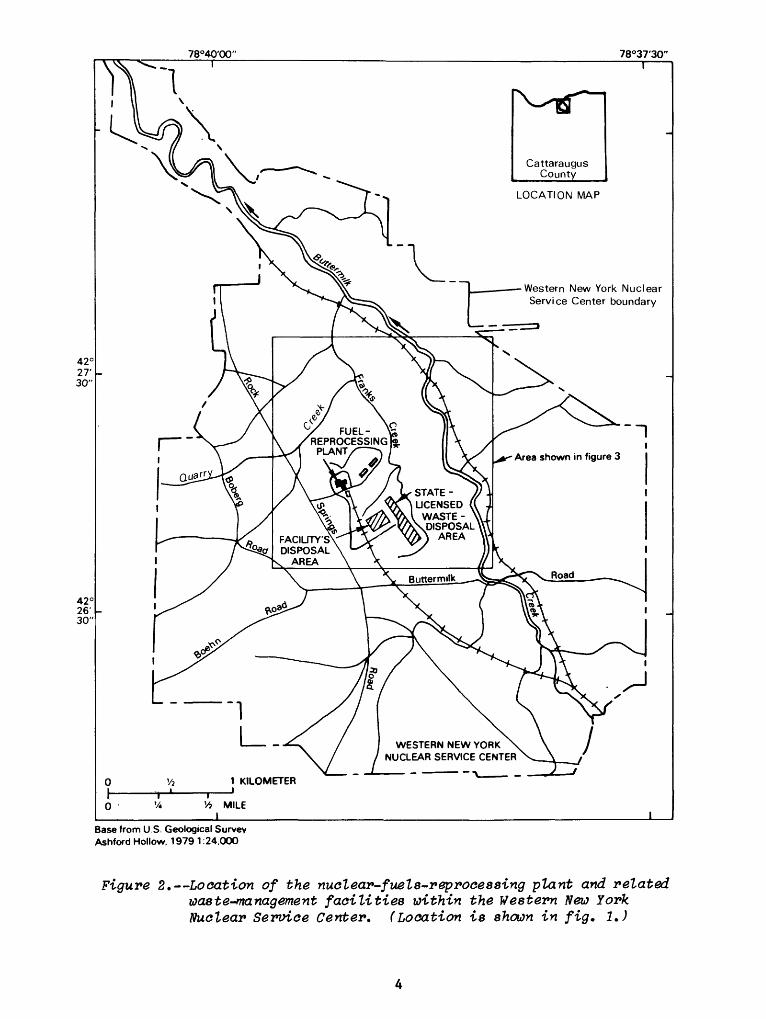
In 1961, the New York State Office of Atomic Development acquired 1,350 ha of undeveloped land near the village of West Valley in northern Cattaraugus County, about 48 km south of Buffalo (fig. 1), for development of a nuclear- fuel-reprocessing plant and waste-management facilities. The land was subse quently named the Western New York Nuclear Service Center. In 1963, the U.S. Atomic Energy Commission issued a permit to a private operator authorizing development of about 100 ha of the site for construction of a reprocessing plant and supporting facilities (fig. 2).
The supporting facilities include a structure for receiving and storage of irradiated fuel before reprocessing, an underground storage-tank complex for liquid high-level radioactive wastes generated by reprocessing, and a low-level radioactive-wastewater-treatment plant. The site also includes two separate burial grounds for shallow burial of solid radioactive wastes a 4-ha area licensed by the State of New York for burial of commercial low-level radioactive wastes (not operating at present), and a 2. 2-ha disposal area licensed by U.S. Nuclear Regulatory Commission for wastes with higher radioactivity. The loca tions of these facilities are shown in figure 3.
During 1975-80, two studies were done to evaluate the extent of and poten tial for radionuclide movement from the State-licensed waste-disposal area. One was by the U.S. Geological Survey; its purpose was to identify the principal hydrologic and geologic factors that control subsurface movement of radio- isotopes from the burial ground. The other was done by the New York State Geological Survey under contract with the U.S. Environmental Protection Agency and, later, the U.S. Nuclear Regulatory Commission, to evaluate all processes of radioisotope migration at the burial site.
Since 1980, the U.S. Geological Survey has conducted studies to complement efforts by the New York State Geological Survey to evaluate the geology, surface and subsurface hydrology, and the extent and potential for radioisotope migra tion from the other facilities. Both studies were funded under mutual financial agreements with the U.S. Nuclear Regulatory Commission, and many elements of the two studies were jointly planned and completed by the two Surveys.
Purpose and Scope
This report summarizes the hydrogeologic conditions at the fuel reproc essing plant and waste-management facilities. The geologic and hydrologic information presented was obtained largely from studies conducted since 1980, but data from previous investigations are also included. The report includes maps and several geologic cross sections that illustrate the stratigraphic relationships of the glacial deposits and the underlying bedrock and describe^ ground-water flow patterns and hydraulic properties of the sediments. It a" includes (1) descriptions of the surface-water-drainage areas and charac teristics, with results of inventories of ground-water seepage to the surfa« (2) hydrologic information from wells and borings drilled during 1980-83, including locations and depths of wells, water levels, and general well- construction data; and (3) natural gamma and neutron-moisture logs of selected test holes.
78°40-QO"
42° 27' 30"
42 C 26' 30"
78°37'30" I
Cattaraugus County
LOCATION MAP
Western New York Nuclear Service Center boundary
WESTERN NEW YORK NUCLEAR SERVICE CENTER
1 KILOMETER
Yi MILE I
Base from U.S. Geological Survey Ashford Hollow. 1979 1:24.000
Figure 2. Location of the nuclear-fuels-reprocessing plant and related waste-management facilities within the Western New York Nuclear Service Center. (Location is shown in fig. 1.)
Geologic Setting
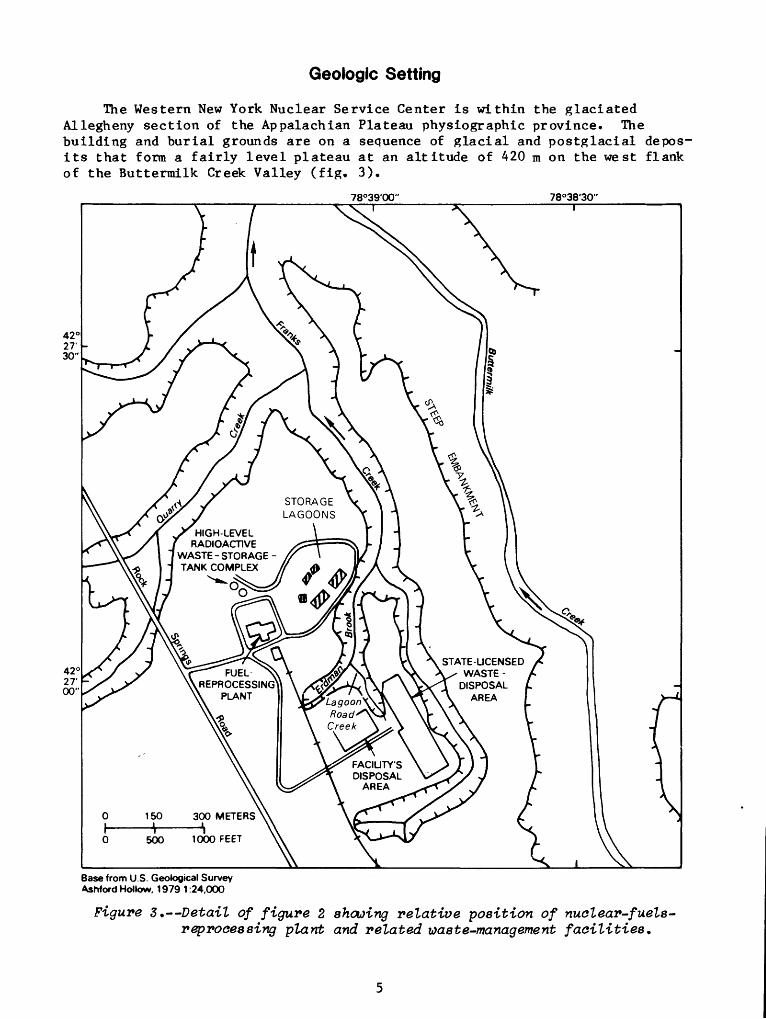
The Western New York Nuclear Service Center is within the glaciated Allegheny section of the Appalachian Plateau physiographic province. The building and burial grounds are on a sequence of glacial and postglacial depos its that form a fairly level plateau at an altitude of 420 m on the west flank of the Buttermilk Creek Valley (fig. 3).
78°39'00' 78°38'30"
42° 27' 30"
42° 27' 00"
STORAGE LAGOONS
HIGH-LEVEL RADIOACTIVE
WASTE-STORAGE - TANK COMPLEX
STATE-LICENSEDWASTE -
DISPOSALAREA
FUEL- REPROCESSING
PLANT Lagoon Road Creek
FACILITY'SDISPOSAL
AREA
300 METERS
1000 FEET
Base from U.S. Geological Survey Ashford Hollow, 1979 1:24,000
Figure 3.--Detail of figure 2 showing relative position of nuclear-fuels- reprocessing plant and related waste-management facilities.
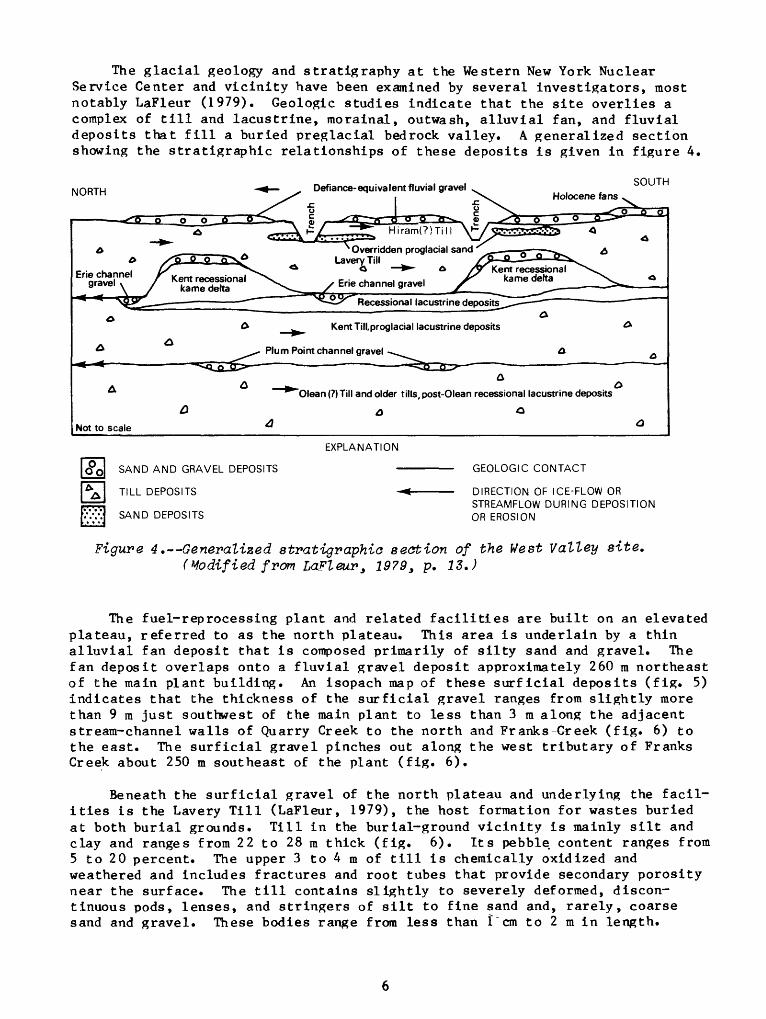
The glacial geology and stratigraphy at the Western New York Nuclear Service Center and vicinity have been examined by several investigators, most notably LaFleur (1979). Geologic studies indicate that the site overlies a complex of till and lacustrine, morainal, outwash, alluvial fan, and fluvial deposits that fill a buried preglacial bedrock valley. A generalized section showing the stratigraphic relationships of these deposits is given in figure 4.
NORTH Defiance-equivalent fluvial gravel SOUTH
"Q Q Q o
Holocene fans
I j- ^fr ft _ ° ° ""3"_S g/CL
z
N Overridden proglacial sand Lavery Till ^
C ^- A /^^ Kent recessionalErie channel gravel kame delta
Recessional lacustrine deposits
Kent Till,proglacial lacustrine deposits
Plum Point channel gravel ^^.^
"Olean (?)Till and older tills, post-Olean recessional lacustrine deposits
Not to scale
EXPLANATION
SAND AND GRAVEL DEPOSITS
TILL DEPOSITS
SAND DEPOSITS
GEOLOGIC CONTACT
DIRECTION OF ICE-FLOW OR STREAMFLOW DURING DEPOSITION OR EROSION
4.--Generalized stratigraphio section of the Vest Valley site. (Modified from LaFleur, 1979, p. 13.)
The fuel-reprocessing plant and related facilities are built on an elevated plateau, referred to as the north plateau. This area is underlain by a thin alluvial fan deposit that is composed primarily of silty sand and gravel. The fan deposit overlaps onto a fluvial gravel deposit approximately 260 m northeast of the main plant building. An isopach map of these surficial deposits (fig. 5) indicates that the thickness of the surficial gravel ranges from slightly more than 9 m just southwest of the main plant to less than 3 m along the adjacent stream-channel walls of Quarry Creek to the north and Franks Greek (fig. 6) to the east. The surficial gravel pinches out along the west tributary of Franks Creek about 250 m southeast of the plant (fig. 6).
Beneath the surficial gravel of the north plateau and underlying the facil ities is the Lavery Till (LaFleur, 1979), the host formation for wastes buried at both burial grounds. Till in the burial-ground vicinity is mainly silt and clay and ranges from 22 to 28 m thick (fig. 6). Its pebble content ranges from 5 to 20 percent. The upper 3 to 4 m of till is chemically oxidized and weathered and includes fractures and root tubes that provide secondary porosity near the surface. The till contains slightly to severely deformed, discon tinuous pods, lenses, and stringers of silt to fine sand and, rarely, coarse sand and gravel. These bodies range from less than I cm to 2 m in length.

78°39'15" 78°39'OQ"
LINE OF EQUAL SAND AND GRAVEL THICKNESS Contour interval 3 meters
CONTROL POI NT-Number unit thickness, in meters
EXTENT OF SAND AND
GRAVEL DEPOSITS
STATE-LICENSEDWASTE -
DISPOSAL AREA
FUELREPROCESSING
PLANT
Lagoon Road Creek
FACILITY'S DISPOSAL AREA
0 50 100 150 METERS f '
250 500 FEET
Base from U.S. Geologica! Survey Ashford Hollow, 1979 1:24,000
Figure 5. Thickness of surf idol sand and gravel in the north plateau area. (Modified frcm Albanese and others, 1983.)

440
420
400
380
360
340
Siity sand and gravel
PAH-39 I^l . 1| . . . J . ./ .T
NJ-3 B-23
Shale bedrock
50 100 150 METERS
0 250 500 FEET Vertical Exaggeration X 5
440
420
400
380
360
340
$ Silty sand£5 and gravel
* *' Silty clay till
Lagoon area rfvto'
ILow- Level Radioactive Waste-
I Disposal AreaR U N...
Silty clay till
Silt with fine sand
0 50 100 160 METERS -
0 250 500 FEET Vertical Exaggeration X 5
EXPLANATION
GEOLOGIC CONTACT-- Dashed where approximate
APPROXIMATE LOCATION OF WATER TABLE
Figure 6. Section A-A' through main plant area and facility's disposal area; and section B-B' through storage lagoon area and State-licensed waste-disposal area. (Location of sections is shown on pi. 1.)
a 01
ALT
ITU
DE
, IN
ME
TE
RS
AB
OV
E S
EA
LE
VE
L
DO
CD
m«Q
o>
-I x
m
<
' I
? j"
O^ H
2O
£
^O
r -
o a>
zm
S
B>
!
O z
D
Roc
k S
prin
gs
Roa
d D
O
80
-10
83-1
E
^Pro
ject
ed
83-2
E
RR
gra
de
82-3
D
82-4
C {
, 82
-2C
('
_ _
SE
CT
ION
*
A-A
'
82
-1 D
I
82-5
C f
Pro
J601
641
Low
- Le
vel
Rad
ioac
tive
Was
te -
Dis
posa
l A
rea
~S
EC
TT
ON
"i-B
' '
g
r-< D
o 0)
Fran
ks C
reek
DH
-7 P
roje
cted O
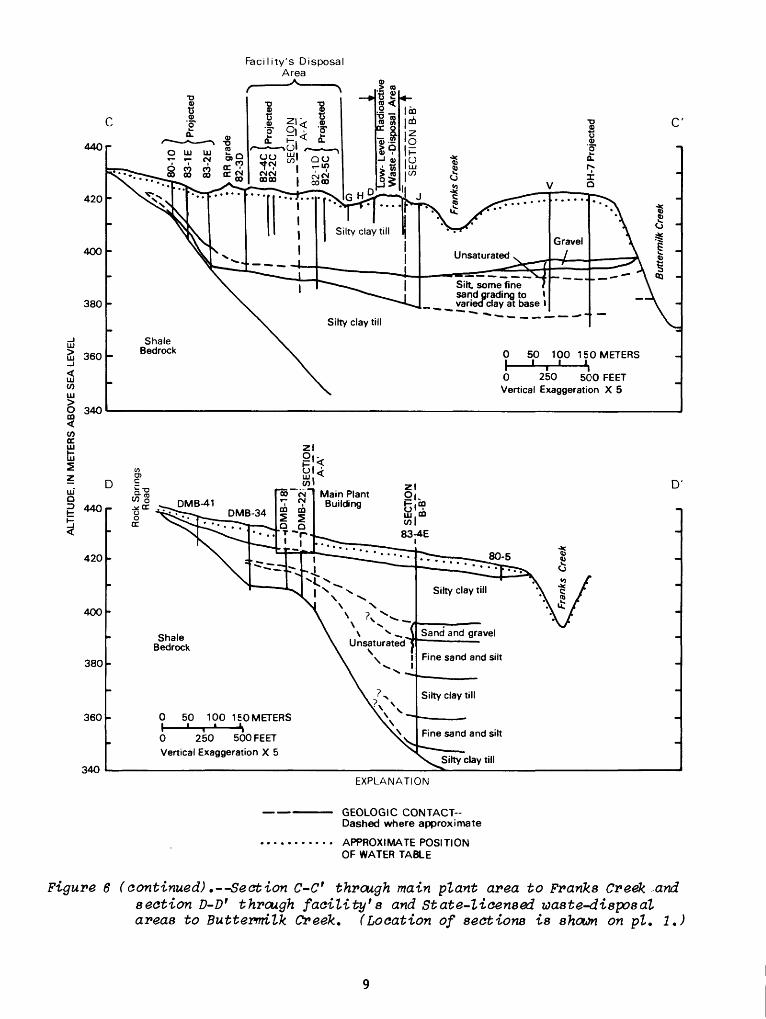
Beneath the Lavery Till is a sequence of recessional lacustrine and kame- delta deposits of post-Kent Till age that consist of laminated silt and clay grading upward into fine to coarse sand and silt. In two boreholes (hole V and DH-7) east of the low-level waste-burial site (see fig. 6), the upper, sandy part of the unit is capped by gravel. Evidence from regional stratigraphy and a bedrock test hole at the site indicates that post-Kent recessional deposits are underlain by at least two older, clayey-silt tills the Kent Till and the Olean(?) Till (LaFleur, 1979). In borehole 83-4, about 150 m from the main plant facilities (pi. 1), two silty-clay till sequences separated by 12 m of saturated fine sand and silt were penetrated below post-Kent deposits before shale bedrock was encountered at 5.2 m. (See fig. 5.) These tills are presumed to be Kent Till and Olean(?) Till separated by post-Olean recessional lacustrine deposits. The post-Kent and Kent Tills are exposed in the steep valley walls of Buttermilk Creek.
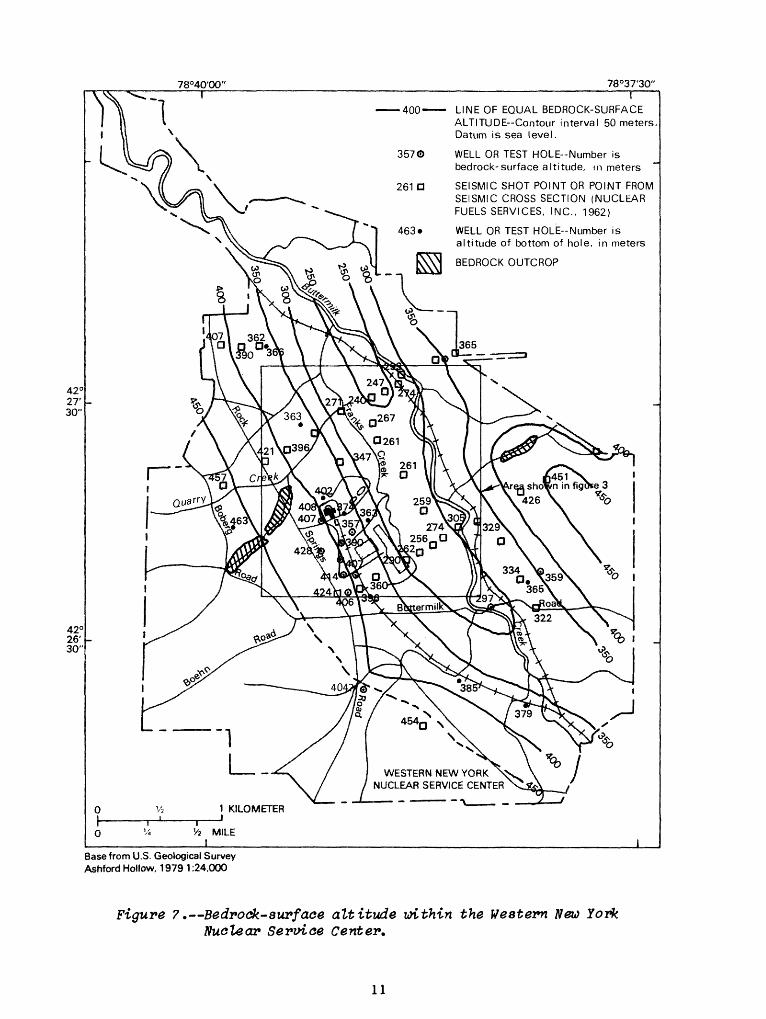
The bedrock underlying the area is shale and sandstone of the Upper Devonian Canadaway and Conneaut Groups (Rickard and Fisher, 1970). The bedrock- surface altitude, shown in figure 7, ranges from about 250 m about 1 km north east of the main plant facilities to about 450 m east and west of the site along the flanks of the Buttermilk Creek valley. Depth to bedrock ranges from about 150 m in the deepest part of the bedrock valley to less than 1 m along the hillsides of Buttermilk Creek valley west of the plant. A test hole drilled by the U.S. Geological Survey about 200 m northeast of the main reprocessing plant encountered bedrock at a depth of about 75 m. Bedrock is exposed in the upland stream channels along Quarry Creek northwest of the site, in hilltops west and south of the site, and in the steep-walled gorges cut by Cattaraugus Creek to the north and by Connoisserauley Creek to the west (both off the map in fig. 7).
Climate
The climate of western New York State is classified as moist continental. Precipitation and temperature are typically a function of the type and direction of movement of air masses that pass over the region. Dry, cool air masses enter from Canada, and warm, moist air originates from the Gulf of Mexico. In south western New York, the weather is also affected by Lake Erie, which has a moderating effect on temperature and provides additional moisture to the air (Harding and Gilbert, 1968). Orographic effects of the area's topography further affect the precipitation pattern in this area.
Previous site operators collected meteorological data from 1963 to the present, but no long-term meteorologic data are available because most records are discontinuous and unreliable. Regional analyses of meteorological data by Dethier (1966) and Harding and Gilbert (1968) indicate that extreme temperatures in the West Valley area range from -35° to +35°C. The average annual temper ature is 7.2°C; the lowest average monthly temperature is -5.7°C in February, and the highest average monthly temperature is 19.6°C in July. The frost-free period extends for approximately 110 days from late May through early September.
Average annual precipitation is approximately 105 cm/yr, and monthly precip itation is roughly equal throughout the year. Snowfall usually starts in early November, and the regional snowpack lasts through March.
10
42° 27' 30"
42C 26' 30"
78°40'00"
!400-
3570
261 D
463 «
___________________78°37'30"!
LINE OF EQUAL BEDROCK-SURFACE ALTITUDE-Contour interval 50 meters. Datum is sea level.
WELL OR TEST HOLE-Number is bedrock-surface altitude, tn meters
SEISMIC SHOT POINT OR POINT FROM SEISMIC CROSS SECTION (NUCLEAR FUELS SERVICES, INC., 1962)
WELL OR TEST HOLE-Number is altitude of bottom of hole, in meters
BEDROCK OUTCROP
WESTERN NEW YORK NUCLEAR SERVICE CENTER
Base from U.S. Geological Survey Ashford Hollow, 1979 1:24.000
Figure 7. Bedrock-surf ace altitude within the Western New York Nuclear Seririce Center.
11

Average annual evapotranspiration is approximately 48 cm. Evapotranspira tion is greatest during June through August, approximately 10 cm/mo, and is minimal from December through March, aproximately 1 cm/mo.
SURFACE-WATER HYDROLOGY
Drainage-Area Characteristics
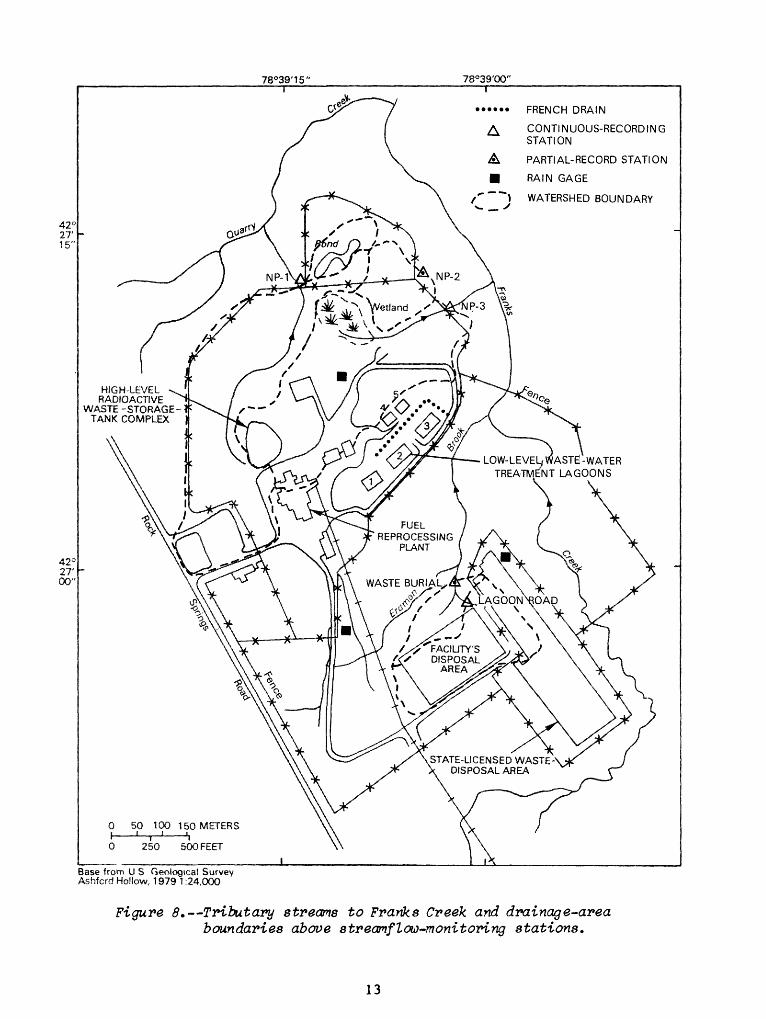
Surface runoff from the plant facilities drains to Franks Creek on the east and south side of the facility and to Quarry Creek on its northwest edge (fig. 8). Franks Creek (drainage area 6.32 km 2 ) drains into the upper third of the 80.0-km 2 Buttermilk Creek basin, which lies north of the site. Buttermilk Creek flows into Cattaraugus Creek (drainage area 1,450 km 2 ) near Springville, and Cattaraugus Creek flows to Lake Erie near Silver Creek (fig. 1).
The quantity of surface water leaving the site was monitored between October 1980 and October 1983 at three gaging stations Lagoon Road, north plateau 1 (NP1), and north plateau 3 (NP3). Locations and drainage areas of these stations are shown in figure 8. The Lagoon Road station receives flow from a 4.40-ha area, parts of which drain both burial areas. The NP3 station receives flow from a 9.83-ha area that lies between the reprocessing plant and a drained wetland area on the north plateau. The NP1 station receives flow from the western flank of the plateau, which has a drainage area of 10.4 ha.
Peak-flow data were also collected at a small drainage area designated as north plateau 2 (NP2). Before construction of the reprocessing facility and subsequent draining of the north plateau wetland, this channel carried a peren nial stream. Its present surface watershed is 1.81 ha, but its flow is sup ported mainly by ground-water discharge. Eighteen ground-water seepage faces surrounding the north plateau were also monitored, generally during base-flow periods. (Descriptive data on these seepage faces are given in Appendix A.)
Streamflow Monitoring
Flow data from the NP1 and NP3 stations were obtained at streamflow- monitoring stations that were constructed on each stream channel. Each station was sheltered by a large enclosure spanning the width of the stream. Deep snow and ice had prevented collection of winter discharge data in previous years; therefore, these enclosures were heated to keep the measurement section free of snow and ice throughout the winter. A typical enclosure is illustated in figure 9.
A similar attempt to gage flow downstream from the Lagoon Road station at a site called Waste Burial 1 (fig. 8) with an enclosure was less successful because the channel was unstable (the clay soil under the enclosure alternately slumped and eroded from the measurement section); therefore, this station was discontinued. The station just upstream from the enclosure was operated for approximately 9 months each year. During mid-winter, generally December through mid-March, attempts were made to gage flows during periods of thaw or rain. Attempts to maintain the measurement section during the spring thaw period were marginally successful.
12
78°39'15" 78°39'00"
...... FRENCH DRAIN
A CONTINUOUS-RECORDING STATION
A PARTIAL-RECORD STATION
RAIN GAGE
) WATERSHED BOUNDARY
HIGH-LEVEL RADIOACTIVE
WASTE-STORAGE-1' TANK COMPLEX I
ASTE-WATER TREATMENT LAGOONS
REPROCESSING PLANT
WASTE BURIAL
AGOON^OA
\
FACSUTY'SDISPOSAL
AREA
STATE-UCENSED WASTE - DISPOSAL AREA
0 50 100 150 METERS I ' '
Base from U S Geological Survey Ashfcrd Hollow, 1979 1:24,000
Figure 8.--Tributary streams to Franks Creek and drainage-area boundaries above streamflow-monitoring stations.
13

STYROFOAM CURTAIN WALL
WOODEN PLATFORM
STEEL I-BEAM BOX FRAME RESTING ON GROUND
FLEXIBLE PLASTIC STRIPS
UPSTREAM DEBRIS WEIR
Figure 9.--Schematic diagram of streartf low-monitoring station enclosure used at north plateau stations 1 and 3.
Flow Characteristics
Lagoon Road
Flow measured at the Lagoon Road station responded quickly to most rainstorms and generally returned to near prestorm conditions within several hours after precipitation ended. During 1981-83, average flow at Lagoon Road was 0.675 x 10~ 3 m 3 /s. The highest daily recorded flow was 28.3 x 10~" 3 m 3 /s on March 17 and September 2, 1982, and the stream was dry for approximately 60 days during each summer.
North Plateau
In contrast to the Lagoon Road site, the north plateau streams were not highly responsive to rainfall, and base flow rarely ceased. At the NP1 site (fig. 8), average daily recorded flow was 1.30 x 10" 3 m 3 /s. Maximum recorded flow was 31.2 x 10"3 m 3 /s on November 4, 1982, and the stream was dry for a few days during each summer (1981-83). The NP3 site had higher average daily flow
14

of 2.48 x 10~ 3 m 3 /s, with a maximum daily recorded flow of 28.3 x 10~" 3 m 3/s on March 13, 1982 and a minimum daily recorded flow of 0.113 x 10~" 3 m 3 /s for several days during July and August 1981.
Streamflow data for the NP2 site were derived from stage readings from a staff and crest-stage gage. The average flow, based on correlation of 44 staff- gage readings to the records of stations NP1 and NP3,was 0.340 x 10~ 3 m 3 /s. Maximum recorded flow was 1.98 x 10~" 3 m 3 /s, during the spring of 1983; no flow was observed on July 9, 1982.
Flow monitoring at 18 seepage (ground-water-discharge) sites was added to the surface-water-monitoring network in 1983. Measurements were made during March, July, and October 1983 during base-flow periods (appendix A). Results of these measurements indicated that approximately 73 percent of the flow leaving the plateau during nonstorm periods flowed past the NPl and NP3 gages; the remaining 27 percent was discharged from seepage faces and flowed directly to Quarry Creek, Erdraan Brook, or Franks Creek, bypassing the gaging stations. The major seepage-discharge point was a french-drain system constructed to eliminate seepage of ground water into Lagoons 2 and 3 (fig. 8). The highest concentra tion of seeps is between the NP3 site and the french drain on the northeast side of the plateau.
GROUND-WATER HYDROLOGY
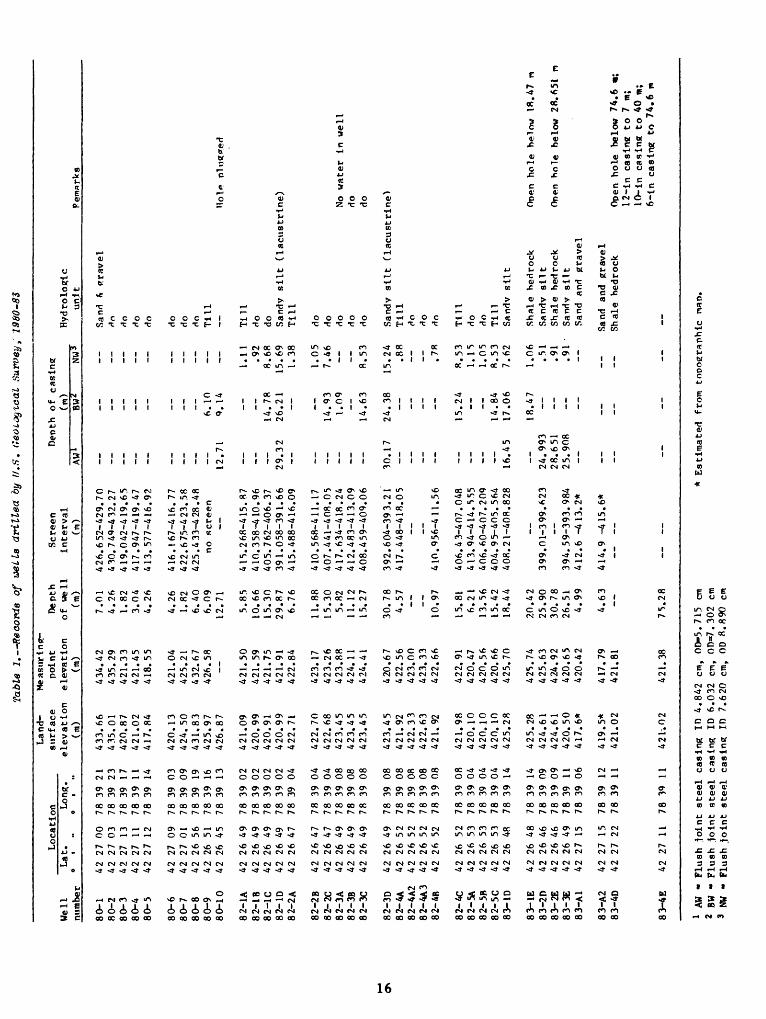
From 1980 to July 1983, the U.S. Geological Survey drilled 41 test holes to provide geologic and hydrologic information in the area of the fuel-reprocessing plant and the facility's disposal site. Locations of the test holes and pre viously drilled test holes are shown in plate 1. In all test holes except 80-10, wells or piezometers were installed to monitor water-level changes to define spatial head relationships and to determine patterns of ground-water flow from water-table and potentiometric-surface maps. Records of each test hole and piezometer are given in table 1. Water-level altitudes measured from January 19, 1981 through May 22, 1984 are given in appendix B.
Ground-Water on the North Plateau
Re charge
Some of the precipitation on the north plateau drains from the area through small drainage channels; the rest infiltrates downward to recharge the ground- water system. Ground water also enters the plateau as underflow along the upland boundary southwest of the plant. Preliminary results from a two- dimensional finite-difference model that simulates ground-water flow through the surficial gravel indicates the recharge rate to be 40 to 50 cm/yr. Although some water infiltrates downward into the underlying till, most of it moves laterally in the surficial gravel to points of discharge.
Ground-Water Movement in Surficial Sand and Gravel
Water levels in 10 U.S. Geological Survey wells and 15 other wells were measured periodically to monitor changes and to evaluate the direction of
15
Tab
le
1. R
eoord
e o
f w
eila
d
rill
ed
by
ll.f
i. G
eolo
gic
al
Surv
ey,
1980
-83
Loca
tion
Wel
l nu
mbe
r
80-1
80-2
80-3
80-4
80
-5
80
-680-7
80-8
80-9
80-1
0
8 2-
1 A
82-1
B82
-1C
8 2-
ID82
-2A
82-2
B82
-2C
82-3
A82
-3B
82-3
C
82-3
D82
-4A
82-4
A2
82-4
A3
82-4
B
82
- 4C
82-5
A82
-5B
82-5
C83
-1D
83
- IE
83-2
D8
3-
2E83
-3E
83-A
1
83-A
283
-4D
83-4
E
Lat
.0
1
42 42 42 42 42 42 42 42 42 42 42 42 42 42 42 42 42 42 42 42 42 42 42 42 42 42 42 42 42 42 42 42 42 42 42 42 42 42
27 27 27 27 27 27 27 26 26 26 26 26 26 26 26 26 26 26 26 26 26 26 26 26 26 26 26 26 26 26 26 26 26 26 27 27 27 27
00 03 13 11 12 09 01 56 51 45 49 49 49 49 47 47 47 49 49 49 49 52 52 52 52 52 53 53 53 48 48 46 46 49 15 15 22 11
Lon
g.e
i t<
78
39
2178
39
23
78
39
1778
39
11
78
39
14
78
39
0378
39
09
78
39
1978
39
16
78
39
13
78
39
0278
39
02
78
39
0278
39
02
78
39
04
78
39
0478
39
04
78
39
0878
39
08
78
39
08
78
39
0878
39
08
78
39
0878
39
08
78
39
08
78
39
0878
39
04
78
39
0478
39
04
78
39
14
78
39
1478
39
09
78
39
0978
39
11
78
39
06
78
39
1278
39
11
78
39
11
Lan
d-
surf
ace
ele
vati
on
(m)
433.6
6435.0
1420.8
7421.0
2417.8
4
420.1
34
24
.50
43
1.8
34
25
.97
426.8
7
42
1.0
94
20
.99
42
0.9
14
20
.99
422.7
1
42
2.7
0422.6
8423.4
54
23
.45
42
3.4
5
42
3.4
54
21
.92
42
2.3
3422.6
3421.9
2
42
1.9
84
20
.10
42
0.1
04
20
. 10
425.2
8
42
5.2
84
24
.61
424.6
14
20
.50
41
7.6
*
41
9.5
*421.0
2
421.0
2
Me a
snr In
s-
poin
t D
epth
S
cree
n
ele
vati
on
of
well
In
terv
al
(m)
(m)
(m)
434.4
2435.2
9421
.33
421
.45
418
.55
421
.04
425
.21
432.6
7426
.58
421.5
0421
.59
421
.75
421.9
1422
.84
423.
1742
3.2
642
3.8
8424.1
1424.4
1
420.6
742
2.5
642
3.0
042
3.3
342
2.6
6
42
2.9
142
0.4
7420.5
642
0.6
6425.7
0
425.7
4425.6
3424.9
242
0.6
542
0.4
2
417.7
942
1.81
421.3
8
7.0
14
.26
1.8
23
.04
4.2
6
4.2
61
.82
6.4
06
.09
12.7
1
5.8
51
0.6
61
5.3
029.8
76
.76
11
.88
15
.30
5.8
211.1
21
5.2
7
30.7
84.5
7
10.9
7
15.8
16
.21
13
.56
15
.42
18.4
4
20
.42
25
.90
30
.78
26.5
14
.99
4.6
3
75
.28
42
6.6
52
-42
9.7
04
30
.74
P-4
32
.27
41
9.0
42
-41
9.6
54
17
.94
7-4
19
.47
41
3.5
77
-41
6.9
2
416.1
67-4
16.7
74
22
.67
5-4
23
.58
42
5.4
33
-42
8.4
8no
sc
reen
41
5.2
68
-41
5.8
74
10
.35
8-4
10
.96
405.7
62-4
06.3
7391.0
58-3
91.6
6415.4
88-4
16.0
9
410.5
68-4
11.1
74
07
.44
1-4
08
.05
41
7.6
34
-41
8.2
4412.4
83-4
13.0
9408.4
59-4
09.0
6
392.6
04-3
93.2
14
17
.44
8-4
18
.05
410.9
56-4
11.5
6
406.4
3-4
07.0
48
41
3.9
4-4
14
.5.5
54
06
.60
-40
7.2
09
40
4.9
5-4
05
.56
4408.2
1-4
08.8
28
399.0
1-3
99.6
23
394.5
9-3
93.9
84
412.6
-4
13.2
*
41
4.9
-4
15
.6*
Dep
th
of
casi
ng
(m)
AW1
BWZ
_ ._
_ _ .
__
6.1
01
2.7
1
0.1
4
14.7
829.3
2
26
.21
14
.93
1.0
9
14.6
3
30.1
7
24.3
8
15
.24
1
4.8
41
6.4
5
17.0
6
18
.47
24
.99
328.6
51
25
.90
8
NW
*
__ 1.1
1.9
28
.68
15
.69
1.3
8
1.0
57.4
6 8.5
3
15
.24
.88 .7
8
R.5
31.1
51
.05
8.5
37.6
2
1.0
6.5
1.9
1.9
1
Hy
dro
log
tc
unjl
t P
eroa
rk s
San
d ft
trav
el
Ho
do do do do do do Til
l
Ho
le
plu
gg
ed
Til
ldo do S
andy
sil
t (l
acu
stri
ne)
Til
l
do do do
No
wat
er
In w
ell
do
dodo
do
San
dy sil
t (l
acu
stri
ne
1)T
ill
do do do Til
ldo do T
ill
San
dv sil
t
Sh
ale
hed
rock
O
pen
hole
he
low
18.4
7
mS
andv
sli
tS
hal
e h
edro
ck
Ope
n hole
be
low
2
8.6
51
n
San
dv sil
tS
and
and
gra
vel
San
d an
d gra
vel
Shal
e bed
rock
O
pen
hole
be
low
74.6
w
;12-l
n
casi
ng to
7
m;
10-l
n
casi
ng
to
40
m;
6-l
n
casi
ng
to
74.6
in
1 AW
-
Flu
sh j
oin
t st
eel
casi
ng
ID
4
.84
2
cm,
OD
-5.7
15
cm2
BW -
Flu
sh jo
int
steel
casi
ng
ID
6
.03
2
en,
OD
=7.
302
cm3
NW -
Flu
sh j
oin
t st
eel
casi
ng
ID
7.6
20
cm,
OD 8
.89
0
cm
* E
stim
ated
fr
om
to
po
gra
ph
ic
nap
.
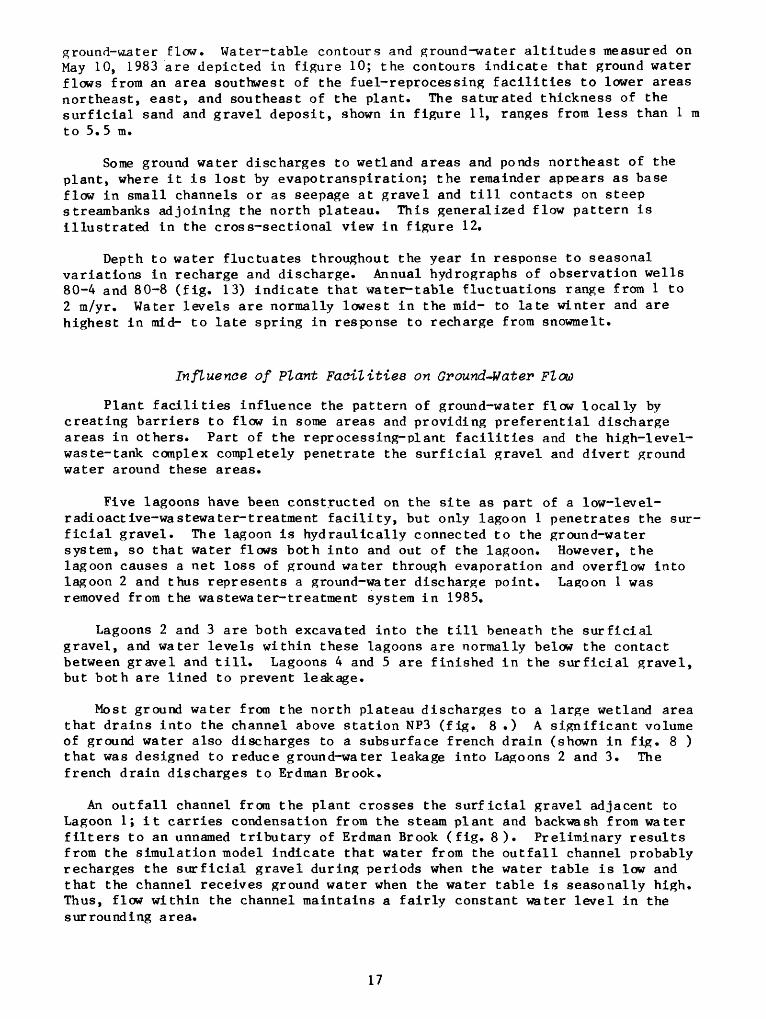
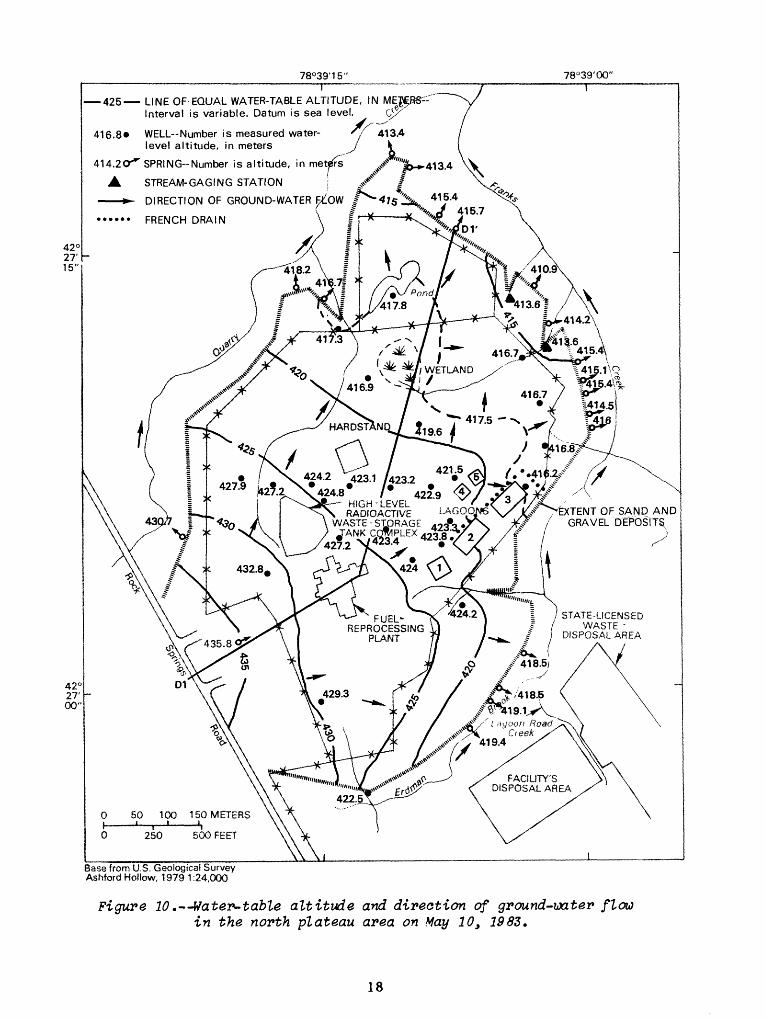
ground-water flow. Water-table contours and ground-water altitudes measured on May 10, 1983 are depicted in figure 10; the contours indicate that ground water flows from an area southwest of the fuel-reprocessing facilities to lower areas northeast, east, and southeast of the plant. The saturated thickness of the surficial sand and gravel deposit, shown in figure 11, ranges from less than 1 m to 5.5 m.
Some ground water discharges to wetland areas and ponds northeast of the plant, where it is lost by evapotranspiration; the remainder appears as base flow in small channels or as seepage at gravel and till contacts on steep streambanks adjoining the north plateau. This generalized flow pattern is illustrated in the cross-sectional view in figure 12.
Depth to water fluctuates throughout the year in response to seasonal variations in recharge and discharge. Annual hydrographs of observation wells 80-4 and 80-8 (fig. 13) indicate that water-table fluctuations range from 1 to 2 m/yr. Water levels are normally lowest in the mid- to late winter and are highest in mid- to late spring in response to recharge from snowmelt.
Influence of Plant Facilities on Ground-Water Flow
Plant facilities influence the pattern of ground-water flow locally by creating barriers to flow in some areas and providing preferential discharge areas in others. Part of the reprocessing-plant facilities and the high-level- waste-tank complex completely penetrate the surficial gravel and divert ground water around these areas.
Five lagoons have been constructed on the site as part of a low-level- radio act ive-wa st ewa ter- treatment facility, but only lagoon 1 penetrates the sur ficial gravel. The lagoon is hydraulically connected to the ground-water system, so that water flows both into and out of the lagoon. However, the lagoon causes a net loss of ground water through evaporation and overflow into lagoon 2 and thus represents a ground-water discharge point. Lagoon 1 was removed from the wastewater-treatment system in 1985.
Lagoons 2 and 3 are both excavated into the till beneath the surficial gravel, and water levels within these lagoons are normally below the contact between gravel and till. Lagoons 4 and 5 are finished in the surficial gravel, but both are lined to prevent leakage.
Most ground water from the north plateau discharges to a large wetland area that drains into the channel above station NP3 (fig. 8 .) A significant volume of ground water also discharges to a subsurface french drain (shown in fig. 8 ) that was designed to reduce ground-water leakage into Lagoons 2 and 3. The french drain discharges to Erdman Brook.
An outfall channel from the plant crosses the surficial gravel adjacent to Lagoon 1; it carries condensation from the steam plant and backwash from water filters to an unnamed tributary of Erdman Brook (fig. 8). Preliminary results from the simulation model indicate that water from the outfall channel probably recharges the surficial gravel during periods when the water table is low and that the channel receives ground water when the water table is seasonally high. Thus, flow within the channel maintains a fairly constant water level in the surrounding area.
17
78°39'15" 78°39'00"
425 LINE OF EQUAL WATER-TABLE ALTITUDE, IN Interval is variable. Datum is sea level.
416.8* WELL Number is measured water- level altitude, in meters
414.2O-*" SPRING-Number is altitude, in meters ^/ %-*-413.4» _ _ _ _ { v^ a
STREAM-GAGING STATION
DIRECTION OF GROUND-WATER F/OW
FRENCH DRAIN
-Y- \ i Ini 41^71 >' /^° A
«^VA ̂ / Wpo
/^-EXTENT OF SAND AND / GRAVEL DEPOSITS
STATE-LICENSEDWASTE -
DISPOSAL AREA
FUEL- REPROCESSING
PLANT
FACIUTY'SD!SPOSAL AREA
Base from U.S. Geo!ogica! Survey Ashford Hollow, 1979 1:24,000
Figure 10. Water-table altitude and direction of ground-water flow in the north plateau area on May 10, 1983.
18
78°39'15" 78C39'00-
LINE OF EQUAL SATURATED THICKNESS-lnterval is 1 meter.
CONTROL POINT-Number is saturated thickness, in meters
XTENT OF SAND AND RAVEL DEPOSITS
1.6HARDSTAND
^_..ADIOACTSVE / GOON
STORAGE^ COMPLEX
STATE-LICENSEDWASTE
DISPOSAL AREA
FUEL REPROCESSIN
PLANT
Area shown fig. 15
FACILITY'S DISPOSAL AREA
0 50 100 150 METERS__I___.__.__!.____J.
Base from U.S. Geological Survey Ashford Hollow, 1979 1:24,000
Figure 11.--Saturated thickness of surficial sand and gravel in the north plateau area on May 10, 1983.
19

ALT
ITU
DE
, IN
ME
TE
RS
AB
OV
E S
EA
LE
VE
LA
LTIT
UD
E,
IN M
ET
ER
S A
BO
VE
SE
A L
EV
EL
N)
O
I__
__
I
ft
CO
I <O ft ft a
*O
ft
* S*
cf
^.
^ M ft
ft t
o
cf
ft
ft
O
ft
«-»
S
O
L-i
Co
O
ft cl
ef
^.
O
Tt-
CO
^
ft
ftC
iC
f CO
0)
^.
CO
v-»
a* §^ 3 ft ^
^. f
t25
r-
»
MJ
a,
^. f
t«Q
-^
O
CO
^ ^
.C
i ct
- ^-
O
Mai
n pl
ant
55
;
foun
datio
n
AC.
i//
i
0
O >
i oi>
o i x
P
o I
" I

Ground-Water Discharge
Total measured ground-water discharge from the north plateau on three separate days in 1983 are presented in table 2. These flows were measured at gaging stations NP1 and NP3 and at 19 seepage faces. The measurements of March 3 and July 5 were made during base-flow conditions with negligible surface runoff. The measurements of October 6 reflect 2.4 cm of rain that fell during the preceding hours and produced significant runoff at station NPl.
Seasonal variation in discharge (table 2) parallels the water-table trends shown in figure 11. The highest annual water levels generally occur in the spring after snowmelt and seasonal precipitation and produce the largest ground- water discharges. Water levels decline during late spring and are lowest in July, when evapotranspiration is greatest. Ground-water discharges decrease nearly 70 percent during summer. Flow from the buried french drain near lagoons 2 and 3 remains fairly constant, however, because the saturated thickness in that part of the north plateau is sufficient to maintain discharge throughout the year. Increased recharge in the fall causes the water table to rise, and ground-water discharge increases through December. Then, as low temperatures and freezing of the ground begin to limit recharge, discharge decreases until s pr ing.
Table 2. Ground-water discharge from the north plateau, 1982
[Values are In liters per second. Locations are shown in figure 8. ]
Discharge point
NP 3NP 1French drainSeepage flow
3-3-83
1.76.37.29.38
7-5-83
0.60.03.22.09
10-6-83
1.56.62.31.40
Total 2.80 .94 2.89
Hydraulic Conductivity of Surficial Gravel
The horizontal hydraulic conductivity of the surficial gravel was estimated from slug tests on eight wells screened throughout the saturated thickness of the gravels. Slug-test data were analyzed through a type-curve method described by Cooper and others (1967) that assumes horizontal flow to the perimeter screen. Although the method was developed for wells tapping confined aquifers, it applies also to the unconfined surficial gravel because the variation in saturated thickness during the tests was small.
The Cooper method requires semi logarithmic plots of H/HQ against time (t), where Ho is the decline of the water level immediately after injection, and His the water level at some time, t, after injection. The plots were compared to a family of type curves presented in Cooper and others (1967) to estimate transmissivity. The horizontal hydraulic conductivity was then calculated by dividing the transmissivity by the saturated thickness. A sample plot and
21

calculation for well 80-8 is given in figure 14. Values of horizontal hydraulic conductivity estimated from the slug-test data (table 3) range from 0.11 to 7.9 m/d. These values are comparable to the soil permeability of 1 to 4 m/d on the north plateau derived by Pearson and others (1940).
1.02OI- (JLU )
2
2Ov- CJLU )2
(DD 0.5
ULUQo
o
0.0
Water levelimmediately after injection
- TYPE CURVE FOR:I ^ Initial head in aquifer
Well casing
where:
rs = radius of well screen
rc = radius of well casing
S = storage coefficient
Water level at time t
Head in aquifer at time t
Well screen or wall of open hole
= 0.3cm2/s
where: T = transmissivity, cm2 /cm . s
t = time, s
K= T/b
= 0.3/277
17x10-*cm/s= 1.4 m/d
where: K = hydraulic conductivity,
b = aquifer thickness, m
MATCH POINT:
t = 13 seconds
10 100
TIME, IN SECONDS
1,000 10,000
Figure 14. Calculation of hydraulic conductivity from slug-test data from well 80-83 by method of Cooper (1967).
22
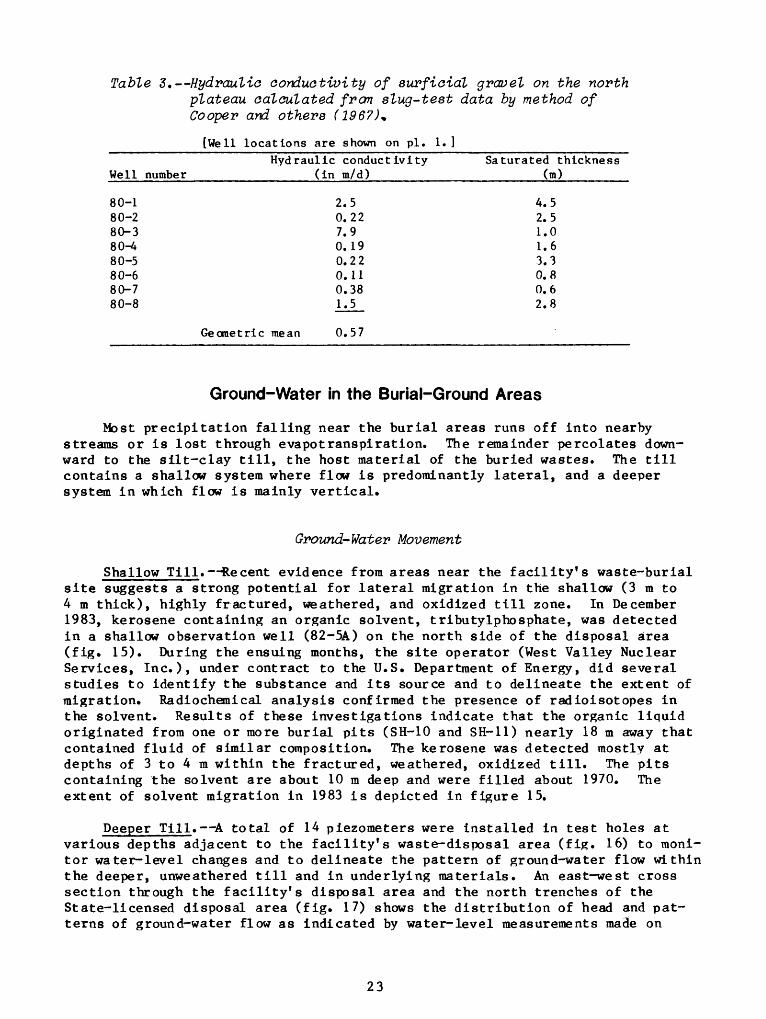
Table S. Hydraulic conductivity of surficial gravel on the north plateau calculated from slug-test data by method of Cooper and others (1967)+
[Well locations are shown on pi. 1. ]Hydraulic conductivity Saturated thickness
Well number (in m/d) (m)
80-180-280-380-480-580-680-780-8
2.50.227.90.190.220.110.381.5
4.52.51.01.63.30.80.62.8
Geometric mean 0.57
Ground-Water in the Burial-Ground Areas
Most precipitation falling near the burial areas runs off into nearby streams or is lost through evapotranspiration. The remainder percolates down ward to the silt-clay till, the host material of the buried wastes. The till contains a shallow system where flow is predominantly lateral, and a deeper system in which flow is mainly vertical.
Ground-Water Movement
Shallow Till. Recent evidence from areas near the facility's waste-burial site suggests a strong potential for lateral migration in the shallow (3 m to 4 m thick), highly fractured, weathered, and oxidized till zone. In December 1983, kerosene containing an organic solvent, tributylphosphate, was detected in a shallow observation well (82-5A) on the north side of the disposal area (fig. 15). During the ensuing months, the site operator (West Valley Nuclear Services, Inc.), under contract to the U.S. Department of Energy, did several studies to identify the substance and its source and to delineate the extent of migration. Radiochemical analysis confirmed the presence of radioisotopes in the solvent. Results of these investigations indicate that the organic liquid originated from one or more burial pits (SH-10 and SH-11) nearly 18 m away that contained fluid of similar composition. The kerosene was detected mostly at depths of 3 to 4 m within the fractured, weathered, oxidized till. The pits containing the solvent are about 10 m deep and were filled about 1970. The extent of solvent migration in 1983 is depicted in figure 15.
Deeper Till. A total of 14 piezometers were installed in test holes at various depths adjacent to the facility's waste-disposal area (fig. 16) to moni tor water level changes and to delineate the pattern of ground-water flow within the deeper, unweathered till and in underlying materials. An east-west cross section through the facility's disposal area and the north trenches of the State-licensed disposal area (fig. 17) shows the distribution of head and pat terns of ground-water flow as indicated by water-level measurements made on
23

EXPLANATION
BURIAL PIT AND NUMBER
BURIAL PIT CONTAINING ORGANIC SOLVENT
V, N APPROXIMATE AREA OF *" J ORGANIC SOLVENT
OBSERVATION WELL
X FENCE
Figure 15. Approximate extent of solvent migration in 1984 from thefacility's waste-disposal area. (Location is shown in fig. 11.)
24
May 10, 1983. In general, ground water moves vertically downward through the 22- to 28-m-thick sequence of till, even beneath small stream valleys along the cross section (fig. 17), where a small amount of discharge was expected. The head distribution at the facility's disposal area reflects water levels measured in piezometers along the sides of the burial ground and presumably shows a natural pattern of flow unaffected by burial pits. No information is available on the hydraulic connection between the flow system and the burial pits.
Data from some piezometers installed adjacent to the facility's disposal area support Prudic and Randall's conclusions (1979, p. 859) that unsaturated conditions within the Lavery Till are found not only in the thin, narrow zone of unsaturated sediment between land surface and the water table. West of the facility's burial ground, piezometers between depths of 6.1 and 16.2 m in holes82-3A, 82-3B, and 83-3C (fig. 16)i have never contained water since their installation. Prudic and RandaTl (1979) cited similar conditions in piezometers between 5.5- and 14-m depths in holes L and Q west of trench 14 at the State- licensed waste-burial ground. The area near the 82-3 nest of piezometers (fig. 16) is routinely traveled over and scraped by heavy equipment that has formed a compacted surface with little vegetation. This type of surface would encourage rapid runoff of rainfall and would reduce infiltration and could thus explain the absence of saturation at depth.
Neutron-moisture profiles from till near the 82-3 nest of piezometers and in saturated till near the 82-1 nest of piezometers south of the facility's disposal area (appendix C) show a 0- to 10-percent moisture content in the nonwater-yielding till, compared to a 20- to 35-percent moisture content of the saturated till. The presence of moisture in the nonwater-yielding till indi cates, as Prudic and Randall (1979, p. 859) suggested, that pressure head in this area is negative but may approach zero. This interpretation is reflected by the dashed equipotential lines in figure 17.
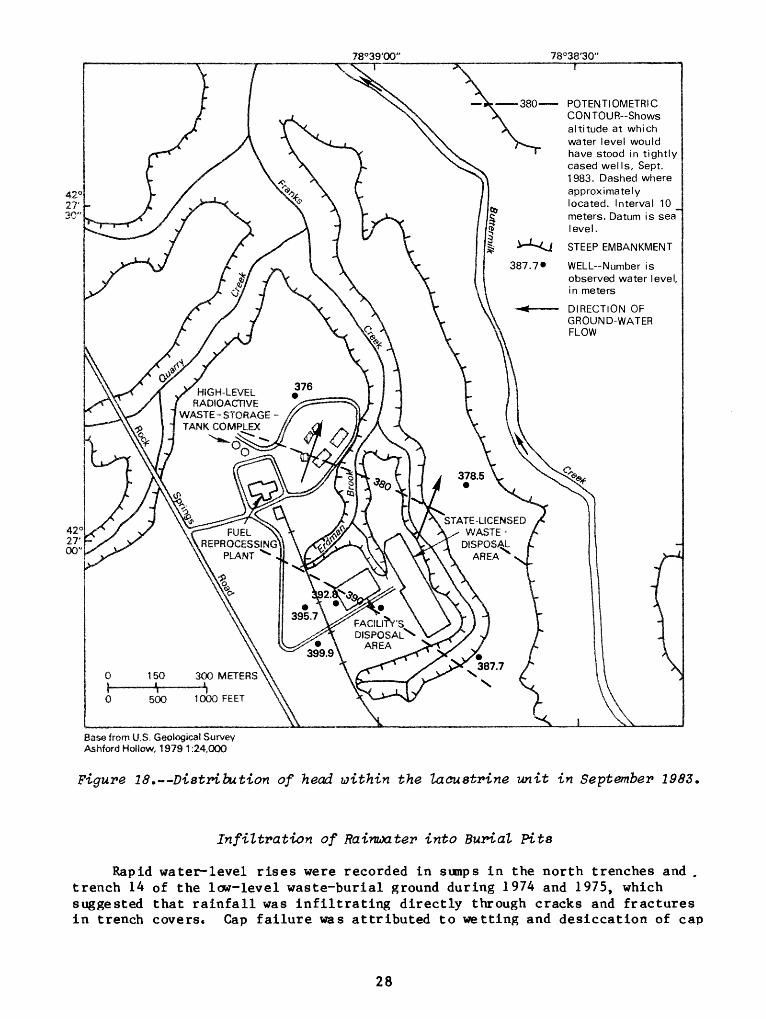
Below the Till. Water moving downward through the till from the burial grounds eventually reaches the underlying lacustrine fine sand and silt. Data from eight test holes near the higher level and the low-level-waste disposal areas indicate that the upper sandy part of the lacustrine sequence is not water yielding. Neutron-moisture profiles (appendix C) of four boreholes (83-1E,83-2E, 82-3D, and 82-lD) suggest minor levels of saturation, which indicates that pressure heads are less than or close to zero through this sequence. Water levels in piezometers completed in saturated silt and clay at the base of the unit (fig. 18) suggest a small lateral gradient (0.023 m/m) northeastward toward Buttermilk Creek. Although no major springs are evident in outcrop areas along Buttermilk Creek, Prudic and Randall (1979, p. 861) suggested that either ground-water discharge may be large enough to cause soil creep but too small to carry away slumped and landslide material that mantles the outcrop slope, or that the discharge occurs chiefly where the unit dips to creek grade some distance to the north.
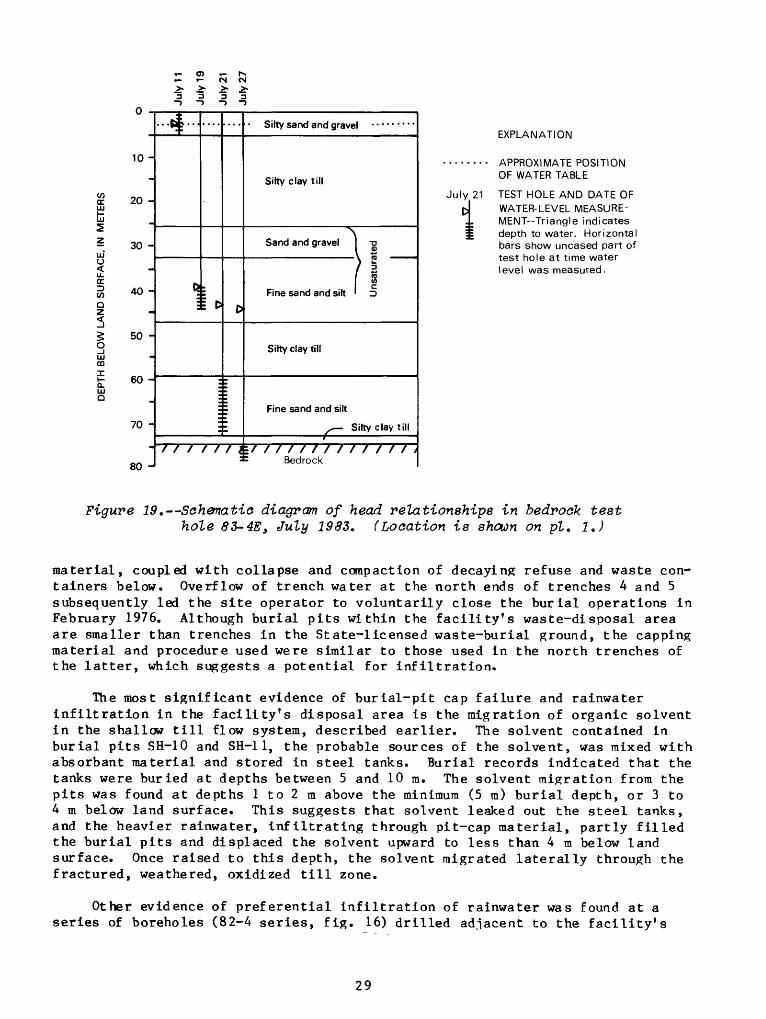
Head data collected during drilling of bedrock test hole 83-4E, 200 m northeast of the main plant (fig. 19), suggest that part of the water entering the saturated silt and fine sand may continue downward to recharge lower glacial deposits and the bedrock in an area northeast of the main plant building. However, this flow pattern has not been verified in other areas of the plant facilities because no information is available on heads within the lower sequen ces of glacial deposits.
25

Trench 12 I '/I Trench 7 / / Trench 6
43
0 r
420
Low
- Lev
el
Rad
ioac
tive
| W
aste
- |
Dis
posa
l A
rea
410 - -,._
_ _
_
40
0
390
EX
PLA
NA
TIO
N
77
BA
CK
FIL
L
FR
AC
TU
RE
D,
OX
IDIZ
ED
, W
EA
TH
ER
ED
TIL
L
TIL
L W
ITH
O
XID
IZE
D
FR
AC
TU
RE
S
UN
WE
AT
HE
RE
D T
ILL
41
7.6
1
D
410
OB
SE
RV
ED
H
EA
D
IN
PIE
ZO
ME
TE
R--
in m
ete
rs
TES
T H
OLE
AP
PR
OX
IMA
TE
PO
SIT
ION
OF
WA
TE
R T
AB
LE
EQ
UIP
OT
EN
TIA
L C
ON
TO
UR
-In
terv
al
is 4
m
ete
rs.
Dash
ed w
he
re a
pp
roxi
ma
te.
DIR
EC
TIO
N
OF
GR
OU
ND
-WA
TE
R F
LOW
Fig
ure
17.
Dis
trib
uti
on o
f he
ad a
nd d
irec
tions
of
grou
nd-w
ater
flo
w i
n
cro
ss s
ecti
on
th
roug
h fa
cil
ity's
d
isp
osa
l ar
ea a
nd n
ort
h t
ren
ches
of
the
Sta
te-l
icen
sed
w
ast
e-d
isp
osa
l ar
eas
on M
ay
10,
1983
. (L
ocat
ion
of
sect
ion
is
show
n in
fig
.
78°39'00" 78°38'30"
POTENTIOMETRIC CONTOUR--Shows altitude at which water level would have stood in tightly cased wells, Sept. 1983. Dashed where approximately located. Interval 10 meters. Datum is sea level.
STEEP EMBANKMENT
WELL-Number is observed water level, in meters
DIRECTION OFGROUND-WATERFLOW
HIGH-LEVEL RADIOACTIVE
WASTE-STORAGE TANK COMPLEX
STATE-UCENSED WASTE -FUEL
REPROCESSING PLANT
DISPOSAL AREA
FACILITY'S DISPOSAL^"AREA
Base from U.S. Geological Survey Ashford Hollow, 1979 1:24,000
Figure 18. Distribution of head within the lacustrine unit in September 1983,
Infiltration of Rainwater into Burial Pits
Rapid water-level rises were recorded in sumps in the north trenches and . trench 14 of the low-level waste-burial ground during 1974 and 1975, which suggested that rainfall was infiltrating directly through cracks and fractures in trench covers. Cap failure was attributed to wetting and desiccation of cap
28
»- O> r- t^ r- r- CM CM
3333
10 -
-
20 -
30 -
40 -
-
50 -
60 -
70 -
8O -
C^*? :
c?
/ / /
i e>
/ /
0
/ \
Silty sand and gravel
Silty clay till
Sand and gravel I -D
I 1 Fine sand and silt ' D
Silty clay till
Fine sand and silt
x Silty clay till»
= Bedrock
EXPLANATION
........ APPROXIMATE POSITION
OF WATER TABLE
July 21 TEST HOLE AND DATE OF d WATER-LEVEL MEASURE- ^ MENT Triangle indicates j depth to water. Horizontal
bars show uncased part of test hole at time water level was measured.
Figure 19. Schematic diagram of head relationships in bedrock test hole 83-4E, July 1983. (Location is shown on pi. 1.)
material, coupled with collapse and compaction of decaying refuse and waste con tainers below. Overflow of trench water at the north ends of trenches 4 and 5 subsequently led the site operator to voluntarily close the burial operations in February 1976. Although burial pits within the facility's waste-disposal area are smaller than trenches in the State-licensed waste-burial ground, the capping material and procedure used were similar to those used in the north trenches of the latter, which suggests a potential for infiltration.
The most significant evidence of burial-pit cap failure and rainwater infiltration in the facility's disposal area is the migration of organic solvent in the shallow till flow system, described earlier. The solvent contained in burial pits SH-10 and SH-11, the probable sources of the solvent, was mixed with absorbant material and stored in steel tanks. Burial records indicated that the tanks were buried at depths between 5 and 10 m. The solvent migration from the pits was found at depths 1 to 2 m above the minimum (5 m) burial depth, or 3 to 4 m below land surface. This suggests that solvent leaked out the steel tanks, and the heavier rainwater, infiltrating through pit-cap material, partly filled the burial pits and displaced the solvent upward to less than 4 m below land surface. Once raised to this depth, the solvent migrated laterally through the fractured, weathered, oxidized till zone.
Other evidence of preferential infiltration of rainwater was found at a series of boreholes (82-4 series, fig. 16) drilled adjacent to the facility's
29
waste-disposal area along its northwest border. A 15-m borehole (82-4C) in this area, drilled with continuous coring, indicated a general lack of permeable or water-bearing materials in the sequence of till penetrated. During the drilling of a hole approximately 1.5 m northwest of the original 15-m hole (borehole 82-4A) to install a piezometer at a shallower depth, a water-bearing zone was encountered at a depth of about 3.6 m that produced an anomalous pressure head of about 3 m. Borehole 82-4A was evacuated on several occasions and, in each instance, water levels in the piezometers recovered rapidly, which suggests that the piezometer was tapping a significant water-bearing zone.
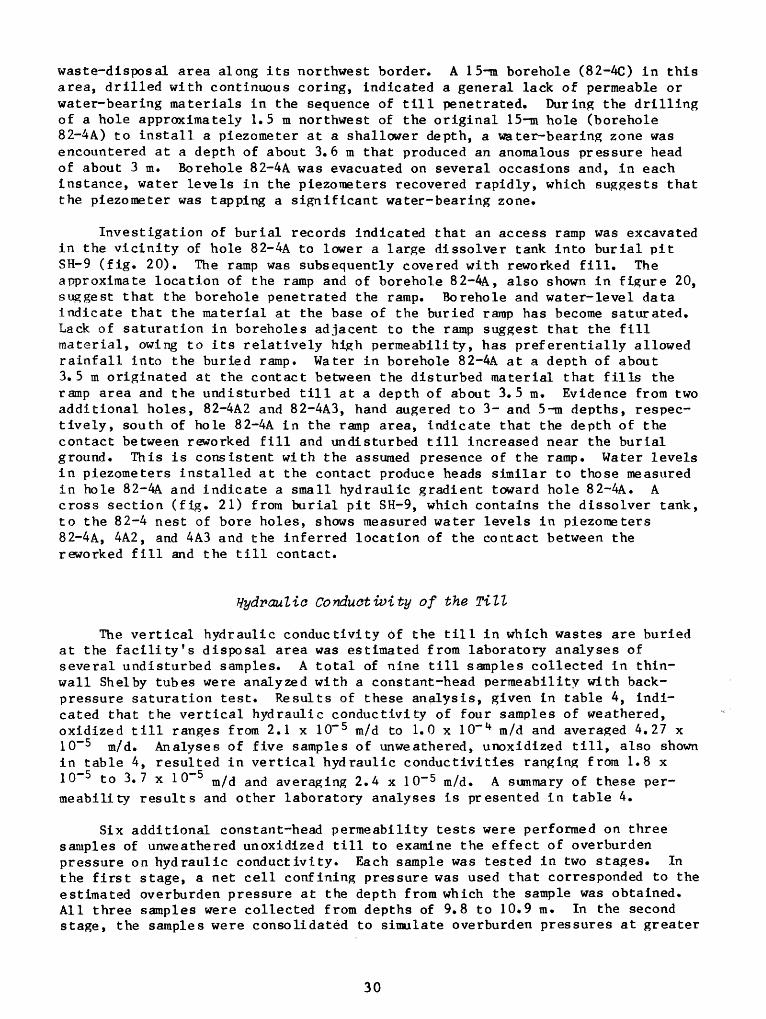
Investigation of burial records indicated that an access ramp was excavated in the vicinity of hole 82-4A to lower a large dissolver tank into burial pit SH-9 (fig. 20). The ramp was subsequently covered with reworked fill. The approximate location of the ramp and of borehole 82-4A, also shown in figure 20, suggest that the borehole penetrated the ramp. Borehole and water-level data indicate that the material at the base of the buried ramp has become saturated. Lack of saturation in boreholes adjacent to the ramp suggest that the fill material, owing to its relatively high permeability, has preferentially allowed rainfall into the buried ramp. Water in borehole 82-4A at a depth of about 3. 5 m originated at the contact between the disturbed material that fills the ramp area and the undisturbed till at a depth of about 3.5 m. Evidence from two additional holes, 82-4A2 and 82-4A3, hand augered to 3- and 5-m depths, respec tively, south of hole 82-4A in the ramp area, indicate that the depth of the contact between reworked fill and undisturbed till increased near the burial ground. This is consistent with the assumed presence of the ramp. Water levels in piezometers installed at the contact produce heads similar to those measured in hole 82-4A and indicate a small hydraulic gradient toward hole 82-4A. A cross section (fig. 21) from burial pit SH-9, which contains the dissolver tank, to the 82-4 nest of bore holes, shows measured water levels in piezometers 82-4A, 4A2, and 4A3 and the inferred location of the contact between the reworked fill and the till contact.
Hydraulic Conduct wity of the Till
The vertical hydraulic conductivity of the till in which wastes are buried at the facility's disposal area was estimated from laboratory analyses of several undisturbed samples. A total of nine till samples collected in thin- wall Shelby tubes were analyzed with a constant-head permeability with back pressure saturation test. Results of these analysis, given in table 4, indi cated that the vertical hydraulic conductivity of four samples of weathered, oxidized till ranges from 2.1 x 10~" 5 m/d to 1.0 x lO"" 1* m/d and averaged 4.27 x 10~~ 5 m/d. Analyses of five samples of unweathered, unoxidized till, also shown in table 4, resulted in vertical hydraulic conductivities ranging from 1.8 x 10 to 3. 7 x 10 m/d an<j averaging 2.4 x 10~" 5 m/d. A summary of these per meability results and other laboratory analyses is presented in table 4.
Six additional constant-head permeability tests were performed on three samples of unweathered unoxidized till to examine the effect of overburden pressure on hydraulic conductivity. Each sample was tested in two stages. In the first stage, a net cell confining pressure was used that corresponded to the estimated overburden pressure at the depth from which the sample was obtained. All three samples were collected from depths of 9.8 to 10.9 m. In the second stage, the samples were consolidated to simulate overburden pressures at greater
30

FACILITY'S DISPOSAL \\VAREA
10 20 30 FEET
EXPLANATION
FENCE
A2° WELL AND NUMBER
SH 76 BURIAL TRENCH AND NUMBER
Figure 20. Location of 82-4 aeries piezometers and approximate location of buried access ramp. (Location is shown in fig. 16.)
31
A
f
E
* .
Not to scale
J /
»,
tic^
82-4 A PIEZOMETERS
^^"s^ i-r-M/^r- i n.r- r*r>« rrw<p rtMMk/\«>«i * »«-*
c k
*,
>*
i
* - j^. - ,"^^ ̂ BACKHLLbU | MAIhHIAL |
Q 1 '^^ 5 !2 i BURIALPTT SH9 |
"^^4 ' 'UNDISTURBED TILL ^* ^»?^P i ,
"*^ ^^ if WSSOLVER TANK J
groofc
fMETERS
0 10 20 30 FEET
EXPLANATIONA3
PIEZOMETER-Number is water-level i2 altitude, in meters. Datum is sea level.
150 300 FEET
LOCATION MAP
Figure 21. Geologic section from 82-4 series of piezometers to burial pit SH 9 stowing inferred position of buried access ramp.
depths (21.0 to 23.2 m). Permeability values resulting from the first stage ranged from 1.17 x 10" 5 to 1.5 x 10~ 5 m/d and averaged 1.3 x 1CT 5 m/d (table 5). The increased overburden pressures simulated in the second stage gave slightly lower values ranging from 0.1 x 10" 5 to 1.27 x 10" 5 m/d. This apparent reduc tion in permeability ranged from 3.5 to 18.4 percent and averaged 13.1 percent, which indicates that the increase in overburden pressure below trench-bottom levels reduces the hydraulic conductivity of the till only slightly.
The horizontal hydraulic conductivity of the clay-rich till was also eval uated in the field. Horizontal hydraulic conductivity values were estimated from recovery-test data from five piezometers. Recovery tests were analyzed by two methods a type-curve-matching method described by Cooper and others (1967), which assumes horizontal flow to the piezometer screen, and a graphical method described by Hvorslev (1951), which assumes spherical, isotropic flow. The calculated values obtained by both methods ranged from 8.6 x 10"~ 5 to 6.9 x 10~ 6 m/d and averaged 1.7 x 10"" 5 m/d.
32

Table 4. Laboratory analysis of vertical hydraulic conductivity of selected till samples by constant-head permeability with back-pressure saturation tests [Boring locations shown on pi. 1. ]
Boring no
82-1B
82-2A
82-2B
82-3A
82-4B
82-5A
82-5B
Sample depth below land Moisture surface content
(m) (percent)
0.9 - 1.45 17.617.5*
6.1 - 6.6 19.620.5*
1.5-1.9 12.812.4*
6.2 - 6.7 19.718.5*
1.2 - 1.7 16.717.0*
5.0-5.5 16.011.2*
6.1 -6.6 18.920.5*
1.8-2.3 17.617.3*
3.0 - 3.6 18.418.4*
Grain size in sample Dry unit Vertical(percent) weight permeability
>2mm 2-0.074 <0. 074mm (kg/m 8 ) (m/d)
1.9 13.8 84.3 1825.9 2.5 x 10'5
1.3 13.9 85.3 1760.2 2.4 x 10'5
5.3 27.5 67.2 1933.2 1.0 x 10~4
7.3 19.6 73.1 1819.4 2.4x10⁻⁵
2.7 16.1 81.2 1859.5 2.1 x 10'5
9.6 20.5 69.9 2091.8 1.9 x lO'5
1.8 4.2 94.0 1758.6 3.7 x 10~ 5
3.0 16.8 80.2 1846.7 2.16xlO'5
2.3 14.0 83.7 1816.3 1.8 x 10'5
* Permeability sample
33
SUMMARY AND CONCLUSIONS
The Western New York Nuclear Service Center in northern Cattaraugus County contains a fuel-reprocessing plant, a high-level-radioactive liquid-^waste tank complex, and other related waste facilities that include two separate burial grounds for shallow burial of solid radioactive wastes. The burial grounds consist of a 4-hectare area licensed by the State of New York for burial of com mercial low-level radioactive wastes and a 2.2-ha area previously licensed by the U.S. Nuclear Regulatory Commission and now operated by the U.S. Department of Energy for burial of wastes with higher levels of radioactivity. The former is not operating at present (1987).
The plant and waste facilities are on a sequence of glacial and postglacial deposits at an altitude of 420 m on the west flank of the Buttermilk Creek valley. These deposits partly fill an ancestral bedrock valley that is as much as 150 m deep.
The facilities and burial grounds are on an elevated plateau, referred to as the north plateau, that is underlain by an alluvial fan and fluvial deposits composed of silty sand and gravel. Thickness of these surficial deposits ranges from slightly more than 9 m southwest of the plant area to less than 3.0 m along deeply incised stream channels of Quarry Creek and Franks Creek, tributary streams bordering the plateau.
The burial grounds are excavated into the Lavery Till (LaFleur, 1979), which is predominantly silt and clay and ranges from 22 to 28 m thick. Beneath the Lavery Till are recessional lacustrine and kame delta deposits of post-Kent Till age. The units consist of basal laminated silt and clay grading upward to fine to coarse sand and silt. In some boreholes, the upper sandy parts of the kame delta and lacustrine deposits are capped by coarse gravel. Evidence from regional stratigraphic studies and a bedrock test hole on the site indicates that post-Kent recessional deposits are underlain by at least two older clayey silt tills, the Kent Till and Olean(?) Till (LaFleur, 1979). These till units are separated by a sequence of fine sand and silt presumed to be post-Clean recessional lacustrine deposits.
Bedrock underlying the unconsolidated sediments consists of shale and sand stone of the Upper Devonian Canadaway and Conneaut Groups (Rickard and Fisher, 1970). Depth to bedrock ranges from about 150 m in the deepest parts of the ancestral bedrock valley to less than 1 m along hillsides west of the plant.
Surface runoff from the center drains to Franks Creek east and south of the main plant area and to Quarry Creek north of the center. Franks Creek drains into Buttermilk Creek north of the center. Buttermilk Creek flows into Cattaraugus Creek at Springville, and Cattaraugus Creek in turn flows into Lake Erie near Silver Creek.
Surface water leaving the site was monitored at three gaging stations. Flow measured at Lagoon Road Creek on a small tributary of Franks Creek that drains parts of the disposal areas, averaged 0.675 x 10~ 3 m 3 /s during 1981-83. The highest daily flow was 28.3 x 10~" 3 m 3/s, and the stream was dry for about 60 days during the summer. During most rainstorms, streamflow increased quickly with runoff from the surficial silty-clay till of the area but returned to base- flow conditions within several hours after rainfall ended.
34
Streamflow from the north plateau was less responsive to rainfall. Base flow was normally sustained during summer, presumably by storage release from the surficial sand and gravel. Flow at the NP1 station ranged from zero during a few days in the summer to 31.2 x 10"3 m 3/s and averaged 1.30 x 10" 3 m 3/s. Flow at the NP3 station ranged from 0.113 x 10" 3 m 3/s to 28.3 x 10~ 3 m 3/s and averaged 2.48 x 10~ 3 m 3/s.
Periodic water-level measurements in observation wells indicate that ground water in the north plateau area flows from southwest of the fuel-reprocessing plant toward the perimeter of the plateau. Structures such as the main plant and the high-level radioactive liquid waste tanks create local barriers to flow, while other structures, such as lagoons associated with the low-level radio- act ive-wastewater-tr eatment plant, provide areas of preferential discharge.
Saturated thickness of the surficial sand and gravel ranges from 1 to 5.5 m. Hydraulic conductivity of the surficial sand and gravel, calculated from slug- test data, ranges from 0.1 to 7.9 m/d.
Evidence from a series of boreholes suggests that mechanisms similar to those causing preferential infiltration through materials capping the commercial burial area may be operating in the facility's disposal area. Water-level and borehole data suggest that the base of a buried access ramp used to dispose of a dissolver tank on the northwest side of the burial area has become saturated.
Vertical hydraulic conductivity of the clay-rich Lavery till was evaluated from laboratory permeability tests. Values for four samples of weathered, oxidized till samples ranged from 2.1 x 10"5 to 1.0 x 10" 1* m/d and averaged 4.27 x 10~5 m/d. Values for five unweathered till samples ranged from 1.8 x 10"5 to 3.7 x 10" 5 m/d and averaged 2.45 x 10" 5 m/d.
Horizontal hydraulic conductivity of the till was evaluated through analysis of recovery-test data. Calculated values from five piezometers ranged from 8.6 x 10"5 to 6.9 x 10"6 m/d and averaged 1.0 x 1O" 5 m/d.
REFERENCES CITED
Albanese, J. R. , Anderson, S. L. , Dunne, L. A., and Weir, B. A., 1983, Geologic and hydrologic research at the Western New York Nuclear Service Center, West Valley, New York, Annual Report, August 1981-July 1982: U.S. Nuclear Regulatory Commission report NUREG/CR-3207, 397 p.
Cooper, H. H. , Jr., Bredehoeft, J. D. , and Papadopulos, S. S., 1967, Response of a finite-diameter well to an instantaneous charge of water: Water Resources Research, v. 3, p. 262-269.
Dethier, B. E., 1966, Precipitation in New York state: Ithaca, N.Y., Cornell University Agricultural Experiment Station, New York State College of Agriculture, Bulletin 10, 78 p.
35
REFERENCES CITED (continued)
Harding, W. E., and Gilbert, B. K., 1968, Surface water in the Erie-Niagara basin, New York: New York State Conservation Department, Water Resources Commission, Basin Planning Report ENB-2, 118 p.
Hvorslev, M. J., 1951, Time lag and soil permeability in ground-waterobervations: U.S. Array Corps of Engineers Waterways Experimental StationBulletin 36, 43 p.
LaFleur, R. G., 1979, Glacial geology and stratigraphy of Western New York Nuclear Service Center and vicinity, Cattaraugus and Erie Counties, New York: U.S. Geological Survey Open-File Report 79-989, 17 p.
Pearson, C. S. , Bryant, J. C. , Secor, William, Bacon, S. R., Lounsbury,Clarence, Camp, W. J. , and Beadles, C. B., 1940, Soil survey Cattaraugus County, New York: U.S. Department of Agriculture, Bureau of Plant Industry series 1935, v. 12, 65 p.
Prudic, D. E. , and Randall, A. D., 1979, Ground-water hydrology and subsurface migration of radioisotopes at a low-level solid radioactive-waste disposal site, West Valley, New York, in Carter, M. W., Moghissi, A. A., and Kahn, Bernd, (eds.), Management of low-level radioactive waste: New York, Pergamon Press, v. 2, p. 853-882.
Rickard, L. V., and Fisher, D. W., 1970, Geology of New York, Niagara sheet: New York State Museum and Science Service, Map and Chart series, no. 15.
36
APPENDIXES
Page
A. Description and discharges of notable seeps and springs in the north plateau area of the Western New York Nuclear Service Center ............................. 38
B. Water-level altitudes in wells at the Western New York NuclearService Center, 1981-84. .................... 41
C. Natural gamma and neutron-moisture information from selectedwells logged by the U.S. Geological Survey, May 11, 1983 .... 47
37
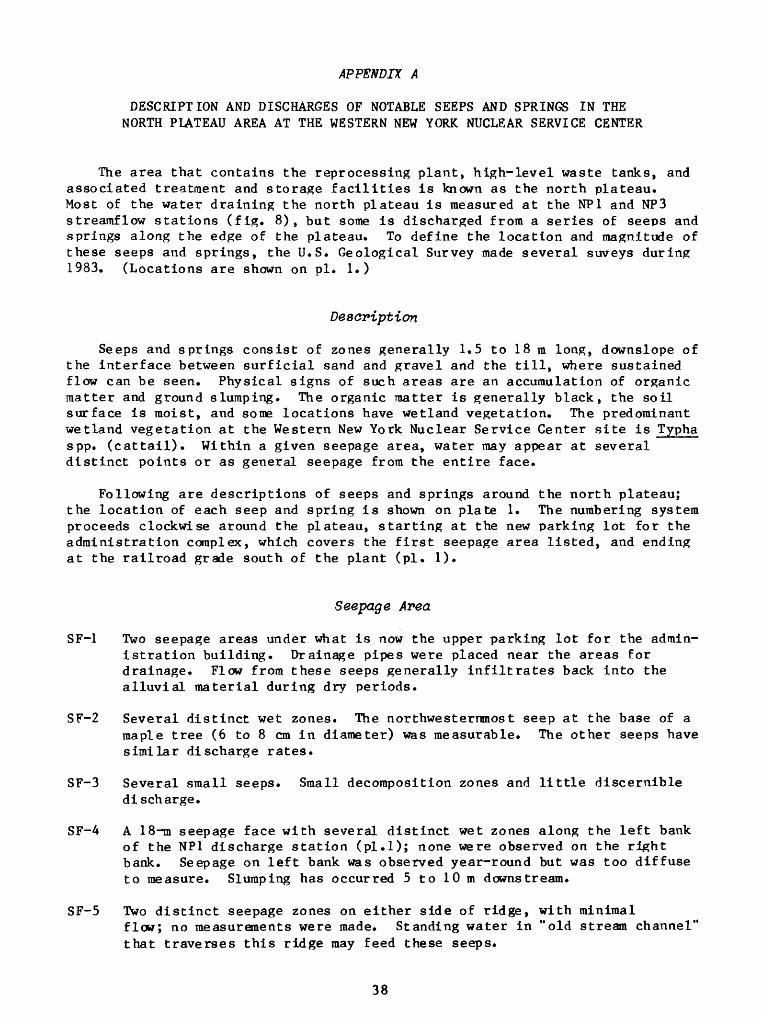
APPENDIX A
DESCRIPTION AND DISCHARGES OF NOTABLE SEEPS AND SPRINGS IN THE NORTH PLATEAU AREA AT THE WESTERN NEW YORK NUCLEAR SERVICE CENTER
The area that contains the reprocessing plant, high-level waste tanks, and associated treatment and storage facilities is known as the north plateau. Most of the water draining the north plateau is measured at the NP1 and NP3 streamflow stations (fig. 8), but some is discharged from a series of seeps and springs along the edge of the plateau. To define the location and magnitude of these seeps and springs, the U.S. Geological Survey made several suveys during 1983. (Locations are shown on pi. 1.)
Description
Seeps and springs consist of zones generally 1.5 to 18 m long, downslope of the interface between surficial sand and gravel and the till, where sustained flow can be seen. Physical signs of such areas are an accumulation of organic matter and ground slumping. The organic matter is generally black, the soil surface is moist, and some locations have wetland vegetation. The predominant wetland vegetation at the Western New York Nuclear Service Center site is Typha spp. (cattail). Within a given seepage area, water may appear at several distinct points or as general seepage from the entire face.
Following are descriptions of seeps and springs around the north plateau; the location of each seep and spring is shown on plate 1. The numbering system proceeds clockwise around the plateau, starting at the new parking lot for the administration complex, which covers the first seepage area listed, and ending at the railroad grade south of the plant (pi. 1).
Seepage Area
SF-1 Two seepage areas under what is now the upper parking lot for the admin istration building. Drainage pipes were placed near the areas for drainage. Flow from these seeps generally infiltrates back into the alluvial material during dry periods.
SF-2 Several distinct wet zones. The northwesternmost seep at the base of a maple tree (6 to 8 cm in diameter) was measurable. The other seeps have similar discharge rates.
SF-3 Several small seeps. Small decomposition zones and little discernible discharge.
SF-4 A 18-m seepage face with several distinct wet zones along the left bank of the NP1 discharge station (pl.l); none were observed on the right bank. Seepage on left bank was observed year-round but was too diffuse to measure. Slumping has occurred 5 to 10m downstream.
SF-5 Two distinct seepage zones on either side of ridge, with minimalflow; no measurements were made. Standing water in "old stream channel" that traverses this ridge may feed these seeps.
38

APPENDIX A (continued)
SF-6 Several seeps are combined in this unit. All are small and generally appear as broad mud flats on gentle slopes but disappear or become channelized on steeper slopes. No measurements have been made.
SF-7 Seepage beginning inside the old security fence northeast of the gravelpits. The seepage area broadens downslope (as found at SA-6) and narrows to several distinct channels as slope steepens. Measureable flow was found in one channel.
SF-8 NP2 drainage. Seepage zone begins inside security fence in swamp. Flow increases considerably between drainpipe under fence and NP2 gage pool. Measurements were made (see table A-l) at lower weir pool in NP2 channel.
SF-9 Two seepage zones in this face. Southern zone was measurable; the other was too diffuse. Alluvial material 1.5 to 2.4 m thick covers surface.
SF-10 Active seepage area on left bank of channel 45 m downstream of the NP3 station. An active slump 9 m long had diffuse flow. A new mudflow appeared in spring 1983. A yellow-brown mud emanates from a 0.3-m-deep hole on the steeper slope. A 1-m-wide sluiceway channels the mud to the NP3 streamcourse. No measurements were possible.
SF-11 Active seepage area along right bank of NP3 channel. Seepage along entire bank, 9 m upstream of station through the weir pond area (approximately 15m). The major seepage point was measured; several others were seen. This area flows year-round.
SF-12 Seepage area is 7.5 m wide with flow dispersed along entire face. Flow into two broad channels, neither of which are measurable. Magnitude of seepage is similar to that of SF-13.
SF-13 Active seepage from 4,5-m-wide area. Flow becomes channelized one-third of the way down the slope.
SF-14 Seepage from 6-m-wide area. Flow becomes channelized two-thirds way downslope; most of seepage is probably in this channel.
SF-15 Seepage from 6-m-wide area. Flow becomes channelized halfway downslope; most seepage is measured in this channel.
SF-16 Seepage from 20.5-m-wide area. Flow becomes channelized halfway downslope; most of the flow is probably here.
SF-17 Outlet of french-drain system east of the large storage lagoons. Appreciable flow with black (manganese?) stain in channel.
SF-18 Seepage from field east of plant complex. Forms several small connected wetlands opposite low-level waste-burial trenches. Most drainage flows along south side of road.
SF-19 Long seepage area halfway between railroad and SF-18. Small seeps near crest of slope; one of four had measurable flow.
39
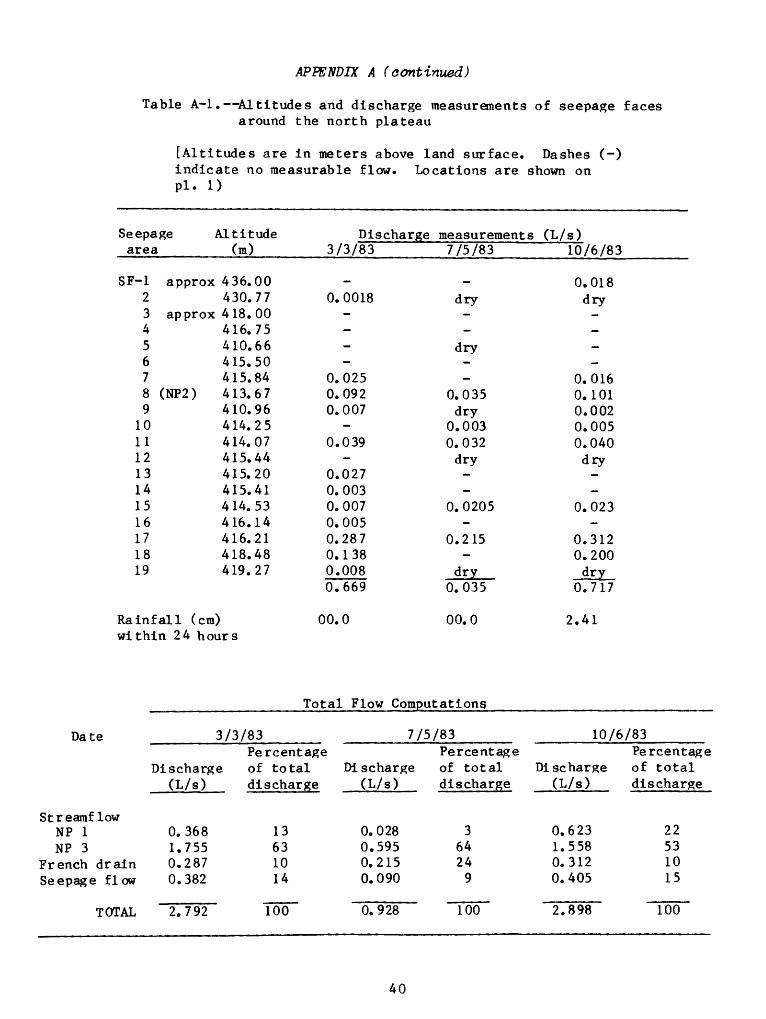
APPENDIX A (continued)
Table A-1. Altitudes and discharge measurements of seepage faces around the north plateau
[Altitudes are in meters above land surface. Dashes (-) indicate no measurable flow. Locations are shown on pl. 1)
Seepage Altitude area (m)
SF-1 approx2 3 approx45 678 (NP2)9
101112 13141516171819
Rainfall (cm)
436.00430.77 418.00416.75410.66 415.50415.84413.67410.96 414.25414.07415.44 415.20415.41414.53416.14416.21418.48419.27
Discharge3/3/83
_0. 0018
-
:0.0250.0920.007
0.039
0.0270.0030.0070.0050.2870.1380.0080.669
00.0
measurements7/5/83
__
dry
-dry
0.035dry
0.0030.032
dry
0.0205
-0.215
-dry
0.035
00.0
(L/s)10/6/83
0.018dry
0.0160.1010.002 0.0050.040dry
0.023
0.3120.200dry
0.717
2.41within 24 hours
Total Flow Computations.
Date 3/3/83
StreamflowNP 1NP 3
French drain Seepage flow
TOTAL
Discharge (L/s)
0.3681.7550.2870.382
2.792
Percentage of total discharge
13631014
Too"
7/5/83
Di scharge (L/s)
0.0280.5950.2150.090
0.928
Percentage of total discharge
36424
9Too"
10/6/83
Discharge (L/s)
0.6231.5580.3120.405
2.898
Percentage of total discharge
22531015
Too"
40
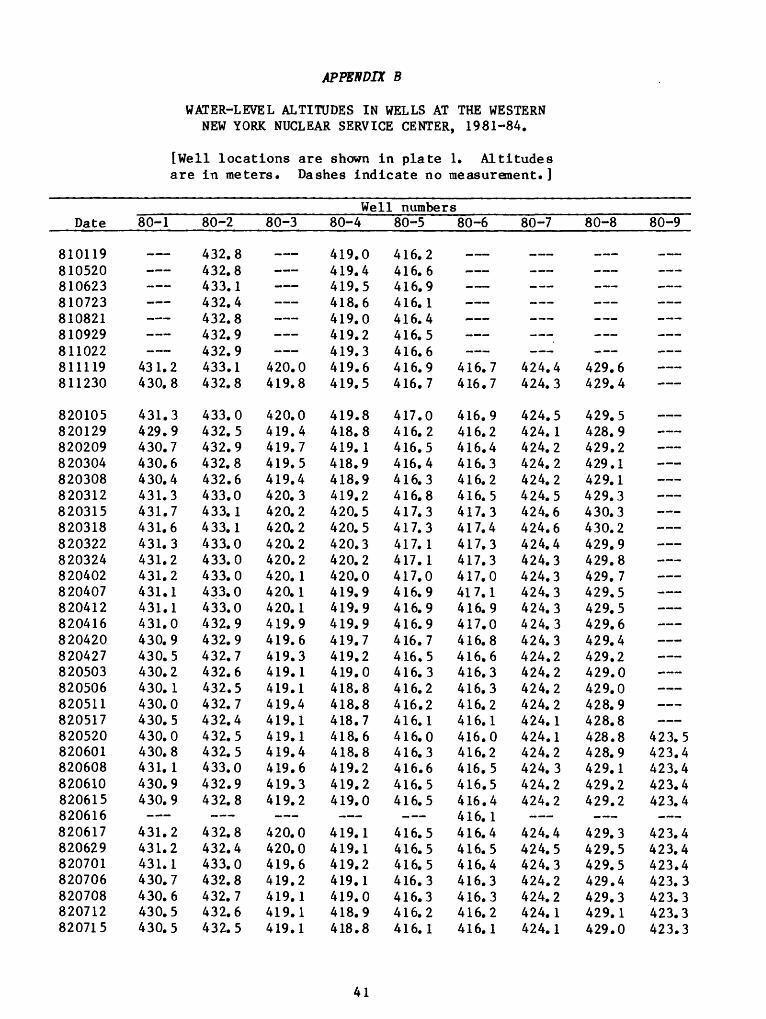
APPENDIX B
WATER-LEVEL ALTITUDES IN WELLS AT THE WESTERN NEW YORK NUCLEAR SERVICE CENTER, 1981-84.
[Well locations are shown in plate 1. Altitudes are in meters. Dashes indicate no measurement.]
Well numbersDate
810119810520810623810723810821810929811022811119811230
820105820129820209820304820308820312820315820318820322820324820402820407820412820416820420820427820503820506820511820517820520820601820608820610820615820616820617820629820701820706820708820712820715
80-1
___
431.2430.8
431.3429.9430.7430.6430.4431.3431.7431.6431.3431.2431.2431.1431.1431.0430.9430.5430.2430.1430.0430.5430.0430.8431.1430.9430.9
431.2431.2431.1430.7430.6430.5430.5
80-2
432.8432.8433.1432.4432.8432.9432.9433.1432.8
433.0432.5432.9432.8432.6433.0433.1433.1433.0433.0433.0433.0433.0432.9432.9432.7432.6432.5432.7432.4432.5432.5433.0432.9432.8
432.8432.4433.0432.8432.7432.6432.5
80-3
___
420.0419.8
420.0419.4419.7419.5419.4420.3420.2420.2420.2420.2420.1420.1420.1419.9419.6419.3419.1419.1419.4419.1419.1419.4419.6419.3419.2
420.0420.0419.6419.2419.1419.1419.1
80-4
419.0419.4419.5418.6419.0419.2419.3419.6419.5
419.8418.8419.1418.9418.9419.2420.5420.5420.3420.2420.0419.9419.9419.9419.7419.2419.0418.8418.8418.7418.6418.8419.2419.2419.0
419.1419.1419.2419.1419.0418.9418.8
80-5
416.2416.6416.9416.1416.4416.5416.6416.9416.7
417.0416.2416.5416.4416.3416.8417.3417.3417.1417.1417.0416.9416.9416.9416.7416.5416.3416.2416.2416.1416.0416.3416.6416.5416.5
416.5416.5416.5416.3416.3416.2416.1
80-6
___ , _-,,_-,,
416.7416.7
416.9416.2416.4416.3416.2416.5417.3417.4417.3417.3417.0417.1416.9417.0416.8416.6416.3416.3416.2416.1416.0416.2416.5416.5416.4416.1416.4416.5416.4416.3416.3416.2416.1
80-7
__, r ^ _-, ,
424.4424.3
424.5424.1424.2424.2424.2424.5424.6424.6424.4424.3424.3424.3424.3424.3424.3424.2424.2424.2424.2424.1424.1424.2424.3424.2424.2
424.4424.5424.3424.2424.2424.1424.1
80-8
____
429.6429.4
429.5428.9429.2429.1429.1429.3430.3430.2429.9429.8429.7429.5429.5429.6429.4429.2429.0429.0428.9428.8428.8428.9429.1429.2429.2
429.3429.5429.5429.4429.3429.1429.0
80-9
___
_-__
423.5423.4423.4423.4423.4
423.4423.4423.4423.3423.3423.3423.3
41
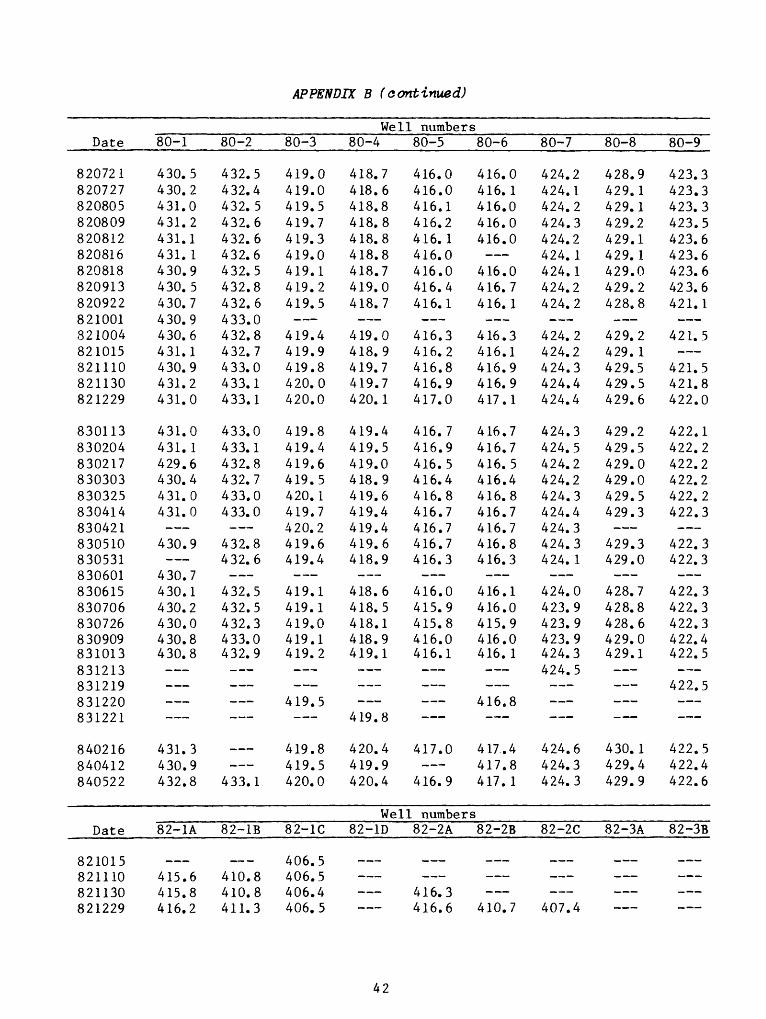
APPENDIX B (continued)
Date
820721820727820805820809820812820816820818820913820922821001821004821015821110821130821229
830113830204830217830303830325830414830421830510830531830601830615830706830726830909831013831213831219831220831221
840216840412840522
Date
821015821110821130821229
80-1
430.5430.2431.0431.2431.1431.1430.9430.5430.7430.9430.6431.1430.9431.2431.0
431.0431.1429.6430.4431.0431.0
430.9
430.7430.1430.2430.0430.8430.8
431.3430.9432.8
82-1A
r_r r_r r_r
415.6415.8416.2
80-2
432.5432.4432.5432.6432.6432.6432.5432.8432.6433.0432.8432.7433.0433.1433.1
433.0433.1432.8432.7433.0433.0
432.8432.6
432.5432.5432.3433.0432.9
433.1
82-1B
_« «
410.8410.8411.3
80-3
419.0419.0419.5419.7419.3419.0419.1419.2419.5
419.4419.9419.8420.0420.0
419.8419.4419.6419.5420.1419.7420.2419.6419.4
419.1419.1419.0419.1419.2
419.5
419.8419.5420.0
82-1C
406.5406.5406.4406.5
Well80-4
418.7418.6418.8418.8418.8418.8418.7419.0418.7
419.0418.9419.7419.7420.1
419.4419.5419.0418.9419.6419.4419.4419.6418.9
418.6418.5418.1418.9419.1
419.8
420.4419.9420.4
Well82-1D
___
numbers80-5
416.0416.0416.1416.2416. 1416.0416.0416.4416.1
416.3416.2416.8416.9417.0
416.7416.9416.5416.4416.8416.7416.7416.7416.3
416.0415.9415.8416.0416.1
417.0
416.9
numbers82-2A
___
416.3416.6
80-6
416.0416.1416.0416.0416.0
416.0416.7416.1
416.3416.1416.9416.9417.1
416.7416.7416.5416.4416.8416.7416.7416.8416.3
416.1416.0415.9416.0416.1
416.8
4 17.. 4417.8417.1
82-2B
___
410.7
80-7
424.2424.1424.2424.3424.2424.1424.1424.2424.2
424.2424.2424.3424.4424.4
424.3424.5424.2424.2424.3424.4424.3424.3424. 1
424.0423.9423.9423.9424.3424.5
424.6424.3424.3
82-2C
___
407.4
80-8
428.9429.1429.1429.2429.1429.1429.0429.2428.8
429.2429. 1429.5429.5429.6
429.2429.5429.0429.0429.5429.3
429.3429.0
428.7428.8428.6429.0429.1
430.1429.4429.9
82-3A
___
80-9
423.3423.3423.3423.5423.6423.6423.6423.6421.1
421.5
421.5421.8422.0
422.1422.2422.2422.2422.2422.3
422.3422.3
422.3422.3422.3422.4422.5
422.5
422.5422.4422.6
82-3B
_ _
42
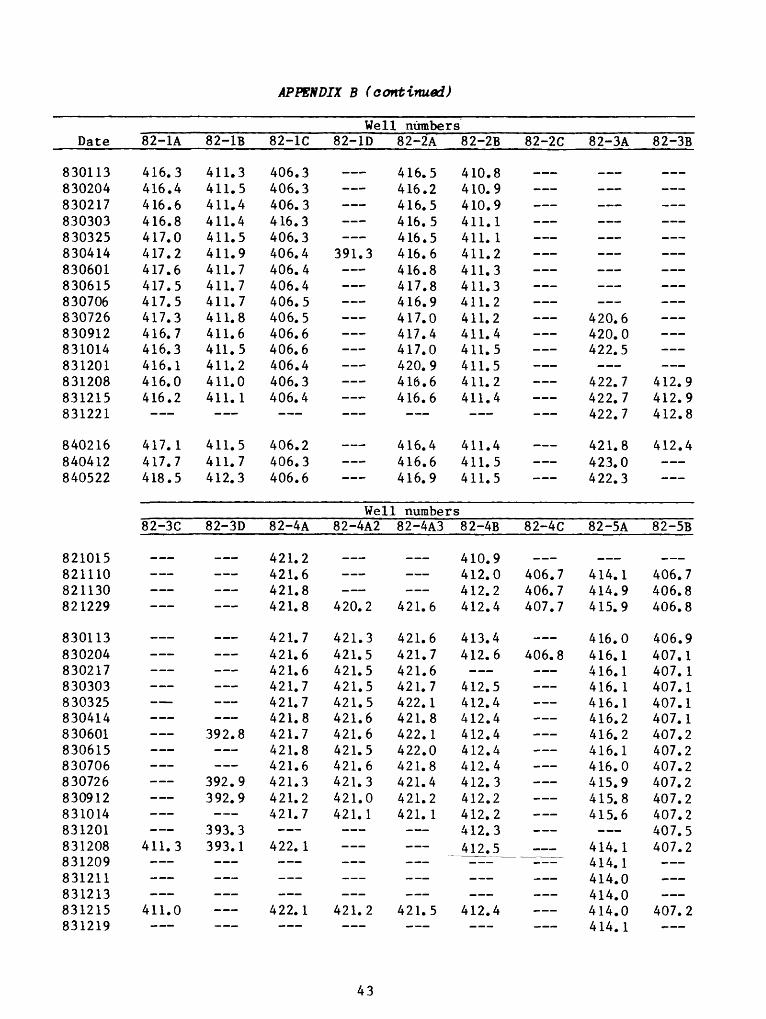
APPENDIX B (continued)
Date
830113830204830217830303830325830414830601830615830706830726830912831014831201831208831215831221
840216840412840522
821015821110821130821229
830113830204830217830303830325830414830601830615830706830726830912831014831201831208831209831211831213831215831219
82-1A
416.3416.4416.6416.8417.0417.2417.6417.5417.5417.3416.7416.3416.1416.0416.2-
417.1417.7418.5
82-3C
uiu U1U U1U
___
411.3
411.0
82-1B
411.3411.5411.4411.4411.5411.9411.7411.7411.7411.8411.6411.5411.2411.0411.1-
411.5411.7412.3
82-3D
_ U1UIIM
_
392.8
392.9392.9
393.3393.1
82-1C
406.3406.3406.3416.3406.3406.4406.4406.4406.5406.5406.6406.6406.4406.3406.4
406.2406.3406.6
82-4A
421.2421.6421.8421.8
421.7421.6421.6421.7421.7421.8421.7421.8421.6421.3421.2421.7
422.1-
422.1
Well82-1D
___
391.3
_ ___
Well82-4A2
...
420.2
421.3421.5421.5421.5421.5421.6421.6421.5421.6421.3421.0421.1
421.2
numbers82-2A
416.5416.2416.5416.5416.5416.6416.8417.8416.9417.0417.4417.0420.9416.6416.6
416.4416.6416.9
numbers82-4A3
._.
421.6
421.6421.7421.6421.7422.1421.8422.1422.0421.8421.4421.2421. 1
421.5
82-2B 82-2C
410.8410.9410.9411.1411.1411.2411.3411.3411.2 411.2411.4411.5411.5411.2411.4
411.4411.5411.5
82-4B 82-4C
410.9412.0 406.7412.2 406.7412.4 407.7
413.4412.6 406.8
412.5412.4412.4412.4412.4412.4412.3412.2412.2412.3412.5
412.4
82-3A
420.6420.0422.5
422.7422.7422.7
421.8423.0422.3
82-5A
.__414.1414.9415.9
416.0416.1416.1416.1416.1416.2416.2416.1416.0415.9415.8415.6
414.1414.1414.0414.0414.0414.1
82-3B
uiu
412.9412.9412.8
412.4 ___
82-5B
___406.7406.8406.8
406.9407.1407.1407.1407.1407.1407.2407.2407.2407.2407.2407.2407.5407.2
407.2
43
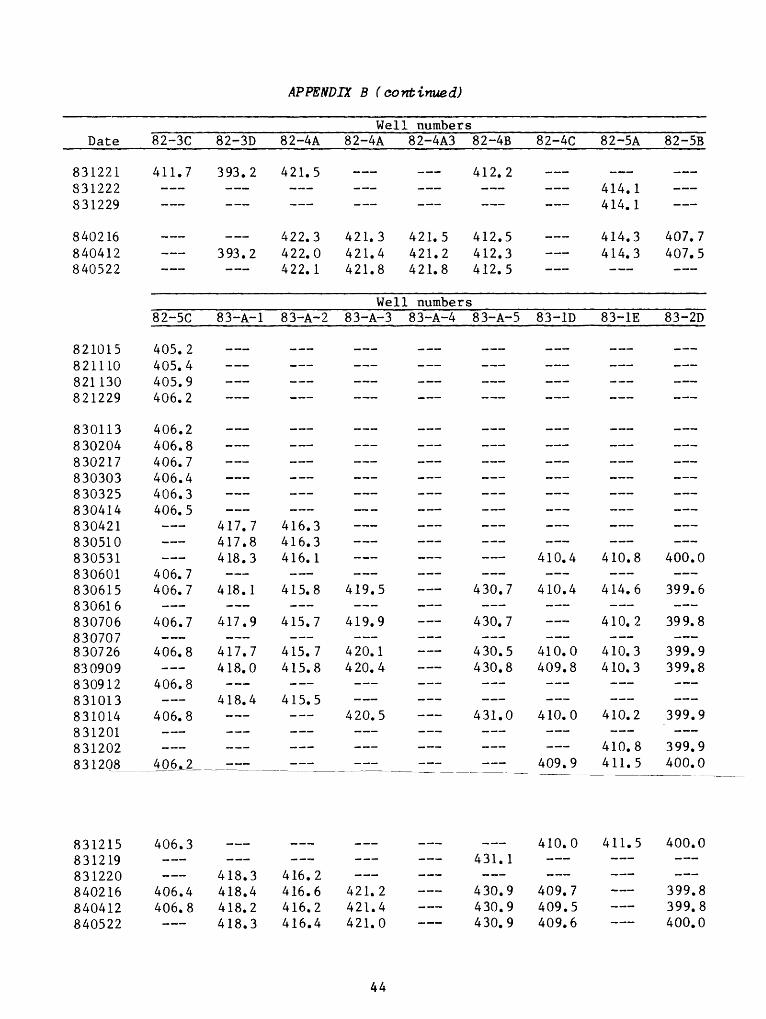
APPENDIX B (continued)
Date
831221831222831229
840216840412840522
821015821110821130821229
830113830204830217830303830325830414830421830510830531830601830615830616830706830707830726830909830912831013831014831201831202831208
831215831219831220840216840412840522
82-3C
411.7
_ ___
82-5C
405.2405.4405.9406.2
406.2406.8406.7406.4406.3406.5
406.7406.7
406.7
406.8
406.8
406.8
406.2
406.3
406.4406.8
82-3D
393.2 -
_
393.2__. _
83-A-l
__. _
_
417.7417.8418.3
418.1
417.9
417.7418.0
418.4
418.3418.4418.2418.3
82-4A
421.5
422.3422.0422.1
83-A-2
__._.
416.3416.3416.1
415.8
415.7
415.7415.8
415.5
416.2416.6416.2416.4
Well82-4A
___ -
421.3421.4421.8
Well83-A-3
_. _
_
419.5
419.9
420.1420.4
420.5
421.2421.4421.0
numbers82-4A3 82-4B
412.2 -
421.5 412.5421.2 412.3421.8 412.5
numbers83-A-4 83-A-5
__._. ___
430.7
430. 7
430.5430.8
431.0
431.1
430.9430.9430.9
82-4C
mm ra
__
83-1D
__
410.4
410.4
410.0409.8
410.0
409.9
410.0
409.7409.5409.6
82-5A
M -
414.1414.1
414.3414.3___
83-1E
___
410.8
414.6
410.2
410.3410.3
410.2
410.8411.5
411.5
82-5B
_
407.7407.5
__. _
83-2D
___
400.0
399.6
399.8
399.9399.8
399.9
399.9400.0
400.0
399.8399.8400.0
44

APPENDIX B (continued)
Well numbersDate
821229830113830204830217830218830303830325830414830510830531830601830615830706830726830909830912831014831202831208831213831215
840216840412840522
821229
8301138302048302178302188303038303258304148J30510830531830601830615830616830706830707830726
83-2E
___
400.3400.3400.3400.2
400.2400.5400.4
400.4
400.2400.2401.0
SI
408.4
408.3
408.2408.2408.2
408.2408.3
408.2
408.1
408.9
83-3D
_ _
395.5
395.6395.7395.7395.7
395.7395.8396.1
395.7
395.8395.2395.6
S2
410.0
410.0410.0
410.0410.0410.0
409.9
409.5
409.3
407.9
Gl
417.5417.5417.6417.5
417.5417.6418.6
417.9
417.7417.7417.6
417.3417.3
417.5417.6417.9
V
379.3379.2
379.0379.2379.2
379.1
378.7
378.7378.5
G2
414.3414.3414.3414.2
414.1414.1417.5
414.0
414.0413.9413.8
413.9414.0
417.5414.0414.0
WellWl
390.1
390.0390.0390.0
387.5
389.4389.7
G3
409.3
409.3
408.9409.8409.3416.0
409.1409.0408.9
408.9409.0
412.6409.2409.1
numbersW2
_
387.5
387.7387.7387.7
387.7
388.4
387.5387.5
J-l
414.7414.8414.8
415.8414.8414.7
414.7414.7
414.9414.5414.4
414.4414.5
414.6
414.9419.4414.6
CT-272
_
398.0398.0
398.0
397.9
J-2
391.3
382.0382.1382.0
382.0
382.1382.0381.3381.9
382.1419.8
381.8
382.3382.1382.2
B
_ __
424.0424.0424.0
423.7423.6
_ 423.6
423.5
J2
416.5416.4416.4
416.3416.3416.2
416.3416.2
416.2416.1416.1
415.9418.7
416.0
416.0416.0416.2
E
_ _
423.9424.0422.7
422.4422.1
422. 1
422.3
J5
419.2419.2419.2
419.3419.2419.2
419.1419.2
418.7418.6418.5
418.6415.0
419.2
419.3419.1419.0
F
___
422.5423.4422.9
422.5422.2
422.2
422.1
45
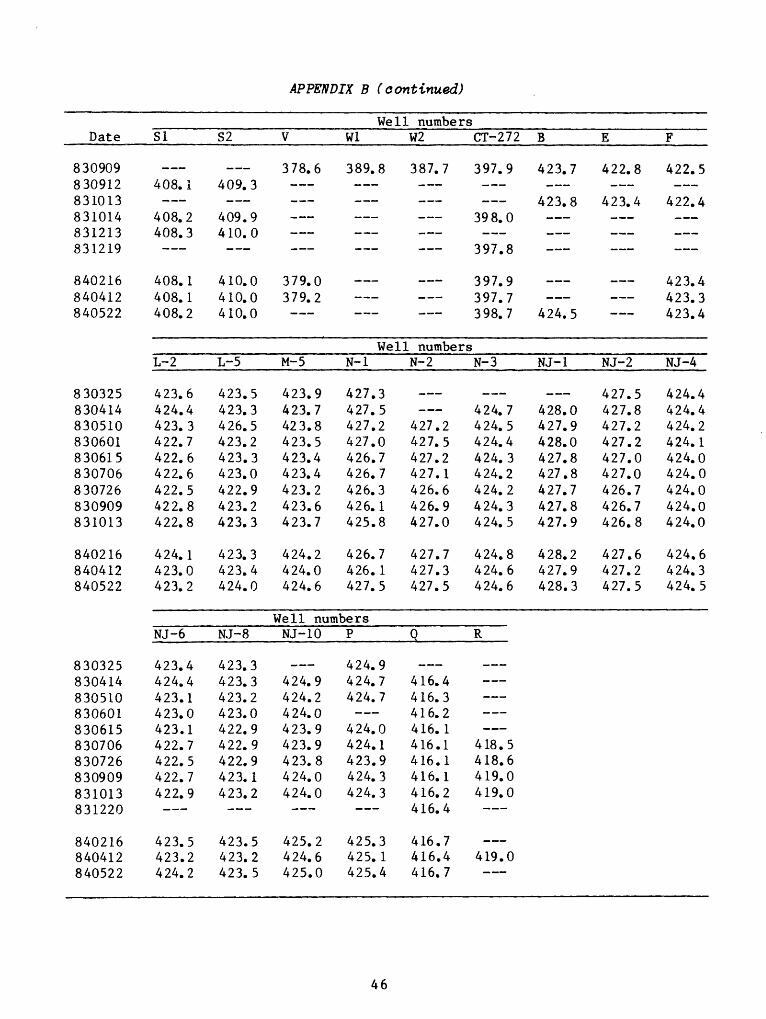
APPENDIX B (continued)
Date
830909830912831013831014831213831219
840216840412840522
830325830414830510830601830615830706830726830909831013
840216840412840522
SI
___
408.1
408.2408.3
408.1408.1408.2
L-2
423.6424.4423.3422.7422.6422.6422.5422.8422.8
424.1423.0423.2
S2
_ _ _
409.3
409.9410.0-
410.0410.0410.0
L-5
423.5423.3426.5423.2423.3423.0422.9423.2423.3
423.3423.4424.0
V
378.6
379.0379.2___
M-5
423.9423.7423.8423.5423.4423.4423.2423.6423.7
424.2424.0424.6
WellWl
389.8
_ ___
WellN-l
427.3427.5427.2427.0426.7426.7426.3426.1425.8
426.7426.1427.5
numbersW2
387.7
___
numbersN-2
___
427.2427.5427.2427.1426.6426.9427.0
427.7427.3427.5
CT-272
397.9
398.0
397.8
397.9397.7398.7
N-3
___424.7424.5424.4424.3424.2424.2424.3424.5
424.8424.6424.6
B
423.7
423.8
424.5
NJ-1
_ _ _
428.0427.9428.0427.8427.8427.7427.8427.9
428.2427.9428.3
E
422.8
423.4
___
NJ-2
427.5427.8427.2427.2427.0427.0426.7426.7426.8
427.6427.2427.5
F
422.5
422.4
423.4423.3423.4
NJ-4
424.4424.4424.2424.1424.0424.0424.0424.0424.0
424.6424.3424.5
Well numbers
830325830414830510830601830615830706830726830909831013831220
840216840412840522
NJ-6
423.4424.4423.1423.0423.1422.7422.5422.7422.9
423.5423.2424.2
NJ-8
423.3423.3423.2423.0422.9422.9422.9423.1423.2
423.5423.2423.5
NJ-10
___424.9424.2424.0423.9423.9423.8424.0424.0
425.2424.6425.0
P
424.9424.7424.7
424.0424.1423.9424.3424.3
425.3425.1425.4
Q
___416.4416.3416.2416.1416.1416.1416.1416.2416.4
416.7416.4416.7
R
___
418.5418.6419.0419.0
419.0
46
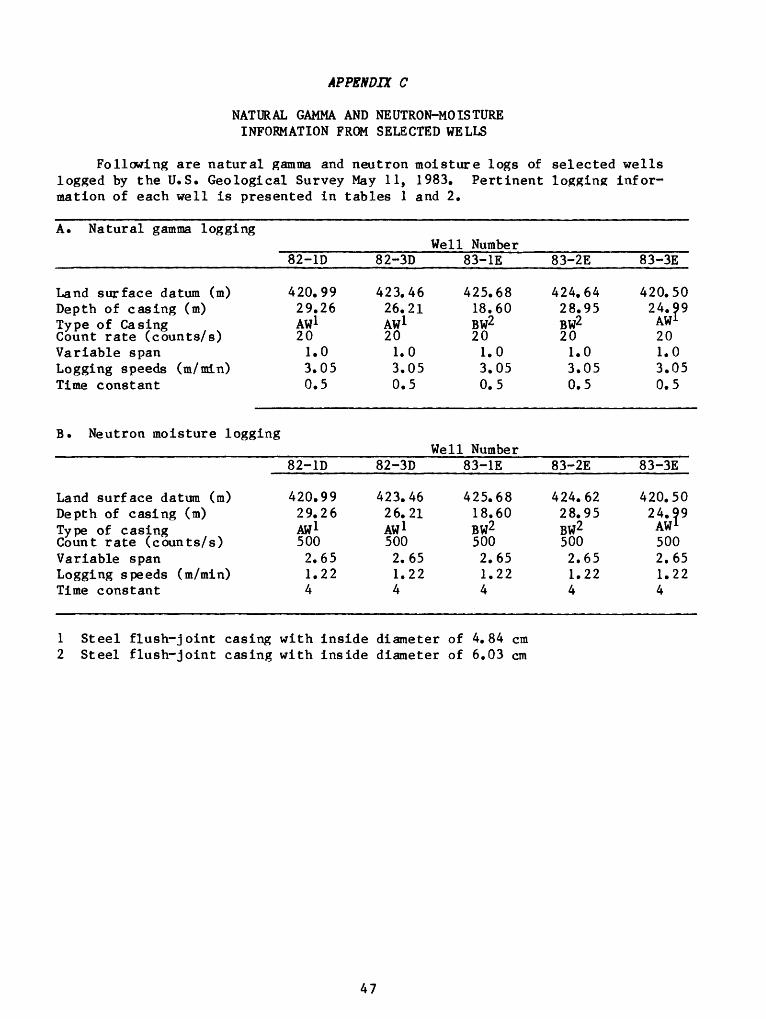
APPENDIX C
NATURAL GAMMA AND NEUTRON-MOISTURE INFORMATION FROM SELECTED WELLS
Following are natural gamma and neutron moisture logs of selected wells logged by the U.S. Geological Survey May 11, 1983. Pertinent logging infor mation of each well is presented in tables 1 and 2.
A. Natural gamma logging
Land surface datum (m)Depth of casing (m)Type of Casing Count rate (counts/s)Variable spanLogging speeds (m/min)Time constant
82-1D
420.9929.26AW1 20
1.03.050.5
Well82-3D
423.4626.21AW 1 20
1.03.050.5
Number83-1E
425.6818.60BW2 20
1.03.050.5
83-2E
424.6428.95BW2 20
1.03.050.5
83-3E
420.5024.99
AW1 201.03.050.5
B. Neutron moisture logging
Land surface datum (m)Depth of casing (m)Type of casing Count rate (counts/s)Variable spanLogging speeds (m/min)Time constant
1 Steel flush-joint casing2 Steel flush-joint casing
82-1D
420.9929.26AW 1 5002.651.224
with insidewith inside
Well82-3D
423.4626.21AW 1 5002.651.224
diameter ofdiameter of
Number83-1E
425.6818.60BW2 5002.651.224
4.84 cm6.03 cm
83-2E
424.6228.95BW2 5002.651.224
83-3E
420.5024.99
AW 1
5002.651.224
47
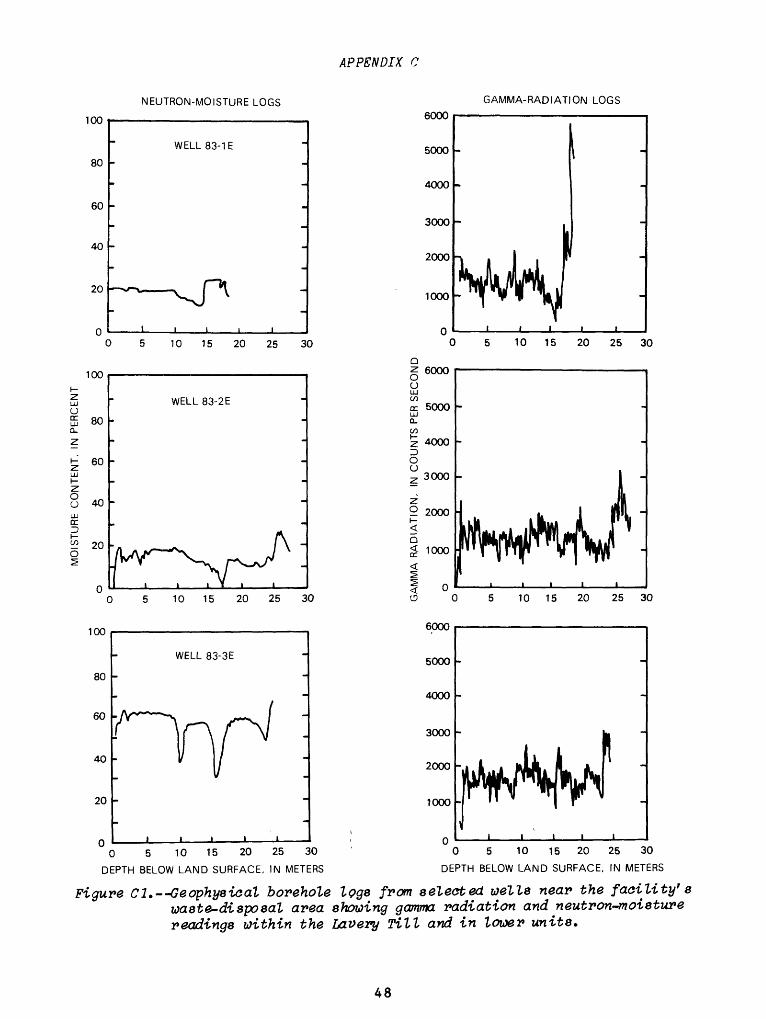
oo
MO
IST
UR
E C
ON
TE
NT
, IN
P
ER
CE
NT
8
GA
MM
A R
AD
IAT
ION
, IN
CO
UN
TS
PER
SE
CO
ND
o c/) O

aM
OIS
TU
RE
CO
NTE
NT.
IN
PE
RC
EN
T
0}
Kj
I
Ob
ft
«c»
a, c
oCO
r*
. r*
. CO
Ci
S.'g
ftrt
- co
;s*
ft
<ye
. *-
* O
^
^ft
&
tf ^
;s*
;s*
Ob
OOb
ft
?-
»Cb
t~t
CO
ft i
1 r-
* C
§0
Ob
S C
Q > «
v*
. CO
«<
a
<S M
> ~
3 *f
r».c
c»
Q^ a
3
r^ 3 g
co
Cb
^§ S
r».
fta
«
a
r».
(&ft
&
a^*
rf
6
e.
S
£
O
<&
TO
a
r-*
hS
r-»
ft
Co
§S,3
r».
»«
^J
ftCO
Ob
**
K vl
- vl
-^ ^
O
C&
?N
,18
r».
r».
CO
r^
K
rhT
{^
Ob
- CO
8
S8
8
S8
CO O
GA
MM
A R
AD
IAT
ION
. IN
CO
UN
TS
PE
R S
EC
ON
D
ts?
£
fc
<C
g>
ro
"fl I §