Genome-wide atlas of gene expression in the adult mouse brain
45
Genome-wide atlas of gene expression in the adult mouse brain By Lein Ed S et. al Presented by Shinsheng Yuan STAT SINICA
Transcript of Genome-wide atlas of gene expression in the adult mouse brain
Genome-wide atlas of gene
expression in the adult mouse
brain
By Lein Ed S et. al
Presented by
Shinsheng Yuan
STAT SINICA
Outline
Motivation
in situ hybridization
Reproducibility
Mapping ISH to Anatomic Data
Global analysis
Comments
Motivation
The phenotypic properties of different
neuronal and non-neuronal cells are
the product of unique combinations
of expressed gene products.
Gene expression profiles => define the
cell types. (Note: This has been done
for cancer classification.)
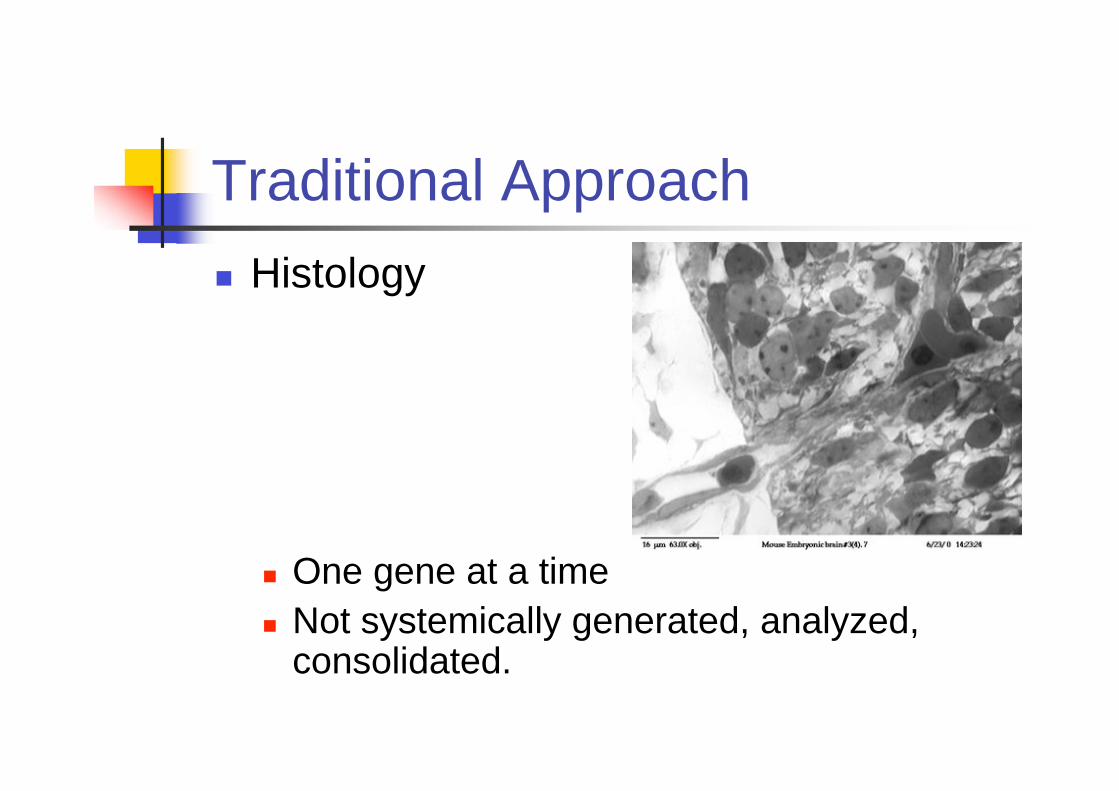
Traditional Approach
Histology
One gene at a time
Not systemically generated, analyzed,consolidated.
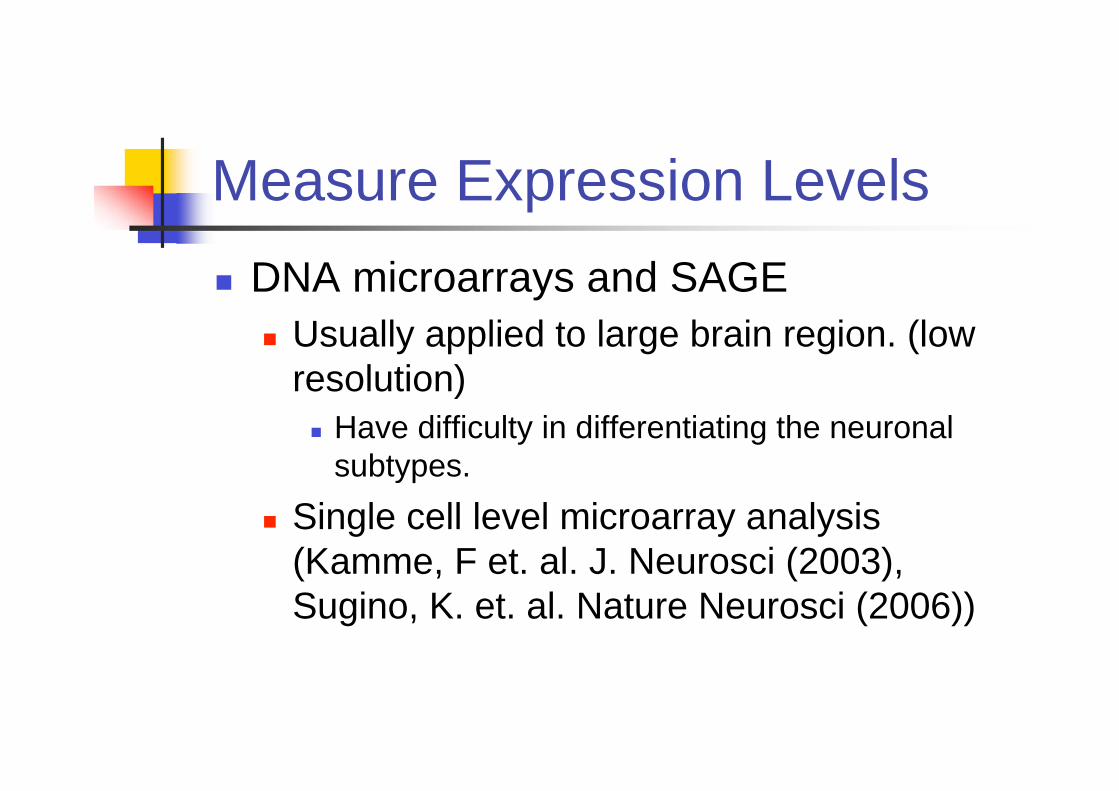
Measure Expression Levels
DNA microarrays and SAGE
Usually applied to large brain region. (low
resolution)
Have difficulty in differentiating the neuronal
subtypes.
Single cell level microarray analysis
(Kamme, F et. al. J. Neurosci (2003),
Sugino, K. et. al. Nature Neurosci (2006))
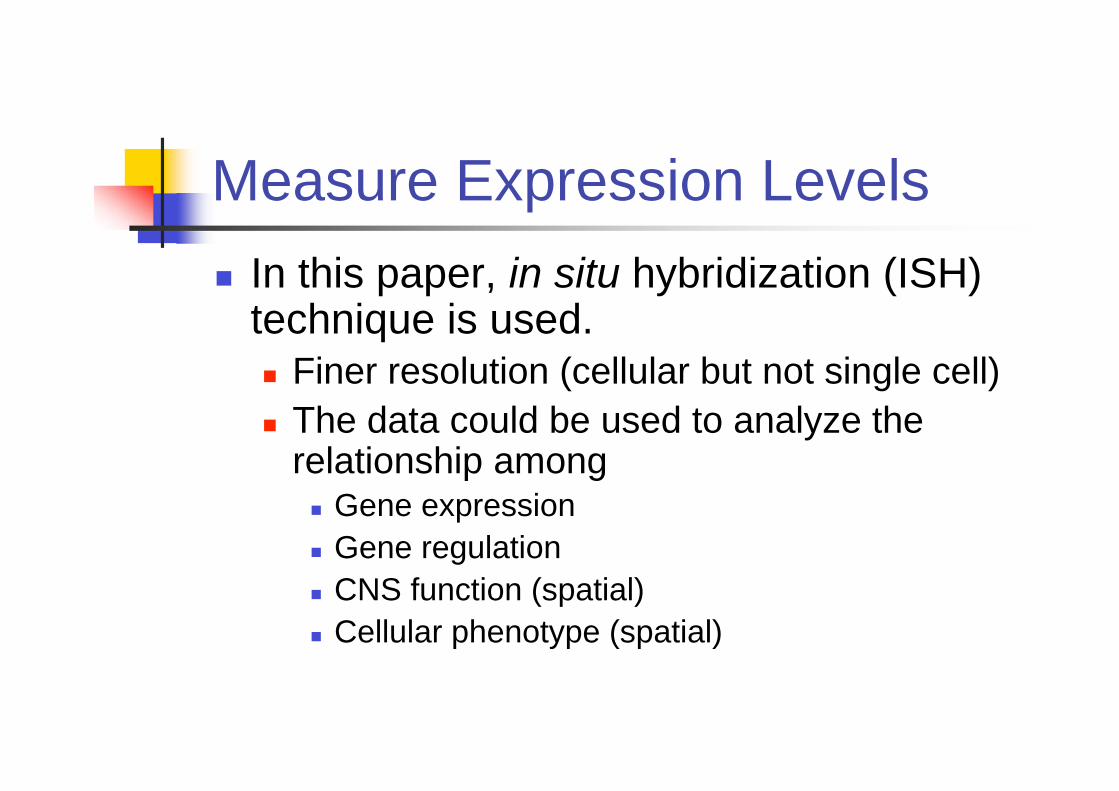
Measure Expression Levels
In this paper, in situ hybridization (ISH)technique is used.
Finer resolution (cellular but not single cell)
The data could be used to analyze therelationship among
Gene expression
Gene regulation
CNS function (spatial)
Cellular phenotype (spatial)
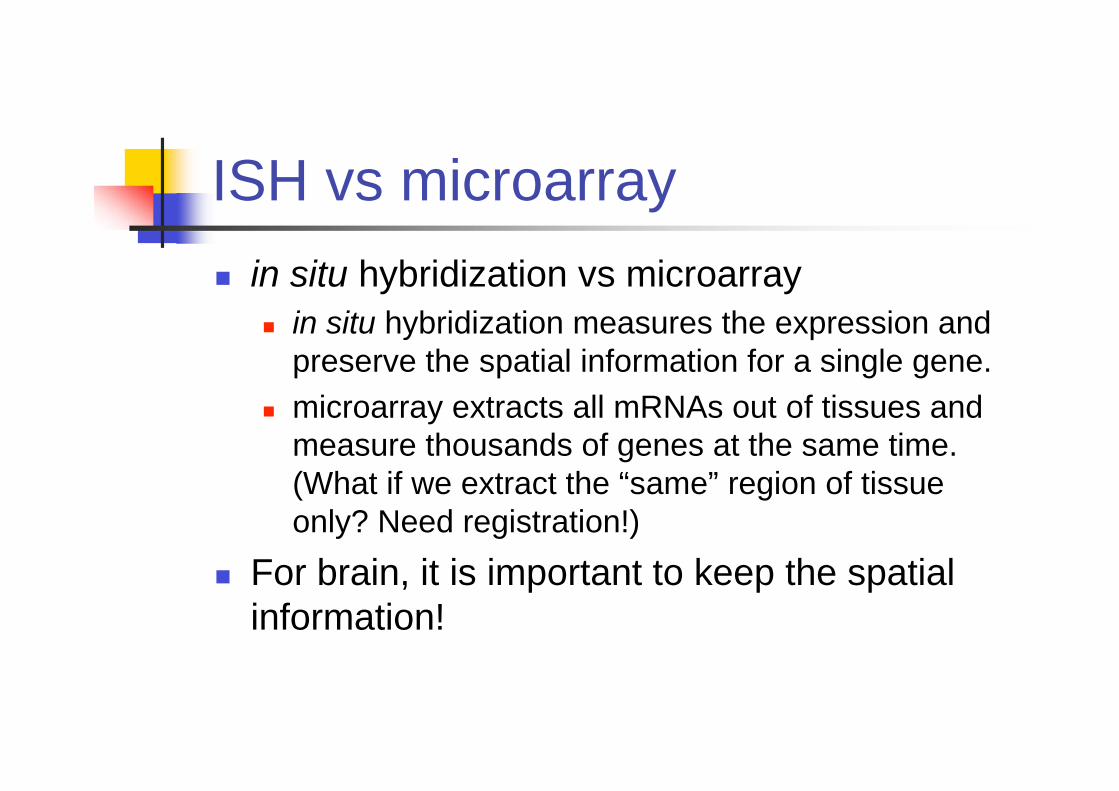
ISH vs microarray
in situ hybridization vs microarray
in situ hybridization measures the expression and
preserve the spatial information for a single gene.
microarray extracts all mRNAs out of tissues and
measure thousands of genes at the same time.
(What if we extract the “same” region of tissue
only? Need registration!)
For brain, it is important to keep the spatial
information!
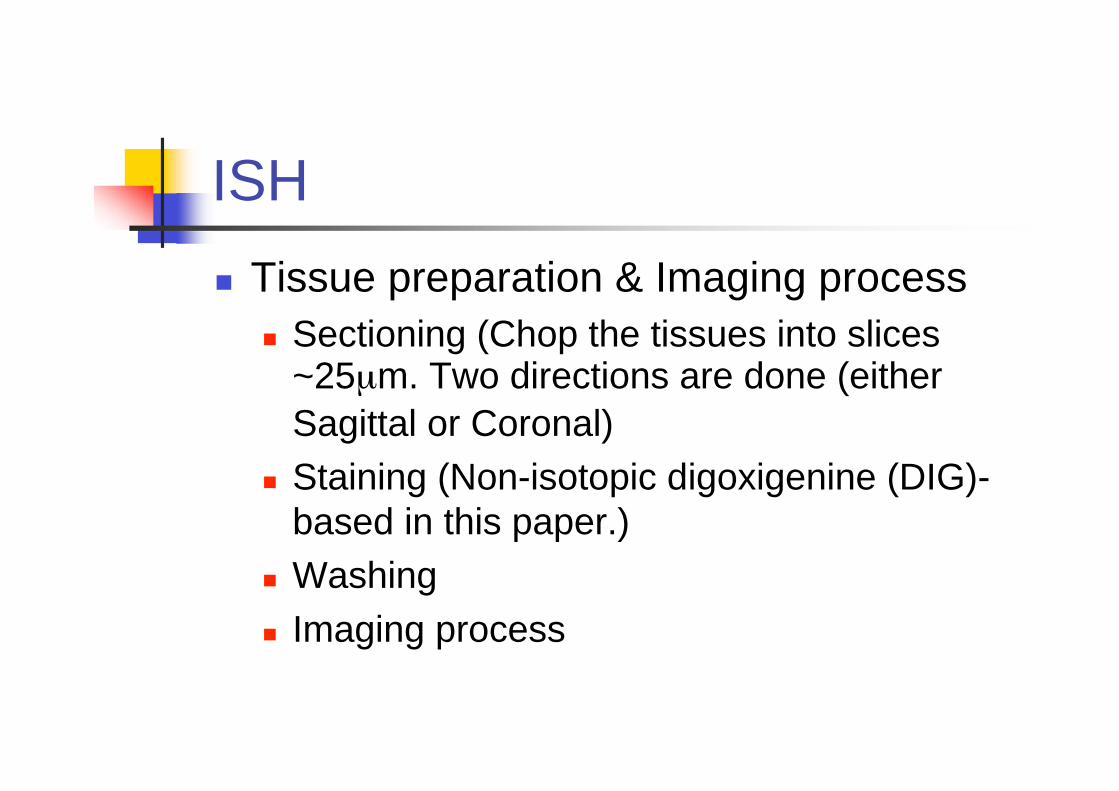
ISH
Tissue preparation & Imaging process
Sectioning (Chop the tissues into slices~25μm. Two directions are done (either
Sagittal or Coronal)
Staining (Non-isotopic digoxigenine (DIG)-
based in this paper.)
Washing
Imaging process
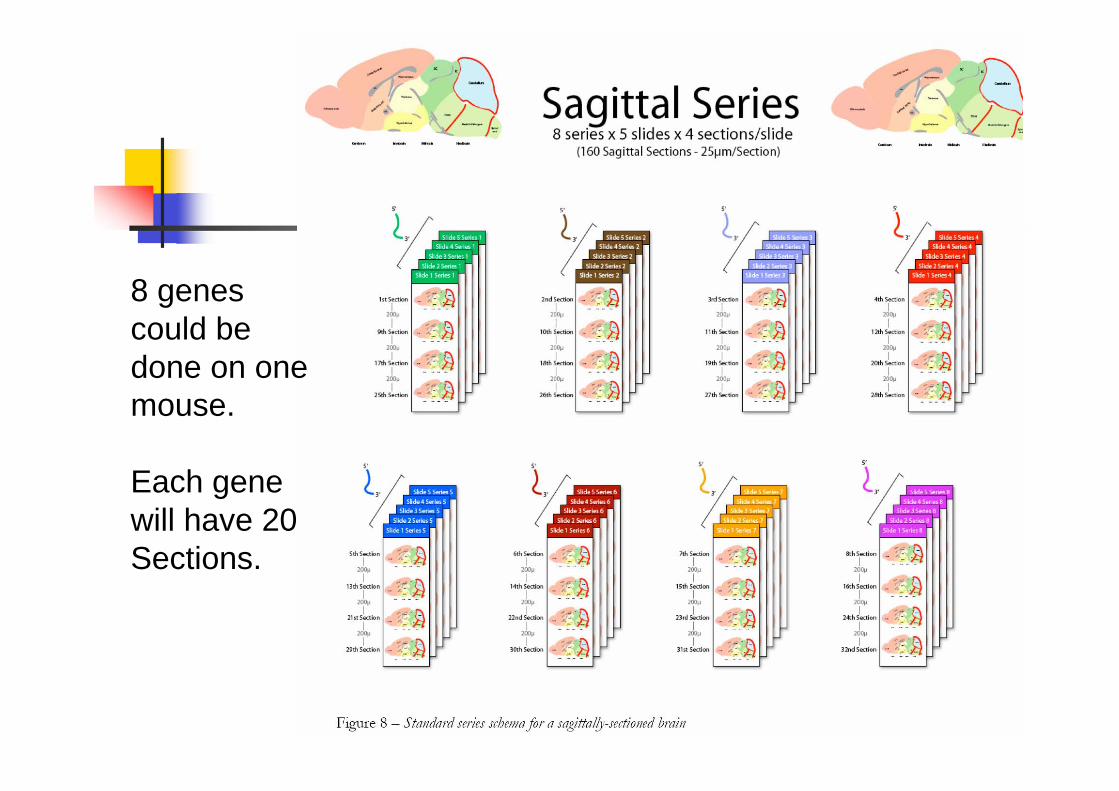
8 genes
could be
done on one
mouse.
Each gene
will have 20
Sections.
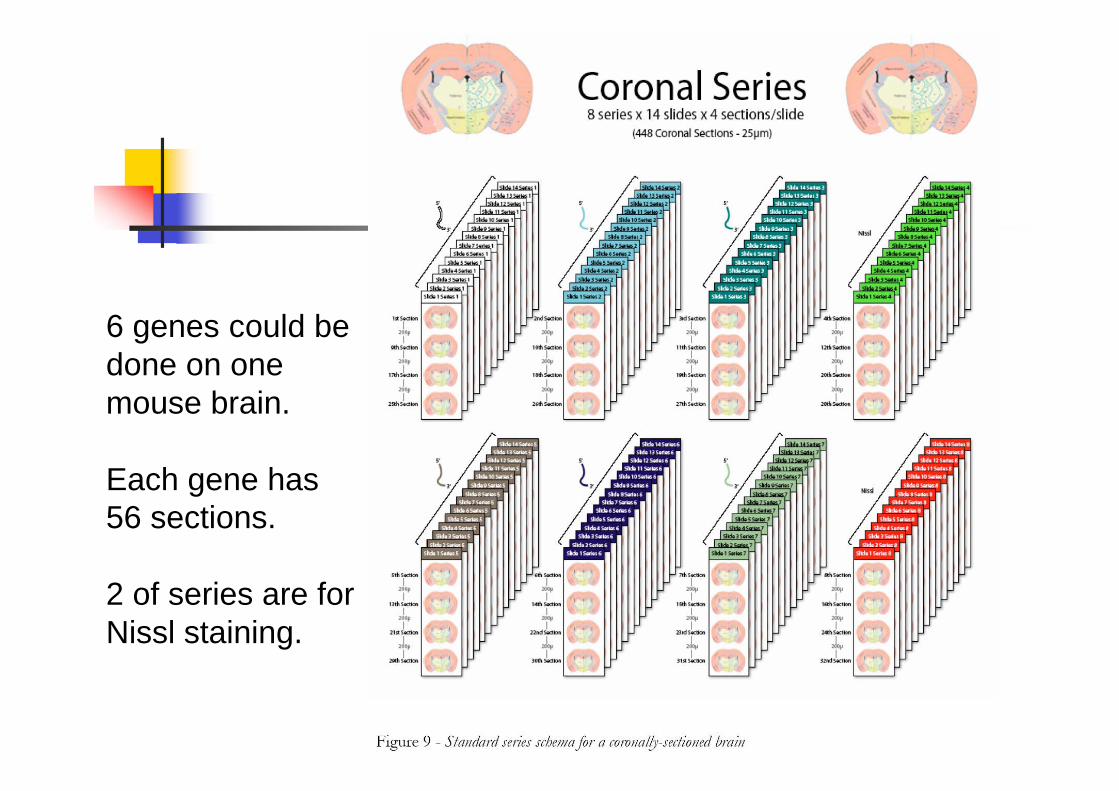
6 genes could be
done on one
mouse brain.
Each gene has
56 sections.
2 of series are for
Nissl staining.
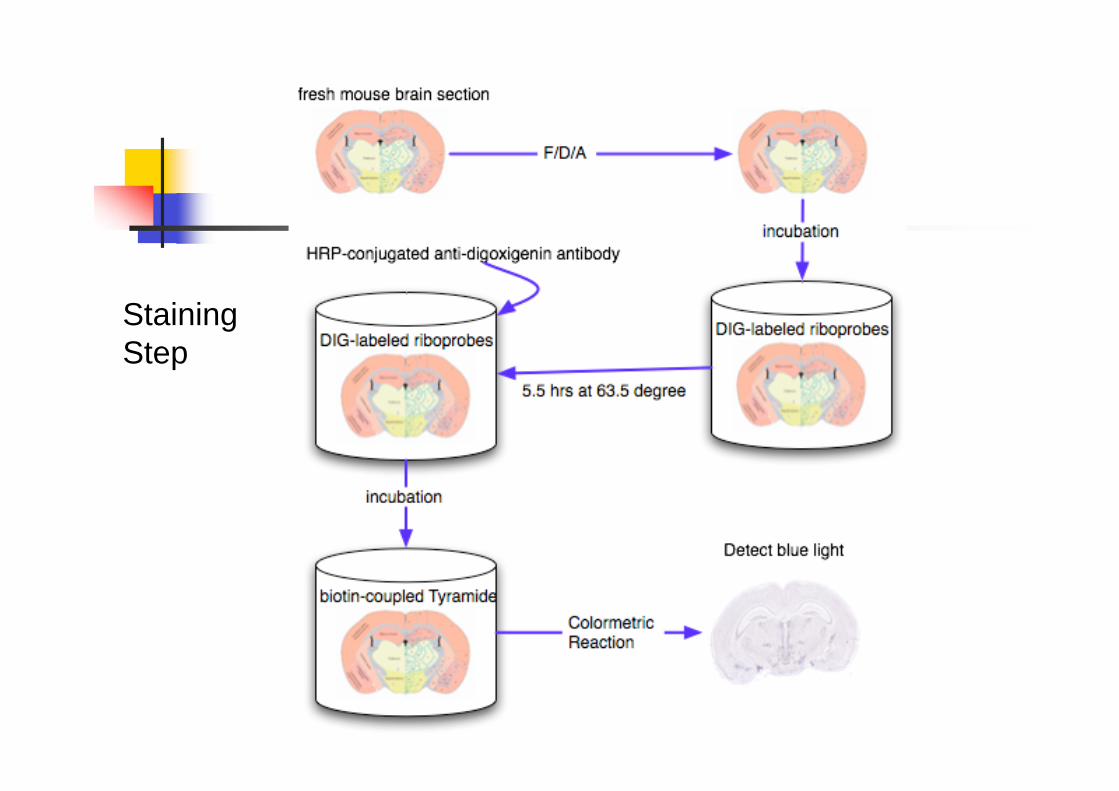
Staining
Step
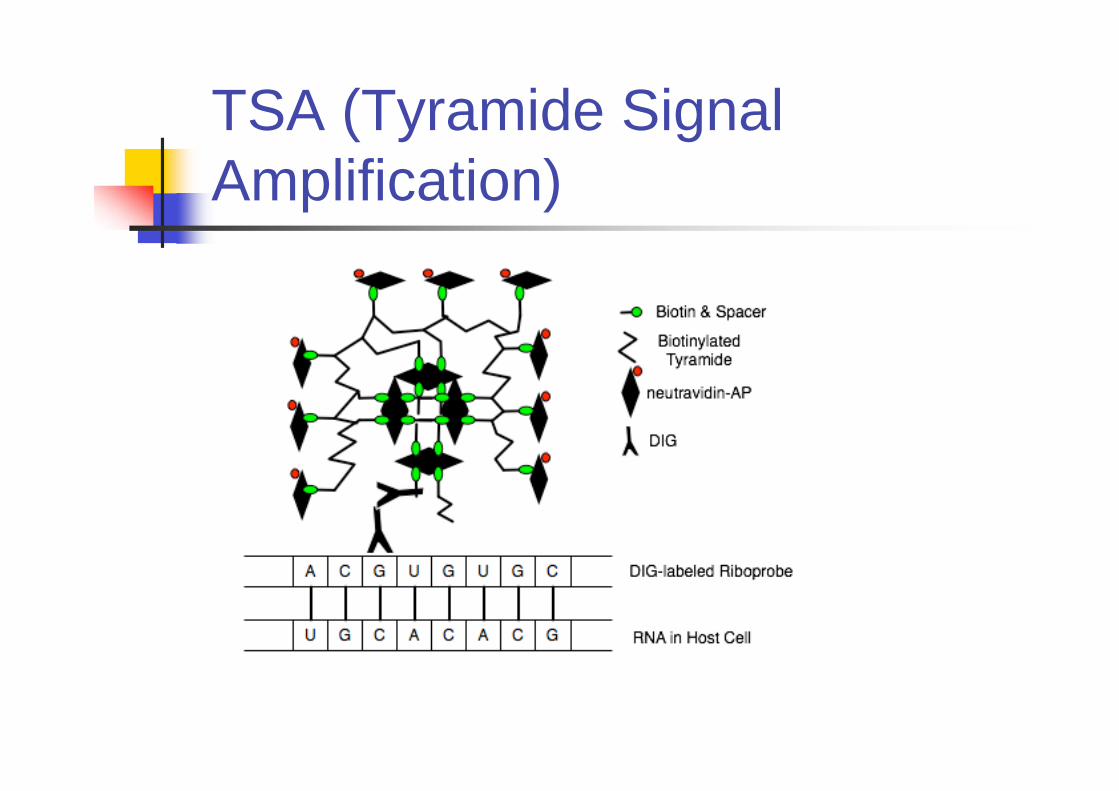
TSA (Tyramide Signal
Amplification)
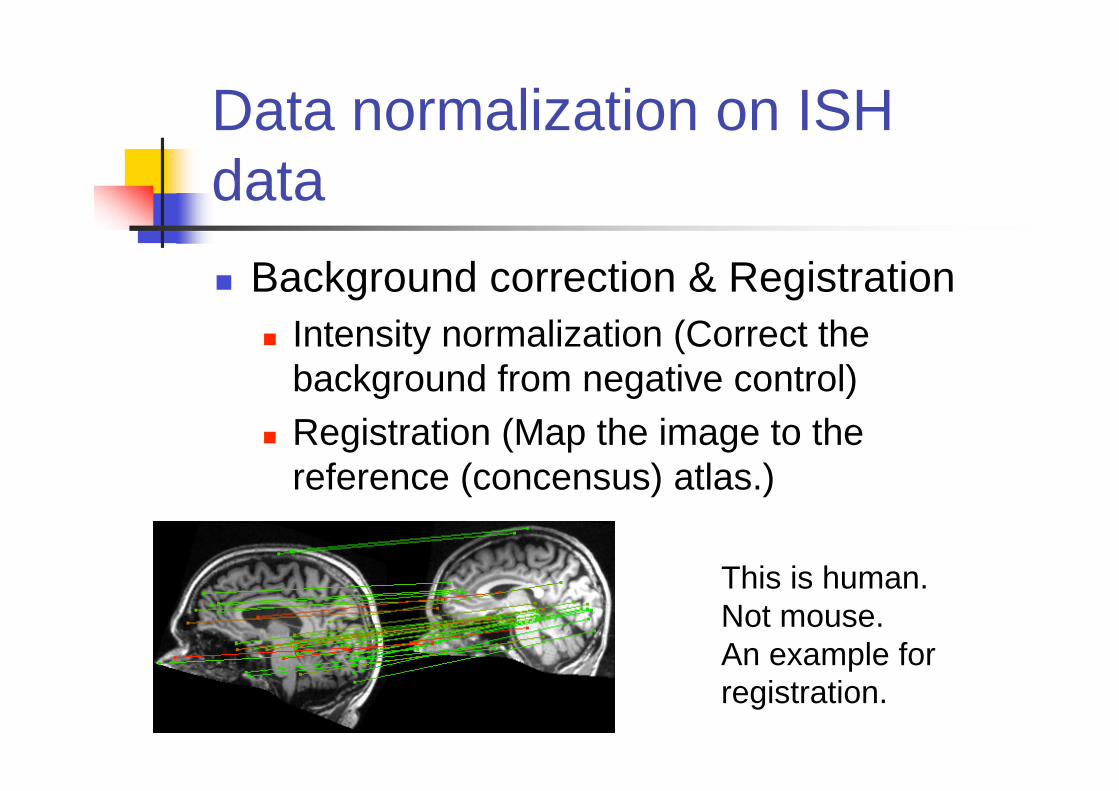
Data normalization on ISH
data
Background correction & Registration
Intensity normalization (Correct the
background from negative control)
Registration (Map the image to the
reference (concensus) atlas.)
This is human.
Not mouse.
An example for
registration.
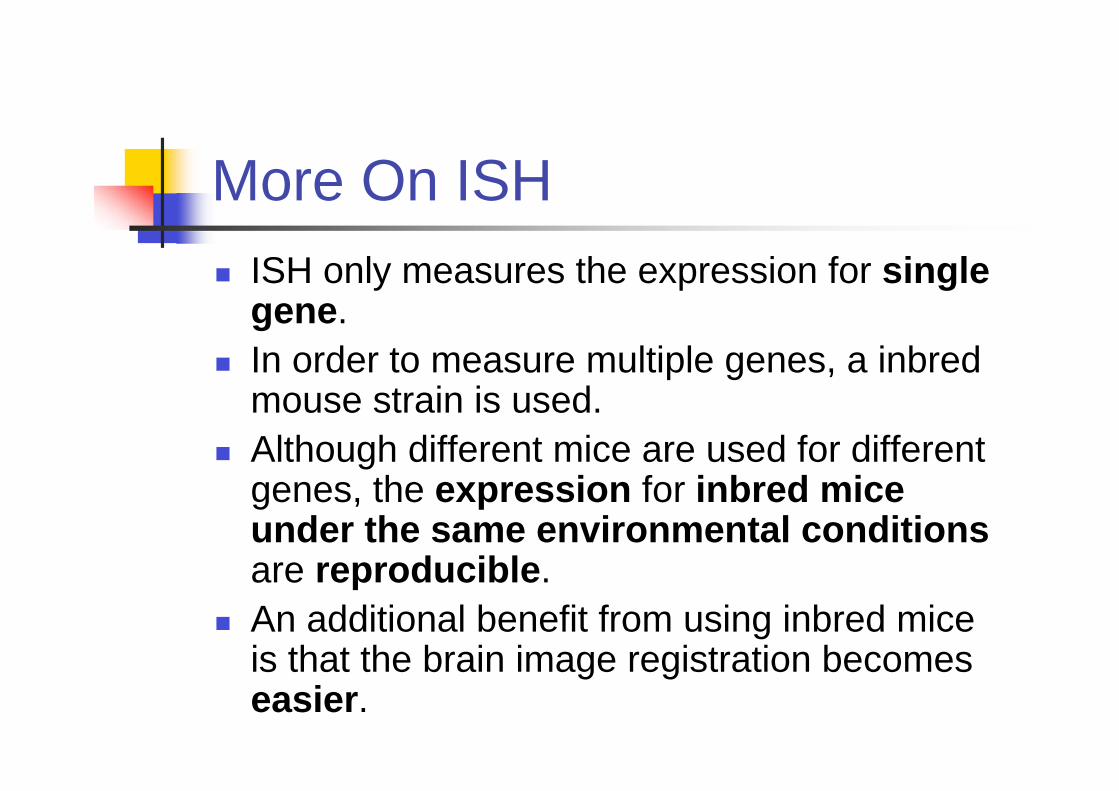
More On ISH
ISH only measures the expression for singlegene.
In order to measure multiple genes, a inbredmouse strain is used.
Although different mice are used for differentgenes, the expression for inbred miceunder the same environmental conditionsare reproducible.
An additional benefit from using inbred miceis that the brain image registration becomeseasier.
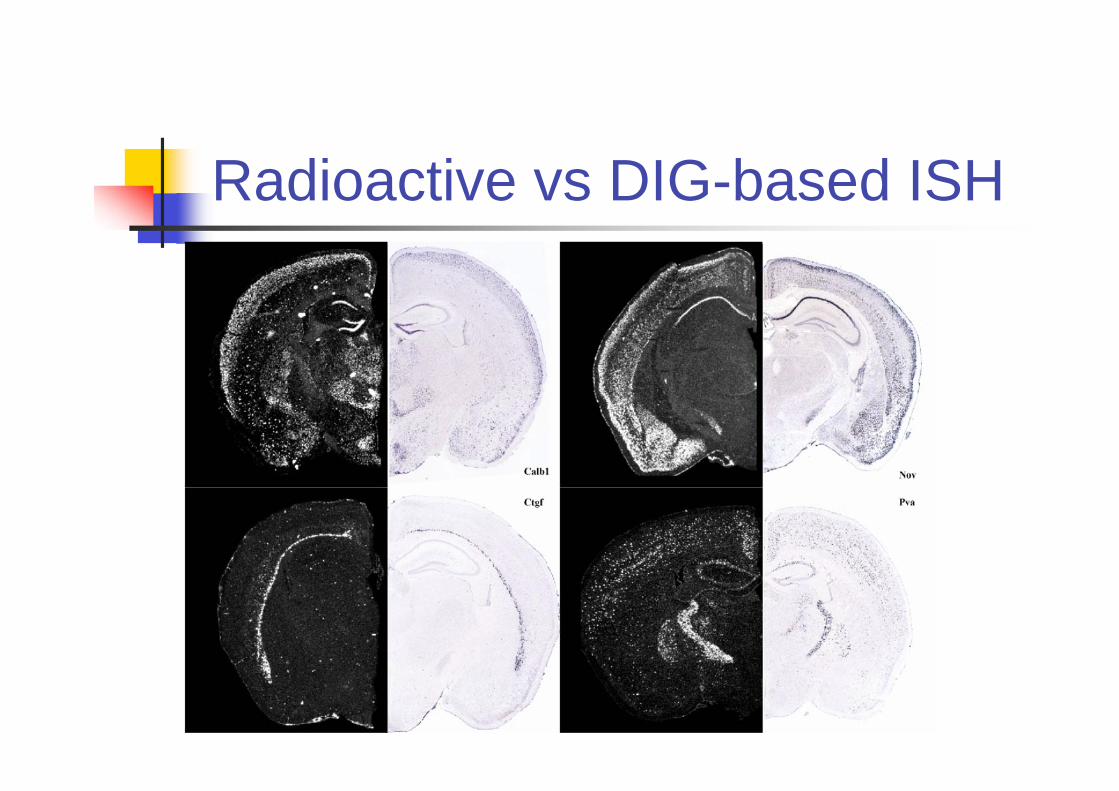
Radioactive vs DIG-based ISH
Is ISH Reproducible?
Primary Source of variation comes from
Riboprobes
Day to day variability
Biological variability across brain sample
(Not considered here since the inbred
mouse is used.)
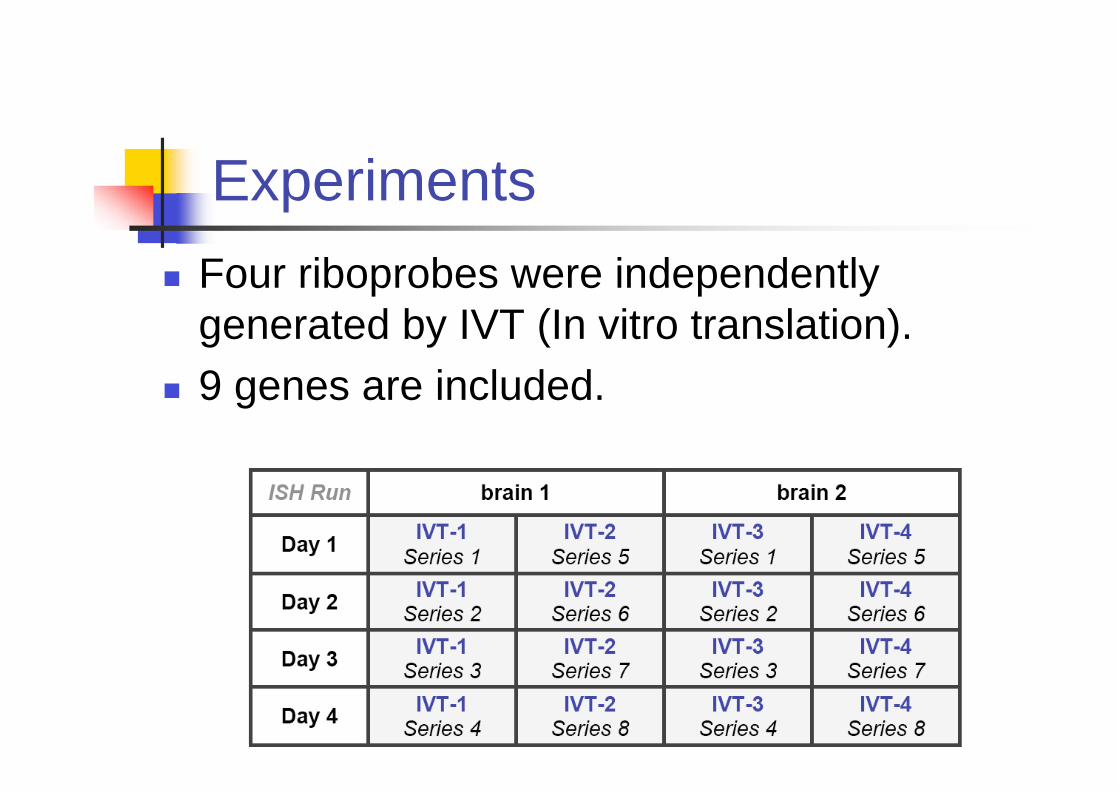
Experiments
Four riboprobes were independently
generated by IVT (In vitro translation).
9 genes are included.
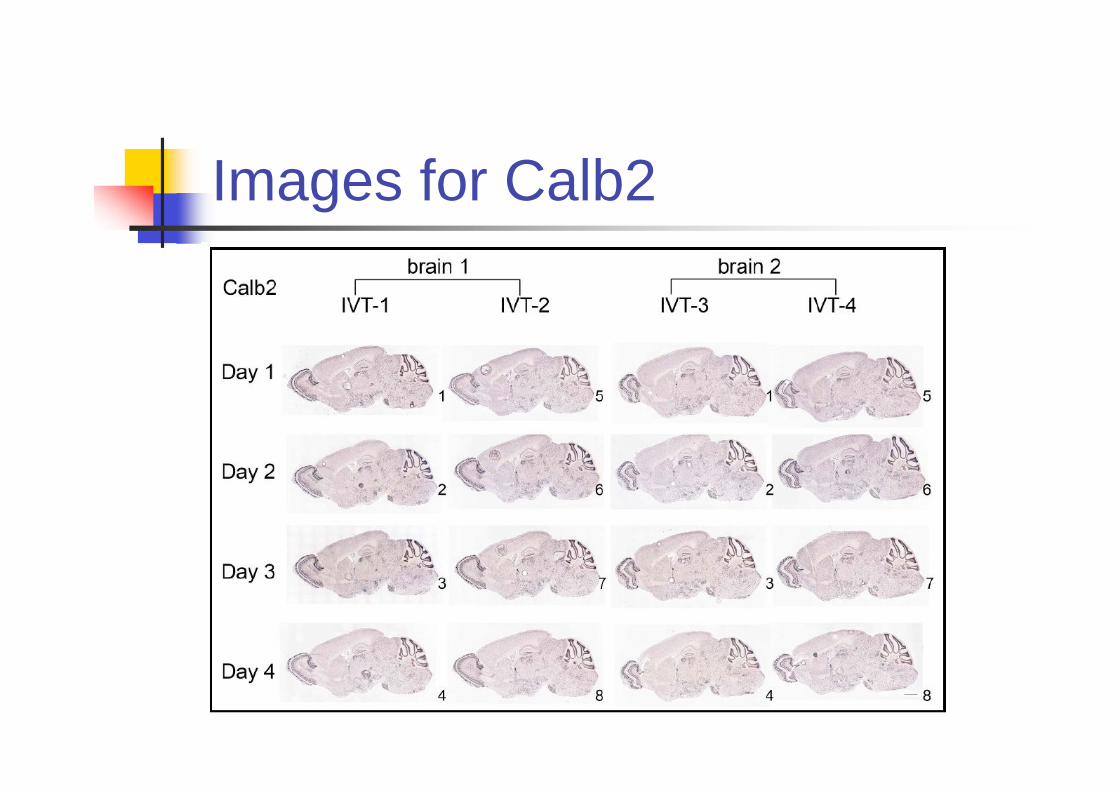
Images for Calb2
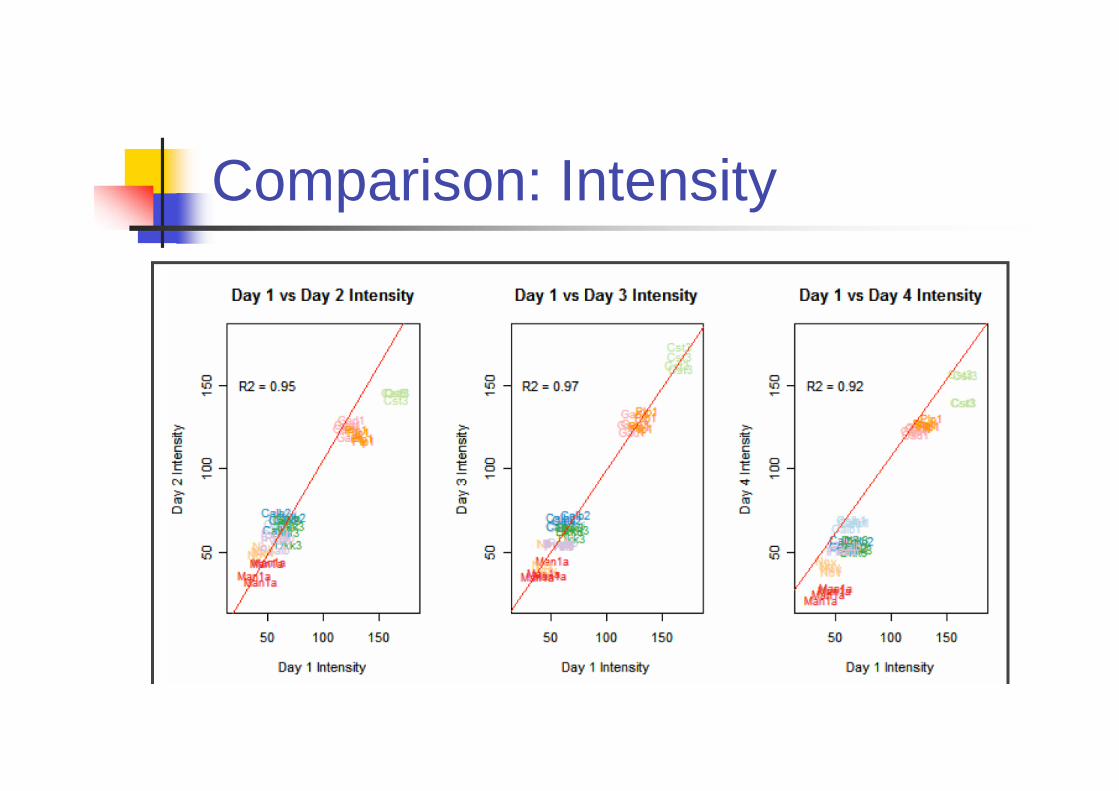
Comparison: Intensity
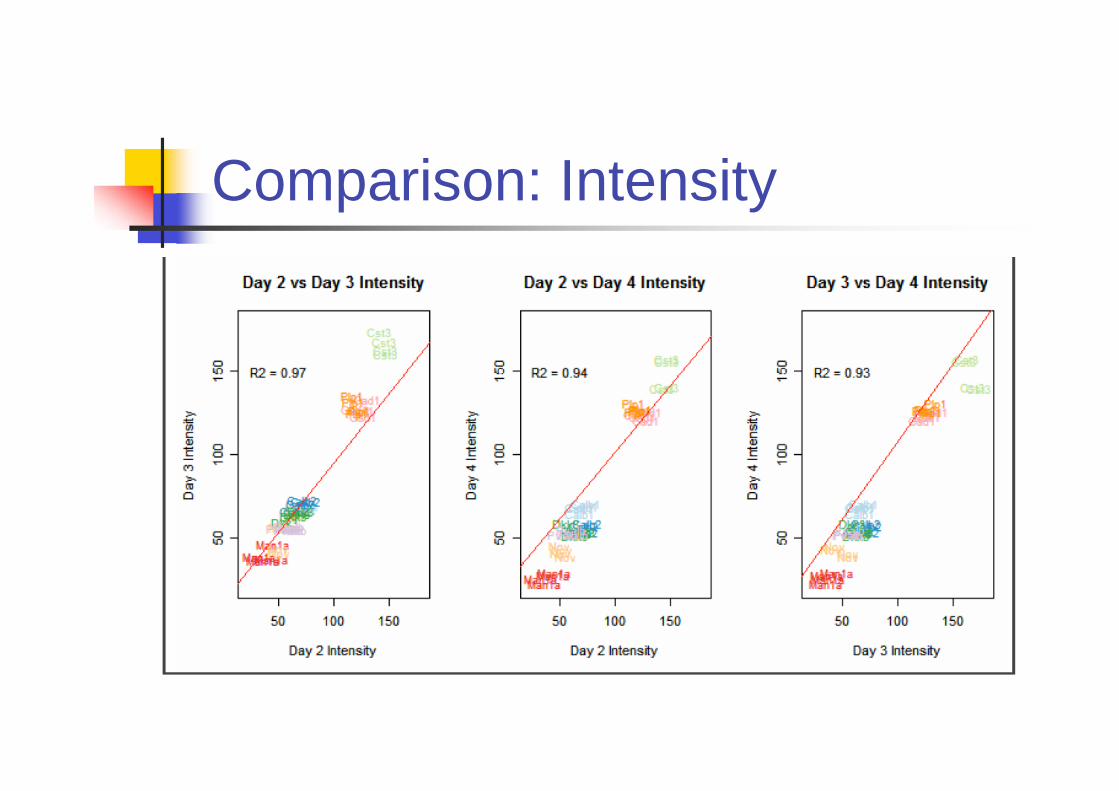
Comparison: Intensity
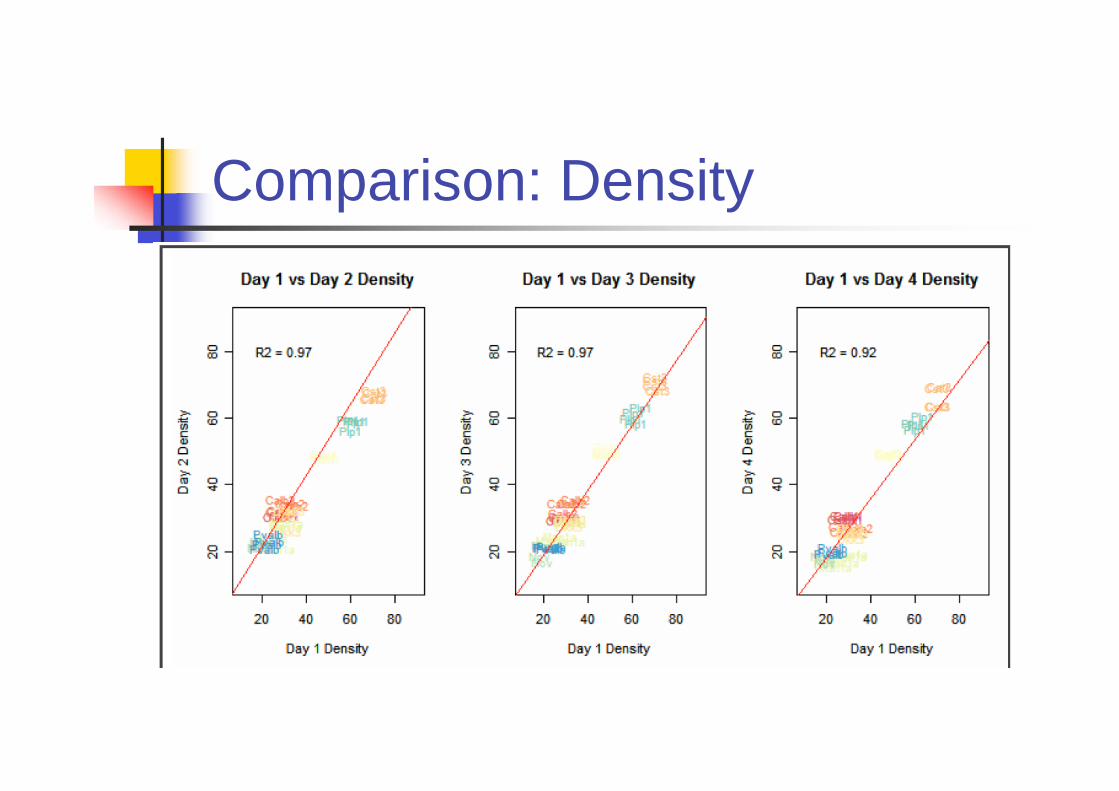
Comparison: Density
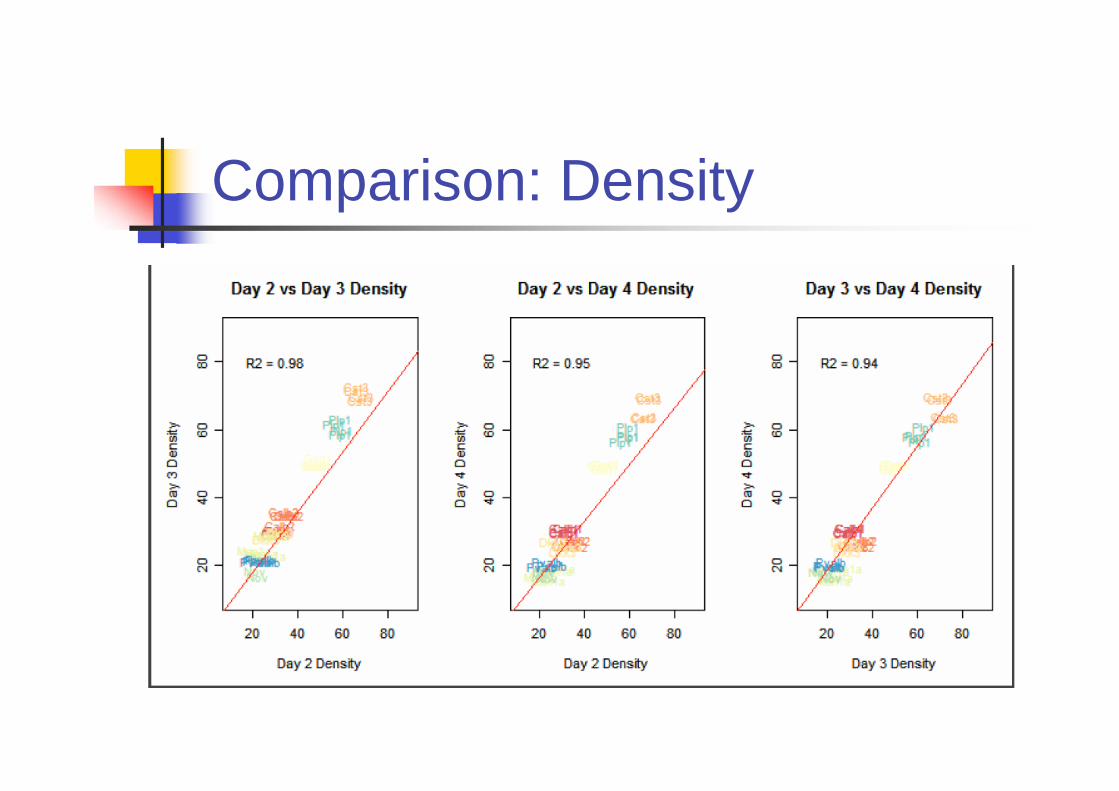
Comparison: Density
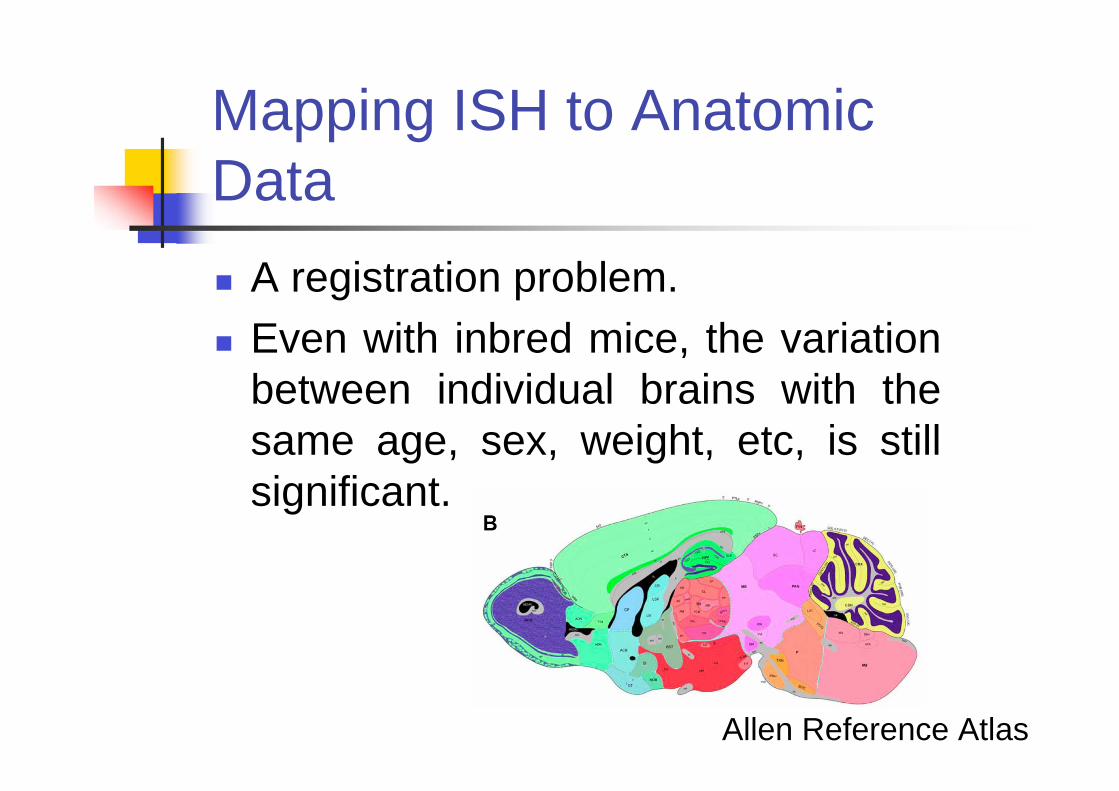
Mapping ISH to Anatomic
Data
A registration problem.
Even with inbred mice, the variation
between individual brains with the
same age, sex, weight, etc, is still
significant.
Allen Reference Atlas
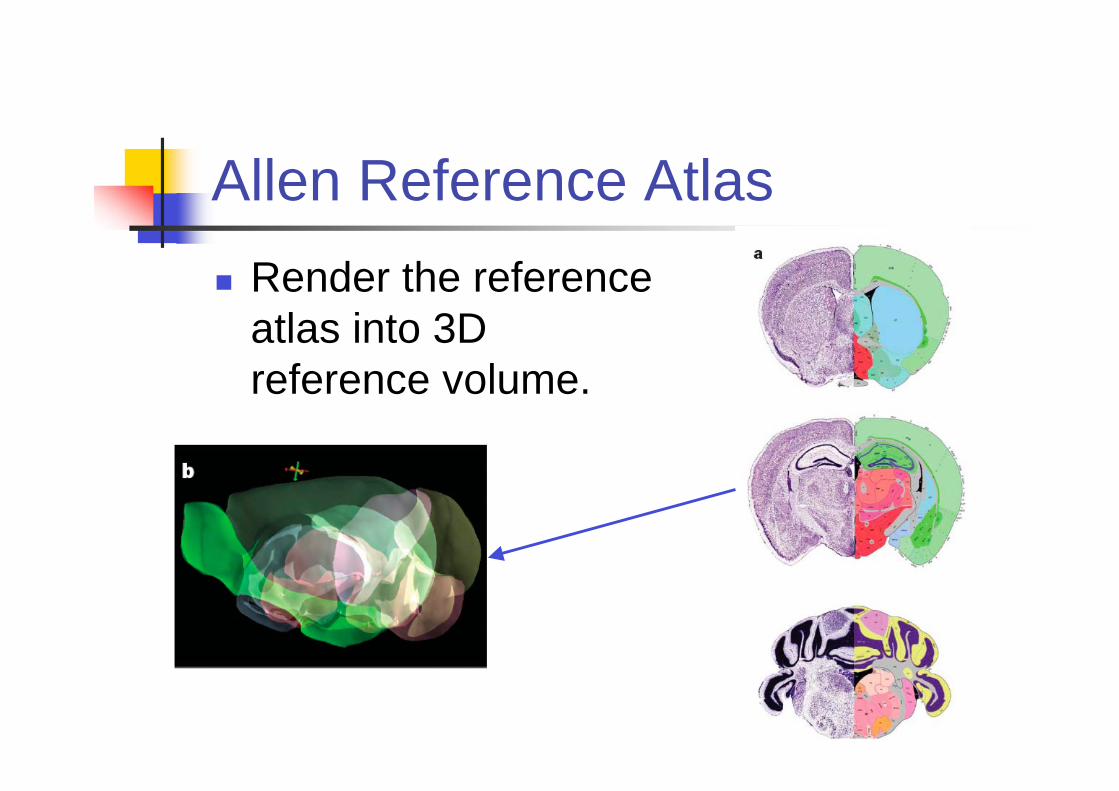
Allen Reference Atlas
Render the reference
atlas into 3D
reference volume.
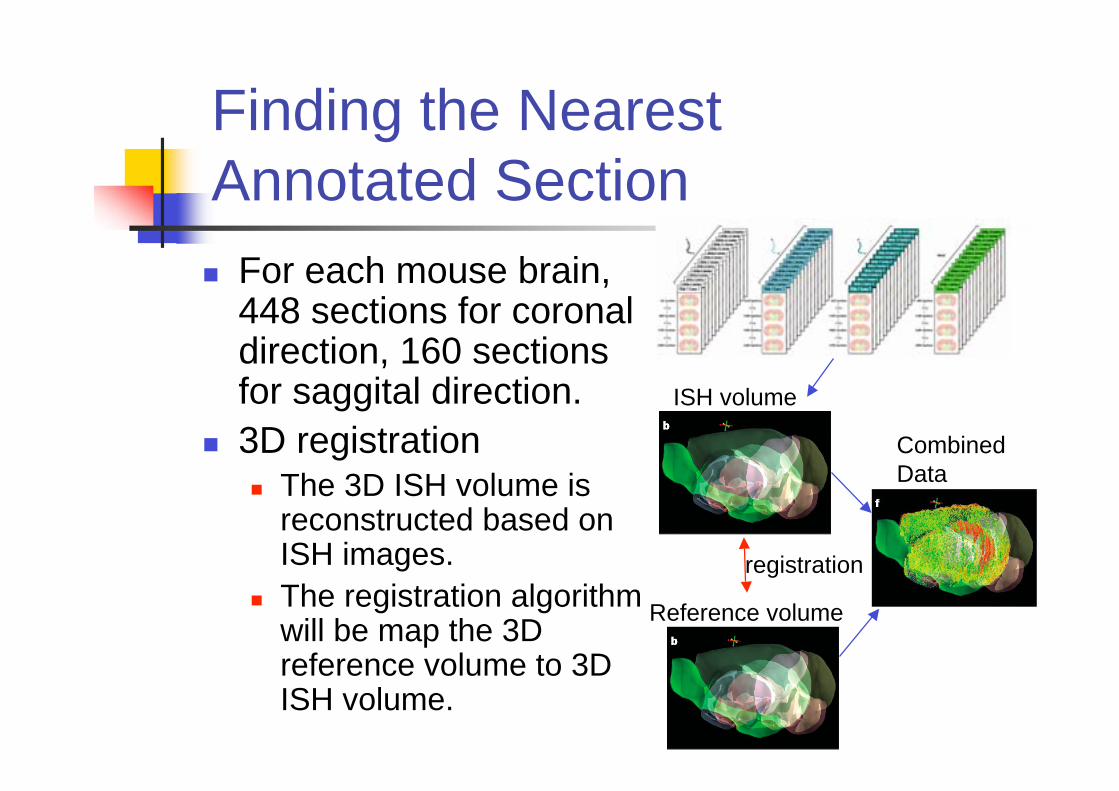
Finding the Nearest
Annotated Section
For each mouse brain,448 sections for coronaldirection, 160 sectionsfor saggital direction.
3D registrationThe 3D ISH volume isreconstructed based onISH images.
The registration algorithmwill be map the 3Dreference volume to 3DISH volume.
Reference volume
ISH volume
registration
Combined
Data
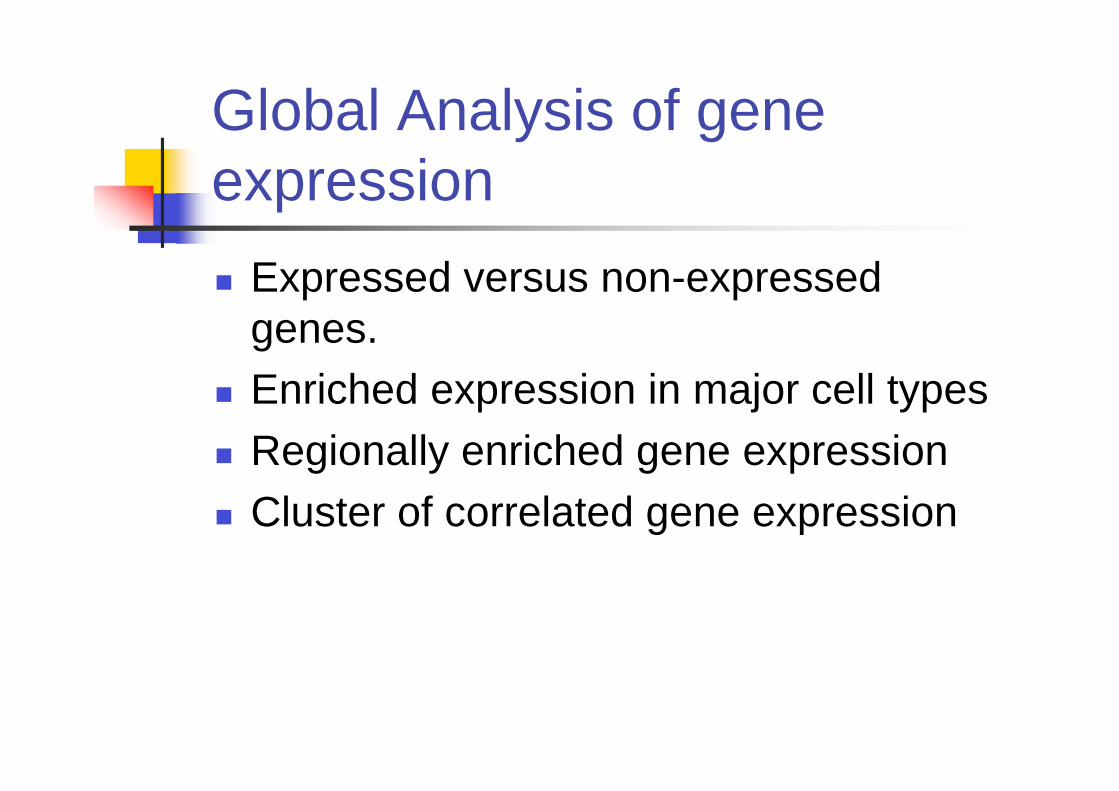
Global Analysis of gene
expression
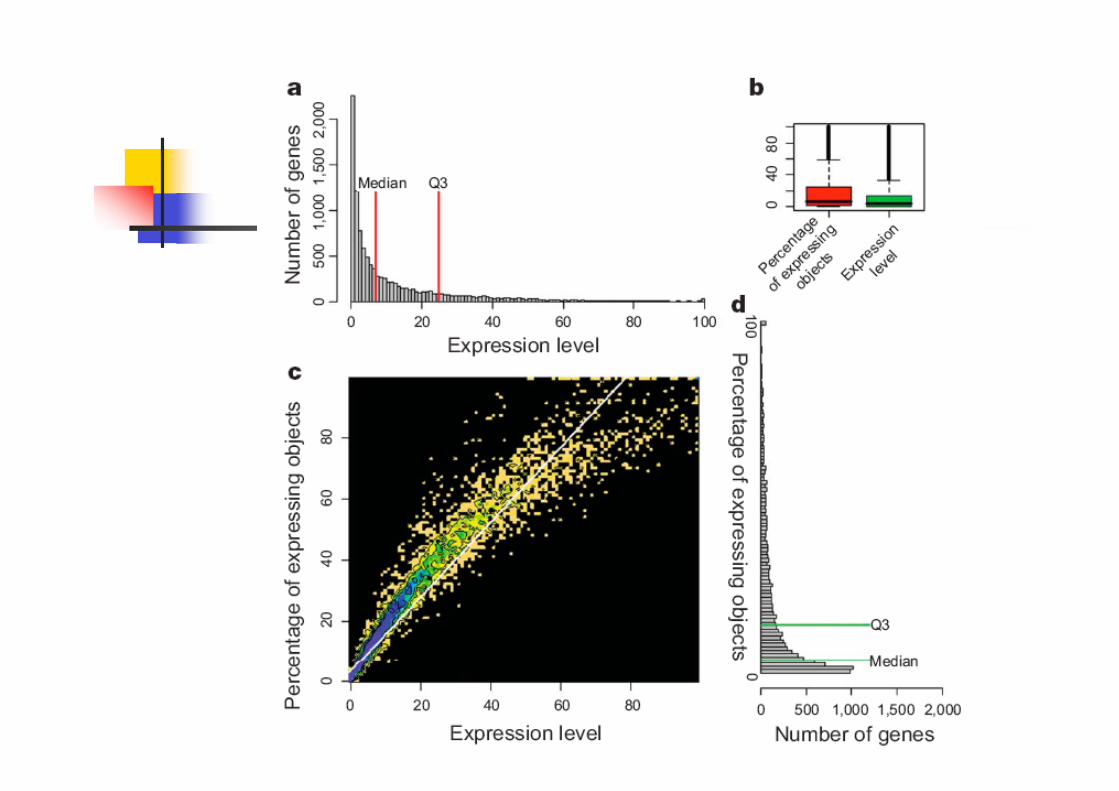
Expressed versus non-expressed
genes.
Enriched expression in major cell types
Regionally enriched gene expression
Cluster of correlated gene expression
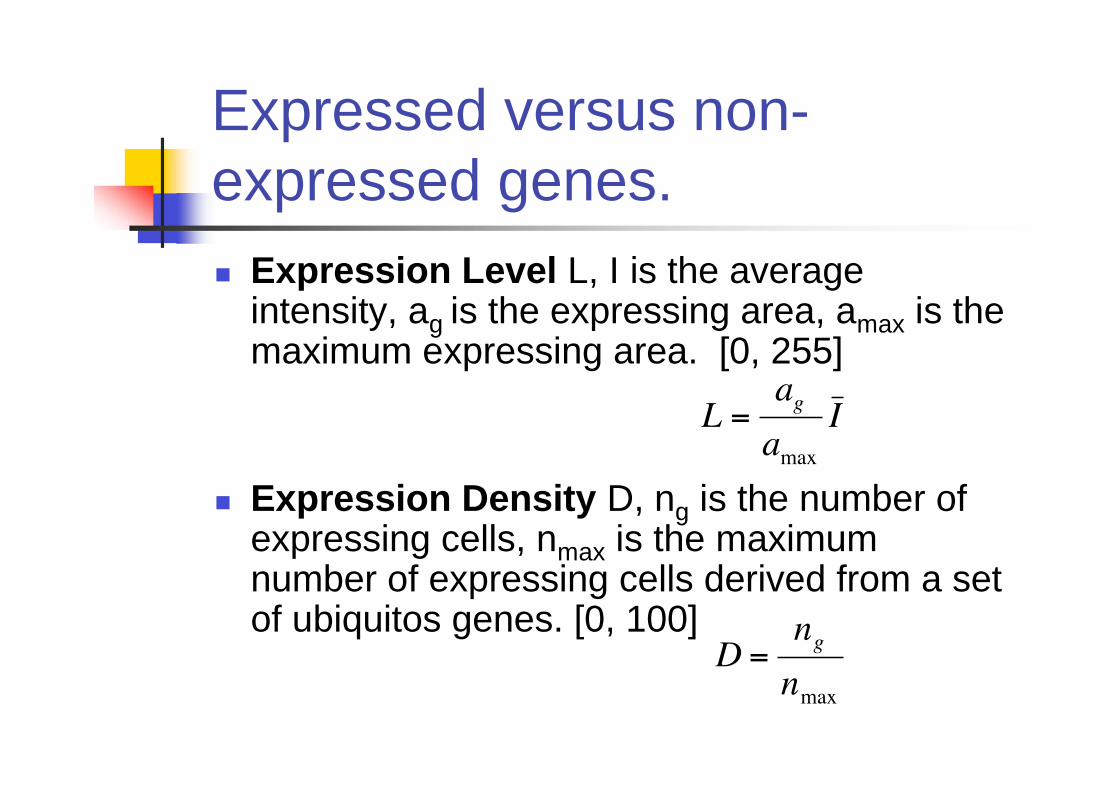
Expressed versus non-
expressed genes.
Expression Level L, I is the averageintensity, ag is the expressing area, amax is themaximum expressing area. [0, 255]
Expression Density D, ng is the number ofexpressing cells, nmax is the maximumnumber of expressing cells derived from a setof ubiquitos genes. [0, 100]
L =ag
amaxI
D =ngnmax
Expressed genes
80% of genes display some cellular
expression above background in the
brain.
70.5% of genes are expressed in less
than 20% of total cells.
Enriched expression in major
cell types
Expression PatternA binary classification represented by the labels,clustered and not clustered.
Not clustered => uniformly distributed throughoutthe anatomic structure.
Clustered => has some regional aspect in theanatomic structure.
The result is a binary vector over allanatomic structures.
Finding enriched genes
Seeding with known structure-specific
genes.
Oligodendrocyte (Mbp, Mobp, Cnp1)
Choroid-plexus (Col8a2, Lbp, Msx1)
Find the genes with similar expression
patterns.
Result
All well-established markers for
different cell types were identified.
GO enrichment analysis show different
aspects.
Oligodendrocyte-enriched genes =>
myelin production.
Regionally enriched gene
expression
Genes with regionalized expression
patterns provides potential substrates
for functional differences between brain
regions.
Finding regional-specific
genes.
For each gene, the area occupied by
signal is A and the area in the region
occupied by the signal is B. B/A is the
percentage of signal in the region.
For 12 major brain regions, 100 top
genes are reported for each region.
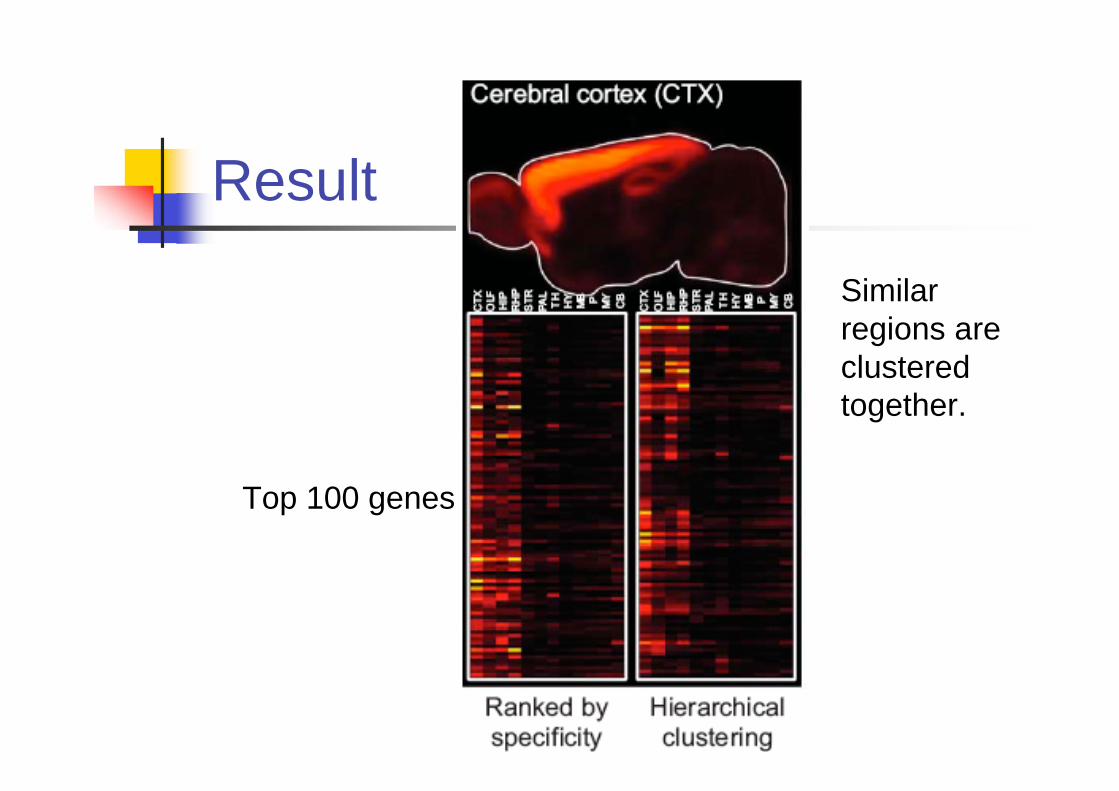
Result
Top 100 genes
Similar
regions are
clustered
together.
Cluster of correlated gene
expression
Classical definition of brain regions
Overall Morphology
Cellular Cytoarchitecture
Ontological Development
Functional Connectivity
Use gene expression for
finding brain regions
Genes with regionalized expression (not thebrain region) are used.
Initially, 5195 genes are selected. The expressingfraction is between [0.2, 0.14]
The non-expressers and genes expressedwidely are excluded.
Grid level correlations are computed.The voxel size is 300 μm2. Among 7000 voxels,1500 representative voxels are selected.
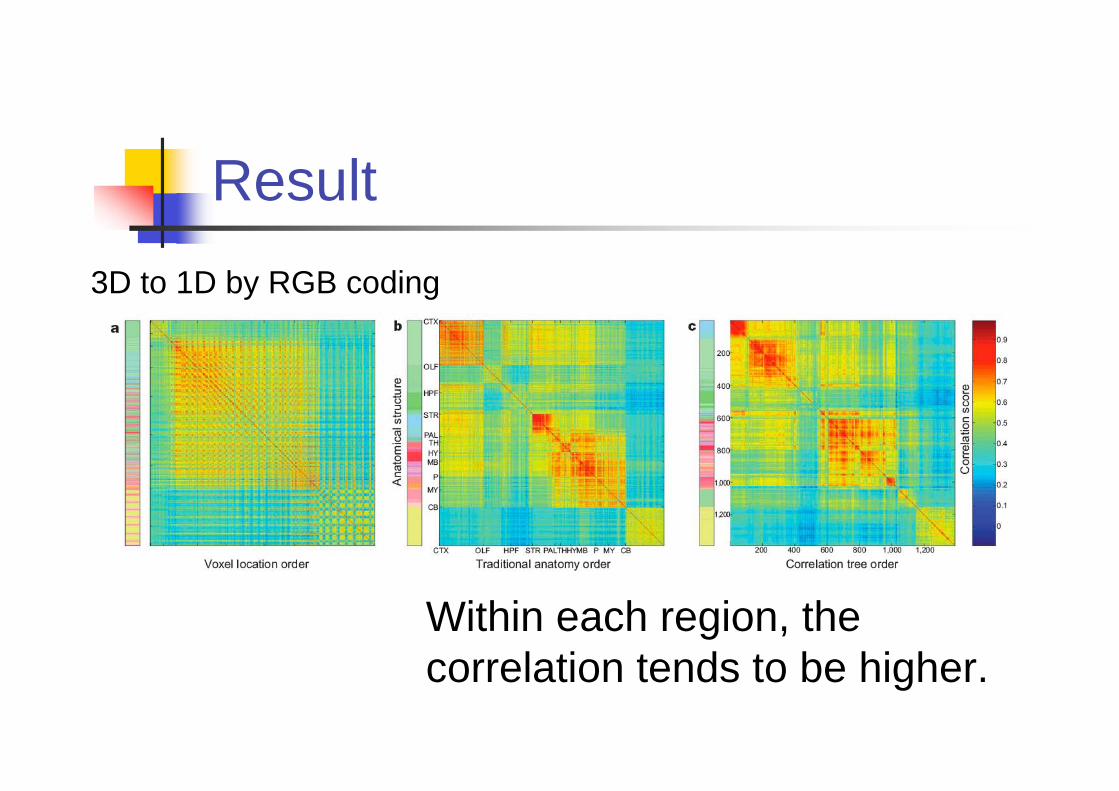
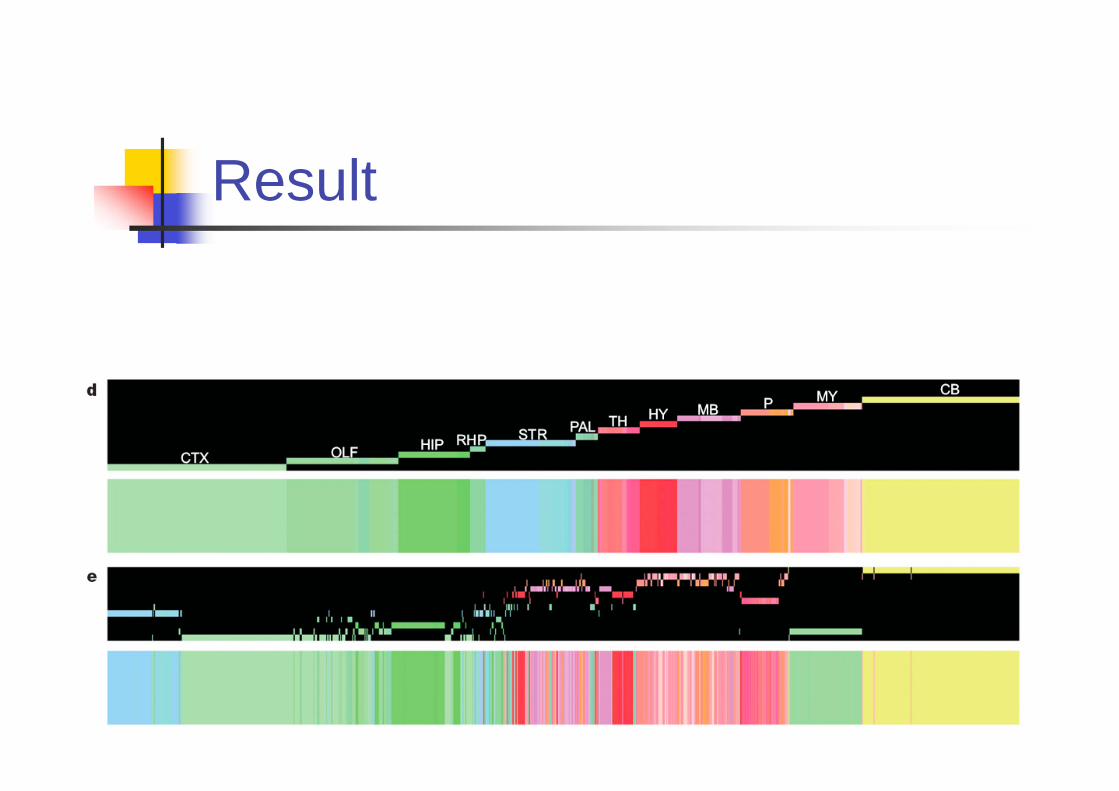
Result
Within each region, the
correlation tends to be higher.
3D to 1D by RGB coding
Result
Comments
The data produced in this paper ishuge!
The expression “profile” is in fact an 3dimension matrix.
The gene expression could be used todifferentiate the cell types and possiblydiscover the sub-cell types. Thosegenes will be the potential marker forHistology staining.
Comments
The inbred mouse strain plays
important roles in this data. Without it,
the gene expression measured on
different mice would be subject to the
genetic variation.

Comments
Is this really better than microarray
approach?
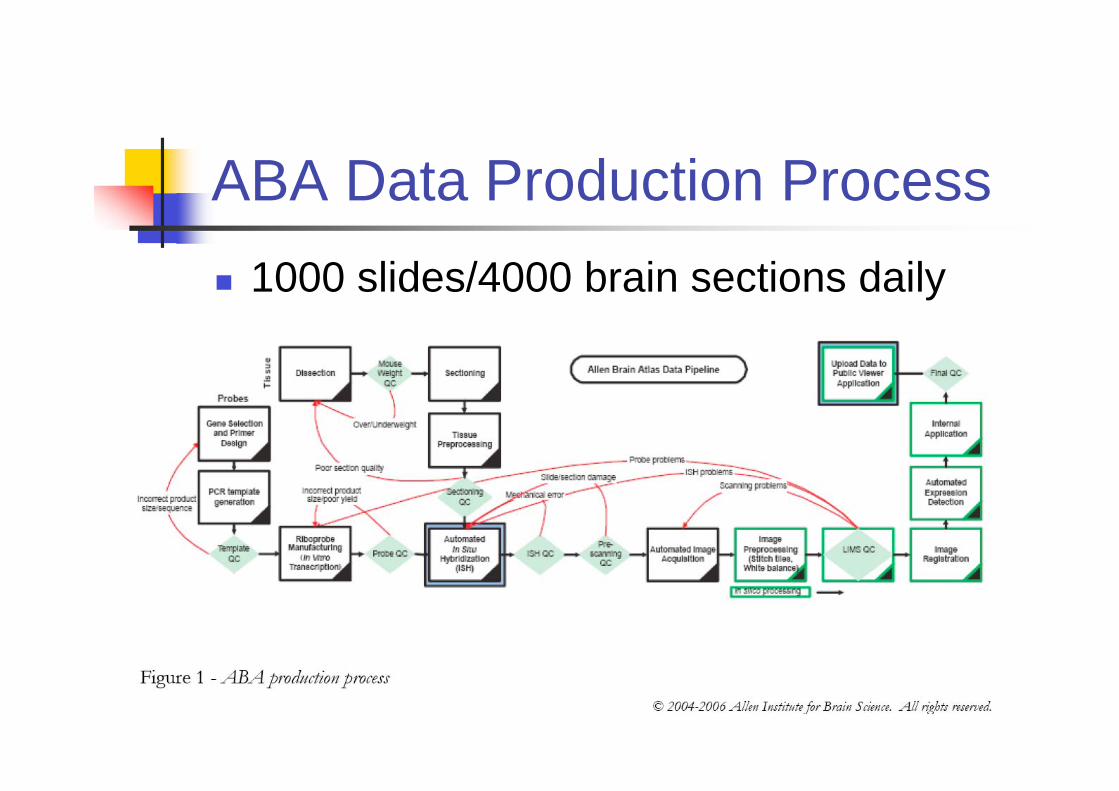
ABA Data Production Process
1000 slides/4000 brain sections daily
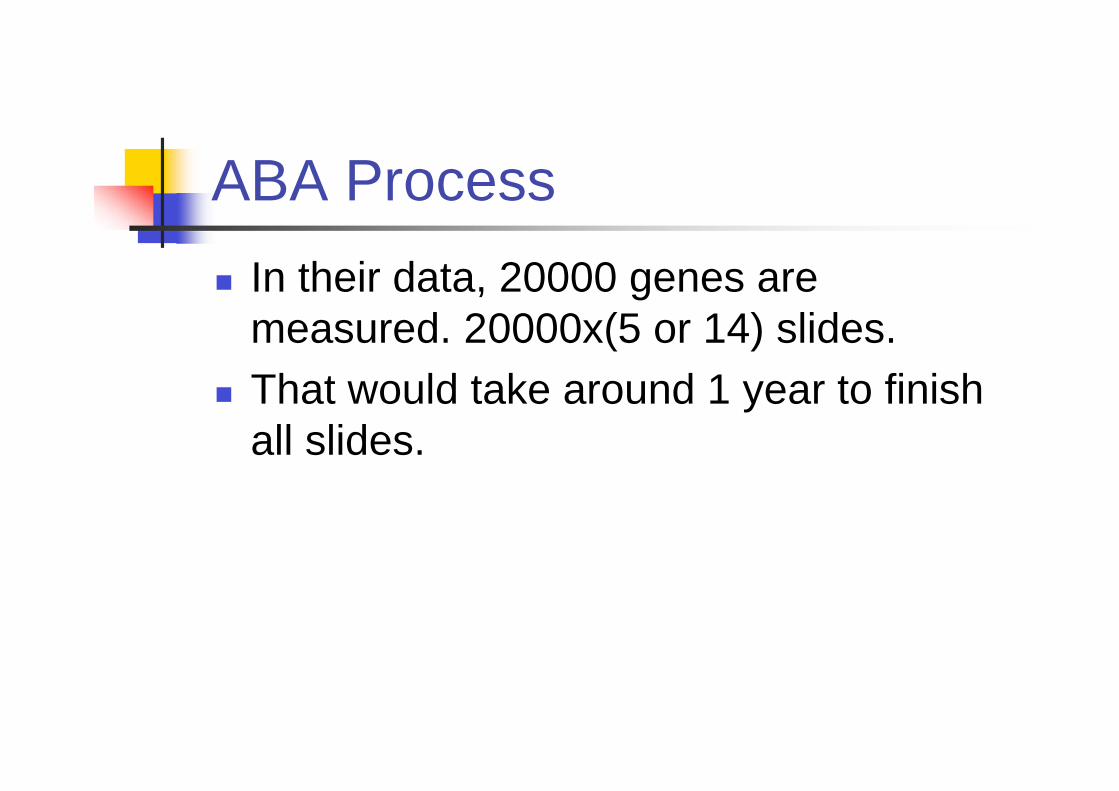
ABA Process
In their data, 20000 genes are
measured. 20000x(5 or 14) slides.
That would take around 1 year to finish
all slides.
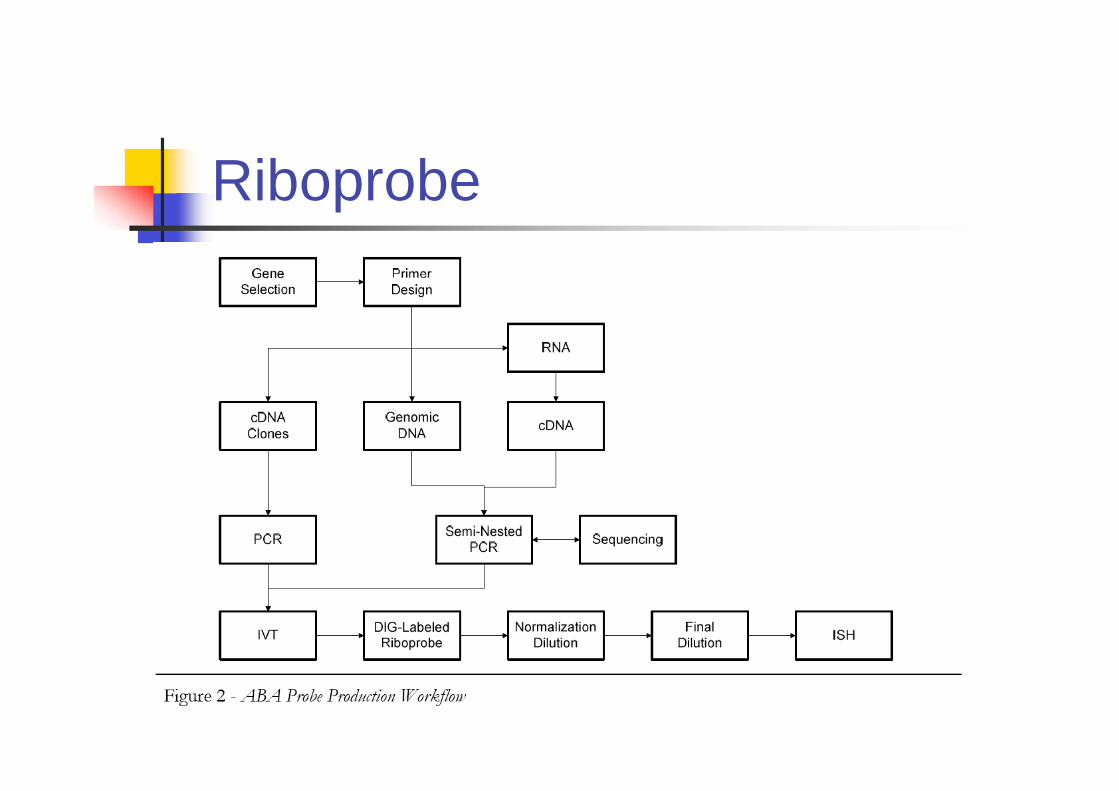
Riboprobe