Genome-Wide Association Study of Coronary Heart Disease and Its Risk Factors in 8,090 African...
11
Genome-Wide Association Study of Coronary Heart Disease and Its Risk Factors in 8,090 African Americans: The NHLBI CARe Project Guillaume Lettre 1,2 , Cameron D. Palmer 3,4. , Taylor Young 3. , Kenechi G. Ejebe 3. , Hooman Allayee 5 , Emelia J. Benjamin 6,7 , Franklyn Bennett 8 , Donald W. Bowden 9 , Aravinda Chakravarti 10 , Al Dreisbach 11 , Deborah N. Farlow 3 , Aaron R. Folsom 12 , Myriam Fornage 13 , Terrence Forrester 8 , Ervin Fox 11 , Christopher A. Haiman 5 , Jaana Hartiala 5 , Tamara B. Harris 14 , Stanley L. Hazen 15 , Susan R. Heckbert 16,17,18 , Brian E. Henderson 5 , Joel N. Hirschhorn 3,4,19 , Brendan J. Keating 20 , Stephen B. Kritchevsky 21 , Emma Larkin 22 , Mingyao Li 23 , Megan E. Rudock 24 , Colin A. McKenzie 25 , James B. Meigs 19,26 , Yang A. Meng 3 , Tom H. Mosley Jr. 11 , Anne B. Newman 27 , Christopher H. Newton-Cheh 3,7,19,28,29 , Dina N. Paltoo 30 , George J. Papanicolaou 30 , Nick Patterson 3 , Wendy S. Post 31 , Bruce M. Psaty 16,17,18 , Atif N. Qasim 32 , Liming Qu 23 , Daniel J. Rader 32,33 , Susan Redline 23 , Muredach P. Reilly 32,33 , Alexander P. Reiner 34 , Stephen S. Rich 35 , Jerome I. Rotter 36 , Yongmei Liu 24 , Peter Shrader 26 , David S. Siscovick 16,17 , W. H. Wilson Tang 15 , Herman A. Taylor Jr. 11,37,38 , Russell P. Tracy 39 , Ramachandran S. Vasan 6,7 , Kevin M. Waters 5 , Rainford Wilks 40 , James G. Wilson 11,41 , Richard R. Fabsitz 30 , Stacey B. Gabriel 3 , Sekar Kathiresan 3,7,19,28,29 , Eric Boerwinkle 42 * 1 Montreal Heart Institute, Montre ´al, Canada, 2 De ´partement de Me ´decine, Universite ´ de Montre ´al, Montre ´al, Canada, 3 Program in Medical and Population Genetics, Broad Institute, Cambridge, Massachusetts, United States of America, 4 Divisions of Genetics and Endocrinology and Program in Genomics, Children’s Hospital Boston, Boston, Massachusetts, United States of America, 5 Department of Preventive Medicine, University of Southern California Keck School of Medicine, Los Angeles, California, United States of America, 6 Department of Medicine, Boston University Schools of Medicine and Epidemiology, Boston, Massachusetts, United States of America, 7 Framingham Heart Study of the National, Heart, Lung, and Blood Institute and Boston University, Framingham, Massachusetts, United States of America, 8 Tropical Medicine Research Institute, University of the West Indies, Kingston, Jamaica, 9 Wake Forest University School of Medicine, Winston-Salem, North Carolina, United States of America, 10 McKusick-Nathans Institute of Genetic Medicine, Johns Hopkins University School of Medicine, Baltimore, Maryland, United States of America, 11 Department of Medicine, University of Mississipi Medical Center, Jackson, Mississippi, United States of America, 12 Division of Epidemiology and Community Health, University of Minnesota, Minneapolis, Minnesota, United States of America, 13 Institute of Molecular Medicine and Division of Epidemiology School of Public Health, University of Texas Health Sciences Center at Houston, Houston, Texas, United States of America, 14 Laboratory of Epidemiology, Demography, and Biometry, National Institute on Aging, Bethesda, Maryland, United States of America, 15 Departments of Cell Biology and Cardiovascular Medicine, The Center for Cardiovascular Diagnostics and Prevention, Cleveland Clinic, Cleveland, Ohio, United States of America, 16 Departments of Medicine and Epidemiology, University of Washington, Seattle, Washington, United States of America, 17 Cardiovascular Health Research Unit, University of Washington, Seattle, Washington, United States of America, 18 Group Health Research Institute, Group Health Cooperative, Seattle, Washington, United States of America, 19 Department of Medicine, Harvard Medical School, Boston, Massachusetts, United States of America, 20 Center for Applied Genomics, Children’s Hospital of Philadelphia, Philadelphia, Pennsylvania, United States of America, 21 J. Paul Sticht Center on Aging, Division of Gerontology and Geriatric Medicine, Wake Forest University School of Medicine, Winston-Salem, North Carolina, United States of America, 22 Case Western Reserve University, Center for Clinical Investigation, Cleveland, Ohio, United States of America, 23 Biostatistics and Epidemiology, University of Pennsylvania, Philadelphia, Pennsylvania, United States of America, 24 Department of Epidemiology and Prevention, Division of Public Health Sciences, Wake Forest University School of Medicine, Winston-Salem, North Carolina, United States of America, 25 Tropical Metabolism Research Unit, Tropical Medicine Research Institute, University of the West Indies, Kingston, Jamaica, 26 General Medicine Division, Massachusetts General Hospital, Boston, Massachusetts, United States of America, 27 Center for Aging and Population Health, Department of Epidemiology, University of Pittsburgh, Pittsburgh, Pennsylvania, United States of America, 28 Center for Human Genetic Research, Massachusetts General Hospital, Boston, Massachusetts, United States of America, 29 Cardiovascular Research Center and Cardiology Division, Massachusetts General Hospital, Boston, Massachusetts, United States of America, 30 National Heart, Lung, and Blood Institute (NHLBI), Division of Cardiovascular Sciences, National Institutes of Health, Bethesda, Maryland, United States of America, 31 Division of Cardiology, the Johns Hopkins University School of Medicine, Baltimore, Maryland, United States of America, 32 The Cardiovascular Institute, University of Pennsylvania, Philadelphia, Pennsylvania, United States of America, 33 The Institute for Translational Medicine and Therapeutics, School of Medicine, University of Pennsylvania, Philadelphia, Pennsylvania, United States of America, 34 Department of Epidemiology, University of Washington, Seattle, Washington, United States of America, 35 Center for Public Health Genomics, University of Virginia, Charlottesville, Virginia, United States of America, 36 Medical Genetics Institute, Cedars-Sinai Medical Center, Los Angeles, California, United States of America, 37 Jackson State University, Jackson, Mississippi, United States of America, 38 Tougaloo College, Tougaloo, Mississippi, United States of America, 39 Departments of Pathology and Biochemistry, University of Vermont, Colchester, Vermont, United States of America, 40 Epidemiology Research Unit, Tropical Medicine Research Institute, University of the West Indies, Kingston, Jamaica, 41 G. V. (Sonny) Montgomery Veterans Affairs Medical Center, Jackson, Mississippi, United States of America, 42 Human Genetics Center and Institute of Molecular Medicine and Division of Epidemiology, University of Texas Health Science Center, Houston, Texas, United States of America PLoS Genetics | www.plosgenetics.org 1 February 2011 | Volume 7 | Issue 2 | e1001300
-
Upload
independent -
Category
Documents
-
view
1 -
download
0
Transcript of Genome-Wide Association Study of Coronary Heart Disease and Its Risk Factors in 8,090 African...
Genome-Wide Association Study of Coronary HeartDisease and Its Risk Factors in 8,090 African Americans:The NHLBI CARe ProjectGuillaume Lettre1,2, Cameron D. Palmer3,4., Taylor Young3., Kenechi G. Ejebe3., Hooman Allayee5,
Emelia J. Benjamin6,7, Franklyn Bennett8, Donald W. Bowden9, Aravinda Chakravarti10, Al Dreisbach11,
Deborah N. Farlow3, Aaron R. Folsom12, Myriam Fornage13, Terrence Forrester8, Ervin Fox11,
Christopher A. Haiman5, Jaana Hartiala5, Tamara B. Harris14, Stanley L. Hazen15, Susan R.
Heckbert16,17,18, Brian E. Henderson5, Joel N. Hirschhorn3,4,19, Brendan J. Keating20, Stephen B.
Kritchevsky21, Emma Larkin22, Mingyao Li23, Megan E. Rudock24, Colin A. McKenzie25, James B.
Meigs19,26, Yang A. Meng3, Tom H. Mosley Jr.11, Anne B. Newman27, Christopher H. Newton-Cheh3,7,19,28,29,
Dina N. Paltoo30, George J. Papanicolaou30, Nick Patterson3, Wendy S. Post31, Bruce M. Psaty16,17,18, Atif N.
Qasim32, Liming Qu23, Daniel J. Rader32,33, Susan Redline23, Muredach P. Reilly32,33, Alexander P. Reiner34,
Stephen S. Rich35, Jerome I. Rotter36, Yongmei Liu24, Peter Shrader26, David S. Siscovick16,17, W. H. Wilson
Tang15, Herman A. Taylor Jr.11,37,38, Russell P. Tracy39, Ramachandran S. Vasan6,7, Kevin M. Waters5,
Rainford Wilks40, James G. Wilson11,41, Richard R. Fabsitz30, Stacey B. Gabriel3, Sekar Kathiresan3,7,19,28,29,
Eric Boerwinkle42*
1 Montreal Heart Institute, Montreal, Canada, 2 Departement de Medecine, Universite de Montreal, Montreal, Canada, 3 Program in Medical and Population Genetics,
Broad Institute, Cambridge, Massachusetts, United States of America, 4 Divisions of Genetics and Endocrinology and Program in Genomics, Children’s Hospital Boston,
Boston, Massachusetts, United States of America, 5 Department of Preventive Medicine, University of Southern California Keck School of Medicine, Los Angeles, California,
United States of America, 6 Department of Medicine, Boston University Schools of Medicine and Epidemiology, Boston, Massachusetts, United States of America,
7 Framingham Heart Study of the National, Heart, Lung, and Blood Institute and Boston University, Framingham, Massachusetts, United States of America, 8 Tropical
Medicine Research Institute, University of the West Indies, Kingston, Jamaica, 9 Wake Forest University School of Medicine, Winston-Salem, North Carolina, United States of
America, 10 McKusick-Nathans Institute of Genetic Medicine, Johns Hopkins University School of Medicine, Baltimore, Maryland, United States of America, 11 Department
of Medicine, University of Mississipi Medical Center, Jackson, Mississippi, United States of America, 12 Division of Epidemiology and Community Health, University of
Minnesota, Minneapolis, Minnesota, United States of America, 13 Institute of Molecular Medicine and Division of Epidemiology School of Public Health, University of Texas
Health Sciences Center at Houston, Houston, Texas, United States of America, 14 Laboratory of Epidemiology, Demography, and Biometry, National Institute on Aging,
Bethesda, Maryland, United States of America, 15 Departments of Cell Biology and Cardiovascular Medicine, The Center for Cardiovascular Diagnostics and Prevention,
Cleveland Clinic, Cleveland, Ohio, United States of America, 16 Departments of Medicine and Epidemiology, University of Washington, Seattle, Washington, United States
of America, 17 Cardiovascular Health Research Unit, University of Washington, Seattle, Washington, United States of America, 18 Group Health Research Institute, Group
Health Cooperative, Seattle, Washington, United States of America, 19 Department of Medicine, Harvard Medical School, Boston, Massachusetts, United States of America,
20 Center for Applied Genomics, Children’s Hospital of Philadelphia, Philadelphia, Pennsylvania, United States of America, 21 J. Paul Sticht Center on Aging, Division of
Gerontology and Geriatric Medicine, Wake Forest University School of Medicine, Winston-Salem, North Carolina, United States of America, 22 Case Western Reserve
University, Center for Clinical Investigation, Cleveland, Ohio, United States of America, 23 Biostatistics and Epidemiology, University of Pennsylvania, Philadelphia,
Pennsylvania, United States of America, 24 Department of Epidemiology and Prevention, Division of Public Health Sciences, Wake Forest University School of Medicine,
Winston-Salem, North Carolina, United States of America, 25 Tropical Metabolism Research Unit, Tropical Medicine Research Institute, University of the West Indies,
Kingston, Jamaica, 26 General Medicine Division, Massachusetts General Hospital, Boston, Massachusetts, United States of America, 27 Center for Aging and Population
Health, Department of Epidemiology, University of Pittsburgh, Pittsburgh, Pennsylvania, United States of America, 28 Center for Human Genetic Research, Massachusetts
General Hospital, Boston, Massachusetts, United States of America, 29 Cardiovascular Research Center and Cardiology Division, Massachusetts General Hospital, Boston,
Massachusetts, United States of America, 30 National Heart, Lung, and Blood Institute (NHLBI), Division of Cardiovascular Sciences, National Institutes of Health, Bethesda,
Maryland, United States of America, 31 Division of Cardiology, the Johns Hopkins University School of Medicine, Baltimore, Maryland, United States of America, 32 The
Cardiovascular Institute, University of Pennsylvania, Philadelphia, Pennsylvania, United States of America, 33 The Institute for Translational Medicine and Therapeutics,
School of Medicine, University of Pennsylvania, Philadelphia, Pennsylvania, United States of America, 34 Department of Epidemiology, University of Washington, Seattle,
Washington, United States of America, 35 Center for Public Health Genomics, University of Virginia, Charlottesville, Virginia, United States of America, 36 Medical Genetics
Institute, Cedars-Sinai Medical Center, Los Angeles, California, United States of America, 37 Jackson State University, Jackson, Mississippi, United States of America,
38 Tougaloo College, Tougaloo, Mississippi, United States of America, 39 Departments of Pathology and Biochemistry, University of Vermont, Colchester, Vermont, United
States of America, 40 Epidemiology Research Unit, Tropical Medicine Research Institute, University of the West Indies, Kingston, Jamaica, 41 G. V. (Sonny) Montgomery
Veterans Affairs Medical Center, Jackson, Mississippi, United States of America, 42 Human Genetics Center and Institute of Molecular Medicine and Division of
Epidemiology, University of Texas Health Science Center, Houston, Texas, United States of America
PLoS Genetics | www.plosgenetics.org 1 February 2011 | Volume 7 | Issue 2 | e1001300
Abstract
Coronary heart disease (CHD) is the leading cause of mortality in African Americans. To identify common geneticpolymorphisms associated with CHD and its risk factors (LDL- and HDL-cholesterol (LDL-C and HDL-C), hypertension,smoking, and type-2 diabetes) in individuals of African ancestry, we performed a genome-wide association study (GWAS) in8,090 African Americans from five population-based cohorts. We replicated 17 loci previously associated with CHD or its riskfactors in Caucasians. For five of these regions (CHD: CDKN2A/CDKN2B; HDL-C: FADS1-3, PLTP, LPL, and ABCA1), we couldleverage the distinct linkage disequilibrium (LD) patterns in African Americans to identify DNA polymorphisms morestrongly associated with the phenotypes than the previously reported index SNPs found in Caucasian populations. We alsodeveloped a new approach for association testing in admixed populations that uses allelic and local ancestry variation.Using this method, we discovered several loci that would have been missed using the basic allelic and global ancestryinformation only. Our conclusions suggest that no major loci uniquely explain the high prevalence of CHD in AfricanAmericans. Our project has developed resources and methods that address both admixture- and SNP-association tomaximize power for genetic discovery in even larger African-American consortia.
Citation: Lettre G, Palmer CD, Young T, Ejebe KG, Allayee H, et al. (2011) Genome-Wide Association Study of Coronary Heart Disease and Its Risk Factors in 8,090African Americans: The NHLBI CARe Project. PLoS Genet 7(2): e1001300. doi:10.1371/journal.pgen.1001300
Editor: Mark I. McCarthy, University of Oxford, United Kingdom
Received July 22, 2010; Accepted January 7, 2011; Published February 10, 2011
This is an open-access article distributed under the terms of the Creative Commons Public Domain declaration which stipulates that, once placed in the publicdomain, this work may be freely reproduced, distributed, transmitted, modified, built upon, or otherwise used by anyone for any lawful purpose.
Funding: The grants and contracts that have supported CARe are listed at http://public.nhlbi.nih.gov/GeneticsGenomics/home/care.aspx, includingHHSN268200625226C (ADB No. N01-HC-65226). Additional support for this work was provided by: the Fondation de l’Institut de Cardiologie de Montreal andthe Centre of Excellence in Personalized Medicine (CEPMed) (to GL), NIDDK K24 DK080140 (to JBM). The Health ABC study was supported by NIA contractsN01AG62101, N01AG62103, and N01AG62106. The Health ABC genome-wide association study was funded by NIA grant 1R01AG032098-01A1 to Wake ForestUniversity Health Sciences, and genotyping services were provided by the Center for Inherited Disease Research (CIDR). CIDR is fully funded through a federalcontract from the National Institutes of Health to The Johns Hopkins University, contract number HHSN268200782096C. The Health ABC research was supportedin part by the Intramural Research Program of the NIH, National Institute on Aging. The Cleveland Clinic GeneBank study was supported through NIH grants1P01HL098055-01, P01HL087018, P01HL076491, R01DK080732, and R01HL103931-01. A portion of analyses for the Cleveland Clinic GeneBank was conducted in afacility constructed with support from Research Facilities Improvement Program Grant Number C06 (RR10600-01, CA62528-01, RR14514-01) from the NationalCenter for Research Resources. The funders had no role in study design, data collection and analysis, decision to publish, or preparation of the manuscript.
Competing Interests: JBM has a research grant from GSK and a consulting agreement with Interleukin Genetics, SLH reports being listed as co-inventor onpending and issued patents held by the Cleveland Clinic relating to cardiovascular diagnostics. SLH reports having been paid as a consultant or speaker for thefollowing companies: AstraZeneca Pharmaceuticals LP, BG Medicine, Merck & Co., Pfizer Takeda, Esperion, and Cleveland Heart Lab. SLH reports receiving researchfunds from Abbott, Liposcience, and Cleveland Heart Lab. WHWT reports receiving research grant support from Abbott Laboratories.
* E-mail: [email protected]
. These authors contributed equally to this work
Introduction
Coronary heart disease (CHD) is the leading cause of mortality
in African-American men and women [1]. The risk factors for
CHD in African Americans are similar to those reported in
Caucasians, but their relative impact varies between the two ethnic
groups. Multiple studies have reported that smoking, type-2
diabetes (T2D), hypertension, and LDL- and HDL-cholesterol
(LDL-C and HDL-C) are significant independent risk factors for
CHD in African Americans [2–5]. In general, hypertension and
LDL-C have a larger and smaller impact on CHD risk,
respectively, in African Americans compared with Caucasians
[3]. There is also extensive evidence of the role of genetic factors in
the familial aggregation of CHD and its predictors in African
Americans [6]. However, the underlying genes remain largely
unknown.
Recent advances in genome-wide association studies (GWAS)
have made spectacular advances in identifying genes contributing
to numerous common chronic diseases in Europeans and
European Americans [7]. There are multiple loci convincingly
associated with CHD risk in Caucasians, including many genes
involved in lipid metabolism, as well as novel chromosomal
regions that do not appear to contribute to risk through traditional
risk factors [7–14]. However, there have been no large-scale
GWAS for CHD and its risk factors in African Americans. GWAS
in African Americans is important because new genes may be
identified as a result of genetic variation private to populations of
African-descent, differences in allele frequencies and in patterns of
linkage disequilibrium (LD), differences in the relative impact of
risk factors to disease, or differences in gene-environment
interactions. Here we report a large (and for most phenotypes
first) GWAS for CHD, type-2 diabetes (T2D), hypertension, LDL-
C and HDL-C, and smoking in 8,090 African Americans as part of
the National Heart, Lung, and Blood Institute (NHLBI)-sponsored
Candidate gene Association Resource (CARe) Project [15].
Results
We genotyped 909,622 single nucleotide polymorphisms in
9,119 African Americans from the ARIC (N = 3,269), CARDIA
(N = 1,209), CFS (N = 704), JHS (N = 2,200), and MESA
(N = 1,737) population-based cohorts, on the Affymetrix Ge-
nome-Wide Human SNP Array 6.0 platform. Genotypes were
called using Birdseed v1.33 [16], and stringent quality-control
filters were applied (Tables S1 and S2). For samples that passed
quality control (N = 8,100), principal component analysis (PCA)
using EIGENSTRAT [17] revealed only ten population outliers
across all cohorts; these samples were also excluded from the
analysis (Text S1 and Figure S1). Overall, a total of 8,090 African
Americans with very high genotype quality (average genotype
success rate of 99.65%) were available for analysis. The
demographics of these participants by cohort are shown in
Table 1. To increase our coverage of common genetic variation
and statistical power, and to facilitate comparisons across
GWAS of CHD in African Americans
PLoS Genetics | www.plosgenetics.org 2 February 2011 | Volume 7 | Issue 2 | e1001300

genotyping platforms, we imputed genotypes in the CARe
African-American populations using MACH taking into account
the admixed nature of the population (Text S1) [18,19].
For all cohorts except CFS, single marker genetic association
tests were performed by study using PLINK v1.06 [20] under an
additive genetic model. We used linear regression for quantitative
traits (HDL-C, LDL-C, and smoking) and logistic regression for
dichotomous phenotypes (CHD, hypertension, and T2D). For
CFS, family structure was modeled using linear mixed effects
(LME) models and generalized estimating equations (GEE) for
quantitative and dichotomous phenotypes, respectively [21]. For
all analyses, the first ten principal components were used as
covariates to account for global admixture and population
stratification. A detailed description of the analysis methods and
the phenotypic definitions used can be found in Text S1. Power
calculations for the different phenotypes analyzed are summarized
in Table S3; we have excellent power to find strong signals, but
low to modest power for variants with weak phenotypic effects.
The inflation factors (ls) observed were all near unity (Table S4),
suggesting that most confounders, including population stratifica-
tion, were well-controlled.
We applied genomic control to the individual cohorts’ results
and combined them using the inverse variance meta-analysis
method [22]. Inflation factors of the meta-analysis results were
modest and were again scaled using genomic control (Table S4).
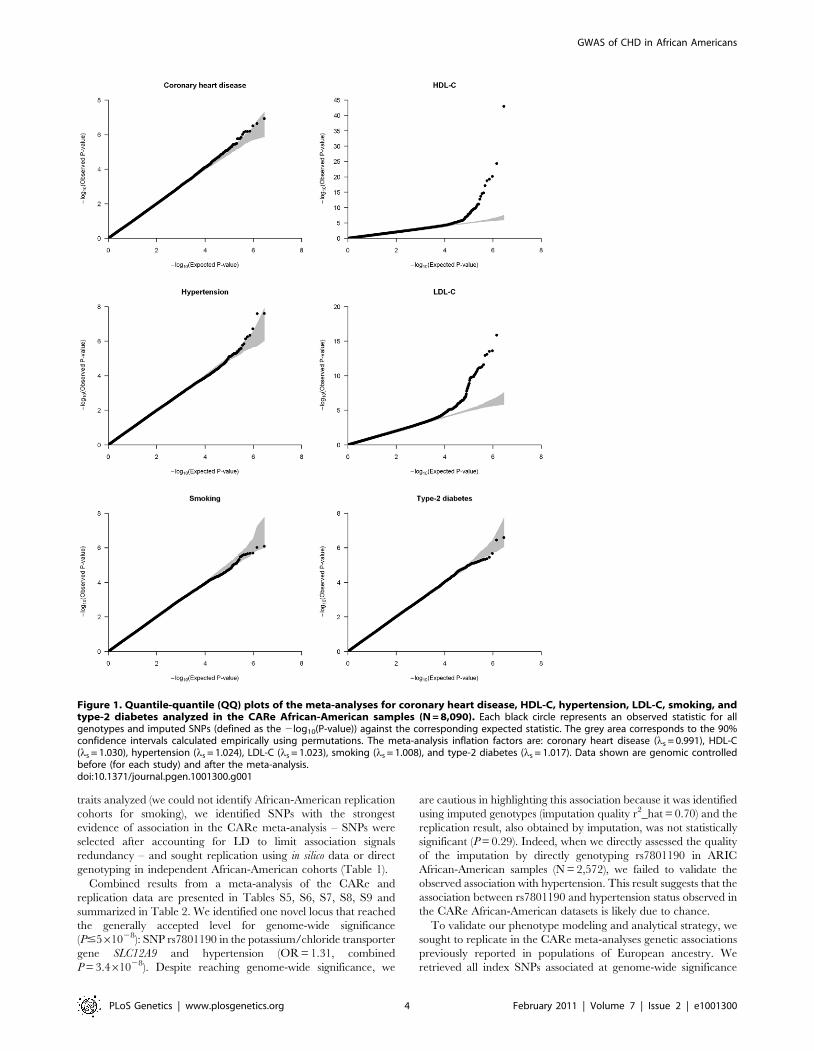
Quantile-quantile (QQ) plots of the six different meta-analyses
after double genomic control corrections show that the test
statistics follow the null expectations, except for the HDL-C and
LDL-C meta-analyses, which show an upward departure from the
null distributions at the lowest P-values (Figure 1). This departure
is caused by known genetic variants with large effects on lipid
levels (Figure S2).
The main goal of this study was to identify new genetic risk
factors for CHD and its predictors in African Americans. For five
Author Summary
To date, most large-scale genome-wide association studies(GWAS) carried out to identify risk factors for complexhuman diseases and traits have focused on population ofEuropean ancestry. It is currently unknown whether thesame loci associated with complex diseases and traits inCaucasians will replicate in population of African ancestry.Here, we conducted a large GWAS to identify commonDNA polymorphisms associated with coronary heartdisease (CHD) and its risk factors (type-2 diabetes,hypertension, smoking status, and LDL- and HDL-choles-terol) in 8,090 African Americans as part of the NHLBICandidate gene Association Resource (CARe) Project. Wereplicated 17 associations previously reported in Cauca-sians, suggesting that the same loci carry common DNAsequence variants associated with CHD and its risk factorsin Caucasians and African Americans. At five of these 17loci, we used the different patterns of linkage disequilib-rium between populations of European and Africanancestry to identify DNA sequence variants more stronglyassociated with phenotypes than the index SNPs found inCaucasians, suggesting smaller genomic intervals to searchfor causal alleles. We also used the CARe data to developnew statistical methods to perform association studies inadmixed populations. The CARe Project data represent anextraordinary resource to expand our understanding of thegenetics of complex diseases and traits in non-European-derived populations.
Ta
ble
1.
De
mo
gra
ph
ics
of
the
CA
Re
and
rep
licat
ion
Afr
ican
-Am
eri
can
coh
ort
s.
Ph
en
oty
pe
s1A
RIC
CA
RD
IAC
FS
JHS
ME
SA
ME
C-
T2
DC
lev
ela
nd
Cli
nic
Pe
nn
CA
TH
NH
AN
ES
III
Jam
aic
aS
PT
Jam
aic
aG
XE
He
alt
hA
BC
Ge
nd
er
10
45
/17
85
36
6/5
83
21
3/3
08
84
2/1
30
27
45
/90
18
35
/13
49
34
5/3
74
28
0/2
22
71
8/1
00
26
74
/10
55
23
2/7
36
46
8/6
51
Ag
e5
3.3
65
.82
4.4
63
.84
5.7
61
6.2
50
.06
12
.26
2.2
61
0.1
60
.46
8.5
60
.06
11
.15
8.0
61
0.6
40
.86
16
.74
6.1
61
3.9
39
.76
8.3
73
.46
2.9
Co
ron
ary
he
art
dis
eas
e1
10
/25
80
NA
25
/47
51
25
/19
98
NA
NA
22
0/4
00
15
7/3
34
NA
NA
NA
24
4/8
95
Typ
e-2
dia
be
tes
52
9/2
15
0N
A9
8/4
03
33
9/1
77
72
98
/13
48
10
70
/11
14
NA
NA
16
8/8
99
NA
NA
33
5/7
57
Hyp
ert
en
sio
n1
61
2/1
13
23
6/9
13
20
9/2
60
11
93
/91
81
01
9/6
25
NA
NA
NA
50
1/1
21
9N
AN
A8
71
/26
3
LDL-
C1
38
.76
43
.3(2
58
8)
11
1.3
63
1.0
(94
0)
99
.06
33
.9(2
95
)1
25
.26
36
.6(2
11
1)
11
6.5
63
3.4
(16
31
)N
AN
AN
A1
21
.16
40
.4(8
05
)1
23
.56
39
.1(9
28
)1
36
.66
38
.5(9
28
)1
23
.96
36
.7(1
12
8)
HD
L-C
54
.76
17
.5(2
61
3)
54
.46
13
.0(9
40
)4
6.4
61
5.0
(48
3)
50
.06
14
.1(2
13
8)
52
.56
15
.3(1
63
9)
NA
NA
NA
54
.16
17
.2(8
05
)4
8.4
61
2.6
(14
13
)5
1.5
61
1.5
(96
7)
57
.16
17
.6(1
13
8)
Smo
kin
g1
4.2
69
.4(7
99
)1
0.8
67
.6(3
59
)1
0.8
66
.7(1
78
)1
5.1
61
1.6
(65
9)
14
.66
18
.6(8
73
)N
AN
AN
AN
AN
AN
AN
A
1Fo
rg
en
de
r,w
ere
po
rte
rth
en
um
be
ro
fm
ale
s/fe
mal
es.
For
age
,we
rep
ort
the
me
an6
stan
dar
dd
evi
atio
nin
year
s.Fo
rco
ron
ary
he
art
dis
eas
e,t
ype
-2d
iab
ete
s,an
dh
ype
rte
nsi
on
,we
rep
ort
the
nu
mb
er
of
case
s/co
ntr
ols
.Fo
rLD
L-C
and
HD
L-C
,w
ere
po
rtth
em
ean
6st
and
ard
de
viat
ion
inm
g/d
l(n
um
be
ro
fsa
mp
les
wit
hp
he
no
typ
es
avai
lab
le).
For
smo
kin
g,
we
rep
ort
the
me
an6
stan
dar
dd
evi
atio
nin
dai
lyci
gar
ett
es,
exc
lud
ing
no
n-s
mo
kers
(nu
mb
er
of
sam
ple
sw
ith
ph
en
oty
pe
sav
aila
ble
).T
he
nu
mb
er
of
CH
Dca
ses
wit
hco
nco
mit
ant
typ
e-2
dia
be
tes
inth
eC
AR
eco
ho
rts
is:
44
for
AR
IC,
14
for
CFS
,an
d4
3fo
rJH
S.N
A;
no
tav
aila
ble
or
no
tan
alyz
ed
inth
isst
ud
y.d
oi:1
0.1
37
1/j
ou
rnal
.pg
en
.10
01
30
0.t
00
1
GWAS of CHD in African Americans
PLoS Genetics | www.plosgenetics.org 3 February 2011 | Volume 7 | Issue 2 | e1001300
traits analyzed (we could not identify African-American replication
cohorts for smoking), we identified SNPs with the strongest
evidence of association in the CARe meta-analysis – SNPs were
selected after accounting for LD to limit association signals
redundancy – and sought replication using in silico data or direct
genotyping in independent African-American cohorts (Table 1).
Combined results from a meta-analysis of the CARe and
replication data are presented in Tables S5, S6, S7, S8, S9 and
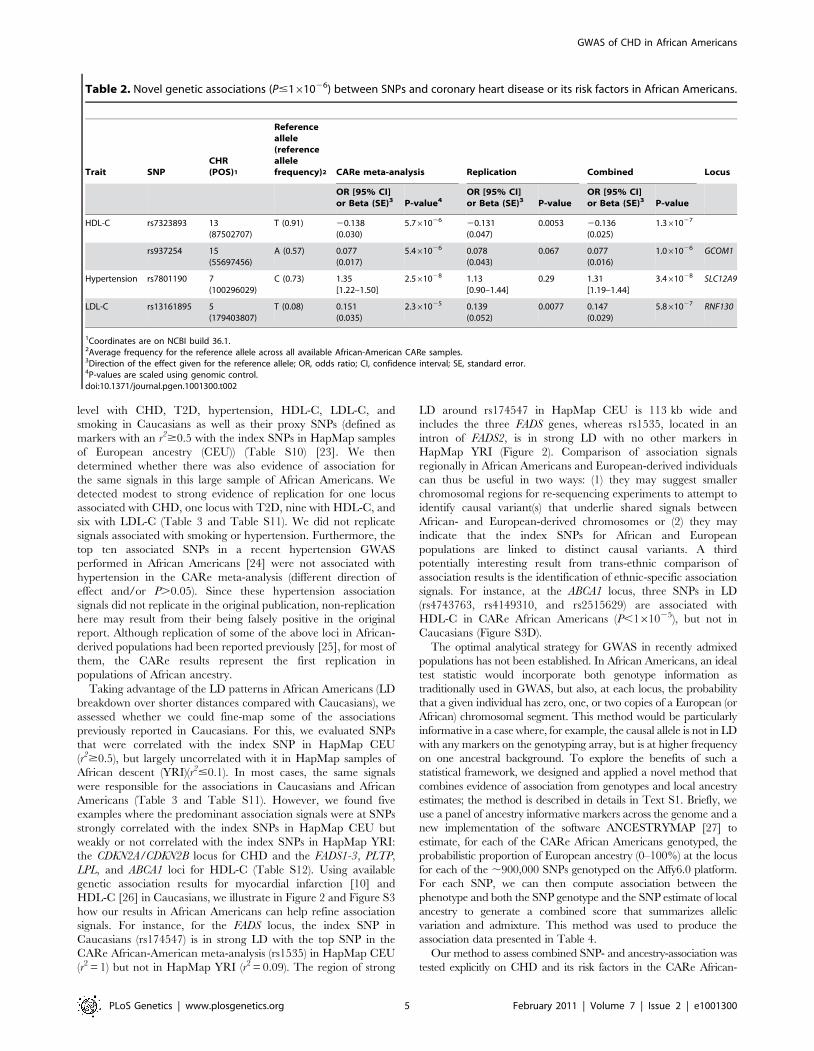
summarized in Table 2. We identified one novel locus that reached
the generally accepted level for genome-wide significance
(P#561028): SNP rs7801190 in the potassium/chloride transporter
gene SLC12A9 and hypertension (OR = 1.31, combined
P = 3.461028). Despite reaching genome-wide significance, we
are cautious in highlighting this association because it was identified
using imputed genotypes (imputation quality r2_hat = 0.70) and the
replication result, also obtained by imputation, was not statistically
significant (P = 0.29). Indeed, when we directly assessed the quality
of the imputation by directly genotyping rs7801190 in ARIC
African-American samples (N = 2,572), we failed to validate the
observed association with hypertension. This result suggests that the
association between rs7801190 and hypertension status observed in
the CARe African-American datasets is likely due to chance.
To validate our phenotype modeling and analytical strategy, we
sought to replicate in the CARe meta-analyses genetic associations
previously reported in populations of European ancestry. We
retrieved all index SNPs associated at genome-wide significance
Figure 1. Quantile-quantile (QQ) plots of the meta-analyses for coronary heart disease, HDL-C, hypertension, LDL-C, smoking, andtype-2 diabetes analyzed in the CARe African-American samples (N = 8,090). Each black circle represents an observed statistic for allgenotypes and imputed SNPs (defined as the 2log10(P-value)) against the corresponding expected statistic. The grey area corresponds to the 90%confidence intervals calculated empirically using permutations. The meta-analysis inflation factors are: coronary heart disease (ls = 0.991), HDL-C(ls = 1.030), hypertension (ls = 1.024), LDL-C (ls = 1.023), smoking (ls = 1.008), and type-2 diabetes (ls = 1.017). Data shown are genomic controlledbefore (for each study) and after the meta-analysis.doi:10.1371/journal.pgen.1001300.g001
GWAS of CHD in African Americans
PLoS Genetics | www.plosgenetics.org 4 February 2011 | Volume 7 | Issue 2 | e1001300
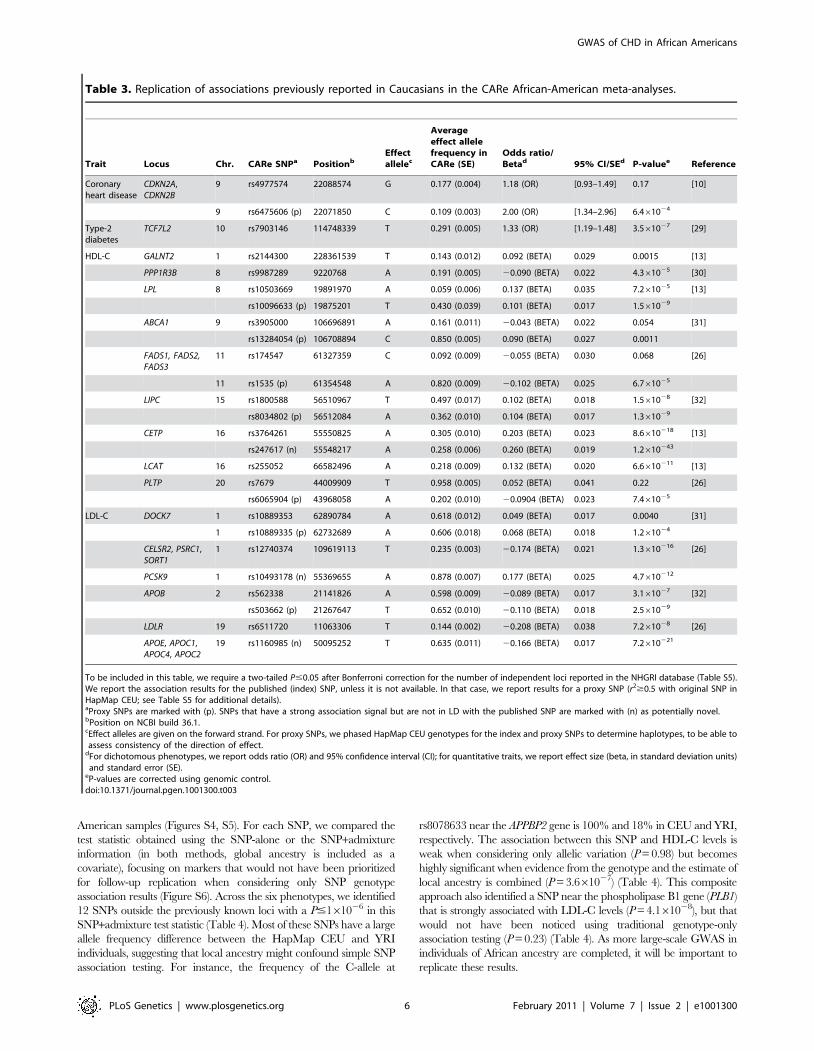
level with CHD, T2D, hypertension, HDL-C, LDL-C, and
smoking in Caucasians as well as their proxy SNPs (defined as
markers with an r2$0.5 with the index SNPs in HapMap samples
of European ancestry (CEU)) (Table S10) [23]. We then
determined whether there was also evidence of association for
the same signals in this large sample of African Americans. We
detected modest to strong evidence of replication for one locus
associated with CHD, one locus with T2D, nine with HDL-C, and
six with LDL-C (Table 3 and Table S11). We did not replicate
signals associated with smoking or hypertension. Furthermore, the
top ten associated SNPs in a recent hypertension GWAS
performed in African Americans [24] were not associated with
hypertension in the CARe meta-analysis (different direction of
effect and/or P.0.05). Since these hypertension association
signals did not replicate in the original publication, non-replication
here may result from their being falsely positive in the original
report. Although replication of some of the above loci in African-
derived populations had been reported previously [25], for most of
them, the CARe results represent the first replication in
populations of African ancestry.
Taking advantage of the LD patterns in African Americans (LD
breakdown over shorter distances compared with Caucasians), we
assessed whether we could fine-map some of the associations
previously reported in Caucasians. For this, we evaluated SNPs
that were correlated with the index SNP in HapMap CEU
(r2$0.5), but largely uncorrelated with it in HapMap samples of
African descent (YRI)(r2#0.1). In most cases, the same signals
were responsible for the associations in Caucasians and African
Americans (Table 3 and Table S11). However, we found five
examples where the predominant association signals were at SNPs
strongly correlated with the index SNPs in HapMap CEU but
weakly or not correlated with the index SNPs in HapMap YRI:
the CDKN2A/CDKN2B locus for CHD and the FADS1-3, PLTP,
LPL, and ABCA1 loci for HDL-C (Table S12). Using available
genetic association results for myocardial infarction [10] and
HDL-C [26] in Caucasians, we illustrate in Figure 2 and Figure S3
how our results in African Americans can help refine association
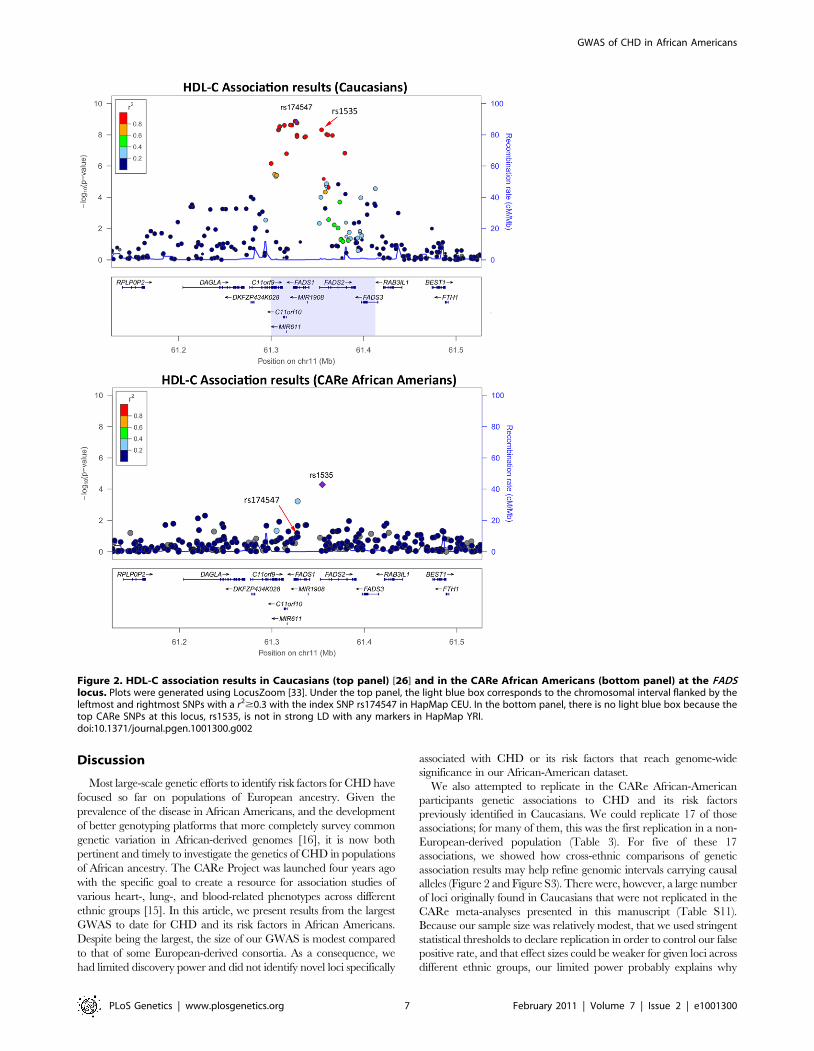
signals. For instance, for the FADS locus, the index SNP in
Caucasians (rs174547) is in strong LD with the top SNP in the
CARe African-American meta-analysis (rs1535) in HapMap CEU
(r2 = 1) but not in HapMap YRI (r2 = 0.09). The region of strong
LD around rs174547 in HapMap CEU is 113 kb wide and
includes the three FADS genes, whereas rs1535, located in an
intron of FADS2, is in strong LD with no other markers in
HapMap YRI (Figure 2). Comparison of association signals
regionally in African Americans and European-derived individuals
can thus be useful in two ways: (1) they may suggest smaller
chromosomal regions for re-sequencing experiments to attempt to
identify causal variant(s) that underlie shared signals between
African- and European-derived chromosomes or (2) they may
indicate that the index SNPs for African and European
populations are linked to distinct causal variants. A third
potentially interesting result from trans-ethnic comparison of
association results is the identification of ethnic-specific association
signals. For instance, at the ABCA1 locus, three SNPs in LD
(rs4743763, rs4149310, and rs2515629) are associated with
HDL-C in CARe African Americans (P,161025), but not in
Caucasians (Figure S3D).
The optimal analytical strategy for GWAS in recently admixed
populations has not been established. In African Americans, an ideal
test statistic would incorporate both genotype information as
traditionally used in GWAS, but also, at each locus, the probability
that a given individual has zero, one, or two copies of a European (or
African) chromosomal segment. This method would be particularly
informative in a case where, for example, the causal allele is not in LD
with any markers on the genotyping array, but is at higher frequency
on one ancestral background. To explore the benefits of such a
statistical framework, we designed and applied a novel method that
combines evidence of association from genotypes and local ancestry
estimates; the method is described in details in Text S1. Briefly, we
use a panel of ancestry informative markers across the genome and a
new implementation of the software ANCESTRYMAP [27] to
estimate, for each of the CARe African Americans genotyped, the
probabilistic proportion of European ancestry (0–100%) at the locus
for each of the ,900,000 SNPs genotyped on the Affy6.0 platform.
For each SNP, we can then compute association between the
phenotype and both the SNP genotype and the SNP estimate of local
ancestry to generate a combined score that summarizes allelic
variation and admixture. This method was used to produce the
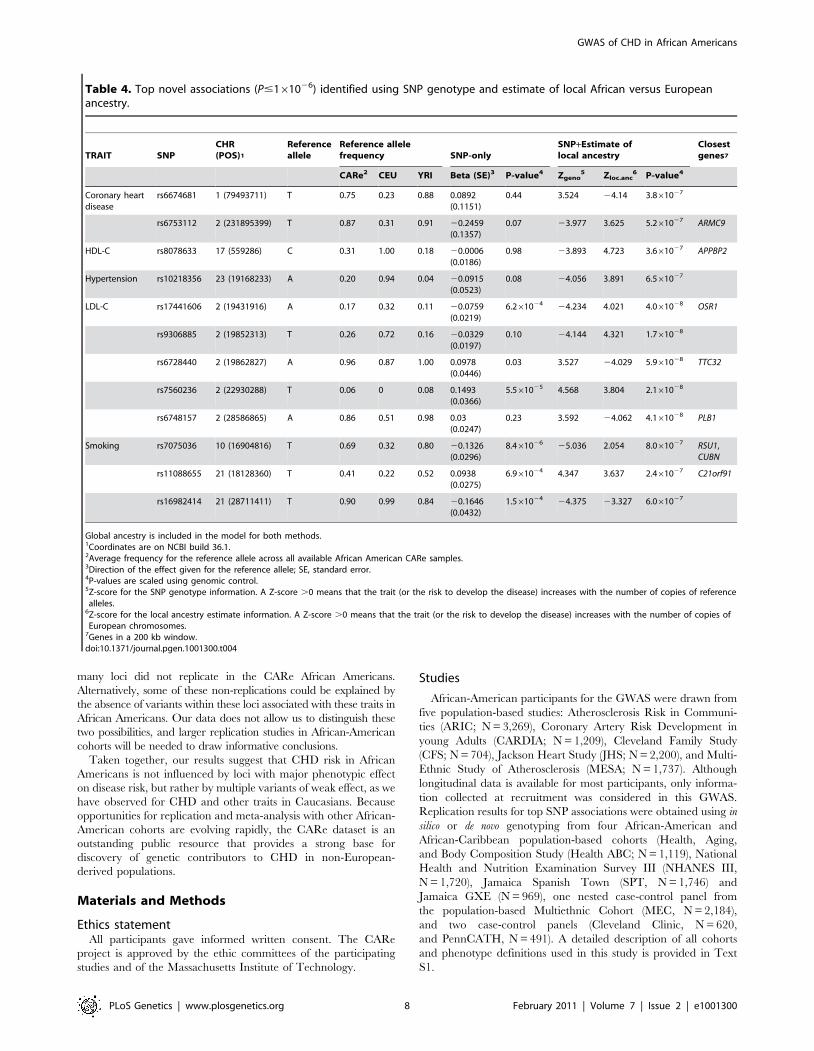
association data presented in Table 4.
Our method to assess combined SNP- and ancestry-association was
tested explicitly on CHD and its risk factors in the CARe African-
Table 2. Novel genetic associations (P#161026) between SNPs and coronary heart disease or its risk factors in African Americans.
Trait SNPCHR(POS)1
Referenceallele(referenceallelefrequency)2 CARe meta-analysis Replication Combined Locus
OR [95% CI]or Beta (SE)3 P-value4
OR [95% CI]or Beta (SE)3 P-value
OR [95% CI]or Beta (SE)3 P-value
HDL-C rs7323893 13(87502707)
T (0.91) 20.138(0.030)
5.761026 20.131(0.047)
0.0053 20.136(0.025)
1.361027
rs937254 15(55697456)
A (0.57) 0.077(0.017)
5.461026 0.078(0.043)
0.067 0.077(0.016)
1.061026 GCOM1
Hypertension rs7801190 7(100296029)
C (0.73) 1.35[1.22–1.50]
2.561028 1.13[0.90–1.44]
0.29 1.31[1.19–1.44]
3.461028 SLC12A9
LDL-C rs13161895 5(179403807)
T (0.08) 0.151(0.035)
2.361025 0.139(0.052)
0.0077 0.147(0.029)
5.861027 RNF130
1Coordinates are on NCBI build 36.1.2Average frequency for the reference allele across all available African-American CARe samples.3Direction of the effect given for the reference allele; OR, odds ratio; CI, confidence interval; SE, standard error.4P-values are scaled using genomic control.doi:10.1371/journal.pgen.1001300.t002
GWAS of CHD in African Americans
PLoS Genetics | www.plosgenetics.org 5 February 2011 | Volume 7 | Issue 2 | e1001300
American samples (Figures S4, S5). For each SNP, we compared the
test statistic obtained using the SNP-alone or the SNP+admixture
information (in both methods, global ancestry is included as a
covariate), focusing on markers that would not have been prioritized
for follow-up replication when considering only SNP genotype
association results (Figure S6). Across the six phenotypes, we identified
12 SNPs outside the previously known loci with a P#161026 in this
SNP+admixture test statistic (Table 4). Most of these SNPs have a large
allele frequency difference between the HapMap CEU and YRI
individuals, suggesting that local ancestry might confound simple SNP
association testing. For instance, the frequency of the C-allele at
rs8078633 near the APPBP2 gene is 100% and 18% in CEU and YRI,
respectively. The association between this SNP and HDL-C levels is
weak when considering only allelic variation (P = 0.98) but becomes
highly significant when evidence from the genotype and the estimate of
local ancestry is combined (P = 3.661027) (Table 4). This composite
approach also identified a SNP near the phospholipase B1 gene (PLB1)
that is strongly associated with LDL-C levels (P = 4.161028), but that
would not have been noticed using traditional genotype-only
association testing (P = 0.23) (Table 4). As more large-scale GWAS in
individuals of African ancestry are completed, it will be important to
replicate these results.
Table 3. Replication of associations previously reported in Caucasians in the CARe African-American meta-analyses.
Trait Locus Chr. CARe SNPa PositionbEffectallelec
Averageeffect allelefrequency inCARe (SE)
Odds ratio/Betad 95% CI/SEd P-valuee Reference
Coronaryheart disease
CDKN2A,CDKN2B
9 rs4977574 22088574 G 0.177 (0.004) 1.18 (OR) [0.93–1.49] 0.17 [10]
9 rs6475606 (p) 22071850 C 0.109 (0.003) 2.00 (OR) [1.34–2.96] 6.461024
Type-2diabetes
TCF7L2 10 rs7903146 114748339 T 0.291 (0.005) 1.33 (OR) [1.19–1.48] 3.561027 [29]
HDL-C GALNT2 1 rs2144300 228361539 T 0.143 (0.012) 0.092 (BETA) 0.029 0.0015 [13]
PPP1R3B 8 rs9987289 9220768 A 0.191 (0.005) 20.090 (BETA) 0.022 4.361025 [30]
LPL 8 rs10503669 19891970 A 0.059 (0.006) 0.137 (BETA) 0.035 7.261025 [13]
rs10096633 (p) 19875201 T 0.430 (0.039) 0.101 (BETA) 0.017 1.561029
ABCA1 9 rs3905000 106696891 A 0.161 (0.011) 20.043 (BETA) 0.022 0.054 [31]
rs13284054 (p) 106708894 C 0.850 (0.005) 0.090 (BETA) 0.027 0.0011
FADS1, FADS2,FADS3
11 rs174547 61327359 C 0.092 (0.009) 20.055 (BETA) 0.030 0.068 [26]
11 rs1535 (p) 61354548 A 0.820 (0.009) 20.102 (BETA) 0.025 6.761025
LIPC 15 rs1800588 56510967 T 0.497 (0.017) 0.102 (BETA) 0.018 1.561028 [32]
rs8034802 (p) 56512084 A 0.362 (0.010) 0.104 (BETA) 0.017 1.361029
CETP 16 rs3764261 55550825 A 0.305 (0.010) 0.203 (BETA) 0.023 8.6610218 [13]
rs247617 (n) 55548217 A 0.258 (0.006) 0.260 (BETA) 0.019 1.2610243
LCAT 16 rs255052 66582496 A 0.218 (0.009) 0.132 (BETA) 0.020 6.6610211 [13]
PLTP 20 rs7679 44009909 T 0.958 (0.005) 0.052 (BETA) 0.041 0.22 [26]
rs6065904 (p) 43968058 A 0.202 (0.010) 20.0904 (BETA) 0.023 7.461025
LDL-C DOCK7 1 rs10889353 62890784 A 0.618 (0.012) 0.049 (BETA) 0.017 0.0040 [31]
1 rs10889335 (p) 62732689 A 0.606 (0.018) 0.068 (BETA) 0.018 1.261024
CELSR2, PSRC1,SORT1
1 rs12740374 109619113 T 0.235 (0.003) 20.174 (BETA) 0.021 1.3610216 [26]
PCSK9 1 rs10493178 (n) 55369655 A 0.878 (0.007) 0.177 (BETA) 0.025 4.7610212
APOB 2 rs562338 21141826 A 0.598 (0.009) 20.089 (BETA) 0.017 3.161027 [32]
rs503662 (p) 21267647 T 0.652 (0.010) 20.110 (BETA) 0.018 2.561029
LDLR 19 rs6511720 11063306 T 0.144 (0.002) 20.208 (BETA) 0.038 7.261028 [26]
APOE, APOC1,APOC4, APOC2
19 rs1160985 (n) 50095252 T 0.635 (0.011) 20.166 (BETA) 0.017 7.2610221
To be included in this table, we require a two-tailed P#0.05 after Bonferroni correction for the number of independent loci reported in the NHGRI database (Table S5).We report the association results for the published (index) SNP, unless it is not available. In that case, we report results for a proxy SNP (r2$0.5 with original SNP inHapMap CEU; see Table S5 for additional details).aProxy SNPs are marked with (p). SNPs that have a strong association signal but are not in LD with the published SNP are marked with (n) as potentially novel.bPosition on NCBI build 36.1.cEffect alleles are given on the forward strand. For proxy SNPs, we phased HapMap CEU genotypes for the index and proxy SNPs to determine haplotypes, to be able toassess consistency of the direction of effect.
dFor dichotomous phenotypes, we report odds ratio (OR) and 95% confidence interval (CI); for quantitative traits, we report effect size (beta, in standard deviation units)and standard error (SE).
eP-values are corrected using genomic control.doi:10.1371/journal.pgen.1001300.t003
GWAS of CHD in African Americans
PLoS Genetics | www.plosgenetics.org 6 February 2011 | Volume 7 | Issue 2 | e1001300
Discussion
Most large-scale genetic efforts to identify risk factors for CHD have
focused so far on populations of European ancestry. Given the
prevalence of the disease in African Americans, and the development
of better genotyping platforms that more completely survey common
genetic variation in African-derived genomes [16], it is now both
pertinent and timely to investigate the genetics of CHD in populations
of African ancestry. The CARe Project was launched four years ago
with the specific goal to create a resource for association studies of
various heart-, lung-, and blood-related phenotypes across different
ethnic groups [15]. In this article, we present results from the largest
GWAS to date for CHD and its risk factors in African Americans.
Despite being the largest, the size of our GWAS is modest compared
to that of some European-derived consortia. As a consequence, we
had limited discovery power and did not identify novel loci specifically
associated with CHD or its risk factors that reach genome-wide
significance in our African-American dataset.
We also attempted to replicate in the CARe African-American
participants genetic associations to CHD and its risk factors
previously identified in Caucasians. We could replicate 17 of those
associations; for many of them, this was the first replication in a non-
European-derived population (Table 3). For five of these 17
associations, we showed how cross-ethnic comparisons of genetic
association results may help refine genomic intervals carrying causal
alleles (Figure 2 and Figure S3). There were, however, a large number
of loci originally found in Caucasians that were not replicated in the
CARe meta-analyses presented in this manuscript (Table S11).
Because our sample size was relatively modest, that we used stringent
statistical thresholds to declare replication in order to control our false
positive rate, and that effect sizes could be weaker for given loci across
different ethnic groups, our limited power probably explains why
Figure 2. HDL-C association results in Caucasians (top panel) [26] and in the CARe African Americans (bottom panel) at the FADSlocus. Plots were generated using LocusZoom [33]. Under the top panel, the light blue box corresponds to the chromosomal interval flanked by theleftmost and rightmost SNPs with a r2$0.3 with the index SNP rs174547 in HapMap CEU. In the bottom panel, there is no light blue box because thetop CARe SNPs at this locus, rs1535, is not in strong LD with any markers in HapMap YRI.doi:10.1371/journal.pgen.1001300.g002
GWAS of CHD in African Americans
PLoS Genetics | www.plosgenetics.org 7 February 2011 | Volume 7 | Issue 2 | e1001300
many loci did not replicate in the CARe African Americans.
Alternatively, some of these non-replications could be explained by
the absence of variants within these loci associated with these traits in
African Americans. Our data does not allow us to distinguish these
two possibilities, and larger replication studies in African-American
cohorts will be needed to draw informative conclusions.
Taken together, our results suggest that CHD risk in African
Americans is not influenced by loci with major phenotypic effect
on disease risk, but rather by multiple variants of weak effect, as we
have observed for CHD and other traits in Caucasians. Because
opportunities for replication and meta-analysis with other African-
American cohorts are evolving rapidly, the CARe dataset is an
outstanding public resource that provides a strong base for
discovery of genetic contributors to CHD in non-European-
derived populations.
Materials and Methods
Ethics statementAll participants gave informed written consent. The CARe
project is approved by the ethic committees of the participating
studies and of the Massachusetts Institute of Technology.
Studies
African-American participants for the GWAS were drawn from
five population-based studies: Atherosclerosis Risk in Communi-
ties (ARIC; N = 3,269), Coronary Artery Risk Development in
young Adults (CARDIA; N = 1,209), Cleveland Family Study
(CFS; N = 704), Jackson Heart Study (JHS; N = 2,200), and Multi-
Ethnic Study of Atherosclerosis (MESA; N = 1,737). Although
longitudinal data is available for most participants, only informa-
tion collected at recruitment was considered in this GWAS.
Replication results for top SNP associations were obtained using in
silico or de novo genotyping from four African-American and
African-Caribbean population-based cohorts (Health, Aging,
and Body Composition Study (Health ABC; N = 1,119), National
Health and Nutrition Examination Survey III (NHANES III,
N = 1,720), Jamaica Spanish Town (SPT, N = 1,746) and
Jamaica GXE (N = 969), one nested case-control panel from
the population-based Multiethnic Cohort (MEC, N = 2,184),
and two case-control panels (Cleveland Clinic, N = 620,
and PennCATH, N = 491). A detailed description of all cohorts
and phenotype definitions used in this study is provided in Text
S1.
Table 4. Top novel associations (P#161026) identified using SNP genotype and estimate of local African versus Europeanancestry.
TRAIT SNPCHR(POS)1
Referenceallele
Reference allelefrequency SNP-only
SNP+Estimate oflocal ancestry
Closestgenes7
CARe2 CEU YRI Beta (SE)3 P-value4 Zgeno5 Zloc.anc
6 P-value4
Coronary heartdisease
rs6674681 1 (79493711) T 0.75 0.23 0.88 0.0892(0.1151)
0.44 3.524 24.14 3.861027
rs6753112 2 (231895399) T 0.87 0.31 0.91 20.2459(0.1357)
0.07 23.977 3.625 5.261027 ARMC9
HDL-C rs8078633 17 (559286) C 0.31 1.00 0.18 20.0006(0.0186)
0.98 23.893 4.723 3.661027 APPBP2
Hypertension rs10218356 23 (19168233) A 0.20 0.94 0.04 20.0915(0.0523)
0.08 24.056 3.891 6.561027
LDL-C rs17441606 2 (19431916) A 0.17 0.32 0.11 20.0759(0.0219)
6.261024 24.234 4.021 4.061028 OSR1
rs9306885 2 (19852313) T 0.26 0.72 0.16 20.0329(0.0197)
0.10 24.144 4.321 1.761028
rs6728440 2 (19862827) A 0.96 0.87 1.00 0.0978(0.0446)
0.03 3.527 24.029 5.961028 TTC32
rs7560236 2 (22930288) T 0.06 0 0.08 0.1493(0.0366)
5.561025 4.568 3.804 2.161028
rs6748157 2 (28586865) A 0.86 0.51 0.98 0.03(0.0247)
0.23 3.592 24.062 4.161028 PLB1
Smoking rs7075036 10 (16904816) T 0.69 0.32 0.80 20.1326(0.0296)
8.461026 25.036 2.054 8.061027 RSU1,CUBN
rs11088655 21 (18128360) T 0.41 0.22 0.52 0.0938(0.0275)
6.961024 4.347 3.637 2.461027 C21orf91
rs16982414 21 (28711411) T 0.90 0.99 0.84 20.1646(0.0432)
1.561024 24.375 23.327 6.061027
Global ancestry is included in the model for both methods.1Coordinates are on NCBI build 36.1.2Average frequency for the reference allele across all available African American CARe samples.3Direction of the effect given for the reference allele; SE, standard error.4P-values are scaled using genomic control.5Z-score for the SNP genotype information. A Z-score .0 means that the trait (or the risk to develop the disease) increases with the number of copies of referencealleles.
6Z-score for the local ancestry estimate information. A Z-score .0 means that the trait (or the risk to develop the disease) increases with the number of copies ofEuropean chromosomes.
7Genes in a 200 kb window.doi:10.1371/journal.pgen.1001300.t004
GWAS of CHD in African Americans
PLoS Genetics | www.plosgenetics.org 8 February 2011 | Volume 7 | Issue 2 | e1001300

Genotyping and quality controlsAll discovery samples (GWAS) were genotyped on the Affymetrix
Genome-Wide Human SNP array 6.0 according to the manufacturer’s
protocol. For replication, the MEC samples were genotyped by
Taqman, and the NHANES III, Jamaica SPT, Jamaica GXE,
Cleveland, and UPENN samples were genotyped using Illumina’s
Oligos Pool All (OPA) technology. The Health ABC samples were
genotyped on the Illumina Human1M-Duo BeadChip array as part of
an independent GWAS; SNP results for the replication of the CARe
findings were extracted and analyzed. Several quality control (QC)
filters were applied to the genome-wide genotype data: DNA
concordance checks; sample and SNP genotyping success rate
(.95%, minor allele frequency $1%); sample heterozygosity rate,
identity-by-descent analysis to identify population outliers (Figure S1),
problematic samples, and cryptic relatedness; Mendel errors rate in
CFS and JHS, and SNP association with chemistry plates. For
replication, SNPs and samples with genotyping success rate ,90%
were excluded. Because of the admixed nature of the participants,
SNPs were not removed solely because they departed from Hardy-
Weinberg equilibrium. A detailed description of the quality control
checks applied to the discovery (GWAS) and replication genotyping
data can be found in Text S1.
SNP imputationTo increase coverage and facilitate comparison with other
datasets, we imputed genotype data using MACH v1.0.16 [19].
We built a panel of reference haplotypes using HapMap phase II
CEU and YRI data, and imputed SNP genotypes using all
Affymetrix 6.0 SNPs that passed the QC steps described above.
Using and independent dataset of ,12,000 SNPs genotyped on
the same DNA but with a different platform, we estimated an
allelic concordance rate of 95.6% (Text S1).
Association analysesSNP-only based genetic association analysis of quantitative (HDL-
C, LDL-C, smoking) and dichotomous (coronary heart disease, type-
2 diabetes, hypertension) traits were carried out using linear and
logistic statistical framework, respectively, in PLINK (unrelated
cohorts: ARIC, CARDIA, JHS, MESA, UPENN, Cleveland, MEC,
NHANES III, and Health ABC) or using R scripts that model family
structure (related cohort: CFS) [28]. For the cohorts with genome-
wide genotyping data available, the first ten principal components
were included in each analysis to account for population stratifica-
tion and admixture. The method to estimate local ancestry was
implemented in ANCESTRYMAP and is described in details in Text
S1. To combine allelic and local ancestry information (Table 4), we
calculated a chi-square statistic with two degrees-of-freedom.
Association results were combined across cohorts using an inverse
variance meta-analysis approach as implemented in metal.
URLCARe: http://www.broadinstitute.org/gen_analysis/care/index.
php/Main_Page; MACH: http://www.sph.umich.edu/csg/abecasis/
MACH; METAL: http://www.sph.umich.edu/csg/abecasis/Metal/
index.html; PLINK: http://pngu.mgh.harvard.edu/,purcell/plink.
Supporting Information
Figure S1 Plots of the two main principal components (PC) in the
CARe African-American samples. European-Americans and Niger-
ians samples are used as reference populations. We note that the first
principal component (PC1) captures European vs. African global
ancestry. For CFS, outliers on PC2 all belong to the same large family.
Found at: doi:10.1371/journal.pgen.1001300.s001 (0.25 MB TIF)
Figure S2 Manhattan plots summarizing the meta-analysis
results for the six phenotypes analyzed after double genomic
control scaling. The dashed line highlights genome-wide signifi-
cance (P-value = 561028). The genome-wide significant loci
include 8p23 (chr8), LPL (chr8), LIPC (chr15), LCAT (chr16),
and CETP (chr16) for HDL-C, SLC12A9 (chr7) for hypertension,
and PCSK9 (chr1), CELSR2-PSRC1-SORT1 (chr1), and APOE
(chr19) for LDL-C.
Found at: doi:10.1371/journal.pgen.1001300.s002 (1.27 MB TIF)
Figure S3 Graphical representation of the information summarized
in Table S12. Plots were drawn using LocusZoom [26]. CHD
association results in Caucasians are from Kathiresan et al. [27]. HDL-
C association results in Caucasians are from Kath-
iresan et al. [28]. Under each plot, the light blue box corresponds to
the genomic intervals flanked by the leftmost and rightmost SNPs with
and r2$0.3 with the index SNPs (purple diamond). For the results in
Caucasians, we used LD based on HapMap CEU, and for the results
in African Americans, LD based on HapMap YRI. For the PLTP and
ABCA1 loci, the CARe SNPs (respectively rs6065904 and rs13284054)
define genomic intervals of 0.2 kb using the r2$0.3 threshold, which
appear as light blue lines on the plots.
Found at: doi:10.1371/journal.pgen.1001300.s003 (1.59 MB TIF)
Figure S4 Quantile-quantile (QQ) plots of the meta-analyses
results that take into account local ancestry estimates and SNP
genotypes (Chi-square with two degrees-of-freedom (N = 8,090).
Each black circle represents an observed statistic for genotyped
SNPs only (defined as the 2log10(P-value)) against the corre-
sponding expected statistic. The grey area corresponds to the 90%
confidence intervals calculated empirically using permutations.
The meta-analysis inflation factors are: coronary heart disease
(ls = 0.923), HDL-C (ls = 1.030), hypertension (ls = 1.121), LDL-
C (ls = 1.290), smoking (ls = 1.060), and type-2 diabetes
(ls = 1.109). Data shown is genomic controlled before (for each
study) and after the meta-analysis.
Found at: doi:10.1371/journal.pgen.1001300.s004 (0.26 MB TIF)
Figure S5 Manhattan plots summarizing the meta-analysis
results that take into account local ancestry estimates and SNP
genotypes (two degrees-of-freedom). Results are shown for the six
phenotypes analyzed after double genomic control scaling. The
dashed line highlights genome-wide significance (P-val-
ue = 561028). The genome-wide significant loci include LCAT
(chr16) and CETP (chr16) for HDL-C and PCSK9 (chr1), CELSR2-
PSRC1-SORT1 (chr1), 2p24 (chr2), and APOE (chr19) for LDL-C.
Found at: doi:10.1371/journal.pgen.1001300.s005 (1.23 MB TIF)
Figure S6 Comparison of P-values (-log10 scale) for the meta-
analysis results obtained using SNP genotype-only (x-axis) or SNP
genotype+estimate of local ancestry (y-axis) to compute the test
statistics. Each black circle corresponds to a SNP. In total, results
from ,885,000 genotyped SNPs were available for each method.
The gray line represents perfect correlation (x = y). The horizontal
and vertical dashed lines represent the pre-defined threshold for
genome-wide significance (P-value = 561028).
Found at: doi:10.1371/journal.pgen.1001300.s006 (0.45 MB TIF)
Table S1 Sample exclusion for the CARe Affy6.0 datasets.
Found at: doi:10.1371/journal.pgen.1001300.s007 (0.05 MB
DOC)
Table S2 SNP exclusion for the CARe Affy6.0 datasets.
Found at: doi:10.1371/journal.pgen.1001300.s008 (0.04 MB
DOC)
Table S3 Power calculations for the different phenotypes
analyzed by the CARe Project in this study. The assumptions
GWAS of CHD in African Americans
PLoS Genetics | www.plosgenetics.org 9 February 2011 | Volume 7 | Issue 2 | e1001300
are: an additive inheritance model, an effect allele frequency of
10%, and an alpha threshold of 161026 (which was arbitrary
selected to promote SNPs for replication). We also assume that all
samples belong to a single study; in practice, there is a small loss of
power because of the meta-analysis. For case-control, power
calculations were done using the Genetic Power Calculator
(http://pngu.mgh.harvard.edu/,purcell/gpc/). For quantitative
traits, power calculations were done using Quanto (http://hydra.
usc.edu/gxe/).
Found at: doi:10.1371/journal.pgen.1001300.s009 (0.04 MB
DOC)
Table S4 Inflation factors (ls) for the different phenotypes
analyzed, by cohort and for the corresponding meta-analyses.
Found at: doi:10.1371/journal.pgen.1001300.s010 (0.04 MB
DOC)
Table S5 Coronary heart disease replication results for SNPs
from the CARe meta-analysis.
Found at: doi:10.1371/journal.pgen.1001300.s011 (0.25 MB
DOC)
Table S6 HDL-C replication results for SNPs from the CARe
meta-analysis.
Found at: doi:10.1371/journal.pgen.1001300.s012 (0.21 MB
DOC)
Table S7 Hypertension replication results for SNPs from the
CARe meta-analysis.
Found at: doi:10.1371/journal.pgen.1001300.s013 (0.21 MB
DOC)
Table S8 LDL-C replication results for SNPs from the CARe
meta-analysis.
Found at: doi:10.1371/journal.pgen.1001300.s014 (0.22 MB
DOC)
Table S9 Type-2 diabetes replication results for SNPs from the
CARe meta-analysis.
Found at: doi:10.1371/journal.pgen.1001300.s015 (0.10 MB
DOC)
Table S10 Loci associated at genome-wide significance level
with CHD or its risk factors in Caucasians (data retrieved from the
NHGRI database; http://www.genome.gov/26525384).
Found at: doi:10.1371/journal.pgen.1001300.s016 (0.30 MB
DOC)
Table S11 CARe meta-analysis association results (including
data from ARIC, CARDIA, CFS, JHS, and MESA) for the SNPs
associated with coronary heart disease and its risk factors in
Caucasians. In yellow, we highlight the five loci where association
signals in African Americans define smaller genomic intervals to
search for causal allele(s).
Found at: doi:10.1371/journal.pgen.1001300.s017 (0.32 MB
DOC)
Table S12 Linkage disequilibrium-based genomic intervals of
loci previously associated with coronary heart disease and HDL-C
in Caucasians using the CARe datasets.
Found at: doi:10.1371/journal.pgen.1001300.s018 (0.05 MB
DOC)
Text S1 Supporting information.
Found at: doi:10.1371/journal.pgen.1001300.s019 (0.27 MB
DOC)
Acknowledgments
The authors wish to acknowledge the support of the National Heart, Lung,
and Blood Institute and the contributions of the research institutions, study
investigators, field staff, and study participants in creating this resource for
biomedical research.
Author Contributions
Conceived and designed the experiments: GL TY KGE SK EB. Performed
the experiments: GL CDP KGE. Analyzed the data: GL CDP KGE SK
EB. Contributed reagents/materials/analysis tools: GL CDP TY KGE HA
EJB FB DWB AC AD DNF ARF MF TF EF CAH JH TBH SLH SRH
BEH JNH BJK SBK EL ML MER CAM JBM YAM THM ABN CHNC
DNP GJP NP WSP BMP ANQ LQ DJR SR MPR APR SSR JIR YL PS
DSS WHWT HAT RPT RSV KMW RW JGW RRF SBG SK EB. Wrote
the paper: GL EB.
References
1. NHLBI (2009) 2009 NHLBI Morbidity and Mortality Chart Book.
2. Thomas J, Thomas DJ, Pearson T, Klag M, Mead L (1997) Cardiovascular
disease in African American and white physicians: the Meharry Cohort and
Meharry-Hopkins Cohort Studies. J Health Care Poor Underserved 8: 270–283;
discussion 284.
3. Jones DW, Chambless LE, Folsom AR, Heiss G, Hutchinson RG, et al. (2002)
Risk factors for coronary heart disease in African Americans: the atherosclerosis
risk in communities study, 1987–1997. Arch Intern Med 162: 2565–2571.
4. Cooper R, Rotimi C (1997) Hypertension in blacks. Am J Hypertens 10:
804–812.
5. Cooper RS, Zhu X (2001) Racial differences and the genetics of hypertension.
Curr Hypertens Rep 3: 19–24.
6. Katzmarzyk PT, Perusse L, Rice T, Gagnon J, Skinner JS, et al. (2000) Familial
resemblance for coronary heart disease risk: the HERITAGE Family Study.
Ethn Dis 10: 138–147.
7. WTCCC (2007) Wellcome Trust Case Control Consortium. Genome-wide
association study of 14,000 cases of seven common diseases and 3,000 shared
controls. Nature 447: 661–678.
8. Erdmann J, Grosshennig A, Braund PS, Konig IR, Hengstenberg C, et al. (2009)
New susceptibility locus for coronary artery disease on chromosome 3q22.3. Nat
Genet 41: 280–282.
9. Helgadottir A, Thorleifsson G, Manolescu A, Gretarsdottir S, Blondal T, et al.
(2007) A common variant on chromosome 9p21 affects the risk of myocardial
infarction. Science 316: 1491–1493.
10. Kathiresan S, Voight BF, Purcell S, Musunuru K, Ardissino D, et al. (2009)
Genome-wide association of early-onset myocardial infarction with single
nucleotide polymorphisms and copy number variants. Nat Genet 41: 334–341.
11. McPherson R, Pertsemlidis A, Kavaslar N, Stewart A, Roberts R, et al. (2007) A
common allele on chromosome 9 associated with coronary heart disease. Science
316: 1488–1491.
12. Samani NJ, Erdmann J, Hall AS, Hengstenberg C, Mangino M, et al. (2007)
Genomewide association analysis of coronary artery disease. N Engl J Med 357:
443–453.
13. Willer CJ, Sanna S, Jackson AU, Scuteri A, Bonnycastle LL, et al. (2008) Newly
identified loci that influence lipid concentrations and risk of coronary artery
disease. Nat Genet 40: 161–169.
14. Gudbjartsson DF, Bjornsdottir US, Halapi E, Helgadottir A, Sulem P, et al.
(2009) Sequence variants affecting eosinophil numbers associate with asthma
and myocardial infarction. Nat Genet 41: 342–347.
15. Musunuru K, Lettre G, Young T, Farlow DN, Pirruccello JP, et al. (2010)
Candidate gene association resource (CARe): design, methods, and proof of
concept. Circ Cardiovasc Genet 3: 267–275.
16. Korn JM, Kuruvilla FG, McCarroll SA, Wysoker A, Nemesh J, et al. (2008)
Integrated genotype calling and association analysis of SNPs, common copy
number polymorphisms and rare CNVs. Nat Genet 40: 1253–1260.
17. Price AL, Patterson NJ, Plenge RM, Weinblatt ME, Shadick NA, et al. (2006)
Principal components analysis corrects for stratification in genome-wide
association studies. Nat Genet 38: 904–909.
18. Li Y, Willer C, Sanna S, Abecasis G (2009) Genotype imputation. Annu Rev
Genomics Hum Genet 10: 387–406.
19. Kang SJ, Chiang CW, Palmer CD, Tayo BO, Lettre G, et al. (2010) Genome-
wide association of anthropometric traits in African- and African-derived
populations. Hum Mol Genet 19: 2725–2738.
20. Purcell S, Neale B, Todd-Brown K, Thomas L, Ferreira MA, et al. (2007)
PLINK: a tool set for whole-genome association and population-based linkage
analyses. Am J Hum Genet 81: 559–575.
21. Chen MH, Yang Q (2009) GWAF: an R package for genome-wide association
analyses with family data. Bioinformatics.
22. Willer CJ, Li Y, Abecasis GR (2010) METAL: fast and efficient meta-analysis of
genomewide association scans. Bioinformatics 26: 2190–2191.
GWAS of CHD in African Americans
PLoS Genetics | www.plosgenetics.org 10 February 2011 | Volume 7 | Issue 2 | e1001300
23. Hindorff LA, Sethupathy P, Junkins HA, Ramos EM, Mehta JP, et al. (2009)
Potential etiologic and functional implications of genome-wide association locifor human diseases and traits. Proc Natl Acad Sci U S A 106: 9362–9367.
24. Adeyemo A, Gerry N, Chen G, Herbert A, Doumatey A, et al. (2009) A
genome-wide association study of hypertension and blood pressure in AfricanAmericans. PLoS Genet 5: e1000564. doi:10.1371/journal.pgen.1000564.
25. Helgason A, Palsson S, Thorleifsson G, Grant SF, Emilsson V, et al. (2007)Refining the impact of TCF7L2 gene variants on type 2 diabetes and adaptive
evolution. Nat Genet 39: 218–225.
26. Kathiresan S, Willer CJ, Peloso GM, Demissie S, Musunuru K, et al. (2009)Common variants at 30 loci contribute to polygenic dyslipidemia. Nat Genet 41:
56–65.27. Patterson N, Hattangadi N, Lane B, Lohmueller KE, Hafler DA, et al. (2004)
Methods for high-density admixture mapping of disease genes. Am J HumGenet 74: 979–1000.
28. Chen MH, Yang Q (2010) GWAF: an R package for genome-wide association
analyses with family data. Bioinformatics 26: 580–581.
29. Zeggini E, Scott LJ, Saxena R, Voight BF, Marchini JL, et al. (2008) Meta-
analysis of genome-wide association data and large-scale replication identifies
additional susceptibility loci for type 2 diabetes. Nat Genet 40: 638–645.
30. Teslovich TM, Musunuru K, Smith AV, Edmondson AC, Stylianou IM, et al.
(2010) Biological, clinical and population relevance of 95 loci for blood lipids.
Nature 466: 707–713.
31. Aulchenko YS, Ripatti S, Lindqvist I, Boomsma D, Heid IM, et al. (2009) Loci
influencing lipid levels and coronary heart disease risk in 16 European
population cohorts. Nat Genet 41: 47–55.
32. Kathiresan S, Melander O, Guiducci C, Surti A, Burtt NP, et al. (2008) Six new
loci associated with blood low-density lipoprotein cholesterol, high-density
lipoprotein cholesterol or triglycerides in humans. Nat Genet 40: 189–197.
33. Pruim RJ, Welch RP, Sanna S, Teslovich TM, Chines PS, et al. (2010)
LocusZoom: regional visualization of genome-wide association scan results.
Bioinformatics 26: 2336–2337.
GWAS of CHD in African Americans
PLoS Genetics | www.plosgenetics.org 11 February 2011 | Volume 7 | Issue 2 | e1001300