Genome-wide association study of asthma identifies RAD50-IL13 and HLA-DR/DQ regions
16
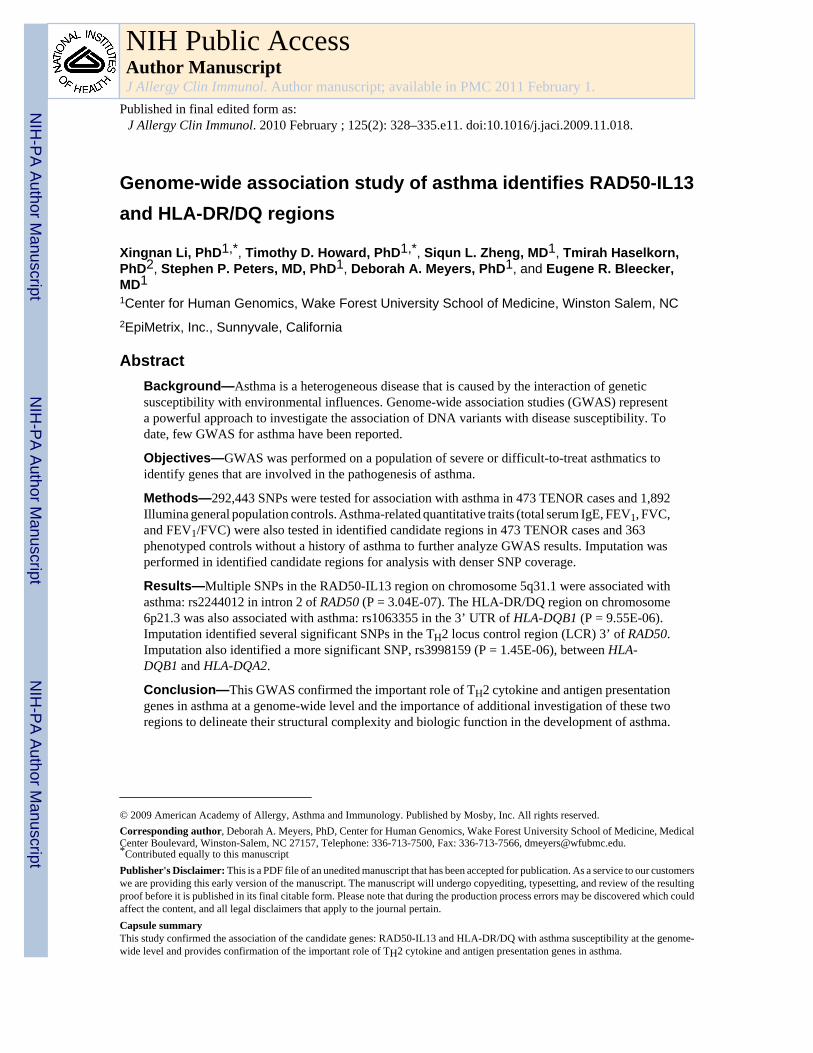
Genome-wide association study of asthma identifies RAD50-IL13 and HLA-DR/DQ regions Xingnan Li, PhD 1,* , Timothy D. Howard, PhD 1,* , Siqun L. Zheng, MD 1 , Tmirah Haselkorn, PhD 2 , Stephen P. Peters, MD, PhD 1 , Deborah A. Meyers, PhD 1 , and Eugene R. Bleecker, MD 1 1 Center for Human Genomics, Wake Forest University School of Medicine, Winston Salem, NC 2 EpiMetrix, Inc., Sunnyvale, California Abstract Background—Asthma is a heterogeneous disease that is caused by the interaction of genetic susceptibility with environmental influences. Genome-wide association studies (GWAS) represent a powerful approach to investigate the association of DNA variants with disease susceptibility. To date, few GWAS for asthma have been reported. Objectives—GWAS was performed on a population of severe or difficult-to-treat asthmatics to identify genes that are involved in the pathogenesis of asthma. Methods—292,443 SNPs were tested for association with asthma in 473 TENOR cases and 1,892 Illumina general population controls. Asthma-related quantitative traits (total serum IgE, FEV 1 , FVC, and FEV 1 /FVC) were also tested in identified candidate regions in 473 TENOR cases and 363 phenotyped controls without a history of asthma to further analyze GWAS results. Imputation was performed in identified candidate regions for analysis with denser SNP coverage. Results—Multiple SNPs in the RAD50-IL13 region on chromosome 5q31.1 were associated with asthma: rs2244012 in intron 2 of RAD50 (P = 3.04E-07). The HLA-DR/DQ region on chromosome 6p21.3 was also associated with asthma: rs1063355 in the 3’ UTR of HLA-DQB1 (P = 9.55E-06). Imputation identified several significant SNPs in the T H 2 locus control region (LCR) 3’ of RAD50. Imputation also identified a more significant SNP, rs3998159 (P = 1.45E-06), between HLA- DQB1 and HLA-DQA2. Conclusion—This GWAS confirmed the important role of T H 2 cytokine and antigen presentation genes in asthma at a genome-wide level and the importance of additional investigation of these two regions to delineate their structural complexity and biologic function in the development of asthma. © 2009 American Academy of Allergy, Asthma and Immunology. Published by Mosby, Inc. All rights reserved. Corresponding author, Deborah A. Meyers, PhD, Center for Human Genomics, Wake Forest University School of Medicine, Medical Center Boulevard, Winston-Salem, NC 27157, Telephone: 336-713-7500, Fax: 336-713-7566, [email protected]. * Contributed equally to this manuscript Publisher's Disclaimer: This is a PDF file of an unedited manuscript that has been accepted for publication. As a service to our customers we are providing this early version of the manuscript. The manuscript will undergo copyediting, typesetting, and review of the resulting proof before it is published in its final citable form. Please note that during the production process errors may be discovered which could affect the content, and all legal disclaimers that apply to the journal pertain. Capsule summary This study confirmed the association of the candidate genes: RAD50-IL13 and HLA-DR/DQ with asthma susceptibility at the genome- wide level and provides confirmation of the important role of T H 2 cytokine and antigen presentation genes in asthma. NIH Public Access Author Manuscript J Allergy Clin Immunol. Author manuscript; available in PMC 2011 February 1. Published in final edited form as: J Allergy Clin Immunol. 2010 February ; 125(2): 328–335.e11. doi:10.1016/j.jaci.2009.11.018. NIH-PA Author Manuscript NIH-PA Author Manuscript NIH-PA Author Manuscript
Transcript of Genome-wide association study of asthma identifies RAD50-IL13 and HLA-DR/DQ regions
Genome-wide association study of asthma identifies RAD50-IL13and HLA-DR/DQ regions
Xingnan Li, PhD1,*, Timothy D. Howard, PhD1,*, Siqun L. Zheng, MD1, Tmirah Haselkorn,PhD2, Stephen P. Peters, MD, PhD1, Deborah A. Meyers, PhD1, and Eugene R. Bleecker,MD11Center for Human Genomics, Wake Forest University School of Medicine, Winston Salem, NC2EpiMetrix, Inc., Sunnyvale, California
AbstractBackground—Asthma is a heterogeneous disease that is caused by the interaction of geneticsusceptibility with environmental influences. Genome-wide association studies (GWAS) representa powerful approach to investigate the association of DNA variants with disease susceptibility. Todate, few GWAS for asthma have been reported.
Objectives—GWAS was performed on a population of severe or difficult-to-treat asthmatics toidentify genes that are involved in the pathogenesis of asthma.
Methods—292,443 SNPs were tested for association with asthma in 473 TENOR cases and 1,892Illumina general population controls. Asthma-related quantitative traits (total serum IgE, FEV1, FVC,and FEV1/FVC) were also tested in identified candidate regions in 473 TENOR cases and 363phenotyped controls without a history of asthma to further analyze GWAS results. Imputation wasperformed in identified candidate regions for analysis with denser SNP coverage.
Results—Multiple SNPs in the RAD50-IL13 region on chromosome 5q31.1 were associated withasthma: rs2244012 in intron 2 of RAD50 (P = 3.04E-07). The HLA-DR/DQ region on chromosome6p21.3 was also associated with asthma: rs1063355 in the 3’ UTR of HLA-DQB1 (P = 9.55E-06).Imputation identified several significant SNPs in the TH2 locus control region (LCR) 3’ of RAD50.Imputation also identified a more significant SNP, rs3998159 (P = 1.45E-06), between HLA-DQB1 and HLA-DQA2.
Conclusion—This GWAS confirmed the important role of TH2 cytokine and antigen presentationgenes in asthma at a genome-wide level and the importance of additional investigation of these tworegions to delineate their structural complexity and biologic function in the development of asthma.
© 2009 American Academy of Allergy, Asthma and Immunology. Published by Mosby, Inc. All rights reserved.Corresponding author, Deborah A. Meyers, PhD, Center for Human Genomics, Wake Forest University School of Medicine, MedicalCenter Boulevard, Winston-Salem, NC 27157, Telephone: 336-713-7500, Fax: 336-713-7566, [email protected].*Contributed equally to this manuscriptPublisher's Disclaimer: This is a PDF file of an unedited manuscript that has been accepted for publication. As a service to our customerswe are providing this early version of the manuscript. The manuscript will undergo copyediting, typesetting, and review of the resultingproof before it is published in its final citable form. Please note that during the production process errors may be discovered which couldaffect the content, and all legal disclaimers that apply to the journal pertain.Capsule summaryThis study confirmed the association of the candidate genes: RAD50-IL13 and HLA-DR/DQ with asthma susceptibility at the genome-wide level and provides confirmation of the important role of TH2 cytokine and antigen presentation genes in asthma.
NIH Public AccessAuthor ManuscriptJ Allergy Clin Immunol. Author manuscript; available in PMC 2011 February 1.
Published in final edited form as:J Allergy Clin Immunol. 2010 February ; 125(2): 328–335.e11. doi:10.1016/j.jaci.2009.11.018.
NIH
-PA Author Manuscript
NIH
-PA Author Manuscript
NIH
-PA Author Manuscript

KeywordsAsthma; GWAS; RAD50; IL13; HLA-DQB1; TENOR
INTRODUCTIONAsthma is a complex disease that is caused by the interaction of genetic susceptibility withenvironmental influences. Genome-wide linkage studies, candidate-gene association studies,and genome-wide association studies (GWAS) represent three major approaches to investigatethe association between genetic variants and disease development.
Genome-wide linkage studies have consistently identified regions linked to asthma or asthma-related traits on chromosome 2q, 5q, 6p, 12q, and 13q [1]. The most highly replicated regionswith obvious candidate genes are chromosome 5q31-33 (including interleukin (IL)5, IL13,IL4, CD14, and adrenergic beta-2-receptor (ADRB2)) and 6p21 (including lymphotoxin alpha(LTA or TNFB), tumor necrosis factor (TNF), major histocompatibility complex, class II, DQbeta 1 (HLA-DQB1), and DR beta 1 (HLA-DRB1)) [2]. In addition, a recent meta-analysis ofgenome-wide linkage studies of asthma, bronchial hyperresponsiveness (BHR), positiveallergen skin prick test (SPT), and total immunoglobulin E (IgE) identified overlapping regionsfor multiple phenotypes on chromosomes 5q and 6p as well as 3p and 7p [3]. Unfortunately,genome-wide linkage studies can only identify genes with relative strong effects in broadregions that include many genes. Positional cloning studies have identified six genes forasthma: a disintegrin and metalloprotease domain 33 (ADAM33) on chromosome 20p13 [4],dipeptidyl-peptidase 10 (DPP10) on 2q14.1 [5], PHD finger protein 11 (PHF11) on 13q14.11[6], neuropeptide S receptor 1 (NPSR1 or GPRA) on 7p14.3 [7], major histocompatibilitycomplex, class I, G (HLA-G) on 6p21.3 [8], and cytoplasmic FMR1 interacting protein 2(CYFIP2) on 5q33.3 [9].
Candidate-gene association studies have identified over 100 genes for asthma and asthma-related traits [2,10,11]. Although candidate-gene association studies have identified manygenes, only a few have been replicated extensively. Thus, only 14 genes including genes on5q and 6p (ADRB2, interleukin 4 receptor (IL4R), HLA-DRB1, IL13, CD14, TNF, membrane-spanning 4-domains, subfamily A, member 2 (MS4A2 or FCER1B), IL4, ADAM33, signaltransducer and activator of transcription 6, interleukin-4 induced (STAT6), IL10, HLA-DQB1, glutathione S-transferase pi 1 (GSTP1), and LTA) that have been replicated in morethan 20 independent studies [10]. Even for highly replicated genes, replication might be dueto ‘winner’s bias’ and/or loose replication standard (gene as a unit and related phenotypes).
A GWAS is a hypothesis-free approach able to identify novel genes with mild/moderate effectsand, thus has become the best approach for studying association between genes and commondisease phenotypes. To date, only four GWAS have been performed for asthma and asthma-related traits [12]. The first GWAS of childhood asthma identified ORM1-like 3 (ORMDL3)on chromosome 17q12 [13]. The second GWAS of serum YKL-40 levels identified chitinase3-like 1 (CHI3L1) on 1q32 [14]. The third GWAS was for a related trait, total serum IgE levels,and the most significant SNPs are in the Fc fragment of IgE, high affinity I, receptor for alphapolypeptide gene (FCER1A) on chromosome 1q23 and the second highest region observed wasRAD50 on 5q31 [15]. The fourth GWAS of childhood asthma indicated phosphodiesterase 4D,cAMP-specific (phosphodiesterase E3 dunce homolog, Drosophila) (PDE4D) on chromosome5q12 [16].
In this study, we performed GWAS of asthma in The Epidemiology and Natural History ofAsthma: Outcomes and Treatment Regimens (TENOR) population of severe or difficult to
Li et al. Page 2
J Allergy Clin Immunol. Author manuscript; available in PMC 2011 February 1.
NIH
-PA Author Manuscript
NIH
-PA Author Manuscript
NIH
-PA Author Manuscript

treat asthmatics to search for novel genes and to confirm previously identified genes involvedin asthma. The purpose of the TENOR study was to investigate the natural history of asthmain a large cohort of well characterized asthmatics with severe or difficult to treat asthma; notreatment intervention was involved and patients continued to be treated by their asthmaspecialist [17–19].
METHODSStudy subjects
The TENOR study was a multi-center observational and longitudinal cohort study of 4,756asthmatics described as “severe or difficult-to-treat” by their physicians, sponsored byGenentech and Novartis [17]. Subjects were included if they had physician-characterizeddifficult-to-treat asthma, and met additional criteria based on frequency of urgent care visitsand/or the use of multiple controller medications. The clinical sites from the original TENORstudy were contacted and invited to participate in this study. Sites that agreed were mailedOragene DNA saliva collection kits (DNA Genotek, Inc), labeled with the TENOR participantID. Sites then mailed the kits to participating individuals, who sent their collected samples tothe Center for Human Genomics at Wake Forest University School of Medicine. This processwas required to maintain anonymity between investigators at Wake Forest University and thestudy participants. Unfortunately the TENOR study had ended (end of 2004) before this projectstarted so it was difficult to re-contact participants. 607 samples had sufficient DNA forsuccessful SNP genotyping. Table 1 shows the demographic data for the TENOR cases andthe two control populations. The TENOR asthmatics genotyped were similar in characteristicsto the larger TENOR cohort.
General population controls were obtained using the Illumina iControlDB client to downloadgenotypes for 3,294 Caucasian individuals with genotype data available from any of the threeavailable HumanHap550k products (v1, v3, and −2v3). As shown in Table 1, only age andgender data are available. Additional control samples for asthma-related quantitative traits wereobtained from a separate GWAS for asthma. These 363 phenotyped controls had no personalor family history of asthma and had normal pulmonary function including lack of bronchialhyperresponsiveness or bronchodilator reversibility. Testing also included measures of atopyincluding total serum IgE levels (Table 1). HapMap samples (N = 262) to be used for geneticancestry check were also downloaded from the iControlDB database (Illumina, Inc.) afterselecting the HumanHap300_v1 genotyping product.
DNA was isolated using the protocol described by DNA Genotek, and SNP genotyping wasperformed using the Illumina HumanCNV370 BeadChip. The samples were clustered by firstapplying Illumina’s cluster definition, removing samples with call rates less than 0.90, andthen re-clustering using the samples themselves.
Statistical analysisPLINK (version 1.06, URL: http://pngu.mgh.harvard.edu/purcell/plink/) [20] was the mainsoftware used to perform statistical analysis unless otherwise mentioned.
Quality control (QC) was applied to cases and controls separately since they were genotypedusing slightly different Illumina products. Genetic ancestry of the TENOR cases wasdetermined using the HapMap 300k dataset as a reference. Fixed 3 groups clustering andpairwise population concordance (PPC) of 1.0E-05 based on identity-by-state (IBS) were usedto cross-validate ethnic group identity. Subjects were removed if they 1) were not of Europeanwhite descent, 2) had low genotyping call rates (< 95%), 3) were discrepant or ambiguous forgenetic sex (heterozygous haploid genotype percentage ≥ 0.01 or X chromosome
Li et al. Page 3
J Allergy Clin Immunol. Author manuscript; available in PMC 2011 February 1.
NIH
-PA Author Manuscript
NIH
-PA Author Manuscript
NIH
-PA Author Manuscript

homozygosity F ≥ 0.9), 4) failed the cryptic relatedness check (PI_HAT > 0.125), 5) weredetected as an outlier (> 6 standard deviation for the first or se cond principal component).After subjects meeting these criteria were deleted, SNPs were deleted if the call rates were low(95%) or were inconsistent with Hardy-Weinberg Equilibrium (HWE) (P < 10E-04). QC wasthen applied on the subjects and SNPs of merged case-control dataset as done separately. SNPswere also deleted if the minor allele frequency (MAF) was less than 0.05 in cases and controlsor the HWE P value was less than 0.01 in controls only.
Asthma susceptibility was analyzed by comparing the non-Hispanic white TENOR cases tothe general population Illumina controls. To reduce population stratification, four controls werematched with every one case based on pairwise IBS. Principal components were generatedusing principal components analysis (PCA) in EIGENSTRAT (version 3.0, URL:http://genepath.med.harvard.edu/~reich/Software.htm) [21]. Sex, age, and significantprincipal components were used as covariates in the logistic additive model. Genomic control(GC) was applied on P values to reduce population stratification further [22]. A linear modelwas analyzed in GWAS-identified candidate regions in 473 TENOR cases and 363 phenotypedcontrols for asthma-related quantitative traits (total serum IgE, % predicted FEV1, FVC, andFEV1/FVC).
Haploview (URL: http://www.broad.mit.edu/mpg/haploview/) was used to generate linkagedisequilibrium plots [23]. 95% confidence intervals on D’ was used to define blocks [24].SNAP (version 2.0, URL: http://www.broad.mit.edu/mpg/snap/) was used to generate theassociation plots [25]. Imputation was performed based on HapMap II CEU genotype data[26] using MACH (version 1.0, URL:http://www.sph.umich.edu/csg/abecasis/MaCH/index.html) [27]. Association of candidateSNPs with nearby gene expression data in lymphocytes was performed based on GENEVARdataset (URL: http://www.sanger.ac.uk/humgen/genevar/) [28] by using WGAViewer [29].
RESULTSA total of 607 TENOR cases were genotyped with the HumanCNV370 BeadChip. Afterremoval of non-white samples (see Figure E1 in the Online Repository) and removal based onthe QC criteria described above, data from 474 asthmatics were carried forward to analysis.Of the 3,294 Illumina Caucasian controls downloaded from iControldb, 3,141 Illumina controlspassed QC. After merging 474 TENOR cases with 3,141 Illumina controls and evaluating thecombined QC metrics, 473 cases and 3,106 controls were retained. To reduce populationstratification, four controls were matched with every one case based on pairwise IBS, thus 473cases and 1,892 Illumina controls were used for GWAS (see Table I for demographics andFigure E2 in the Online Repository). After QC analysis of the 318,075 common SNPs, 292,443SNPs were retained for the GWAS.
GWAS of asthma was performed on 292,443 SNPs of 473 TENOR cases and 1,892 Illuminacontrols with sex, age, and significant principal components as covariates in the logisticadditive model (see Figure 1). Genomic control (GC) was applied to P values to reducepopulation stratification (genomic inflation factor = 1.073 and 1.000 before and afteradjustment, see Figure E3 in the Online Repository). In total, 248 SNPs had GC-adjusted Pvalues ≤ 1.0E-03 (see Table E1 in the Online Repository). Focusing on SNPs with a GC-adjusted P values ≤ 1.0E-04 and at least two neighboring SNPs (+/− 100 kb) with GC-adjustedP values ≤ 1.0E-03, six regions were identified: RAD50-IL13 on chromosome 5q31.1, HLA-DR/DQ on 6p21.32, low density lipoprotein-related protein 1B (LRP1B) on 2q22.1-22.2,sorting nexin 10 (SNX10) on 7p15.2, carbonic anhydrase X (CA10) on 17q21.33, and potassiuminwardly-rectifying channel, subfamily J, member 2 (KCNJ2) 17q24.3 (see Figure 1 and TableE1 in the Online Repository).
Li et al. Page 4
J Allergy Clin Immunol. Author manuscript; available in PMC 2011 February 1.
NIH
-PA Author Manuscript
NIH
-PA Author Manuscript
NIH
-PA Author Manuscript
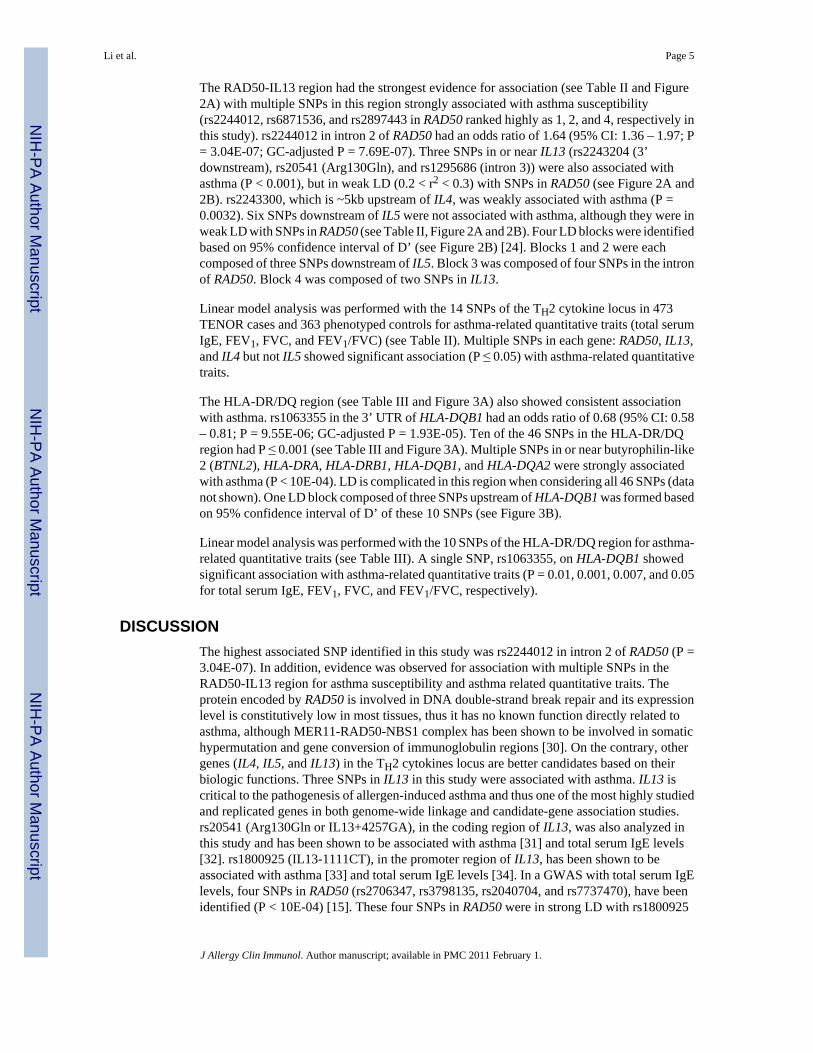
The RAD50-IL13 region had the strongest evidence for association (see Table II and Figure2A) with multiple SNPs in this region strongly associated with asthma susceptibility(rs2244012, rs6871536, and rs2897443 in RAD50 ranked highly as 1, 2, and 4, respectively inthis study). rs2244012 in intron 2 of RAD50 had an odds ratio of 1.64 (95% CI: 1.36 – 1.97; P= 3.04E-07; GC-adjusted P = 7.69E-07). Three SNPs in or near IL13 (rs2243204 (3’downstream), rs20541 (Arg130Gln), and rs1295686 (intron 3)) were also associated withasthma (P < 0.001), but in weak LD (0.2 < r2 < 0.3) with SNPs in RAD50 (see Figure 2A and2B). rs2243300, which is ~5kb upstream of IL4, was weakly associated with asthma (P =0.0032). Six SNPs downstream of IL5 were not associated with asthma, although they were inweak LD with SNPs in RAD50 (see Table II, Figure 2A and 2B). Four LD blocks were identifiedbased on 95% confidence interval of D’ (see Figure 2B) [24]. Blocks 1 and 2 were eachcomposed of three SNPs downstream of IL5. Block 3 was composed of four SNPs in the intronof RAD50. Block 4 was composed of two SNPs in IL13.
Linear model analysis was performed with the 14 SNPs of the TH2 cytokine locus in 473TENOR cases and 363 phenotyped controls for asthma-related quantitative traits (total serumIgE, FEV1, FVC, and FEV1/FVC) (see Table II). Multiple SNPs in each gene: RAD50, IL13,and IL4 but not IL5 showed significant association (P ≤ 0.05) with asthma-related quantitativetraits.
The HLA-DR/DQ region (see Table III and Figure 3A) also showed consistent associationwith asthma. rs1063355 in the 3’ UTR of HLA-DQB1 had an odds ratio of 0.68 (95% CI: 0.58– 0.81; P = 9.55E-06; GC-adjusted P = 1.93E-05). Ten of the 46 SNPs in the HLA-DR/DQregion had P ≤ 0.001 (see Table III and Figure 3A). Multiple SNPs in or near butyrophilin-like2 (BTNL2), HLA-DRA, HLA-DRB1, HLA-DQB1, and HLA-DQA2 were strongly associatedwith asthma (P < 10E-04). LD is complicated in this region when considering all 46 SNPs (datanot shown). One LD block composed of three SNPs upstream of HLA-DQB1 was formed basedon 95% confidence interval of D’ of these 10 SNPs (see Figure 3B).
Linear model analysis was performed with the 10 SNPs of the HLA-DR/DQ region for asthma-related quantitative traits (see Table III). A single SNP, rs1063355, on HLA-DQB1 showedsignificant association with asthma-related quantitative traits (P = 0.01, 0.001, 0.007, and 0.05for total serum IgE, FEV1, FVC, and FEV1/FVC, respectively).
DISCUSSIONThe highest associated SNP identified in this study was rs2244012 in intron 2 of RAD50 (P =3.04E-07). In addition, evidence was observed for association with multiple SNPs in theRAD50-IL13 region for asthma susceptibility and asthma related quantitative traits. Theprotein encoded by RAD50 is involved in DNA double-strand break repair and its expressionlevel is constitutively low in most tissues, thus it has no known function directly related toasthma, although MER11-RAD50-NBS1 complex has been shown to be involved in somatichypermutation and gene conversion of immunoglobulin regions [30]. On the contrary, othergenes (IL4, IL5, and IL13) in the TH2 cytokines locus are better candidates based on theirbiologic functions. Three SNPs in IL13 in this study were associated with asthma. IL13 iscritical to the pathogenesis of allergen-induced asthma and thus one of the most highly studiedand replicated genes in both genome-wide linkage and candidate-gene association studies.rs20541 (Arg130Gln or IL13+4257GA), in the coding region of IL13, was also analyzed inthis study and has been shown to be associated with asthma [31] and total serum IgE levels[32]. rs1800925 (IL13-1111CT), in the promoter region of IL13, has been shown to beassociated with asthma [33] and total serum IgE levels [34]. In a GWAS with total serum IgElevels, four SNPs in RAD50 (rs2706347, rs3798135, rs2040704, and rs7737470), have beenidentified (P < 10E-04) [15]. These four SNPs in RAD50 were in strong LD with rs1800925
Li et al. Page 5
J Allergy Clin Immunol. Author manuscript; available in PMC 2011 February 1.
NIH
-PA Author Manuscript
NIH
-PA Author Manuscript
NIH
-PA Author Manuscript

(0.7 < r2 < 0.8) and in weak LD with rs20541 (0.2 < r2 < 0.3) in IL13 [15]. These results areconsistent with the results of this study; since many of the TENOR asthmatics were recruitedfrom allergist’s offices and the population has increased IgE levels [18]. Since the actualfunctional SNPs can-not be determined purely by their P values, it is difficult to dissect theassociation data of RAD50 from IL13 in this study or other genetic studies due to the degreeof LD present in this chromosomal region.
In a transgenic mouse study, a TH2 locus control region (LCR) was identified as the 25 kbfragment at the 3’ end of Rad50 [35]. An LCR is defined experimentally as regulating theexpression of linked genes in a copy number dependent and tissue-specific manner. The TH2LCR is involved in the chromatin configuration to re-organize promoters of IL4, IL5, IL13 inproximity and co-regulation of TH2 cytokine expression [36]. Seven Rad50 DNase Ihypersensitive sites (RHS1-7) were identified, where RHS4-7 formed the core of the LCR[37]. LCR-C (RHS7) and LCR-B (RHS6) were possible TH2 cytokine expression enhancers;LCR-A (RHS6) and LCR-O (RHS5) were likely insulators [38]. RHS7 is essential for TH2cytokine expression by showing TH2 specific demethylation after allergen stimulation andintrachromosomal interactions between LCR and the promoters of TH2 cytokines [39].Furthermore, RHS6, Rad50 promoter (RHS2), and IL5 promoter interacted with interferongamma (Ifng) on a different chromosome, which suggests an interchromosomal regulation ofthe expression of TH1/TH2 cytokines [40]. Although all the above experiments were done inmouse, the RAD50 sequence is highly conserved in the LCR between human and mouse. Withimputation, multiple significant SNPs were found in the LCR (see Table E2 in the OnlineRepository): rs3798135 (P = 1.49E-06, in RHS5/LCR-O), rs12653750 (P = 1.49E-06, in RHS6/LCR-A), rs2040704 (P = 1.33E-06, in RHS6/LCR-B), and rs2240032 (P = 6.68E-06, in RHS7/LCR-C). The association of rs2244012 with the expression levels of IL13 in lymphocytes fromwhite adults based on GENEVAR dataset was not significant (P = 0.176), but may be due tosmall sample size.
Since both a previous GWAS for total serum IgE levels and our GWAS of asthma identifiedRAD50, it appears to be a new candidate gene for asthma. Although it is still possible the signalfrom RAD50 is purely due to its LD with the promoter of IL13, RAD50 deserves to be carefullystudied when considering TH2 cytokine locus.
HLA-DR/DQ also showed consistent association with asthma, for example, rs1063355 in the3’ UTR of HLA-DQB1 (P = 9.55E-06), rs2239804 in intron of HLA-DRA (P = 2.80E-05), andrs2516049 5’ upstream of HLA-DRB1 (P = 2.62E-05). HLA-DR/DQ is part of the HLA classII region, which is one of the most gene/variant dense regions in the human genome and isassociated with many diseases [41]. HLA-DQB1 and HLA-DRB1 have been shown to beassociated with asthma in multiple independent studies [42–44]. Genetic variants in the HLA-DR/DQ region have also been shown to be highly associated with HLA-DR/DQ geneexpression, indicating that the association of HLA-DR/DQ with disease might be due to geneexpression levels in addition to antigen recognition [45,46]. The association of rs2516049 withasthma in our study and with the expression levels of HLA-DRB1 (P = 1.25E-04) inlymphocytes from white adults based on GENEVAR dataset indicated that the variant mightfunction through expression level changes (see Figure E4 in the Online Repository) [28,29].Imputation identified a SNP with a more significant P value, rs3998159 (P = 1.45E-06),between HLA-DQB1 and HLA-DQA2. It is difficult to determine the functional genes/SNPs inthe HLA-DR/DQ region in our study due to the complicated LD pattern in this region. Thelong-range LD and haplotype analysis based on the MHC Haplotype Project may solve theissue [47].
Using a GWAS approach, this study is the first to confirm the association of RAD50-IL13 andHLA-DR/DQ regions with asthma susceptibility, regions which have been identified by
Li et al. Page 6
J Allergy Clin Immunol. Author manuscript; available in PMC 2011 February 1.
NIH
-PA Author Manuscript
NIH
-PA Author Manuscript
NIH
-PA Author Manuscript

multiple candidate-gene association studies and one genome-wide association study on totalserum IgE levels. Our results weakly replicated the findings of the other GWAS: ORMDL3and gasdermin B (GSDML) (rs7216389) with asthma (P = 0.057); FCER1A (rs2251746) withtotal serum IgE (P = 0.040); CHI3L1 (rs880633) with FEV1 (P = 0.003), FVC (P = 0.031), andFEV1/FVC (P = 0.040). rs1588265 (P = 0.507) and rs1544791 (P = 0.678) in PDE4D withasthma were not replicated. GWAS of total serum IgE by Weidinger [15] identified severalSNPs in RAD50 (P < 10E-04). In our study, the most significant SNP in RAD50 for total serumIgE is rs6871536 (P = 2.61E-03). The geometric mean of total serum IgE in Weidinger’s studyis 42.41 (95% CI: 39.56 – 45.47). In our study, the geometric mean of total serum IgE is higher,48.94 (95% CI: 43.04 – 55.65). The difference in the total serum IgE distribution and relativelysmall sample size in our study may lead to the difference of significant levels between thesetwo studies.
The potential for false negative results could not be avoided in this study due to the relativelysmall sample size (473 cases) which may also be the reason that although significance levelsof 10-7 were observed, no SNP reached Bonferroni adjusted multiple test criterion(p=0.05/292,443 = 1.71E-07. However, evidence for multiple SNPs was observed in our resultsin this comprehensively phenotyped relatively homogeneous cohort of difficult-to-treatasthmatics from the larger TENOR study. Our control datasets (general population andphenotyped controls) both have some limitations. They were both significantly younger (seeTable I) than TENOR cases, making our results a little conservative because some controlsmight become asthma cases in the future. Genotyping confirmation and fine-mapping ofcandidate regions were impossible since the Illumina controls were from a public database,but our approach compensated for this by using imputation. Population stratification wasrelatively strong between TENOR cases and Illumina 550k controls.
This GWAS confirmed the important role of TH2 cytokine and antigen presentation genes inasthma at a genome-wide level. Furthermore, these findings will stimulate more comprehensiveresearch (e.g., re-sequencing, long-range LD, epistasis, epigenetics, copy number variant, andfunction) on these two regions due to their functional importance and structural complexity.
Key messages
GWAS of asthma identifies RAD50-IL13 and HLA-DR/DQ. These findings will stimulatemore comprehensive research on these genes because of their structural complexity andfunctional importance in the pathogenesis of asthma.
Supplementary MaterialRefer to Web version on PubMed Central for supplementary material.
AcknowledgmentsWe would like to thank Dr. Elizabeth J. Ampleford for analytical assistance. We would also like to acknowledge theTENOR/SARP/CSGA/STAMPEED Study Group and the TENOR/SARP/CSGA/STAMPEED participants whocontributed DNA samples.
Declaration of all sources of funding: The clinical TENOR study was supported by Genentech, Inc. and NovartisPharmaceuticals Corporation, and this genetic study was funded by NIH HL76285 and HL87665.
Abbreviations used
GC Genomic control
Li et al. Page 7
J Allergy Clin Immunol. Author manuscript; available in PMC 2011 February 1.
NIH
-PA Author Manuscript
NIH
-PA Author Manuscript
NIH
-PA Author Manuscript
GWAS Genome-wide association study
HLA Human leukocyte antigen
LCR Locus control region
LD Linkage disequilibrium
QC quality control
SNP Single nucleotide polymorphism
TENOR The Epidemiology and Natural History of Asthma: Outcomes and TreatmentRegimens
UTR Untranslated region
REFERENCES1. Hoffjan S, Ober C. Present status on the genetic studies of asthma. Curr Opin Immunol 2002;14:709–
717. [PubMed: 12413520]2. Ober C, Hoffjan S. Asthma genetics 2006: the long and winding road to gene discovery. Genes Immun
2006;7:95–100. [PubMed: 16395390]3. Denham S, Koppelman GH, Blakey J, Wjst M, Ferreira MA, Hall IP, et al. Meta-analysis of genome-
wide linkage studies of asthma and related traits. Respir Res 2008;9:38. [PubMed: 18442398]4. Van Eerdewegh P, Little RD, Dupuis J, Del Mastro RG, Falls K, Simon J, et al. Association of the
ADAM33 gene with asthma and bronchial hyperresponsiveness. Nature 2002;418:426–430. [PubMed:12110844]
5. Allen M, Heinzmann A, Noguchi E, Abecasis G, Broxholme J, Ponting CP, et al. Positional cloningof a novel gene influencing asthma from chromosome 2q14. Nat Genet 2003;35:258–263. [PubMed:14566338]
6. Zhang Y, Leaves NI, Anderson GG, Ponting CP, Broxholme J, Holt R, et al. Positional cloning of aquantitative trait locus on chromosome 13q14 that influences immunoglobulin E levels and asthma.Nat Genet 2003;34:181–186. [PubMed: 12754510]
7. Laitinen T, Polvi A, Rydman P, Vendelin J, Pulkkinen V, Salmikangas P, et al. Characterization of acommon susceptibility locus for asthma-related traits. Science 2004;304:300–304. [PubMed:15073379]
8. Nicolae D, Cox NJ, Lester LA, Schneider D, Tan Z, Billstrand C, et al. Fine mapping and positionalcandidate studies identify HLA-G as an asthma susceptibility gene on chromosome 6p21. Am J HumGenet 2005;76:349–357. [PubMed: 15611928]
9. Noguchi E, Yokouchi Y, Zhang J, Shibuya K, Shibuya A, Bannai M, et al. Positional identification ofan asthma susceptibility gene on human chromosome 5q33. Am J Respir Crit Care Med 2005;172:183–188. [PubMed: 15879417]
10. Vercelli D. Discovering susceptibility genes for asthma and allergy. Nat Rev Immunol 2008;8:169–182. [PubMed: 18301422]
11. Zhang J, Pare PD, Sandford AJ. Recent advances in asthma genetics. Respir Res 2008;9:4. [PubMed:18197984]
12. Willis-Owen SA, Cookson WO, Moffatt MF. Genome-wide association studies in the genetics ofasthma. Curr Allergy Asthma Rep 2009;9:3–9. [PubMed: 19063818]
13. Moffatt MF, Kabesch M, Liang L, Dixon AL, Strachan D, Heath S, et al. Genetic variants regulatingORMDL3 expression contribute to the risk of childhood asthma. Nature 2007;448:470–473.[PubMed: 17611496]
14. Ober C, Tan Z, Sun Y, Possick JD, Pan L, Nicolae R, et al. Effect of variation in CHI3L1 on serumYKL-40 level, risk of asthma, and lung function. N Engl J Med 2008;358:1682–1691. [PubMed:18403759]
Li et al. Page 8
J Allergy Clin Immunol. Author manuscript; available in PMC 2011 February 1.
NIH
-PA Author Manuscript
NIH
-PA Author Manuscript
NIH
-PA Author Manuscript
15. Weidinger S, Gieger C, Rodriguez E, Baurecht H, Mempel M, Klopp N, et al. Genome-wide scan ontotal serum IgE levels identifies FCER1A as novel susceptibility locus. PLoS Genet2008;4:e1000166. [PubMed: 18846228]
16. Himes BE, Hunninghake GM, Baurley JW, Rafaels NM, Sleiman P, Strachan DP, et al. Genome-wide association analysis identifies PDE4D as an asthma-susceptibility gene. Am J Hum Genet2009;84:581–593. [PubMed: 19426955]
17. Dolan CM, Fraher KE, Bleecker ER, Borish L, Chipps B, Hayden ML, et al. Design and baselinecharacteristics of the epidemiology and natural history of asthma: Outcomes and Treatment Regimens(TENOR) study: a l arge cohort of patients with severe or difficult-to-treat asthma. Ann AllergyAsthma Immunol 2004;92:32–39. [PubMed: 14756462]
18. Borish L, Chipps B, Deniz Y, Gujrathi S, Zheng B, Dolan CM. Total serum IgE levels in a largecohort of patients with severe or difficult-to-treat asthma. Ann Allergy Asthma Immunol2005;95:247–253. [PubMed: 16200815]
19. Miller MK, Johnson C, Miller DP, Deniz Y, Bleecker ER, Wenzel SE. Severity assessment in asthma:An evolving concept. J Allergy Clin Immunol 2005;116:990–995. [PubMed: 16275365]
20. Purcell S, Neale B, Todd-Brown K, Thomas L, Ferreira MA, Bender D, et al. PLINK: a tool set forwhole-genome association and population-based linkage analyses. Am J Hum Genet 2007;81:559–575. [PubMed: 17701901]
21. Price AL, Patterson NJ, Plenge RM, Weinblatt ME, Shadick NA, Reich D. Principal componentsanalysis corrects for stratification in genome-wide association studies. Nat Genet 2006;38:904–909.[PubMed: 16862161]
22. Clayton DG, Walker NM, Smyth DJ, Pask R, Cooper JD, Maier LM, et al. Population structure,differential bias and genomic control in a large-scale, case-control association study. Nat Genet2005;37:1243–1246. [PubMed: 16228001]
23. Barrett JC, Fry B, Maller J, Daly MJ. Haploview: analysis and visualization of LD and haplotypemaps. Bioinformatics 2005;21:263–265. [PubMed: 15297300]
24. Gabriel SB, Schaffner SF, Nguyen H, Moore JM, Roy J, Blumenstiel B, et al. The structure ofhaplotype blocks in the human genome. Science 2002;296:2225–2229. [PubMed: 12029063]
25. Johnson AD, Handsaker RE, Pulit SL, Nizzari MM, O'Donnell CJ, de Bakker PI. SNAP: a web-basedtool for identification and annotation of proxy SNPs using HapMap. Bioinformatics 2008;24:2938–2939. [PubMed: 18974171]
26. Frazer KA, Ballinger DG, Cox DR, Hinds DA, Stuve LL, Gibbs RA, et al. A second generation humanhaplotype map of over 3.1 million SNPs. Nature 2007;449:851–861. [PubMed: 17943122]
27. Li Y, Abecasis GR. Mach 1.0: Rapid Haplotype Reconstruction and Missing Genotype Inference.Am J Hum Genet 2006;S79:2290.
28. Stranger BE, Forrest MS, Dunning M, Ingle CE, Beazley C, Thorne N, et al. Relative impact ofnucleotide and copy number variation on gene expression phenotypes. Science 2007;315:848–853.[PubMed: 17289997]
29. Ge D, Zhang K, Need AC, Martin O, Fellay J, Urban TJ, et al. WGAViewer: software for genomicannotation of whole genome association studies. Genome Res 2008;18:640–643. [PubMed:18256235]
30. Yabuki M, Fujii MM, Maizels N. The MRE11-RAD50-NBS1 complex accelerates somatichypermutation and gene conversion of immunoglobulin variable regions. Nat Immunol 2005;6:730–736. [PubMed: 15937485]
31. Heinzmann A, Mao XQ, Akaiwa M, Kreomer RT, Gao PS, Ohshima K, et al. Genetic variants ofIL-13 signalling and human asthma and atopy. Hum Mol Genet 2000;9:549–559. [PubMed:10699178]
32. Graves PE, Kabesch M, Halonen M, Holberg CJ, Baldini M, Fritzsch C, et al. A cluster of seventightly linked polymorphisms in the IL-13 gene is associated with total serum IgE levels in threepopulations of white children. J Allergy Clin Immunol 2000;105:506–513. [PubMed: 10719301]
33. van der Pouw Kraan TC, van Veen A, Boeije LC, van Tuyl SA, de Groot ER, Stapel SO, et al. AnIL-13 promoter polymorphism associated with increased risk of allergic asthma. Genes Immun1999;1:61–65. [PubMed: 11197307]
Li et al. Page 9
J Allergy Clin Immunol. Author manuscript; available in PMC 2011 February 1.
NIH
-PA Author Manuscript
NIH
-PA Author Manuscript
NIH
-PA Author Manuscript

34. Liu X, Beaty TH, Deindl P, Huang SK, Lau S, Sommerfeld C, et al. Associations between total serumIgE levels and the 6 potentially functional variants within the genes IL4, IL13, and IL4RA in Germanchildren: the German Multicenter Atopy Study. J Allergy Clin Immunol 2003;112:382–388.[PubMed: 12897746]
35. Lee GR, Fields PE, Griffin TJ, Flavell RA. Regulation of the Th2 cytokine locus by a locus controlregion. Immunity 2003;19:145–153. [PubMed: 12871646]
36. Spilianakis CG, Flavell RA. Long-range intrachromosomal interactions in the T helper type 2 cytokinelocus. Nat Immunol 2004;5:1017–1027. [PubMed: 15378057]
37. Fields PE, Lee GR, Kim ST, Bartsevich VV, Flavell RA. Th2-specific chromatin remodeling andenhancer activity in the Th2 cytokine locus control region. Immunity 2004;21:865–876. [PubMed:15589174]
38. Lee DU, Rao A. Molecular analysis of a locus control region in the T helper 2 cytokine gene cluster:a target for STAT6 but not GATA3. Proc Natl Acad Sci U S A 2004;101:16010–16015. [PubMed:15507491]
39. Lee GR, Spilianakis CG, Flavell RA. Hypersensitive site 7 of the TH2 locus control region is essentialfor expressing TH2 cytokine genes and for long-range intrachromosomal interactions. Nat Immunol2005;6:42–48. [PubMed: 15608641]
40. Spilianakis CG, Lalioti MD, Town T, Lee GR, Flavell RA. Interchromosomal associations betweenalternatively expressed loci. Nature 2005;435:637–645. [PubMed: 15880101]
41. Shiina T, Hosomichi K, Inoko H, Kulski JK. The HLA genomic loci map: expression, interaction,diversity and disease. J Hum Genet 2009;54:15–39. [PubMed: 19158813]
42. Torio A, Sanchez-Guerrero I, Muro M, Villar LM, Minguela A, Marin L, et al. HLA class II genotypicfrequencies in atopic asthma: association of DRB1*01-DQB1*0501 genotype with Artemisiavulgaris allergic asthma. Hum Immunol 2003;64:811–815. [PubMed: 12878360]
43. Lin YC, Lu CC, Su HJ, Shen CY, Lei HY, Guo YL. The association between tumor necrosis factor,HLA-DR alleles, and IgE-mediated asthma in Taiwanese adolescents. Allergy 2002;57:831–834.[PubMed: 12169181]
44. Cho SH, Kim YK, Oh HB, Jung JW, Son JW, Lee MH, et al. Association of HLA-DRB1(*)07 andDRB1(*)04 to citrus red mite (Panonychus citri) and house dust mite sensitive asthma. Clin ExpAllergy 2000;30:1568–1575. [PubMed: 11069565]
45. Dixon AL, Liang L, Moffatt MF, Chen W, Heath S, Wong KC, et al. A genome-wide associationstudy of global gene expression. Nat Genet 2007;39:1202–1207. [PubMed: 17873877]
46. Beaty JS, West KA, Nepom GT. Functional effects of a natural polymorphism in the transcriptionalregulatory sequence of HLA-DQB1. Mol Cell Biol 1995;15:4771–4782. [PubMed: 7651394]
47. Horton R, Gibson R, Coggill P, Miretti M, Allcock RJ, Almeida J, et al. Variation analysis and geneannotation of eight MHC haplotypes: the MHC Haplotype Project. Immunogenetics 2008;60:1–18.[PubMed: 18193213]
Li et al. Page 10
J Allergy Clin Immunol. Author manuscript; available in PMC 2011 February 1.
NIH
-PA Author Manuscript
NIH
-PA Author Manuscript
NIH
-PA Author Manuscript

Figure 1.Genome-wide association of 292,443 SNPs in 473 TENOR cases and 1,892 Illumina controls.Color scale of the x-axis represents chromosomes. Negative logarithm transformed GC-adjusted P values are shown on the y-axis.
Li et al. Page 11
J Allergy Clin Immunol. Author manuscript; available in PMC 2011 February 1.
NIH
-PA Author Manuscript
NIH
-PA Author Manuscript
NIH
-PA Author Manuscript

Figure 2.Linkage disequilibrium (LD) and association plot of 14 SNPs in the TH2 cytokine locus. (A)Association plot: negative logarithm transformed P values (left scale) and recombination rate(right scale). (B) LD plot: r2 color scheme was used and labeled. 95% confidence intervals onD’ was used to set up blocks.
Li et al. Page 12
J Allergy Clin Immunol. Author manuscript; available in PMC 2011 February 1.
NIH
-PA Author Manuscript
NIH
-PA Author Manuscript
NIH
-PA Author Manuscript

Figure 3.Linkage disequilibrium (LD) and association plot of 10 SNPs in the HLA-DR/DQ region. (A)Association plot: negative logarithm transformed P values (left scale) and recombination rate(right scale). (B) LD plot: r2 color scheme was used and labeled. 95% confidence intervals onD’ was used to setup blocks. Only 10 out of 46 SNPs (with P ≤ 0.001) are shown.
Li et al. Page 13
J Allergy Clin Immunol. Author manuscript; available in PMC 2011 February 1.
NIH
-PA Author Manuscript
NIH
-PA Author Manuscript
NIH
-PA Author Manuscript
NIH
-PA Author Manuscript
NIH
-PA Author Manuscript
NIH
-PA Author Manuscript
Li et al. Page 14
Table I
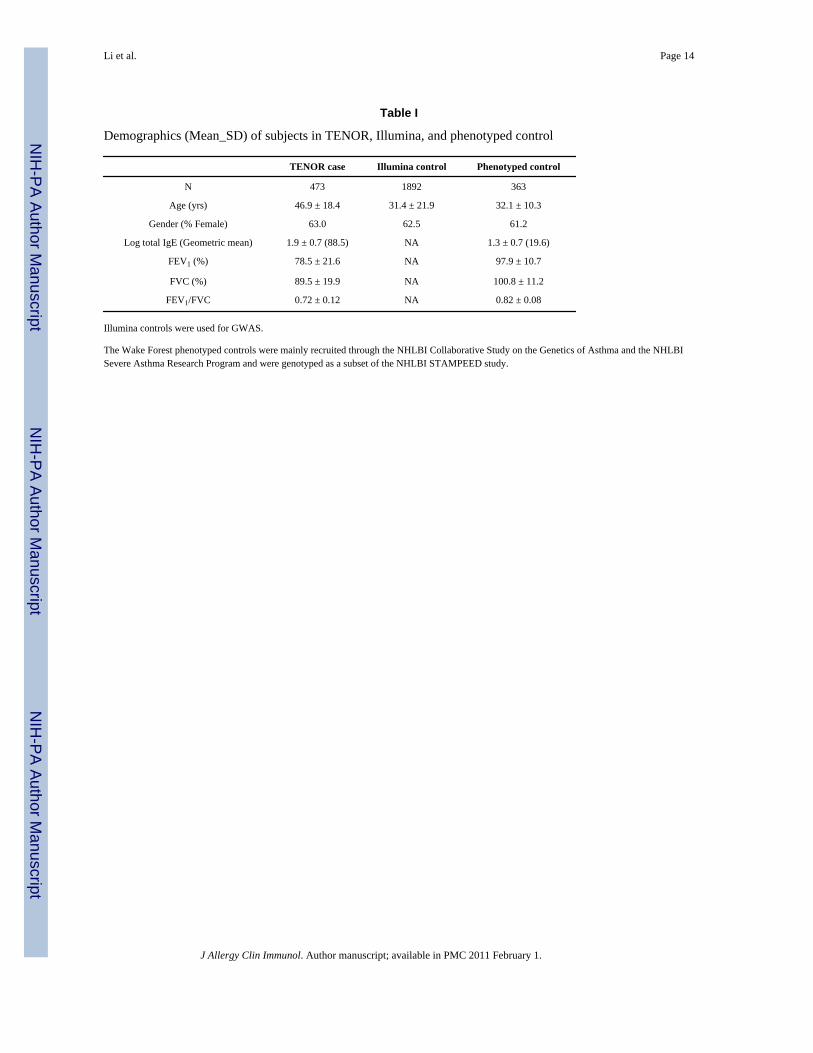
Demographics (Mean_SD) of subjects in TENOR, Illumina, and phenotyped control
TENOR case Illumina control Phenotyped control
N 473 1892 363
Age (yrs) 46.9 ± 18.4 31.4 ± 21.9 32.1 ± 10.3
Gender (% Female) 63.0 62.5 61.2
Log total IgE (Geometric mean) 1.9 ± 0.7 (88.5) NA 1.3 ± 0.7 (19.6)
FEV1 (%) 78.5 ± 21.6 NA 97.9 ± 10.7
FVC (%) 89.5 ± 19.9 NA 100.8 ± 11.2
FEV1/FVC 0.72 ± 0.12 NA 0.82 ± 0.08
Illumina controls were used for GWAS.
The Wake Forest phenotyped controls were mainly recruited through the NHLBI Collaborative Study on the Genetics of Asthma and the NHLBISevere Asthma Research Program and were genotyped as a subset of the NHLBI STAMPEED study.
J Allergy Clin Immunol. Author manuscript; available in PMC 2011 February 1.

NIH
-PA Author Manuscript
NIH
-PA Author Manuscript
NIH
-PA Author Manuscript
Li et al. Page 15
Tabl
e II
Ass
ocia
tion
resu
lts o
f 14
SNPs
in T
H2
cyto
kine
locu
s on
chro
mos
ome
5
No.
SNP
Posi
tion
Gen
eA
llele
s(M
:m)
MA
FO
R (9
5% C
I)P
valu
eL
og to
tal
IgE
FEV
1/FV
CFE
V1
(%)
FVC
(%)
1rs
4143
832
1318
9087
6IL
5C
:A0.
178
1.23
(1.0
0 –
1.51
)5.
10E-
024.
31E-
027.
01E-
015.
31E-
018.
01E-
01
2rs
1173
9623
1318
9205
1IL
5C
:T0.
255
0.91
(0.7
5 –
1.10
)3.
28E-
014.
28E-
018.
14E-
013.
38E-
013.
91E-
01
3rs
2079
103
1318
9240
5IL
5G
:T0.
237
1.06
(0.8
8 –
1.28
)5.
22E-
012.
30E-
018.
84E-
014.
36E-
016.
05E-
01
4rs
2706
399
1318
9560
1IL
5A
:G0.
497
1.00
(0.8
5 –
1.17
)9.
92E-
019.
85E-
018.
28E-
015.
23E-
014.
15E-
01
5rs
7435
6213
1900
282
IL5
C:T
0.42
31.
06 (0
.89
– 1.
25)
5.22
E-01
5.94
E-01
5.18
E-01
7.35
E-01
4.98
E-01
6rs
7397
1913
1900
764
IL5
G:T
0.06
90.
79 (0
.57
– 1.
11)
1.72
E-01
1.20
E-01
1.96
E-01
9.95
E-01
8.02
E-01
7rs
2244
012
1319
2912
4RA
D50
T:C
0.21
21.
64 (1
.36
– 1.
97)
3.04
E-07
5.90
E-03
3.18
E-02
8.64
E-02
1.59
E-01
8rs
2897
443
1319
5749
3RA
D50
C:A
0.19
91.
58 (1
.31
– 1.
92)
2.74
E-06
1.86
E-02
9.75
E-02
1.99
E-01
2.48
E-01
9rs
6871
536
1319
9777
3RA
D50
T:C
0.20
81.
60 (1
.33
– 1.
94)
9.03
E-07
2.61
E-03
3.36
E-02
1.38
E-01
2.58
E-01
10rs
2237
060
1319
9878
4RA
D50
A:C
0.42
50.
88 (0
.74
– 1.
04)
1.22
E-01
2.56
E-01
1.19
E-01
1.16
E-01
2.79
E-01
11rs
1295
686
1320
2374
2IL
13G
:A0.
198
1.45
(1.1
9 –
1.76
)2.
21E-
046.
16E-
022.
10E-
031.
84E-
033.
77E-
02
12rs
2054
113
2023
863
IL13
C:T
0.19
11.
44 (1
.19
– 1.
76)
2.50
E-04
6.06
E-02
1.83
E-03
2.18
E-03
3.69
E-02
13rs
2243
204
1320
2739
3IL
13C
:T0.
086
1.69
(1.2
9 –
2.21
)1.
31E-
041.
67E-
031.
11E-
021.
39E-
028.
10E-
02
14rs
2243
300
1320
3198
5IL
4G
:T0.
081.
51 (1
.15
– 1.
99)
3.17
E-03
3.14
E-02
1.57
E-03
7.89
E-03
8.58
E-02
Alle
les (
M:m
): M
ajor
alle
le :
min
or a
llele
.
MA
F: m
inor
alle
le fr
eque
ncy.
OR
(95%
CI)
: odd
s rat
io a
nd 9
5% c
onfid
ence
inte
rval
.
Log
tota
l IgE
, FEV
1/FV
C, F
EV1,
and
FV
C: P
valu
es o
f ast
hma-
rela
ted
quan
titat
ive
traits
.
J Allergy Clin Immunol. Author manuscript; available in PMC 2011 February 1.

NIH
-PA Author Manuscript
NIH
-PA Author Manuscript
NIH
-PA Author Manuscript
Li et al. Page 16
Tabl
e III
Ass
ocia
tion
resu
lts o
f 10
of 4
6 SN
Ps (w
ith P
≤ 0
.001
) in
the
HLA
-DR
/DQ
regi
on
No.
SNP
Posi
tion
Gen
eA
llele
s(M
:m)
MA
FO
R (9
5% C
I)P
valu
e
1rs
9268
542
3249
2699
BTN
L2A
:G0.
377
1.40
(1.1
8 –
1.65
)8.
55E-
05
13rs
2239
804
3251
9501
HLA
-DRA
A:G
0.46
11.
43 (1
.21
– 1.
68)
2.80
E-05
19rs
2395
185
3254
1145
HLA
-DRA
G:T
0.33
11.
40 (1
.19
– 1.
66)
8.73
E-05
20rs
2516
049
3267
8378
HLA
-DRB
1A
:G0.
319
1.44
(1.2
2 –
1.71
)2.
62E-
05
21rs
6608
9532
6853
58H
LA-D
RB1
A:G
0.20
21.
45 (1
.19
– 1.
75)
2.02
E-04
25rs
1063
355
3273
5692
HLA
-DQ
B1C
:A0.
397
0.68
(0.5
8 –
0.81
)9.
55E-
06
26rs
9275
141
3275
9095
HLA
-DQ
B1T:
G0.
497
1.37
(1.1
6 –
1.61
)1.
77E-
04
30rs
5000
634
3277
1542
HLA
-DQ
B1T:
C0.
386
1.39
(1.1
8 –
1.65
)9.
16E-
05
35rs
9275
312
3277
3706
HLA
-DQ
B1A
:G0.
132
1.63
(1.3
1 –
2.02
)1.
13E-
05
46rs
3916
765
3279
3528
HLA
-DQ
A2G
:A0.
111.
50 (1
.18
– 1.
90)
9.78
E-04
Alle
les (
M:m
): M
ajor
alle
le :
min
or a
llele
.
MA
F: m
inor
alle
le fr
eque
ncy.
OR
(95%
CI)
: odd
s rat
io a
nd 9
5% c
onfid
ence
inte
rval
.
J Allergy Clin Immunol. Author manuscript; available in PMC 2011 February 1.