Genome-scale metabolic reconstruction and constraint-based modelling of the Antarctic bacterium P...
29
For Peer Review Only Genome scale metabolic reconstruction and constraints- based modelling of the Antarctic bacterium Pseudoalteromonas haloplanktis TAC125 Journal: Environmental Microbiology and Environmental Microbiology Reports Manuscript ID: EMI-2014-0451.R1 Manuscript Type: EMI - Research article Journal: Environmental Microbiology Date Submitted by the Author: 13-May-2014 Complete List of Authors: Fondi, Marco; University of Florence, Dep. of Biology Maida, Isabel; University of Florence, Dep. of Biology Perrin, Elena; University of Florence, Dep. of Biology Mellera, Alessandra; University of Florence, Dep. of Biology Mocali, Stefano; Centro di Ricerca per l’Agrobiologia e la Pedologia (CRA- ABP), Consiglio per la Ricerca e la Sperimentazione in Agricoltura Parrilli, Ermenegilda; University of Naples Federico II, Department of Chemical Sciences Tutino, Maria Luisa; University of Naples Federico II, Department of Chemical Sciences Liò, Pietro; University of Cambridge, Computer Laboratory Fani, Renato; University of Florence, Dep. of Biology; University of Florence, Evolutionary Biology Keywords: bioinformatics, environmental signal/stress responses, extremophiles/extremophily, gene expression/regulation, genomics/functional genomics/comparative genomics, metabolic networks, metabolism, modelling Wiley-Blackwell and Society for Applied Microbiology
Transcript of Genome-scale metabolic reconstruction and constraint-based modelling of the Antarctic bacterium P...

For Peer Review O
nly
Genome scale metabolic reconstruction and constraints-
based modelling of the Antarctic bacterium Pseudoalteromonas haloplanktis TAC125
Journal: Environmental Microbiology and Environmental Microbiology Reports
Manuscript ID: EMI-2014-0451.R1
Manuscript Type: EMI - Research article
Journal: Environmental Microbiology
Date Submitted by the Author: 13-May-2014
Complete List of Authors: Fondi, Marco; University of Florence, Dep. of Biology Maida, Isabel; University of Florence, Dep. of Biology Perrin, Elena; University of Florence, Dep. of Biology Mellera, Alessandra; University of Florence, Dep. of Biology Mocali, Stefano; Centro di Ricerca per l’Agrobiologia e la Pedologia (CRA-ABP), Consiglio per la Ricerca e la Sperimentazione in Agricoltura Parrilli, Ermenegilda; University of Naples Federico II, Department of Chemical Sciences Tutino, Maria Luisa; University of Naples Federico II, Department of Chemical Sciences Liò, Pietro; University of Cambridge, Computer Laboratory Fani, Renato; University of Florence, Dep. of Biology; University of Florence, Evolutionary Biology
Keywords:
bioinformatics, environmental signal/stress responses, extremophiles/extremophily, gene expression/regulation, genomics/functional genomics/comparative genomics, metabolic networks, metabolism, modelling
Wiley-Blackwell and Society for Applied Microbiology

For Peer Review O
nly
Genome scale metabolic reconstruction and constraints-based 1
modelling of the Antarctic bacterium Pseudoalteromonas haloplanktis 2
TAC125. 3
4
Marco Fondi1,2§, Isabel Maida
1, Elena Perrin
1, Alessandra Mellera
1,2, Stefano Mocali
3, Ermenegilda 5
Parrilli4, Maria Luisa Tutino
4, Pietro Liò
5, Renato Fani
1,2 6
7
1 Laboratory of Microbial and Molecular Evolution, Department of Biology, University of Florence, Via Madonna del 8
Piano 6, 50019 Sesto Fiorentino (Firenze) 9
2 ComBo, Florence Computational Biology group, University of Florence, Via Madonna del Piano 6, 50019 Sesto 10
Fiorentino (Firenze) 11
3 Consiglio per la Ricerca e la Sperimentazione in Agricoltura, Centro di Ricerca per l’Agrobiologia e la Pedologia 12
(CRA-ABP), Piazza d’Azeglio 30, 50121 Firenze, Italy 13
4 Department of Chemical Sciences, University of Naples Federico II, Complesso Universitario M. S. Angelo, Via 14
Cintia, I-80126, Naples, Italy 15
5 Computer Laboratory, Cambridge University, William Gates Building 15, JJ Thomson Avenue, Cambridge, United 16
Kingdom§Corresponding author 17
Dr. Marco Fondi 18
Laboratory of Microbial and Molecular Evolution, Department of Biology, University of Florence, Via Madonna del 19
Piano 6, 50019 Sesto Fiorentino (Firenze) 20
Tel +390554574736 21
Email: [email protected] 22
Page 1 of 28
Wiley-Blackwell and Society for Applied Microbiology

For Peer Review O
nly
Summary 23
The Antarctic strain Pseudoalteromonas haloplanktis TAC125 is one of the model organisms of 24
cold-adapted bacteria and is currently exploited as a new alternative expression host for numerous 25
biotechnological applications. 26
Here, we investigated several metabolic features of this strain through in silico modelling and 27
functional integration of –omics data. A genome-scale metabolic model of P. haloplanktis TAC125 28
was reconstructed, encompassing information on 721 genes, 1133 metabolites and 1322 reactions. 29
The predictive potential of this model was validated against a set of experimentally determined 30
growth rates and a large dataset of growth phenotypic data. Furthermore, evidence synthesis from 31
proteomics, phenomics, physiology and metabolic modeling data revealed possible drawbacks of 32
cold-dependent changes in gene expression on the overall metabolic network of P. haloplanktis 33
TAC125. These included, for example, variations in its central metabolism, amino acids 34
degradation and fatty acids biosynthesis. 35
The genome scale metabolic model described here is the first one reconstructed so far for an 36
Antarctic microbial strain. It allowed a system-level investigation of variations in cellular metabolic 37
fluxes following a temperature downshift. It represents a valuable platform for further 38
investigations on P. haloplanktis TAC125 cellular functional states and for the design of more 39
focused strategies for its possible biotechnological exploitation. 40
41
Page 2 of 28
Wiley-Blackwell and Society for Applied Microbiology

For Peer Review O
nly
Introduction 42
Antarctica is one of the most extreme environments on Earth due to the presence of stably low 43
temperatures. Many (psychrophilic) microorganisms inhabit this environment, being responsible for 44
most of the biomass of this ecological niche and playing a key role in maintaining proper ecosystem 45
functions (Wilkins et al., 2013). Such cold-adapted microorganisms have begun to attract the 46
attention of the scientific community from both fundamental and application viewpoints 47
(Cavicchioli et al., 2002; D'Amico et al., 2006). Indeed, psychrophiles have evolved peculiar 48
features (Feller and Gerday, 2003; Giordano et al., 2012) to face the profound impact of cold shock 49
on several cellular processes (e.g. growth rates, ribosomal synthesis, cytoplasmic membrane 50
composition, etc.) (Phadtare, 2004). Overall, survival at low temperature depends on the ability of 51
microbes to sense changes in temperature and to transduce these signals to the genome, ultimately 52
bringing changes in the regulation of cold-adaptation related genes (Shivaji and Prakash, 2010). 53
These include: i) genes for fatty acid desaturases (Sato and Murata, 1980), ii) genes involved in 54
replication (Jones et al., 1992; Graumann and Marahiel, 1999), transcription (Sledjeski et al., 1996; 55
Inaba et al., 2003) and translation (Jones et al., 1987; Xia et al., 2003), iii) genes encoding cold 56
shock proteins (Brandi et al., 1994; Atlung and Ingmer, 1997), as well as iv) many genes coding for 57
still uncharacterized proteins (Kawamoto et al., 2007; Ting et al., 2010). Moreover, the increase of 58
enzymes concentration (Willem et al., 1999) and the expression of specific cold-adapted enzymatic 59
isoforms (Hoyoux et al., 2004) represent two additional examples of how psychrophilic enzymatic 60
machineries may counteract the growth limiting effects of cold temperatures. 61
Recently, the spreading of –omics technologies has allowed the system-level investigation of the 62
mechanisms involved in microbial cold adaptation (Seo et al., 2004; Goodchild et al., 2005; 63
Bakermans et al., 2007; Zheng et al., 2007; Piette et al., 2010). For example, a transcriptomics 64
analysis on Shewanella oneidensis MR-1 showed that more than 70% of its genes involved in 65
energy metabolism were down-regulated following a temperature downshift (Gao et al., 2006). A 66
proteomic study on Sphingopyxis alaskensis revealed that a large fraction of genes involved in 67
metabolic processes (e.g. energy production/conversion, carbohydrate, amino acids, nucleotides and 68
cofactors transport/metabolism) are less abundant at lower temperatures (Ting et al., 2010). Finally, 69
from a metabolic viewpoint, a large-scale metabolomics analysis on the cold adaptation of 70
Mesorhizobium sp. strain N33 revealed a key role of (unsaturated) fatty acids biosynthetic process. 71
From such examples, it emerges that, despite some strategies may be shared, different 72
microorganisms use different strategies to cope with cold environments (Kawamoto et al., 2007). 73
The Antarctic marine bacterium Pseudoalteromonas haloplanktis TAC125 (PhTAC125) has been 74
isolated from sea water sampled along the Antarctic ice-shell, a permanently cold environment. 75
PhTAC125 is capable of growing in a wide temperature range (4–25°C) and its lowest observed 76
doubling time was detected at 20°C (Medigue et al., 2005). Several exceptional genomic and 77
metabolic features were derived from the genome sequence of this bacterium, showing adaptation to 78
periodic situations of nutrient abundance (Medigue et al., 2005). Indeed PhTAC125 is considered to 79
be one of the model organisms of cold-adapted bacteria and has been suggested as an alternative 80
host for the soluble overproduction of heterologous proteins, given its capability to grow fast at low 81
temperatures (Duilio et al., 2004; Wilmes et al., 2010; Rippa et al., 2012; Corchero et al., 2013). 82
Furthermore, bacteria belonging to the genus Pseudoalteromonas are known to possess an 83
inhibitory activity against human pathogens belonging to the Burkholdeia cepacia complex (Bcc) 84
Page 3 of 28
Wiley-Blackwell and Society for Applied Microbiology
For Peer Review O
nly
and to be able to produce antibiofilm molecules (Papa et al., 2013; Papaleo et al., 2013), revealing 85
the interesting biotechnological potential and metabolic biodiversity of these microorganisms. The 86
increasing interest in PhTAC125 has led to the accumulation of different data types for this 87
bacterium in the last few years, including its complete genome sequence (Medigue et al., 2005), its 88
proteome (Piette et al., 2010; Piette et al., 2011) and detailed growth phenotypes (Wilmes et al., 89
2010; Giuliani, 2011). Thus, it is now possible to integrate such different data sources and perform 90
a system-level investigation of PhTAC125 metabolism. 91
Genome scale metabolic modeling represents a valuable tool in this context. Indeed, this in silico 92
approach can be adopted to quantitatively simulate chemical reactions fluxes within the cell, 93
including metabolic adjustments in response to external perturbations (e.g. temperature downshift). 94
Genome annotations are usually transformed into models by defining the boundaries of the system, 95
a biomass assembly reaction, and exchange fluxes with the environment (Durot et al., 2009; Thiele 96
and Palsson, 2010). Constraint-based modelling methods (e.g. Flux Balance Analysis, FBA) can 97
then be used to compute the resulting balance of all the active cellular reactions in the cell and to 98
simulate the maximal growth of a cell in a given environmental condition (Varma and Palsson, 99
1994; Schilling et al., 2000). In the past decade, this approach has been successfully applied for 100
studying large-scale metabolic networks in microbes, with the aim of guiding rational engineering 101
of biological systems for applications in industrial and medical biotechnology (Milne et al., 2009). 102
Interestingly, different data types can be mapped onto metabolic models in order to elucidate more 103
thoroughly the metabolism of a cell and its response to environmental factors. This is usually done 104
by including functional characterization and accurate quantification of all the main cellular 105
information levels of gene products, mRNA, proteins and metabolites, as well as their interaction 106
(Zhang et al., 2010). In recent years, –omics-derived data have been used to refine, validate and/or 107
integrate metabolic models, including transcriptomics (Colijn et al., 2009; Jensen and Papin, 2011), 108
proteomics (Gille et al., 2010), fluxomics (Chen et al., 2011; Feng and Zhao, 2013) and phenomics 109
(Fang et al., 2011). 110
In at least two study-cases, FBA and expression data have been merged to explore the effect of 111
temperature downshift at the system level (Navid and Almaas, 2012; Tong et al., 2013). In 112
particular, Tong et al. (2013) performed robustness analysis on the core metabolic model of 113
Thermoanaerobacter tengcongensis to study the dynamic changes of the metabolic network 114
following the perturbation of the culture temperature and collecting the bacterial growth rates and 115
differential proteomes. Given the overall agreement between in silico simulations and observed 116
phenotypes, this approach was shown to provide a reliable platform to systematically evaluate the 117
mechanisms of bacterial metabolism and relevant switches in the presence of a temperature 118
downshift. 119
In this study, a genome-scale reconstruction of P. haloplanktis TAC125’s metabolism was 120
performed based on its genome annotation. The predictive capability of the model [named iMF721 121
according to the current naming convention (Reed et al., 2003)] was successfully validated 122
comparing constraints-based modeling outcomes with experimentally determined growth rates and 123
large scale growth phenotype data (Phenotype Microarray). The iMF721 model was then used to 124
globally investigate possible metabolic adjustments of P. haloplanktis TAC125 during growth at 125
low temperature by means of robustness analysis and functional integration of protein abundance 126
data into the reconstructed network. 127
Page 4 of 28
Wiley-Blackwell and Society for Applied Microbiology

For Peer Review O
nly
Finally, the metabolic reconstruction reported herein represents a reliable platform for the future 128
design of experimental strategies aimed at the exploitation of the biotechnological potential of 129
PhTAC125. 130
131
132
Page 5 of 28
Wiley-Blackwell and Society for Applied Microbiology
For Peer Review O
nly
Experimental procedures 133
Metabolic model reconstruction 134
An initial draft metabolic reconstruction of the strain PhTAC125 was constructed using RAST 135
annotation system with default parameters (Overbeek et al., 2014) and then downloaded from the 136
ModelSEED database (Henry et al., 2010). This reconstruction was then thoroughly inspected 137
following the main steps listed in (Thiele and Palsson, 2010) and refined by integrating information 138
from PhTAC125 original genome annotation (Medigue et al., 2005) and from different functional 139
databases, including KEGG (Kanehisa, 2002) BRENDA (Scheer et al., 2011) and MetCyc (Caspi et 140
al., 2006). At this stage, models of related organisms (e.g. Escherichia coli, Shewanella oneidensis 141
MR-1) were used as reference in a comparative genomics workflow for identifying potentially 142
missing reactions. BLAST (Altschul et al., 1997) searches (adopting the Bidirectional Best Hit 143
criterion) on the PhTAC125 genome were carried out to confirm/exclude the inclusion of further 144
reactions to the original model. The list of the PhTAC125’s cellular transporters was obtained 145
probing the Transporter Classification Data Base [TCDB (Saier et al., 2006)]. At the end of this 146
iterative, manual refinement procedure, the model gained information on 60 additional genes and 147
(about) 200 reactions were added to the reconstruction (see Table S1). Also, to properly reconcile 148
the model with experimental data, some of the reactions initially included by the adopted automatic 149
reconstruction method were removed from the model during manual refinement. 150
To date, no detailed information on the biomass composition of PhTAC125 is available in scientific 151
literature, except for specific constituents [e.g. the structure of its lipo-oligosaccharide fraction 152
(Corsaro et al., 2001), RNA and DNA composition (Medigue et al., 2005)]. Accordingly, missing 153
information concerning the biomass assembly reaction of PhTAC125 was derived from the closely 154
related gamma-proteobacterium Shewanella oneidensis MR-1 and E. coli, for which detailed 155
metabolic models were already available (Feist et al., 2007) (Pinchuk et al., 2010) (Orth et al., 156
2011). The description of the biomass composition can be found in Table S2. 157
The final PhTAC125 model was named iMF721 according to the current nomenclature standard 158
(Reed et al., 2003) and was successfully validated with the SBML Validator tool available at 159
http://sbml.org/Facilities/Validator/index.jsp. The SBML-formatted version of iMF721 is available 160
as Document S1. 161
162
Metabolic modeling 163
The Flux Balance Analysis (FBA) method was employed to simulate flux distribution in different 164
conditions. Briefly, FBA is a constraint-based method relying on the representation of the 165
biochemical system under investigation in the form of stoichiometric matrix S (m×n), where m is 166
the number of metabolites and n the number of reactions. FBA is based on the assumption of the 167
cellular pseudo-steady state, according to which the net sum of all the production and consumption 168
rates of each internal metabolite within a cell is considered to be zero. Under this assumption, the 169
system can be described by the set of linear equations: 170
Page 6 of 28
Wiley-Blackwell and Society for Applied Microbiology

For Peer Review O
nly
����� = ��� = 0, ∀
�
��� ∈ �, ∀� ∈ �
in which Xi is the concentration of metabolite i, Sij is the stoichiometric coefficient of the ith 171
metabolite in the jth reaction, vj is the flux of the j
th reaction, N the entire set of metabolites and M 172
the entire set of reactions. 173
Upper and lower bounds of flux through each reaction act as further constraints and are expressed 174
as: 175
�� < <�� where lb and ub are the lower and upper limits for reaction j, respectively. Finally, FBA exploits 176
linear programming to determine a feasible steady state flux vector that optimizes a given objective 177
function (e.g. biomass production). 178
The reconstructed model was analysed using COBRAToolbox-2.0 (Schellenberger et al., 2011) in 179
MATLAB® R2009b (Mathworks Inc.). Gurobi 5.6 (www.gurobi.com) and GLPK 4.32 180
(http://www.gnu.org/software/glpk/) solvers were used for computational simulations presented 181
herein. 182
Proteomic data and robustness analysis 183
Up- and down-regulation patterns of protein expression used in this work were obtained from 184
previously published studies (Piette et al., 2010; Piette et al., 2011) in which the proteome of cells 185
of PhTAC125 grown at 4°C and 18°C were analysed using two-dimensional differential in-gel 186
electrophoresis. 187
These data were used to compare (by means of robustness analysis) the experimentally determined 188
changes in protein abundance (following a temperature downshift) with the in silico inferred impact 189
of various reaction flux variations on the cell growth rate. Robustness analysis consists in the 190
calculation of suboptimal cellular growth (using FBA) when the reaction flux of a given reaction is 191
varied around the optimal value. In this context, we perturbed the flux through each reaction whose 192
corresponding genes i) were included in the model and ii) showed a significant change in 193
expression during proteomics experiments. Results of this analysis can be visualized as a plot of the 194
reaction flux (x-axis) versus the cellular growth rates (y-axis). We used the ad hoc implemented 195
function in COBRA Toolbox to perform robustness analysis. This approach overall resembles the 196
one recently used to investigate the response of Thermoanaerobacter tengcongensis adaptation to 197
high temperatures (Tong et al., 2013). 198
Proteomic data integration and fluxes visualization 199
Up- and down-regulation ratios (and corresponding p-values) of protein expression were mapped 200
onto the PhTAC125 metabolic model using MADE (Metabolic Adjustment by Differential 201
Expression) (Jensen and Papin, 2011). The visualization of the changes in reaction fluxes in the two 202
conditions was performed using iPath 2.0 (Yamada et al., 2011). 203
204
Page 7 of 28
Wiley-Blackwell and Society for Applied Microbiology
For Peer Review O
nly
205
206
Phenotype Microarray 207
Cells to be tested were previously plated on TYP medium agar plates and incubated overnight at 208
25°C. Cells were swabbed from the plates after overnight growth and suspended in appropriate 209
medium containing Inoculating fluid (BIOLOG) and Schatz salts (NaCl 10g/l, KH2PO4 1g/l, 210
NH4NO3 1g/l, MgSO4 7H2O 0.2g/l, FeSO4 7H2O 10mg/l, CaCl2 2H2O 10mg/l) as additive solution 211
until the 85% transmittance suspension of cells was obtained on a Biolog turbidimeter. In order to 212
inoculate the microplates PM1 and PM2, 1% tetrazolium violet (vol/vol) (Dye Mix A, Biolog) was 213
added to the suspension and 100 µL of such mixture were then inoculated in each well. Plates were 214
incubated at 15°C for 1 week (167h) with readings taken manually three times a day using a 215
Synergy HT (Biotek) system. The cellular growth was determined on the absorbance (OD 590nm) 216
values of the kinetic curve of dye formation. In particular OD=0.45 was selected as cut-off value for 217
cellular growth within each well of the PM microplates as tetrazolium colour development was 218
visually detected only for OD>0.45. 219
220
Page 8 of 28
Wiley-Blackwell and Society for Applied Microbiology
For Peer Review O
nly
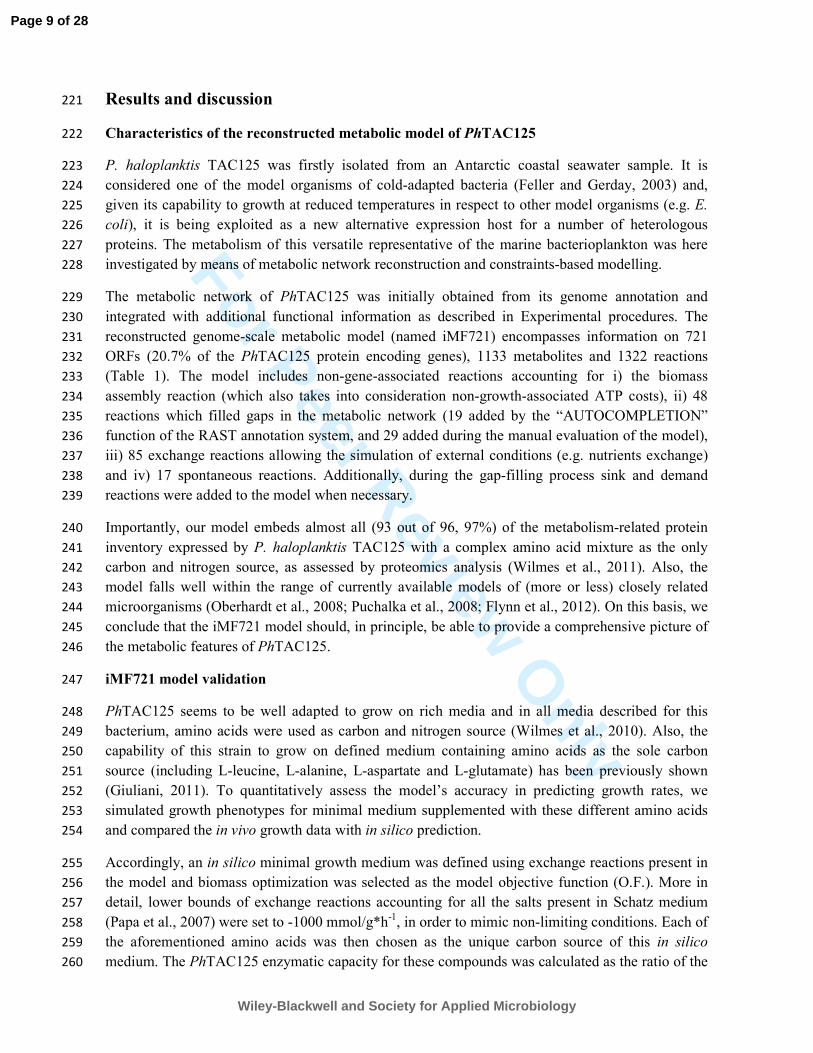
Results and discussion 221
Characteristics of the reconstructed metabolic model of PhTAC125 222
P. haloplanktis TAC125 was firstly isolated from an Antarctic coastal seawater sample. It is 223
considered one of the model organisms of cold-adapted bacteria (Feller and Gerday, 2003) and, 224
given its capability to growth at reduced temperatures in respect to other model organisms (e.g. E. 225
coli), it is being exploited as a new alternative expression host for a number of heterologous 226
proteins. The metabolism of this versatile representative of the marine bacterioplankton was here 227
investigated by means of metabolic network reconstruction and constraints-based modelling. 228
The metabolic network of PhTAC125 was initially obtained from its genome annotation and 229
integrated with additional functional information as described in Experimental procedures. The 230
reconstructed genome-scale metabolic model (named iMF721) encompasses information on 721 231
ORFs (20.7% of the PhTAC125 protein encoding genes), 1133 metabolites and 1322 reactions 232
(Table 1). The model includes non-gene-associated reactions accounting for i) the biomass 233
assembly reaction (which also takes into consideration non-growth-associated ATP costs), ii) 48 234
reactions which filled gaps in the metabolic network (19 added by the “AUTOCOMPLETION” 235
function of the RAST annotation system, and 29 added during the manual evaluation of the model), 236
iii) 85 exchange reactions allowing the simulation of external conditions (e.g. nutrients exchange) 237
and iv) 17 spontaneous reactions. Additionally, during the gap-filling process sink and demand 238
reactions were added to the model when necessary. 239
Importantly, our model embeds almost all (93 out of 96, 97%) of the metabolism-related protein 240
inventory expressed by P. haloplanktis TAC125 with a complex amino acid mixture as the only 241
carbon and nitrogen source, as assessed by proteomics analysis (Wilmes et al., 2011). Also, the 242
model falls well within the range of currently available models of (more or less) closely related 243
microorganisms (Oberhardt et al., 2008; Puchalka et al., 2008; Flynn et al., 2012). On this basis, we 244
conclude that the iMF721 model should, in principle, be able to provide a comprehensive picture of 245
the metabolic features of PhTAC125. 246
iMF721 model validation 247
PhTAC125 seems to be well adapted to grow on rich media and in all media described for this 248
bacterium, amino acids were used as carbon and nitrogen source (Wilmes et al., 2010). Also, the 249
capability of this strain to grow on defined medium containing amino acids as the sole carbon 250
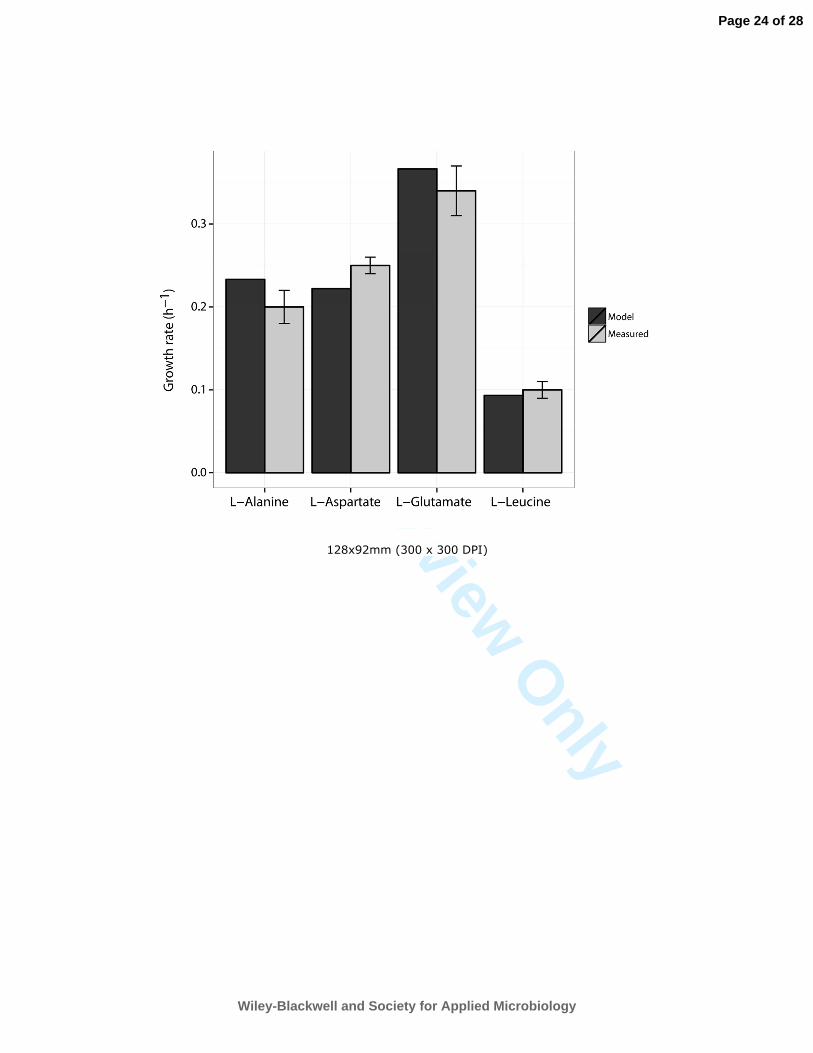
source (including L-leucine, L-alanine, L-aspartate and L-glutamate) has been previously shown 251
(Giuliani, 2011). To quantitatively assess the model’s accuracy in predicting growth rates, we 252
simulated growth phenotypes for minimal medium supplemented with these different amino acids 253
and compared the in vivo growth data with in silico prediction. 254
Accordingly, an in silico minimal growth medium was defined using exchange reactions present in 255
the model and biomass optimization was selected as the model objective function (O.F.). More in 256
detail, lower bounds of exchange reactions accounting for all the salts present in Schatz medium 257
(Papa et al., 2007) were set to -1000 mmol/g*h-1, in order to mimic non-limiting conditions. Each of 258
the aforementioned amino acids was then chosen as the unique carbon source of this in silico 259
medium. The PhTAC125 enzymatic capacity for these compounds was calculated as the ratio of the 260
Page 9 of 28
Wiley-Blackwell and Society for Applied Microbiology

For Peer Review O
nly
growth rate to the biomass yield in batch experiments (Varma and Palsson, 1994) and was set to 261
0.7, 3.6, 2.5 and 3.4 (mmol/g*h-1) for leucine, alanine, aspartate and glutamate, respectively. The 262
predicted growth rates were compared to those experimentally determined for PhTAC125 (Figure 263
1), revealing an overall agreement between experimentally determined growth rates and in silico 264
predictions. 265
Furthermore, we used Biolog Phenotype Microarray (PM) data (obtained at 15°C) to evaluate and 266
iteratively refine the iMF721 model. This is typically achieved by (qualitatively) comparing the 267
estimated flux value across biomass assembly reaction of the model with the activity directly 268
measured during phenotype microarray experiment. Of the 192 carbon sources tested with PM 269
microplates, 64 (~33%) were accounted for by the iMF721 model and thus could be used to directly 270
test model predictions. In silico growth on these substrates was simulated by setting each of them as 271
sole carbon source and its uptake rate to the arbitrary value of 1 mmol/g*h-1 (under aerobic 272
conditions). Simulation results (either “growth” or “no growth”) were compared with in vivo 273
determined phenotypes. Inconsistencies between simulation results and PM data allowed the 274
identification of metabolic gaps in the model and/or missing transport reactions. These included, for 275
example, the gluconate:H+ symporter (encoded by PSHAb0479), the pyruvate transporter 276
(putatively) encoded by PSHAa0587 and the ATP:D-fructose 6-phosphotransferase (encoded by 277
PSHAb0209); these genes were missing in the initial draft reconstruction and thus precluded the 278
model from using some of the tested carbon sources. 279
After this iterative refinement procedure, iMF721 growth phenotypes predictions were compared 280
again with PM results, revealing that in 84% of the cases (54 out of 64) the outcomes of in silico 281
simulations correctly matched growth phenotypes assessed by in vivo experiments (Table 2, Table 282
S3). Discrepancies in experimental and in silico growth phenotypes may be due to several factors, 283
including incomplete/incorrect homology-based gene annotation or regulatory mechanisms not 284
currently accounted for by the iMF721 reconstruction. However, all the observed incongruences 285
derived from the fact that the model and PM outcomes were “growth” and “no growth”, 286
respectively. In these cases, the wrong incorporation of transport reaction(s) in the iMF721 model is 287
the most likely explanation. It must be noted that, for at least two of the tested compounds (i.e. 288
leucine and mannose), the model predictions are probably correct since it has been previously 289
reported that PhTAC125 is able to utilize leucine and mannose as single carbon sources (Papa et al., 290
2006; Giuliani, 2011). However, it is also possible that such reactions were not detectable within the 291
incubation time (167h) at 15°C due to the slow metabolism of PhTAC125 in presence of leucine as 292
single c-source (Figure 1). Moreover the cut-off value considered in this work (“growth” if 293
OD>0.450) could have led to an underestimation of the overall agreement between Biolog 294
outcomes and in silico predictions as, for example, malate or succinate which resulted as “no 295
growth” because of their OD values <0.450 even if close to the cut-off (OD=0.384 and OD=0,372, 296
respectively). 297
The quantitative and qualitative evaluations of the predictive capability of the model reconstructed 298
herein falls within the range of those from most of the metabolic reconstructions available to date 299
(see, for example (Durot et al., 2008; Fang et al., 2011; Schatschneider et al., 2013; Bartell et al., 300
2014)), supporting iMF721 as being a reliable reconstruction of the central metabolism of this 301
bacterium. 302
Page 10 of 28
Wiley-Blackwell and Society for Applied Microbiology

For Peer Review O
nly
303
iMF721 robustness analysis following temperature downshift 304
The growth rates and the corresponding proteomes of PhTAC125 at 4° and 18°C have been recently 305
obtained (Piette et al., 2010; Piette et al., 2011). These results showed that this bacterium maintains 306
a doubling time of 4h at 4°C and that this value decreases to 1h40min when the culture temperature 307
is raised to 18°C. These studies also led to the identification of 123 differentially expressed genes 308
among the two temperatures (83 down- and 40 up-regulated). Importantly, the reconstructed 309
iMF721 model encompasses gene-protein relationship (GPR) for nearly half of them (65) and for 310
most of the metabolic genes showing a differential expression among the two conditions (54 out of 311
60, 90%) (Table S4). Since proteomics experiments were performed on cells grown in a culture 312
broth containing peptone, we simulated an amino acid rich medium by setting exchange reactions of 313
all amino acids to an arbitrary value of 1 mmol/g*h-1. FBA in this condition (with biomass 314
optimization as the O.F.) resulted into a predicted growth rate of 0.68 h-1, a value that resembles the 315
doubling time of PhTAC125 at 18°C (0.62h-1) on such medium (Piette et al., 2011). 316
First, we focused on evaluating the functional response of the PhTAC125’s metabolic model to the 317
temperature shift. To do this we exploited protein abundance information for this set of genes and a 318
recently proposed robustness-based approach (Tong et al., 2013). More in detail, we defined the 319
proteome and the corresponding reaction fluxes of PhTAC125 grown at 18°C as its optimal overall 320
metabolic state. Under the assumption that protein abundance can be proportional to the metabolic 321
reaction fluxes in bacteria (Rossell et al., 2011), we then conducted robustness analysis on iMF721 322
combining the information on up- and down-regulated genes (and corresponding growth rates) 323
obtained at 18°C (optimal temperature) and 4°C (perturbation temperature). According to this 324
general modelling framework, a reaction flux is disturbed from the optimal status by a perturbation 325
factor and the corresponding change in trend of cell growth is derived and compared to 326
experimental results. Specifically, since PhTAC125’s growth rate decreases when the bacterium is 327
facing lower temperatures, increasing or decreasing the flux in up- and down-regulated genes, 328
respectively, should result in slower biomass production. 329
To avoid possible ambiguous results, at this stage of the work we excluded from the analysis those 330
genes involved in multiple reactions showing conflicting results during robustness analysis. 331
Similarly, a set of 14 reactions displaying an optimal flux that remained non-unique throughout the 332
whole perturbation range (Figure S1) was not considered for the following step. Indeed, this set of 333
reactions cannot provide information concerning the capability of the iMF721 model of predicting 334
growth rate variations in response to external perturbations and further work will be necessary to 335
fully reconcile metabolic model predictions and in vivo effects of perturbing these genes. 336
For a set of 16 reactions an optimal flux could be identified (grey dots in Figure 2). Robustness 337
analysis of these reactions revealed that the iMF721 model is able to correctly predict the effect of 338
perturbation (i.e. up- or down-regulation of the corresponding genes) in 13 cases (81.25%, Figure 339
2a-o). For example, Figure 2a shows how, according to the model prediction, an increase in the flux 340
of the enzymatic reaction encoded by PSHAa1317 would be followed by a reduced growth rate. 341
This is in line with the reduced growth of PhTAC125 at 4°C and, in particular, the up-regulation 342
ratio of methionyl-tRNA synthetase has been tentatively related to the requirement of an increased 343
Page 11 of 28
Wiley-Blackwell and Society for Applied Microbiology

For Peer Review O
nly
pool of initiation tRNA to promote protein synthesis (Piette et al., 2010). The same overall pattern 344
applies to other tRNA synthetases (e.g. PSHAa0006 encoding Glycine tRNA ligase, PSHAa0518 345
encoding for Lysine tRNA ligase and so on). Conversely, the model predicts that a decrease in the 346
flux of the reaction encoded by PSHAa0649 (Xanthosine-5'-phosphateL-glutamine amido-ligase, 347
involved in purine metabolism) would be linked to a decrease of PhTAC125 growth rate (Figure 348
2b). Again this is compatible with the reduced biomass production observed for PhTAC125 at 4°C 349
(Piette et al., 2011). 350
Model reactions whose perturbation did not match proteomics outcomes (Figure 2p-r) included, for 351
example, (R)-S-Lactoylglutathione methylglyoxal-lyase (encoded by PSHAa1601); in this case a 352
decrease in the expression level of the corresponding genes was observed at 4°C, parallel to a 353
decrease in biomass production. Our model, instead, predicts a zero flux through this reaction in 354
correspondence to the optimal growth state and that an increase in of the flux through this reaction 355
would result in a decrease of the growth rate. The same pattern was observed PSHAa2168 and 356
PSHAa2935 encoding for phenylpyruvate oxygen oxidoreductase and 5-Aminolevulinate hydro-357
lyase, respectively. 358
Interestingly, also for those reactions for which a non-unique optimal value was identified, the 359
correct overall trend of growth rate following their perturbation (i.e. up- or down-regulation) was 360
identified in about 72.2% of the cases (13 out of 18 reactions, Figure S1). 361
Taken together, these results revealed that the iMF721 model correctly predicts the effect of gene 362
perturbation for 76.4% of the reactions whose perturbation had effect on the predicted growth rate. 363
This value is in line with studies on the effect of temperature downshift on other (core) metabolic 364
models (Tong et al., 2013) and suggests that our reconstruction is overall capable of (qualitatively) 365
capturing the response of PhTAC125’s metabolic system to a decreased growth temperature. 366
Integrating proteomics data with metabolic modelling 367
In order to globally examine changes in PhTAC125’s metabolism resulting from the temperature 368
transition, we integrated protein abundance data with constraints-based modelling of the iMF721 369
model. Up- and down-regulation ratios (and corresponding p-values) of protein expression were 370
combined with the iMF721 metabolic model using MADE (Metabolic Adjustment by Differential 371
Expression) (Jensen and Papin, 2011). Briefly, MADE creates a sequence of binary expression 372
states that matches the most statistically significant changes in the series of gene expression 373
measurements and, as such, it does not require an arbitrarily imposed gene expression threshold. 374
The resulting gene states produce functioning models that simulate the real metabolic functional 375
state of the cell, given the input expression values. Accordingly, this approach allows the 376
identification of two distinct metabolic models (functional metabolic states), i.e. the original 377
(optimal) iMF721 model and the one derived from simulating growth at lower temperature. These 378
two models will differ in that some of their reactions will be (completely) “turned on” or “off” 379
according to the measured levels of their corresponding proteins (and associated p-values). Overall, 380
12 genes (involved in 35 reactions) were turned on in the 4°C model (i.e. their expression showed 381
an increase in the transition between 18° and 4° growth temperature) whereas 33 (involved in 54 382
reactions in the model) were turned off (since they were down-regulated at 4°C). 383
Page 12 of 28
Wiley-Blackwell and Society for Applied Microbiology

For Peer Review O
nly
After mapping information on up- and down-regulated genes onto the iMF721 model, the predicted 384
(adjusted) growth rate decreased to 0.48 h-1; the 31% downshift in respect to the growth rate at 385
18°C (0.69 h-1) is compatible with experimental evidences on the reduced biomass production of 386
PhTAC125 at lower temperature (Piette et al., 2010). Also, this is line with the perturbation analysis 387
performed in the previous paragraph since “turning off” all the reactions whose genes are down-388
regulated basically corresponds to perturbing all of them simultaneously and recording consequent 389
changes in growth rate. 390
Notably, the same overall trend was observed when growth was simulated on Shatz medium 391
supplemented with each of the aforementioned amino acids as the sole carbon sources. In these 392
cases, the decrease of growth rates ranged from 10% (in the case of alanine) to 40% (with glutamate 393
as the sole carbon source). These results are also confirmed by preliminary Biolog data, showing an 394
overall reduced growth rate of PhTAC125 when grown at low temperatures with amino acids as the 395
sole carbon source (Mocali et al. manuscript in preparation). 396
We analyzed changes in fluxes distribution across the PhTAC125’s metabolism among the two 397
temperature conditions (4°C and 18°C); in both cases iMF721 was optimized for biomass 398
production using FBA. Overall, we found 209 reactions whose fluxes varied between the two 399
conditions (Figure 3, 4 and Table S5). In particular, 141 reactions displayed a reduced flux at 4°C in 400
respect to 18°C, whereas 68 reactions increased their flux in the shift between 18°C and 4°C. This 401
is in line with the overall number of induced vs. repressed genes in the two conditions and with the 402
observed decrease of the PhTAC125’s growth rate at 4°C (Piette et al., 2010; Piette et al., 2011). 403
Most of the reactions displaying a reduced metabolic activity belong to pathways involved in the 404
biosynthesis of compounds and the production of energy (Figure 3). These include most of the 405
reactions involved in the biosynthesis of purine and pyrimidine precursors, such as nucleoside 406
diphosphate kinase (E.C. 2.7.4.6, pyrimidine metabolism) or adenylosuccinate lyase (E.C. 4.3.2.2, 407
de novo purine biosynthesis). Similarly, fluxes through reactions belonging to glycolysis and 408
pentose phosphate pathway are strongly reduced at 4°C (Figure 3), thus hampering both energy 409
production and biosynthesis of important intermediates to be used in the assembly of nucleic acids 410
and amino acids. Also, amino acids biosynthetic pathways display a sensibly reduced activity at 411
4°C in respect to 18°C. These reactions include, for example, aspartokinase and aspartate-412
semialdehyde dehydrogenase (EC 2.7.2.4 and EC 1.2.1.11, respectively, involved in the initial steps 413
of the biosynthesis of the branched chains amino acids lysine and threonine), ketol-acid 414
reductoisomerase (EC 1.1.1.86, valine, leucine and isoleucine biosynthesis), histidinol 415
dehydrogenase (EC 1.1.1.23, histidine biosynthesis) and aspartate aminotransferase (EC 2.6.1.1, 416
aspartate biosynthesis). It is interesting to notice that, in the case of histidine biosynthesis, some of 417
the intermediates are also precursors for the biosynthesis of purines (e.g. Phosphoribosyl-ATP and 418
phosphoribulosyl-formimino-AICAR-phosphate); their reduced flux is thus compatible with the 419
decrease in PhTAC125’s growth rate at 4°C. 420
Reactions involved in amino acids degradation revealed an opposite trend (increased flux at 4 in 421
respect to 18°C). This is the case, for example, of cystathionine beta-lyase (EC 4.4.1.8), involved in 422
cysteine and methionine degradation and catalyzing the conversion of cystathionine to 423
homocysteine with the production of pyruvate; similarly fluxes through both threonine dehydratase 424
(EC 4.3.1.19, catalyzing the conversion of L-threonine to 2-oxobutanoate and representing the first 425
Page 13 of 28
Wiley-Blackwell and Society for Applied Microbiology

For Peer Review O
nly
step in threonine degradation, possibly leading to L-isoleucine) and the glycine cleavage system are 426
increased in the “4°C” metabolic model. Reactions devoted to fatty acids biosynthesis/metabolism 427
also increased their flux at 4°C. More precisely, 23 reactions involved in fatty acids metabolism 428
followed this trend (Figure 3), 7 of them being involved in fatty acids biosynthesis and 16 in fatty 429
acids elongation. These included, for example, i) acetyl-CoA carbon-dioxide ligase (EC 6.3.4.15), 430
providing the malonyl-CoA substrate for biosynthesis of fatty acids; ii) malonyl CoA-acyl carrier 431
protein transacylase (EC 2.3.1.39) represents a critical enzyme responsible for the transfer of the 432
malonyl moiety to holo-acyl carrier protein (ACP) forming the malonyl-ACP intermediates in the 433
initiation step of type II fatty acid synthesis (FAS II) in bacteria (Ruch and Vagelos, 1973); iii) (S)-434
Hydroxydecanoyl-CoA hydrolyase (EC:4.2.1.17), involved in fatty acids elongation, catalyzing the 435
formation of n-unsaturated fatty acyl-CoA (trans-dec-2-enoyl-CoA) from (S)-hydroxydecanoyl-436
CoA. The only reaction in fatty acids metabolism that displays a reduced flux at 4°C (Figure 3) is 437
Butanoyl-CoAoxygen 2-oxidoreductase (EC 1.3.3.6), catalyzing the conversion of butanoyl-CoA to 438
crotonoyl-CoA and being involved in fatty acids degradation. 439
Taking all these data together, it appears that the cell primary metabolic adjustment following (cold-440
dependent) changes in gene expression involves the reduction of the activity of its central 441
metabolism. Indeed, the metabolic network of PhTAC125 appears to be rewired towards the 442
reduction of the energetic costs associated to amino acids and nucleotide biosynthesis; conversely, 443
amino acids degradation and fatty acids metabolism are particularly active in this specific cellular 444
functional state. Notably, a similar functional pattern has been observed in other organisms 445
following a temperature downshift. In Bacillus subtilis, for example, genes involved in amino acids 446
and nucleotides biosynthesis were found to be down-regulated after a temperature downshift. 447
Conversely, genes involved in amino acids degradation and fatty acids metabolism showed an 448
increased expression at lower temperatures (Kaan et al., 2002). In this case, it was inferred that the 449
intermediates of amino acids degradation were redirected towards the synthesis of fatty acids which, 450
in turn, may contribute essentially to sufficient fluidity of the membrane under low-temperature 451
conditions. Alternatively, amino acids degradation may entail the reduced activity of glycolytic 452
reactions (as in the case of PhTAC125) and lead to the synthesis of compounds (such as pyruvate) 453
that can more easily feed into the major metabolic pathways (e.g., TCA cycle and fatty acids 454
biosynthesis). Thus, the functional outcome of changes in the expression of metabolic-related genes 455
of PhTAC125 seems to recapitulate common biological trends of cold adaptation. 456
A large body of data supports a link between fatty acids metabolism and adaptation to cold 457
temperature in bacteria. Indeed, a mechanism shared by cold-adapted microorganisms is to 458
manipulate membrane lipid composition (incorporation of lower-melting point unsaturated, short 459
chain and branched chain fatty acids) in order to maintain membrane fluidity for proper membrane 460
permeability and function of membrane protein complexes (Russell and Nichols, 1999). Changes in 461
fatty acids composition, for example, were observed in the lipooligosaccharide (LOS) fraction of 462
PhTAC125 cells grown at different temperatures (Corsaro et al., 2004). Additionally, many –omics 463
oriented experiments have captured an increased activity in fatty acids biosynthesis, at different 464
cellular levels. A quantitative proteomics survey for S. alaskensis, for example, revealed that 465
adaptation to growth at low temperature involves de novo synthesis of fatty acids in this bacterium 466
(Ting et al., 2010). Similarly, a recent metabolomics study on the cold acclimation of 467
Mesorhizobium sp. strain N33 revealed that (unsaturated) fatty acids biosynthesis probably plays a 468
Page 14 of 28
Wiley-Blackwell and Society for Applied Microbiology

For Peer Review O
nly
role in the specific metabolic responses to low temperatures. Finally, genomics-derived data 469
revealed the presence of a relatively large set of CDSs predicted to encode proteins functioning in 470
fatty acid biosynthesis in psychrophilic microorganisms (Methe et al., 2005), as well as in cold 471
environments in general (Simon et al., 2009; Varin et al., 2012). 472
The integration of expression data with functional modelling of PhTAC125 metabolism presented 473
herein has allowed the identification of possible metabolic consequences derived from the re-474
modulation of gene expression in response to cold adaptation. Our findings supports and extends 475
previous observations suggesting that this bacterium depresses its general metabolism when grown 476
at low temperature, in agreement with the reduced biomass produced at 4°C (Piette et al., 2011). 477
Also, despite different cold-adapted microorganisms are supposed to use different strategies to cope 478
with cold environments (Kawamoto et al., 2007), features similar to those observed in this Antarctic 479
strain (i.e. increased amino acids degradation and changes in fatty acids metabolism) have also been 480
observed in the metabolic landscape of other bacteria during cold adaptation (Graumann and 481
Marahiel, 1999; Ting et al., 2010). 482
483
Conclusions 484
In this work, we have reconstructed a genome-scale metabolic model of the strain P. haloplanktis 485
TAC125 (iMF721). To the best of our knowledge, this represents the first metabolic reconstruction 486
of a bacterium isolated from Antarctica. This model encompasses information on (roughly) 20% of 487
the proteins encoded by the PhTAC125 genome; also, it is worth of noticing that, when considering 488
purely metabolic genes, our model embeds information on 97% of such genes expressed at 16°C 489
(Wilmes et al., 2011). The iMF721 model was successfully validated against a set of experimentally 490
determined growth phenotypes (Figure 1 and Table 2), suggesting a reliable predictive potential. 491
Evidence synthesis from multiple data sources (including proteomics, phenomics, modelling and 492
physiology) allowed the study of the metabolic response of PhTAC125 to a temperature downshift 493
at the system level. First, we exploited robustness analysis to test whether the model was able to 494
correctly predict changes in trend of cell growth in response to variations in reaction fluxes under 495
perturbation (i.e. up- or down-regulation of the corresponding genes). Results of this analysis 496
revealed that model’s predictions matched experimental data in 76.4% of the cases. 497
Furthermore, biologically consistent metabolic adjustments caused by changes in gene expression at 498
the two growth temperatures were inferred by mapping protein abundance values onto the iMF721 499
reconstruction. The overall scenario emerging from comparing the reactions fluxes from 500
computational simulations at the two temperatures suggests that PhTAC125 depresses its general 501
metabolism following a switch between 18 and 4°C, compatibly with i) the amino acids enriched 502
nutritional environment of both in silico simulations and proteomics experiments, ii) the number of 503
up- vs. down-regulated genes and iii) the reduced growth rate of this strain at 4°C in respect to 504
18°C. In this context, amino acids degradation and fatty acids metabolism seem to cover an 505
important role. Amino acids could be used as important carbon and energy sources. Indeed, this 506
strategy represents an advantage in protein-rich environments and it is used also in cases in which 507
crucial metabolic processes (e.g. protein biosynthesis) are impaired (Fonknechten et al., 2010). 508
Fatty acids metabolism, in turn, may be linked to the manipulation of membrane lipid composition 509
Page 15 of 28
Wiley-Blackwell and Society for Applied Microbiology
For Peer Review O
nly
in order to maintain membrane fluidity for proper membrane permeability and function of 510
membrane protein complexes at low temperatures. Importantly, similar patterns, although at 511
different cellular levels (e.g. transcription), have been observed in other cold-adapted organisms. 512
Finally, it can be anticipated that the iMF721 model presented here will be a valuable platform for a 513
further understanding of PhTAC125 cellular physiology at the system level, including the design of 514
more focused strategies for its possible biotechnological exploitation. 515
516
Page 16 of 28
Wiley-Blackwell and Society for Applied Microbiology
For Peer Review O
nly
Acknowledgments 517
Marco Fondi was financially supported by a FEMS advanced fellowship (FAF2012). This work is 518
supported by two 2013 MIUR/PNRA grants (Piano Nazionale per la Ricerca in Antartide, PNRA 519
2013/B4.02 and 2013/AZ1.04). 520
521
References 522
Altschul, S.F., Madden, T.L., Schaffer, A.A., Zhang, J., Zhang, Z., Miller, W., and Lipman, D.J. (1997) Gapped 523
BLAST and PSI-BLAST: a new generation of protein database search programs. Nucleic Acids Res 25: 3389-524
3402. 525
Atlung, T., and Ingmer, H. (1997) H-NS: a modulator of environmentally regulated gene expression. Mol 526
Microbiol 24: 7-17. 527
Bakermans, C., Tollaksen, S.L., Giometti, C.S., Wilkerson, C., Tiedje, J.M., and Thomashow, M.F. (2007) 528
Proteomic analysis of Psychrobacter cryohalolentis K5 during growth at subzero temperatures. 529
Extremophiles 11: 343-354. 530
Bartell, J.A., Yen, P., Varga, J.J., Goldberg, J.B., and Papin, J.A. (2014) Comparative metabolic systems 531
analysis of pathogenic Burkholderia. J Bacteriol 196: 210-226. 532
Brandi, A., Pon, C.L., and Gualerzi, C.O. (1994) Interaction of the main cold shock protein CS7.4 (CspA) of 533
Escherichia coli with the promoter region of hns. Biochimie 76: 1090-1098. 534
Caspi, R., Foerster, H., Fulcher, C.A., Hopkinson, R., Ingraham, J., Kaipa, P. et al. (2006) MetaCyc: a 535
multiorganism database of metabolic pathways and enzymes. Nucleic Acids Res 34: D511-516. 536
Cavicchioli, R., Siddiqui, K.S., Andrews, D., and Sowers, K.R. (2002) Low-temperature extremophiles and 537
their applications. Curr Opin Biotechnol 13: 253-261. 538
Chen, X., Alonso, A.P., Allen, D.K., Reed, J.L., and Shachar-Hill, Y. (2011) Synergy between (13)C-metabolic 539
flux analysis and flux balance analysis for understanding metabolic adaptation to anaerobiosis in E. coli. 540
Metab Eng 13: 38-48. 541
Colijn, C., Brandes, A., Zucker, J., Lun, D.S., Weiner, B., Farhat, M.R. et al. (2009) Interpreting expression 542
data with metabolic flux models: predicting Mycobacterium tuberculosis mycolic acid production. PLoS 543
Comput Biol 5: e1000489. 544
Corchero, J.L., Gasser, B., Resina, D., Smith, W., Parrilli, E., Vazquez, F. et al. (2013) Unconventional 545
microbial systems for the cost-efficient production of high-quality protein therapeutics. Biotechnol Adv 31: 546
140-153. 547
Corsaro, M.M., Lanzetta, R., Parrilli, E., Parrilli, M., and Tutino, M.L. (2001) Structural investigation on the 548
lipooligosaccharide fraction of psychrophilic Pseudoalteromonas haloplanktis TAC 125 bacterium. Eur J 549
Biochem 268: 5092-5097. 550
Corsaro, M.M., Lanzetta, R., Parrilli, E., Parrilli, M., Tutino, M.L., and Ummarino, S. (2004) Influence of 551
growth temperature on lipid and phosphate contents of surface polysaccharides from the antarctic 552
bacterium Pseudoalteromonas haloplanktis TAC 125. J Bacteriol 186: 29-34. 553
D'Amico, S., Collins, T., Marx, J.C., Feller, G., and Gerday, C. (2006) Psychrophilic microorganisms: challenges 554
for life. EMBO Rep 7: 385-389. 555
Duilio, A., Tutino, M.L., and Marino, G. (2004) Recombinant protein production in Antarctic Gram-negative 556
bacteria. Methods Mol Biol 267: 225-237. 557
Durot, M., Bourguignon, P.Y., and Schachter, V. (2009) Genome-scale models of bacterial metabolism: 558
reconstruction and applications. FEMS microbiology reviews 33: 164-190. 559
Durot, M., Le Fevre, F., de Berardinis, V., Kreimeyer, A., Vallenet, D., Combe, C. et al. (2008) Iterative 560
reconstruction of a global metabolic model of Acinetobacter baylyi ADP1 using high-throughput growth 561
phenotype and gene essentiality data. BMC Syst Biol 2: 85. 562
Page 17 of 28
Wiley-Blackwell and Society for Applied Microbiology

For Peer Review O
nly
Fang, K., Zhao, H., Sun, C., Lam, C.M., Chang, S., Zhang, K. et al. (2011) Exploring the metabolic network of 563
the epidemic pathogen Burkholderia cenocepacia J2315 via genome-scale reconstruction. BMC Syst Biol 5: 564
83. 565
Feist, A.M., Henry, C.S., Reed, J.L., Krummenacker, M., Joyce, A.R., Karp, P.D. et al. (2007) A genome-scale 566
metabolic reconstruction for Escherichia coli K-12 MG1655 that accounts for 1260 ORFs and 567
thermodynamic information. Mol Syst Biol 3: 121. 568
Feller, G., and Gerday, C. (2003) Psychrophilic enzymes: hot topics in cold adaptation. Nat Rev Microbiol 1: 569
200-208. 570
Feng, X., and Zhao, H. (2013) Investigating xylose metabolism in recombinant Saccharomyces cerevisiae via 571
13C metabolic flux analysis. Microb Cell Fact 12: 114. 572
Flynn, C.M., Hunt, K.A., Gralnick, J.A., and Srienc, F. (2012) Construction and elementary mode analysis of a 573
metabolic model for Shewanella oneidensis MR-1. Biosystems 107: 120-128. 574
Fonknechten, N., Chaussonnerie, S., Tricot, S., Lajus, A., Andreesen, J.R., Perchat, N. et al. (2010) Clostridium 575
sticklandii, a specialist in amino acid degradation:revisiting its metabolism through its genome sequence. 576
BMC Genomics 11: 555. 577
Gao, H., Yang, Z.K., Wu, L., Thompson, D.K., and Zhou, J. (2006) Global transcriptome analysis of the cold 578
shock response of Shewanella oneidensis MR-1 and mutational analysis of its classical cold shock proteins. J 579
Bacteriol 188: 4560-4569. 580
Gille, C., Bolling, C., Hoppe, A., Bulik, S., Hoffmann, S., Hubner, K. et al. (2010) HepatoNet1: a 581
comprehensive metabolic reconstruction of the human hepatocyte for the analysis of liver physiology. Mol 582
Syst Biol 6: 411. 583
Giordano, D., Russo, R., di Prisco, G., and Verde, C. (2012) Molecular adaptations in Antarctic fish and 584
marine microorganisms. Mar Genomics 6: 1-6. 585
Giuliani, M.P., E. Ferrer, P. Baumann, K. Marino, G. Tutino, M.L. (2011) Process optimization for 586
recombinant protein production in the psychrophilic bacterium Pseudoalteromonas haloplanktis. Process 587
Biochemistry journal 46: 953-959. 588
Goodchild, A., Raftery, M., Saunders, N.F., Guilhaus, M., and Cavicchioli, R. (2005) Cold adaptation of the 589
Antarctic archaeon, Methanococcoides burtonii assessed by proteomics using ICAT. J Proteome Res 4: 473-590
480. 591
Graumann, P.L., and Marahiel, M.A. (1999) Cold shock response in Bacillus subtilis. J Mol Microbiol 592
Biotechnol 1: 203-209. 593
Henry, C.S., DeJongh, M., Best, A.A., Frybarger, P.M., Linsay, B., and Stevens, R.L. (2010) High-throughput 594
generation, optimization and analysis of genome-scale metabolic models. Nature biotechnology 28: 977-595
982. 596
Hoyoux, A., Blaise, V., Collins, T., D'Amico, S., Gratia, E., Huston, A.L. et al. (2004) Extreme catalysts from 597
low-temperature environments. J Biosci Bioeng 98: 317-330. 598
Inaba, M., Suzuki, I., Szalontai, B., Kanesaki, Y., Los, D.A., Hayashi, H., and Murata, N. (2003) Gene-599
engineered rigidification of membrane lipids enhances the cold inducibility of gene expression in 600
synechocystis. J Biol Chem 278: 12191-12198. 601
Jensen, P.A., and Papin, J.A. (2011) Functional integration of a metabolic network model and expression 602
data without arbitrary thresholding. Bioinformatics 27: 541-547. 603
Jones, P.G., VanBogelen, R.A., and Neidhardt, F.C. (1987) Induction of proteins in response to low 604
temperature in Escherichia coli. J Bacteriol 169: 2092-2095. 605
Jones, P.G., Krah, R., Tafuri, S.R., and Wolffe, A.P. (1992) DNA gyrase, CS7.4, and the cold shock response in 606
Escherichia coli. J Bacteriol 174: 5798-5802. 607
Kaan, T., Homuth, G., Mader, U., Bandow, J., and Schweder, T. (2002) Genome-wide transcriptional 608
profiling of the Bacillus subtilis cold-shock response. Microbiology 148: 3441-3455. 609
Kanehisa, M. (2002) The KEGG database. Novartis Found Symp 247: 91-101; discussion 101-103, 119-128, 610
244-152. 611
Kawamoto, J., Kurihara, T., Kitagawa, M., Kato, I., and Esaki, N. (2007) Proteomic studies of an Antarctic 612
cold-adapted bacterium, Shewanella livingstonensis Ac10, for global identification of cold-inducible 613
proteins. Extremophiles 11: 819-826. 614
Page 18 of 28
Wiley-Blackwell and Society for Applied Microbiology

For Peer Review O
nly
Medigue, C., Krin, E., Pascal, G., Barbe, V., Bernsel, A., Bertin, P.N. et al. (2005) Coping with cold: the 615
genome of the versatile marine Antarctica bacterium Pseudoalteromonas haloplanktis TAC125. Genome 616
Res 15: 1325-1335. 617
Methe, B.A., Nelson, K.E., Deming, J.W., Momen, B., Melamud, E., Zhang, X. et al. (2005) The psychrophilic 618
lifestyle as revealed by the genome sequence of Colwellia psychrerythraea 34H through genomic and 619
proteomic analyses. Proc Natl Acad Sci U S A 102: 10913-10918. 620
Milne, C.B., Kim, P.J., Eddy, J.A., and Price, N.D. (2009) Accomplishments in genome-scale in silico modeling 621
for industrial and medical biotechnology. Biotechnol J 4: 1653-1670. 622
Navid, A., and Almaas, E. (2012) Genome-level transcription data of Yersinia pestis analyzed with a new 623
metabolic constraint-based approach. BMC Syst Biol 6: 150. 624
Oberhardt, M.A., Puchalka, J., Fryer, K.E., Martins dos Santos, V.A., and Papin, J.A. (2008) Genome-scale 625
metabolic network analysis of the opportunistic pathogen Pseudomonas aeruginosa PAO1. J Bacteriol 190: 626
2790-2803. 627
Orth, J.D., Conrad, T.M., Na, J., Lerman, J.A., Nam, H., Feist, A.M., and Palsson, B.O. (2011) A comprehensive 628
genome-scale reconstruction of Escherichia coli metabolism--2011. Mol Syst Biol 7: 535. 629
Overbeek, R., Olson, R., Pusch, G.D., Olsen, G.J., Davis, J.J., Disz, T. et al. (2014) The SEED and the Rapid 630
Annotation of microbial genomes using Subsystems Technology (RAST). Nucleic acids research 42: D206-631
214. 632
Papa, R., Rippa, V., Sannia, G., Marino, G., and Duilio, A. (2007) An effective cold inducible expression 633
system developed in Pseudoalteromonas haloplanktis TAC125. J Biotechnol 127: 199-210. 634
Papa, R., Glagla, S., Danchin, A., Schweder, T., Marino, G., and Duilio, A. (2006) Proteomic identification of a 635
two-component regulatory system in Pseudoalteromonas haloplanktis TAC125. Extremophiles 10: 483-491. 636
Papa, R., Parrilli, E., Sannino, F., Barbato, G., Tutino, M.L., Artini, M., and Selan, L. (2013) Anti-biofilm 637
activity of the Antarctic marine bacterium Pseudoalteromonas haloplanktis TAC125. Res Microbiol 164: 638
450-456. 639
Papaleo, M.C., Romoli, R., Bartolucci, G., Maida, I., Perrin, E., Fondi, M. et al. (2013) Bioactive volatile 640
organic compounds from Antarctic (sponges) bacteria. N Biotechnol 30: 824-838. 641
Phadtare, S. (2004) Recent developments in bacterial cold-shock response. Curr Issues Mol Biol 6: 125-136. 642
Piette, F., D'Amico, S., Mazzucchelli, G., Danchin, A., Leprince, P., and Feller, G. (2011) Life in the cold: a 643
proteomic study of cold-repressed proteins in the antarctic bacterium pseudoalteromonas haloplanktis 644
TAC125. Appl Environ Microbiol 77: 3881-3883. 645
Piette, F., D'Amico, S., Struvay, C., Mazzucchelli, G., Renaut, J., Tutino, M.L. et al. (2010) Proteomics of life at 646
low temperatures: trigger factor is the primary chaperone in the Antarctic bacterium Pseudoalteromonas 647
haloplanktis TAC125. Mol Microbiol 76: 120-132. 648
Pinchuk, G.E., Hill, E.A., Geydebrekht, O.V., De Ingeniis, J., Zhang, X., Osterman, A. et al. (2010) Constraint-649
based model of Shewanella oneidensis MR-1 metabolism: a tool for data analysis and hypothesis 650
generation. PLoS Comput Biol 6: e1000822. 651
Puchalka, J., Oberhardt, M.A., Godinho, M., Bielecka, A., Regenhardt, D., Timmis, K.N. et al. (2008) Genome-652
scale reconstruction and analysis of the Pseudomonas putida KT2440 metabolic network facilitates 653
applications in biotechnology. PLoS Comput Biol 4: e1000210. 654
Reed, J.L., Vo, T.D., Schilling, C.H., and Palsson, B.O. (2003) An expanded genome-scale model of Escherichia 655
coli K-12 (iJR904 GSM/GPR). Genome Biol 4: R54. 656
Rippa, V., Papa, R., Giuliani, M., Pezzella, C., Parrilli, E., Tutino, M.L. et al. (2012) Regulated recombinant 657
protein production in the Antarctic bacterium Pseudoalteromonas haloplanktis TAC125. Methods Mol Biol 658
824: 203-218. 659
Rossell, S., Solem, C., Jensen, P.R., and Heijnen, J.J. (2011) Towards a quantitative prediction of the fluxome 660
from the proteome. Metab Eng 13: 253-262. 661
Ruch, F.E., and Vagelos, P.R. (1973) The isolation and general properties of Escherichia coli malonyl 662
coenzyme A-acyl carrier protein transacylase. J Biol Chem 248: 8086-8094. 663
Russell, N.J., and Nichols, D.S. (1999) Polyunsaturated fatty acids in marine bacteria--a dogma rewritten. 664
Microbiology 145 ( Pt 4): 767-779. 665
Saier, M.H., Jr., Tran, C.V., and Barabote, R.D. (2006) TCDB: the Transporter Classification Database for 666
membrane transport protein analyses and information. Nucleic Acids Res 34: D181-186. 667
Page 19 of 28
Wiley-Blackwell and Society for Applied Microbiology

For Peer Review O
nly
Sato, N., and Murata, N. (1980) Temperature shift-induced responses in lipids in the blue-green alga, 668
Anabaena variabilis: the central role of diacylmonogalactosylglycerol in thermo-adaptation. Biochim 669
Biophys Acta 619: 353-366. 670
Schatschneider, S., Persicke, M., Watt, S.A., Hublik, G., Puhler, A., Niehaus, K., and Vorholter, F.J. (2013) 671
Establishment, in silico analysis, and experimental verification of a large-scale metabolic network of the 672
xanthan producing Xanthomonas campestris pv. campestris strain B100. J Biotechnol 167: 123-134. 673
Scheer, M., Grote, A., Chang, A., Schomburg, I., Munaretto, C., Rother, M. et al. (2011) BRENDA, the enzyme 674
information system in 2011. Nucleic Acids Res 39: D670-676. 675
Schellenberger, J., Que, R., Fleming, R.M., Thiele, I., Orth, J.D., Feist, A.M. et al. (2011) Quantitative 676
prediction of cellular metabolism with constraint-based models: the COBRA Toolbox v2.0. Nat Protoc 6: 677
1290-1307. 678
Schilling, C.H., Edwards, J.S., Letscher, D., and Palsson, B.O. (2000) Combining pathway analysis with flux 679
balance analysis for the comprehensive study of metabolic systems. Biotechnol Bioeng 71: 286-306. 680
Seo, J.B., Kim, H.S., Jung, G.Y., Nam, M.H., Chung, J.H., Kim, J.Y. et al. (2004) Psychrophilicity of Bacillus 681
psychrosaccharolyticus: a proteomic study. Proteomics 4: 3654-3659. 682
Shivaji, S., and Prakash, J.S. (2010) How do bacteria sense and respond to low temperature? Arch Microbiol 683
192: 85-95. 684
Simon, C., Wiezer, A., Strittmatter, A.W., and Daniel, R. (2009) Phylogenetic diversity and metabolic 685
potential revealed in a glacier ice metagenome. Appl Environ Microbiol 75: 7519-7526. 686
Sledjeski, D.D., Gupta, A., and Gottesman, S. (1996) The small RNA, DsrA, is essential for the low 687
temperature expression of RpoS during exponential growth in Escherichia coli. EMBO J 15: 3993-4000. 688
Thiele, I., and Palsson, B.O. (2010) A protocol for generating a high-quality genome-scale metabolic 689
reconstruction. Nat Protoc 5: 93-121. 690
Ting, L., Williams, T.J., Cowley, M.J., Lauro, F.M., Guilhaus, M., Raftery, M.J., and Cavicchioli, R. (2010) Cold 691
adaptation in the marine bacterium, Sphingopyxis alaskensis, assessed using quantitative proteomics. 692
Environ Microbiol 12: 2658-2676. 693
Tong, W., Chen, Z., Cao, Z., Wang, Q., Zhang, J., Bai, X. et al. (2013) Robustness analysis of a constraint-694
based metabolic model links cell growth and proteomics of Thermoanaerobacter tengcongensis under 695
temperature perturbation. Mol Biosyst 9: 713-722. 696
Varin, T., Lovejoy, C., Jungblut, A.D., Vincent, W.F., and Corbeil, J. (2012) Metagenomic analysis of stress 697
genes in microbial mat communities from Antarctica and the High Arctic. Appl Environ Microbiol 78: 549-698
559. 699
Varma, A., and Palsson, B.O. (1994) Stoichiometric flux balance models quantitatively predict growth and 700
metabolic by-product secretion in wild-type Escherichia coli W3110. Appl Environ Microbiol 60: 3724-3731. 701
Wilkins, D., Yau, S., Williams, T.J., Allen, M.A., Brown, M.V., DeMaere, M.Z. et al. (2013) Key microbial 702
drivers in Antarctic aquatic environments. FEMS Microbiol Rev 37: 303-335. 703
Willem, S., Srahna, M., Devos, N., Gerday, C., Loppes, R., and Matagne, R.F. (1999) Protein adaptation to 704
low temperatures: a comparative study of alpha-tubulin sequences in mesophilic and psychrophilic algae. 705
Extremophiles 3: 221-226. 706
Wilmes, B., Hartung, A., Lalk, M., Liebeke, M., Schweder, T., and Neubauer, P. (2010) Fed-batch process for 707
the psychrotolerant marine bacterium Pseudoalteromonas haloplanktis. Microb Cell Fact 9: 72. 708
Wilmes, B., Kock, H., Glagla, S., Albrecht, D., Voigt, B., Markert, S. et al. (2011) Cytoplasmic and periplasmic 709
proteomic signatures of exponentially growing cells of the psychrophilic bacterium Pseudoalteromonas 710
haloplanktis TAC125. Appl Environ Microbiol 77: 1276-1283. 711
Xia, B., Ke, H., Shinde, U., and Inouye, M. (2003) The role of RbfA in 16S rRNA processing and cell growth at 712
low temperature in Escherichia coli. J Mol Biol 332: 575-584. 713
Yamada, T., Letunic, I., Okuda, S., Kanehisa, M., and Bork, P. (2011) iPath2.0: interactive pathway explorer. 714
Nucleic Acids Res 39: W412-415. 715
Zhang, W., Li, F., and Nie, L. (2010) Integrating multiple 'omics' analysis for microbial biology: application 716
and methodologies. Microbiology 156: 287-301. 717
Zheng, S., Ponder, M.A., Shih, J.Y., Tiedje, J.M., Thomashow, M.F., and Lubman, D.M. (2007) A proteomic 718
analysis of Psychrobacter articus 273-4 adaptation to low temperature and salinity using a 2-D liquid 719
mapping approach. Electrophoresis 28: 467-488. 720
Page 20 of 28
Wiley-Blackwell and Society for Applied Microbiology
For Peer Review O
nly
721
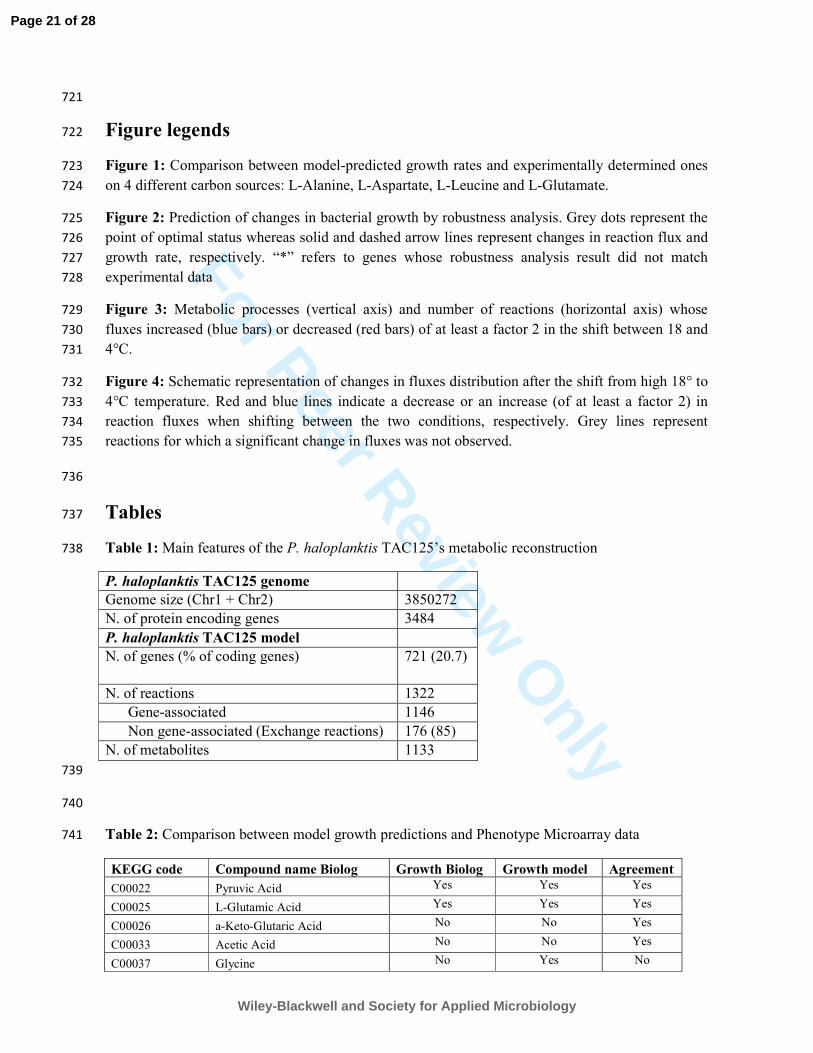
Figure legends 722
Figure 1: Comparison between model-predicted growth rates and experimentally determined ones 723
on 4 different carbon sources: L-Alanine, L-Aspartate, L-Leucine and L-Glutamate. 724
Figure 2: Prediction of changes in bacterial growth by robustness analysis. Grey dots represent the 725
point of optimal status whereas solid and dashed arrow lines represent changes in reaction flux and 726
growth rate, respectively. “*” refers to genes whose robustness analysis result did not match 727
experimental data 728
Figure 3: Metabolic processes (vertical axis) and number of reactions (horizontal axis) whose 729
fluxes increased (blue bars) or decreased (red bars) of at least a factor 2 in the shift between 18 and 730
4°C. 731
Figure 4: Schematic representation of changes in fluxes distribution after the shift from high 18° to 732
4°C temperature. Red and blue lines indicate a decrease or an increase (of at least a factor 2) in 733
reaction fluxes when shifting between the two conditions, respectively. Grey lines represent 734
reactions for which a significant change in fluxes was not observed. 735
736
Tables 737
Table 1: Main features of the P. haloplanktis TAC125’s metabolic reconstruction 738
P. haloplanktis TAC125 genome
Genome size (Chr1 + Chr2) 3850272
N. of protein encoding genes 3484
P. haloplanktis TAC125 model
N. of genes (% of coding genes) 721 (20.7)
N. of reactions 1322
Gene-associated 1146
Non gene-associated (Exchange reactions) 176 (85)
N. of metabolites 1133
739
740
Table 2: Comparison between model growth predictions and Phenotype Microarray data 741
KEGG code Compound name Biolog Growth Biolog Growth model Agreement
C00022 Pyruvic Acid Yes Yes Yes
C00025 L-Glutamic Acid Yes Yes Yes
C00026 a-Keto-Glutaric Acid No No Yes
C00033 Acetic Acid No No Yes
C00037 Glycine No Yes No
Page 21 of 28
Wiley-Blackwell and Society for Applied Microbiology

For Peer Review O
nly
C00041 L-Alanine Yes Yes Yes
C00047 L-Lysine No No Yes
C00048 Glyoxylic Acid No No Yes
C00049 L-Aspartic Acid No Yes No
C00058 Formic Acid No No Yes
C00062 L-Arginine No No Yes
C00064 L-Glutamine Yes Yes Yes
C00073 L-Methionine No No Yes
C00077 L-Ornithine No No Yes
C00079 L-Phenylalanine No No Yes
C00085 D-Fructose-6-Phosphate No No Yes
C00103 D-Glucose-1-Phosphate No No Yes
C00109 a-Keto-Butyric Acid No No Yes
C00116 Glycerol Yes Yes Yes
C00122 Fumaric Acid Yes Yes Yes
C00123 L-Leucine No Yes No
C00124 D-Galactose Yes Yes Yes
C00133 D-Alanine No No Yes
C00134 Putrescine No No Yes
C00135 L-Histidine No No Yes
C00137 m-Inositol No No Yes
C00140 N-Acetyl-D-Glucosamine No No Yes
C00148 L-Proline Yes Yes Yes
C00152 L-Asparagine Yes Yes Yes
C00156 4-Hydroxy-Benzoic Acid No No Yes
C00158 Citric Acid No No Yes
C00160 Glycolic Acid No No Yes
C00163 Propionic Acid No No Yes
C00164 Acetoacetic Acid No Yes No
C00183 L-Valine No No Yes
C00184 Dihydroxy-Acetone No No Yes
C00188 L-Threonine No No Yes
C00189 Ethanolamine No No Yes
C00208 Maltose Yes Yes Yes
C00209 Oxalic Acid No No Yes
C00212 Adenosine No Yes No
C00214 Thymidine No Yes No
C00246 Butyric Acid No No Yes
C00257 D-Gluconic Acid Yes Yes Yes
C00263 L-Homoserine No No Yes
C00270 N-Acetyl-Neuraminic Acid Yes Yes Yes
C00294 Inosine No Yes No
C00299 Uridine Yes Yes Yes
C00334 g-Amino-Butyric Acid No No Yes
C00392 D-Mannitol Yes Yes Yes
C00407 L-Isoleucine No No Yes
C00559 2`-Deoxy-Adenosine No Yes No
Page 22 of 28
Wiley-Blackwell and Society for Applied Microbiology

For Peer Review O
nly
C00624 N-Acetyl-L-Glutamic Acid No No Yes
C00645 N-Acetyl-b-D-Mannosamine No No Yes
C01089 b-Hydroxy-Butyric Acid Yes Yes Yes
C01835 Maltotriose Yes Yes Yes
C03383 D-Galactonic Acid-g-Lactone No No Yes
C00031 a-D-Glucose No No Yes
C00065 L-Serine Yes Yes Yes
C00623,C00093 L-Glycerol 1-phosphate No No Yes
C00149 L-Malic Acid No Yes No
C00092 D-Glucose-6-Phosphate No No Yes
C00159 D-Mannose No Yes No
C00085 D-Fructose-6-Phosphate No No Yes
742
743
Supporting Information 744
Table S1: Reactions (and corresponding coding genes) added/removed to/from the model during 745
the manual refinement procedure. 746
Table S2: Biomass assembly reaction for the iMF721 reconstructed model 747
Document S1: The SBML formatted iMF721 metabolic model 748
Table S3: Detailed information on the comparison between model growth phenotype predictions 749
vs. Biolog results and full Biolog data on PM1 and PM2. “1” stands for “Growth” and “0” stands 750
for “No growth” 751
Table S4: The whole set of protein abundance data obtained from previously published papers (see 752
text for details). Bold lines refer to those genes whose corresponding reactions are embedded in the 753
iMF721 reconstruction. 754
Figure S1: Robustness analysis for reactions with non-unique optimal flux. In a) an example of a 755
reaction showing a non-unique optimal flux throughout the robustness analysis is shown. b) to u) 756
reactions with non-unique optimal flux but whose perturbation still influences growth rate. “*” 757
refers to genes whose robustness analysis result did not match experimental data. 758
Table S5: Complete list of reactions whose fluxes increased or decreased by at least a factor of 2 in 759
the shift between 18 and 4°C 760
761
Page 23 of 28
Wiley-Blackwell and Society for Applied Microbiology
For Peer Review O
nly
128x92mm (300 x 300 DPI)
Page 24 of 28
Wiley-Blackwell and Society for Applied Microbiology

For Peer Review O
nly
214x210mm (300 x 300 DPI)
Page 25 of 28
Wiley-Blackwell and Society for Applied Microbiology

For Peer Review O
nly
146x78mm (300 x 300 DPI)
Page 26 of 28
Wiley-Blackwell and Society for Applied Microbiology

For Peer Review O
nly
1025x613mm (600 x 600 DPI)
Page 27 of 28
Wiley-Blackwell and Society for Applied Microbiology

For Peer Review Only
0 100 200 300 400 500 600 7000
0.1
0.2
0.3
0.4
0.5
0.6
0.7
0.8
0.9rxn00799
Reaction �ux (mmol/g*h −1)
Gro
wth
rate
(h− 1)
0 100 200 300 400 500 600 7000
0.1
0.2
0.3
0.4
0.5
0.6
0.7
0.8
0.9rxn00414
Reaction �ux (mmol/g*h −1)
Gro
wth
rate
(h− 1)
−100 0 100 200 300 4000
0.1
0.2
0.3
0.4
0.5
0.6
0.7
0.8
0.9rxn00290
Reaction �ux (mmol/g*h −1)
Gro
wth
rate
(h− 1)
−400 −300 −200 −100 00
0.1
0.2
0.3
0.4
0.5
0.6
0.7
0.8
0.9rxn01504
Reaction �ux (mmol/g*h −1)
Gro
wth
rate
(h− 1)
−200 0 200 400 600 8000
0.1
0.2
0.3
0.4
0.5
0.6
0.7
0.8
0.9rxn00256
Reaction �ux (mmol/g*h −1)
Gro
wth
rate
(h− 1)
−1000 −500 0 500 10000
0.1
0.2
0.3
0.4
0.5
0.6
0.7
0.8
0.9rxn00330
Reaction �ux (mmol/g*h −1)
Gro
wth
rate
(h− 1)
−1000 −800 −600 −400 −200 00
0.1
0.2
0.3
0.4
0.5
0.6
0.7
0.8
0.9rxn00336
Reaction �ux (mmol/g*h −1)
Gro
wth
rate
(h− 1)
0 100 200 300 4000
0.1
0.2
0.3
0.4
0.5
0.6
0.7
0.8
0.9rxn01241
Reaction �ux (mmol/g*h −1)
Gro
wth
rate
(h− 1)
−400 −200 0 200 400 6000
0.1
0.2
0.3
0.4
0.5
0.6
0.7
0.8
0.9rxn00692
Reaction �ux (mmol/g*h −1)
Gro
wth
rate
(h− 1)
−1000 −500 0 500 10000
0.1
0.2
0.3
0.4
0.5
0.6
0.7
0.8
0.9rxn00973
Reaction �ux (mmol/g*h −1)
Gro
wth
rate
(h− 1)
−600 −500 −400 −300 −200 −100 0 1000
0.1
0.2
0.3
0.4
0.5
0.6
0.7
0.8
0.9rxn01200
Reaction �ux (mmol/g*h −1)
Gro
wth
rate
(h− 1)
−500 −400 −300 −200 −100 0 1000
0.1
0.2
0.3
0.4
0.5
0.6
0.7
0.8
0.9rxn00785
Reaction �ux (mmol/g*h −1)
Gro
wth
rate
(h− 1)
0 100 200 300 400 500 600 7000
0.1
0.2
0.3
0.4
0.5
0.6
0.7
0.8
0.9rxn06493
Reaction �ux (mmol/g*h −1)
Gro
wth
rate
(h− 1)
0 100 200 300 400 500 600 7000
0.1
0.2
0.3
0.4
0.5
0.6
0.7
0.8
0.9rxn06377
Reaction �ux (mmol/g*h −1)
Gro
wth
rate
(h− 1)
−100 0 100 200 300 400 500 6000
0.1
0.2
0.3
0.4
0.5
0.6
0.7
0.8
0.9rxn01333
Reaction �ux (mmol/g*h −1)
Gro
wth
rate
(h− 1)
−300 −250 −200 −150 −100 −50 00
0.1
0.2
0.3
0.4
0.5
0.6
0.7
0.8
0.9rxn00086
Reaction �ux (mmol/g*h −1)
Gro
wth
rate
(h− 1)
PSHAa1565((S)-MalateNADP+ oxidoreductase)
0 200 400 600 800 10000
0.1
0.2
0.3
0.4
0.5
0.6
0.7
0.8
0.9rxn00285
Reaction �ux (mmol/g*h −1)
Gro
wth
rate
(h− 1)
−1000 −500 0 500 10000
0.1
0.2
0.3
0.4
0.5
0.6
0.7
0.8
0.9rxn01517
Reaction �ux (mmol/g*h −1)
Gro
wth
rate
(h− 1)
−1000 −500 0 500 10000
0.1
0.2
0.3
0.4
0.5
0.6
0.7
0.8
0.9rxn00119
Reaction �ux (mmol/g*h −1)
Gro
wth
rate
(h− 1)
PSHAa1228 and PSHAa1229Carbon-dioxideL-glutamine amido-ligase
PSHAa1447Succinyl-CoA3-oxo-acid CoA-transferase
PSHAa1653Citrate oxaloacetate-lyase
PSHAa2559Sedoheptulose-7-phosphateD-glyceraldehyde-3-phosphate
PSHAa1450(S)-3-Hydroxy-3-methylglutaryl-CoA hydro-lyase
PSHAb0061L-Malate glyoxylate-lyase
PSHAb0062Isocitrate glyoxylate-lyase
PSHAa0184 and PSHAa0159Citrate hydro-lyase
PSHAa2473Glycinelipoylprotein oxidoreductase
PSHAa0671Sedoheptulose-7-phosphateD-glyceraldehyde-3-phosphate
PSHAa0671D-Fructose 6-phosphateD-glyceraldehyde
3-phosphate glycolaldehyde
PSHAa0048 * or PSHAa1166(S)-Malate hydro-lyase
PSHAa0393*DihydrolipoamideNAD+ oxidoreductase
PSHAa2376*5,10-Methylenetetrahydrofolateglycine hydroxymethyltransferase
PSHAa0360*GlutathioneNADP+ oxidoreductase
PSHAa2473DihydrolipoylproteinNAD+ oxidoreductase
PSHAa2034*ATPdTMP phosphotransferase
PSHAa2034*ATPnucleoside-phosphate phosphotransferase
a b dc e
f g ih l
m n po q
r s ute
Page 28 of 28
Wiley-Blackwell and Society for Applied Microbiology