Chaste: using agile programming techniques to develop computational biology software
Upload
baylorhealthCategory
view
2download
0
Genome-Scale Computational Approaches to Memory-Intensive Applications in Systems Biology
Yun Zhang1, Faisal N. Abu-Khzam2, Nicole E. Baldwin3, Elissa J. Chesler4, Michael A. Langston1,5, and Nagiza F. Samatova3,5
1Department of Computer Science, University of Tennessee, Knoxville, TN 37996-3450, USA 2Division of Computer Science and Mathematics, Lebanese American University, Chouran, Beirut, Lebanon 3Computational Biology Institute, Oak Ridge National Laboratory, P.O. Box 2008, Oak Ridge, TN 37831, USA 4Department of Anatomy and Neurobiology, University of Tennessee, Memphis, TN 38163, USA 5Corresponding authors: [email protected] and [email protected] Abstract Graph-theoretical approaches to biological network analysis have proven to be effective for small networks but are computationally infeasible for comprehensive genome-scale systems-level elucidation of these networks. The difficulty lies in the NP-hard nature of many global systems biology problems that, in practice, translates to exponential (or worse) run times for finding exact optimal solutions. Moreover, these problems, especially those of an enumerative flavor, are often memory-intensive and must share very large sets of data effectively across many processors. For example, the enumeration of maximal cliques – a core component in gene expression networks analysis, cis regulatory motif finding, and the study of quantitative trait loci for high-throughput molecular phenotypes – can result in as many as 3n/3 maximal cliques for a graph with n vertices. Memory requirements to store those cliques reach terabyte scales even on modest-sized genomes. Emerging hardware architectures with ultra-large globally addressable memory such as the SGI Altix and Cray X1 seem to be well suited for addressing these types of data-intensive problems in systems biology. This paper presents a novel framework that provides exact, parallel and scalable solutions to various graph-theoretical approaches to genome-scale elucidation of biological networks. This framework takes advantage of these large-memory architectures by creating globally addressable bitmap memory indices with potentially high compression rates, fast bitwise-logical operations, and reduced search space. Augmented with recent theoretical advancements based on fixed-parameter tractability, this framework produces computationally feasible performance for genome-scale combinatorial problems of systems biology. 1. Introduction Ultrascale computing and high-throughput experimental technologies used in support of such fields of study as genomics, transcriptomics, proteomics and metabolomics will revolutionize the way systems biology is conducted. High-throughput experimental pipelines provide many revealing snapshots of dynamic cellular processes as they progress in time and space. Considered in total, the wealth of data produced by these methods provides a unique opportunity to build mathematical models of molecular interaction networks including physical, chemical, and biological processes at an unprecedented level of detail, and to use ultrascale computation for predictive simulation of their dynamics to guide experimental studies. With this promise, however, comes the challenge of interpreting and integrating, in a biologically meaningful way, the avalanche of complex and noisy data. The combination of huge scale and high complexity in systems biology makes this data-intensive science an excellent choice to drive the development of novel computational solutions in both hardware and software.
Over the past decade, advances in scientific computing have primarily focused on scientific simulations from “first principles,” as in the fields of astrophysics, climate modeling, fusion and materials science. The result is that high-end computing hardware is relatively well configured to run scientific simulation software and to store the massive amounts of data that it produces. Fundamental differences exist, however, between the scientific method cycle of applications from “first principles” and those of systems biology. The starting point of the former is a mathematical model, often expressed in terms of a system of equations. Unlike simulations from “first principles,” systems biology starts from analysis and interpretation of massive amounts of data. These data are needed for building the model and for constraining the space of possible models to those that are computationally tractable yet biologically plausible. Organism specific genomics, proteomics and metabolomics data needs to be analyzed both within species and comparatively. Most full context biological data analysis, modeling and simulation software

requires the entire data set to be in memory. This allows for efficient and frequent access to terabytes of irregularly structured data in dynamically allocated storage. Scaling up to full context places significant constraints on computer memory and memory access rates, as well as the compute power for the processors, and requires a somewhat different balance of performance and algorithmic principles as compared to other domains.
These multi-scale and data-intensive challenges are especially apparent in the systems-level biological applications that we describe here. The elucidation of genome-scale biological networks [1-4] necessitates the development of more efficient and effective methods for the analysis of their integrated properties and the comparison of these properties amongst different organisms. As comparative analysis of sequence data across multiple organisms has proven immensely useful for analyzing the structure and function of genomes, interest has grown in performing similar comparative analyses and computations on molecular networks. Specifically, biologists are interested in: (a) functional modules (e.g., metabolic pathways) conserved across multiple genomes; (b) common regulatory motifs across several regulatory networks; (c) cross-talk networks among individual response networks; and (d) sets of genes co-regulated in response to genetic or environmental perturbations.
Various computational methods have been developed for processing these intelligent queries over biological networks to understand their inner workings and to predict behaviors in response to changes in environmental and genetic conditions. Systemic pathways oriented approaches [5-8] centered around properties of metabolic networks at steady state (stoichiometry) have been successfully used to define the limitations and production capabilities of various metabolic systems [9, 10]. Computational approaches to defining and comprehensively describing all metabolic routes (phenotypes) that are both stoichiometrically and thermodynamically feasible for a given metabolic genotype are based on the mathematical principles of convex analysis. The enumeration of a complete set of “systemically independent” metabolic pathways, termed “extreme pathways” is at the core of these approaches [8, 11, 12]. Clique enumeration is a key approach to solving these real-world systems biological problems.
Studying the integrated function of an organism also requires a systematic description of the processes that regulate metabolism. Regulation occurs at multiple levels, including transcriptional control of mRNA abundance and a variety of post-transcriptional regulatory mechanisms such as kinetic regulation of enzymatic function. Transcriptional regulation constitutes perhaps the most experimentally tractable of these regulatory mechanisms. New technology in the measurement of gene expression and the identification of cis-regulatory binding sites, along with complementary computational methods, make it possible to discover transcriptional regulatory networks [13-15]. Network construction often requires the ability to assess simultaneously the effects of small perturbations of a large number of nodes and to examine the resultant continuous variation in gene expression that results. Once the network modules are defined, the study of their direct and indirect regulatory pathways by biological experimentation and statistical analysis becomes feasible. Recent developments have led to a proliferation of datasets consisting of many independent observations of high-throughput molecular phenotypes. These measures may be collected across time, tissue compartment or, as in the case of our recent work, across a mouse genetic reference population [16, 17]. This type of population models the genetic variation present in more complex populations, but reduces the genetic analysis to a simple correlation of many attributes that can be obtained across all levels of biological scale.
The ability to use graph theoretical algorithms to understand the relations among genes with co-variant expression across these conditions has allowed biologists to identify functionally connected gene products. The gene products need not physically interact, nor do they need to be tightly co-regulated at a transcriptional level, i.e. by a common transcription factor. For example, in the mouse brain one or more gene products may cause heightened activation of the neuronal synapse in certain strains of mice. This might in turn ultimately trigger many parallel transcriptional processes temporarily coupled to carry out highly specialized cellular processes. Using clique-based methods, it is possible to detect novel and transitory associations among transcripts, even when these associations do not involve direct physical interactions. Enumerating maximal cliques defines pure functional units, each affected by a unique combination of sources of co-variation. The ability to generate cliques, paracliques and other forms of densely-connected subgraphs allows us to separate these causes, and to place them in a larger systems-level graph, thus facilitating genome-scale regulatory network elucidation [17].
Elucidating protein-interaction networks including protein-protein, protein-DNA, protein-RNA or protein-ligand bindings is a considerably more daunting task. Besides being present in low concentrations, proteins are constantly undergoing state changes by forming complexes with other proteins, undergoing covalent modifications and binding to one or more substrates. Deciphering such spatiotemporal variations in a dynamic cell is beyond the scope of current technology. Most current efforts focus on analyzing a cellular milieu for specific proteins using immunoprecipitation and tagging methods [18, 19]. Interactions among the myriad proteins are best studied through fluorescence and microscopy methods [20]. Nevertheless, the yeast two-hybrid method is considered the best available strategy for mapping protein–protein interactions on a large scale [21] despite the high potential for false

positive identifications. Further, this method can only provide a potential list of interactions and not the specific interactions involved in a given pathway.
To extract true interactions from the false positive and false negative rates, one can represent the data as undirected graphs to record pairs of proteins that are experimentally observed to interact with each other. Then, queries consisting of Boolean graph operations (e.g., graph intersection and at-least-k-of-n over multiple graphs) can be used to refine the data. Once the data has been cleaned, one can discover uncharacterized functional modules, by looking for conserved protein interaction pathways using pathway alignment [22] based on optimization techniques such as dynamic programming.
The existing computational tools, such as ones described above, have contributed substantially to our understanding of biological systems. However, there remains an inability to apply these methods efficiently to organism-scale biological networks [1, 6, 9], especially in the context of comparative analysis. For example, generating the set of extreme pathways is simple for small networks. For genome-scale networks, however, the calculation of extreme pathways poses a significant computational challenge. The computational time as well as the number of extreme pathways grows exponentially as the size of the metabolic network grows linearly. The problem of enumerating the extreme pathways can be reduced in polynomial time to the problem of enumerating all vertices of an n-dimensional convex polyhedron that is known to belong to the class of NP-hard problems. This computational intractability bottleneck has been addressed by considering the reduced reaction network (with the enzyme subsets taken as combined reactions [11, 23], by decomposing the network into computationally feasible subsystems to generate pathways in each subsystem that may be pieced together [9], or by developing parallel out-of-core algorithms [24].
Likewise, while efficient in analyzing biological networks of small size (tens of nodes), many graph-theoretical approaches are computationally challenged on genome-scale applications (hundreds or thousands of nodes), especially those in the context of comparative analysis among different organisms. This fact is mainly due to NP-hardness of the problems under study that, in practice, translates to exponential (or worse) run times, which tend not to scale as the problem size grows. Even though approximate solutions with polynomial run times have been proposed for many of those problems, the exact solutions are largely preferred. This is especially true in light of the huge time and expense involved in data capture.
In addition to being computationally complex, many of these algorithms are extremely memory intensive. For example, it is well known that a network with n nodes can have as many as 3n/3 maximal cliques [25], thus the memory requirement may grow exponentially with the size of the network, and may reach even petabyte scale on even modest-sized genomes. We already observed the need for at least 1.5-2 TBytes memory during the analysis of the Affymetrix U74Av2 microarray data used to test 12,422 probe sets in samples from the brain of Mus musculus [17]. To deal with such large memory requirements we have previously developed an out-of-core algorithm based on the recursive branching procedure suggested by Kose et al in their analysis of metabolomic correlation networks [26]. However, the algorithm could not finish after one week of execution on the graphs derived from this microarray data using various threshold values for correlation of genes. Intensive disk I/O access has been the major bottleneck.
To address these computational bottlenecks to genome-scale elucidation of biological networks, we present a general framework that provides exact, parallel and scalable solutions to various graph-theoretical approaches by taking advantage of: (a) ultra-large globally addressable memory architectures such as SGI Altix or Cray X1; (b) the theory of fixed parameter tractability (FPT); and (c) a novel bitmap data representation scheme for memory saving and search space reduction. We demonstrate the applicability of our framework to the problem of enumeration of maximal cliques [27], which is ubiquitous in the context of cis regulatory motif finding [28], microarray analysis [16], the study of quantitative trait loci [17], and the construction of ClustalXP [29] for high-performance multiple sequence alignment.
The rest of the paper is organized as follows. We first describe approaches to clique enumeration and our novel strategy for maximal clique, Clique Enumerator, including both sequential and multithreaded implementations. This is followed by an evaluation of the performance of these implementations compared to Kose RAM. This performance evaluation includes an evaluation of speed-up with load balancing. We close with a discussion of our future directions, both in biological applications and in computational approaches. 2. Maximum and maximal clique algorithms Clique (decision version) is a well-known NP-complete problem in the field of graph theory. Informally, a clique in graph, G, is defined as a set of vertices in G that are completely connected. That is, for every pair of vertices in the clique, there exists an edge between them. Thus, every vertex in a clique is related in some user-defined fashion.

Two derivations of the clique problem are frequently used for analysis of biological datasets. Maximum clique requires the algorithm to identify the largest clique in the graph. In contrast, maximal clique enumerates all maximal cliques in the graph, where a maximal clique is defined as a clique that cannot be enlarged by the addition of any vertex in the graph. By definition, there is no constraint on the size of a maximal clique. Considering that the cliques of interest are typically relatively large and that there are potentially an exponential number of undesired maximal cliques in a given graph, it is clear that a method to limit maximal clique enumeration by size is required.
We describe such a strategy in the following section. Using a maximum clique algorithm to determine an upper bound on clique size (Section 2.1), we then enumerate all k-cliques (maximal and non-maximal), where k is the user-supplied lower bound (Section 2.2). A maximal clique enumeration algorithm (Section 2.3) is then employed using the non-maximal k-cliques as input. This algorithm enumerates maximal cliques in increasing order of size until the upper bound is reached, allowing the user to track the algorithm’s progress, an essential feature when dealing with such computationally complex problems.
2.1 Maximum clique and upper bounds In the process of maximal clique enumeration, it is often useful first to identify the size of a graph's maximum clique. Computing maximum clique is foundational in a variety of biological settings, for example, when establishing the edge-weight threshold in microarray analysis [17], when searching for common cis regulatory elements [28], and when solving the compatibility problem in phylogeny [30]. In fact, the utility of maximum clique extends to a great many application domains. A nice survey can be found in [31].
The decision version of maximum clique is a classic NP-complete problem. From an asymptotic standpoint, the fastest known general-purpose maximum clique algorithms are based on independent sets and run in O(2n/4) time, where n is the order of the input graph [32]. By exploiting the desired clique size, however, we can do much better via reduction to vertex cover and employing the notion of fixed parameter tractability (FPT). A problem is FPT if it has an algorithm that runs in O(f(k)nc) time, where n is the problem size, k is the input parameter, and c is a constant independent of both n and k [33]. FPT can be traced at least as far back as work done on applications of well-quasi order theory [34-36], where the main objective was to show, via the Graph Minor Theorem, that a variety of NP-complete problems are actually tractable when the relevant input parameter is fixed. The fastest currently-known vertex cover algorithm runs in O(1.2759kk1.5+kn) time [37]. Recent FPT implementations of vertex cover as used to solve maximum clique are described in [38, 39].
2.2 Clique enumeration and lower bounds The two most-frequently cited algorithms [40] utilize a recursive backtracking strategy to enumerate maximal cliques. Although shown in [1] to be efficient algorithms relative to other popular maximal clique enumeration algorithms both Bron and Kerbosch algorithms, called herein Base BK and Improved BK, share the same drawbacks. Both discover maximal cliques in a quasi-random fashion, despite the tendency of Improved BK to discover larger cliques first. Therefore, neither algorithm satisfies our requirement for an algorithm to discover maximal cliques in non-decreasing order relative to size. However, they do provide a sound foundation for an algorithm to enumerate all cliques, maximal and non-maximal, of size k in canonical order.
Both Base and Improved BK algorithms can be viewed as a depth-first traversal of a search tree based on three dynamically changing sets:
• COMPSUB, a global set containing the clique-in-progress, • CANDIDATES, a local set holding all vertices that will eventually be added to the current COMPSUB, and • NOT, a local set containing all vertices that have been previously added to COMPSUB.
Both CANDIDATES and NOT are initially empty, while CANDIDATES contains all vertices in the graph. At each node of the search tree, the function EXTEND selects a vertex, v, from CANDIDATES, which is removed from CANDIDATES and added to COMPSUB. Local sets are generated, where set NEW_CANDIDATES is the intersection of CANDIDATES and the neighborhood of v and set NEW_NOT, is the intersection of NOT and the neighborhood of v. COMPSUB contains a maximal clique when both local sets NEW_CANDIDATES and NEW_NOT are empty (i.e. no vertex remains that is completely connected to COMPSUB). If a maximal clique has not been found, EXTEND is called again, passing sets NEW_CANDIDATES and NEW_NOT as arguments to become the child node’s CANDIDATE and NOT sets, respectively. When a maximal clique is discovered or when returning from a child node, the current v is removed from COMPSUB and added to NOT, ensuring that neither the current search tree node nor any of its children will try to find any other maximal clique containing v. EXTEND then selects a new v, iterating through the described actions until CANDIDATES is exhausted.

The algorithms differ in two significant ways. When choosing the selected vertex, v, Base BK always chooses in the order in which the vertices are presented in CANDIDATES. In contrast, Improved BK initially chooses a v with the highest number of connections to the remaining members of CANDIDATES. After finding a maximal clique or returning from a child node, Improved BK only considers vertices that are not connected to the current v. This enables Improved BK to operate more efficiently on graphs with a high number of overlapping cliques [1]. However, these methods of reducing branch traversal are predicated on the need to find only maximal cliques. When finding both maximal and non-maximal cliques of a specified size, these constraints are no longer beneficial. Given k, it is more efficient to eliminate all vertices of degree less than k-1 during preprocessing (such vertices cannot be members of any k-clique by definition) than to select a vertex of highest connectivity on each call to EXTEND. Additionally, refusing to select vertices connected to the current v upon finding a maximal clique or returning from a child node prevents discovery of overlapping cliques where at least one is non-maximal. For these reasons, Base BK was chosen as the basis for our algorithm.
Our algorithm, called herein k-clique enumerator, is altered in two main respects as compared to the original Bron and Kerbosch algorithms. Firstly, when the size of COMPSUB equals k, sets NEW_CANDIDATES and NEW_NOT are examined. If both sets are empty, then (as in BK Base and BK Improved) a maximal k-clique has been found and is output as such. Otherwise, a non-maximal k-clique has been found. It is output separately to be provided as input to the algorithm of [26], and EXTEND returns. Secondly, we introduce a boundary condition. If at any point there are less than k vertices in the union of sets COMPSUB and CANDIDATES, it is not possible to form a k-clique with the current COMPSUB and CANDIDATES and EXTEND returns.
2.3 A new maximal clique enumeration algorithm In this section, we propose a new (Clique Enumerator) algorithm to enumerate maximal cliques of size bounded by a given range. The algorithm is inspired by a characteristic property of cliques described in [26]. That is, any k-clique (k ≥ 3) is comprised of two (k-1)-cliques that share (k-2) vertices, as shown in Figure 1. This property also implies that any (k-1)-clique is maximal if it is not a component of any k-cliques; otherwise, it is non-maximal.
The Kose et al. algorithm takes as input a list of all edges (2-cliques) in non-repeating canonical order, generates all possible (k+1)-cliques from all k-cliques, checks for all k-cliques to see if they are components of a (k+1)-clique after it is generated, declares a k-clique maximal if it is not a component of any (k+1)-cliques, outputs all the maximal k-cliques, and repeats this procedure until there is no (k+1)-clique generated. This algorithm provides two features that are unavailable in other methods, including those of [40] . The algorithm enumerates maximal cliques in non-decreasing order, and it prevents repetitive generation of non-maximal clique components in the search for maximal cliques [1]. However, the algorithm has some less then appealing features. First, it requires storage of all k-cliques and (k+1)-cliques, which assumes enormous amount of memory. Although secondary storage such as disk can be used, the overhead of disk I/O operations is tremendous. Second, in order to decide if a clique is maximal, the algorithm has to check for each (k+1)-clique to see if it contains any k-clique as its subgraph, which not only requires a search of all k-cliques, but also makes the algorithm hard to parallelize. The basic ideas The algorithm we propose keeps the advantage of Kose et al. in the sense that it enumerates maximal cliques in non-decreasing order while it addresses its disadvantages. The algorithm is based on the same principle with additional observations. First, a k-clique is a candidate to generate (k+1)-cliques if and only if it is a subgraph of a (k+1)-clique. Thus, it is not necessary to keep all k-cliques to generate (k+1)-cliques; only the candidate k-cliques are needed. A k-clique is not a subgraph of any (k+1)-clique if either it is maximal, or it does not have (k-1) vertices shared with
any other k-clique. Second, the (k-1) vertices shared by two k-cliques also form a clique. Thus the k-cliques generated from a same (k-1)-clique naturally form a sub-list consisting of the (k-1)-clique with a list of common neighbors of this (k-1)-clique. A vertex is a common neighbor of a clique if and only if this vertex is outside the clique and is adjacent to all vertices in the clique. Thus, deciding if a k-clique shares (k-1) vertices with any other k-cliques it is simply necessary to decide if a k-clique is the only clique in a sub-list or not. If it is, it does not share (k-1) vertices with any other k-cliques. Moreover, to avoid the duplication of cliques, only the common neighbors whose indices higher than the index
(k-1)-cliques k-clique
Figure 1: A k-clique consists of two (k-1)-cliques that share (k-2) vertices

Vertex Neighbors Clique Common neighbors
Maximal or not
a 0111 (a, b) 0011 No b 1011 (a, b, c) 0001 No c 1101 (a, b, d) 0010 No d 1110 (a, b, c, d) 0000 Yes
a
b
c
d
Figure 2: An example of bit strings representing common neighbors of cliques in a graph.
of the (k-1)-th vertex need to be kept in a k-clique sub-list. Third, any clique is maximal if the clique has no common neighbors. If a k-clique has any common neighbor, the k-clique together with any one of the common neighbors can form a (k+1)-clique. Thus, it is not necessary to check all (k+1)-cliques to test if the k-clique is contained in any of them, but only to check if the clique has any common neighbors. The sequential algorithm The sequential algorithm takes as input a list of candidate k-cliques in canonical order, generates (k+1)-cliques from all candidate k-cliques, decides and outputs the maximal (k+1)-cliques, keeps the candidate (k+1)-cliques, and repeats until no candidate (k+1)-cliques are generated. The k-cliques that share (k-1) vertices form a k-clique sub-list. To generate (k+1)-cliques, for each k-clique sub-list, the vertices in the list of common neighbors (k-th vertex of each k-clique) are compared to the other common neighbors with higher indices to check the adjacency. If two common neighbors are adjacent to each other, a new (k+1)-clique is generated. Those (k+1)-cliques generated from a same k-clique form a new (k+1)-clique sub-list. Each k-clique sub-list is deleted after its (k+1)-cliques are generated. When a (k+1)-clique is generated, it is determined to be maximal or not by checking if the clique has any common neighbors. The non-maximal (k+1)-cliques in those sub-lists that contain more than one non-maximal cliques are regarded as candidates.
The procedure of finding the common neighbors of a clique can be solved by representing the common neighbors as a binary (bit) string and then by bit operations. The bit string representing the common neighbors of a clique contains ⎡n/8⎤ bytes, where n is the number of vertices in the graph. Each bit represents the adjacency between the clique and a vertex that is not in the clique, such that, the i-th bit is set to ‘1’ if all vertices in the clique are adjacent to the i-th vertex, and is set to ‘0’ otherwise. Thus, the common neighbors of a k-clique can be computed by bitwise AND operations of neighbors of the k vertices in the clique. Determination of clique maximality can be made by a bit ‘1’ existence checking operation on common neighbors of the clique. For example, in the graph shown in Figure , the bit string of common neighbors of 3-clique (a, b, c) is 0001, which has a ‘1’ bit in it, thus clique (a, b, c) is non-maximal. The bit string of the 4-clique (a, b, c, d) is 0000, which is all zeros, thus clique (a, b, c, d) is maximal.
The algorithm requires computing the common neighbors of a k-clique to check if it is maximal. The common neighbors of a k-clique can be computed by either (k-1) bitwise AND operations on neighbors of the k vertices, or one bitwise AND operation on common neighbors of a (k-1)-clique and neighbors of a vertex. The first method requires no more memory but will perform bitwise AND operations on the same bit strings repeatedly, while the second method is faster but requires keeping the common neighbors of a (k-1)-clique. Thus, the algorithm keeps the common neighbors of the shared (k-1)-clique for each k-clique sub-list instead of each k-clique, which avoids large memory requirement as well as repetitive bit operations. For each k-clique sub-list, the common neighbors of the (k-1) vertices shared by all k-cliques are kept. Then, only two bitwise AND operations are needed. Taking the same example shown in Figure , 3-cliques (a, b, c) and (a, b, d) sharing clique (a, b) forms a sub-list. The common neighbors of clique (a, b, c, d) can be computed from a bitwise AND operation on neighbors of vertex d and common neighbors of (a, b, c), which is computed from bitwise AND operations on neighbors of vertex c and common neighbors of (a, b).
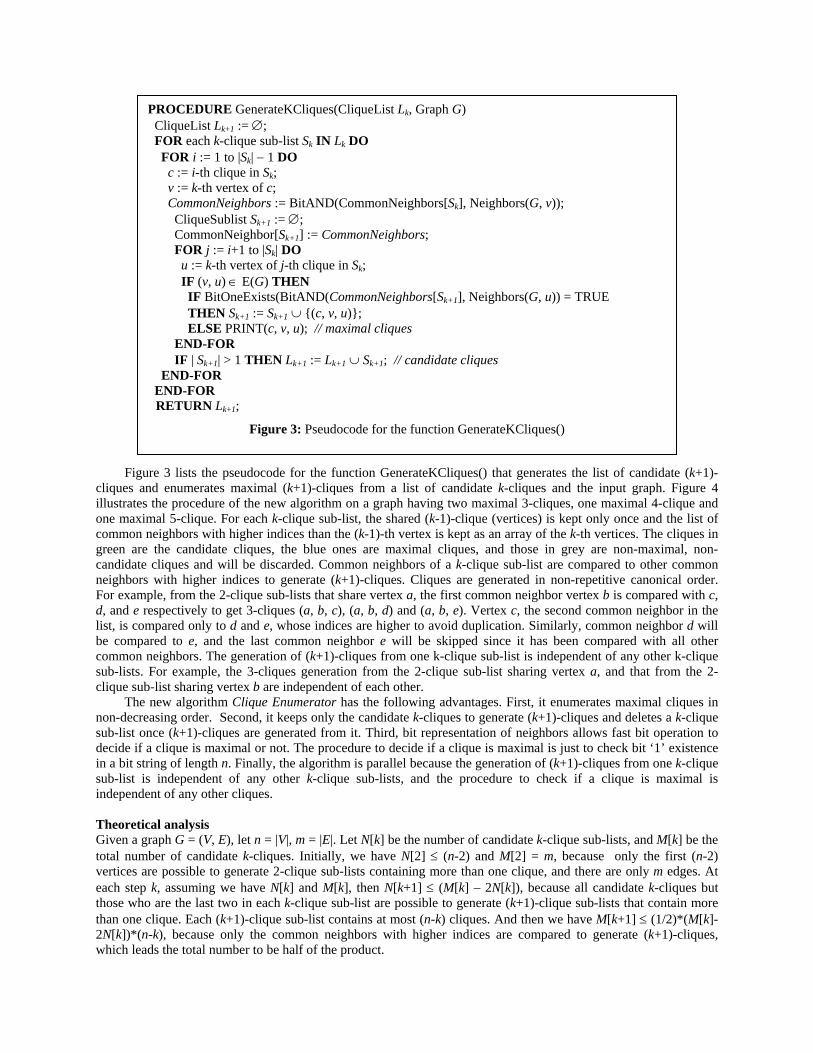
PROCEDURE GenerateKCliques(CliqueList Lk, Graph G) CliqueList Lk+1 := ∅; FOR each k-clique sub-list Sk IN Lk DO FOR i := 1 to |Sk| − 1 DO c := i-th clique in Sk; v := k-th vertex of c; CommonNeighbors := BitAND(CommonNeighbors[Sk], Neighbors(G, v)); CliqueSublist Sk+1 := ∅; CommonNeighbor[Sk+1] := CommonNeighbors; FOR j := i+1 to |Sk| DO u := k-th vertex of j-th clique in Sk; IF (v, u) ∈ E(G) THEN IF BitOneExists(BitAND(CommonNeighbors[Sk+1], Neighbors(G, u)) = TRUE THEN Sk+1 := Sk+1 ∪ {(c, v, u)}; ELSE PRINT(c, v, u); // maximal cliques END-FOR IF | Sk+1| > 1 THEN Lk+1 := Lk+1 ∪ Sk+1; // candidate cliques END-FOR END-FOR
RETURN Lk+1;
Figure 3: Pseudocode for the function GenerateKCliques()
Figure 3 lists the pseudocode for the function GenerateKCliques() that generates the list of candidate (k+1)-cliques and enumerates maximal (k+1)-cliques from a list of candidate k-cliques and the input graph. Figure 4 illustrates the procedure of the new algorithm on a graph having two maximal 3-cliques, one maximal 4-clique and one maximal 5-clique. For each k-clique sub-list, the shared (k-1)-clique (vertices) is kept only once and the list of common neighbors with higher indices than the (k-1)-th vertex is kept as an array of the k-th vertices. The cliques in green are the candidate cliques, the blue ones are maximal cliques, and those in grey are non-maximal, non-candidate cliques and will be discarded. Common neighbors of a k-clique sub-list are compared to other common neighbors with higher indices to generate (k+1)-cliques. Cliques are generated in non-repetitive canonical order. For example, from the 2-clique sub-lists that share vertex a, the first common neighbor vertex b is compared with c, d, and e respectively to get 3-cliques (a, b, c), (a, b, d) and (a, b, e). Vertex c, the second common neighbor in the list, is compared only to d and e, whose indices are higher to avoid duplication. Similarly, common neighbor d will be compared to e, and the last common neighbor e will be skipped since it has been compared with all other common neighbors. The generation of (k+1)-cliques from one k-clique sub-list is independent of any other k-clique sub-lists. For example, the 3-cliques generation from the 2-clique sub-list sharing vertex a, and that from the 2-clique sub-list sharing vertex b are independent of each other.
The new algorithm Clique Enumerator has the following advantages. First, it enumerates maximal cliques in non-decreasing order. Second, it keeps only the candidate k-cliques to generate (k+1)-cliques and deletes a k-clique sub-list once (k+1)-cliques are generated from it. Third, bit representation of neighbors allows fast bit operation to decide if a clique is maximal or not. The procedure to decide if a clique is maximal is just to check bit ‘1’ existence in a bit string of length n. Finally, the algorithm is parallel because the generation of (k+1)-cliques from one k-clique sub-list is independent of any other k-clique sub-lists, and the procedure to check if a clique is maximal is independent of any other cliques.
Theoretical analysis Given a graph G = (V, E), let n = |V|, m = |E|. Let N[k] be the number of candidate k-clique sub-lists, and M[k] be the total number of candidate k-cliques. Initially, we have N[2] ≤ (n-2) and M[2] = m, because only the first (n-2) vertices are possible to generate 2-clique sub-lists containing more than one clique, and there are only m edges. At each step k, assuming we have N[k] and M[k], then N[k+1] ≤ (M[k] – 2N[k]), because all candidate k-cliques but those who are the last two in each k-clique sub-list are possible to generate (k+1)-clique sub-lists that contain more than one clique. Each (k+1)-clique sub-list contains at most (n-k) cliques. And then we have M[k+1] ≤ (1/2)*(M[k]-2N[k])*(n-k), because only the common neighbors with higher indices are compared to generate (k+1)-cliques, which leads the total number to be half of the product.

Figure 4: An example of the new algorithm applied to a graph.
For each k-clique sub-list, the run time for checking adjacency of pairs of common neighbors is O((n-k)2). Moreover, checking if a k-clique is maximal takes O(n) (in the worst case). Therefore, the run time of step k is O((n-k)2*N[k] + n*M[k]). As to the space requirement, assume each vertex index takes c bytes, then at each step k, the algorithm would need M[k]*c + N[k]*((k-1)*c+⎡n/8⎤) bytes to hold all the candidate k-cliques, and N[k]*sizeof(pointers) more bytes to keep the pointers to the sub-lists.
Since our algorithm uses bit strings to represent the common neighbors of a clique, there is another way to generate (k+1)-cliques by taking advantage of the bit strings. Going through each bit of the bit string, we are able to identify the common neighbors. By skipping all the bits that represent vertices whose index lower than the highest index vertex in the clique, the duplication of clique generation could be avoided. However, we do not use this method because for each clique, every bit in the bit string of length n must be visited, which requires n comparisons while our method checks only the list of common neighbors whose size is bounded by (n-k). Parallelism for shared-memory machines Our parallel technique is based on the fact that the generation of (k+1)-cliques from a k-clique sub-list is independent of any other k-clique sub-lists. The multithreaded implementation for shared-memory machines can take advantage of multi-processor shared-memory architecture, because a large amount of memory is required to hold the large data structure.
This approach is not as easy as it sounds. First, we want to keep the desired feature of the sequential algorithm that enumerates cliques in non-decreasing order, so the multiple threads need to be synchronized to work on generating cliques of the same size. Second, we want each thread to work on its local instance as much as possible to avoid too much remote memory access. Third, we want the loads to be balanced among the threads. The need for load balancing is obvious in our Clique Enumerator, since the number of cliques generated could vary tremendously from one sub-list to another. We use a centralized dynamic load balancing technique to transfer some work from heavy loaded threads to light-loaded (or idle) ones. However, a thread working on loads transferred from other threads has to access the remote memory over that processor, which will mitigate the benefit of balanced loads and even worsen the problem if the load balancing is not carefully performed. Thus, while multiple threads are forked to perform clique generation simultaneously and independently, a dynamic task scheduler is used to synchronize multiple threads, to collect partial results, to make load-balancing decisions and to transfer loads among threads. This is done at each step k.
The multithreaded algorithm takes as input a list of k-cliques. The task scheduler divides all k-cliques evenly to multiple threads and then signals them to start enumerating (k+1)-cliques. When all threads finish their work, they update their results and wait for next start signal from the task scheduler. The task scheduler collects the results from threads, makes the load-balancing decision, and redistributes the work. The task scheduler signals all threads to quit when no candidate (k+1)-cliques are generated by all threads.

There is no communication required when threads perform clique enumeration operation, because they all work independently. Also there is no communication required among threads when the load balancing is performed because the large data structure is shared in the memory. Although we use the word “transferred,” we don't mean that data is physically transferred, only that addresses are passed. This is also one of the reasons why shared-memory machines are preferred over distributed-memory machines. The task scheduler has to be smart when it makes a decision to transfer tasks among threads. After collecting results from all threads, it identifies the heavy-loaded threads, and light-loaded threads will help the heaviest-loaded thread. This is achieved as follows: if the difference between two threads is greater than a certain threshold, a load transfer decision is made. In our algorithm the threshold is determined based on the graph size, the total amount of current load, and differences of their loads from the average load (details are suppressed). 3. Performance evaluation In this section, we evaluate the performance of the sequential and multithreaded implementations of the Clique Enumerator algorithm. We also measure the amount of memory required by the algorithm. The measurements are performed on an SGI Altix with 256 Intel Itanium 2 processors running at 1.5 GHz, and 8 GB of memory per processor for a total of 2 Terabytes shared system memory.
The graphs tested in this section were generated from raw microarray data after normalization, pairwise rank coefficient calculation, and filtering using threshold [16]. Two of the graphs were generated from neurobiological datasets, where each graph contains 12422 vertices, one with 6151 edges (0.008% edge density), the other with 229297 edges (0.3% edge density) [17]. The third graph was generated from myogenic differentiation data, and contains 2895 vertices with 10914 edges (0.2% edge density) [41]. Applying Clique Enumerator to these graphs, we found the maximum clique size to be 17, 110, and 28 for each graph, respectively. Each experiment was repeated 10 times and the average is reported.
Table 1 presents run times for the Kose RAM and sequential Clique Enumerator algorithms that enumerate maximal cliques ranging in size from 3 to 17 on the 12,422 vertex graph using a 1GHz PowerPC G4. Clique Enumerator is more than three hundred times faster than the Kose RAM, due to the fast bit operations and reduced candidate cliques-sets to be checked, which reduces not only the execution time, but also the memory requirements.
Figure 5 shows the run times of the multithreaded implementation with load balancing to enumerate maximal cliques from different initial size (Init_K) on the 2,895 vertices graph using up to 256 processors on an SGI Altix
3700. The run times are the average from 10 different runs and the standard deviations are within 5% of run times. From the figure, we can see that the run times scale well for up to 64 processors, and still scale when using 128 processors, though the performance degrades a little when 256 processors are used. The two measures are calculated: the absolute speedup defined as the ratio between p processors and one processor run times and the relative speedup defined as the ratio between 2p processors and p processors run times. The absolute and relative speedups for up to 64 processors are plotted in Figure 6, which shows that the relative speedups remain around 1.8 when the number of processors increases. This performance pattern is observed for all different initial clique sizes from 3 to 20, though the absolute speedups for case Init_K=3 are better than the absolute speedups for the other three cases. Another observation from Figure 5 is that when the initial clique size increases by one, the run times decrease by almost half. This indicates that the larger the lower bound on clique size is chosen, the shorter the program is executed.
Graph Size Edge Density Maximal Clique Size Kose RAM Sequential algorithm Speedup
12,422 0.008% [3, 17] 17261 sec. 45 sec. 383 Table 1. Run times on a Mac PowerPC G4 running at 1GHz with 1GB memory for Kose et al algorithm and our sequential Clique Enumerator algorithm.

Run Times to enumerate maximal cliques of different initial clique size for a graph with 2895 vertices and 0.2% edge density
0
50
100
150
200
250
300
350
1 2 4 8 16 32 64 128 256
Number of Processors
Init_K = 18 Init_K = 19 Init_K = 20
Figure 5. Average run times to enumerate maximal cliques from different initial clique sizes (Init_K) for the 2,895 vertices and 0.2% edge density graph using up to 256 processors on an SGI Altix 3700.
Absolute Speedup for different initial clique size using up to 64 processors
0
10
20
30
40
50
60
70
0 8 16 24 32 40 48 56 64
Number of Processors
Ideal Init_K = 20 Init_K = 19Init_K = 18 Init_K = 3
Relative Speedup for different initial clique size using up to 64 processors
0.0
0.5
1.0
1.5
2.0
2.5
0 8 16 24 32 40 48 56 64
Number of Processors
Ideal Init_K = 20 Init_K = 19Init_K = 18 Init_K = 3
Figure 6. Absolute speedups and relative speedups for different initial clique sizes using up to 64 processors. We have observed that the multithreaded program scales almost linearly up to 64 processors, but not on 256
processors. The lack of scalability for 256 processors is largely due to the small execution time of the serial implementation, which becomes almost negligible when divided among 256 processors and is dominated by network and synchronization latency. As shown in Figure 7, the absolute speedup for 256 processors increases when the sequential run time increases. The speedup will go up from 22 to 51 when the sequential run time increases from 98 seconds for Init_K=20 to 1,948 seconds for Init_K=3. Similar behavior is observed for 128 processors. In other words, various problem sizes with different execution times have their optimal number of processors to take the maximum benefit from the parallel Clique Enumerator algorithm.
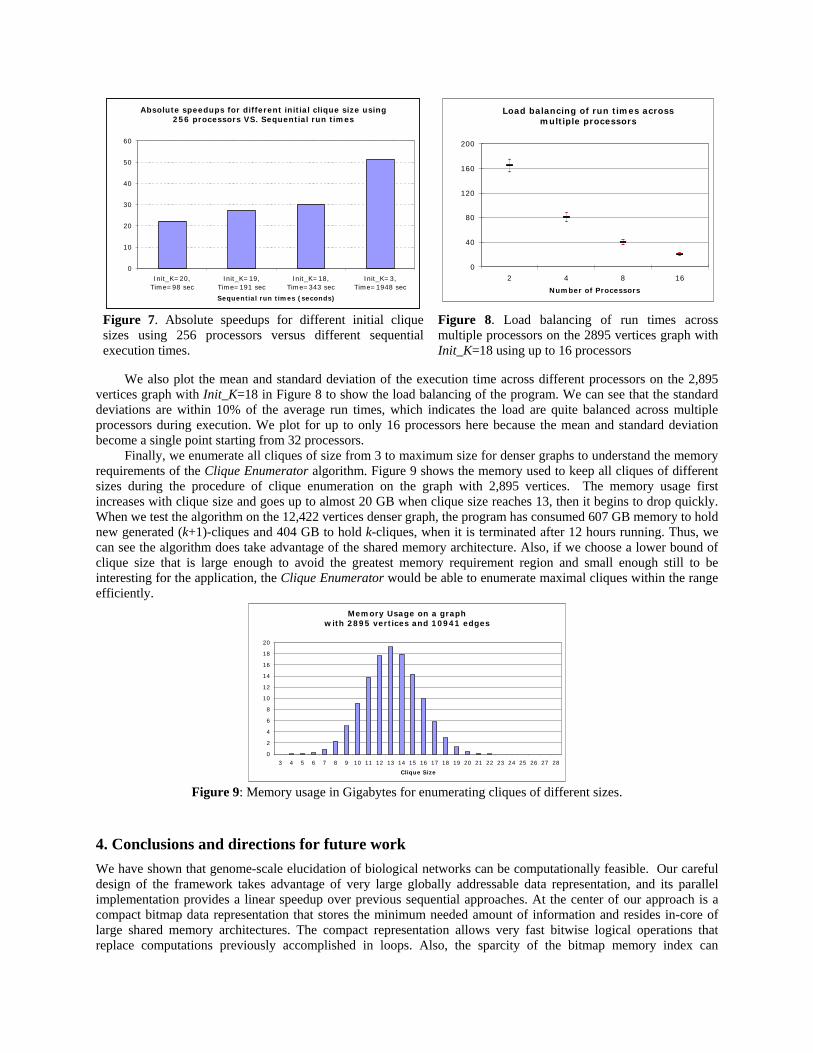
Absolute speedups for different initial clique size using256 processors VS. Sequential run times
0
10
20
30
40
50
60
Init_K=20,Time=98 sec
Init_K=19,Time=191 sec
Init_K=18,Time=343 sec
Init_K=3,Time=1948 sec
Sequential run times (seconds)
Load balancing of run times across multiple processors
0
40
80
120
160
200
2 4 8 16
Number of Processors
Figure 7. Absolute speedups for different initial clique sizes using 256 processors versus different sequential execution times.
Figure 8. Load balancing of run times across multiple processors on the 2895 vertices graph with Init_K=18 using up to 16 processors
We also plot the mean and standard deviation of the execution time across different processors on the 2,895 vertices graph with Init_K=18 in Figure 8 to show the load balancing of the program. We can see that the standard deviations are within 10% of the average run times, which indicates the load are quite balanced across multiple processors during execution. We plot for up to only 16 processors here because the mean and standard deviation become a single point starting from 32 processors.
Finally, we enumerate all cliques of size from 3 to maximum size for denser graphs to understand the memory requirements of the Clique Enumerator algorithm. Figure 9 shows the memory used to keep all cliques of different sizes during the procedure of clique enumeration on the graph with 2,895 vertices. The memory usage first increases with clique size and goes up to almost 20 GB when clique size reaches 13, then it begins to drop quickly. When we test the algorithm on the 12,422 vertices denser graph, the program has consumed 607 GB memory to hold new generated (k+1)-cliques and 404 GB to hold k-cliques, when it is terminated after 12 hours running. Thus, we can see the algorithm does take advantage of the shared memory architecture. Also, if we choose a lower bound of clique size that is large enough to avoid the greatest memory requirement region and small enough still to be interesting for the application, the Clique Enumerator would be able to enumerate maximal cliques within the range efficiently.
Memory Usage on a graph with 2895 vertices and 10941 edges
0
2
4
6
8
10
12
14
16
18
20
3 4 5 6 7 8 9 10 11 12 13 14 15 16 17 18 19 20 21 22 23 24 25 26 27 28
Clique Size
Figure 9: Memory usage in Gigabytes for enumerating cliques of different sizes.
4. Conclusions and directions for future work We have shown that genome-scale elucidation of biological networks can be computationally feasible. Our careful design of the framework takes advantage of very large globally addressable data representation, and its parallel implementation provides a linear speedup over previous sequential approaches. At the center of our approach is a compact bitmap data representation that stores the minimum needed amount of information and resides in-core of large shared memory architectures. The compact representation allows very fast bitwise logical operations that replace computations previously accomplished in loops. Also, the sparcity of the bitmap memory index can

potentially provide high compression rate and allow for bitwise operations to be performed on the compressed data. The work in this direction is underway. Further, the search space is naturally partitioned so that the most demanding part of the algorithm can be confined to each partition and need not consider any partition interactions, or inter-process communications. Finally, the run-time distribution of work among computational threads by the master assures load balancing.
We tested our approach on gene expression networks derived from the Affymetrix U74Av2 microarray data used to test 12,422 probe sets in samples from the brain of Mus musculus – the size far exceeding any previously attempted networks. The cliques generated by the Clique Enumerator allow us to extract correlated sets of traits from the very large correlation matrices that are generated in genetic correlation analysis. The result is to reduce the dimensionality of the data matrix, which allows us 1) to adjust more appropriately for the number of independent hypotheses being tested, and 2) to examine the major systems and pathways that are involved in the large data set. Existing clustering and PCA methods require reduction of the input data set, and many arbitrary filtering criteria are in place. The clique approach allows us to maintain our analytic focus on the entire data matrix. Our analysis of cliques allowed us to detect the most highly connected vertex, corresponding to expression of Lin7c. This gene is involved in the formation of multiprotein complexes at the synapse. We have also been able to examine the relation of these small cliques, and large subgraphs of which they are a part, overlaying both graphs of genetic causality for the correlations, and phenotypic relations. This is only possible because we are exploiting a large-scale genetic correlation approach. The use of clique extraction has allowed us to identify the highly connected gene sets, which are genetically covarying in this experimental system, and therefore, which are co-regulated through pathways affected by genetic polymorphisms. We have found that approximately 7 – 10 polymorphic loci are responsible for the regulation of a highly connected group of over 1950 transcripts. These transcripts function in the process of synaptic modification and synaptic translation. The work we have done reveals that there are several individual differences in these endo-phenotypes, which are associated with variation in several of the 1400 published phenotypes obtained in this mouse reference population [17].
Our central focus has been on maximal clique. In this effort it is often useful first to identify the size of a graph’s maximum clique, a classic NP-complete problem. To solve maximum clique efficiently, we turn to the notion of fixed parameter tractability (FPT), whose origins can be traced at least as far back as our work done to show that a variety of parameterized problems are tractable when the relevant input parameter is fixed [35, 36]. Unfortunately, clique is not FPT unless the W hierarchy collapses [33]. Thus we focus instead on clique’s complementary dual, the vertex cover problem with our fastest implementations described in [39]. Like maximal clique, maximum clique via vertex cover can be solved on much larger scales with monolithic shared memory architectures and careful storage utilization techniques.
Clique is but one of many NP-complete problems in high-throughput computational biology that can benefit from an approach such as the one we have described here. In phylogenetic footprinting, for example, it is feedback vertex set that is the crucial combinatorial problem [42]. We have recently devised the asymptotically-fastest currently-known algorithms for feedback vertex set [43]. Our methods make extensive use of branching [33] (not to be confused with branch and bound), and so benefit from immense shared memory. Moreover, exact algorithms for difficult combinatorial problems such as these frequently use recursive backtracking, and model their search space by a tree in which a depth-first traversal is used to identify optimum solutions. Input instances are typically huge. The effectiveness of these methods thus frequently relies heavily on judicious memory management.
As a final example of future work, we should not overlook dynamic programming. This ubiquitous technique needs no introduction. It is employed for a myriad of problems in computational biology and many other fields. In this context, however, it is worth remembering that with dynamic programming we generally trade space for time. In the case of NP-complete problems in particular, the time saved is offset by gigantic storage requirements. Paging, thrashing and other potential side-effects of out-of-core implementations are apt to negate the time savings expected with dynamic programming unless memory intensive management techniques are applied. Acknowledgements We wish to thank Robert W. Williams at the University of Tennessee Health Science Center for granting us access to enormous neurobiological datasets. This work was funded in part by the U.S. Department of Energy's Genomes to Life program (www.doegenomestolife.org) under the ORNL-PNNL project, “Exploratory Data Intensive Computing for Complex Biological Systems.” Additional funding was provided by the National Science Foundation under grant CCR-0311500, by the Office of Naval Research under grant N00014-01-1-0608, and by the UT-ORNL Science Alliance (http://www.scialli.org/). This research used resources of the Center for Computational Sciences at Oak Ridge National Laboratory that is managed by UT-Battelle for the LLC U.S. D.O.E. under Contract No. DE-AC05-00OR22725.

References [1] F. N. Abu-Khzam, N. E. Baldwin, M. A. Langston, and N. F. Samatova, On the Relative Efficiency of Maximal Clique Enumeration Algorithms, with Application to High-Throughput Computational Biology, Proceedings, International Conference on Research Trends in Science and Technology, Beirut, Lebanon, 2005. [2] P. Karp, EcoCyc version 2.7, vol. 7 (5), Jan-Mar, 1996, 8-8. [3] R. Overbeek, N. Larsen, G. D. Pusch, M. D'Souza, E. Selkov, N. Kyrpides, M. Fonstein, N. Maltsev, and E. Selkov, WIT: integrated system for high-throughput genome sequence analysis and metabolic reconstruction, vol. 28 (1), Jan 1, 2000, 123-125. [4] E. Selkov, Y. Grechkin, N. Mikhailova, and E. Selkov, MPW: the Metabolic Pathways Database, vol. 26 (1), Jan 1, 1998, 43-45. [5] D. A. Fell and H. M. Sauro, Metabolic Control Analysis By Computer - Progress And Prospects, vol. 49 (8-9), 1990, 811-816. [6] C. H. Schilling, J. S. Edwards, D. Letscher, and B. O. Palsson, Combining pathway analysis with flux balance analysis for the comprehensive study of metabolic systems, vol. 71 (4), 2000, 286-306. [7] C. H. Schilling, J. S. Edwards, and B. O. Palsson, Toward metabolic phenomics: Analysis of genomic data using flux balances, vol. 15 (3), May-Jun, 1999, 288-295. [8] S. Schuster, T. Dandekar, and D. A. Fell, Detection of elementary flux modes in biochemical networks: a promising tool for pathway analysis and metabolic engineering, vol. 17 (2), Feb, 1999, 53-60. [9] C. H. Schilling and B. O. Palsson, Assessment of the metabolic capabilities of Haemophilus influenzae Rd through a genome-scale pathway analysis, vol. 203 (3), Apr 7, 2000, 249-283. [10] S. Schuster, D. A. Fell, and T. Dandekar, A general definition of metabolic pathways useful for systematic organization and analysis of complex metabolic networks, vol. 18 (3), Mar, 2000, 326-332. [11] T. Pfeiffer, I. Sanchez-Valdenebro, J. C. Nuno, F. Montero, and S. Schuster, METATOOL: for studying metabolic networks, vol. 15 (3), Mar, 1999, 251-257. [12] C. H. Schilling, D. Letscher, and B. O. Palsson, Theory for the systemic definition of metabolic pathways and their use in interpreting metabolic function from? A pathway-oriented perspective, vol. 203 (3), Apr 7, 2000, 229-248. [13] M. J. Herrgard, M. W. Covert, and B. O. Palsson, Reconciling gene expression data with known genome-scale regulatory network structures, Genome Research, vol. 13 (11), Nov, 2003, 2423-2434. [14] G. D. Stormo and K. Tan, Mining genome databases to identify and understand new gene regulatory systems, Current Opinion in Microbiology, vol. 5 (2), Apr, 2002, 149-153. [15] J. J. Wyrick and R. A. Young, Deciphering gene expression regulatory networks, Current Opinion in Genetics & Development, vol. 12 (2), Apr, 2002, 130-136. [16] N. E. Baldwin, E. J. Chesler, S. Kirov, M. A. Langston, J. R. Snoddy, R. W. Williams, and B. Zhang, Computational, Integrative and Comparative Methods for the Elucidation of Genetic Co-Expression Networks, Journal of Biomedicine and Biotechnology, vol. 2, 2005, 172-180. [17] E. J. Chesler, L. Lu, S. Shou, Y. Qu, J. Gu, J. Wang, H. C. Hsu, J. D. Mountz, N. E. Baldwin, M. A. Langston, J. B. Hogenesch, D. W. Threadgill, K. F. Manly, and R. W. Williams, Complex Trait Analysis of Gene Expression Uncovers Polygenic and Pleiotropic Networks that Modulate Nervous System Function, Nature Genetics, vol. 37 (3), 2005, 233-242. [18] A. C. Gavin, M. Bosche, R. Krause, P. Grandi, M. Marzioch, A. Bauer, J. Schultz, J. M. Rick, A. M. Michon, C. M. Cruciat, M. Remor, C. Hofert, M. Schelder, M. Brajenovic, H. Ruffner, A. Merino, K. Klein, M. Hudak, D. Dickson, T. Rudi, V. Gnau, A. Bauch, S. Bastuck, B. Huhse, C. Leutwein, M. A. Heurtier, R. R. Copley, A. Edelmann, E. Querfurth, V. Rybin, G. Drewes, M. Raida, T. Bouwmeester, P. Bork, B. Seraphin, B. Kuster, G. Neubauer, and G. Superti-Furga, Functional organization of the yeast proteome by systematic analysis of protein complexes, Nature, vol. 415 (6868), Jan 10, 2002, 141-147. [19] Y. Ho, A. Gruhler, A. Heilbut, G. D. Bader, L. Moore, S. L. Adams, A. Millar, P. Taylor, K. Bennett, K. Boutilier, L. Y. Yang, C. Wolting, I. Donaldson, S. Schandorff, J. Shewnarane, M. Vo, J. Taggart, M. Goudreault, B. Muskat, C. Alfarano, D. Dewar, Z. Lin, K. Michalickova, A. R. Willems, H. Sassi, P. A. Nielsen, K. J. Rasmussen, J. R. Andersen, L. E. Johansen, L. H. Hansen, H. Jespersen, A. Podtelejnikov, E. Nielsen, J. Crawford, V. Poulsen, B. D. Sorensen, J. Matthiesen, R. C. Hendrickson, F. Gleeson, T. Pawson, M. F. Moran, D. Durocher, M. Mann, C. W. V. Hogue, D. Figeys, and M. Tyers, Systematic identification of protein complexes in Saccharomyces cerevisiae by mass spectrometry, Nature, vol. 415 (6868), Jan 10, 2002, 180-183. [20] K. Truong and M. Ikura, The use of FRET imaging microscopy to detect protein-protein interactions and protein conformational changes in vivo, Current Opinion in Structural Biology, vol. 11 (5), Oct, 2001, 573-578. [21] P. Uetz, L. Giot, G. Cagney, T. A. Mansfield, R. S. Judson, J. R. Knight, D. Lockshon, V. Narayan, M. Srinivasan, P. Pochart, A. Qureshi-Emili, Y. Li, B. Godwin, D. Conover, T. Kalbfleisch, G. Vijayadamodar, M. J. Yang, M. Johnston, S. Fields, and J. M. Rothberg, A comprehensive analysis of protein-protein interactions in Saccharomyces cerevisiae, Nature, vol. 403 (6770), Feb 10, 2000, 623-627.

[22] B. P. Kelley, B. B. Yuan, F. Lewitter, R. Sharan, B. R. Stockwell, and T. Ideker, PathBLAST: a tool for alignment of protein interaction networks, vol. 32, Jul 1, 2004, W83-W88. [23] J. M. Rohwer, S. Schuster, and H. V. Westerhoff, How to recognize monofunctional units in a metabolic system, vol. 179 (3), Apr 7, 1996, 213-228. [24] N. F. Samatova, A. Geist, G. Ostrouchov, and A. V. Melechko, Parallel out-of-core algorithm for genome-scale enumeration of metabolic systematic pathways, Proc. First IEEE Workshop on High Performance Computat. Biol. (HiCOMB2002), Ft. Lauderdale, FL, 2002. [25] E. Tomita, A. Tanaka, and H. Takahashi, The Worst-Case Time Complexity for Generating all Maximal Cliques, Proceedings, Computing and Combinatorics Conference, Jeju Island, Korea, 2004. [26] F. Kose, W. Weckwerth, T. Linke, and O. Fiehn, Visualizing plant metabolomic correlation networks using clique–metabolite matrices, Bioinformatics, vol. 17, 2001, 1198-1208. [27] Y. Zhang, F. N. Abu-Khzam, N. E. Baldwin, E. J. Chesler, M. A. Langston, and N. F. Samatova, Genome-Scale Computational Approaches to Memory-Intensive Applications in Systems Biology, Proceedings, Supercomputing, Seattle, Washington, 2005. [28] N. E. Baldwin, R. L. Collins, M. A. Langston, M. R. Leuze, C. T. Symons, and B. H. Voy., High Performance Computational Tools for Motif Discovery, Proceedings, IEEE International Workshop on High Performance Computational Biology (HiCOMB), Santa Fe, New Mexico, 2004. [29] F. N. Abu-Khzam, F. Cheetham, F. Dehne, M. A. Langston, S. Pitre, A. Rau-Chaplin, P. Shanbhag, and P. J. Taillon, "ClustalXP," http://ClustalXP.cgmlab.org/. [30] D. Fernández-Baca, "The Perfect Phylogeny Problem," in Steiner Trees in Industry, X. Cheng and D.-Z. Du, Eds.: Springer, 2002). [31] I. Bomze, M. Budinich, P. Pardalos, and M. Pelillo, "The Maximum Clique Problem," in Handbook of Combinatorial Optimization, vol. 4, D.-Z. Du and P. M. Pardalos, Eds.: Kluwer Academic Publishers, 1999). [32] J. M. Robson, "Finding a maximum independent set in time O(2n/4)," LaBRI, Universite Bordeaux, Report 1251-01, 2001. [33] R. G. Downey and M. R. Fellows, Parameterized Complexity. New York: Springer) 1999. [34] M. R. Fellows and M. A. Langston, Nonconstructive Advances in Polynomial-Time Complexity, Information Processing Letters, vol. 26, 1987, 157-162. [35] M. R. Fellows and M. A. Langston, Nonconstructive Tools for Proving Polynomial-Time Decidability, Journal of the ACM, vol. 35, 1988, 727-739. [36] M. R. Fellows and M. A. Langston, On Search, Decision and the Efficiency of Polynomial-Time Algorithms, Journal of Computer and Systems Sciences, vol. 49, 1994, 769-779. [37] L. S. Chandran and F. Grandoni, Refined Memorisation for Vertex Cover, Proceedings, International Workshop on Parameterized and Exact Computation, Bergen, Norway, 2004. [38] F. N. Abu-Khzam, M. A. Langston, and P. Shanbhag, Scalable Parallel Algorithms for Difficult Combinatorial Problems: A Case Study in Optimization, Proceedings, International Conference on Parallel and Distributed Computing and Systems, Marina Del Rey, California, 2003. [39] F. N. Abu-Khzam, M. A. Langston, P. Shanbhag, and C. T. Symons, Scalable Parallel Algorithms for FPT Problems, Algorithmica, accepted for publication, 2005. [40] C. Bron and J. Kerbosch, Algorithm 457: Finding All Cliques of an Undirected Graph, Proceedings of the ACM, 1973, 575-577. [41] K. K. Tomczak, V. D. Marinescu, M. F. Ramoni, D. Sanoudou, F. Montanaro, M. Han, L. M. Kunkel, I. S. Kohane, and A. H. Beggs, Expression Profiling and Identification of Novel Genes Involved in Myogenic Differentiation, FASEB Journal, vol. 18 (2), 2004, 403-405. [42] C. Fried, W. Hordijk, S. J. Prohaska, C. R. Stadler, and P. F. Stadler, The Footprint Sorting Problem, J. Chem. Inf. Comput. Sci., vol. 44 (2), 2004, 332 -338. [43] F. Dehne, M. R. Fellows, M. A. Langston, F. A. Rosamond, and K. Stevens, An O*(2O(k)) FPT Algorithm for the Undirected Feedback Vertex Set Problem, Proceedings, International Computing and Combinatorics Conference, Kunming, China, 2005. .
Copyright © 2022 FDOKUMEN