Genetic variation in natural populations of Anthurium sinuatum and A. pentaphyllum var. pentaphyllum...
18
Genetic variation in natural populations of Anthurium sinuatum and A. pentaphyllum var. pentaphyllum (Araceae) from north-east Brazil using AFLP molecular markers IVANILZA M. ANDRADE 1 *, SIMON J. MAYO FLS 2 , CÁSSIO VAN DEN BERG 1 , MICHAEL F. FAY FLS 3 , MICHAEL CHESTER 3 , CHRISTIAN LEXER 3 and DON KIRKUP 2 1 Programa de Pós-Graduação em Botânica, Universidade Estadual de Feira de Santana (UEFS), Departamento de Ciências Biológicas, Avenida Universitária s/n, 44031-460, Feira de Santana, Bahia, Brazil 2 Herbarium, Royal Botanic Gardens, Kew, Richmond, Surrey TW9 3AE, UK 3 Genetics Section, Jodrell Laboratory, Royal Botanic Gardens, Kew, Richmond, Surrey TW9 3DS, UK Received 14 July 2008; accepted for publication 28 October 2008 Genetic variation was investigated using AFLP markers in 12 populations of Anthurium sinuatum and A. pentaphyllum var. pentaphyllum (Araceae) in north-east Brazil, Amazonia and the Brazilian Atlantic forest. Two unique genetic patterns characterized the populations of A. sinuatum as a group, but no correlation between genetic and geographical interpopulation distance was found; the Amazonian population was not separated from that in Ceará. The isolated Ceará brejo populations of A. sinuatum were genetically distinct, but genetic diversity levels were similar to populations elsewhere, with no evidence of genetic erosion. Anthurium pentaphyllum populations were significantly different from each other; Bayesian genetic structural analysis found no common genetic pattern, but revealed genetic clusters unique to subgroups and individual populations in the Atlantic forest and French Guiana. Anthurium pentaphyllum and A. sinuatum can be distinguished genetically, but individuals of both species formed intermediate genetic clusters that blurred their distinction. We suggest that genetic mixing of A. sinuatum and A. pentaphyllum has occurred in north-east Brazil, possibly connected with cycles of humid forest expansion. The weak genetic structure in A. sinuatum is consistent with the natural fragmentation of continuous forest areas, possibly during the Holocene. This study highlights the scientific importance of the highly threatened brejo forests for tropical American biogeography. © 2009 The Linnean Society of London, Botanical Journal of the Linnean Society, 2009, 159, 88–105. ADDITIONAL KEYWORDS: Amazonia – Atlantic forest – brejo forests – French Guiana – species’ limits. INTRODUCTION The biota of the isolated, humid brejo forests of north-east Brazil have interested biologists for many years and have played a part in the continuing effort to understand the historical biogeography and possible migration routes between the major forest biomes of Amazonia and Atlantic Brazil (for example, Andrade-Lima, 1953, 1966, 1982; Ducke, 1959; Prance, 1973; Vanzolini, 1973; Ab’Sáber, 1982; Bigarella & Andrade-Lima, 1982; Lourenço, 1988; Giulietti & Forero, 1990; Ledru, 1991, 1993; Oliveira- Filho & Ratter, 1995; Behling, 1998; Oliveira, Barreto & Suguio, 1999; Barreto, Pessenda & Suguio, 2002; Borges-Nojosa & Caramaschi, 2003; Costa, 2003; Cavalcanti & Tabarelli, 2004; Pôrto, Cabral & Tabarelli, 2004; Vasconcelos, Almeida & Costa, 2004). Despite the destructive impact of human activity, these two large forest regions are dominating features *Corresponding author. E-mail: [email protected] Botanical Journal of the Linnean Society, 2009, 159, 88–105. With 4 figures © 2009 The Linnean Society of London, Botanical Journal of the Linnean Society, 2009, 159, 88–105 88
Transcript of Genetic variation in natural populations of Anthurium sinuatum and A. pentaphyllum var. pentaphyllum...
Genetic variation in natural populations of Anthuriumsinuatum and A. pentaphyllum var. pentaphyllum(Araceae) from north-east Brazil using AFLPmolecular markers
IVANILZA M. ANDRADE1*, SIMON J. MAYO FLS2, CÁSSIO VAN DEN BERG1,MICHAEL F. FAY FLS3, MICHAEL CHESTER3, CHRISTIAN LEXER3 and DON KIRKUP2
1Programa de Pós-Graduação em Botânica, Universidade Estadual de Feira de Santana (UEFS),Departamento de Ciências Biológicas, Avenida Universitária s/n, 44031-460, Feira de Santana,Bahia, Brazil2Herbarium, Royal Botanic Gardens, Kew, Richmond, Surrey TW9 3AE, UK3Genetics Section, Jodrell Laboratory, Royal Botanic Gardens, Kew, Richmond, Surrey TW9 3DS, UK
Received 14 July 2008; accepted for publication 28 October 2008
Genetic variation was investigated using AFLP markers in 12 populations of Anthurium sinuatum and A.pentaphyllum var. pentaphyllum (Araceae) in north-east Brazil, Amazonia and the Brazilian Atlantic forest. Twounique genetic patterns characterized the populations of A. sinuatum as a group, but no correlation betweengenetic and geographical interpopulation distance was found; the Amazonian population was not separated fromthat in Ceará. The isolated Ceará brejo populations of A. sinuatum were genetically distinct, but genetic diversitylevels were similar to populations elsewhere, with no evidence of genetic erosion. Anthurium pentaphyllumpopulations were significantly different from each other; Bayesian genetic structural analysis found no commongenetic pattern, but revealed genetic clusters unique to subgroups and individual populations in the Atlantic forestand French Guiana. Anthurium pentaphyllum and A. sinuatum can be distinguished genetically, but individualsof both species formed intermediate genetic clusters that blurred their distinction. We suggest that genetic mixingof A. sinuatum and A. pentaphyllum has occurred in north-east Brazil, possibly connected with cycles of humidforest expansion. The weak genetic structure in A. sinuatum is consistent with the natural fragmentation ofcontinuous forest areas, possibly during the Holocene. This study highlights the scientific importance of the highlythreatened brejo forests for tropical American biogeography. © 2009 The Linnean Society of London, BotanicalJournal of the Linnean Society, 2009, 159, 88–105.
ADDITIONAL KEYWORDS: Amazonia – Atlantic forest – brejo forests – French Guiana – species’ limits.
INTRODUCTION
The biota of the isolated, humid brejo forests ofnorth-east Brazil have interested biologists for manyyears and have played a part in the continuing effortto understand the historical biogeography andpossible migration routes between the major forestbiomes of Amazonia and Atlantic Brazil (for example,
Andrade-Lima, 1953, 1966, 1982; Ducke, 1959;Prance, 1973; Vanzolini, 1973; Ab’Sáber, 1982;Bigarella & Andrade-Lima, 1982; Lourenço, 1988;Giulietti & Forero, 1990; Ledru, 1991, 1993; Oliveira-Filho & Ratter, 1995; Behling, 1998; Oliveira, Barreto& Suguio, 1999; Barreto, Pessenda & Suguio, 2002;Borges-Nojosa & Caramaschi, 2003; Costa, 2003;Cavalcanti & Tabarelli, 2004; Pôrto, Cabral &Tabarelli, 2004; Vasconcelos, Almeida & Costa, 2004).Despite the destructive impact of human activity,these two large forest regions are dominating features
*Corresponding author.E-mail: [email protected]
Botanical Journal of the Linnean Society, 2009, 159, 88–105. With 4 figures
© 2009 The Linnean Society of London, Botanical Journal of the Linnean Society, 2009, 159, 88–10588
of South American biogeography, and continue to bethe focus of baseline botanical exploration. Historicalhypotheses are necessarily constrained by the patchynature of much existing knowledge of the ranges anddistinctions between species. The brejo forests areof particular interest, because they lie between thetwo main forest regions as a mosaic of small uplandforest fragments scattered over a prevailing semi-aridlandscape. Although poorly studied until recentlyand under severe pressure from deforestation, theyprovide unique opportunities for tropical Americanbiogeographical studies.
Most studies of the brejo forests have concernedspecies’ composition and endemicity of the brejo biota(for example, Sales, Mayo & Rodal, 1998; Pôrto et al.,2004), and hitherto there have been almost no studiesusing genetic information to quantify relationshipsbetween populations of species common to the brejoforests, Amazonia and/or Atlantic Brazil. Carnaval(2002) studied frog phylogeography and comparedpopulations in brejo forests and adjacent Atlanticforest in Pernambuco and Alagoas.
This article represents the first study comparinggenetic variation in plant populations of the isolatedbrejos in the State of Ceará with populations in theAmazon and Atlantic forest regions. We report theresults from two taxa of the family Araceae (Mayo,Bogner & Boyce, 1997): Anthurium sinuatum Benth.ex Schott and A. pentaphyllum (Aubl.) G.Don var.pentaphyllum. A parallel study of the aroid hemi-epiphyte Monstera adansonii Schott var. klotzschiana(Schott) Madison also forms part of this researchproject (Andrade et al., 2007). Anthurium sinuatum isa common, usually epiphytic aroid of the most humidareas within the isolated brejo forests of Ceará, butis absent from the Brazilian Atlantic forest; it alsooccurs widely in the Guianas, eastern Amazonia andcentral Brazil. The closely related A. pentaphyllumdoes not occur in Ceará, but replaces A. sinuatumecologically in the Atlantic forest, and is also foundin Amazonia and further west to the Guianas andCentral America; it is much more variable mor-phologically than A. sinuatum (Madison, 1978; I. M.Andrade et al., pers. observ.).
TAXONOMIC CONSIDERATIONS
In the most recent taxonomic treatment of thespecies, Madison (1978) grouped A. pentaphyllumand A. sinuatum together with 12 other species insection Schizoplacium Schott. Croat & Sheffer (1983)later modified the sectional boundaries, placing themtogether in section Dactylophyllium Schott, character-ized by compound, pedatisect or palmatisect leaveswith the leaf segments completely free to the base,each leaflet with a distinct basal pulvinus.
Current alpha taxonomy treats these two speciesas distinct and there are no molecular phylogeniesavailable. Madison (1978) considered A. sinuatumto be closest to A. clavigerum Poeppig, an extremelyrobust Amazonian species. The closest relatives of A.pentaphyllum are A. brevipedunculatum Madison andA. kunthii Poeppig (Madison, 1978).
Both the study species occur as root-climbing epi-phytes, terrestrials or on rocks, with leaves dividedinto five to nine leaflets and the spadix turning frompale green to lavender or purple at female anthesis.Based on the taxonomic treatment by Madison (1978)and adding our own observations in the field andfrom herbarium specimens (Herbarium, Royal BotanicGardens, Kew [K]; Holmgren & Holmgren, 1998), thetwo species can usually be distinguished as follows.Anthurium sinuatum: cataphylls persisting entire,leaflet margins sinuate, peduncle 14–50 cm long,flowering spadix 15–22.5 cm long, 0.4–0.9 cm thickat base, berries rich maroon (vinose). Anthuriumpentaphyllum: cataphylls soon drying and becomingnet-fibrous or deciduous, leaflet margins entire,peduncle 1–25 cm long, flowering spadix 4.3–13 cmlong, 0.4–1.7 cm thick at base, berries red to purple.
Madison (1978) recognized three varieties withinA. pentaphyllum: var. bombacifolium (Schott) Madisonfrom Central America and Mexico; var. digitatum(Jacq.) Madison from Venezuela (now recognized as adistinct species; CATE Araceae, 2008); and var. penta-phyllum from the Guianas and Brazil. Anthuriumpentaphyllum var. pentaphyllum, reported in thispaper (and subsequently referred to as A. pentaphyl-lum), was originally described from French Guianaand circumscribed by Madison as a widespread andvariable subspecies, characterized by a short erectpeduncle and non-sinuate leaflets. Subsequent field-work by the first and second authors has indicated thatvariation in both peduncle length and degree of sinu-osity of the leaflets is greater in var. pentaphyllumthan previously thought, but with fertile materialavailable, the morphological distinction from A. sinua-tum is nevertheless usually quite clear.
REPRODUCTIVE BIOLOGY
Petersen (1989) reported chromosome numbersof between 2n = 30 and 2n = 60 for A. pentaphyllum,including var. pentaphyllum. Ramalho (1994), work-ing with plants from Pernambuco in north-eastBrazil, reported 2n = 60 for A. pentaphyllum var. pen-taphyllum; further work is needed to investigatethe variation in cytology in this taxon. No detailedstudy of the mating system exists. Madison (1978)briefly reported the results of some hybridizations,which included A. pentaphyllum, finding that selfingresulted in 95% fruit set and viable seed; he con-
GENETIC VARIATION IN N.E. BRAZILIAN ANTHURIUM 89
© 2009 The Linnean Society of London, Botanical Journal of the Linnean Society, 2009, 159, 88–105
cluded that internal genetic barriers to hybridizationbetween species probably exist in the palmatifidAnthurium species. Croat (1980) reviewed the flow-ering behaviour in Anthurium as a whole. The flowersare bisexual and tepalate, and most species aredistinctly protogynous with female and male phasesseparated by a sterile phase (Schwerdtfeger, Gerlach& Kaiser, 2002), suggesting that outbreeding is therule, as in Araceae generally (Mayo et al., 1997). Ourown field observations confirm that, in A. sinuatumand A. pentaphyllum, stigma receptivity (indicated bythe presence of a conspicuous droplet) occurs prior toand separately from pollen presentation, and we haveconcluded that these two species are probably out-breeders. Gibernau (2003) reported bees, beetles andflies as pollinators of Anthurium but, as yet, there areno specific reports for A. pentaphyllum. The berriesin both A. pentaphyllum and A. sinuatum are con-spicuous and glossy red, maroon or purple, and areprobably dispersed by fruit-eating birds. Levey(1988), reporting on the ecology of fruit-eating birds,cited A. pentaphyllum as a probable food plant.
THE BREJO FORESTS
The brejo forests of north-east Brazil are found onmountainous uplands within the semi-arid caatingabiome that occupies most of the lowlands in theinterior of the region. They occur between 500 and1110 m in altitude wherever humid prevailing windsprovide annual rainfall above 1200 mm (Lima, Fer-reira & Cavalcanti, 1975). The soils are well devel-oped and, prior to human disturbance in recent times,supported forest formations with permanent watercourses (Andrade-Lima, 1960, 1982; IBGE, 1985;Lins, 1989). The climate is cooler than in the sur-rounding caatinga, where water shortages for over9 months of the year and high temperatures arethe norm (Ab’Sáber, 1977a, b; Sampaio et al., 2002).The brejo forests are currently classified as part of theBrazilian Atlantic forest (IBGE, 1985, 2008), and areconsidered its most threatened element, 85% havingbeen destroyed by deforestation, despite their criticalimportance for regional water resources, as well asfor scientific, environmental and social reasons(Rodal et al., 1998; Pôrto et al., 2004). Few remainingareas have effective legal protection or strategiesfor their preservation and recuperation, and there isan urgent need to develop science-based conservationprogrammes.
Various authors have proposed that the Cearábrejos represent natural fragments of a former humidforest corridor during the Pleistocene or even earlier,along the northern coast of Brazil, linking the Atlan-tic and Amazonian regions (for example, Ab’Sáber,1982; Bigarella & Andrade-Lima, 1982; Borges-
Nojosa & Caramaschi, 2003). In contrast with theeastern coast, this area has no littoral humid forestzone and is much drier. According to this hypothesis,the natural brejo forest fragments, prior to the large-scale human disturbance of the past 500 years,resulted from the regional spread of drier climaticconditions which restricted humid forest to higheraltitudes with greater rainfall and lower tempera-tures. Palynological evidence is crucial to establishingthe previous existence of more mesic conditions innorth-east Brazil. Although Behling (1998) and Ledru(1991, 1993) have attempted reconstructions of thepalaeoclimate of the vegetation of south-east Brazilin the final phase of the Quaternary, palynologicalstudies in north-east Brazil are few. Those of Oliveiraet al. (1999) and Barreto et al. (2002), on Holocenesediments in fossil dune systems of the Rio São Fran-cisco basin, are the most interesting in the contextof our work, because of their relative proximity; theirstudy sites are located approximately 780 km south–south-west of the Ceará brejos. Oliveira et al. (1999)hypothesized that conditions favourable for a humidforest connection between Amazonia and the Atlanticforest could have existed in the first half of theHolocene, either along the north coast of Ceará andneighbouring states or via the gallery forests acrosscentral Brazil, or both, up to approximately 5000 BP.
The aim of our study was to investigate patternsof genetic diversity within and divergence betweenthe studied populations, primarily to address thefollowing questions. Do the Ceará brejo populationsshow genetic evidence of their geographical and eco-logical isolation, such as low intrapopulation diver-sity, and do they differ significantly in genetic markerpatterns? Is the disjunct French Guiana population ofA. pentaphyllum markedly different from the Atlanticforest populations, as might be expected in view oftheir great geographical separation? Is the geneticdifference between the populations of the morphologi-cally variable A. pentaphyllum significantly greaterthan in A. sinuatum? Do the Atlantic forest popula-tions cluster into geographical groups matching pat-terns known in other biota from this region, such asthe Paulista and Central Corridor centres of diversity(Aguiar et al., 2003)? Can A. sinuatum and A. penta-phyllum be distinguished genetically and is thereevidence of their genetic mixing in Ceará, where A.pentaphyllum is absent?
MATERIAL AND METHODSSAMPLE POPULATIONS
A total of 166 individual plants was sampled forthis study from 12 populations (seven populations ofA. pentaphyllum, five populations of A. sinuatum) in
90 I. M. ANDRADE ET AL.
© 2009 The Linnean Society of London, Botanical Journal of the Linnean Society, 2009, 159, 88–105
the humid forests of Ceará, eastern Amazonia, FrenchGuiana and the Brazilian Atlantic forest (Table 1).Because of the possibility of clonal growth, care wastaken when collecting to avoid sampling plants fromthe same tree bole, or, if terrestrial, within 10 m ofeach other; this reduced the scope for larger samplesin some populations.
Voucher specimens of all populations sampled(Table S1, see Supporting Information) are depositedat the following herbaria: Herbário, UniversidadeFederal do Ceará, Fortaleza (EAC); Herbário, Univer-sidade Estadual de Feira de Santana (HUEFS); Her-barium, Royal Botanic Gardens, Kew (K). Speciesnames in Araceae follow CATE Araceae (2008); seeHolmgren & Holmgren (1998) for herbarium codes.
MOLECULAR TECHNIQUES
Genomic DNA was extracted from leaf fragmentsdried in silica gel following the 2 ¥ cetyltrimethylam-monium bromide (CTAB) protocol of Doyle & Doyle(1987) with modifications (10 mL extraction with
40 mL b-mercaptoethanol, followed by precipitationin isopropanol). All samples were then cleaned usingQIAQUICK columns (QIAGEN Inc., Warrington,Cheshire, UK). AFLP reactions (Vos et al., 1995) wereconducted according to the AFLP™ Plant MappingProtocol of PE Applied Biosystems Inc. (Applied Bio-systems, 1996) using EcoRI and MseI. Eight primercombinations (with three and four selective baseson the EcoRI- and MseI-based primers, respectively)were tested on a small number of samples. The twocombinations which gave the best results in terms ofclarity of traces, numbers of bands and numbers ofpolymorphic bands were primer pairs EcoRI-ACT andMseI-CTAG, and EcoRI-AGG and MseI-CTAG, whichwere then used with all samples. Fragments wereseparated using an ABI 3100 sequencer with Genes-can and Genotyper 2.0 (PE Applied Biosystems Inc.)software. Amplified fragments between 50 and 500base pairs (bp) were scored by visual inspection forthe presence (1) or absence (0) of peaks in the outputtraces. Only distinct peaks were scored as present,and the manual scoring procedure was repeated three
Table 1. Geographical details of sampled populations of Anthurium pentaphyllum and Anthurium sinuatum
Population codeLatitude andlongitude Population details
Country orBrazilian state
Samplesize
Anthurium pentaphyllum var. pentaphyllumAPBAR 12°46′40″S
39°03′38″WRecôncavo, Serra daCopioba, Serra da Jibóia
Bahia 14
APBAS 15°17′49″S39°41′27″W
Cacao Zone, Una Bahia 19
APES 19°09′05″S40°04′14″W
Linhares, Santa Tereza Espírito Santo 17
APFG 04°37′26″N52°31′58″W
Arataí French Guiana 8
APPER 08°05′10″S35°00′53″W
Recife, Curado Pernambuco 9
APRJ 22°58′00″S43°13′40″W
Rio de Janeiro (Jardim Botânico,Vista Chinesa)
Rio de Janeiro 19
APSP 23°51′14″S46°08′20″W
Bertioga São Paulo 8
Anthurium sinuatumASCEbat 04°13′19″S
38°56′30″WSerra de Baturité Ceará 30
ASCEibi 03°49′58″S40°56′23″W
Serra de Ibiapaba Ceará 15
ASCEmar 03°54′32″S38°43′30″W
Serra de Maranguape Ceará 7
ASCEpac 03°57′21″S38°37′44″W
Serra de Aratanha, Pacatuba Ceará 14
ASPA 01°30′32″S48°17′59″W
Acará, Marituba Pará 6
See also map in Figure 1.
GENETIC VARIATION IN N.E. BRAZILIAN ANTHURIUM 91
© 2009 The Linnean Society of London, Botanical Journal of the Linnean Society, 2009, 159, 88–105
times on separate occasions to reduce inconsistenciesin scoring to a minimum. The resulting binary matri-ces of AFLP bands were used to carry out variouskinds of genetic data analysis.
GENETIC DATA ANALYSIS
Within-population genetic diversityWithin-population genetic diversity was estimatedassuming Hardy–Weinberg equilibrium usingGENALEX 6 (Peakall & Smouse, 2006) to computeaverage expected heterozygosity (He, equivalent toNei’s gene diversity) for each population from thebinary AFLP data matrix.
The average values of He calculated usingGENALEX 6 were tested employing a bootstrap resa-mpling procedure carried out using the statisticalsoftware package R (R Development Core Team, 2006).The rows of the original binary matrix were randomlypermuted and the columns were then bootstrap resa-mpled using the ‘sample’ function with replacement(‘replace = T’). A random sample of 14 rows (theaverage sample size) was then made, from which asample average He was calculated using the formulagiven in the GENALEX manual (Peakall & Smouse,2006). This procedure was repeated 10 000 times toprovide a null distribution of values for average He,from which P values could be calculated for theaverage He values observed in each population.
Population clusteringWe used AFLP-SURV version 1.0 (Vekemans, 2002;Vekemans et al., 2002) to compute FST distance matri-ces between populations. The program is designed forAFLP data and estimates allele frequencies at eachmarker locus in each population, assuming that themarkers are dominant and that there are two allelesper locus (presence of the band being dominant andabsence recessive). We used the default option, i.e.Bayesian method with non-uniform prior distributionof allele frequencies (Zhivotovsky, 1999), and assumedHardy–Weinberg equilibrium for the data. Wright’sfixation index FST (Hartl & Clark, 1997) was com-puted using the method of Lynch & Milligan (1994),and tested by a permutation procedure of 1000 rep-licates, which randomly permuted individuals amongthe populations and then recalculated FST for eachpermutation; the observed value of FST was thencompared with the distribution of randomized FST
values. A distance matrix of pairwise FST betweenpopulations was calculated in AFLP-SURV as ameasure of interpopulation genetic differentiation,from which 1000 bootstrapped replicate matriceswere then computed.
To express the clustering patterns of populationsvisually, the bootstrapped FST matrices were used as
input to compute an unweighted pair group methodwith arithmetic averaging (UPGMA) consensustree using the software package PHYLIP version 3.66(Felsenstein, 2006): first, the module NEIGHBORwas used to compute UPGMA dendrograms forall bootstrapped matrices, and then an extendedmajority rule consensus tree was produced using themodule CONSENSE.
Significance of interpopulation genetic differencesThe significance of the population pairwise differ-ences was estimated using the software packageGENALEX 6 (Peakall & Smouse, 2006). Distancematrices were prepared from the original binarymatrix by computing FPT, a metric which is analogousto FST for binary data. The significance of the inter-population FPT values was evaluated by permutationtests of 1000 permutations.
Test for correlation with geographical distanceIsolation-by-distance patterns were investigated bycomputing the correlation between geographical andgenetic (FPT) population pairwise distance matricesand applying the Mantel test, using NTSYSpc version2.2d (Rohlf, 2005). The significance of the Mantel zstatistic value was tested non-parametrically by cre-ating a null distribution of z using 10 000 randompermutations, and comparing the observed z value.
Partition of variation within andbetween populationsAnalysis of molecular variance (AMOVA) was carriedout using ARLEQUIN version 2.0 (Schneider, Roessli& Excoffier, 2000); the number of AFLP phenotypesobserved in each population was computed usingthe setting ‘Infer haplotype definitions from distancematrix’. Genetic structure and statistics were com-puted from a matrix of Euclidean squared distancesbetween every pair of individuals (Schneider et al.,2000). Four models were tested. The first treated allpopulations as a single group, i.e. a two-level analy-sis, to obtain a value for FST as an overall measure ofpopulation divergence. Two of the other three modelstreated the populations of each species separately asa single group in two-level analyses. The fourth modelwas a three-level hierarchical analysis treating all12 populations in two groups, representing the twospecies.
Test for influence of inbreedingPopulation structure was also investigated by theBayesian software HICKORY version 1.0.4 (Hols-inger, Lewis & Dey, 2002; Holsinger & Lewis, 2003),in order to assess the importance of inbreeding inthe data and the assumption of Hardy–Weinbergequilibrium. HICKORY makes it possible to evaluate
92 I. M. ANDRADE ET AL.
© 2009 The Linnean Society of London, Botanical Journal of the Linnean Society, 2009, 159, 88–105
departures from Hardy–Weinberg equilibrium indominant as well as co-dominant markers. Separateanalyses were carried out for the seven populationsof A. pentaphyllum and the five populations ofA. sinuatum. For each, the AFLP data were fitted tofour models: ‘full model’, which allows for inbreeding;‘f = 0’ model, which implies a lack of inbreeding;‘theta = 0’ model, which implies a zero-valued FST ana-logue (i.e. no differentiation between populations);and ‘f free’ model, which decouples the estimates off and theta. Computations were carried out usingthe default values, as recommended in the manual(Holsinger & Lewis, 2003): burn-in = 5000, number ofsamples = 25 000 and thinning factor = 5. To estimatethe best fit of the four models, the criteria DIC (devi-ance information criterion), Dbar, Dhat and pD wereused, with interpretations following the recommenda-tions given in the manual.
Grouping the individuals into genetic clustersThree methods were used to cluster individuals onthe basis of their AFLP marker patterns: (1) agglom-erative hierarchical cluster analysis (UPGMA); (2)principal coordinate analysis; and (3) model-basedBayesian cluster analysis.
A bootstrapped UPGMA was carried out using thesoftware package PHYLIP version 3.66 (Felsenstein,2006). The binary AFLP matrix was bootstrappedwith 1000 replicates using the SEQBOOT module.Distance matrices for each replicate matrix werecomputed using the RESTDIST module, which isdesigned to calculate distance matrices from restric-tion site or fragment data, including AFLPs. Themodule NEIGHBOR was used to compute UPGMAdendrograms for all bootstrapped distance matrices,and an extended majority rule consensus tree wasproduced using the module CONSENSE. Bootstrapvalues were then transferred to a UPGMA dendro-gram computed in NTSYSpc version 2.2 (Rohlf, 2005)from the RESTDIST distance matrix based on theoriginal binary matrix.
Principal coordinate analysis was used to generatea two-dimensional ordination of the sampled indi-viduals, which served primarily to illustrate the sepa-ration of the two species, based on a dissimilaritymeasure different from that used in UPGMA. Jac-card’s similarity coefficient (Sneath & Sokal, 1973)was computed for all pairs of individuals usingthe SIMQUAL module in NTSYSpc version 2.2d, andthen transformed into a dissimilarity measure as(1 – Jaccard’s similarity). Principal coordinate analy-sis was carried out on this dissimilarity matrix usingNTSYSpc version 2.2d (modules DCENTER, EIGEN,MXPLOT).
Model-based Bayesian analysis was carried outusing the software package STRUCTURE version 2.1
(Pritchard, Stephens & Donnelly, 2000), applying a ‘noadmixture’ model, 100 000 burn-in period length and100 000 Markov chain Monte Carlo (MCMC) replicatesafter burn-in. This approach requires that the numberof clusters (k) is predefined, and the analysis thenassigns the individuals to the clusters probabilistically.We performed three to five runs for each value ofk (2–19), and then eight runs with 500 000 MCMCreplicates for the k = 14 model. STRUCTURE is widelyused for inferring gene pool structure in genetic data.
RESULTS
The matrix of 166 individuals, from which satis-factory results were obtained for both primer com-binations, was made up of 252 fragments (bands)and was used for further analysis; 100% of the scoredmarker bands were polymorphic. All AFLP pheno-types recorded were unique to one individual and wetherefore assumed that no resampling of clones hadoccurred during the field collections.
WITHIN-POPULATION GENETIC DIVERSITY
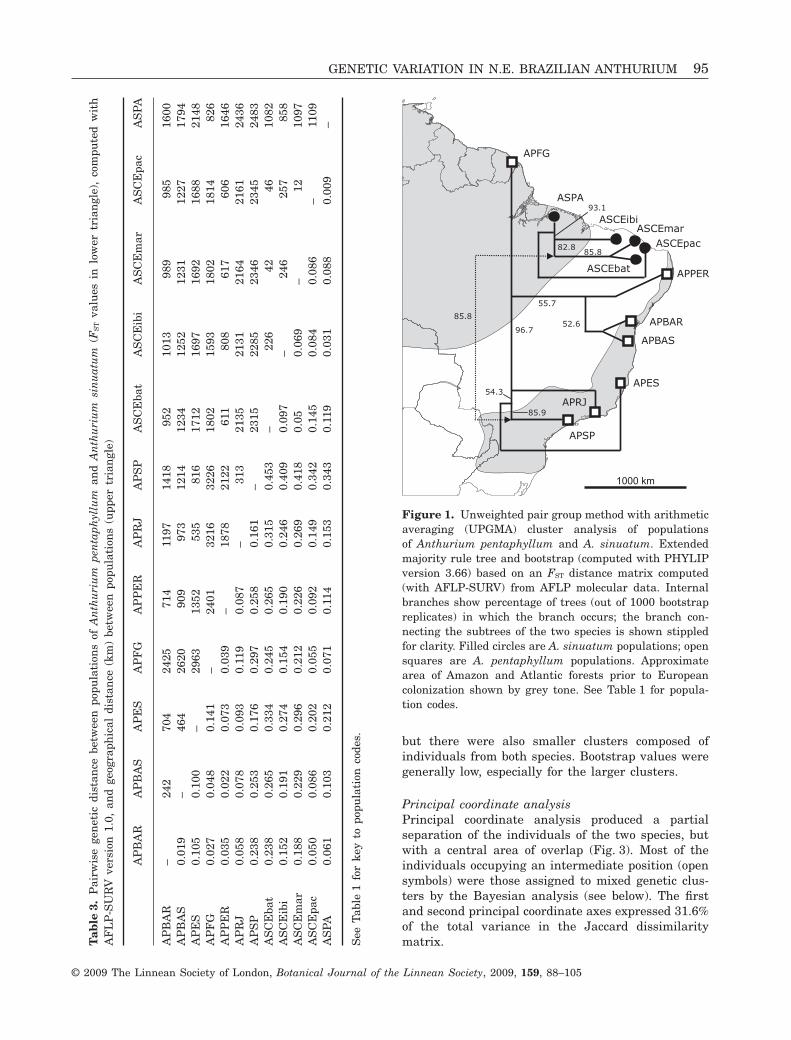
In A. pentaphyllum, the most diverse populations,in descending order, were Bahia-Recôncavo (APBAR),Espírito Santo (APES) and Rio de Janeiro (APRJ),none of which was significantly less diverse thanexpected (Table 2). The southernmost population inSão Paulo was much less diverse (P < 0.0001), andremained so when the bootstrap test was modifiedto take replicate samples of only N = 8, the samplesize of this population. The northern populationsin Pernambuco (APPER, P < 0.01) and French Guiana(APFG, P < 0.01) were likewise significantly lessdiverse than the average.
In A. sinuatum, the Ibiapaba population (ASCEibi),the most isolated of those studied in Ceará, wasgenetically the most diverse (Table 2), and Maran-guape (ASCEmar) was the least diverse, measuredby average expected heterozygosity (He). Pacatuba(ASCEpac) was the most diverse measured bypercentage of polymorphic loci (Pl). The other twopopulations, including that at Pará (ASPA), had inter-mediate levels of diversity. The bootstrap analysisshowed that the Ibiapaba population did not differsignificantly in diversity (P = 0.056) from the averagefor pooled populations of both species taken together.The Maranguape population, however, was signifi-cantly less diverse (P < 0.001), and the others slightlyso (0.02 < P < 0.03).
POPULATION CLUSTERING
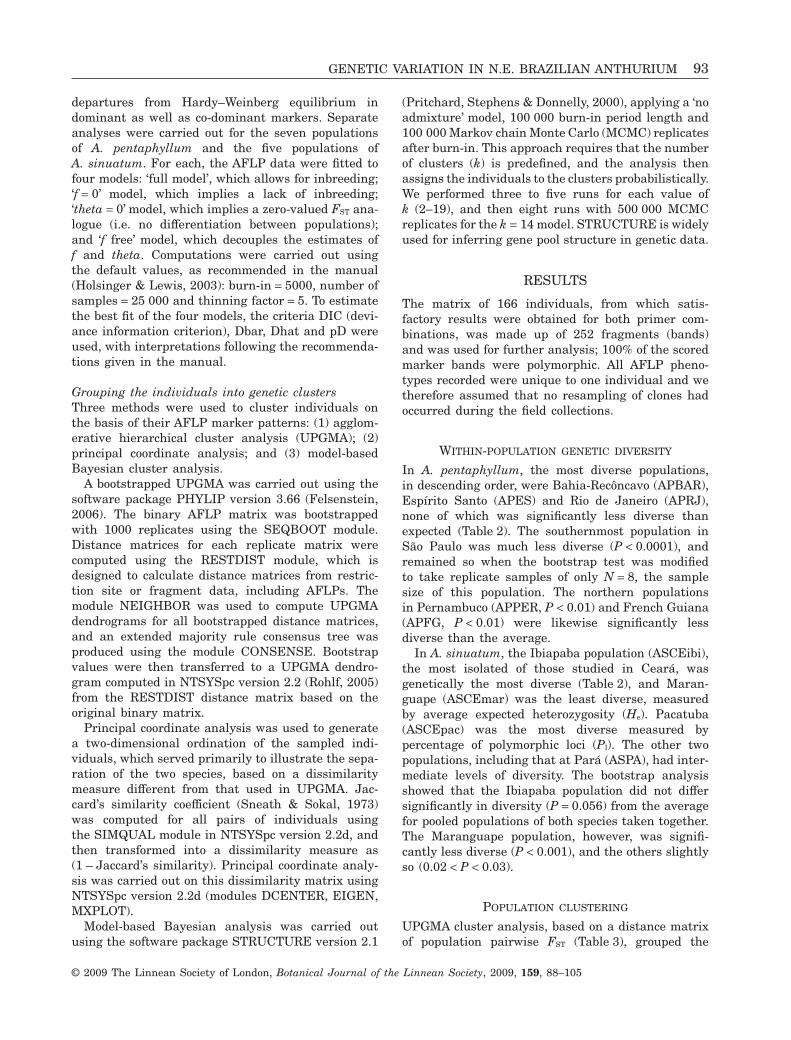
UPGMA cluster analysis, based on a distance matrixof population pairwise FST (Table 3), grouped the
GENETIC VARIATION IN N.E. BRAZILIAN ANTHURIUM 93
© 2009 The Linnean Society of London, Botanical Journal of the Linnean Society, 2009, 159, 88–105

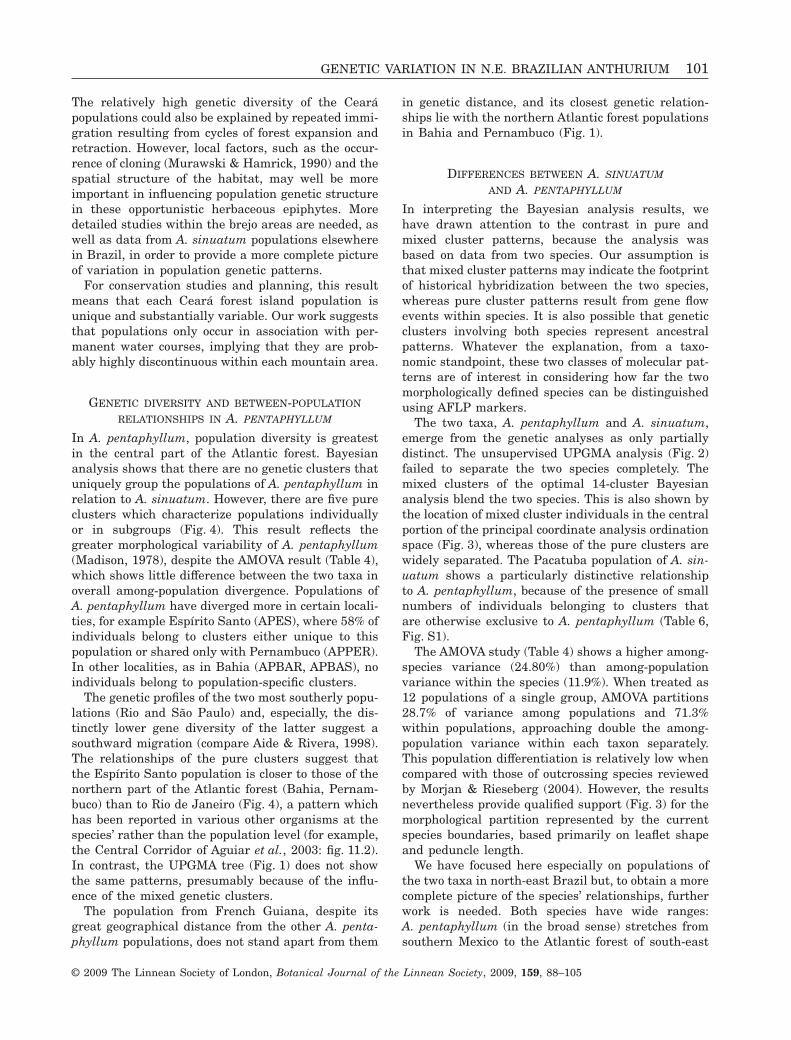
populations into their respective species (Fig. 1), butthe bootstrap support of the two species’ clusters(85.8%) was weaker than between some populationgroups within each species. The most strongly sup-ported cluster (96.7%) was composed of the fournorthern populations of A. pentaphyllum, in FrenchGuiana, Pernambuco and Bahia. In A. sinuatum,the best supported group (93.1%) was composed ofthe Pará (ASPA, Amazonia) and Pacatuba (ASCEpac,Ceará) populations.
SIGNIFICANCE OF INTERPOPULATION
GENETIC DIFFERENCES
Analysis of interpopulation genetic distances withGENALEX 6 showed that the 12 populations weresignificantly different in all possible pairs [P (prob-ability of observed FPT) � 0.03), except in the Pará–Pacatuba population pair (P = 0.056).
CORRELATION WITH GEOGRAPHICAL DISTANCE
Genetic distances between populations (estimatedwith FPT using GENALEX 6) and geographical dis-tances were not significantly correlated within eitherspecies (Mantel test: A. sinuatum: r = - 0.26, P = 0.83;A. pentaphyllum: r = 0.20, P = 0.18).
PARTITION OF VARIATION WITHIN AND
BETWEEN POPULATIONS
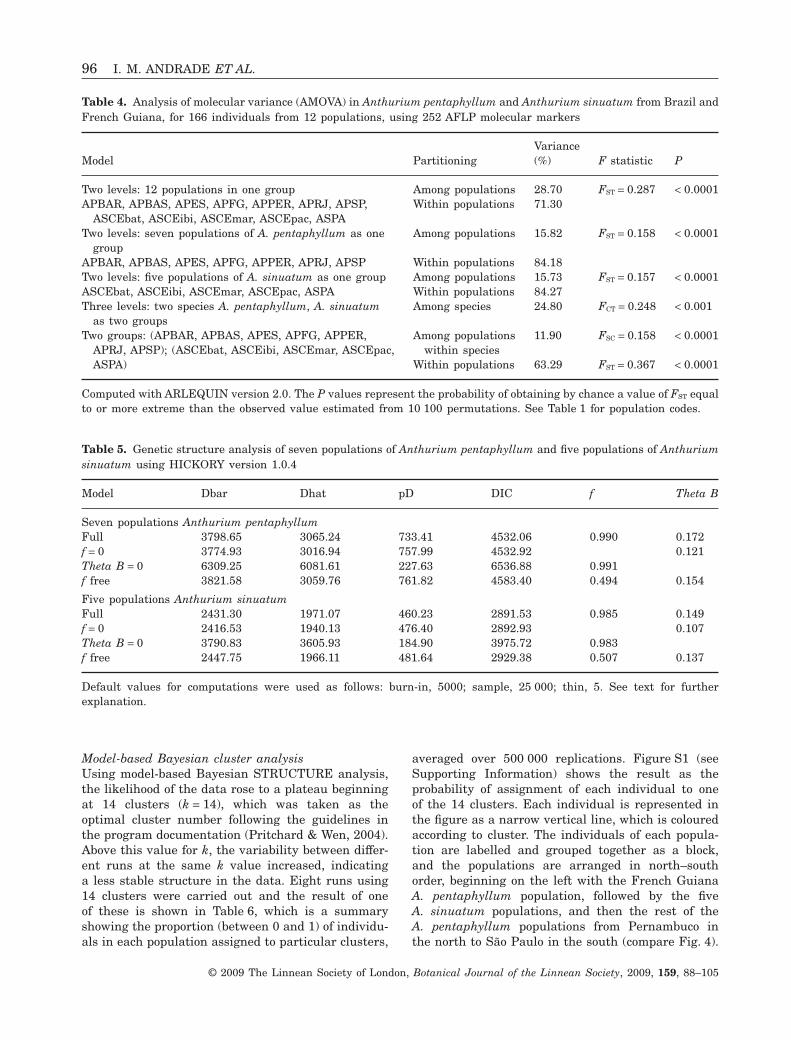
The AMOVA results (Table 4) using ARLEQUINshowed that between-population variation was similar
within A. pentaphyllum (15.82% of total variation)and within A. sinuatum (15.73% of total variation),and lower than that between the two species (24.80%of variation). When treated as 12 subpopulationsof a single overall population, the data gave 28.7%between-population variation and 71.3% within-population variation.
INFLUENCE OF INBREEDING
Results using the Bayesian software HICKORYshowed that inbreeding was unlikely to be a majordriving force in determining the gene pool structurein either taxon (Table 5). In both analyses, the DICparameter was equal or almost equal in the ‘full’ and‘f = 0’ models, whereas the Dbar values were lower inthe ‘f = 0’ model. Because the model with the lowestDbar value is that which fits the data best, thispattern of results allows the ‘f = 0’ model (inbreedingequals zero) to be considered as more likely than the‘full’ model (HICKORY manual; Holsinger & Lewis,2003).
GROUPING THE INDIVIDUALS INTO
GENETIC CLUSTERS
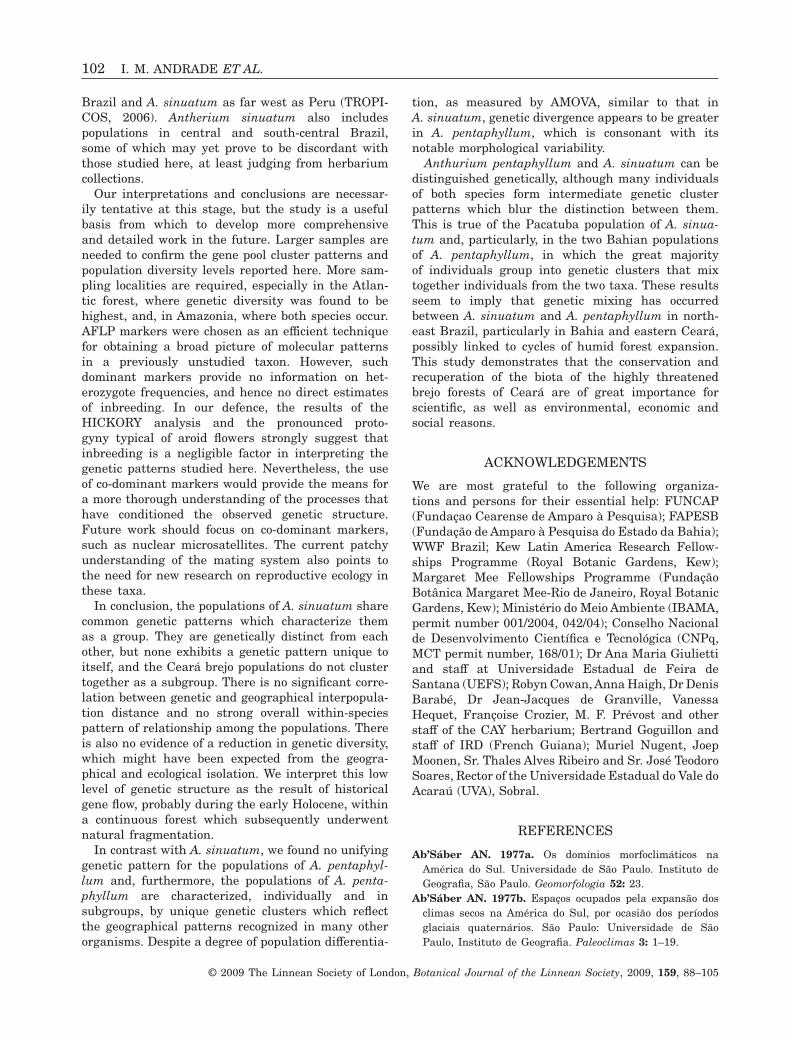
Hierarchical cluster analysisAgglomerative hierarchical cluster analysis (UPGMA)of individuals showed two major clusters (Fig. 2)within which the two species A. pentaphyllum (openbar) and A. sinuatum (filled bar) were recognizable,
Table 2. Genetic diversity measures in 12 sampled populations of Anthurium pentaphyllum and Anthurium sinuatumfrom Brazil and French Guiana
Populationcode
Samplesize
Percentagepolymorphic loci (Pl)
Average expectedheterozygosity (He) SE of He P value*
Anthurium pentaphyllum var. pentaphyllumAPBAR 14 62.30 0.153 0.011 0.139APBAS 19 62.30 0.144 0.010 0.051APES 17 58.33 0.150 0.011 0.097APFG 8 50.79 0.134 0.010 0.009APPER 9 44.05 0.133 0.011 0.008APRJ 19 54.76 0.146 0.011 0.065APSP 8 30.95 0.091 0.010 0.000
Anthurium sinuatumASCEbat 30 53.97 0.140 0.011 0.026ASCEibi 15 51.98 0.145 0.011 0.056ASCEmar 7 38.10 0.121 0.011 0.000ASCEpac 14 57.14 0.140 0.011 0.027ASPA 6 42.86 0.139 0.011 0.023
*The P value is the frequency at which the observed value of He occurred in the resample distribution of 10 000 randombootstrap replicates. If P < 0.05, the observed value is considered to be significantly lower than expected by chance.Diversity measures computed in GENALEX 6 (Peakall & Smouse, 2006); bootstrap resample distribution computed in Rversion 2.4.1. (R Development Core Team, 2006). See Table 1 for population codes.
94 I. M. ANDRADE ET AL.
© 2009 The Linnean Society of London, Botanical Journal of the Linnean Society, 2009, 159, 88–105
but there were also smaller clusters composed ofindividuals from both species. Bootstrap values weregenerally low, especially for the larger clusters.
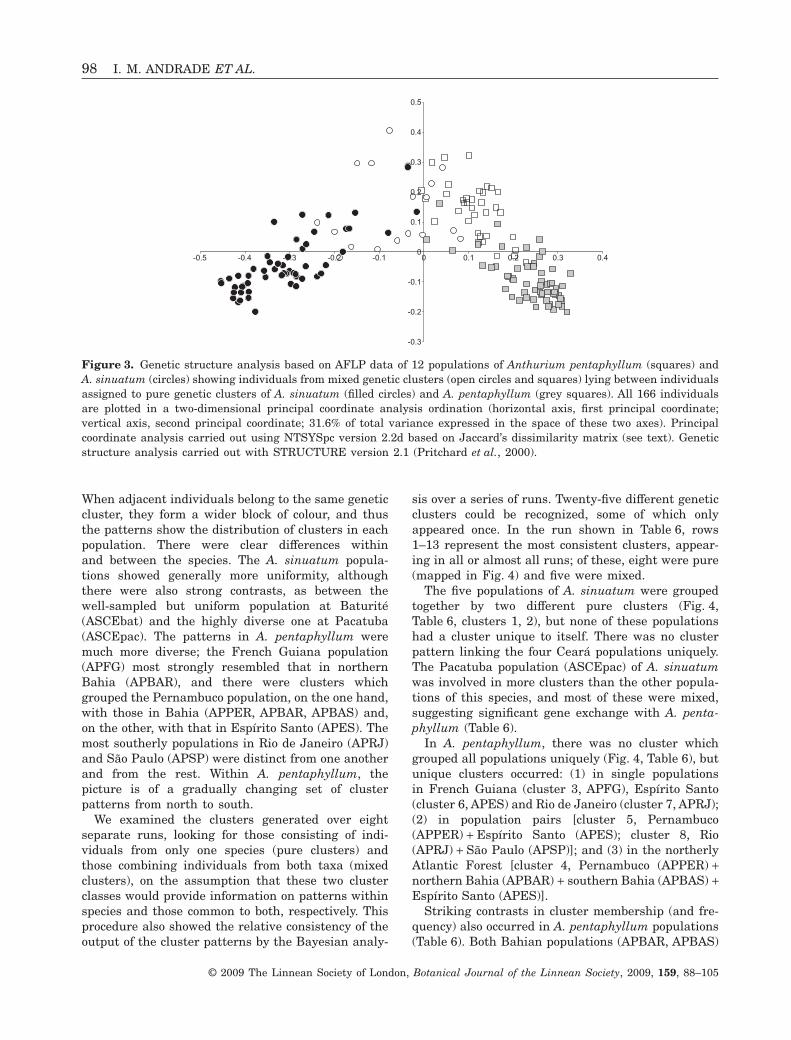
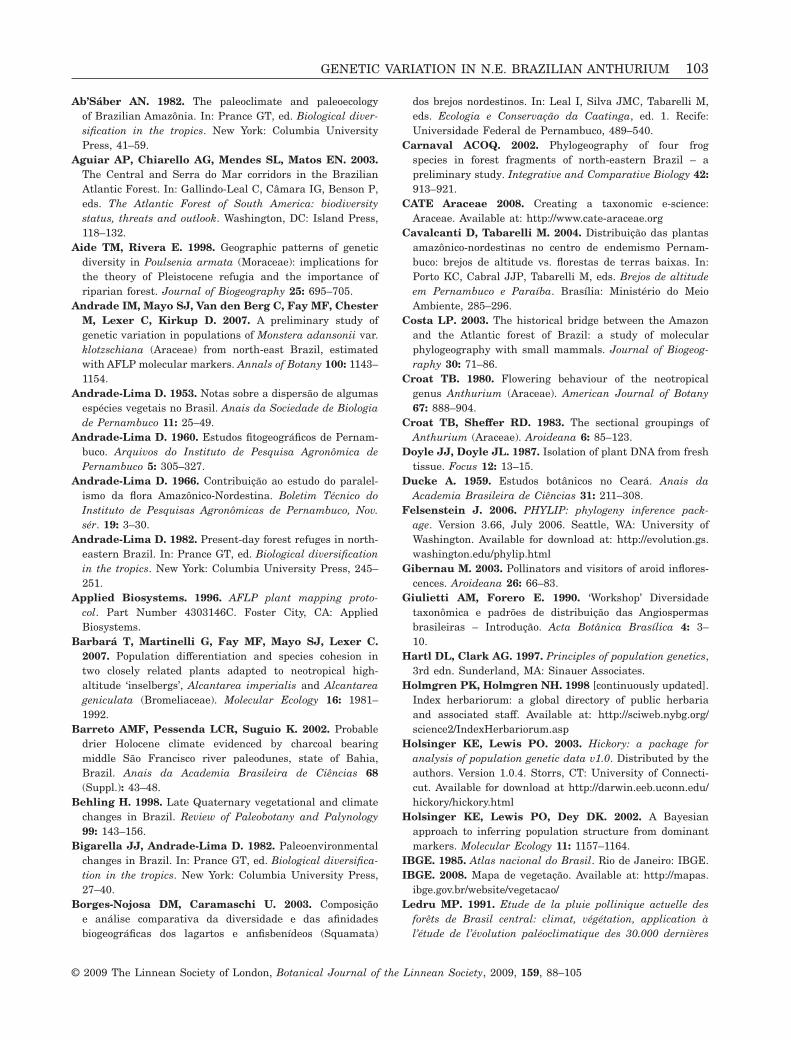
Principal coordinate analysisPrincipal coordinate analysis produced a partialseparation of the individuals of the two species, butwith a central area of overlap (Fig. 3). Most of theindividuals occupying an intermediate position (opensymbols) were those assigned to mixed genetic clus-ters by the Bayesian analysis (see below). The firstand second principal coordinate axes expressed 31.6%of the total variance in the Jaccard dissimilaritymatrix.T
able
3.P
airw
ise
gen
etic
dist
ance
betw
een
popu
lati
ons
ofA
nth
uri
um
pen
taph
yllu
man
dA
nth
uri
um
sin
uat
um
(FS
Tva
lues
inlo
wer
tria
ngl
e),
com
pute
dw
ith
AF
LP
-SU
RV
vers
ion
1.0,
and
geog
raph
ical
dist
ance
(km
)be
twee
npo
pula
tion
s(u
pper
tria
ngl
e)
AP
BA
RA
PB
AS
AP
ES
AP
FG
AP
PE
RA
PR
JA
PS
PA
SC
Eba
tA
SC
Eib
iA
SC
Em
arA
SC
Epa
cA
SPA
AP
BA
R–
242
704
2425
714
1197
1418
952
1013
989
985
1600
AP
BA
S0.
019
–46
426
2090
997
312
1412
3412
5212
3112
2717
94A
PE
S0.
105
0.10
0–
2963
1352
535
816
1712
1697
1692
1688
2148
AP
FG
0.02
70.
048
0.14
1–
2401
3216
3226
1802
1593
1802
1814
826
AP
PE
R0.
035
0.02
20.
073
0.03
9–
1878
2122
611
808
617
606
1646
AP
RJ
0.05
80.
078
0.09
30.
119
0.08
7–
313
2135
2131
2164
2161
2436
AP
SP
0.23
80.
253
0.17
60.
297
0.25
80.
161
–23
1522
8523
4623
4524
83A
SC
Eba
t0.
238
0.26
50.
334
0.24
50.
265
0.31
50.
453
–22
642
4610
82A
SC
Eib
i0.
152
0.19
10.
274
0.15
40.
190
0.24
60.
409
0.09
7–
246
257
858
AS
CE
mar
0.18
80.
229
0.29
60.
212
0.22
60.
269
0.41
80.
050.
069
–12
1097
AS
CE
pac
0.05
00.
086
0.20
20.
055
0.09
20.
149
0.34
20.
145
0.08
40.
086
–11
09A
SPA
0.06
10.
103
0.21
20.
071
0.11
40.
153
0.34
30.
119
0.03
10.
088
0.00
9–
See
Tabl
e1
for
key
topo
pula
tion
code
s.
APFG
ASCEpac
ASCEibi
ASPA
APBAS
APES
APRJ
APSP
ASCEbat
1000 km
APBAR
APPER
ASCEmar
52.6
55.7
96.7
54.3
85.9
85.8
85.8
93.1
82.8
Figure 1. Unweighted pair group method with arithmeticaveraging (UPGMA) cluster analysis of populationsof Anthurium pentaphyllum and A. sinuatum. Extendedmajority rule tree and bootstrap (computed with PHYLIPversion 3.66) based on an FST distance matrix computed(with AFLP-SURV) from AFLP molecular data. Internalbranches show percentage of trees (out of 1000 bootstrapreplicates) in which the branch occurs; the branch con-necting the subtrees of the two species is shown stippledfor clarity. Filled circles are A. sinuatum populations; opensquares are A. pentaphyllum populations. Approximatearea of Amazon and Atlantic forests prior to Europeancolonization shown by grey tone. See Table 1 for popula-tion codes.
GENETIC VARIATION IN N.E. BRAZILIAN ANTHURIUM 95
© 2009 The Linnean Society of London, Botanical Journal of the Linnean Society, 2009, 159, 88–105
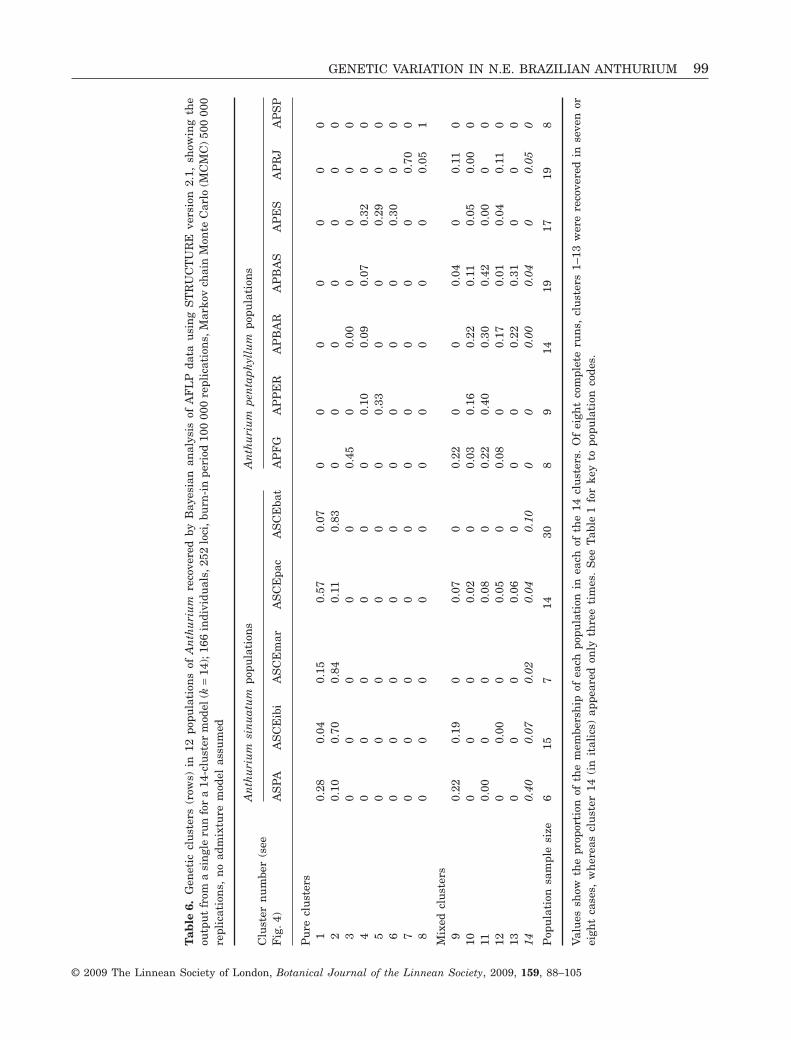
Model-based Bayesian cluster analysisUsing model-based Bayesian STRUCTURE analysis,the likelihood of the data rose to a plateau beginningat 14 clusters (k = 14), which was taken as theoptimal cluster number following the guidelines inthe program documentation (Pritchard & Wen, 2004).Above this value for k, the variability between differ-ent runs at the same k value increased, indicatinga less stable structure in the data. Eight runs using14 clusters were carried out and the result of oneof these is shown in Table 6, which is a summaryshowing the proportion (between 0 and 1) of individu-als in each population assigned to particular clusters,
averaged over 500 000 replications. Figure S1 (seeSupporting Information) shows the result as theprobability of assignment of each individual to oneof the 14 clusters. Each individual is represented inthe figure as a narrow vertical line, which is colouredaccording to cluster. The individuals of each popula-tion are labelled and grouped together as a block,and the populations are arranged in north–southorder, beginning on the left with the French GuianaA. pentaphyllum population, followed by the fiveA. sinuatum populations, and then the rest of theA. pentaphyllum populations from Pernambuco inthe north to São Paulo in the south (compare Fig. 4).
Table 4. Analysis of molecular variance (AMOVA) in Anthurium pentaphyllum and Anthurium sinuatum from Brazil andFrench Guiana, for 166 individuals from 12 populations, using 252 AFLP molecular markers
Model PartitioningVariance(%) F statistic P
Two levels: 12 populations in one group Among populations 28.70 FST = 0.287 < 0.0001APBAR, APBAS, APES, APFG, APPER, APRJ, APSP,
ASCEbat, ASCEibi, ASCEmar, ASCEpac, ASPAWithin populations 71.30
Two levels: seven populations of A. pentaphyllum as onegroup
Among populations 15.82 FST = 0.158 < 0.0001
APBAR, APBAS, APES, APFG, APPER, APRJ, APSP Within populations 84.18Two levels: five populations of A. sinuatum as one group Among populations 15.73 FST = 0.157 < 0.0001ASCEbat, ASCEibi, ASCEmar, ASCEpac, ASPA Within populations 84.27Three levels: two species A. pentaphyllum, A. sinuatum
as two groupsAmong species 24.80 FCT = 0.248 < 0.001
Two groups: (APBAR, APBAS, APES, APFG, APPER,APRJ, APSP); (ASCEbat, ASCEibi, ASCEmar, ASCEpac,ASPA)
Among populationswithin species
11.90 FSC = 0.158 < 0.0001
Within populations 63.29 FST = 0.367 < 0.0001
Computed with ARLEQUIN version 2.0. The P values represent the probability of obtaining by chance a value of FST equalto or more extreme than the observed value estimated from 10 100 permutations. See Table 1 for population codes.
Table 5. Genetic structure analysis of seven populations of Anthurium pentaphyllum and five populations of Anthuriumsinuatum using HICKORY version 1.0.4
Model Dbar Dhat pD DIC f Theta B
Seven populations Anthurium pentaphyllumFull 3798.65 3065.24 733.41 4532.06 0.990 0.172f = 0 3774.93 3016.94 757.99 4532.92 0.121Theta B = 0 6309.25 6081.61 227.63 6536.88 0.991f free 3821.58 3059.76 761.82 4583.40 0.494 0.154
Five populations Anthurium sinuatumFull 2431.30 1971.07 460.23 2891.53 0.985 0.149f = 0 2416.53 1940.13 476.40 2892.93 0.107Theta B = 0 3790.83 3605.93 184.90 3975.72 0.983f free 2447.75 1966.11 481.64 2929.38 0.507 0.137
Default values for computations were used as follows: burn-in, 5000; sample, 25 000; thin, 5. See text for furtherexplanation.
96 I. M. ANDRADE ET AL.
© 2009 The Linnean Society of London, Botanical Journal of the Linnean Society, 2009, 159, 88–105
Coefficient0.000.010.020.030.04
97.1
69.9
63.1
99.5
50.675.4
97.199.2
69.0
51.8
83.5
68.3 57.0
52.8
74.3
65.8 78.7
50.6 55.5
58.3
60.4
56.4
99.9
58.3
50.7
62.0
51.3
75.4
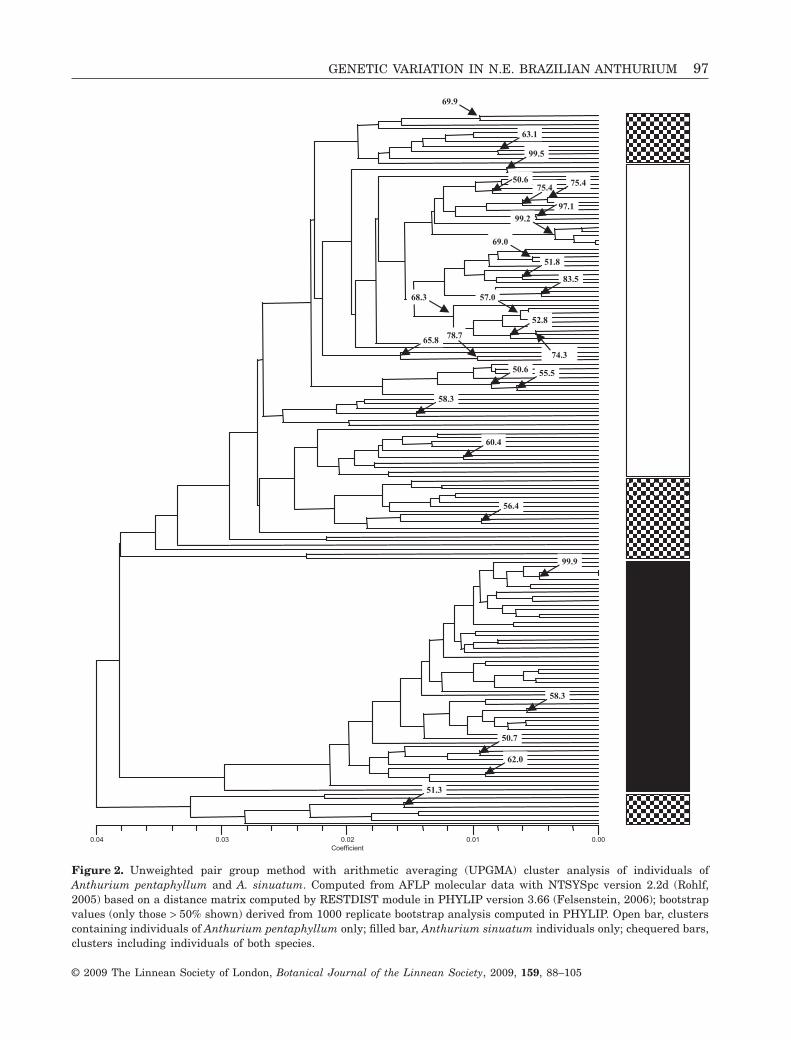
Figure 2. Unweighted pair group method with arithmetic averaging (UPGMA) cluster analysis of individuals ofAnthurium pentaphyllum and A. sinuatum. Computed from AFLP molecular data with NTSYSpc version 2.2d (Rohlf,2005) based on a distance matrix computed by RESTDIST module in PHYLIP version 3.66 (Felsenstein, 2006); bootstrapvalues (only those > 50% shown) derived from 1000 replicate bootstrap analysis computed in PHYLIP. Open bar, clusterscontaining individuals of Anthurium pentaphyllum only; filled bar, Anthurium sinuatum individuals only; chequered bars,clusters including individuals of both species.
GENETIC VARIATION IN N.E. BRAZILIAN ANTHURIUM 97
© 2009 The Linnean Society of London, Botanical Journal of the Linnean Society, 2009, 159, 88–105
When adjacent individuals belong to the same geneticcluster, they form a wider block of colour, and thusthe patterns show the distribution of clusters in eachpopulation. There were clear differences withinand between the species. The A. sinuatum popula-tions showed generally more uniformity, althoughthere were also strong contrasts, as between thewell-sampled but uniform population at Baturité(ASCEbat) and the highly diverse one at Pacatuba(ASCEpac). The patterns in A. pentaphyllum weremuch more diverse; the French Guiana population(APFG) most strongly resembled that in northernBahia (APBAR), and there were clusters whichgrouped the Pernambuco population, on the one hand,with those in Bahia (APPER, APBAR, APBAS) and,on the other, with that in Espírito Santo (APES). Themost southerly populations in Rio de Janeiro (APRJ)and São Paulo (APSP) were distinct from one anotherand from the rest. Within A. pentaphyllum, thepicture is of a gradually changing set of clusterpatterns from north to south.
We examined the clusters generated over eightseparate runs, looking for those consisting of indi-viduals from only one species (pure clusters) andthose combining individuals from both taxa (mixedclusters), on the assumption that these two clusterclasses would provide information on patterns withinspecies and those common to both, respectively. Thisprocedure also showed the relative consistency of theoutput of the cluster patterns by the Bayesian analy-
sis over a series of runs. Twenty-five different geneticclusters could be recognized, some of which onlyappeared once. In the run shown in Table 6, rows1–13 represent the most consistent clusters, appear-ing in all or almost all runs; of these, eight were pure(mapped in Fig. 4) and five were mixed.
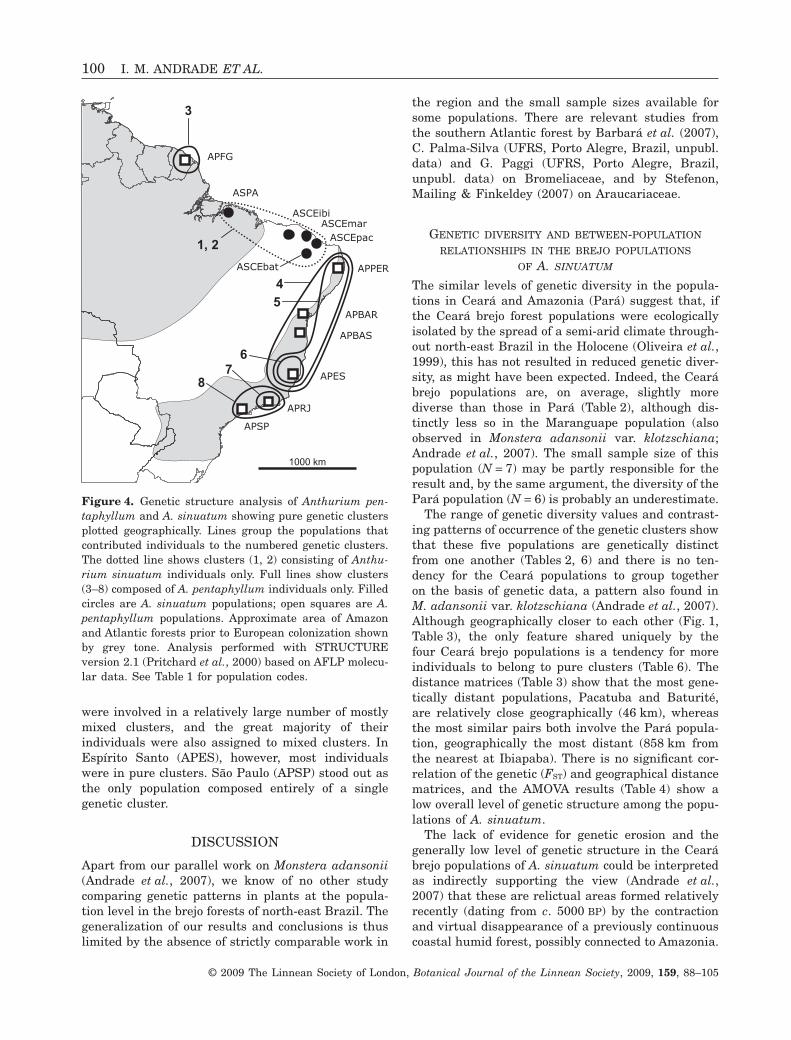
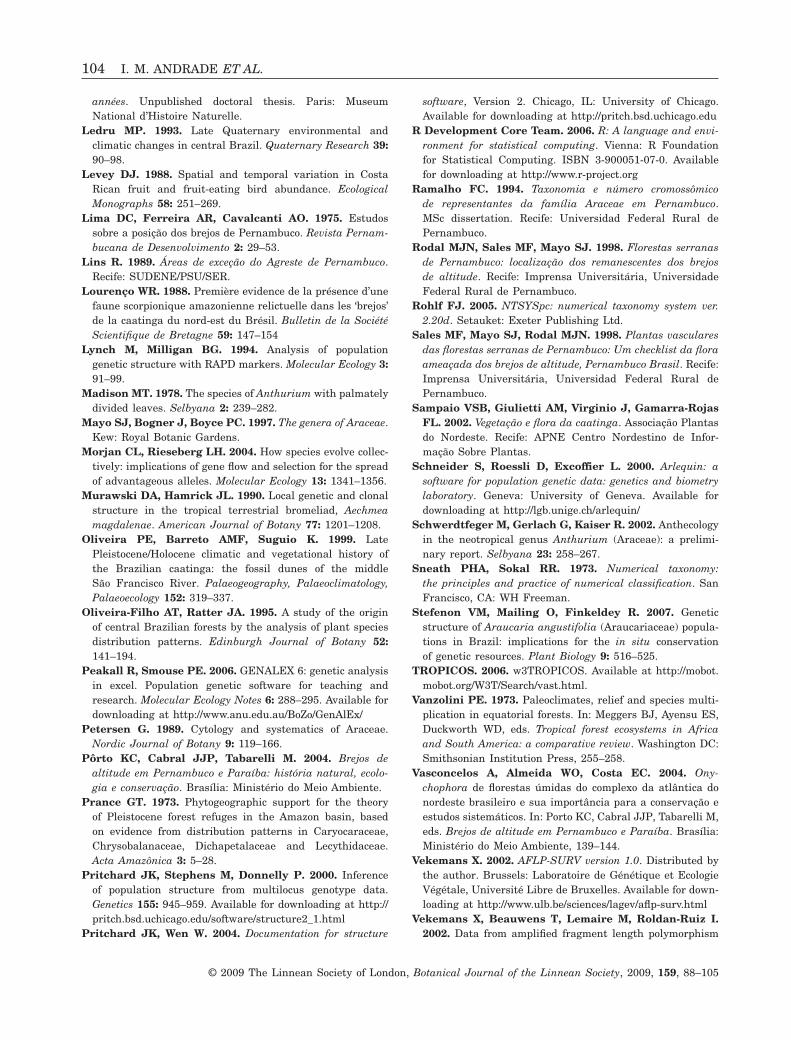
The five populations of A. sinuatum were groupedtogether by two different pure clusters (Fig. 4,Table 6, clusters 1, 2), but none of these populationshad a cluster unique to itself. There was no clusterpattern linking the four Ceará populations uniquely.The Pacatuba population (ASCEpac) of A. sinuatumwas involved in more clusters than the other popula-tions of this species, and most of these were mixed,suggesting significant gene exchange with A. penta-phyllum (Table 6).
In A. pentaphyllum, there was no cluster whichgrouped all populations uniquely (Fig. 4, Table 6), butunique clusters occurred: (1) in single populationsin French Guiana (cluster 3, APFG), Espírito Santo(cluster 6, APES) and Rio de Janeiro (cluster 7, APRJ);(2) in population pairs [cluster 5, Pernambuco(APPER) + Espírito Santo (APES); cluster 8, Rio(APRJ) + São Paulo (APSP)]; and (3) in the northerlyAtlantic Forest [cluster 4, Pernambuco (APPER) +northern Bahia (APBAR) + southern Bahia (APBAS) +Espírito Santo (APES)].
Striking contrasts in cluster membership (and fre-quency) also occurred in A. pentaphyllum populations(Table 6). Both Bahian populations (APBAR, APBAS)
-0.3
-0.2
-0.1
0
0.1
0.2
0.3
0.4
0.5
0.40.30.20.10-0.1-0.2-0.3-0.4-0.5
Figure 3. Genetic structure analysis based on AFLP data of 12 populations of Anthurium pentaphyllum (squares) andA. sinuatum (circles) showing individuals from mixed genetic clusters (open circles and squares) lying between individualsassigned to pure genetic clusters of A. sinuatum (filled circles) and A. pentaphyllum (grey squares). All 166 individualsare plotted in a two-dimensional principal coordinate analysis ordination (horizontal axis, first principal coordinate;vertical axis, second principal coordinate; 31.6% of total variance expressed in the space of these two axes). Principalcoordinate analysis carried out using NTSYSpc version 2.2d based on Jaccard’s dissimilarity matrix (see text). Geneticstructure analysis carried out with STRUCTURE version 2.1 (Pritchard et al., 2000).
98 I. M. ANDRADE ET AL.
© 2009 The Linnean Society of London, Botanical Journal of the Linnean Society, 2009, 159, 88–105
Tab
le6.
Gen
etic
clu
ster
s(r
ows)
in12
popu
lati
ons
ofA
nth
uri
um
reco
vere
dby
Bay
esia
nan
alys
isof
AF
LP
data
usi
ng
ST
RU
CT
UR
Eve
rsio
n2.
1,sh
owin
gth
eou
tpu
tfr
oma
sin
gle
run
for
a14
-clu
ster
mod
el(k
=14
);16
6in
divi
dual
s,25
2lo
ci,b
urn
-in
peri
od10
000
0re
plic
atio
ns,
Mar
kov
chai
nM
onte
Car
lo(M
CM
C)
500
000
repl
icat
ion
s,n
oad
mix
ture
mod
elas
sum
ed
Clu
ster
nu
mbe
r(s
eeF
ig.4
)
An
thu
riu
msi
nu
atu
mpo
pula
tion
sA
nth
uri
um
pen
taph
yllu
mpo
pula
tion
s
AS
PAA
SC
Eib
iA
SC
Em
arA
SC
Epa
cA
SC
Eba
tA
PF
GA
PP
ER
AP
BA
RA
PB
AS
AP
ES
AP
RJ
AP
SP
Pu
recl
ust
ers
10.
280.
040.
150.
570.
070
00
00
00
20.
100.
700.
840.
110.
830
00
00
00
30
00
00
0.45
00.
000
00
04
00
00
00
0.10
0.09
0.07
0.32
00
50
00
00
00.
330
00.
290
06
00
00
00
00
00.
300
07
00
00
00
00
00
0.70
08
00
00
00
00
00
0.05
1
Mix
edcl
ust
ers
90.
220.
190
0.07
00.
220
00.
040
0.11
010
00
00.
020
0.03
0.16
0.22
0.11
0.05
0.00
011
0.00
00
0.08
00.
220.
400.
300.
420.
000
012
00.
000
0.05
00.
080
0.17
0.01
0.04
0.11
013
00
00.
060
00
0.22
0.31
00
014
0.40
0.07
0.02
0.04
0.10
00
0.00
0.04
00.
050
Pop
ula
tion
sam
ple
size
615
714
308
914
1917
198
Val
ues
show
the
prop
orti
onof
the
mem
bers
hip
ofea
chpo
pula
tion
inea
chof
the
14cl
ust
ers.
Of
eigh
tco
mpl
ete
run
s,cl
ust
ers
1–13
wer
ere
cove
red
inse
ven
orei
ght
case
s,w
her
eas
clu
ster
14(i
nit
alic
s)ap
pear
edon
lyth
ree
tim
es.
See
Tabl
e1
for
key
topo
pula
tion
code
s.
GENETIC VARIATION IN N.E. BRAZILIAN ANTHURIUM 99
© 2009 The Linnean Society of London, Botanical Journal of the Linnean Society, 2009, 159, 88–105
were involved in a relatively large number of mostlymixed clusters, and the great majority of theirindividuals were also assigned to mixed clusters. InEspírito Santo (APES), however, most individualswere in pure clusters. São Paulo (APSP) stood out asthe only population composed entirely of a singlegenetic cluster.
DISCUSSION
Apart from our parallel work on Monstera adansonii(Andrade et al., 2007), we know of no other studycomparing genetic patterns in plants at the popula-tion level in the brejo forests of north-east Brazil. Thegeneralization of our results and conclusions is thuslimited by the absence of strictly comparable work in
the region and the small sample sizes available forsome populations. There are relevant studies fromthe southern Atlantic forest by Barbará et al. (2007),C. Palma-Silva (UFRS, Porto Alegre, Brazil, unpubl.data) and G. Paggi (UFRS, Porto Alegre, Brazil,unpubl. data) on Bromeliaceae, and by Stefenon,Mailing & Finkeldey (2007) on Araucariaceae.
GENETIC DIVERSITY AND BETWEEN-POPULATION
RELATIONSHIPS IN THE BREJO POPULATIONS
OF A. SINUATUM
The similar levels of genetic diversity in the popula-tions in Ceará and Amazonia (Pará) suggest that, ifthe Ceará brejo forest populations were ecologicallyisolated by the spread of a semi-arid climate through-out north-east Brazil in the Holocene (Oliveira et al.,1999), this has not resulted in reduced genetic diver-sity, as might have been expected. Indeed, the Cearábrejo populations are, on average, slightly morediverse than those in Pará (Table 2), although dis-tinctly less so in the Maranguape population (alsoobserved in Monstera adansonii var. klotzschiana;Andrade et al., 2007). The small sample size of thispopulation (N = 7) may be partly responsible for theresult and, by the same argument, the diversity of thePará population (N = 6) is probably an underestimate.
The range of genetic diversity values and contrast-ing patterns of occurrence of the genetic clusters showthat these five populations are genetically distinctfrom one another (Tables 2, 6) and there is no ten-dency for the Ceará populations to group togetheron the basis of genetic data, a pattern also found inM. adansonii var. klotzschiana (Andrade et al., 2007).Although geographically closer to each other (Fig. 1,Table 3), the only feature shared uniquely by thefour Ceará brejo populations is a tendency for moreindividuals to belong to pure clusters (Table 6). Thedistance matrices (Table 3) show that the most gene-tically distant populations, Pacatuba and Baturité,are relatively close geographically (46 km), whereasthe most similar pairs both involve the Pará popula-tion, geographically the most distant (858 km fromthe nearest at Ibiapaba). There is no significant cor-relation of the genetic (FST) and geographical distancematrices, and the AMOVA results (Table 4) show alow overall level of genetic structure among the popu-lations of A. sinuatum.
The lack of evidence for genetic erosion and thegenerally low level of genetic structure in the Cearábrejo populations of A. sinuatum could be interpretedas indirectly supporting the view (Andrade et al.,2007) that these are relictual areas formed relativelyrecently (dating from c. 5000 BP) by the contractionand virtual disappearance of a previously continuouscoastal humid forest, possibly connected to Amazonia.
ASCEpac
ASCEibi
ASPA
APBAS
APES
APRJ
APSP
APFG
ASCEbat
1000 km
APBAR
APPER
3
ASCEmar
1, 2
45
6
87
Figure 4. Genetic structure analysis of Anthurium pen-taphyllum and A. sinuatum showing pure genetic clustersplotted geographically. Lines group the populations thatcontributed individuals to the numbered genetic clusters.The dotted line shows clusters (1, 2) consisting of Anthu-rium sinuatum individuals only. Full lines show clusters(3–8) composed of A. pentaphyllum individuals only. Filledcircles are A. sinuatum populations; open squares are A.pentaphyllum populations. Approximate area of Amazonand Atlantic forests prior to European colonization shownby grey tone. Analysis performed with STRUCTUREversion 2.1 (Pritchard et al., 2000) based on AFLP molecu-lar data. See Table 1 for population codes.
100 I. M. ANDRADE ET AL.
© 2009 The Linnean Society of London, Botanical Journal of the Linnean Society, 2009, 159, 88–105
The relatively high genetic diversity of the Cearápopulations could also be explained by repeated immi-gration resulting from cycles of forest expansion andretraction. However, local factors, such as the occur-rence of cloning (Murawski & Hamrick, 1990) and thespatial structure of the habitat, may well be moreimportant in influencing population genetic structurein these opportunistic herbaceous epiphytes. Moredetailed studies within the brejo areas are needed, aswell as data from A. sinuatum populations elsewherein Brazil, in order to provide a more complete pictureof variation in population genetic patterns.
For conservation studies and planning, this resultmeans that each Ceará forest island population isunique and substantially variable. Our work suggeststhat populations only occur in association with per-manent water courses, implying that they are prob-ably highly discontinuous within each mountain area.
GENETIC DIVERSITY AND BETWEEN-POPULATION
RELATIONSHIPS IN A. PENTAPHYLLUM
In A. pentaphyllum, population diversity is greatestin the central part of the Atlantic forest. Bayesiananalysis shows that there are no genetic clusters thatuniquely group the populations of A. pentaphyllum inrelation to A. sinuatum. However, there are five pureclusters which characterize populations individuallyor in subgroups (Fig. 4). This result reflects thegreater morphological variability of A. pentaphyllum(Madison, 1978), despite the AMOVA result (Table 4),which shows little difference between the two taxa inoverall among-population divergence. Populations ofA. pentaphyllum have diverged more in certain locali-ties, for example Espírito Santo (APES), where 58% ofindividuals belong to clusters either unique to thispopulation or shared only with Pernambuco (APPER).In other localities, as in Bahia (APBAR, APBAS), noindividuals belong to population-specific clusters.
The genetic profiles of the two most southerly popu-lations (Rio and São Paulo) and, especially, the dis-tinctly lower gene diversity of the latter suggest asouthward migration (compare Aide & Rivera, 1998).The relationships of the pure clusters suggest thatthe Espírito Santo population is closer to those of thenorthern part of the Atlantic forest (Bahia, Pernam-buco) than to Rio de Janeiro (Fig. 4), a pattern whichhas been reported in various other organisms at thespecies’ rather than the population level (for example,the Central Corridor of Aguiar et al., 2003: fig. 11.2).In contrast, the UPGMA tree (Fig. 1) does not showthe same patterns, presumably because of the influ-ence of the mixed genetic clusters.
The population from French Guiana, despite itsgreat geographical distance from the other A. penta-phyllum populations, does not stand apart from them
in genetic distance, and its closest genetic relation-ships lie with the northern Atlantic forest populationsin Bahia and Pernambuco (Fig. 1).
DIFFERENCES BETWEEN A. SINUATUM
AND A. PENTAPHYLLUM
In interpreting the Bayesian analysis results, wehave drawn attention to the contrast in pure andmixed cluster patterns, because the analysis wasbased on data from two species. Our assumption isthat mixed cluster patterns may indicate the footprintof historical hybridization between the two species,whereas pure cluster patterns result from gene flowevents within species. It is also possible that geneticclusters involving both species represent ancestralpatterns. Whatever the explanation, from a taxo-nomic standpoint, these two classes of molecular pat-terns are of interest in considering how far the twomorphologically defined species can be distinguishedusing AFLP markers.
The two taxa, A. pentaphyllum and A. sinuatum,emerge from the genetic analyses as only partiallydistinct. The unsupervised UPGMA analysis (Fig. 2)failed to separate the two species completely. Themixed clusters of the optimal 14-cluster Bayesiananalysis blend the two species. This is also shown bythe location of mixed cluster individuals in the centralportion of the principal coordinate analysis ordinationspace (Fig. 3), whereas those of the pure clusters arewidely separated. The Pacatuba population of A. sin-uatum shows a particularly distinctive relationshipto A. pentaphyllum, because of the presence of smallnumbers of individuals belonging to clusters thatare otherwise exclusive to A. pentaphyllum (Table 6,Fig. S1).
The AMOVA study (Table 4) shows a higher among-species variance (24.80%) than among-populationvariance within the species (11.9%). When treated as12 populations of a single group, AMOVA partitions28.7% of variance among populations and 71.3%within populations, approaching double the among-population variance within each taxon separately.This population differentiation is relatively low whencompared with those of outcrossing species reviewedby Morjan & Rieseberg (2004). However, the resultsnevertheless provide qualified support (Fig. 3) for themorphological partition represented by the currentspecies boundaries, based primarily on leaflet shapeand peduncle length.
We have focused here especially on populations ofthe two taxa in north-east Brazil but, to obtain a morecomplete picture of the species’ relationships, furtherwork is needed. Both species have wide ranges:A. pentaphyllum (in the broad sense) stretches fromsouthern Mexico to the Atlantic forest of south-east
GENETIC VARIATION IN N.E. BRAZILIAN ANTHURIUM 101
© 2009 The Linnean Society of London, Botanical Journal of the Linnean Society, 2009, 159, 88–105
Brazil and A. sinuatum as far west as Peru (TROPI-COS, 2006). Antherium sinuatum also includespopulations in central and south-central Brazil,some of which may yet prove to be discordant withthose studied here, at least judging from herbariumcollections.
Our interpretations and conclusions are necessar-ily tentative at this stage, but the study is a usefulbasis from which to develop more comprehensiveand detailed work in the future. Larger samples areneeded to confirm the gene pool cluster patterns andpopulation diversity levels reported here. More sam-pling localities are required, especially in the Atlan-tic forest, where genetic diversity was found to behighest, and, in Amazonia, where both species occur.AFLP markers were chosen as an efficient techniquefor obtaining a broad picture of molecular patternsin a previously unstudied taxon. However, suchdominant markers provide no information on het-erozygote frequencies, and hence no direct estimatesof inbreeding. In our defence, the results of theHICKORY analysis and the pronounced proto-gyny typical of aroid flowers strongly suggest thatinbreeding is a negligible factor in interpreting thegenetic patterns studied here. Nevertheless, the useof co-dominant markers would provide the means fora more thorough understanding of the processes thathave conditioned the observed genetic structure.Future work should focus on co-dominant markers,such as nuclear microsatellites. The current patchyunderstanding of the mating system also points tothe need for new research on reproductive ecology inthese taxa.
In conclusion, the populations of A. sinuatum sharecommon genetic patterns which characterize themas a group. They are genetically distinct from eachother, but none exhibits a genetic pattern unique toitself, and the Ceará brejo populations do not clustertogether as a subgroup. There is no significant corre-lation between genetic and geographical interpopula-tion distance and no strong overall within-speciespattern of relationship among the populations. Thereis also no evidence of a reduction in genetic diversity,which might have been expected from the geogra-phical and ecological isolation. We interpret this lowlevel of genetic structure as the result of historicalgene flow, probably during the early Holocene, withina continuous forest which subsequently underwentnatural fragmentation.
In contrast with A. sinuatum, we found no unifyinggenetic pattern for the populations of A. pentaphyl-lum and, furthermore, the populations of A. penta-phyllum are characterized, individually and insubgroups, by unique genetic clusters which reflectthe geographical patterns recognized in many otherorganisms. Despite a degree of population differentia-
tion, as measured by AMOVA, similar to that inA. sinuatum, genetic divergence appears to be greaterin A. pentaphyllum, which is consonant with itsnotable morphological variability.
Anthurium pentaphyllum and A. sinuatum can bedistinguished genetically, although many individualsof both species form intermediate genetic clusterpatterns which blur the distinction between them.This is true of the Pacatuba population of A. sinua-tum and, particularly, in the two Bahian populationsof A. pentaphyllum, in which the great majorityof individuals group into genetic clusters that mixtogether individuals from the two taxa. These resultsseem to imply that genetic mixing has occurredbetween A. sinuatum and A. pentaphyllum in north-east Brazil, particularly in Bahia and eastern Ceará,possibly linked to cycles of humid forest expansion.This study demonstrates that the conservation andrecuperation of the biota of the highly threatenedbrejo forests of Ceará are of great importance forscientific, as well as environmental, economic andsocial reasons.
ACKNOWLEDGEMENTS
We are most grateful to the following organiza-tions and persons for their essential help: FUNCAP(Fundaçao Cearense de Amparo à Pesquisa); FAPESB(Fundação de Amparo à Pesquisa do Estado da Bahia);WWF Brazil; Kew Latin America Research Fellow-ships Programme (Royal Botanic Gardens, Kew);Margaret Mee Fellowships Programme (FundaçãoBotânica Margaret Mee-Rio de Janeiro, Royal BotanicGardens, Kew); Ministério do Meio Ambiente (IBAMA,permit number 001/2004, 042/04); Conselho Nacionalde Desenvolvimento Científica e Tecnológica (CNPq,MCT permit number, 168/01); Dr Ana Maria Giuliettiand staff at Universidade Estadual de Feira deSantana (UEFS); Robyn Cowan, Anna Haigh, Dr DenisBarabé, Dr Jean-Jacques de Granville, VanessaHequet, Françoise Crozier, M. F. Prévost and otherstaff of the CAY herbarium; Bertrand Goguillon andstaff of IRD (French Guiana); Muriel Nugent, JoepMoonen, Sr. Thales Alves Ribeiro and Sr. José TeodoroSoares, Rector of the Universidade Estadual do Vale doAcaraú (UVA), Sobral.
REFERENCES
Ab’Sáber AN. 1977a. Os domínios morfoclimáticos naAmérica do Sul. Universidade de São Paulo. Instituto deGeografia, São Paulo. Geomorfologia 52: 23.
Ab’Sáber AN. 1977b. Espaços ocupados pela expansão dosclimas secos na América do Sul, por ocasião dos períodosglaciais quaternários. São Paulo: Universidade de SãoPaulo, Instituto de Geografia. Paleoclimas 3: 1–19.
102 I. M. ANDRADE ET AL.
© 2009 The Linnean Society of London, Botanical Journal of the Linnean Society, 2009, 159, 88–105
Ab’Sáber AN. 1982. The paleoclimate and paleoecologyof Brazilian Amazônia. In: Prance GT, ed. Biological diver-sification in the tropics. New York: Columbia UniversityPress, 41–59.
Aguiar AP, Chiarello AG, Mendes SL, Matos EN. 2003.The Central and Serra do Mar corridors in the BrazilianAtlantic Forest. In: Gallindo-Leal C, Câmara IG, Benson P,eds. The Atlantic Forest of South America: biodiversitystatus, threats and outlook. Washington, DC: Island Press,118–132.
Aide TM, Rivera E. 1998. Geographic patterns of geneticdiversity in Poulsenia armata (Moraceae): implications forthe theory of Pleistocene refugia and the importance ofriparian forest. Journal of Biogeography 25: 695–705.
Andrade IM, Mayo SJ, Van den Berg C, Fay MF, ChesterM, Lexer C, Kirkup D. 2007. A preliminary study ofgenetic variation in populations of Monstera adansonii var.klotzschiana (Araceae) from north-east Brazil, estimatedwith AFLP molecular markers. Annals of Botany 100: 1143–1154.
Andrade-Lima D. 1953. Notas sobre a dispersão de algumasespécies vegetais no Brasil. Anais da Sociedade de Biologiade Pernambuco 11: 25–49.
Andrade-Lima D. 1960. Estudos fitogeográficos de Pernam-buco. Arquivos do Instituto de Pesquisa Agronômica dePernambuco 5: 305–327.
Andrade-Lima D. 1966. Contribuição ao estudo do paralel-ismo da flora Amazônico-Nordestina. Boletim Técnico doInstituto de Pesquisas Agronômicas de Pernambuco, Nov.sér. 19: 3–30.
Andrade-Lima D. 1982. Present-day forest refuges in north-eastern Brazil. In: Prance GT, ed. Biological diversificationin the tropics. New York: Columbia University Press, 245–251.
Applied Biosystems. 1996. AFLP plant mapping proto-col. Part Number 4303146C. Foster City, CA: AppliedBiosystems.
Barbará T, Martinelli G, Fay MF, Mayo SJ, Lexer C.2007. Population differentiation and species cohesion intwo closely related plants adapted to neotropical high-altitude ‘inselbergs’, Alcantarea imperialis and Alcantareageniculata (Bromeliaceae). Molecular Ecology 16: 1981–1992.
Barreto AMF, Pessenda LCR, Suguio K. 2002. Probabledrier Holocene climate evidenced by charcoal bearingmiddle São Francisco river paleodunes, state of Bahia,Brazil. Anais da Academia Brasileira de Ciências 68(Suppl.): 43–48.
Behling H. 1998. Late Quaternary vegetational and climatechanges in Brazil. Review of Paleobotany and Palynology99: 143–156.
Bigarella JJ, Andrade-Lima D. 1982. Paleoenvironmentalchanges in Brazil. In: Prance GT, ed. Biological diversifica-tion in the tropics. New York: Columbia University Press,27–40.
Borges-Nojosa DM, Caramaschi U. 2003. Composiçãoe análise comparativa da diversidade e das afinidadesbiogeográficas dos lagartos e anfisbenídeos (Squamata)
dos brejos nordestinos. In: Leal I, Silva JMC, Tabarelli M,eds. Ecologia e Conservação da Caatinga, ed. 1. Recife:Universidade Federal de Pernambuco, 489–540.
Carnaval ACOQ. 2002. Phylogeography of four frogspecies in forest fragments of north-eastern Brazil – apreliminary study. Integrative and Comparative Biology 42:913–921.
CATE Araceae 2008. Creating a taxonomic e-science:Araceae. Available at: http://www.cate-araceae.org
Cavalcanti D, Tabarelli M. 2004. Distribuição das plantasamazônico-nordestinas no centro de endemismo Pernam-buco: brejos de altitude vs. florestas de terras baixas. In:Porto KC, Cabral JJP, Tabarelli M, eds. Brejos de altitudeem Pernambuco e Paraíba. Brasília: Ministério do MeioAmbiente, 285–296.
Costa LP. 2003. The historical bridge between the Amazonand the Atlantic forest of Brazil: a study of molecularphylogeography with small mammals. Journal of Biogeog-raphy 30: 71–86.
Croat TB. 1980. Flowering behaviour of the neotropicalgenus Anthurium (Araceae). American Journal of Botany67: 888–904.
Croat TB, Sheffer RD. 1983. The sectional groupings ofAnthurium (Araceae). Aroideana 6: 85–123.
Doyle JJ, Doyle JL. 1987. Isolation of plant DNA from freshtissue. Focus 12: 13–15.
Ducke A. 1959. Estudos botânicos no Ceará. Anais daAcademia Brasileira de Ciências 31: 211–308.
Felsenstein J. 2006. PHYLIP: phylogeny inference pack-age. Version 3.66, July 2006. Seattle, WA: University ofWashington. Available for download at: http://evolution.gs.washington.edu/phylip.html
Gibernau M. 2003. Pollinators and visitors of aroid inflores-cences. Aroideana 26: 66–83.
Giulietti AM, Forero E. 1990. ‘Workshop’ Diversidadetaxonômica e padrões de distribuição das Angiospermasbrasileiras – Introdução. Acta Botânica Brasílica 4: 3–10.
Hartl DL, Clark AG. 1997. Principles of population genetics,3rd edn. Sunderland, MA: Sinauer Associates.
Holmgren PK, Holmgren NH. 1998 [continuously updated].Index herbariorum: a global directory of public herbariaand associated staff. Available at: http://sciweb.nybg.org/science2/IndexHerbariorum.asp
Holsinger KE, Lewis PO. 2003. Hickory: a package foranalysis of population genetic data v1.0. Distributed by theauthors. Version 1.0.4. Storrs, CT: University of Connecti-cut. Available for download at http://darwin.eeb.uconn.edu/hickory/hickory.html
Holsinger KE, Lewis PO, Dey DK. 2002. A Bayesianapproach to inferring population structure from dominantmarkers. Molecular Ecology 11: 1157–1164.
IBGE. 1985. Atlas nacional do Brasil. Rio de Janeiro: IBGE.IBGE. 2008. Mapa de vegetação. Available at: http://mapas.
ibge.gov.br/website/vegetacao/Ledru MP. 1991. Etude de la pluie pollinique actuelle des
forêts de Brasil central: climat, végétation, application àl’étude de l’évolution paléoclimatique des 30.000 dernières
GENETIC VARIATION IN N.E. BRAZILIAN ANTHURIUM 103
© 2009 The Linnean Society of London, Botanical Journal of the Linnean Society, 2009, 159, 88–105
années. Unpublished doctoral thesis. Paris: MuseumNational d’Histoire Naturelle.
Ledru MP. 1993. Late Quaternary environmental andclimatic changes in central Brazil. Quaternary Research 39:90–98.
Levey DJ. 1988. Spatial and temporal variation in CostaRican fruit and fruit-eating bird abundance. EcologicalMonographs 58: 251–269.
Lima DC, Ferreira AR, Cavalcanti AO. 1975. Estudossobre a posição dos brejos de Pernambuco. Revista Pernam-bucana de Desenvolvimento 2: 29–53.
Lins R. 1989. Áreas de exceção do Agreste de Pernambuco.Recife: SUDENE/PSU/SER.
Lourenço WR. 1988. Première evidence de la présence d’unefaune scorpionique amazonienne relictuelle dans les ‘brejos’de la caatinga du nord-est du Brésil. Bulletin de la SociétéScientifique de Bretagne 59: 147–154
Lynch M, Milligan BG. 1994. Analysis of populationgenetic structure with RAPD markers. Molecular Ecology 3:91–99.
Madison MT. 1978. The species of Anthurium with palmatelydivided leaves. Selbyana 2: 239–282.
Mayo SJ, Bogner J, Boyce PC. 1997. The genera of Araceae.Kew: Royal Botanic Gardens.
Morjan CL, Rieseberg LH. 2004. How species evolve collec-tively: implications of gene flow and selection for the spreadof advantageous alleles. Molecular Ecology 13: 1341–1356.
Murawski DA, Hamrick JL. 1990. Local genetic and clonalstructure in the tropical terrestrial bromeliad, Aechmeamagdalenae. American Journal of Botany 77: 1201–1208.
Oliveira PE, Barreto AMF, Suguio K. 1999. LatePleistocene/Holocene climatic and vegetational history ofthe Brazilian caatinga: the fossil dunes of the middleSão Francisco River. Palaeogeography, Palaeoclimatology,Palaeoecology 152: 319–337.
Oliveira-Filho AT, Ratter JA. 1995. A study of the originof central Brazilian forests by the analysis of plant speciesdistribution patterns. Edinburgh Journal of Botany 52:141–194.
Peakall R, Smouse PE. 2006. GENALEX 6: genetic analysisin excel. Population genetic software for teaching andresearch. Molecular Ecology Notes 6: 288–295. Available fordownloading at http://www.anu.edu.au/BoZo/GenAlEx/
Petersen G. 1989. Cytology and systematics of Araceae.Nordic Journal of Botany 9: 119–166.
Pôrto KC, Cabral JJP, Tabarelli M. 2004. Brejos dealtitude em Pernambuco e Paraíba: história natural, ecolo-gia e conservação. Brasília: Ministério do Meio Ambiente.
Prance GT. 1973. Phytogeographic support for the theoryof Pleistocene forest refuges in the Amazon basin, basedon evidence from distribution patterns in Caryocaraceae,Chrysobalanaceae, Dichapetalaceae and Lecythidaceae.Acta Amazônica 3: 5–28.
Pritchard JK, Stephens M, Donnelly P. 2000. Inferenceof population structure from multilocus genotype data.Genetics 155: 945–959. Available for downloading at http://pritch.bsd.uchicago.edu/software/structure2_1.html
Pritchard JK, Wen W. 2004. Documentation for structure
software, Version 2. Chicago, IL: University of Chicago.Available for downloading at http://pritch.bsd.uchicago.edu
R Development Core Team. 2006. R: A language and envi-ronment for statistical computing. Vienna: R Foundationfor Statistical Computing. ISBN 3-900051-07-0. Availablefor downloading at http://www.r-project.org
Ramalho FC. 1994. Taxonomia e número cromossômicode representantes da família Araceae em Pernambuco.MSc dissertation. Recife: Universidad Federal Rural dePernambuco.
Rodal MJN, Sales MF, Mayo SJ. 1998. Florestas serranasde Pernambuco: localização dos remanescentes dos brejosde altitude. Recife: Imprensa Universitária, UniversidadeFederal Rural de Pernambuco.
Rohlf FJ. 2005. NTSYSpc: numerical taxonomy system ver.2.20d. Setauket: Exeter Publishing Ltd.
Sales MF, Mayo SJ, Rodal MJN. 1998. Plantas vascularesdas florestas serranas de Pernambuco: Um checklist da floraameaçada dos brejos de altitude, Pernambuco Brasil. Recife:Imprensa Universitária, Universidad Federal Rural dePernambuco.
Sampaio VSB, Giulietti AM, Virginio J, Gamarra-RojasFL. 2002. Vegetação e flora da caatinga. Associação Plantasdo Nordeste. Recife: APNE Centro Nordestino de Infor-mação Sobre Plantas.
Schneider S, Roessli D, Excoffier L. 2000. Arlequin: asoftware for population genetic data: genetics and biometrylaboratory. Geneva: University of Geneva. Available fordownloading at http://lgb.unige.ch/arlequin/
Schwerdtfeger M, Gerlach G, Kaiser R. 2002. Anthecologyin the neotropical genus Anthurium (Araceae): a prelimi-nary report. Selbyana 23: 258–267.
Sneath PHA, Sokal RR. 1973. Numerical taxonomy:the principles and practice of numerical classification. SanFrancisco, CA: WH Freeman.
Stefenon VM, Mailing O, Finkeldey R. 2007. Geneticstructure of Araucaria angustifolia (Araucariaceae) popula-tions in Brazil: implications for the in situ conservationof genetic resources. Plant Biology 9: 516–525.
TROPICOS. 2006. w3TROPICOS. Available at http://mobot.mobot.org/W3T/Search/vast.html.
Vanzolini PE. 1973. Paleoclimates, relief and species multi-plication in equatorial forests. In: Meggers BJ, Ayensu ES,Duckworth WD, eds. Tropical forest ecosystems in Africaand South America: a comparative review. Washington DC:Smithsonian Institution Press, 255–258.
Vasconcelos A, Almeida WO, Costa EC. 2004. Ony-chophora de florestas úmidas do complexo da atlântica donordeste brasileiro e sua importância para a conservação eestudos sistemáticos. In: Porto KC, Cabral JJP, Tabarelli M,eds. Brejos de altitude em Pernambuco e Paraíba. Brasília:Ministério do Meio Ambiente, 139–144.
Vekemans X. 2002. AFLP-SURV version 1.0. Distributed bythe author. Brussels: Laboratoire de Génétique et EcologieVégétale, Université Libre de Bruxelles. Available for down-loading at http://www.ulb.be/sciences/lagev/aflp-surv.html
Vekemans X, Beauwens T, Lemaire M, Roldan-Ruiz I.2002. Data from amplified fragment length polymorphism
104 I. M. ANDRADE ET AL.
© 2009 The Linnean Society of London, Botanical Journal of the Linnean Society, 2009, 159, 88–105
(AFLP) markers show indication of size homoplasy and ofa relationship between degree of homoplasy and fragmentsize. Molecular Ecology 11: 139–151.
Vos P, Hogers R, Bleeker M, Reijans M, Van de Lee T,Hornes M, Frijters A, Pot J, Peleman J, Kuiper M,
Zabeau M. 1995. AFLP: a new technique for DNA finger-printing. Nucleic Acids Research 23: 4407–4414.
Zhivotovsky LA. 1999. Estimating population structure indiploids with multilocus dominant DNA markers. MolecularEcology 8: 907–913.
SUPPORTING INFORMATION
Additional Supporting Information may be found in the online version of this article:
Figure S1. Genetic structure analysis of 12 populations of Anthurium pentaphyllum and A. sinuatum.Bar chart showing assignment of individuals of each population to one (or more) of 14 clusters as indicated bydifferent colour patterns. Populations, species and the geographic axis are shown below the chart. The chartshows the result of a single run in STRUCTURE version 2.1 (Pritchard et al., 2000); whenever adjacentindividuals are assigned to the same cluster, they are shown as a single block of pattern. Population codes:Anthurium pentaphyllum: APBAR, Bahia Recôncavo; APBAS, southern Bahia; APES, Espírito Santo; APFG,French Guiana; APPER, Pernambuco; APRJ, Rio de Janeiro; APSP, São Paulo. Anthurium sinuatum: ASCEbat,Baturité Ceará; ASCEibi, Ibiapaba Ceará; ASCEmar, Maranguape Ceará; ASCEpac, Pacatuba Ceará; ASPA,Pará; see Table 1 for further details.Appendix S1. List of voucher specimens of Anthurium for this study. Voucher specimens are deposited inthe following herbaria: EAC, Universidade Federal do Ceará, Fortaleza, Ceará, Brazil; HUEFS, UniversidadeEstadual de Feira de Santana, Bahia, Brazil; K, Royal Botanic Gardens, Kew, UK. Population codes are givenin bold. See Holmgren & Holmgren (1998) for herbarium codes or search the Index Herbariorum website athttp://sciweb.nybg.org/science2/IndexHerbariorum.asp
Please note: Wiley-Blackwell are not responsible for the content or functionality of any supporting materialssupplied by the authors. Any queries (other than missing material) should be directed to the correspondingauthor for the article.
GENETIC VARIATION IN N.E. BRAZILIAN ANTHURIUM 105
© 2009 The Linnean Society of London, Botanical Journal of the Linnean Society, 2009, 159, 88–105