Genetic variation in DNA repair genes and prostate cancer risk: results from a population-based...
21
Genetic Variation in DNA Repair Genes and Prostate Cancer Risk: Results from a Population-Based Study Ilir Agalliu 1 , Erika M Kwon 2 , Claudia A. Salinas 3,4,* , Joseph S. Koopmeiners 3,5 , Elaine A. Ostrander 2 , and Janet L. Stanford 3,4 1 Department of Epidemiology and Population Health, Albert Einstein College of Medicine, Bronx, NY 2 Cancer Genetics Branch, National Human Genome Research Institute, National Institutes of Health, Bethesda, MD 3 Division of Public Health Sciences, Fred Hutchinson Cancer Research Center, Seattle, WA 4 Department of Epidemiology, School of Public Health, University of Washington, Seattle, WA 5 Department of Biostatistics, School of Public Health, University of Washington, Seattle, WA Abstract Objective—DNA repair pathways are crucial to prevent accumulation of DNA damage and maintain genomic stability. Alterations of this pathway have been reported in many cancers. An increase in oxidative DNA damage or decrease of DNA repair capacity with aging or due to germline genetic variation may affect prostate cancer risk. Methods—Pooled data from two population-based studies (1,457 cases and 1,351 controls) were analyzed to examine associations between 28 SNPs in 9 DNA repair genes (APEX1, BRCA2, ERCC2, ERCC4, MGMT, MUTYH, OGG1, XPC, and XRCC1) and prostate cancer risk. We also explored whether associations varied by smoking, by family history or clinical features of prostate cancer. Results—There were no associations between these SNPs and overall risk of prostate cancer. Risks did not vary either by smoking or by family history of prostate cancer. Although, two SNPs in BRCA2 (rs144848, rs1801406) and two SNPs in ERCC2 (rs1799793, rs13181) showed stronger associations with high Gleason score or advanced stage tumors when comparing homozygous men carrying the minor vs. major allele, results were not statistically significantly different between clinically aggressive and non-aggressive tumors. Conclusion—Overall this study found no associations between prostate cancer and the SNPs in DNA repair genes. Given the complexity of this pathway and its crucial role in maintenance of genomic stability a pathway-based analysis of all 150 genes in DNA repair pathways, as well as exploration of gene-environment interactions may be warranted. Keywords DNA repair; SNPs; prostate cancer; case-control study; genetic variation Address correspondence to: Janet L. Stanford, Ph.D., Division of Public Health Sciences, Fred Hutchinson Cancer Research Center, 1100 Fairview Ave N., M4-B847, Seattle, WA 98109-1024, Phone: (206) 667-2715, Fax: (206) 667-2717, [email protected]. * Current affiliation of Claudia Salinas is: Division of Hematology and Oncology, University of Michigan Cancer Center, Ann Arbor, MI 48109. NIH Public Access Author Manuscript Cancer Causes Control. Author manuscript; available in PMC 2011 February 1. Published in final edited form as: Cancer Causes Control. 2010 February ; 21(2): 289–300. doi:10.1007/s10552-009-9461-5. NIH-PA Author Manuscript NIH-PA Author Manuscript NIH-PA Author Manuscript
-
Upload
independent -
Category
Documents
-
view
3 -
download
0
Transcript of Genetic variation in DNA repair genes and prostate cancer risk: results from a population-based...
Genetic Variation in DNA Repair Genes and Prostate Cancer Risk:Results from a Population-Based Study
Ilir Agalliu1, Erika M Kwon2, Claudia A. Salinas3,4,*, Joseph S. Koopmeiners3,5, Elaine A.Ostrander2, and Janet L. Stanford3,41 Department of Epidemiology and Population Health, Albert Einstein College of Medicine, Bronx,NY2 Cancer Genetics Branch, National Human Genome Research Institute, National Institutes ofHealth, Bethesda, MD3 Division of Public Health Sciences, Fred Hutchinson Cancer Research Center, Seattle, WA4 Department of Epidemiology, School of Public Health, University of Washington, Seattle, WA5 Department of Biostatistics, School of Public Health, University of Washington, Seattle, WA
AbstractObjective—DNA repair pathways are crucial to prevent accumulation of DNA damage andmaintain genomic stability. Alterations of this pathway have been reported in many cancers. Anincrease in oxidative DNA damage or decrease of DNA repair capacity with aging or due to germlinegenetic variation may affect prostate cancer risk.
Methods—Pooled data from two population-based studies (1,457 cases and 1,351 controls) wereanalyzed to examine associations between 28 SNPs in 9 DNA repair genes (APEX1, BRCA2, ERCC2,ERCC4, MGMT, MUTYH, OGG1, XPC, and XRCC1) and prostate cancer risk. We also exploredwhether associations varied by smoking, by family history or clinical features of prostate cancer.
Results—There were no associations between these SNPs and overall risk of prostate cancer. Risksdid not vary either by smoking or by family history of prostate cancer. Although, two SNPs inBRCA2 (rs144848, rs1801406) and two SNPs in ERCC2 (rs1799793, rs13181) showed strongerassociations with high Gleason score or advanced stage tumors when comparing homozygous mencarrying the minor vs. major allele, results were not statistically significantly different betweenclinically aggressive and non-aggressive tumors.
Conclusion—Overall this study found no associations between prostate cancer and the SNPs inDNA repair genes. Given the complexity of this pathway and its crucial role in maintenance ofgenomic stability a pathway-based analysis of all 150 genes in DNA repair pathways, as well asexploration of gene-environment interactions may be warranted.
KeywordsDNA repair; SNPs; prostate cancer; case-control study; genetic variation
Address correspondence to: Janet L. Stanford, Ph.D., Division of Public Health Sciences, Fred Hutchinson Cancer Research Center, 1100Fairview Ave N., M4-B847, Seattle, WA 98109-1024, Phone: (206) 667-2715, Fax: (206) 667-2717, [email protected].*Current affiliation of Claudia Salinas is: Division of Hematology and Oncology, University of Michigan Cancer Center, Ann Arbor,MI 48109.
NIH Public AccessAuthor ManuscriptCancer Causes Control. Author manuscript; available in PMC 2011 February 1.
Published in final edited form as:Cancer Causes Control. 2010 February ; 21(2): 289–300. doi:10.1007/s10552-009-9461-5.
NIH
-PA Author Manuscript
NIH
-PA Author Manuscript
NIH
-PA Author Manuscript
IntroductionProstate cancer is the most commonly diagnosed solid tumor and the second leading cause ofcancer-related deaths among men in the U.S. (1). It is a multi-factorial disease, where bothgenetic and environmental factors contribute to disease incidence (2). The exponential increasein risk of prostate cancer associated with aging may reflect the accumulation of DNA damageas a result of a series of processes including oxidative stress, inflammation or environmentalcarcinogens or a decrease in DNA damage-repair response capacity (3–5). An increase ingeneration of reactive oxygen species from metabolism of endogenous (e.g., androgens,inflammation) and exogenous (e.g., dietary meat, fat, environmental toxins) compounds withinthe prostate cells can produce DNA adducts or directly damage DNA (4–7). In support of thishypothesis, several studies have reported that DNA adducts are formed in the prostate tissueas a result of exposure to oxidative stress or environmental toxins particularly heterocyclicamines (derived from red meat mutagens) and polycyclic aromatic hydrocarbons (8–10).
DNA repair mechanisms are important pathways in removal of oxidative DNA compounds orDNA adducts from damaged genomic sites (11). There are a number of DNA repair pathways,each responsible for repairing a different type of DNA damage. Base excision repair removessingle base modifications including single strand breaks, oxidative DNA damage and non-bulky adducts, where as nucleotide excision repair removes larger lesions, which often resultfrom environmental exposures such as smoking, UV radiation or external carcinogens (11,12). Alkyltransferases directly reverse DNA damage by transferring alkyl groups fromdamaged DNA onto the transferase enzyme (11). Finally, double-strand DNA breaks arerepaired through complex mechanisms including homologous recombination and end-joiningrepair pathways (13,14). Germline genetic variation in the above DNA repair genes/pathway,which may affect the capacity of encoded DNA repair enzymes to effectively remove DNAadducts or lesions, may result in enhanced cancer risk (15–18).
Several epidemiologic studies have examined associations between single-nucleotidepolymorphisms (SNPs) in DNA repair genes, mostly non-synonymous SNPs with potentialfunctional significance, and risk of prostate cancer (17,19–26). However, results have beeninconsistent across these studies due in part to different study populations, case ascertainment,or due to small sample sizes of each study and thus the potential for false-positive findings aswell as limited power to detect modest associations. The objective of our study was to examineassociations between genetic variants in DNA repair genes and risk of prostate cancer in a largepopulation-based case-control dataset, with detailed information on demographic and lifestylefactors, screening as well as clinical features of the disease. In addition, we were interested inexploring whether SNP-prostate cancer associations varied according to smoking status, familyhistory of prostate cancer, or clinical features of this cancer.
Materials and MethodsStudy Population
Study subjects were Caucasian and African American men residing in King County,Washington, who participated in one of two population-based case-control studies of prostatecancer with ascertainment periods from 1993 to 1996 and 2002 to 2005 that have beenpreviously described (27,28). Incident cases with histologically confirmed adeno-carcinomaof the prostate were 35 to 74 years old at diagnosis, and were identified via the Seattle-PugetSound Surveillance, Epidemiology, and End Results (SEER) cancer registry. The SEER cancerregistry also provided information on clinical characteristics of prostate cancer includingGleason score, tumor stage, and serum prostate-specific antigen (PSA) levels at diagnosis, aswell as primary treatment for prostate cancer. Controls were men without a self-reportedphysician’s diagnosis of prostate cancer, identified via random digit dialing, frequency matched
Agalliu et al. Page 2
Cancer Causes Control. Author manuscript; available in PMC 2011 February 1.
NIH
-PA Author Manuscript
NIH
-PA Author Manuscript
NIH
-PA Author Manuscript
to cases by 5-year age groups, and recruited evenly throughout the ascertainment period of thecases. Both studies were approved by the Institutional Review Board (IRB) of the FredHutchinson Cancer Research Center, and written informed consent was obtained from all studyparticipants. Genotyping was approved by the IRB of the National Human Genome ResearchInstitute.
Study subjects completed a structured in-person interview administered by trained maleinterviewers. The questionnaire collected information about demographic, social and lifestylecharacteristics, medical history including prostate cancer screening, as well as informationabout family history of prostate cancer. After the interview, participants were asked to providea blood sample. Of the combined 2,244 eligible prostate cancer cases and 2,448 eligible controlsidentified in the two population-based studies, 1,754 (78.2%) cases and 1,645 (67.2%) controlsagreed to participate and were interviewed. Among men who participated, 1,457 (83.1%) casesand 1,351 (82.1%) controls provided a blood sample, which was used to obtain germline DNAfor genotyping.
Selection of SNPs and GenotypingSNPs in DNA repair genes were selected for genotyping in this study based on the followingcriteria: (a) functional significance, as assessed by potential effects on enzyme level activityor projected influence on DNA adducts levels, (b) previously reported association(s) withprostate cancer risk in earlier studies, (c) tagSNPs with a minor allele frequency ≥5% selectedfrom available HapMap (version 3.1), dbSNP (http://www.ncbi.nlm.nih.gov/projects/SNP/)and Genome Variation Server (http://pga.gs.washington.edu/gvs). The majority of the SNPsin 9 DNA repair genes genotyped in our study were non-synonomous SNP (n=13) followedby synonomous SNPs (n=8), SNPs located in the UTR region (n=4) and intronic SNPs (n=4).Of the 28 SNPs successfully genotyped, 21 were tagging SNP; however, the coverage ofvariation across large genes such as BRCA2 or MGMT is small. SNPs with prior evidence fromassociation analyses reported from other studies were included, except for the SNPs in themismatch DNA repair pathway, which were part of another analysis. Potential functionalprediction of SNPs that resulted in amino-acid changes was assessed using in silicoclassification program Polyphen (29).
Genomic DNA was purified from peripheral lymphocytes using standard protocols (30). TheApplied Biosystems (ABI) SNPlex™ Genotyping system was used for genotyping andGeneMapper software was used for calling alleles. Discrimination of the specific SNP allelewas carried out with the Applied Biosystems 3730xl DNA analyzer and was based on thepresence of a unique sequence assigned to the original allele-specific oligonucleotide. Qualitycontrol included genotyping of 140 blind duplicate samples that were distributed across allgenotyping batches. Each batch of DNA aliquots that were genotyped incorporated similarnumbers of cases and controls samples collected in a specific calendar year (e.g. 2003) andsamples were distributed equally across the entire genotyping plates. The laboratory personnelthat performed genotyping were however blinded to the case-control status of the samples.
Initially 35 SNPs in 10 DNA repair genes were selected. Of these, 4 SNPs (APEX1 rs2307486,MUTYH rs3219489, XRCC1 rs3547, XRCC3 rs861539) failed on the genotyping platform, andtwo others (ERCC4 rs1799802, MGMT rs2308318) were monomorphic in our studypopulation. One SNP (rs1052133) in the OGG1 had a drop-out rate of 9.5%, and thus wasexcluded from all statistical analyses. The remaining 28 SNPs in 9 DNA repair genes with anaverage drop-out of 0.6% and an average genotype concordance of 99.7% across 140 blindduplicate samples were included in statistical analyses.
Agalliu et al. Page 3
Cancer Causes Control. Author manuscript; available in PMC 2011 February 1.
NIH
-PA Author Manuscript
NIH
-PA Author Manuscript
NIH
-PA Author Manuscript
Statistical AnalysesDeviation of genotype frequencies from Hardy-Weinberg Equilibrium (HWE) amongCaucasian and African-American controls considered separately was assessed by χ2-tests(31). Unconditional logistic regression was used to examine associations between SNPgenotypes and prostate cancer risk among Caucasian and African-American men and tocompute odds ratios (OR) and 95% confidence intervals (CI) (32). Confounding by establishedand potential risk factors for prostate cancer was assessed for each genotype separately, fittingmodels using each main effect and then evaluating the change in parameter estimates of theSNP genotypes when other variables entered the models one at a time. All analyses wereadjusted for age at diagnosis for cases and at reference date for controls. Further adjustmentfor a first-degree family history of prostate cancer, history of screening for prostate cancer(PSA and DRE tests) and smoking did not change the risk estimates and thus were not includedin the final models. Both additive and dominant genetic models were considered for eachvariant allele depending on the distribution of genotypes. Likelihood ratio-based test statisticswere used to identify statistically significant associations between SNP genotypes and prostatecancer risk.
A permutation procedure was used to account for the effect of multiple testing. Pairs of case-control labels and ages were permuted in order to approximate the distribution of the age-adjusted p-values under the null hypothesis. For each permutation codominant and dominantmodels were fit for all SNPs and the minimum of these p-values were kept for each SNP. Thep-values were then ordered to approximate the null distribution of the order statistics for thep-values, starting from the smallest to the largest. The original p-values were also ordered andpermutation p-values were calculated by comparing the ordered p-values to the null distributionfor the appropriate order statistic. Permutation p-values can be interpreted as the probabilityof observing a p-value less than or equal to what was observed for the given order statisticunder the null hypothesis of no association with disease for any of the 28 SNPs. The permutationapproach to approximating the null distribution of the order statistics will be valid regardlessof any correlation between the SNPs. A SNP was considered to be significantly associated withprostate cancer risk if the nominal p-value and the permuted p-value were both <0.05.
In addition, interactions between SNP genotypes and first-degree family history of prostatecancer (yes vs. no) or between base- or nucleotide excision repair genes and either smokingstatus or lifetime pack-years of smoking were examined in relation to prostate cancer risk.Interactions were tested by including an interaction term in the logistic regression models andcomparing the fully saturated model containing the main effects and interaction term with thereduced model containing only the main effects using a likelihood ratio test to determinestatistical significance of the interaction effects (33). Lastly, we also examined associationsbetween SNP genotypes and clinical characteristics of prostate cancer. With respect to theGleason score analyses, cases were grouped into those with Gleason scores of 2–6 or 7=3+4,and those with Gleason scores of 7=4+3 or 8–10 at diagnosis. For cancer stage, cases diagnosedwith regional or distant stage were compared to men with localized stage at diagnosis. Thefrequency of genotypes for DNA repair SNPs in each group of cases was compared to thefrequency of genotypes in controls using polytomous logistic regression models (34); thesefinal models were adjusted for age and prostate cancer screening history.
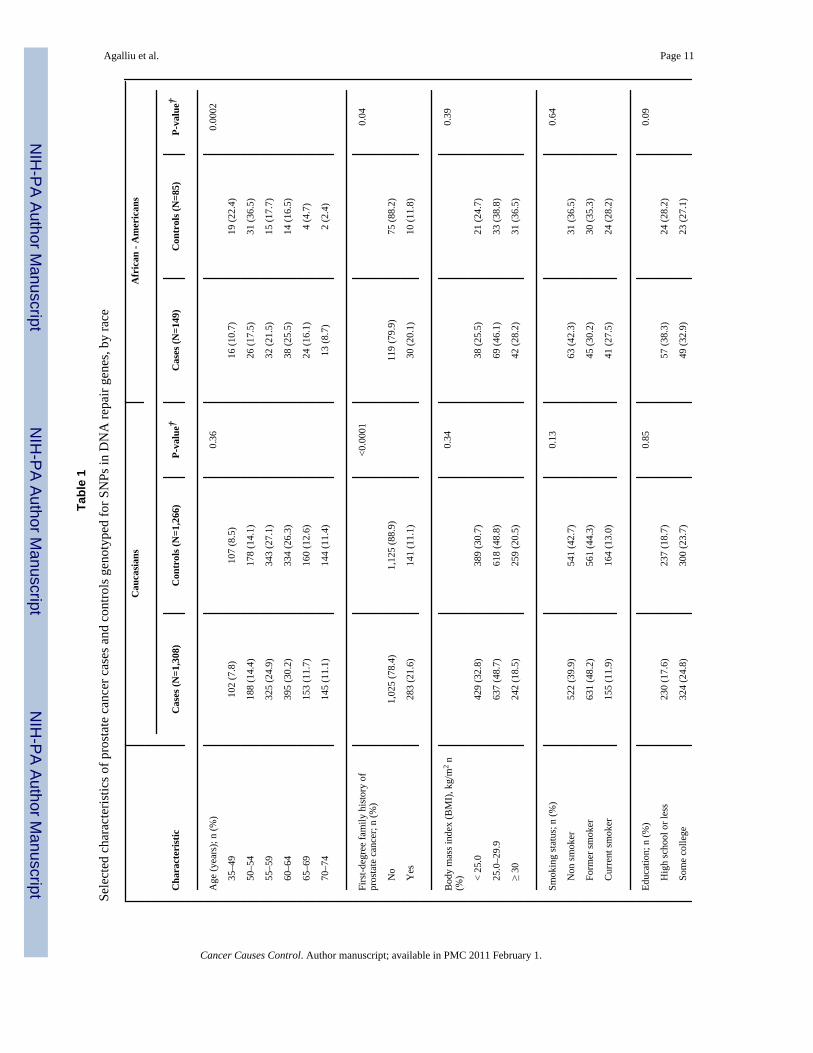
ResultsSelected characteristics of prostate cancer cases and controls, stratified by race, are presentedin Table 1. The distribution of age was similar between Caucasian cases and controls; however,among African Americans cases were slightly older than controls (p=0.0002) although thiscould have been due to small number of cases and controls in this category. In both racialgroups, cases were more likely than controls to report a first-degree family history of prostate
Agalliu et al. Page 4
Cancer Causes Control. Author manuscript; available in PMC 2011 February 1.
NIH
-PA Author Manuscript
NIH
-PA Author Manuscript
NIH
-PA Author Manuscript
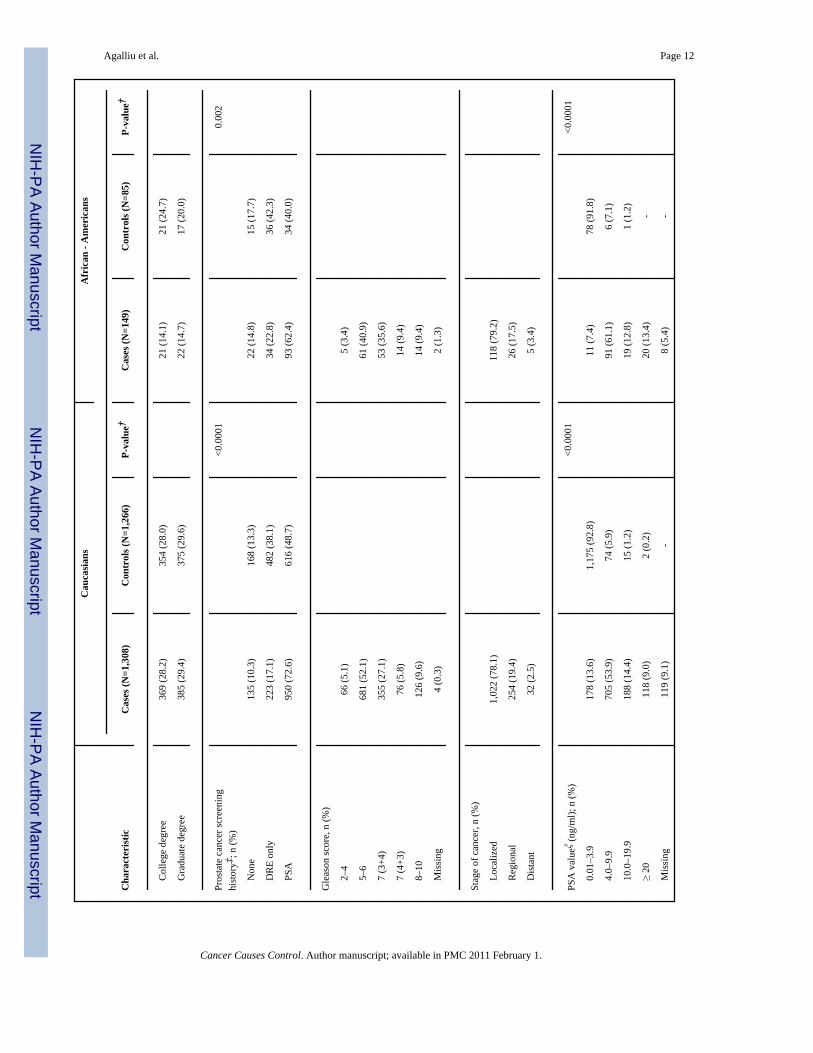
cancer and to have undergone PSA screening within the 5 year-period before diagnosis orreference date. Cases and controls were similar with respect to other factors including bodymass index, education and smoking. With respect to clinical features, the majority of prostatecancer cases were diagnosed with localized stage or Gleason score 2–6 or 7(3+4) cancers andthe distribution of Gleason score and tumor stage was similar between cases ascertained in twodifferent periods: 1993–1996 and 2002–2005 (data not shown).
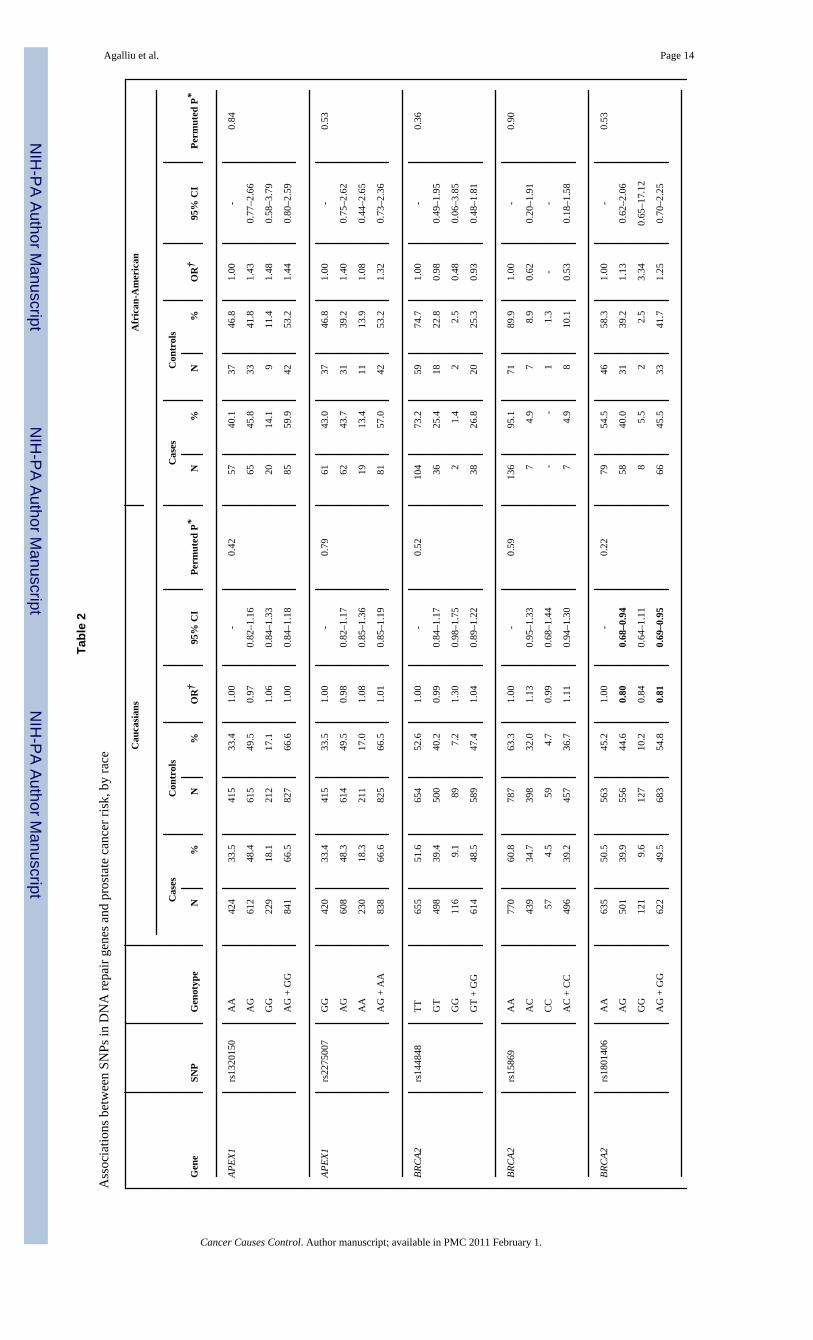
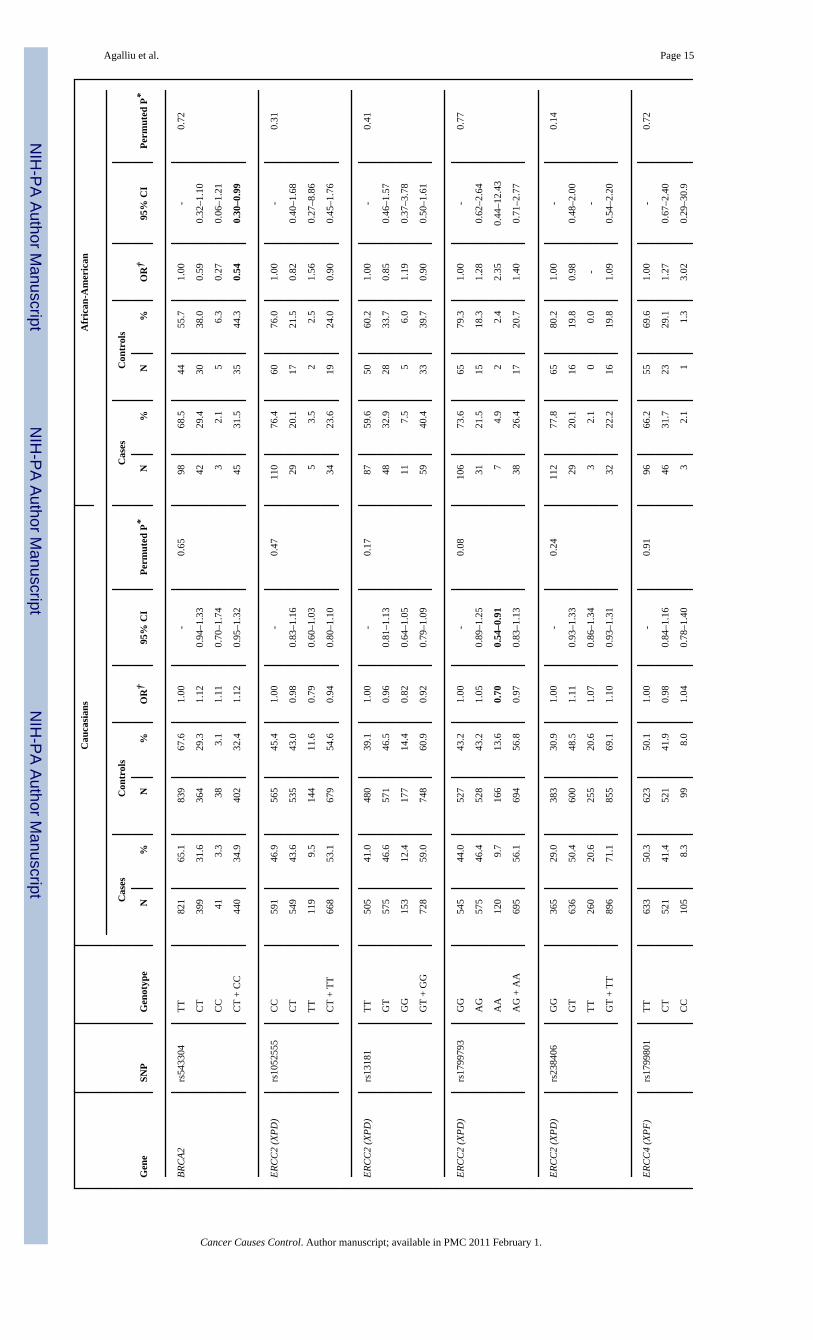
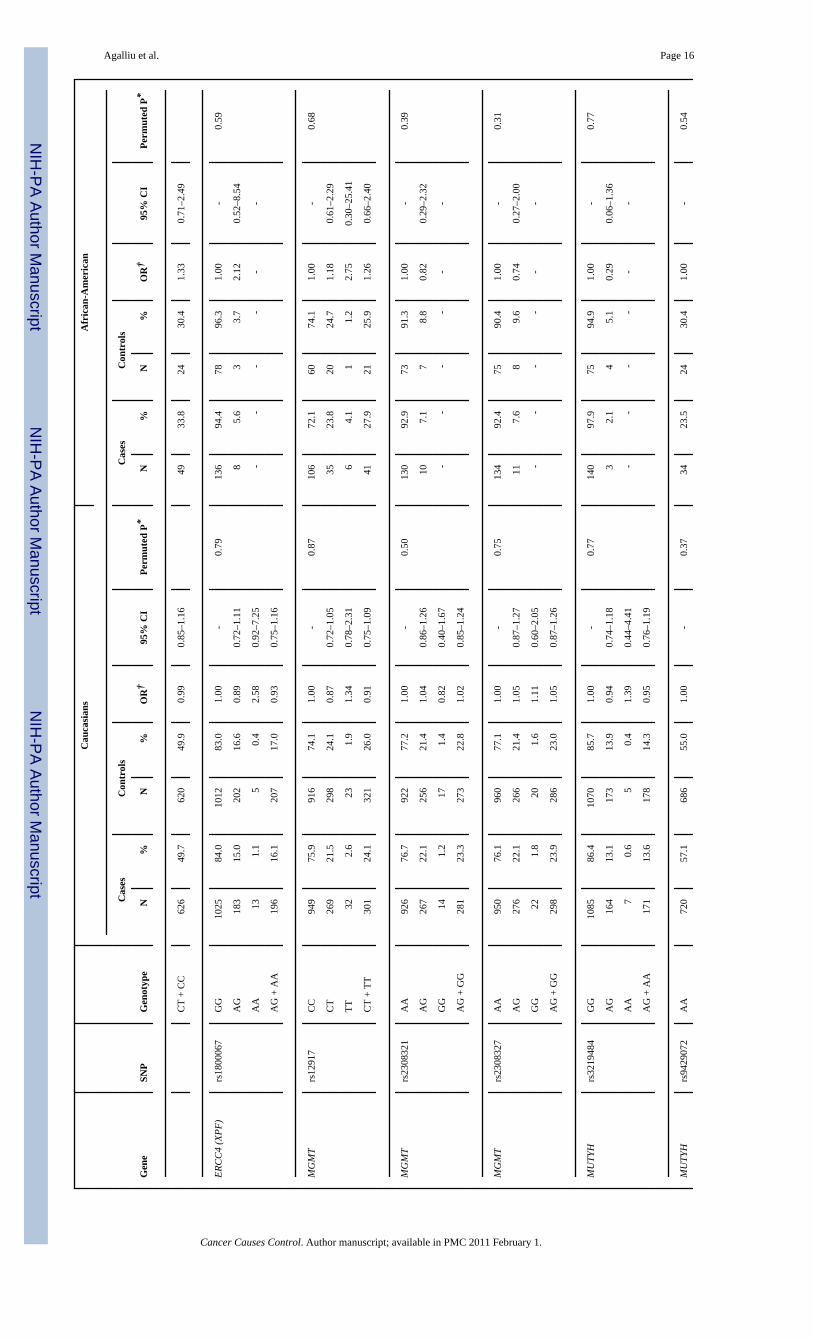
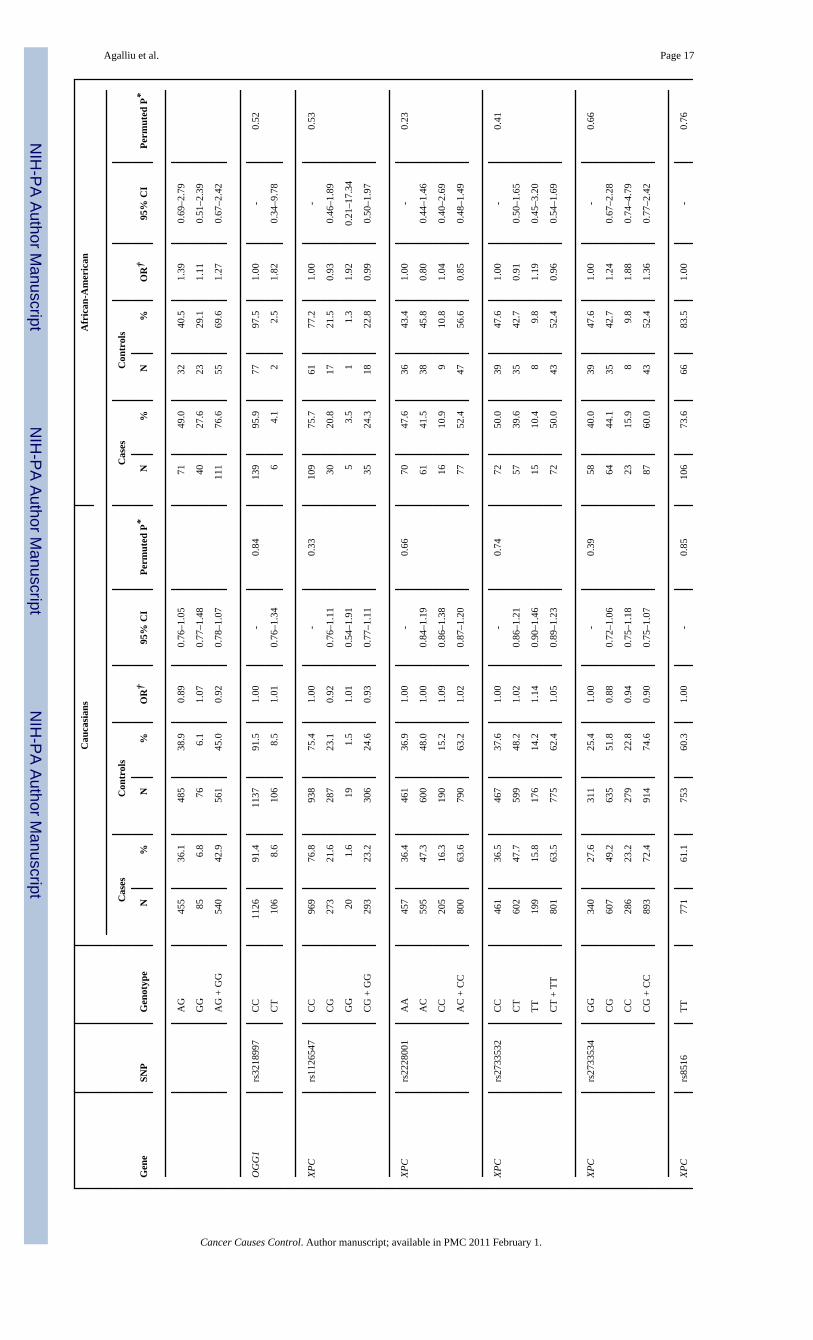
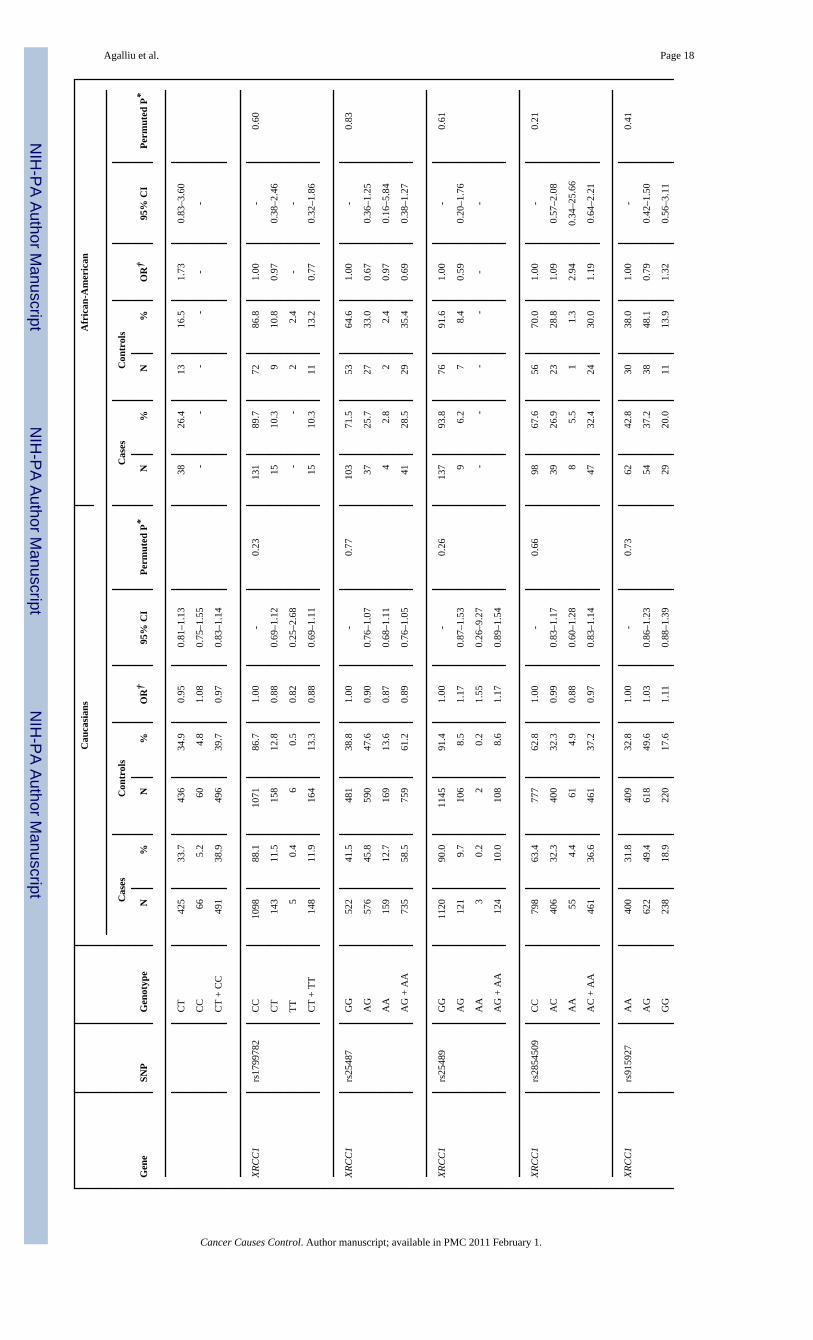
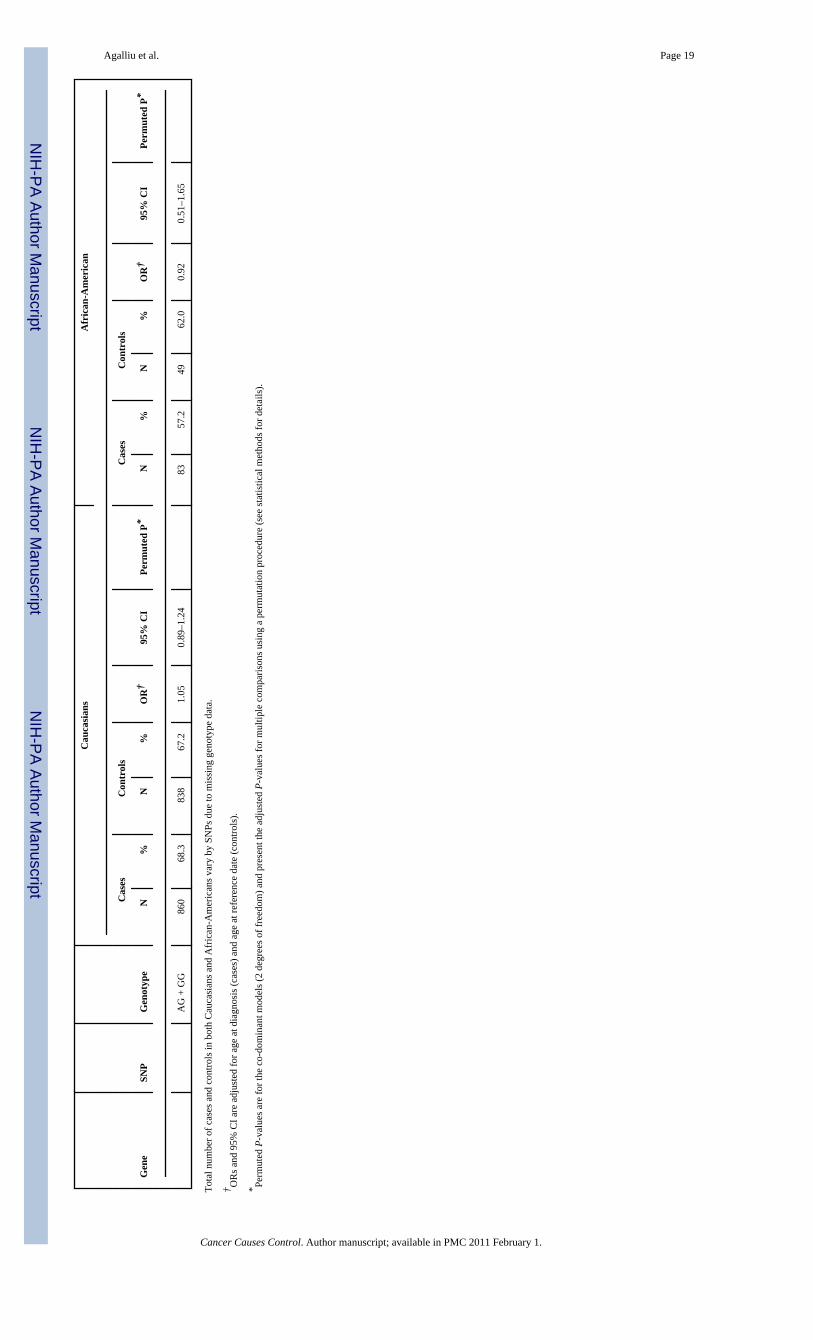
All 28 SNPs evaluated in this study were in HWE among both Caucasian and AfricanAmericans controls (all p>0.05). Table 2 presents associations between SNP genotypes andrisk of prostate cancer in Caucasians and African-Americans, separately. In single SNPanalyses, modest associations with overall risk of prostate cancer were observed in Caucasiansfor BRCA2 rs1801406 (OR=0.81; 95% CI 0.69–0.95; comparing any G allele vs. homozygousA allele carriers) and ERCC2 rs1799793 (OR=0.70; 95% CI 0.54–0.91; comparing men withAA vs. GG genotype). In African-Americans there was an association between prostate cancerand BRCA2 rs543304 where men with any C allele had an OR=0.54 (95% CI 0.30–0.99) incomparison to men with the TT genotype. However, after adjusting for multiple comparisonsthe permuted P-values of associations between these three SNPs and risk of prostate cancerwere no longer statistically significant.
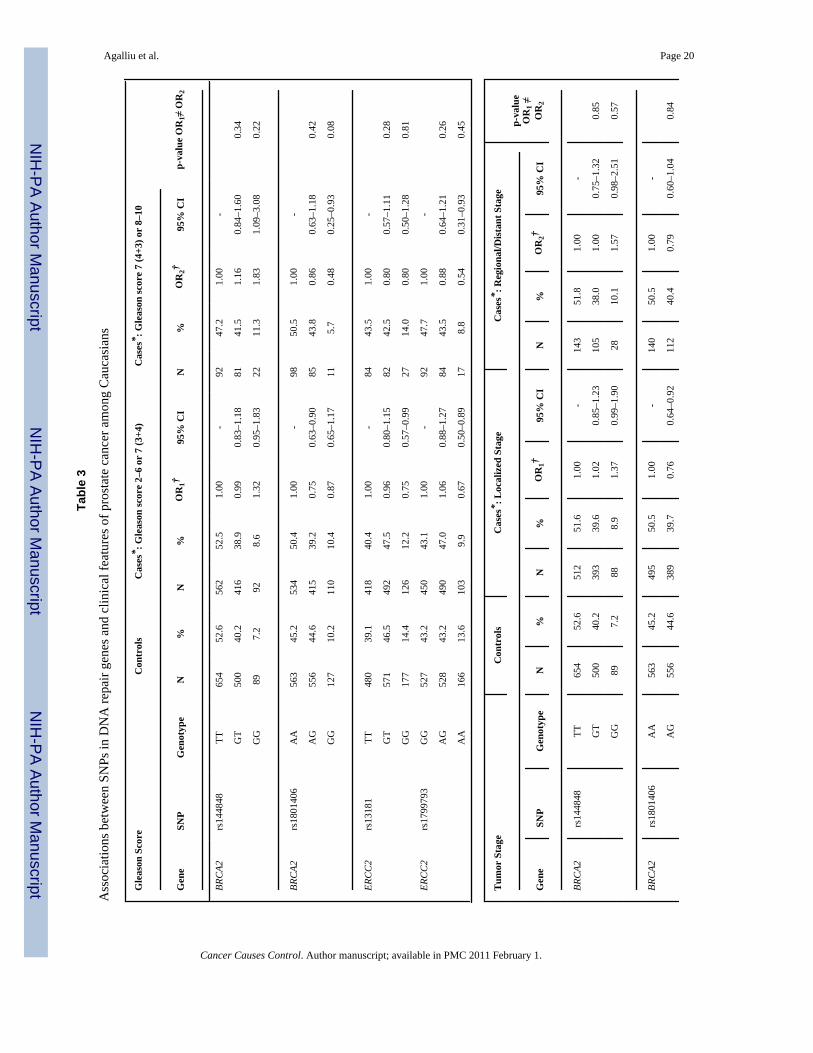
Next we explored interactions between DNA repair SNPs and first-degree family history ofprostate cancer (yes vs. no) and smoking (both smoking status and lifetime pack-years ofsmoking) in relation to prostate cancer risk. There was no evidence for effect modification(data not shown). Lastly, we examined associations between DNA repair SNPs and clinicalcharacteristics of prostate cancer including Gleason score and tumor stage among Caucasians(Table 3). With respect to clinical features of this disease two SNPs (rs144848, rs1801406) inBRCA2 and two SNP (rs1799793, rs13181) in ERCC2 showed some associations with Gleasonscore or tumor stage in single SNP analyses. For BRCA2 rs144848, although men with the GGgenotype had an OR of 1.83 (95% CI 1.09–3.08) of high Gleason score tumors in comparisonto men with the TT genotype, the risk estimate was not statistically significantly different incomparison to the OR obtained for tumors with Gleason score 2–6 or 7(3+4) (OR=1.32, p-value for differences in ORs estimates=0.22). For BRCA2 rs1801406 and ERCC2 rs1799793,although men homozygous for the minor allele had a slightly stronger reduction in risk of highGleason score tumors in comparison to men homozygous for the major allele (ORs of 0.48 and0.54, respectively) the risk estimates between higher and lower Gleason score tumors were notstatistically significantly different. Similar findings of no significant differences were alsoobserved in relation to tumor stage when data were stratified according to localized tumorsversus regional/distant tumors. No associations were observed between the remaining 24 SNPsin DNA repair genes and any of the clinical characteristics of prostate cancer.
DiscussionIn this population-based study we examined associations between 28 SNPs in 9 DNA repairgenes and prostate cancer risk among 1,457 cases and 1,351 controls pooled from two priorstudies conducted in King County, Washington. No associations were observed between anyof these SNPs and overall risk of prostate cancer, after adjusting for age and multiplecomparisons. Risks were not different according to family history of prostate cancer or bysmoking (either smoking status or pack-years of smoking) with mostly null associations. Withrespect to clinical characteristics of prostate cancer, two SNPs in BRCA2 (rs144848,rs1801406) and two SNP in ERCC2 (rs1799793, rs13181) showed some associations withGleason score and tumor stage in single SNP analysis; however ORs were not statisticallysignificantly different between lower and higher Gleason score tumors or between localizedversus regional or distant stage tumors.
Agalliu et al. Page 5
Cancer Causes Control. Author manuscript; available in PMC 2011 February 1.
NIH
-PA Author Manuscript
NIH
-PA Author Manuscript
NIH
-PA Author Manuscript
In relation to BRCA2 SNPs, although both rs144848 (Asn372His) and rs1801406 (Lys1132Lys) showed a stronger association with risk of higher grade prostate cancer in Caucasians,the ORs estimates were not statistically significant different from those obtained for Gleason2–6 or 7(3+4) tumors. However, none of the above SNPs in BRCA2 were associated with tumorstage in our dataset. The BRCA2 is considered a strong susceptibility gene in prostate cancer,since studies of families segregating BRCA2 protein-truncating mutations (35–40), studies ofpopulations who harbor founder mutations such as Icelandic (41) or Ashkenazi Jews (42–44),as well as studies of younger-onset prostate cancer (age at diagnosis < 55 yrs) unselected forfamily history (45,46) all have reported that men who carry protein-truncating BRCA2mutations have increased risk of prostate cancer with relative risk (RRs) ranging from 2.0 to23.0 depending on several factors including study population, case ascertainment, age atprostate cancer diagnosis and familial history of several cancer such as prostate, breast andovary. Unlike SNPs, which have an unclear role in protein function, the above deleteriousmutations in BRCA2 result in an earlier truncation of the BRCA2 protein and thus are morelikely to be linked to prostate cancer susceptibility; however given their very low prevalencein the general population (~0.1%) it is estimated that <1% of sporadic prostate cancers can beattributed to these disease-associated BRCA2 mutations (47).
With respect to ERCC2 (XPD) SNPs, we found no association with overall risk of prostatecancer; however there was an inverse association between two SNPs: rs1799793 (Asp312Asn)and rs13181 (Lys751Glu) and clinical features of prostate cancer including Gleason score andtumor stage. For both of these two non-synonymous SNPs although men homozygous for theminor allele had a stronger reduction in risk of higher Gleason score or regional or distanttumor stage in comparison to men with the more common genotype, these ORs were notstatistically significant for those obtained for low Gleason score (2–6 or 7=3+4) and localizedstage prostate cancer. The ERCC2 gene encodes for a protein that is part of the TFIIH complex,which unwinds the DNA helix around the lesion in the earlier steps of the nucleotide-excisionrepair (NER) pathway (12). This pathway is responsible for removal of DNA bulky lesionsthat occur from a variety of exposures, including UV-induced photoproducts, cross-links,oxidative damage or chemical adducts from PAH exposures (48) (11). Two other studies haveexamined associations between NER pathway and prostate cancer risk (17,21). Hu andcolleagues (17) examined associations between NER capacity in isolated prostate tissue asmeasured in a host-cell reaction assay, and prostate cancer risk is a small clinic-based study of140 prostate cancer patients and 96 controls. They reported a 2.6-fold increased risk (95%CI1.2–6.0) of prostate cancer for men in the lowest quartile of NER capacity in comparison tothose in the highest quartile (17), however, they did not consider genetic variants in NERpathway genes including ERCC2. In another study, Rybicki and colleagues (21) examinedassociations between the same two variants in ERCC2 (rs1799793, rs13181) that we evaluatedand risk of prostate cancer in a family-based study of 637 cases and 480 brother controls (thestudy population was primarily Caucasian) and reported a positive association betweenrs1799793 (Asp312Asn) and prostate cancer, where men with the AA genotype had a 60%increased risk of prostate cancer in comparison to men with the GG or GA genotype (21). Noassociation was observed for ERCC2 rs13181 in that study (21), nor risks differed by clinicalcharacteristics of prostate cancer We did not observe any association between these two SNPs(rs1799793, rs13181) and risk of prostate cancer in our study; however differences in resultscould be due several factors including false-positive findings or different study designs i.e.population-based vs. family-based (sibling brothers).
With respect to other SNPs in DNA repair genes we did not find any associations with overallrisk of prostate cancer or clinical characteristics of this disease in our study population, althoughprior studies have reported positive associations between risk of prostate cancer and geneticvariants in OGG1 (19), XRCC1 (20–24), MGMT (22) and XPC (25) in different populations.In a small study of 245 cases and 222 controls, Xu and colleagues (19) reported an OR of 3.2
Agalliu et al. Page 6
Cancer Causes Control. Author manuscript; available in PMC 2011 February 1.
NIH
-PA Author Manuscript
NIH
-PA Author Manuscript
NIH
-PA Author Manuscript
(95% CI 1.19–8.73) for sporadic prostate cancer risk associated with the GG genotype vs. CCgenotype for OGG1 rs1052133 (Ser326Cys). However that SNP was excluded from ouranalysis due to high frequency of drop-outs. In relation to XRCC1, two studies of Caucasianpopulations (20,21) reported no associations between prostate cancer and rs25487(Arg399Gln), rs1799782 (Arg194Trp) or rs25489 (Arg280His), which is similar to ourfindings. However, one of these studies reported effect modification between XRCC1 rs25487(Arg399Gln) and ERCC2 rs1799793 (Asp312Asn) in relation to risk of prostate cancer (21).Finally, two small scale studies in Asian populations with a maximum of 250 cases, reportedpositive associations between risk of prostate cancer and MGMT Leu84Phe (22), XPCLys939Gln (25) as well as XRCC1 Arg194Trp (22)(25). However the allele frequencies ofthese SNPs in Asians were different from those observed in our study population of Caucasians.
Our study has several strengths and limitations that should be carefully considered wheninterpreting the results. Strengths of the current study include the population-based design, thesample size, and the availability of information on potential confounding variables, as well asthe availability of clinical data on prostate cancer cases. A limitation of our study is that weexamined only a small number of SNPs in DNA repair genes with respect to risk of prostatecancer, and some large genes such as BRCA2 or MGMT had minimal coverage. However, themajority of selected tagSNPs in our study were also non-synonomous SNPs with potentialfunctional prediction based on the in silico Polyphen program. Another limitation is the smallnumber of African American men in this study that limited the statistical power to examineassociations in this group.
Two potential issues that should be considered when pooling datasets of prostate cancer caseswith different ascertainment periods are changes in the prevalence of PSA screening as wellas a shift of Gleason score reading system over time (49–51). The increase of PSA screeningover time would result theoretically in a higher proportion of prostate cancer cases diagnosedwith minimal disease in the more recent study (49). To assess this issue, we compared theprevalence of self-reported PSA screening among cases and controls between the two studies.Although the frequency of PSA screening increased among controls from 34% to 58% whencomparing study I (1993–1996) and study II (2002–2005), the frequency of PSA screeningwas similar between prostate cancer cases with different ascertainment periods, 73% and 71%,respectively. In addition the distribution of Gleason score 8 to 10 tumors was similar betweenthe two studies, 9% and 10% respectively, although the prevalence of cases diagnosed withregional or distant stage tumors slightly declined from 26% to 18% when comparing study I(1993–1996) and study II (2002–2005). Another issue is the shift of Gleason score readingover time, with the tendency of pathologists to provide a higher Gleason score for prostatebiopsy tumors in the more recent PSA screening era (50,51). Although we did not assess thisissue directly, as mentioned before the distribution of Gleason score was similar between thetwo studies, and the majority of our cases also received radical prostatectomy which usuallycorrects (either upgrades or downgrades) Gleason scores readings provided from the biopsies.Finally we stratified our data by study ascertainment period and run separate analysis for studyI and II, respectively. We didn’t find any significant differences in ORs estimates obtained foreach study separately, providing further reassurance that data from both studies are comparable.
In conclusion, we found no associations between DNA repair SNPs and overall risk of prostatecancer. Although, two SNPs in BRCA2 (rs144848, rs1801406) and two SNPs in ERCC2(rs1799793, rs13181) showed some associations with Gleason score or tumor stage whencomparing homozygous men carrying the minor vs. major allele, results were not statisticallysignificantly different between clinically aggressive and non-aggressive tumors. Although ourfindings suggest that selected SNPs in DNA repair genes do not contribute to prostate cancersusceptibility, given the complexity of this pathway and its crucial role in maintenance ofgenomic stability a more comprehensive evaluation of tag SNPs, haplotypes, copy number
Agalliu et al. Page 7
Cancer Causes Control. Author manuscript; available in PMC 2011 February 1.
NIH
-PA Author Manuscript
NIH
-PA Author Manuscript
NIH
-PA Author Manuscript
variations and pathway-based analyses of all 150 genes in several DNA repair pathways, aswell as exploration of gene-environment interactions may be warranted.
AcknowledgmentsWe are grateful to all men who participated in these studies for their time, effort and cooperation, and interviewersfor their help with data collection. This work was supported by NIH grants R01-CA56678, R01-CA092579 andcontract N01-CN-05230 from the National Cancer Institute. Additional support was provided by the Fred HutchinsonCancer Research Center and the Intramural Program of the National Human Genome Research Institute. Ilir Agalliuwas supported by funds from the Albert Einstein College of Medicine of Yeshiva University.
References1. American Cancer Society. Cancer Facts and Figures. Atlanta: 2009.2. Lichtenstein P, Holm NV, Verkasalo PK, Iliadou A, Kaprio J, Koskenvuo M, et al. Environmental and
heritable factors in the causation of cancer--analyses of cohorts of twins from Sweden, Denmark, andFinland. N Engl J Med 2000;343(2):78–85. [PubMed: 10891514]
3. Bostwick DG, Alexander EE, Singh R, Shan A, Qian J, Santella RM, et al. Antioxidant enzymeexpression and reactive oxygen species damage in prostatic intraepithelial neoplasia and cancer.Cancer 2000 Jul 1;89(1):123–34. [PubMed: 10897009]
4. Pathak SK, Sharma RA, Steward WP, Mellon JK, Griffiths TR, Gescher AJ. Oxidative stress andcyclooxygenase activity in prostate carcinogenesis: targets for chemopreventive strategies. Eur JCancer 2005;41(1):61–70. [PubMed: 15617991]
5. Khandrika L, Kumar B, Koul S, Maroni P, Koul HK. Oxidative stress in prostate cancer. Cancer Lett2009 Sep 18;282(2):125–36. [PubMed: 19185987]
6. Cooke MS, Evans MD, Dizdaroglu M, Lunec J. Oxidative DNA damage: mechanisms, mutation, anddisease. Faseb J 2003 Jul;17(10):1195–214. [PubMed: 12832285]
7. Sikka SC. Role of oxidative stress response elements and antioxidants in prostate cancer pathobiologyand chemoprevention--a mechanistic approach. Curr Med Chem 2003 Dec;10(24):2679–92. [PubMed:14529458]
8. Rybicki BA, Rundle A, Savera AT, Sankey SS, Tang D. Polycyclic aromatic hydrocarbon-DNAadducts in prostate cancer. Cancer Res 2004 Dec 15;64(24):8854–9. [PubMed: 15604244]
9. Rybicki BA, Nock NL, Savera AT, Tang D, Rundle A. Polycyclic aromatic hydrocarbon-DNA adductformation in prostate carcinogenesis. Cancer Lett 2006 Aug 8;239(2):157–67. [PubMed: 16154258]
10. Tang D, Liu JJ, Rundle A, Neslund-Dudas C, Savera AT, Bock CH, et al. Grilled meat consumptionand PhIP-DNA adducts in prostate carcinogenesis. Cancer Epidemiol Biomarkers Prev 2007 Apr;16(4):803–8. [PubMed: 17416774]
11. Christmann M, Tomicic MT, Roos WP, Kaina B. Mechanisms of human DNA repair: an update.Toxicology 2003 Nov 15;193(1–2):3–34. [PubMed: 14599765]
12. Wood RD, Mitchell M, Sgouros J, Lindahl T. Human DNA repair genes. Science 2001 Feb 16;291(5507):1284–9. [PubMed: 11181991]
13. Pierce AJ, Stark JM, Araujo FD, Moynahan ME, Berwick M, Jasin M. Double-strand breaks andtumorigenesis. Trends Cell Biol 2001;11:S52–9. [PubMed: 11684443]
14. Jackson SP. Sensing and repairing DNA double-strand breaks. Carcinogenesis 2002;23:687–96.[PubMed: 12016139]
15. Hu JJ, Mohrenweiser HW, Bell DA, Leadon SA, Miller MS. Symposium overview: geneticpolymorphisms in DNA repair and cancer risk. Toxicol Appl Pharmacol 2002 Nov 15;185(1):64–73. [PubMed: 12460738]
16. Goode EL, Ulrich CM, Potter JD. Polymorphisms in DNA repair genes and associations with cancerrisk. Cancer Epidemiol Biomarkers Prev 2002 Dec;11(12):1513–30. [PubMed: 12496039]
17. Hu JJ, Hall MC, Grossman L, Hedayati M, McCullough DL, Lohman K, et al. Deficient nucleotideexcision repair capacity enhances human prostate cancer risk. Cancer Res 2004 Feb 1;64(3):1197–201. [PubMed: 14871857]
Agalliu et al. Page 8
Cancer Causes Control. Author manuscript; available in PMC 2011 February 1.
NIH
-PA Author Manuscript
NIH
-PA Author Manuscript
NIH
-PA Author Manuscript
18. Hung RJ, Hall J, Brennan P, Boffetta P. Genetic polymorphisms in the base excision repair pathwayand cancer risk: a HuGE review. Am J Epidemiol 2005 Nov 15;162(10):925–42. [PubMed:16221808]
19. Xu J, Zheng SL, Turner A, Isaacs SD, Wiley KE, Hawkins GA, et al. Associations between hOGG1sequence variants and prostate cancer susceptibility. Cancer Res 2002 Apr 15;62(8):2253–7.[PubMed: 11956079]
20. van Gils CH, Bostick RM, Stern MC, Taylor JA. Differences in base excision repair capacity maymodulate the effect of dietary antioxidant intake on prostate cancer risk: an example ofpolymorphisms in the XRCC1 gene. Cancer Epidemiol Biomarkers Prev 2002 Nov;11(11):1279–84.[PubMed: 12433703]
21. Rybicki BA, Conti DV, Moreira A, Cicek M, Casey G, Witte JS. DNA repair gene XRCC1 and XPDpolymorphisms and risk of prostate cancer. Cancer Epidemiol Biomarkers Prev 2004 Jan;13(1):23–9. [PubMed: 14744728]
22. Ritchey JD, Huang WY, Chokkalingam AP, Gao YT, Deng J, Levine P, et al. Genetic variants ofDNA repair genes and prostate cancer: a population-based study. Cancer Epidemiol Biomarkers Prev2005 Jul;14(7):1703–9. [PubMed: 16030105]
23. Nock NL, Cicek MS, Li L, Liu X, Rybicki BA, Moreira A, et al. Polymorphisms in estrogenbioactivation, detoxification and oxidative DNA base excision repair genes and prostate cancer risk.Carcinogenesis 2006 Sep;27(9):1842–8. [PubMed: 16569655]
24. Chen L, Ambrosone CB, Lee J, Sellers TA, Pow-Sang J, Park JY. Association betweenpolymorphisms in the DNA repair genes XRCC1 and APE1, and the risk of prostate cancer in whiteand black Americans. J Urol 2006 Jan;175(1):108–12. discussion 12. [PubMed: 16406883]
25. Hirata H, Hinoda Y, Tanaka Y, Okayama N, Suehiro Y, Kawamoto K, et al. Polymorphisms of DNArepair genes are risk factors for prostate cancer. Eur J Cancer 2007 Jan;43(2):231–7. [PubMed:17196815]
26. Hooker S, Bonilla C, Akereyeni F, Ahaghotu C, Kittles RA. NAT2 and NER genetic variants andsporadic prostate cancer susceptibility in African Americans. Prostate Cancer Prostatic Dis 2008;11(4):349–56. [PubMed: 18026184]
27. Stanford JL, Wicklund KG, McKnight B, Daling JR, Brawer MK. Vasectomy and risk of prostatecancer. Cancer Epidemiol Biomarkers Prev 1999;8(10):881–6. [PubMed: 10548316]
28. Agalliu I, Salinas CA, Hansten PD, Ostrander EA, Stanford JL. Statin use and risk of prostate cancer:results from a population-based epidemiologic study. Am J Epidemiol 2008 Aug 1;168(3):250–60.[PubMed: 18556686]
29. Sunyaev S, Ramensky V, Koch I, Lathe W 3rd, Kondrashov AS, Bork P. Prediction of deleterioushuman alleles. Hum Mol Genet 2001 Mar 15;10(6):591–7. [PubMed: 11230178]
30. Sambrook, J.; Fritsch, EF.; Maniatis, T. Isolation of high-molecular weight DNA from mammaliancells. In: Nolan, C., editor. Molecular Cloning: A Laboratory Manual. Plainview, NY: Cold SpringHarbor Press; 1989. p. 9.16-9.9.
31. Ott, J. Analysis of human genetic linkage. Baltimore: John Hopkins University Press; 1999.32. Breslow, NE.; Day, NE. Statistical Methods in Cancer Research, Volume 1-The Analysis of Case-
Control Studies. Lyon: International Agency for Research on Cancer; 1980.33. Klienbaum, DG.; Nizam, A.; Kupper, L.; Muller, KE. Applied regression analysis and multivariate
methods. 4. Pacific Grove, CA: Duxbury Press; 2007.34. Dubin N, Pasternack BS. Risk assessment for case-control subgroups by polychotomous logistic
regression. Am J Epidemiol 1986;123(6):1101–17. [PubMed: 3706280]35. The Breast Cancer Linkage C. Cancer risks in BRCA2 mutation carriers. J Natl Cancer Inst 1999;91
(15):1310–6. [PubMed: 10433620]36. Johannsson O, Loman N, Moller T, Kristoffersson U, Borg A, Olsson H. Incidence of malignant
tumours in relatives of BRCA1 and BRCA2 germline mutation carriers. Eur J Cancer 1999;35(8):1248–57. [PubMed: 10615237]
37. Eerola H, Pukkala E, Pyrhonen S, Blomqvist C, Sankila R, Nevanlinna H. Risk of cancer in BRCA1and BRCA2 mutation-positive and -negative breast cancer families (Finland). Cancer Causes Control2001;12:739–46. [PubMed: 11562114]
Agalliu et al. Page 9
Cancer Causes Control. Author manuscript; available in PMC 2011 February 1.
NIH
-PA Author Manuscript
NIH
-PA Author Manuscript
NIH
-PA Author Manuscript
38. Tulinius H, Olafsdottir GH, Sigvaldason H, Arason A, Barkardottir RB, Egilsson V, et al. The effectof a single BRCA2 mutation on cancer in Iceland. J Med Genet 2002;39(7):457–62. [PubMed:12114473]
39. Bermejo JL, Hemminki K. Risk of cancer at sites other than the breast in Swedish families eligiblefor BRCA1 or BRCA2 mutation testing. Ann Oncol 2004;15:1834–41. [PubMed: 15550590]
40. van Asperen CJ, Brohet RM, Meijers-Heijboer EJ, Hoogerbrugge N, Verhoef S. Cancer risks inBRCA2 families: estimates for sites other than breast and ovary. J Med Genet 2005;42:711–9.[PubMed: 16141007]
41. Sigurdsson S, Thorlacius S, Tomasson J, Tryggvadottir L, Benediktsdottir K, Eyfjörd JE, et al.BRCA2 mutation in Icelandic prostate cancer patients. J Mol Med 1997;75:758–61. [PubMed:9383000]
42. Struewing JP, Hartge P, Wacholder S, Baker SM, Berlin M, McAdams M, et al. The risk of cancerassociated with specific mutations of BRCA1 and BRCA2 among Ashkenazi Jews. N Engl J Med1997;336(20):1401–8. [PubMed: 9145676]
43. Kirchhoff T, Kauff ND, Mitra N, Nafa K, Huang H, Palmer C, et al. BRCA mutations and risk ofprostate cancer in Ashkenazi Jews. Clin Cancer Res 2004;10:2918–21. [PubMed: 15131025]
44. Agalliu I, Gern R, Leanza S, Burk RD. Associations of high-grade prostate cancer with BRCA1 andBRCA2 founder mutations. Clin Cancer Res 2009 Feb 1;15(3):1112–20. [PubMed: 19188187]
45. Edwards SM, Kote-Jarai Z, Meitz J, Hamoudi R, Hope Q, Osin P, et al. Two percent of men withearly-onset prostate cancer harbor germline mutations in the BRCA2 gene. Am J Hum Genet2003;72:1–12. [PubMed: 12474142]
46. Agalliu I, Karlins E, Kwon EM, Iwasaki LM, Diamond A, Ostrander EA, et al. Rare germlinemutations in the BRCA2 gene are associated with early-onset prostate cancer. Br J Cancer 2007 Sep17;97(6):826–31. [PubMed: 17700570]
47. Ostrander EA, Udler MS. The role of the BRCA2 gene in susceptibility to prostate cancer revisited.Cancer Epidemiol Biomarkers Prev 2008 Aug;17(8):1843–8. [PubMed: 18708369]
48. Braithwaite E, Wu X, Wang Z. Repair of DNA lesions induced by polycyclic aromatic hydrocarbonsin human cell-free extracts: involvement of two excision repair mechanisms in vitro. Carcinogenesis1998 Jul;19(7):1239–46. [PubMed: 9683183]
49. Platz EA, De Marzo AM, Giovannucci E. Prostate cancer association studies: pitfalls and solutionsto cancer misclassification in the PSA era. J Cell Biochem 2004;91(3):553–71. [PubMed: 14755685]
50. Kondylis FI, Moriarty RP, Bostwick D, Schellhammer PF. Prostate cancer grade assignment: theeffect of chronological, interpretive and translation bias. J Urol 2003 Oct;170(4 Pt 1):1189–93.[PubMed: 14501722]
51. Albertsen PC, Hanley JA, Barrows GH, Penson DF, Kowalczyk PDH. Prostate cancer and the WillRogers phenomenon. J Natl Cancer Inst 2005;97(17):1248–52. [PubMed: 16145045]
Agalliu et al. Page 10
Cancer Causes Control. Author manuscript; available in PMC 2011 February 1.
NIH
-PA Author Manuscript
NIH
-PA Author Manuscript
NIH
-PA Author Manuscript
NIH
-PA Author Manuscript
NIH
-PA Author Manuscript
NIH
-PA Author Manuscript
Agalliu et al. Page 11
Tabl
e 1
Sele
cted
cha
ract
eris
tics o
f pro
stat
e ca
ncer
cas
es a
nd c
ontro
ls g
enot
yped
for S
NPs
in D
NA
repa
ir ge
nes,
by ra
ce
Cau
casi
ans
Afr
ican
- A
mer
ican
s
Cha
ract
eris
ticC
ases
(N=1
,308
)C
ontr
ols (
N=1
,266
)P-
valu
e†C
ases
(N=1
49)
Con
trol
s (N
=85)
P-va
lue†
Age
(yea
rs);
n (%
)0.
360.
0002
35
–49
102
(7.8
)10
7 (8
.5)
16 (1
0.7)
19 (2
2.4)
50
–54
188
(14.
4)17
8 (1
4.1)
26 (1
7.5)
31 (3
6.5)
55
–59
325
(24.
9)34
3 (2
7.1)
32 (2
1.5)
15 (1
7.7)
60
–64
395
(30.
2)33
4 (2
6.3)
38 (2
5.5)
14 (1
6.5)
65
–69
153
(11.
7)16
0 (1
2.6)
24 (1
6.1)
4 (4
.7)
70
–74
145
(11.
1)14
4 (1
1.4)
13 (8
.7)
2 (2
.4)
Firs
t-deg
ree
fam
ily h
isto
ry o
fpr
osta
te c
ance
r; n
(%)
<0.0
001
0.04
N
o1,
025
(78.
4)1,
125
(88.
9)11
9 (7
9.9)
75 (8
8.2)
Y
es28
3 (2
1.6)
141
(11.
1)30
(20.
1)10
(11.
8)
Bod
y m
ass i
ndex
(BM
I), k
g/m
2 n(%
)0.
340.
39
<
25.0
429
(32.
8)38
9 (3
0.7)
38 (2
5.5)
21 (2
4.7)
25
.0–2
9.9
637
(48.
7)61
8 (4
8.8)
69 (4
6.1)
33 (3
8.8)
≥
3024
2 (1
8.5)
259
(20.
5)42
(28.
2)31
(36.
5)
Smok
ing
stat
us; n
(%)
0.13
0.64
N
on sm
oker
522
(39.
9)54
1 (4
2.7)
63 (4
2.3)
31 (3
6.5)
Fo
rmer
smok
er63
1 (4
8.2)
561
(44.
3)45
(30.
2)30
(35.
3)
C
urre
nt sm
oker
155
(11.
9)16
4 (1
3.0)
41 (2
7.5)
24 (2
8.2)
Educ
atio
n; n
(%)
0.85
0.09
H
igh
scho
ol o
r les
s23
0 (1
7.6)
237
(18.
7)57
(38.
3)24
(28.
2)
So
me
colle
ge32
4 (2
4.8)
300
(23.
7)49
(32.
9)23
(27.
1)
Cancer Causes Control. Author manuscript; available in PMC 2011 February 1.
NIH
-PA Author Manuscript
NIH
-PA Author Manuscript
NIH
-PA Author Manuscript
Agalliu et al. Page 12
Cau
casi
ans
Afr
ican
- A
mer
ican
s
Cha
ract
eris
ticC
ases
(N=1
,308
)C
ontr
ols (
N=1
,266
)P-
valu
e†C
ases
(N=1
49)
Con
trol
s (N
=85)
P-va
lue†
C
olle
ge d
egre
e36
9 (2
8.2)
354
(28.
0)21
(14.
1)21
(24.
7)
G
radu
ate
degr
ee38
5 (2
9.4)
375
(29.
6)22
(14.
7)17
(20.
0)
Pros
tate
can
cer s
cree
ning
hist
ory‡
; n (%
)<0
.000
10.
002
N
one
135
(10.
3)16
8 (1
3.3)
22 (1
4.8)
15 (1
7.7)
D
RE
only
223
(17.
1)48
2 (3
8.1)
34 (2
2.8)
36 (4
2.3)
PS
A95
0 (7
2.6)
616
(48.
7)93
(62.
4)34
(40.
0)
Gle
ason
scor
e, n
(%)
2–
466
(5.1
)5
(3.4
)
5–
668
1 (5
2.1)
61 (4
0.9)
7
(3+4
)35
5 (2
7.1)
53 (3
5.6)
7
(4+3
)76
(5.8
)14
(9.4
)
8–
1012
6 (9
.6)
14 (9
.4)
M
issi
ng4
(0.3
)2
(1.3
)
Stag
e of
can
cer,
n (%
)
Lo
caliz
ed1,
022
(78.
1)11
8 (7
9.2)
R
egio
nal
254
(19.
4)26
(17.
5)
D
ista
nt32
(2.5
)5
(3.4
)
PSA
val
ueξ
(ng/
ml);
n (%
)<0
.000
1<0
.000
1
0.
01–3
.917
8 (1
3.6)
1,17
5 (9
2.8)
11 (7
.4)
78 (9
1.8)
4.
0–9.
970
5 (5
3.9)
74 (5
.9)
91 (6
1.1)
6 (7
.1)
10
.0–1
9.9
188
(14.
4)15
(1.2
)19
(12.
8)1
(1.2
)
≥
2011
8 (9
.0)
2 (0
.2)
20 (1
3.4)
-
M
issi
ng11
9 (9
.1)
-8
(5.4
)-
Cancer Causes Control. Author manuscript; available in PMC 2011 February 1.

NIH
-PA Author Manuscript
NIH
-PA Author Manuscript
NIH
-PA Author Manuscript
Agalliu et al. Page 13† C
hi-s
quar
e p-
valu
e;
‡ Pros
tate
can
cer s
cree
ning
his
tory
with
in th
e 5
year
s bef
ore
pros
tate
can
cer d
iagn
osis
or r
efer
ence
dat
e.
ξ Seru
m P
SA v
alue
at p
rost
ate
canc
er d
iagn
osis
for c
ases
and
at i
nter
view
for c
ontro
ls A
bbre
viat
ions
: DR
E - d
igita
l rec
tal e
xam
inat
ion;
PSA
- pr
osta
te sp
ecifi
c an
tigen
.
Cancer Causes Control. Author manuscript; available in PMC 2011 February 1.
NIH
-PA Author Manuscript
NIH
-PA Author Manuscript
NIH
-PA Author Manuscript
Agalliu et al. Page 14
Tabl
e 2
Ass
ocia
tions
bet
wee
n SN
Ps in
DN
A re
pair
gene
s and
pro
stat
e ca
ncer
risk
, by
race
Cau
casi
ans
Afr
ican
-Am
eric
an
Cas
esC
ontr
ols
Cas
esC
ontr
ols
Gen
eSN
PG
enot
ype
N%
N%
OR
†95
% C
IPe
rmut
ed P
*N
%N
%O
R†
95%
CI
Perm
uted
P*
APEX
1rs
1320
150
AA
424
33.5
415
33.4
1.00
-0.
4257
40.1
3746
.81.
00-
0.84
AG
612
48.4
615
49.5
0.97
0.82
–1.1
665
45.8
3341
.81.
430.
77–2
.66
GG
229
18.1
212
17.1
1.06
0.84
–1.3
320
14.1
911
.41.
480.
58–3
.79
AG
+ G
G84
166
.582
766
.61.
000.
84–1
.18
8559
.942
53.2
1.44
0.80
–2.5
9
APEX
1rs
2275
007
GG
420
33.4
415
33.5
1.00
-0.
7961
43.0
3746
.81.
00-
0.53
AG
608
48.3
614
49.5
0.98
0.82
–1.1
762
43.7
3139
.21.
400.
75–2
.62
AA
230
18.3
211
17.0
1.08
0.85
–1.3
619
13.4
1113
.91.
080.
44–2
.65
AG
+ A
A83
866
.682
566
.51.
010.
85–1
.19
8157
.042
53.2
1.32
0.73
–2.3
6
BRC
A2rs
1448
48TT
655
51.6
654
52.6
1.00
-0.
5210
473
.259
74.7
1.00
-0.
36
GT
498
39.4
500
40.2
0.99
0.84
–1.1
736
25.4
1822
.80.
980.
49–1
.95
GG
116
9.1
897.
21.
300.
98–1
.75
21.
42
2.5
0.48
0.06
–3.8
5
GT
+ G
G61
448
.558
947
.41.
040.
89–1
.22
3826
.820
25.3
0.93
0.48
–1.8
1
BRC
A2rs
1586
9A
A77
060
.878
763
.31.
00-
0.59
136
95.1
7189
.91.
00-
0.90
AC
439
34.7
398
32.0
1.13
0.95
–1.3
37
4.9
78.
90.
620.
20–1
.91
CC
574.
559
4.7
0.99
0.68
–1.4
4-
-1
1.3
--
AC
+ C
C49
639
.245
736
.71.
110.
94–1
.30
74.
98
10.1
0.53
0.18
–1.5
8
BRC
A2rs
1801
406
AA
635
50.5
563
45.2
1.00
-0.
2279
54.5
4658
.31.
00-
0.53
AG
501
39.9
556
44.6
0.80
0.68
–0.9
458
40.0
3139
.21.
130.
62–2
.06
GG
121
9.6
127
10.2
0.84
0.64
–1.1
18
5.5
22.
53.
340.
65–1
7.12
AG
+ G
G62
249
.568
354
.80.
810.
69–0
.95
6645
.533
41.7
1.25
0.70
–2.2
5
Cancer Causes Control. Author manuscript; available in PMC 2011 February 1.
NIH
-PA Author Manuscript
NIH
-PA Author Manuscript
NIH
-PA Author Manuscript
Agalliu et al. Page 15
Cau
casi
ans
Afr
ican
-Am
eric
an
Cas
esC
ontr
ols
Cas
esC
ontr
ols
Gen
eSN
PG
enot
ype
N%
N%
OR
†95
% C
IPe
rmut
ed P
*N
%N
%O
R†
95%
CI
Perm
uted
P*
BRC
A2rs
5433
04TT
821
65.1
839
67.6
1.00
-0.
6598
68.5
4455
.71.
00-
0.72
CT
399
31.6
364
29.3
1.12
0.94
–1.3
342
29.4
3038
.00.
590.
32–1
.10
CC
413.
338
3.1
1.11
0.70
–1.7
43
2.1
56.
30.
270.
06–1
.21
CT
+ C
C44
034
.940
232
.41.
120.
95–1
.32
4531
.535
44.3
0.54
0.30
–0.9
9
ERC
C2
(XPD
)rs
1052
555
CC
591
46.9
565
45.4
1.00
-0.
4711
076
.460
76.0
1.00
-0.
31
CT
549
43.6
535
43.0
0.98
0.83
–1.1
629
20.1
1721
.50.
820.
40–1
.68
TT11
99.
514
411
.60.
790.
60–1
.03
53.
52
2.5
1.56
0.27
–8.8
6
CT
+ TT
668
53.1
679
54.6
0.94
0.80
–1.1
034
23.6
1924
.00.
900.
45–1
.76
ERC
C2
(XPD
)rs
1318
1TT
505
41.0
480
39.1
1.00
-0.
1787
59.6
5060
.21.
00-
0.41
GT
575
46.6
571
46.5
0.96
0.81
–1.1
348
32.9
2833
.70.
850.
46–1
.57
GG
153
12.4
177
14.4
0.82
0.64
–1.0
511
7.5
56.
01.
190.
37–3
.78
GT
+ G
G72
859
.074
860
.90.
920.
79–1
.09
5940
.433
39.7
0.90
0.50
–1.6
1
ERC
C2
(XPD
)rs
1799
793
GG
545
44.0
527
43.2
1.00
-0.
0810
673
.665
79.3
1.00
-0.
77
AG
575
46.4
528
43.2
1.05
0.89
–1.2
531
21.5
1518
.31.
280.
62–2
.64
AA
120
9.7
166
13.6
0.70
0.54
–0.9
17
4.9
22.
42.
350.
44–1
2.43
AG
+ A
A69
556
.169
456
.80.
970.
83–1
.13
3826
.417
20.7
1.40
0.71
–2.7
7
ERC
C2
(XPD
)rs
2384
06G
G36
529
.038
330
.91.
00-
0.24
112
77.8
6580
.21.
00-
0.14
GT
636
50.4
600
48.5
1.11
0.93
–1.3
329
20.1
1619
.80.
980.
48–2
.00
TT26
020
.625
520
.61.
070.
86–1
.34
32.
10
0.0
--
GT
+ TT
896
71.1
855
69.1
1.10
0.93
–1.3
132
22.2
1619
.81.
090.
54–2
.20
ERC
C4
(XPF
)rs
1799
801
TT63
350
.362
350
.11.
00-
0.91
9666
.255
69.6
1.00
-0.
72
CT
521
41.4
521
41.9
0.98
0.84
–1.1
646
31.7
2329
.11.
270.
67–2
.40
CC
105
8.3
998.
01.
040.
78–1
.40
32.
11
1.3
3.02
0.29
–30.
9
Cancer Causes Control. Author manuscript; available in PMC 2011 February 1.
NIH
-PA Author Manuscript
NIH
-PA Author Manuscript
NIH
-PA Author Manuscript
Agalliu et al. Page 16
Cau
casi
ans
Afr
ican
-Am
eric
an
Cas
esC
ontr
ols
Cas
esC
ontr
ols
Gen
eSN
PG
enot
ype
N%
N%
OR
†95
% C
IPe
rmut
ed P
*N
%N
%O
R†
95%
CI
Perm
uted
P*
CT
+ C
C62
649
.762
049
.90.
990.
85–1
.16
4933
.824
30.4
1.33
0.71
–2.4
9
ERC
C4
(XPF
)rs
1800
067
GG
1025
84.0
1012
83.0
1.00
-0.
7913
694
.478
96.3
1.00
-0.
59
AG
183
15.0
202
16.6
0.89
0.72
–1.1
18
5.6
33.
72.
120.
52–8
.54
AA
131.
15
0.4
2.58
0.92
–7.2
5-
--
--
-
AG
+ A
A19
616
.120
717
.00.
930.
75–1
.16
MG
MT
rs12
917
CC
949
75.9
916
74.1
1.00
-0.
8710
672
.160
74.1
1.00
-0.
68
CT
269
21.5
298
24.1
0.87
0.72
–1.0
535
23.8
2024
.71.
180.
61–2
.29
TT32
2.6
231.
91.
340.
78–2
.31
64.
11
1.2
2.75
0.30
–25.
41
CT
+ TT
301
24.1
321
26.0
0.91
0.75
–1.0
941
27.9
2125
.91.
260.
66–2
.40
MG
MT
rs23
0832
1A
A92
676
.792
277
.21.
00-
0.50
130
92.9
7391
.31.
00-
0.39
AG
267
22.1
256
21.4
1.04
0.86
–1.2
610
7.1
78.
80.
820.
29–2
.32
GG
141.
217
1.4
0.82
0.40
–1.6
7-
--
--
-
AG
+ G
G28
123
.327
322
.81.
020.
85–1
.24
MG
MT
rs23
0832
7A
A95
076
.196
077
.11.
00-
0.75
134
92.4
7590
.41.
00-
0.31
AG
276
22.1
266
21.4
1.05
0.87
–1.2
711
7.6
89.
60.
740.
27–2
.00
GG
221.
820
1.6
1.11
0.60
–2.0
5-
--
--
-
AG
+ G
G29
823
.928
623
.01.
050.
87–1
.26
MU
TYH
rs32
1948
4G
G10
8586
.410
7085
.71.
00-
0.77
140
97.9
7594
.91.
00-
0.77
AG
164
13.1
173
13.9
0.94
0.74
–1.1
83
2.1
45.
10.
290.
06–1
.36
AA
70.
65
0.4
1.39
0.44
–4.4
1-
--
--
-
AG
+ A
A17
113
.617
814
.30.
950.
76–1
.19
MU
TYH
rs94
2907
2A
A72
057
.168
655
.01.
00-
0.37
3423
.524
30.4
1.00
-0.
54
Cancer Causes Control. Author manuscript; available in PMC 2011 February 1.
NIH
-PA Author Manuscript
NIH
-PA Author Manuscript
NIH
-PA Author Manuscript
Agalliu et al. Page 17
Cau
casi
ans
Afr
ican
-Am
eric
an
Cas
esC
ontr
ols
Cas
esC
ontr
ols
Gen
eSN
PG
enot
ype
N%
N%
OR
†95
% C
IPe
rmut
ed P
*N
%N
%O
R†
95%
CI
Perm
uted
P*
AG
455
36.1
485
38.9
0.89
0.76
–1.0
571
49.0
3240
.51.
390.
69–2
.79
GG
856.
876
6.1
1.07
0.77
–1.4
840
27.6
2329
.11.
110.
51–2
.39
AG
+ G
G54
042
.956
145
.00.
920.
78–1
.07
111
76.6
5569
.61.
270.
67–2
.42
OG
G1
rs32
1899
7C
C11
2691
.411
3791
.51.
00-
0.84
139
95.9
7797
.51.
00-
0.52
CT
106
8.6
106
8.5
1.01
0.76
–1.3
46
4.1
22.
51.
820.
34–9
.78
XPC
rs11
2654
7C
C96
976
.893
875
.41.
00-
0.33
109
75.7
6177
.21.
00-
0.53
CG
273
21.6
287
23.1
0.92
0.76
–1.1
130
20.8
1721
.50.
930.
46–1
.89
GG
201.
619
1.5
1.01
0.54
–1.9
15
3.5
11.
31.
920.
21–1
7.34
CG
+ G
G29
323
.230
624
.60.
930.
77–1
.11
3524
.318
22.8
0.99
0.50
–1.9
7
XPC
rs22
2800
1A
A45
736
.446
136
.91.
00-
0.66
7047
.636
43.4
1.00
-0.
23
AC
595
47.3
600
48.0
1.00
0.84
–1.1
961
41.5
3845
.80.
800.
44–1
.46
CC
205
16.3
190
15.2
1.09
0.86
–1.3
816
10.9
910
.81.
040.
40–2
.69
AC
+ C
C80
063
.679
063
.21.
020.
87–1
.20
7752
.447
56.6
0.85
0.48
–1.4
9
XPC
rs27
3353
2C
C46
136
.546
737
.61.
00-
0.74
7250
.039
47.6
1.00
-0.
41
CT
602
47.7
599
48.2
1.02
0.86
–1.2
157
39.6
3542
.70.
910.
50–1
.65
TT19
915
.817
614
.21.
140.
90–1
.46
1510
.48
9.8
1.19
0.45
–3.2
0
CT
+ TT
801
63.5
775
62.4
1.05
0.89
–1.2
372
50.0
4352
.40.
960.
54–1
.69
XPC
rs27
3353
4G
G34
027
.631
125
.41.
00-
0.39
5840
.039
47.6
1.00
-0.
66
CG
607
49.2
635
51.8
0.88
0.72
–1.0
664
44.1
3542
.71.
240.
67–2
.28
CC
286
23.2
279
22.8
0.94
0.75
–1.1
823
15.9
89.
81.
880.
74–4
.79
CG
+ C
C89
372
.491
474
.60.
900.
75–1
.07
8760
.043
52.4
1.36
0.77
–2.4
2
XPC
rs85
16TT
771
61.1
753
60.3
1.00
-0.
8510
673
.666
83.5
1.00
-0.
76
Cancer Causes Control. Author manuscript; available in PMC 2011 February 1.
NIH
-PA Author Manuscript
NIH
-PA Author Manuscript
NIH
-PA Author Manuscript
Agalliu et al. Page 18
Cau
casi
ans
Afr
ican
-Am
eric
an
Cas
esC
ontr
ols
Cas
esC
ontr
ols
Gen
eSN
PG
enot
ype
N%
N%
OR
†95
% C
IPe
rmut
ed P
*N
%N
%O
R†
95%
CI
Perm
uted
P*
CT
425
33.7
436
34.9
0.95
0.81
–1.1
338
26.4
1316
.51.
730.
83–3
.60
CC
665.
260
4.8
1.08
0.75
–1.5
5-
--
--
-
CT
+ C
C49
138
.949
639
.70.
970.
83–1
.14
XRC
C1
rs17
9978
2C
C10
9888
.110
7186
.71.
00-
0.23
131
89.7
7286
.81.
00-
0.60
CT
143
11.5
158
12.8
0.88
0.69
–1.1
215
10.3
910
.80.
970.
38–2
.46
TT5
0.4
60.
50.
820.
25–2
.68
--
22.
4-
-
CT
+ TT
148
11.9
164
13.3
0.88
0.69
–1.1
115
10.3
1113
.20.
770.
32–1
.86
XRC
C1
rs25
487
GG
522
41.5
481
38.8
1.00
-0.
7710
371
.553
64.6
1.00
-0.
83
AG
576
45.8
590
47.6
0.90
0.76
–1.0
737
25.7
2733
.00.
670.
36–1
.25
AA
159
12.7
169
13.6
0.87
0.68
–1.1
14
2.8
22.
40.
970.
16–5
.84
AG
+ A
A73
558
.575
961
.20.
890.
76–1
.05
4128
.529
35.4
0.69
0.38
–1.2
7
XRC
C1
rs25
489
GG
1120
90.0
1145
91.4
1.00
-0.
2613
793
.876
91.6
1.00
-0.
61
AG
121
9.7
106
8.5
1.17
0.87
–1.5
39
6.2
78.
40.
590.
20–1
.76
AA
30.
22
0.2
1.55
0.26
–9.2
7-
--
--
-
AG
+ A
A12
410
.010
88.
61.
170.
89–1
.54
XRC
C1
rs28
5450
9C
C79
863
.477
762
.81.
00-
0.66
9867
.656
70.0
1.00
-0.
21
AC
406
32.3
400
32.3
0.99
0.83
–1.1
739
26.9
2328
.81.
090.
57–2
.08
AA
554.
461
4.9
0.88
0.60
–1.2
88
5.5
11.
32.
940.
34–2
5.66
AC
+ A
A46
136
.646
137
.20.
970.
83–1
.14
4732
.424
30.0
1.19
0.64
–2.2
1
XRC
C1
rs91
5927
AA
400
31.8
409
32.8
1.00
-0.
7362
42.8
3038
.01.
00-
0.41
AG
622
49.4
618
49.6
1.03
0.86
–1.2
354
37.2
3848
.10.
790.
42–1
.50
GG
238
18.9
220
17.6
1.11
0.88
–1.3
929
20.0
1113
.91.
320.
56–3
.11
Cancer Causes Control. Author manuscript; available in PMC 2011 February 1.
NIH
-PA Author Manuscript
NIH
-PA Author Manuscript
NIH
-PA Author Manuscript
Agalliu et al. Page 19
Cau
casi
ans
Afr
ican
-Am
eric
an
Cas
esC
ontr
ols
Cas
esC
ontr
ols
Gen
eSN
PG
enot
ype
N%
N%
OR
†95
% C
IPe
rmut
ed P
*N
%N
%O
R†
95%
CI
Perm
uted
P*
AG
+ G
G86
068
.383
867
.21.
050.
89–1
.24
8357
.249
62.0
0.92
0.51
–1.6
5
Tota
l num
ber o
f cas
es a
nd c
ontro
ls in
bot
h C
auca
sian
s and
Afr
ican
-Am
eric
ans v
ary
by S
NPs
due
to m
issi
ng g
enot
ype
data
.
† OR
s and
95%
CI a
re a
djus
ted
for a
ge a
t dia
gnos
is (c
ases
) and
age
at r
efer
ence
dat
e (c
ontro
ls).
* Perm
uted
P-v
alue
s are
for t
he c
o-do
min
ant m
odel
s (2
degr
ees o
f fre
edom
) and
pre
sent
the
adju
sted
P-v
alue
s for
mul
tiple
com
paris
ons u
sing
a p
erm
utat
ion
proc
edur
e (s
ee st
atis
tical
met
hods
for d
etai
ls).
Cancer Causes Control. Author manuscript; available in PMC 2011 February 1.
NIH
-PA Author Manuscript
NIH
-PA Author Manuscript
NIH
-PA Author Manuscript
Agalliu et al. Page 20
Tabl
e 3
Ass
ocia
tions
bet
wee
n SN
Ps in
DN
A re
pair
gene
s and
clin
ical
feat
ures
of p
rost
ate
canc
er a
mon
g C
auca
sian
s
Gle
ason
Sco
reC
ontr
ols
Cas
es* :
Gle
ason
scor
e 2–
6 or
7 (3
+4)
Cas
es* :
Gle
ason
scor
e 7
(4+3
) or
8–10
p-va
lue
OR
1≠ O
R2
Gen
eSN
PG
enot
ype
N%
N%
OR
1†95
% C
IN
%O
R2†
95%
CI
BRC
A2rs
1448
48TT
654
52.6
562
52.5
1.00
-92
47.2
1.00
-
GT
500
40.2
416
38.9
0.99
0.83
–1.1
881
41.5
1.16
0.84
–1.6
00.
34
GG
897.
292
8.6
1.32
0.95
–1.8
322
11.3
1.83
1.09
–3.0
80.
22
BRC
A2rs
1801
406
AA
563
45.2
534
50.4
1.00
-98
50.5
1.00
-
AG
556
44.6
415
39.2
0.75
0.63
–0.9
085
43.8
0.86
0.63
–1.1
80.
42
GG
127
10.2
110
10.4
0.87
0.65
–1.1
711
5.7
0.48
0.25
–0.9
30.
08
ERC
C2
rs13
181
TT48
039
.141
840
.41.
00-
8443
.51.
00-
GT
571
46.5
492
47.5
0.96
0.80
–1.1
582
42.5
0.80
0.57
–1.1
10.
28
GG
177
14.4
126
12.2
0.75
0.57
–0.9
927
14.0
0.80
0.50
–1.2
80.
81
ERC
C2
rs17
9979
3G
G52
743
.245
043
.11.
00-
9247
.71.
00-
AG
528
43.2
490
47.0
1.06
0.88
–1.2
784
43.5
0.88
0.64
–1.2
10.
26
AA
166
13.6
103
9.9
0.67
0.50
–0.8
917
8.8
0.54
0.31
–0.9
30.
45
Tum
or S
tage
Con
trol
sC
ases
* : L
ocal
ized
Sta
geC
ases
* : R
egio
nal/D
ista
nt S
tage
p-va
lue
OR
1 ≠O
R2
Gen
eSN
PG
enot
ype
N%
N%
OR
1†95
% C
IN
%O
R2†
95%
CI
BRC
A2rs
1448
48TT
654
52.6
512
51.6
1.00
-14
351
.81.
00-
GT
500
40.2
393
39.6
1.02
0.85
–1.2
310
538
.01.
000.
75–1
.32
0.85
GG
897.
288
8.9
1.37
0.99
–1.9
028
10.1
1.57
0.98
–2.5
10.
57
BRC
A2rs
1801
406
AA
563
45.2
495
50.5
1.00
-14
050
.51.
00-
AG
556
44.6
389
39.7
0.76
0.64
–0.9
211
240
.40.
790.
60–1
.04
0.84
Cancer Causes Control. Author manuscript; available in PMC 2011 February 1.
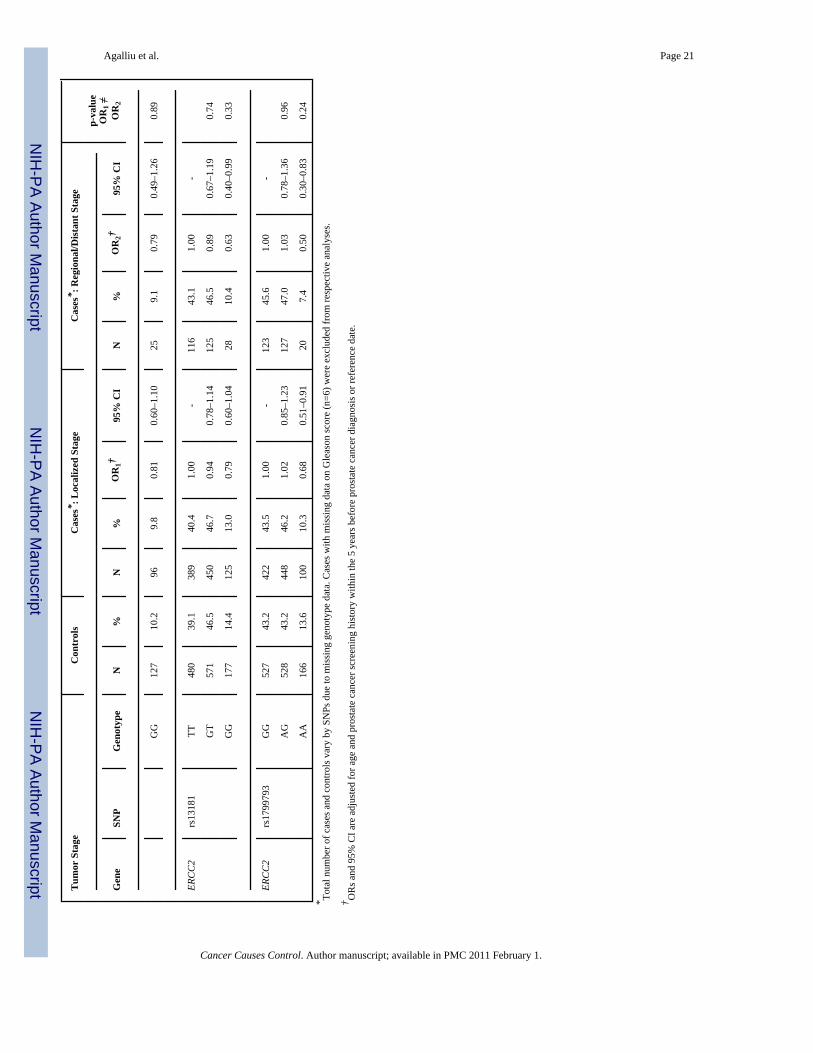
NIH
-PA Author Manuscript
NIH
-PA Author Manuscript
NIH
-PA Author Manuscript
Agalliu et al. Page 21
Tum
or S
tage
Con
trol
sC
ases
* : L
ocal
ized
Sta
geC
ases
* : R
egio
nal/D
ista
nt S
tage
p-va
lue
OR
1 ≠O
R2
Gen
eSN
PG
enot
ype
N%
N%
OR
1†95
% C
IN
%O
R2†
95%
CI
GG
127
10.2
969.
80.
810.
60–1
.10
259.
10.
790.
49–1
.26
0.89
ERC
C2
rs13
181
TT48
039
.138
940
.41.
00-
116
43.1
1.00
-
GT
571
46.5
450
46.7
0.94
0.78
–1.1
412
546
.50.
890.
67–1
.19
0.74
GG
177
14.4
125
13.0
0.79
0.60
–1.0
428
10.4
0.63
0.40
–0.9
90.
33
ERC
C2
rs17
9979
3G
G52
743
.242
243
.51.
00-
123
45.6
1.00
-
AG
528
43.2
448
46.2
1.02
0.85
–1.2
312
747
.01.
030.
78–1
.36
0.96
AA
166
13.6
100
10.3
0.68
0.51
–0.9
120
7.4
0.50
0.30
–0.8
30.
24
* Tota
l num
ber o
f cas
es a
nd c
ontro
ls v
ary
by S
NPs
due
to m
issi
ng g
enot
ype
data
. Cas
es w
ith m
issi
ng d
ata
on G
leas
on sc
ore
(n=6
) wer
e ex
clud
ed fr
om re
spec
tive
anal
yses
.
† OR
s and
95%
CI a
re a
djus
ted
for a
ge a
nd p
rost
ate
canc
er sc
reen
ing
hist
ory
with
in th
e 5
year
s bef
ore
pros
tate
can
cer d
iagn
osis
or r
efer
ence
dat
e.
Cancer Causes Control. Author manuscript; available in PMC 2011 February 1.