Olfactory bulb proteins linked to olfactory memory in C57BL/6J mice
Upload
independentCategory
view
0download
0
ORIGINAL PAPER
John McCallum Æ Andrew Clarke
Meeghan Pither-Joyce Æ Martin Shaw Æ Ruth Butler
Don Brash Æ John Scheffer Æ Ian Sims
Sjaak van Heusden Æ Masayoshi Shigyo
Michael J. Havey
Genetic mapping of a major gene affecting onion bulb fructan content
Received: 13 October 2005 / Accepted: 14 December 2005 / Published online: 11 January 2006� Springer-Verlag 2006
Abstract The non-structural dry matter content of onionbulbs consists principally of fructose, glucose, sucroseand fructans. The objective of this study was to under-stand the genetic basis for the wide variation observed inthe relative amounts of these carbohydrates. Bulb car-bohydrate composition was evaluated in progeny fromcrosses between high dry matter storage onion varietiesand sweet, low dry matter varieties. When samples were
analysed on a dry weight basis, reducing sugar andfructan content exhibited high negative correlations andbimodal segregation suggestive of the action of a majorgene. A polymorphic SSR marker, ACM235, was iden-tified which exhibited strong disequilibrium with bulbfructan content in F2:3 families from the ‘W202A’ ·‘Texas Grano 438’ mapping population evaluated in twoenvironments. This marker was mapped to chromosome8 in the interspecific population ‘Allium cepa · A. roylei’.Mapping in the ‘Colossal Grano PVP’ · ‘Early Long-keeper P12’ F2 population showed that a dominantmajor gene conditioning high-fructan content lay in thesame genomic region. QTL analysis of total bulb fructancontent in the intraspecific mapping population‘BYG15-23’ · ‘AC43’ using a complete molecular mar-ker map revealed only one significant QTL in the samechromosomal region. This locus, provisionally namedFrc, may account for the major phenotypic differences inbulb carbohydrate content between storage and sweetonion varieties.
Abbreviations DM: Dry matter content Æ SSC: Solublesolids content Æ PCA: Principal components analysisREML: Restricted maximum likelihood Æ SSCP:Single-stranded conformation polymorphism
Introduction
Onions have been valued over millennia not only fortheir culinary qualities but also for their medicinal value,which has been confirmed by modern medical science(Griffiths et al. 2002). Selection by growers and breedershas produced cultivars with widely varying adaptation,bulb size, sweetness, storability and processing quality,with correspondingly large variation in bulb carbohy-drate composition. Bulbs of onion and other Alliumspecies store fructans, fructose polysaccharides formedby the cumulative addition of a fructosyl group to a
Communicated by P. Langridge
J. McCallum (&) Æ M. Pither-Joyce Æ M. Shaw Æ R. ButlerNew Zealand Institute for Crop and Food Research Limited,Private Bag 4704, Christchurch, New ZealandE-mail: [email protected].: +64-3-3256400Fax: +64-3-3252074
A. ClarkeInstitute of Molecular BioSciences, Massey University, Private Bag11 222, Palmerston North, New Zealand
D. BrashNew Zealand Institute for Crop and Food Research Limited,Private Bag 11600, Palmerston North, New Zealand
J. SchefferNew Zealand Institute for Crop and Food Research Limited,Cronin Rd, RD 1, Pukekohe, New Zealand
I. SimsIndustrial Research Limited, PO Box 31 310, Lower Hutt,New Zealand
S. van HeusdenLaboratory of Plant Breeding, Department of Plant Sciences,Wageningen University & Research Centre, AJ, Wageningen,The Netherlands
M. ShigyoFaculty of Agriculture, Yamaguchi University,753-8515, Yamaguchi, Japan
M. J. HaveyAgricultural Research Service, USDA, Departmentof Horticulture, , University of Wisconsin,1575 Linden Drive, Madison,WI 53706, USA
Theor Appl Genet (2006) 112: 958–967DOI 10.1007/s00122-005-0199-5

sucrose molecule, which also function as protectantsagainst cold and drought stress (Ritsema and Smeekens2003). Onions are a major source of dietary fructans,contributing 25% of the average American intake(Moshfegh et al. 1999). Fructans enhance the value ofonion as a functional food by conferring prebioticproperties and lowering blood lipid and insulin levels(Ritsema and Smeekens 2003).
Fructans, glucose, fructose and sucrose comprise themajority (65–80%) of onion bulb dry matter content(Darbyshire and Henry 1978). Dry matter content (DM)exhibits wide genetic variation, from around 6% insweet onions up to over 25% in dehydration varieties(Jones and Mann 1963) and is commonly estimatedindirectly as soluble solids content (SSC) by refractom-etry (Mann and Hoyle 1944). Although higher DM isassociated with higher total fructan content, higherdegree of polymerisation (DP) and lower content offructose, glucose and sucrose (Darbyshire and Henry1979), the relationship between carbohydrate contentand bulb water content is poorly understood (Sinclairet al. 1995a, b).
Onion contains fructans with DP 3–15 of the inulinneo-series, in which b(1–2)-linked fructose chains can beattached to the fructose C1 or the glucose C6 of thesucrose starter unit (Darbyshire and Henry 1978; Ernstet al. 1998; Vijn et al. 1997). Comparative chromato-graphic analyses of bulb fructo-oligosaccharides fromsweet, storage and dehydrator-type cultivars have shownthat C6-linked (neokestose) derivatives predominateover C1-linked (1-kestose) types and that cultivar dif-ferences are primarily quantitative (Shiomi et al. 1997).Fructan biosynthesis is initiated by the enzyme sucrose-sucrose 1-fructosyltransferase (SS1FT), which catalysesthe formation of 1-kestose from sucrose (Vijn et al.1998). Chain elongation is catalysed by fructan:fructan6G-fructosyltransferase (6G-FFT) and fructan:fructan1-fructosyltransferase (1-FFT) activities. An onionfructan:fructan fructosyltransferase cloned by Vijn et al.(1998) was subsequently shown to be a bi-functionalenzyme possessing both 6G-FFT and 1-FFT activitiescapable of producing the entire range of fructans ob-served in onion (Fujishima et al. 2005; Ritsema et al.2003). In vitro (Kahane et al. 2001a) and field-based(Kahane et al. 2001b) studies of bulb fructan accumu-lation during development have shown that lines withhigh DM continue to accumulate fructan throughoutbulbing but low DM lines plateau early, suggestingstronger sink strength in high DM lines.
Onion bulb carbohydrate content is highly heritable.Several studies have obtained broad-sense heritabilityestimates of 0.6–0.83 for bulb SSC and also reportedsignificant correlation with other traits such as bulb sizeand pungency (Galmarini et al. 2001; Kadams andNwasike 1986; Lin et al. 1995; McCollum 1968; Simon1995). Many dehydration onion breeding programmeshave also made substantial progress in raising DMthrough selection (Wall and Corgan 1999).
Onion is an outcrossing, biennial diploid(2n=2x=16) with a very large genome (32 pg/2n; Jones1990). Genetic analyses in onion have previously beenlimited by laborious breeding systems, population het-erozygosity, limited genetic and DNA sequence re-sources, and poor knowledge of population structure.The only extensive genetic dissection of bulb traits todate has been conducted in the cross ‘BYG15–23’ ·‘AC43’ made between the storage onion ‘Brigham Yel-low Globe’ and the low DM onion ‘Alisa Craig’ (Kinget al. 1998). An initial QTL analysis identified severalgenomic regions affecting DM, soluble solids and othercorrelated traits (Galmarini et al. 2001). A subsequentstudy based on analysis of fructan content from repli-cated field trials confirmed that a genome region con-taining a functionally characterised acid invertase gene(Vijn et al. 1998) was associated with bulb sugar content(Havey et al. 2004).
The objective of this research was therefore to iden-tify genome regions affecting onion bulb carbohydratecomposition in crosses between commercially relevantstorage and sweet onion varieties using PCR-basedmarkers. Analysis of phenotypic variation in severalindependent pedigrees showed common patterns ofvariation, suggesting segregation of a major geneaffecting fructan content. Following identification of alinked marker, the onion linkage map (Martin et al.2005) was used to confirm that a major gene in the samegenome region was the main determinant of fructancontent in all these populations.
Materials and methods
Plant material
Pair- and self-pollinations were carried out by enclosingumbels in perforated plastic bags and introducing blow-fly pupae. Mass pollinations were performed in 1.5 m3
cages with honeybees. General plant husbandry andpost-harvest practices were as described in McCallumet al. (2001a). Field evaluations of F2 populations wereconducted by transplanting three plots of 40 plants eachof the F2, maternal and paternal populations in a 3·3Latin Square design.
The ‘Colossal Grano’ · ‘Early Longkeeper P12’(C·P12) population was derived by self-pollinating anF1 bulb from the pair cross ‘Colossal PVP’ (lot 37018Sunseeds) · ‘Early Longkeeper P12’ (Crop & FoodResearch). Parental and F2 plants were grown hydro-ponically without supplementary lighting in the glass-house at Lincoln, New Zealand (lat 43�39¢), in a highsulphur medium (4 Meq l�1 S) as described previously(McCallum et al. 2002; Randle et al. 1995). Six 18 l tubseach containing nine F2 plants and two tubs of nineplants of each parental line were transplanted in October1999 and 2000, harvested in late January and cured for2 weeks in the glasshouse.
959

The ‘W429A’ · ‘Houston Grano’ F2 population wasderived by self-pollinating a single F1 bulb from the paircross between ‘W429A’ (Goldman et al. 2000) and‘Houston’ (Texas Grano 1025Y; Asgrow VegetableSeeds; Wehner 1999).
The ‘W202A’ · ‘Texas Grano 438’ (W·T) populationwas established by mass-pollinating four bulbs of themale sterile line ‘W202A’ (Goldman et al. 2000) with aselection of 20 bulbs from ‘Texas Grano 438’ (AsgrowVegetable Seeds, lot VGM 2112; Wehner 1999). SelectedF1 bulbs were self-pollinated to generate multiple F1:2
families. Eighty cured F2 bulbs from one F1:2 family(‘47’) were vernalised and self-pollinated to generate 59F2: 3 families for replicated field trials (one quarter of theF2 were sterile due to segregation for fertility restorationat the Ms locus). In spring 2002 these F2:3 families weretransplanted at Pukekohe, New Zealand (lat 37�12¢; 58families) and Lincoln (45 families) in plots of 40 plantsin a randomised block design with three blocks per site.Replication of lines depended on seed availability andaveraged 2.5 at both sites. Parental plots were allocatedin a pseudo-Latinised arrangement to provide estimatesof spatial variation within sites (Timmerman-Vaughanet al. 2005). Single F2 bulbs from another F1:2 family(‘29F’) were evaluated in the field at Lincoln in 2002 asdescribed above.
Carbohydrate analysis
Cured bulbs were stored under ambient conditions andbulb sampling was performed between 8 and 10 weekspost-harvest, as described previously (McCallum et al.2005). Freeze-dried bulb tissues were stored at roomtemperature in a tightly sealed container over silica gelprior to carbohydrate analyses.
For detailed qualitative analysis of fructans in‘W202A’ and ‘Texas Grano 438’, water-soluble carbo-hydrates were separated by reverse-phase HPLC on anAqua C18 column (250·4.0 mm; Phenomenex, NZ).Samples (�0.5 mg in 20 ml H2O) were eluted with waterat a flow rate of 1.0 ml min�1 and the eluant monitoredby differential refractometry. Isomeric oligosaccharideswere identified as described by Sims et al. (1992).
Quantitative analysis of total fructan and free reduc-ing sugar content in freeze-dried samples was conductedaccording to AOAC Method 999.03 (McCleary et al.2000) using a Megazyme Fructan Assay Kit (MegazymeInternational, Bray, Ireland) and control fructan flour.For quantitative HPLC analysis of glucose, fructose,sucrose and DP 3–4 fructo-oligosaccharides, ground,freeze-dried tissue (20 mg) was extracted in 1 ml of 80%v/v ethanol by agitation for 15 min at room temperature,centrifuged (13,000·g for 5 min) and filtered through a0.2 lmMinisart filter. For preliminary HPLC analyses ofthe C·P12 population, juice extracts were prepared frombulb tissue as described by McCallum et al. (2005),diluted by addition of four volumes of ethanol andclarified as above. Carbohydrates in these extracts were
fractionated by HPLC on a 220·4.6 mm AppliedBiosystems (Foster City, CA, USA) Brownlee aminocolumn and 15·3.2 mm NewGuard amino guardcolumn, on a Waters (Milford, MA, USA) liquid chro-matograph (model 626 pump and controller, model717-plus autosampler). The mobile phase was degassedHPLC-grade acetonitrile:water (80:20 v/v for simplesugars and 60: 40 v/v for fructans) at 1.5 ml min-1.Separations were performed at 30�C and sugars weredetected using a refractive index detector (Waters model410). Analytical standards were obtained from Fluka(Buchs, Switzerland) and identification of each sugar wasbased on retention times. Detector response to all sugarswas linear over the concentration 0–10 mg ml-1 andstandards exhibited less than 2% variability in individ-ual concentrations between triplicate injections of thesame sample.
DNA marker development and analysis
DNA was isolated from leaf of individual F2 plants or atleast 25 germinated seedlings of parental and F2:3 lines(1–2 g fresh weight) by the protocol of Aljanabi et al.(1999) with minor modifications. Chloroform:sec octa-nol (24:1) was used instead of phenol/chloroform/iso-amyl alcohol and tissue homogenisation and DNA pelletwashes were performed as described earlier (McCallumet al. 2001b). EST-SSR and SSCP markers were devel-oped and evaluated as described previously (Kuhl et al.2004; Martin et al. 2005; McCallum et al. 2001b). Primersets not reported in these previous publications areshown in Table 1. AFLP analysis was carried outaccording to Vos et al. (1995) with minor modifications.DNA templates (0.15–1 lg) were digested withPst1+Mse1 and ligated with oligonucleotide adaptors.Pre-amplification was carried out with Pst1+A andMse1+C primers and selective amplification was carriedout with three base selective primers PstI (±33P)+ACW and MseI+CNN. Denatured radiolabelledPCR products were resolved by electrophoresis on 6%denaturing gels and detected by autoradiography.Template DNAs were arranged by fructan phenotypeclass to facilitate visual screening of banding patternsassociated with these phenotypes.
DNA templates and genetic map data from theinterspecific Allium cross A. cepa · A. roylei were usedas described by van Heusden et al. (2000a, b). Alliumfistulosum-shallot (A. cepa L. aggregatum group) alienaddition line stocks (Shigyo et al. 1996) were used forchromosomal assignment of markers as described byMartin et al. (2005).
Statistical analysis
Analysis of phenotypic data was carried out usingGenStat 7 (Payne et al. 2003). Tests for departure fromnormality were performed as described in Pearson and
960
Hartley (1970). Principal components analysis was basedon trait correlation matrices. Linkage analysis was per-formed using Joinmap 3.0 (van Ooijen and Voorips2002) using a minimum of LOD 4 to form linkagegroups. QTL mapping by single marker Kruskal–Wallistests and standard interval mapping was performedusing MapQTL (van Ooijen and Maliepaard 2002).Significance thresholds (P<0.05) for QTL mappingwere obtained by permutation testing with 1,000 per-mutations (Churchill and Doerge 1994). Standard errorsof recombination distances were calculated as describedby Weir (1990). Analyses of phenotypic data from theW202A · Texas Grano QTL mapping trial were con-ducted in Genstat (Payne et al. 2003) using a mixedmodel analysis fitted with restricted maximum likelihood(REML). Check plot genotype and genotype for thelinked marker ACM235 were included as fixed effects.Line genotype, block, row and bed were included asrandom effects. Using variance components estimatedwith the REML analysis, narrow-sense heritability wascalculated as described by Timmerman-Vaughan et al.(2005). QTL analysis of total fructan content in thepopulation ‘BYG15-23’ · ‘AC43’ was carried out withmarker data used to construct the latest onion linkagemap (Martin et al. 2005) and phenotypic data fromreplicated field trials reported previously (Havey et al.2004).
Results
Phenotypic evaluations of F2 onion populations provideevidence of major gene action
Phenotyping of F2 bulb carbohydrate content in theC·P12 population was initially conducted by directHPLC of juice samples prepared by homogenisingbulb tissues with an equal volume of water. This is thesampling procedure most widely used for phenotypingonion bulbs for breeder selections and in previousstudies of pungency and SSC. HPLC revealed thatfructose and glucose concentrations were stronglyskewed (coefficient of skewness �b1=1.29, P<0.01 and�b1=0.82, P<0.01, respectively). Exploration of the
correlation structure of the sugar concentrations byprincipal components analysis (PCA) indicated that thefirst principal component (PC) accounted for 58% oftotal trait variation (Table 2) and that weightings ofmonosaccharides in PC1 were in opposite sign to thoseof oligosaccharides. When extracts from freeze-driedbulb tissue were analysed from a further sample of F2
bulbs in the following season a non-overlapping,bimodal segregation was observed for fructose andfructan content (Fig. 1a). The frequency of high-fructanand low-fructan individuals fitted a 3:1 ratio (33/13;v2=0.26, 1 df, P=0.61), suggesting action of a domi-nant single gene. Because of this clearer resolutioninto non-overlapping phenotypic classes, all subsequentphenotyping of bulbs was conducted on freeze-driedsamples.
Subsequent analyses revealed similar bimodal traitdistributions and correlation structures in other onionpedigrees (Table. 2 and 3). Total carbohydrate content,on a dry weight basis, across these populations was inthe range 550–700 mg g�1 dry weight, as reported inprevious studies (Darbyshire and Henry 1979; Jaimeet al. 2001). Evaluations of field-grown single F2 bulbsfromW·T (family 29F), and ‘W429A · Houston Grano’revealed trait distributions that were bimodal (butoverlapping) and skewed toward high fructan and lowreducing sugars (Fig. 1). Inspection of trait correlations(Table 2) revealed consistently high (r�0.9) negativecorrelations between total fructan and fructose contentin these populations but no consistently high correlationof sucrose concentrations with other components. PCAof carbohydrate concentrations in these populations andalso the F3M families evaluated by Havey et al. (2004)showed that the first PC accounted for 60–70% ofphenotypic variation (Table 3). Inspection of theweightings for individual components in the first PCshowed that in all cases fructose and glucose were ofopposite sign to fructans, suggesting that this PC can beinterpreted as a measure of the balance between reduc-ing sugars and fructans. These phenotypic observationssuggested that in all the populations examined, thebalance between fructan and reducing sugar levels isconditioned by a major gene and that there is dominancefor high fructan.
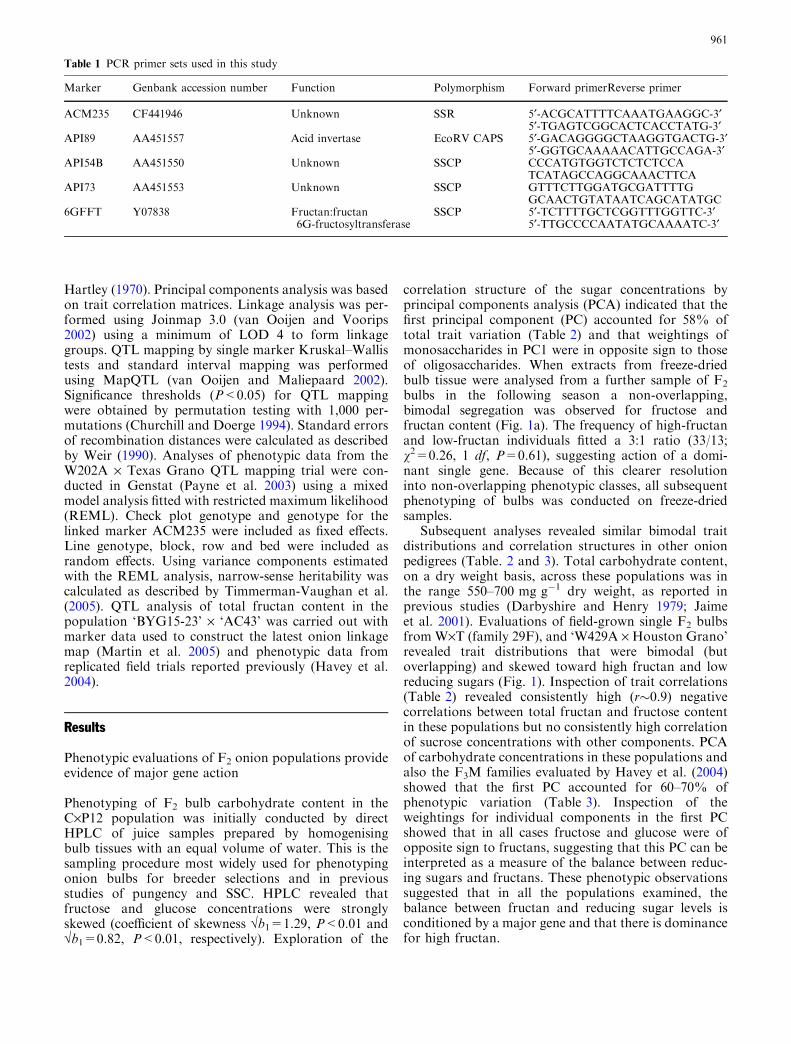
Table 1 PCR primer sets used in this study
Marker Genbank accession number Function Polymorphism Forward primerReverse primer
ACM235 CF441946 Unknown SSR 5¢-ACGCATTTTCAAATGAAGGC-3¢5¢-TGAGTCGGCACTCACCTATG-3¢
API89 AA451557 Acid invertase EcoRV CAPS 5¢-GACAGGGGCTAAGGTGACTG-3¢5¢-GGTGCAAAAACATTGCCAGA-3¢
API54B AA451550 Unknown SSCP CCCATGTGGTCTCTCTCCATCATAGCCAGGCAAACTTCA
API73 AA451553 Unknown SSCP GTTTCTTGGATGCGATTTTGGCAACTGTATAATCAGCATATGC
6GFFT Y07838 Fructan:fructan6G-fructosyltransferase
SSCP 5¢-TCTTTTGCTCGGTTTGGTTC-3¢5¢-TTGCCCCAATATGCAAAATC-3¢
961

Phenotypic evaluation of ‘W202A · Texas Grano 438’mapping population
Reverse-phase HPLC of bulb carbohydrate extractsfrom samples of the ‘W202A’ and ‘Texas Grano 438’parental populations showed a pattern of oligosaccha-rides typical of other onion extracts previously analysedon this system (O’Donoghue et al. 2004). Neokestoseand its related tetrasaccharides were more abundantthan 1-kestose and nystose, as reported in previouscomparisons of onion cultivars (Shiomi et al. 1997) andrelative proportions of these fructo-oligosaccharideswere similar in both parents (Fig. 2). Since theseobservations confirmed that variation in fructan contentwas a quantitative trait, subsequent analysis of themapping population was conducted by enzymatic anal-ysis of total fructan.
F2:3 families derived from ‘W202A · Texas Grano438’ (from F2 family ‘47’) were evaluated at Pukekohe(n=57 F2:3 families) and Lincoln (n=46 F2:3 families)sites in 2002/2003. Total fructan content was bimodaland strongly skewed (coefficient of skewness�b1=�1.09; P<0.01) toward the higher levels of the‘W202A’ parent (Fig. 1). Estimates of narrow-senseheritability (H2) of fructan content from the two siteswere 0.95 (SE=0.010; Pukekohe site) and 0.94(SE=0.015; Lincoln site).
Genetic mapping of the Frc locus
Following the observation of bimodal segregation infructan content in the C·P12 population, attemptswere made to map the putative locus using EST and
Fig. 1 Segregation and correlation of bulb fructan and fructose content in four onion gene mapping populations. Bars on parentpopulation means represent 95% confidence intervals
962

Pst1-Mse1 AFLP markers. Following the screening of15 combinations of Pst1/Mse1 selective primers, wescored 53 polymorphic AFLP markers from ten of theseprimer combinations. Two AFLP bands revealed bythe Pst1-ACT/Mse1-CTA primer combination (pACT-mCTA_7 and pACTmCTA_2), which were absent in theP12 (high fructan) parent, were associated (in repulsion)with fructan content. This was confirmed by formallinkage analysis which showed that these were linked(6.7% recombination; LOD 15.4) and both were signif-icantly associated with carbohydrate content measuredboth on a fresh weight basis (P<0.02) and on a dryweight basis (P<0.00001) by one-way ANOVA.
Although 14 EST markers were scored in this family,heterozygosity of many markers in the parent popula-tions and poor Pst1-AFLP reproducibility preventedeffective mapping and few marker linkages wereobtained. However, a polymorphic, co-dominant SSCP
marker was developed for 6GFFT, the fructosyltrans-ferase involved in fructan chain elongation. This markerrevealed a minimum of four single-stranded DNAbands, consistent with two tightly linked loci (Fig. 3a).Single-marker analyses showed that it was not associ-ated with fructan content (v2=2.6, 2 df, P>0.1). Themarker was unambiguously assigned to Allium cepachromosome 6 using monosomic addition lines(Fig. 3b). No other markers evaluated in this pre-liminary analysis exhibited association with fructanphenotype by single marker analyses.
During evaluation of EST-SSR markers in theW·T F2 family ‘47’ a single-copy (TTTG)4 tetranu-cleotide simple sequence repeat (SSR) marker(ACM235) was identified that was significantly asso-ciated with bulb fructan, fructose and glucose content,but not DM, in both sites (Table 4). Comparison ofmodels fitted by REML, with and without ACM235,
Table 3 Correlation coefficientsfor carbohydrate phenotypes inonion mapping populations
SSC DM (%) Fructan Fructose Glucose
DM (%) Colossal · ELK P12 F2 bulbs 0.80W429A · Houston Grano F2 bulbs 0.45W202A · Texas Grano F2 bulbs 0.89W202A · Texas Grano F2:3 families 0.92
Fructan Colossal · ELK P12 F2 bulbs 0.62 0.43W429A · Houston Grano F2 bulbs 0.59 0.59W202A · Texas Grano F2 bulbs 0.78 0.80W202A · Texas Grano F2:3 families 0.80 0.70
Fructose Colossal · ELK P12 F2 bulbs �0.54 �0.42 �0.88W429A · Houston Grano F2 bulbs �0.47 �0.59 �0.90W202A · Texas Grano F2 bulbs �0.72 �0.77 �0.98W202A · Texas Grano F2:3 families �0.75 �0.64 �0.97
Glucose Colossal · ELK P12 F2 bulbs �0.39 �0.41 �0.45 0.72W429A · Houston Grano F2 bulbs �0.15 �0.30 �0.71 0.69W202A · Texas Grano F2 bulbs �0.55 �0.63 �0.78 0.82W202A · Texas Grano F2:3 families �0.72 �0.61 �0.91 0.94
Sucrose Colossal · ELK P12 F2 bulbs 0.17 0.01 0.56 �0.40 0.02W429A · Houston Grano F2 bulbs 0.01 �0.10 0.19 �0.35 �0.30W202A · Texas Grano F2 bulbs �0.30 �0.37 �0.30 0.14 0.18W202A · Texas Grano F2:3 families 0.00 �0.12 0.19 �0.28 �0.33
Table 2 Summary of first principal components of bulb carbohydrate composition
Population Colossal · ELKP12 F2 1999
Colossal · ELKP12 F2 2000
W202A · TexasGrano 29F F2
W202A · TexasGrano F2:3
W429A ·Houston F2
BYG15-23 · AC43F3 families
Environments Hydroponic Hydroponic Pukekohe2002
Pukekohe andLincoln 2003
Lincoln 2004 Wisconsin, 2 sites
Basis for phenotypes Fresh weight Dry weight Dry weight Dry weight Dry weight Fresh weight, correctedto dry weight
Percentage of variationexplained by PC1
58 65 72 71 68 61
N plants/lines 51 46 93 58 106 48Weightings of PC1Fructose 0.45 0.60 0.47 0.58 0.58 0.24Glucose 0.37 0.43 0.41 0.58 0.53 0.12Sucrose �0.44 �0.35 0.17 �0.21 �0.29 �0.45Total fructan – �0.58 – �0.55 �0.56 –Neokestose �0.49 – �0.46 – – �0.481-Kestose �0.48 – �0.46 – – �0.51Nystose �0.04 – �0.39 – – �0.48
Fructan content is expressed as either total fructan or major fructo-oligosaccharides depending on analysis method used. Dashes denotethat a variable was not measured
963

indicated that the marker could account for 35% ofthe genotypic variance. No polymorphic markerslinked to ACM235 have yet been identified in thisfamily.
We also identified polymorphic markers in W·T fromtwo chromosomal regions previously shown to affectbulb composition by Galmarini et al. (2001). TheEST-SSR marker ACM171, which is closely linked tothe sucrose transporter RFLP locus API66C-E5-6.7/9.5
on chromosome 5 (Martin et al. 2005), showed signifi-cant association with bulb DM (Table 4), as reportedpreviously (Galmarini et al. 2001). Only weak associa-tion of the chromosome 3 acid invertase locus API89with bulb composition was observed (Table 4), in con-trast to observations in ‘BYG15-23 · AC43’(Galmariniet al. 2001; Havey et al. 2004).
The chromosomal location of ACM235 was firstdetermined by mapping in the interspecific population
Fig. 3 a Segregation of a co-dominant SSCP in the 6GFFTgene in ‘Colossal · ELK P12’F2 population. b Assignment ofthe 6-GFFT marker tochromosome 6 using a panel ofindependently isolated A.fistulosum-shallot alien additionlines. Control lanes on left ofgel contained amplicons fromAllium fistulosum (Af) andshallot donor lines
Fig. 2 Proportions ofindividual DP3-5 fructo-oligosaccharides in W202A andTexas Grano 438 determined byRP-HPLC. Values are meansfrom four replicates of each line
Table 4 Results of Kruskal–Wallis single-marker tests of association between genotypes of markers flanking previously reported QTL andbulb composition traits evaluated in ‘W202A · Texas Grano 438’ F2:3 families in two environments
Marker Chromosome v2 (2 df)
Dry matter (%) Sucrose Fructan
Pukekohe Lincoln Pukekohe Lincoln Pukekohe Lincoln
ACM171 3 10.57*** 16.15**** 9.20** 4.19 0.024 1.53API89 5 0.31 0.98 4.30 4.95* 6.09** 2.01ACM235 8 5.18* 1.82 6.10** 3.08 22.9***** 22.935*****
Asterisks denote significance levels: *0.1; **0.05; ***0.01; ****0.0005; *****0.0001
964

A. cepa · A. roylei, in which linkage groups have beenassigned to chromosomes using monosomic additionlines (van Heusden et al. 2000a). ACM235 exhibitedlinkage to AFLP markers assigned to chromosome 8(Fig. 4). Additional co-dominant SSR and EST markersfrom the onion linkage map (Martin et al. 2005) werescored to permit an unambiguous assignment of thismarker to the distal region of the chromosome. Al-though ACM235 was monomorphic in ‘BYG15-123 ·AC43’ it exhibited close linkage in C·P12 (6 cM) and A.cepa · A. roylei (1 cM) to the single-copy (CAT)5SSR marker ACM033. Both SSR markers showedhighly significant associations with fructan, fructose andsucrose content in C·P12 by single marker analyses(v2>13, P<0.005). Interval mapping revealed that thisgenome region contained a major QTL (LOD>6;Fig. 4) explaining 93% of phenotypic variation infructan content. Fructan content was evaluated as aMendelian trait in the 46 C·P12 F2 individuals in whichthis exhibited non-overlapping bimodal segregation.This provided estimates of 10.5±5 cM recombinationfor ACM235 and 16.5±5 cM for ACM033 with theputative locus, which we denote Frc (Fig. 4).
The location of Frc was confirmed by QTLmapping in the population ‘BYG15-123’ · ‘AC43’using least-square means estimates of total bulb fruc-to-oligosaccharide components obtained in replicatedfield trials (Havey et al. 2004) and the more detailedgenetic map recently reported for this population
(Martin et al. 2005), which spans >2 M and all eightchromosomes of the onion genome. The completegenome scan revealed a single QTL (LOD 6) affectingbulb total fructan content in the interval on chromo-some 8 flanked by ACM033 and the SNP markerACABE58, which explained 50.3% of total phenotypicvariation. Galmarini et al. (2001) previously reported aQTL affecting bulb DM in an interval (AJB72-E1-4Y-API54C-E1-15/9) proximal to this position but atthat time the map lacked co-dominant markers distalto AJB72-E1-4Y. A QTL previously reported onchromosome 4 in the interval API18-AOB77 (Haveyet al. 2004) did not exceed the genome-wide signifi-cance threshold (LOD 2.6) using the new map data.
No segregation distortion was evident in the markerslinked to Frc in any of the populations studied. Singlelocus QTL models fitted by interval mapping in C·P12and ‘BYG15-123’ · ‘AC43’ populations showed partialdominance of high fructan content over low, with d/aratios of 0.52 and 0.80, respectively.
Conclusion
It is likely that Frc conditions the principal differences inbulb carbohydrate phenotype between sweet and storageonion types, since fructose quantitatively dominatessweetness in onion. However, the observation that fruc-tan content and DM in the ‘W202A · Texas Grano 438’
ACM033
ACM235pACTmCTA_2
pACTmCTA_7
ACM229ACM125
sucr
ose
fruc
tan
Frc
Colossal x ELK P12
ACM033ACM235
ACABE58
API54B
API73
ACM229
OJ8
A.cepa x A. roylei
ACM033
ACABE58AP12-0-74AJB72-E1-4Y
ACM170API54C-E1-15/9API82-E1-9/9.5API73C-E5-9.5/20
AOB168-E5-10Y
ACM229ACM125AJB32-E1-20/9.5ACACP96API14-H3-4/4.5
API14-H3-6.7/3.0
C15-0-75
API16K-E5-20
AF12-0-80
ACAFM96
fructan
sucroseBYG15-23 x AC43
05101520253035404550556065707580859095100105110115120125130135140145
Fig. 4 Assignment of the Frclocus to chromosome 8 of onionby QTL and linkage analysis ininter- and intraspecific Alliumgene mapping populations.Scale denotes recombinationdistance in Kosambi units.Names of AFLP loci in theinterspecific map are omittedfor clarity. Location of Frc isdenoted by (1) QTL locationbounds for bulb fructan andsucrose content as 1- and 2-LOD intervals from simpleinterval mapping and (2) 1 and2-LOD confidence intervalsdistance of Frc, evaluated as aMendelian character, from SSRloci ACM033 and ACM235.The cross-hatched interval inBYG15-23 · AC43 wasreported by Galmarini et al.(2001) to affect bulb dry matter
965

population are affected by QTL in unlinked genomicregions suggests that interactions between loci may beimportant in determining onion bulb carbohydratephenotype. The expense of developing and triallinglarge replicated onion families does not permit popula-tion sizes sufficiently large for detecting epistasis. Becausebulb carbohydrate content is highly heritable, more rapidand economical progress in genetic analysis of onioncarbohydrate content should be achievable by analysisof larger numbers of individual bulbs from F1, F2, BC ortest-cross populations.
Since none of markers reported in this paper showtight linkage to Frc, it is desirable to tag it moreclosely to enable marker-assisted selection and moredetailed studies of the role and evolution of the locus.Because genomics resources are very limited in Alliumand the pathway of fructan metabolism is wellunderstood, the most efficient means to achieve thismay be through molecular analysis of carbohydratephysiology in high- and low-fructan lines. Studies byShiomi et al. (1997) showed that higher fructan accu-mulation is associated with higher levels of fruc-tan:fructan fructosyltransferase activity, suggesting thatthis enzyme is a candidate for higher sink strength ingenotypes with high fructan accumulation. Studies ofsucrose-metabolising enzymes in developing onionhave reported decreased acid invertase (Lercari 1982)and increased sucrose synthase (Thomas et al. 1997)following induction of bulbing but no comparisons ofdifferent genotypes were included.
The assignment of a major gene conditioning bulbnon-reducing sugar content to onion chromosome 8 issupported by the recent findings of Hang et al. (2004),who reported increased winter content of non-reducingsugars in A. fistulosum monosomic addition lines car-rying shallot (A. cepa aggregatum group) chromosome8. This suggests that the inbred lines developed in thepresent study and the addition lines developed by Shigyoet al. (1997) will provide complementary genetic stocksfor elucidating the biochemical phenotype and molecu-lar nature of the Frc locus.
Acknowledgements This research was funded by the New ZealandFoundation for Research, Science and Technology contractsC02X0203 and C02X0202. We acknowledge the assistance ofMartyn Callaghan, Enza Zaden NZ Ltd, for technical advice, PaulMcCartney and Winston Fahey for bulb and seed production andDoug Grant (Hybrid Seed Company) for population development.
References
Aljanabi SM, Forget L, Dookun A (1999) An improved and rapidprotocol for the isolation of polysaccharide- and polyphenol-free sugarcane DNA. Plant Mol Biol Rep 17:1–8
Churchill GA, Doerge RW (1994) Empirical threshold values forquantitative trait mapping. Genetics 138:963–971
Darbyshire B, Henry RJ (1978) The distribution of fructans inonions. New Phytol 81:29–34
Darbyshire B, Henry RJ (1979) The association of fructans withhigh percentage dry weight in onion cultivars suitable fordehydration. J Sci Food Agric 30:1035–1038
Ernst MK, Chatterton NJ, Harrison PA, Matitschka G (1998)Characterization of fructan oligomers from species of the genusAllium L. J Plant Physiol 153:53–60
Fujishima M, Sakai H, Ueno K, Takahashi N, Onodera S,Benkeblia N, Shiomi N (2005) Purification and characterizationof a fructosyltransferase from onion bulbs and its key role in thesynthesis of fructo-oligosaccharides in vivo. New Phytol165:513–524
Galmarini CR, Goldman IL, Havey MJ (2001) Genetic analyses ofcorrelated solids, flavor, and health-enhancing traits in onion(Allium cepa L.). Mol Genet Genomics 265:543–551
Goldman IL, Schroek G, Havey MJ (2000) History of public onionbreeding programs in the United States. Plant Breed Rev 20:68–103
Griffiths G, Trueman L, Crowther T, Thomas B, Smith B (2002)Onions-a global benefit to health. Phytother Res 16:603–615
Hang TT, Shigyo M, Yaguchi S, Yamauchi N, Tashiro Y (2004)Effect of single alien chromosome from shallot (Allium cepa L.Aggregatum group) on carbohydrate production in leaf blade ofbunching onion (A. fistulosum L.). Genes Genet Syst 79:345–350
Havey MJ, Galmarini CR, Gokce AF, Henson C (2004) QTLaffecting soluble carbohydrate concentrations in stored onionbulbs and their association with flavor and health-enhancingattributes. Genome 47:463–468
van Heusden AW, Shigyo M, Tashiro Y, Vrielink-van Ginkel R,Kik C (2000a) AFLP linkage group assignment to the chro-mosomes of Allium cepa L. via monosomic addition lines.Theor Appl Genet 100:480–486
van Heusden AW, van Ooijen JW, Vrielink-van Ginkel R, VerbeekWHJ, Wietsma WA, Kik C (2000b) A genetic map of aninterspecific cross in Allium based on amplified fragment lengthpolymorphism (AFLPTM) markers. Theor Appl Genet 100:118–126
Jaime L, Martin-Cabrejas M, Molla E, Lopez-Andreu F, EstebanR (2001) Effect of storage on fructan and frucyooligosaccharideof onion (Allium cepa L.). J Agric Food Chem 49:982–988
Jones RN (1990) Cytogenetics. In: Brewster HRRJL (ed) Onionsand allied crops. CRC Press, Boca Raton, pp 199–214
Jones HA, Mann LK (1963) Onions and their allies, 1st edn.Interscience Publishers, London, New York
Kadams AM, Nwasike CC (1986) Heritability and correlationstudies of some vegetative traits in Nigerian local white onion.Plant Breed 97:232–236
Kahane R, Pitiot C, Chamaux C, Vialle-Guerin E, Schweisguth B(2001a) Non-structural carbohydrate composition of long-dayonion in vitro. J Hortic Sci Biotechnol 76:320–326
Kahane R, Vialle-Guerin E, Boukema I, Tzanoudakis D, BellamyC, Chamaux C, Kik C (2001b) Changes in non-structural car-bohydrate composition during bulbing in sweet and high-solidonions in field experiments. Environ Expt Bot 45:73–83
King JJ, Bradeen JM, Bark O, McCallum JA, Havey MJ (1998) Alow-density genetic map of onion reveals a role for tandemduplication in the evolution of an extremely large diploid gen-ome. Theor Appl Genet 96:52–62
Kuhl JC, Cheung F, Yuan Q, Martin W, Zewdie Y, McCallum J,Catanach A, Rutherford P, Sink KC, Jenderek M, Prince JP,Town CD, Havey MJ (2004) A unique set of 11,008 onionexpressed sequence tags reveals expressed sequence and geno-mic differences between the monocot orders Asparagales andPoales. Plant Cell 16:114–125
Lercari B (1982) Changes in invertase activities during the photo-periodically induced bulb formation of onion (Allium cepa L.).Physiol Plant 54:480–484
Lin M, Watson JF, Baggett JR (1995) Inheritance of soluble solidsand pyruvic acid content of bulb onions. J Am Soc Hort Sci120:119–122
Mann L, Hoyle BJ (1944) Use of the refractometer for selectingonion bulbs high in dry matter for breeding. Proc Am Soc HortSci 46:285–292
Martin W, McCallum J, Shigyo M, Jakse J, Kuhl J, Yamane N,Pither-Joyce M, Gokce A, Sink K, Town C, Havey M (2005)Genetic mapping of expressed sequences in onion and in silico
966

comparisons with rice show scant colinearity. Mol GenetGenomics 274:197–204
McCallum JA, Grant DG, McCartney EP, Scheffer J, Shaw ML,Butler RC (2001a) Genotypic and environmental variation inbulb composition of New Zealand adapted onion (Allium cepa)germplasm. N Z J Crop Hortic Sci 29:149–158
McCallum JA, Leite D, Pither-Joyce MD, Havey MJ (2001b)Expressed sequence markers for genetic analysis of bulb onion(Allium cepa. L.). Theor Appl Genet 103:979–991
McCallum JA, Pither-Joyce MD, Shaw ML (2002) Sulfur depri-vation and genotype affect gene expression and metabolism ofonion roots. J Am Soc Hort Sci 127:583–589
McCallum J, Porter N, Searle B, Shaw M, Bettjeman B, McManusM (2005) Sulfur and nitrogen fertility affects flavour of field-grown onions. Plant Soil 274:151–158
McCleary BV, Murphy A, Mugford DC (2000) Measurement oftotal fructan in foods by enzymatic/spectrophotometric meth-od: collaborative study. J AOAC Int 83:356–364
McCollum G (1968) Heritability and genetic correlation of solublesolids, bulb size and shape in white sweet spanish onion. Can JGenet Cytol 10:508–514
Moshfegh AJ, Friday JE, Goldman JP, Ahuja JKC (1999) Presenceof inulin and oligofructose in the diets of Americans. J Nutr129:1407S–1411S
O’Donoghue EM, Somerfield SD, Shaw M, Bendall M, HedderlyD, Eason J, Sims I (2004) Evaluation of carbohydrates inPukekohe Longkeeper and Grano cultivars of Allium cepa.J Agric Food Chem 52:5383–5390
van Ooijen JW, Maliepaard C (2002) MapQTL Version 5.0: Soft-ware for the calculation of QTL positions on genetic maps 5.0.Plant Research International BV, Wageningen
van Ooijen JW, Voorips RE (2002) JoinMap 3.0: software for thecalculation of genetic linkage maps. Plant Research Interna-tional BV, Wageningen
Payne RW, Baird DB, Cherry M, Gilmour AR, Harding SA, KaneAF, Lane PW, Murray DA, Soutar DM, Thompson R, ToddAD, Tunnicliffe Wilson G, Webster R, Welham SJ (2003)GenStat 7.1. Lawes Agricultural Trust
Pearson ES, Hartley HO, (1970) Biometrika tables for statisticians,3rd ed. Cambridge University Press, Cambridge
Randle WM, Lancaster JE, Shaw ML, Sutton KH, Hay RL,Bussard ML (1995) Quantifying onion flavor compoundsresponding to sulfur fertility—sulfur increases levels of alk(en)ylcysteine sulfoxides and biosynthetic intermediates. J Am SocHort Sci 120:1075–1081
Ritsema T, Smeekens S (2003) Fructans: beneficial for plants andhumans. Curr Opin Plant Biol 6:223–230
Ritsema T, Joling J, Smeekens S (2003) Patterns of fructan syn-thesized by onion fructan:fructan 6G-fructosyltransferaseexpressed in tobacco BY2 cells—is fructan:fructan 1-fructosyl-transferase needed in onion? New Phytol 160:61–67
Shigyo M, Tashiro Y, Isshiki S, Miyazaki S (1996) Establishmentof a series of alien monosomic addition lines of Japanese
bunching onion (Allium fistulosum L) with extra chromosomesfrom shallot (A. cepa L. aggregatum group). Genes and GenetSyst 71:363–371
Shigyo M, Iino M, Isshiki S, Tashiro Y (1997) Morphologicalcharacteristics of a series of alien monosomic addition lines ofJapanese bunching onion (Allium Fistulosum L.) with extrachromosomes from shallot (A.cepa L. aggregatum group).Genes Genet Syst 72:181–186
Shiomi N, Onodera S, Sakai H (1997) Fructo-oligosaccharidecontent and fructosyltransferase activity during growth ofonion bulbs. New Phytol 136:105–113
Simon PW (1995) Genetic analysis of pungency and soluble solidsin long-storage onions. Euphytica 82:1–8
Sims IM, Pollock CJ, Horgan R (1992) Structural analysis ofoligomeric fructans from excised leaves of Lolium temulentum.Phytochemistry 31:2989–2992
Sinclair PJ, Blakeney AB, Barlow EWR (1995a) Relationshipsbetween bulb dry matter content, soluble solids concentrationand non-structural carbohydrate composition in the onion(Allium cepa). J Sci Food Agric 69:203–209
Sinclair PJ, Neeson RJ, Barlow EWR (1995b) Osmotic potentialand soluble solids concentration in onion (Allium cepa) bulbs.J Sci Food Agric 69:211–214
Thomas B, P. H, Partis M (1997) Gene regulation in onion. In: JLBurba CG (eds) First international symposium on edible Al-liiaceae, Mendoza, Argentina, 1994. Acta Horticulturae433:375–380
Timmerman-Vaughan GM, Mills A, Whitfield C, Frew T, ButlerR, Murray S, Lakeman M, McCallum J, Russell A, Wilson D(2005) Linkage mapping of QTL for seed yield, yield com-ponents, and developmental traits in pea. Crop Sci 45:1336–1344
Vijn I, Vandijken A, Sprenger N, Vandun K, Weisbeek P, Wiem-ken A, Smeekens S (1997) Fructan of the inulin neoseries issynthesized in transgenic chicory plants (Cichorium Intybus L)harbouring onion (Allium Cepa L) fructan-fructan 6-fructosyl-transferase. Plant J 11:387–398
Vijn I, Vandijken A, Luscher M, Bos A, Smeets E, Weisbeek P,Wiemken A, Smeekens S (1998) Cloning of sucrose—sucrose1—fructosyltransferase from onion and synthesis of structurallydefined fructan molecules from sucrose. Plant Physiol117:1507–1513
Vos P, Hogers R, Bleeker M, Reijans M, Vandelee T, Hornes M,Frijters A, Pot J, Peleman J, Kuiper M, Zabeau M (1995)AFLP—a new technique for DNA fingerprinting. NucleicAcids Res 22:4407–4414
Wall AD, Corgan JN (1999) Heritability estimates and progenytesting of phenotypic selections for soluble solids content indehydrator onion. Euphytica 106:7–13
Wehner TC (1999) Vegetable cultivar descriptions for NorthAmerica; List 25; 1999. Hortscience 34:957–1012
Weir BS (1990) Genetic data analysis: methods for discrete popu-lation data, 1st edn. Sinauer Associates, Sunderland
967
Copyright © 2022 FDOKUMEN