Genetic diversity within and among southern African provenances of Uapaca kirkiana Müell. Årg...
17
Genetic diversity within and among southern African provenances of Uapaca kirkiana Mu ¨ell. A ˚ rg using morphological and AFLP markers Weston F. Mwase • F. K. Akinnifesi • B. Stedje • M. B. Kwapata • A ˚ . Bjørnstad Received: 29 April 2008 / Accepted: 27 May 2010 Ó Springer Science+Business Media B.V. 2010 Abstract Domestication of Uapaca kirkiana Mu ¨ell. Arg is a high priority for improving rural livelihoods of smallholder farmers in southern Africa. Domestication efforts require knowledge of adaptive traits and intra-specific variation. Morphological traits and ampli- fied fragment length polymorphic (AFLP) markers were used to assess genetic variation in twelve provenances of U. kirkiana collected from southern Africa. Assessment of mor- phological traits showed significant differences (P \ 0.05) between provenances. Prove- nances from Zimbabwe and Zambia showed faster growth than those from Malawi (except Phalombe) and Tanzania. Morphological traits exhibited strong genetic differentiation between provenances and within provenances. The degree of provenance differentiation of traits (Q ST = 0.03–0.139, Q ST mean = 0.092) was in the same range with that of AFLP loci (F ST mean = 0.089) detected among provenances and within provenances (0.002 \ F ST \ 0.259). The differentiation for some morphological traits could be attributed to local adaptation and human selection of the U. kirkiana trees at the site of origin. Mean Nei’s (H) genetic diversity of AFLP showed high diversity within the provenances (H = 0.181–0.321, H mean = 0.256). An analysis of molecular variance (AMOVA) revealed higher genetic variation (90.8%) within provenances than among provenances (9.2%). There was no geographical pattern of variation in growth and mor- phological traits among the seed sources. Chipata provenance from Zambia was the most W. F. Mwase (&) M. B. Kwapata Department of Forestry and Horticulture, Bunda College of Agriculture, University of Malawi, P.O. Box 219, Lilongwe, Malawi e-mail: [email protected] F. K. Akinnifesi World Agroforestry Centre (ICRAF), Southern Africa Regional Programme, Chitedze Agricultural Research Station, P.O. Box 30798, Lilongwe 3, Malawi B. Stedje Natural History Museum, Botanical Garden, University of Oslo, P.O. Box 1172, Blindern, 0318 Oslo, Norway A ˚ . Bjørnstad Department of Plant and Environmental Sciences, Norwegian University of Life Sciences, P.O. Box 5003, 1432 A ˚ s, Norway 123 New Forests DOI 10.1007/s11056-010-9206-z
-
Upload
independent -
Category
Documents
-
view
0 -
download
0
Transcript of Genetic diversity within and among southern African provenances of Uapaca kirkiana Müell. Årg...
Genetic diversity within and among southern Africanprovenances of Uapaca kirkiana Muell. Arg usingmorphological and AFLP markers
Weston F. Mwase • F. K. Akinnifesi • B. Stedje •
M. B. Kwapata • A. Bjørnstad
Received: 29 April 2008 / Accepted: 27 May 2010� Springer Science+Business Media B.V. 2010
Abstract Domestication of Uapaca kirkiana Muell. Arg is a high priority for improving
rural livelihoods of smallholder farmers in southern Africa. Domestication efforts require
knowledge of adaptive traits and intra-specific variation. Morphological traits and ampli-
fied fragment length polymorphic (AFLP) markers were used to assess genetic variation in
twelve provenances of U. kirkiana collected from southern Africa. Assessment of mor-
phological traits showed significant differences (P \ 0.05) between provenances. Prove-
nances from Zimbabwe and Zambia showed faster growth than those from Malawi (except
Phalombe) and Tanzania. Morphological traits exhibited strong genetic differentiation
between provenances and within provenances. The degree of provenance differentiation of
traits (QST = 0.03–0.139, QST mean = 0.092) was in the same range with that of AFLP
loci (FST mean = 0.089) detected among provenances and within provenances
(0.002 \ FST \ 0.259). The differentiation for some morphological traits could be
attributed to local adaptation and human selection of the U. kirkiana trees at the site of
origin. Mean Nei’s (H) genetic diversity of AFLP showed high diversity within the
provenances (H = 0.181–0.321, H mean = 0.256). An analysis of molecular variance
(AMOVA) revealed higher genetic variation (90.8%) within provenances than among
provenances (9.2%). There was no geographical pattern of variation in growth and mor-
phological traits among the seed sources. Chipata provenance from Zambia was the most
W. F. Mwase (&) � M. B. KwapataDepartment of Forestry and Horticulture, Bunda College of Agriculture,University of Malawi, P.O. Box 219, Lilongwe, Malawie-mail: [email protected]
F. K. AkinnifesiWorld Agroforestry Centre (ICRAF), Southern Africa Regional Programme,Chitedze Agricultural Research Station, P.O. Box 30798, Lilongwe 3, Malawi
B. StedjeNatural History Museum, Botanical Garden, University of Oslo, P.O. Box 1172,Blindern, 0318 Oslo, Norway
A. BjørnstadDepartment of Plant and Environmental Sciences, Norwegian University of Life Sciences,P.O. Box 5003, 1432 As, Norway
123
New ForestsDOI 10.1007/s11056-010-9206-z
diverse while Mapanzure from Zimbabwe was the least diverse, though it was superior in
height and earliest in fruiting. The pattern of genetic diversity indicates low selection in
some areas and high gene flow which would be counteracting it. Therefore regional and
country collections and conservation strategies should consider differences by focussing on
the main range of the species by paying particular attention to unique populations within
countries.
Keywords AFLP � Conservation � Domestication � Genetic diversity � Provenance �Uapaca kirkiana � UPGMA
Introduction
Uapaca kirkiana Muell. Arg (family Euphorbiaceae) also known as African wild loquat is
a dioecious tree species indigenous to the miombo woodlands of eastern, central and
southern Africa (Ngulube et al. 1995). The tree can grow in the range of 11–13 m with a
juvenile phase of 9–10 years for planting materials derived from sexual propagation while
vegetatively propagated materials can take 2–4 years to fruit (Mhango 2000; Akinnifesi
et al. 2006). The seed is dispersed by humans, birds, bats, monkeys and rodents (Ngulube
et al. 1995). Several studies have reported the utilization of U. kirkiana fresh and processed
fruits as important source of nutrients and income to local communities (Saka et al. 2008;
Ham et al. 2008). The fruit pulp is mixed with maize or millet meal and the mixture is
cooked into porridge. The ripe fruit pulp, broken up and stored in water, is sometimes left
to ferment, making a sweet wine (Mashingaidze et al. 1991).
A regional-wide survey undertaken to determine needs and preference of farmers and
various users in southern Africa identified Uapaca kirkiana as a priority indigenous fruit
tree for utilization, conservation and domestication (Maghembe et al. 1998; Akinnifesi
et al. 2004a). Efforts are in progress to domesticate and commercialise U. kirkiana in
southern Africa forming part of a global initiative to promote indigenous fruit trees in
agroforestry for community livelihood benefits (Akinnifesi et al. 2006; Leakey et al. 2004,
2005). Conservation of genetic diversity is a fundamental goal of conservation biology and
knowledge of the extent and structure of genetic variation in provenances of U. kirkiana is
essential not only for understanding processes of evolution, but also for development of
appropriate and efficient strategies for collection, conservation and domestication of
superior populations.
Several molecular markers are available for studying genetic diversity in plants.
Amplified Fragment Length Polymorphism (AFLP) (Vos et al. 1995) based on the poly-
merase chain reaction (PCR) are spread all over the genomes and are hypervariable. Use of
AFLP markers is advantageous in generation of large number of markers spanning the
whole genome without prior knowledge of the sequence of the genome. Amplified frag-
ment length polymorphism has been used successfully in plant population genetic studies
of tree species (Muluvi et al. 1999; Kremer et al. 2005; Cao et al. 2006). So far, only one
study has been reported on their application in population studies of U. kirkiana (Mwase
et al. 2006b) and another study used random amplified polymorphic DNA (RAPDs) (Agufa
2002). Understanding the morphological and phenological variations among trees, fruits,
seeds and seedlings (Ngulube et al. 1997; Mwase et al. 2006a) from populations derived
from different geographical areas is central to the study of genetic diversity.
In order to detect genetically differentiated lineages that may impact on domestication
and tree improvement programmes of U. kirkiana, combining both morphological and
New Forests
123
genetic criteria parameters is crucial for measuring genetic diversity. The present study is
part of a wider project, which seeks to explore opportunities for the selection, domesti-
cation and cultivation of U. kirkiana in southern Africa (Akinnifesi et al. 2008). The
objective of this study was to assess the level of genetic variation within and among
U. kirkiana provenances of southern Africa based on molecular and morphological tree
attributes, and to recommend appropriate germplasm collection and conservation
strategies.
Materials and methods
Seed sources
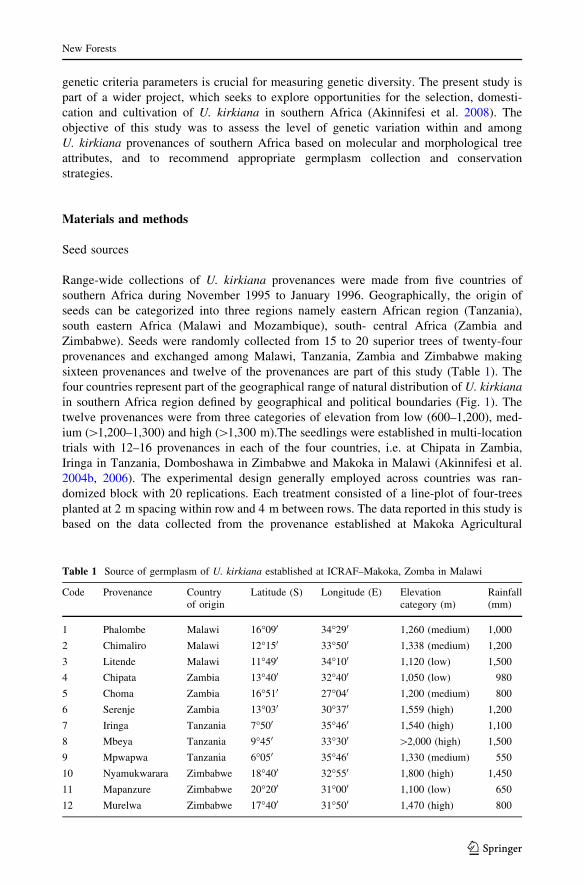
Range-wide collections of U. kirkiana provenances were made from five countries of
southern Africa during November 1995 to January 1996. Geographically, the origin of
seeds can be categorized into three regions namely eastern African region (Tanzania),
south eastern Africa (Malawi and Mozambique), south- central Africa (Zambia and
Zimbabwe). Seeds were randomly collected from 15 to 20 superior trees of twenty-four
provenances and exchanged among Malawi, Tanzania, Zambia and Zimbabwe making
sixteen provenances and twelve of the provenances are part of this study (Table 1). The
four countries represent part of the geographical range of natural distribution of U. kirkianain southern Africa region defined by geographical and political boundaries (Fig. 1). The
twelve provenances were from three categories of elevation from low (600–1,200), med-
ium ([1,200–1,300) and high ([1,300 m).The seedlings were established in multi-location
trials with 12–16 provenances in each of the four countries, i.e. at Chipata in Zambia,
Iringa in Tanzania, Domboshawa in Zimbabwe and Makoka in Malawi (Akinnifesi et al.
2004b, 2006). The experimental design generally employed across countries was ran-
domized block with 20 replications. Each treatment consisted of a line-plot of four-trees
planted at 2 m spacing within row and 4 m between rows. The data reported in this study is
based on the data collected from the provenance established at Makoka Agricultural
Table 1 Source of germplasm of U. kirkiana established at ICRAF–Makoka, Zomba in Malawi
Code Provenance Countryof origin
Latitude (S) Longitude (E) Elevationcategory (m)
Rainfall(mm)
1 Phalombe Malawi 16�090 34�290 1,260 (medium) 1,000
2 Chimaliro Malawi 12�150 33�500 1,338 (medium) 1,200
3 Litende Malawi 11�490 34�100 1,120 (low) 1,500
4 Chipata Zambia 13�400 32�400 1,050 (low) 980
5 Choma Zambia 16�510 27�040 1,200 (medium) 800
6 Serenje Zambia 13�030 30�370 1,559 (high) 1,200
7 Iringa Tanzania 7�500 35�460 1,540 (high) 1,100
8 Mbeya Tanzania 9�450 33�300 [2,000 (high) 1,500
9 Mpwapwa Tanzania 6�050 35�460 1,330 (medium) 550
10 Nyamukwarara Zimbabwe 18�400 32�550 1,800 (high) 1,450
11 Mapanzure Zimbabwe 20�200 31�000 1,100 (low) 650
12 Murelwa Zimbabwe 17�400 31�500 1,470 (high) 800
New Forests
123

Research Station in southern Malawi (15� 300 S and 35� 150 E; altitude 1,029 m above sea
level). The rainfall is unimodal, with most of the rain occurring from November to April.
The total annual rainfall ranges from 560 to 1,200 mm, with a 30-year mean of 1,024 mm.
The soils at the site are classified as Ferric Lixisol (FAO/UNESCO) comprising 46% sand,
46% clay and 8% silt. The clay content in the site increases with soil depth, but major
chemical characteristics are relatively constant to [1 m depth (Akinnifesi et al. 2008).
Measurements of growth and morphological traits
Tree height, diameter at breast height and root collar diameter were measured every year
from 1998 to 2006. Height was measured to the nearest centimetre using a telescopic
measuring pole and diameter to the nearest 0.1 cm using callipers while stem straightness
was scored as described by Cundall et al. (2003). In addition each tree was scored
Fig. 1 Map of southern African countries showing location of twelve provenances as sources of germplasmplanted at ICRAF-Makoka, Zomba in Malawi
New Forests
123
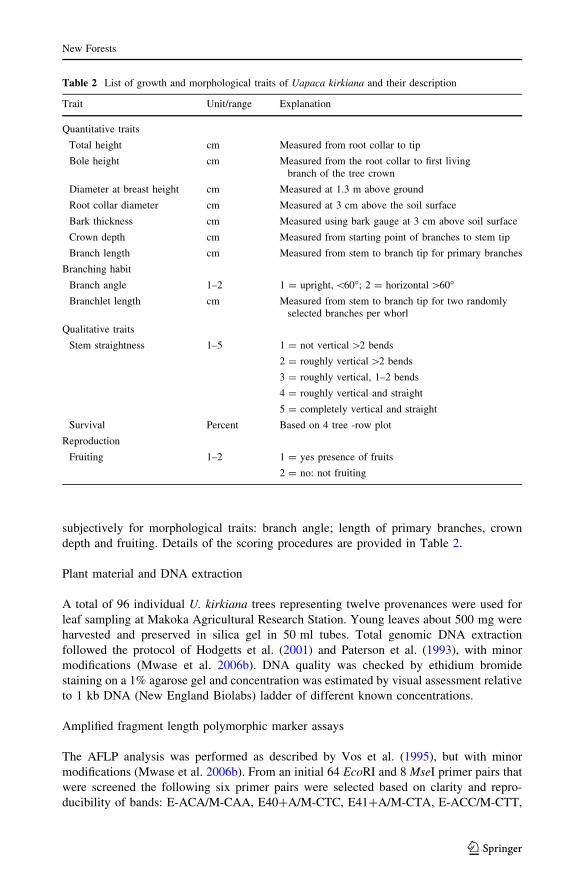
subjectively for morphological traits: branch angle; length of primary branches, crown
depth and fruiting. Details of the scoring procedures are provided in Table 2.
Plant material and DNA extraction
A total of 96 individual U. kirkiana trees representing twelve provenances were used for
leaf sampling at Makoka Agricultural Research Station. Young leaves about 500 mg were
harvested and preserved in silica gel in 50 ml tubes. Total genomic DNA extraction
followed the protocol of Hodgetts et al. (2001) and Paterson et al. (1993), with minor
modifications (Mwase et al. 2006b). DNA quality was checked by ethidium bromide
staining on a 1% agarose gel and concentration was estimated by visual assessment relative
to 1 kb DNA (New England Biolabs) ladder of different known concentrations.
Amplified fragment length polymorphic marker assays
The AFLP analysis was performed as described by Vos et al. (1995), but with minor
modifications (Mwase et al. 2006b). From an initial 64 EcoRI and 8 MseI primer pairs that
were screened the following six primer pairs were selected based on clarity and repro-
ducibility of bands: E-ACA/M-CAA, E40?A/M-CTC, E41?A/M-CTA, E-ACC/M-CTT,
Table 2 List of growth and morphological traits of Uapaca kirkiana and their description
Trait Unit/range Explanation
Quantitative traits
Total height cm Measured from root collar to tip
Bole height cm Measured from the root collar to first livingbranch of the tree crown
Diameter at breast height cm Measured at 1.3 m above ground
Root collar diameter cm Measured at 3 cm above the soil surface
Bark thickness cm Measured using bark gauge at 3 cm above soil surface
Crown depth cm Measured from starting point of branches to stem tip
Branch length cm Measured from stem to branch tip for primary branches
Branching habit
Branch angle 1–2 1 = upright, \60�; 2 = horizontal [60�Branchlet length cm Measured from stem to branch tip for two randomly
selected branches per whorl
Qualitative traits
Stem straightness 1–5 1 = not vertical [2 bends
2 = roughly vertical [2 bends
3 = roughly vertical, 1–2 bends
4 = roughly vertical and straight
5 = completely vertical and straight
Survival Percent Based on 4 tree -row plot
Reproduction
Fruiting 1–2 1 = yes presence of fruits
2 = no: not fruiting
New Forests
123
E33?C/M-CAA and E-AAG/M-CTA. AFLP products were separated on a 6% (w/v)
denaturing polyacrylimide gel and visualised with silver nitrate. The gels were rinsed in
ultra pure water three times and dried at room temperature in fume hood for seven hours.
AFLP fragments were scored as present (1) or absent (0) for each primer pair between 50
and 500 bp and variations in band length were recorded as polymorphism.
Statistical analysis
Analysis of variance for morphological traits was performed across provenances and
separately within each country of origin using the general linear model in MINITAB 14.0.
The morphological traits were compared with AFLP loci through comparison of FST and
QST values after partitioning variance components of ANOVA to obtain QST = rbp2 /
2rwp2 ?rbp
2 where rbp2 is the genotypic variance between provenance and rwp
2 is the geno-
typic variance within provenance (McKay and Latta 2002). It was assumed that variance
between and within provenances is mainly due to additive effects. When QST and FST are
equal, genetic drift is among the main cause of differentiation, while when
QST [ or \ than FST, then selection is acting on the morphological traits. Polymorphism is
the primary source for variation of morphological appearance of plants, the most frequently
used index of polymorphism is gene diversity (H) which is the probability that two alleles
taken at random in a population are different and is calculated with H = 1 -P
pi2 where
pi is the frequency of the ith alllele of the locus. Genetic diversity is a fundamental
component of biodiversity occurring at three fundamental levels of genetic diversity
namely: genetic variation within individuals (heterozygosity), genetic variation among
individuals within a population (HS) and genetic differentiation which is the difference in
the level of polymorphism between the different levels calculated as GST = 1 - (HS/HT).
The standardized mean values of the morphological traits were used to perform cluster
analysis using NTSYS 2.1 (Rohlf 2000) and a dendrogram was constructed using the
unweighted pair group method of arithmetic average (UPGMA). Genetic distances
between provenances were calculated with the squared Euclidean distance (Sneath and
Sokal 1973). It was assumed that the populations were in Hardy–Weinberg equilibrium as
Uapaca kirkiana is a dioecious plant and it is predominantly out-crossing. To estimate
population genetic diversity, the percentage of polymorphic sites (PPL) and Nei’s (1973)
gene diversity (H) were obtained using programme Arlequin 2.0 (Schneider et al. 2000),
average difference between all genotypes in the population (Tajima 1993) were also cal-
culated. Hierarchical structuring of genetic variation within and among provenances was
determined by an analysis of molecular variance (AMOVA) (Excoffier et al. 1992). A
matrix of corrected average pairwise differences between all pairs of provenances gener-
ated by Arlequin was used for constructing dendrograms using UPGMA in NTSYS-pc 2.1
(Rohlf 2000). Simple matching coefficients of similarity (Sneath and Sokal 1973) were
calculated for all pair wise comparisons among provenances. Matrices of Euclidean dis-
similarity coefficients based on morphological and AFLP data sets were tested for corre-
lation using the Mantel test. A matrix of geographical distances among provenances was
obtained (http://www.jan.ucc.nau.edu/-cvm/latlongdist.html) and compared with the cor-
responding simple matching similarity coefficients to investigate possible association
between geographical and genetic distance (MXCOMP in Mantel test in NTSYS). Data
from the AFLP matrix and morphological traits were subjected to principal component
analysis (PCA) (Esbensen 2007) in Unscrambler 9.7 to investigate further relationships
among provenances.
New Forests
123

Results
Morphological traits of provenances
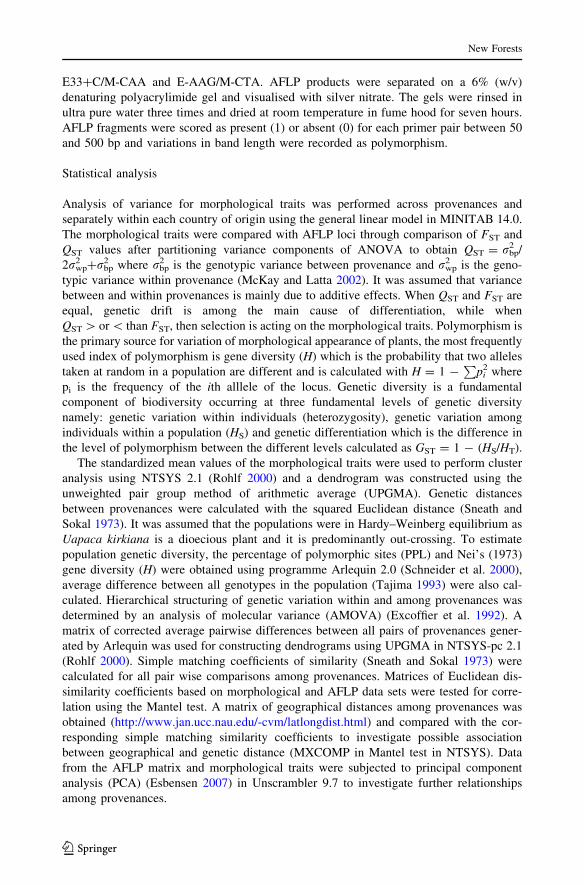
The mean absolute values of the growth and morphological characters used in the char-
acterization are presented in Table 3. Differences within the southern Africa region were
highly significant (P \ 0.001) for diameter at breast height (dbh) and significant
(P B 0.05) for total height, bark thickness, branch length, crown depth and stem
straightness. Provenance differences within countries were not significantly different for
dbh, bole height and root collar diameter. There were no significant differences (P C 0.05)
between the provenances for the traits crown spread, leaf length and breadth, fruiting
and plant survival. The QST values for each morphological trait followed similar trends and
ranged from 0.029 to 0.139 and values were higher than 0.060 except for stem survival and
bole straightness.
There were significant differences (P B 0.05) in plant height, with provenances from
Zimbabwe- Murelwa, Mapanzure and Nyamukwalala being the tallest followed by Choma
from Zambia while Chimaliro from Malawi and Serenje from Zambia were the shortest
(Table 4). Overall, Serenje provenance performed poorly on most traits especially height,
root collar diameter, bark thickness, crown depth and branch length.
Genetic diversity and differentiation
The average genetic differentiation (FST) for the provenances was 0.0922 with individual
population differentiation ranging from 0.002 to 0.259. The six primer combinations
generated a total of 450 loci out of which 90 were polymorphic representing 20% poly-
morphism. The percentage polymorphic loci scored per provenance ranged from 38.9 to
77.7% with an average of 59.4% (Table 5). Nei’s measure of gene diversity (H) showed a
Table 3 Growth and morphological traits of Uapaca kirkiana showing means and QST values
Trait Region Countries withinregion
Provenance withincountry
QST
Total height (cm) 367.00 ± 8.58* 322.26 ± 9. 380* 348.6 ± 16.2*** 0.115
Bole height (cm) 79.66 ± 3.59* 79.66 ± 3.59*** 89.93 ± 6.13ns 0.029
Dbh (cm) 5.38 ± 0.097*** 5.024 ± 0.152*** 5.157 ± 0.238ns 0.139
Root collar diameter (cm) 8.64 ± 0.133ns 6.75 ± 0.210*** 8.057 ± 0.336ns 0.105
Bark thickness (cm) 0.89 ± 0.023* 0.7850 ± 0.037* 0.807 ± 0.0376ns 0.060
Crown depth (cm) 2.65 ± 0.061* 2.65 ± 0.126ns 2.657 ± 0.126ns 0.103
Branch length (cm) 53.73 ± 1.38* 54.43 ± 2.13* 56.45 ± 1.83ns 0.12
Branch angle (degrees) 51.40 ± 0.902ns 55.13 ± 2.30ns 44.93 ± 4.39ns ns
Leaf length (cm) 13.763 ± 0.39ns 13.11 ± 0.568ns 13.85 ± 1.11ns ns
Leaf breadth (cm) 5.86 ± 0.262ns 4.80 ± 0.312ns 5.04 ± 0.57ns ns
Height crown ratio (m) 1.36 ± 0.062* 1.30 ± 0.025ns 1.3125 ± 0.0304ns 0.12
Fruiting (1;0) 1.97 ± 0.012ns 0.075 ± 0.042ns 0.0750 ± 0.0422ns ns
Stem survival (0;1) 2.275 ± 0.085ns 2.40 ± 0.195ns 2.475 ± 0.199ns 0.03
Stem straightness (0–5) 3.39 ± 0.232* 2.27 ± 0.103ns 3.395 ± 0.124ns 0.10
*, *** and ns indicate significance at P \ 0.05, P \ 0.001 and not significantly different at P \ 0.05,respectively
New Forests
123
Ta
ble
4M
ean
val
ues
for
gro
wth
and
morp
ho
log
ical
trai
tso
fa
10
-yea
ro
ldU
ap
aca
kirk
ian
apro
ven
ance
tria
lat
Mak
oka,
Mal
awi
Pro
ven
ance
Ht
db
hrc
db
rth
crd
pb
rcl
brc
ast
rt
Ph
alo
mb
e3
59
.2(2
9.2
)5
.25
(0.4
8)
8.1
0(0
.71
2)
0.8
20
(0.0
512
)2
.730
(0.2
79
)5
8.9
0(3
.36
)5
5.0
(0.7
62
)3
.44
0(0
.27
7)
Chim
alir
o3
16
.1(3
0.2
)5
.07
(0.5
24)
7.8
7(0
.80
4)
0.8
70
(0.0
92)
2.7
6(0
.20
4)
65
.40
(2.9
9)
62
.10
(2.5
9)
3.6
30
(0.2
17
)
Lit
ende
35
6.6
(43
.1)
4.5
8(0
.47
0)
7.4
1(0
.58
6)
0.7
70
(0.0
88)
2.6
6(0
.31
9)
50
.50
(3.6
8)
54
.10
(2.6
6)
3.3
3(0
.29
7)
Chip
ata
34
5.2
(21
.0)
3.6
9(0
.38
4)
8.2
1(0
.72
7)
0.8
0(0
.08
1)
2.2
9(0
.14
7)
47
.40
(3.0
9)
52
.10
(6.9
1)
3.1
0(1
.72
)
Cho
ma
40
8.9
(16
.1)
5.5
3(0
.33
7)
8.8
3(0
.66
4)
0.9
1(0
.07
0)
2.8
8(0
.21
4)
47
.60
(2.7
5)
57
.30
(2.1
8)
3.7
1(0
.51
)
Ser
enje
31
4.2
(31
.9)
4.1
1(0
.32
0)
6.5
90
(0.5
01)
0.6
80
(0.0
55)
2.3
50
(0.2
10
)4
2.9
0(3
.52
)4
9.3
0(3
.29
)3
.05
0(0
.28
3)
Irin
ga
36
6.0
(23
.4)
5.7
2(0
.46
5)
8.6
9(0
.72
4)
0.8
60
(0.0
56)
2.3
6(0
.19
6)
45
.6(2
.40
)4
0.2
0(6
.94
)3
.17
0(0
.20
3)
Mb
eya
34
8.4
(26
.6)
5.2
00
(0.4
90)
8.4
90
(0.6
54)
1.2
3(0
.22
0)
2.9
50
(0.2
11
)5
5.5
0(0
.27
4)
60
.70
(1.9
2)
3.6
1(0
.20
5)
Mp
wap
wa
35
3.7
(17
.8)
5.5
90
(0.3
68)
9.3
6(0
.43
9)
1.0
(0.0
50)
2.9
3(0
.16
9)
54
.80
(2.9
6)
51
.60
(6.8
9)
3.7
(0.1
32
)
Ny
amu
kw
alal
a3
59
.3(3
3.9
)5
.20
(0.5
24)
8.1
2(0
.82
1)
0.8
60
(0.0
95)
2.3
5(0
.29
5)
47
.70
(3.5
5)
49
.60
(6.2
5)
3.0
4(0
.38
5)
Map
anzu
re*
436.4
(37.3
)7.4
1(0
.639)
10.8
8(0
.766)
0.8
50
(0.0
75)
2.7
40
(0.3
62)
51.3
0(3
.40)
53.1
0(6
.26)
3.4
2(0
.389)
Mu
relw
a4
40
.3(2
9.0
)7
.18
(0.5
10)
11
.08
(0.6
66)
0.9
90
(0.0
60)
2.7
60
(0.3
03
)5
6.1
0(3
.63
)5
9.6
0(3
.10
)3
.48
0(0
.38
9)
Ht
tota
ltr
eeh
eigh
t,d
bh
dia
met
erat
bre
ast
hei
gh
t,rc
dro
ot
coll
ard
iam
eter
,b
rth
bar
kth
icknes
s,cr
dp
crow
nd
epth
,b
rcl
bra
nch
len
gth
,b
rca
bra
nch
ang
le,
strt
stra
igh
tnes
s
*F
ruit
ing
ob
serv
ed.
Th
en
um
ber
sin
par
enth
eses
are
stan
dar
der
rors
of
the
mea
ns
of
trai
ts
New Forests
123
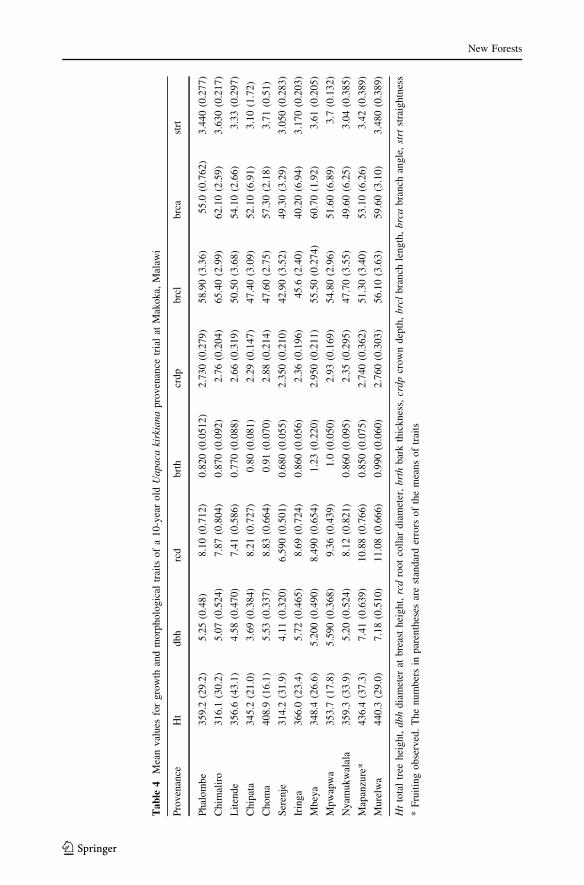
wide range of values from H = 0.181 to H = 0.322 with Mapanzure from Zimbabwe
being least diverse while Chipata from Zambia was the most diverse. Analysis of
molecular variance (AMOVA) (Excoffier et al. 1992) revealed that 90.8% of the genetic
variation is among individuals within provenances. Although variation among provenances
is also highly significant (P \ 0.001), this contributed only 7.7% of the total molecular
variance (Table 6). Partitioning of the overall variance into two hierarchical levels using
AMOVA revealed that differences between countries and altitudes accounted for only 1.6
and 1.0%, respectively. A random permutation indicated that the proportions of variance
attributed to countries and provenances were significant (P = 0.0381, P = 0.000,
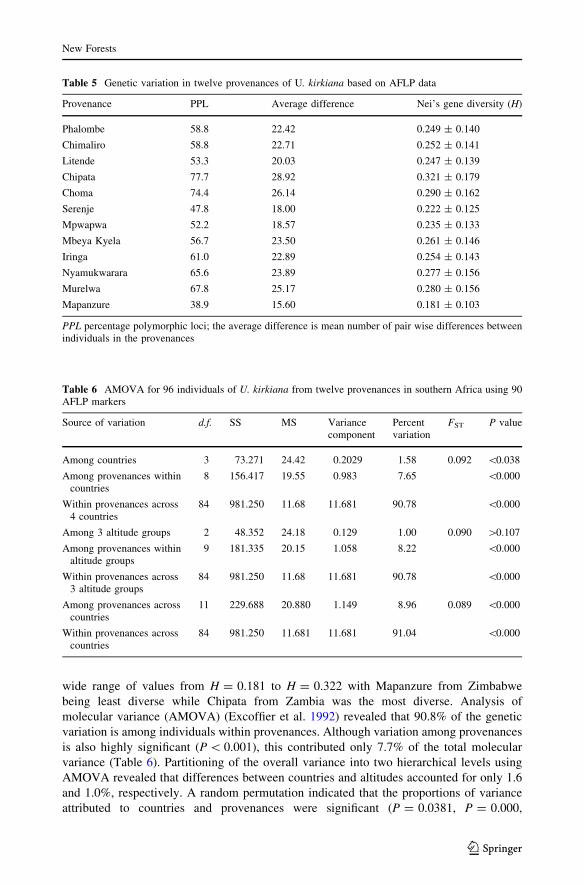
Table 5 Genetic variation in twelve provenances of U. kirkiana based on AFLP data
Provenance PPL Average difference Nei’s gene diversity (H)
Phalombe 58.8 22.42 0.249 ± 0.140
Chimaliro 58.8 22.71 0.252 ± 0.141
Litende 53.3 20.03 0.247 ± 0.139
Chipata 77.7 28.92 0.321 ± 0.179
Choma 74.4 26.14 0.290 ± 0.162
Serenje 47.8 18.00 0.222 ± 0.125
Mpwapwa 52.2 18.57 0.235 ± 0.133
Mbeya Kyela 56.7 23.50 0.261 ± 0.146
Iringa 61.0 22.89 0.254 ± 0.143
Nyamukwarara 65.6 23.89 0.277 ± 0.156
Murelwa 67.8 25.17 0.280 ± 0.156
Mapanzure 38.9 15.60 0.181 ± 0.103
PPL percentage polymorphic loci; the average difference is mean number of pair wise differences betweenindividuals in the provenances
Table 6 AMOVA for 96 individuals of U. kirkiana from twelve provenances in southern Africa using 90AFLP markers
Source of variation d.f. SS MS Variancecomponent
Percentvariation
FST P value
Among countries 3 73.271 24.42 0.2029 1.58 0.092 \0.038
Among provenances withincountries
8 156.417 19.55 0.983 7.65 \0.000
Within provenances across4 countries
84 981.250 11.68 11.681 90.78 \0.000
Among 3 altitude groups 2 48.352 24.18 0.129 1.00 0.090 [0.107
Among provenances withinaltitude groups
9 181.335 20.15 1.058 8.22 \0.000
Within provenances across3 altitude groups
84 981.250 11.68 11.681 90.78 \0.000
Among provenances acrosscountries
11 229.688 20.880 1.149 8.96 0.089 \0.000
Within provenances acrosscountries
84 981.250 11.681 11.681 91.04 \0.000
New Forests
123
respectively), while the variance attributed to altitude was not significant (P = 0.107).
Overall, levels of genetic diversity within provenances did not vary greatly.
Cluster analyses
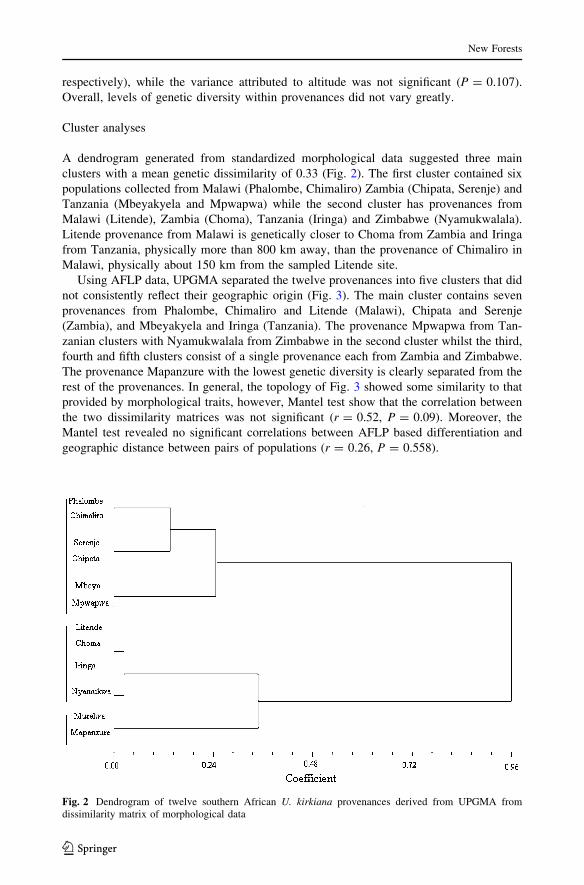
A dendrogram generated from standardized morphological data suggested three main
clusters with a mean genetic dissimilarity of 0.33 (Fig. 2). The first cluster contained six
populations collected from Malawi (Phalombe, Chimaliro) Zambia (Chipata, Serenje) and
Tanzania (Mbeyakyela and Mpwapwa) while the second cluster has provenances from
Malawi (Litende), Zambia (Choma), Tanzania (Iringa) and Zimbabwe (Nyamukwalala).
Litende provenance from Malawi is genetically closer to Choma from Zambia and Iringa
from Tanzania, physically more than 800 km away, than the provenance of Chimaliro in
Malawi, physically about 150 km from the sampled Litende site.
Using AFLP data, UPGMA separated the twelve provenances into five clusters that did
not consistently reflect their geographic origin (Fig. 3). The main cluster contains seven
provenances from Phalombe, Chimaliro and Litende (Malawi), Chipata and Serenje
(Zambia), and Mbeyakyela and Iringa (Tanzania). The provenance Mpwapwa from Tan-
zanian clusters with Nyamukwalala from Zimbabwe in the second cluster whilst the third,
fourth and fifth clusters consist of a single provenance each from Zambia and Zimbabwe.
The provenance Mapanzure with the lowest genetic diversity is clearly separated from the
rest of the provenances. In general, the topology of Fig. 3 showed some similarity to that
provided by morphological traits, however, Mantel test show that the correlation between
the two dissimilarity matrices was not significant (r = 0.52, P = 0.09). Moreover, the
Mantel test revealed no significant correlations between AFLP based differentiation and
geographic distance between pairs of populations (r = 0.26, P = 0.558).
Fig. 2 Dendrogram of twelve southern African U. kirkiana provenances derived from UPGMA fromdissimilarity matrix of morphological data
New Forests
123

Principal component analysis
There was considerable overlapping between individuals from different provenances and
countries as discerned from the principal component analysis performed on the AFLP
matrix. Three clusters were observed (Fig. 4) and the first two principal components
accounted for only 22% of the variation, corresponding to 16% for PC1 and 6% for PC2.
Principal component 2 separated Mapanzure from the rest of the populations. The results
clearly distinguished Mapanzure from the rest of the provenances and seem to be
Fig. 4 PCA plot of twelve provenances of U. kirkiana based on AFLP polymorphic markers
Fig. 3 Dendrogram of twelve provenances using 90 polymorphic AFLP markers based on UPGMA ofcorrected average pairwise differences
New Forests
123
significantly distinct from others while most provenances from Malawi, Tanzania and
Zambia form one group cluster I. Inspection of the loading plots showed that certain alleles
were missing in Mapanzure, however, it also had two markers that distinguished it from the
rest of the provenances. Most of the provenances seem to cluster independently from their
geographical origin. This well exemplified in the case of Nyamukwalala, Chimaliro and
Iringa provenances that are distantly located exhibited close PCA clustering distribution.
The biplot of PCA (figure not shown) obtained with the two marker sets showed mor-
phological traits specifically total height, diameter at breast height, bark thickness and
crown depth loading into the first two principal components and responsible for discrim-
inating some populations by their geographic origin.
Discussion
The geographic source of germplasm for domestication is an important consideration based
on the degree of local adaptation, cost and availability of planting material from different
sites. The variation among populations in the provenance trial might be attributed to genetic
differences caused by the adaptation of the different populations to different environment in
their local sites of origin. The pattern of genetic variation along a geographical distribution
is confounded by specific local environmental conditions. Serenje from Zambia had inferior
traits at the test site, this could be attributed to differences in environmental conditions with
the site of collection; however, it was also one of the poor performers in most traits at a
provenance trial in Chipata (Akinnifesi et al. 2004b) suggesting that it is an inferior
provenance. Apparently, apart from Chimaliro from Malawi, provenances collected from
Zimbabwe (Mapanzure and Murelwa), Zambia (Choma), Tanzania (Iringa) and Malawi
(Phalombe) have good adaptive growth traits at the test site in Malawi. Akinnifesi et al.
(2004b) reported that provenances are more adapted to climatic conditions at their origin,
but the pattern and degree of local adaptation varies among species. In this trial, provenance
ranking in terms of tree height and diameter was not always consistent with results con-
ducted in Zambia where Chipata and Choma provenances had greatest growth (Akinnifesi
et al. 2004b). The good performance of these provenances could be attributed to similarity
of the climatic factors, especially rainfall and elevation between the source of the seed and
test site. The lack of consistency in the results at the two sites indicates the likely presence of
significant provenance and environment interactions.
Minor differences were observed between FST and the range of QST values for some
morphological traits. The morphological traits QST mean = 0.092 was not significantly
different from the AFLP FST mean = 0.089. There were some inconsistent patterns across
provenances but in all traits a trend of higher QST values were found for tree height,
diameter at breast height and branch length suggesting low differential selection for traits
which may be attributed to adaptation at the site of origin. The utility of the AFLP markers
should be considered with caution due to the small sample size of 8 individuals per
provenance which may make it difficult to obtain accurate estimates of allele frequencies
and polymorphism which might result in underestimating the percentage polymorphic loci.
However, studies on similar tree species by Mwase et al. (2006b) used a sample size of 12
individuals per provenance and had mean FST value of 0.079 for the AFLP marker.
Significant levels of variation and moderate levels of differentiation have been reported in
the same species using AFLPs for natural populations collected from Malawi (Mwase et al.
2006b) where AFLP-based diversity (HS) ranged from 0.223 to 0.322 with a mean of 0.27.
Similar mean levels of diversity were found in U. kirkiana after applying RAPD DNA
New Forests
123
markers (Agufa 2002). In this study the mean diversity (HS) of 0.256, the AFLP-based
estimates vary to overall values obtained in studies where RAPDs were used (H range of
0.154–0.250, mean H = 0.192) (Agufa 2002) suggesting that AFLP and RAPDs can
produce different results. The levels of diversity are within the range reported for forest
tree species of similar life history and reproductive ecology such as Sclerocarya birrea,Prunus africana and Vitex fischeri (Muok et al. 2007; Kadu et al. 2006; Lengkeek et al.
2006). The low genetic diversity in Mapanzure could be attributed to genetic drift because
of small population size and forest fragmentation. Like most tropical trees U. kirkiana is
obligatory out crossing and high intrapopulation variation revealed in the AMOVA con-
firms the general observation that differentiation is expected to be very restricted in long-
lived woody, outcrossed and late successional species (Hamrick et al. 1992; Loveless and
Hamrick 1984).
The use of morphological traits is not always the best way to evaluate genetic distance
since the degree of divergence between genotypes at the phenotypic level is not necessarily
correlated with a similar degree of genetic difference (Hamrick and Loveless 1989). The
lack of correlation between morphological and molecular markers shows that most of the
growth and morphological traits are influenced by several genes. The bulk of genetic
diversity is contained within provenances but there is still appreciable differentiation
among provenances. According to Wright (1978) FST values between 0.05 and 0.15
indicate moderate genetic differentiation (Hartl and Clark 1997). The mean FST value of
the provenances was 0.089 which is generally considered to be below the threshold where
genetic drift has a significant impact on the population and level of differentiation could be
mainly due to gene flow. A range of insects possible pollinators of U. kirkiana include bees
(Apis mellifera) and beetles (Dothera bennigseni and Chelomenes lunata) which migrate
only short distance (Ngulube et al. 1998). Monkeys and gorillas disperse fruits through
dung to distant places farther than 20 km contributing high-quality dispersal to favourable
sites over varied and changing environments (Voysey et al.1999). Furthermore, human
transportation of fresh fruits across large distances between forests and towns improves
germplasm exchange through seed dispersal acting as a homogenization factor between
populations (Mwase et al. 2006b). Provenances from Zimbabwe showed higher levels of
differentiation than provenances from Malawi, Zambia and Tanzania. This implies that
provenances of U. kirkiana cannot be considered a single panmictic unit. This may explain
the limited genetic differentiation among provenances within countries although geo-
graphical distance between provenances varies from 95 to 480 km. Although there were no
significant correlations between either morphological or AFLP-based differentiation with
geographical distance between pairs of provenances, geographically close provenances
were more similar than provenances from distant locations. Different levels of human
impacts from origin site of collection might have effects on genetic parameters measured
and could explain the discrepancy between genetic and geographic distances.
The provenance groupings accomplished through UPGMA were inconsistent with the
geographical distribution of the studied provenances. Such results are consistent with the
F-statistics for these areas, indicating that differences among countries have small impli-
cations in the distribution of genetic variation. Comparison of genetic diversity values
between morphological traits and AFLP markers showed that the former ranged from
0.001 to 0.490, while the later from 0.002 to 0.259 (data not shown). The correlations
between the two genetic distances were low and non significant, indicating discrepancy
between the two methods. Several comparisons between molecular and morphological
studies also indicated that these two methods were different and highly variable
(Roldan-Ruiz et al. 2001). Data from common gardens like this one is considered to
New Forests
123
represent genetic variation between individuals, populations and regions. The traits
measured in this study represent a much larger proportion of the tree genome than do the
AFLP loci. While molecular markers show expression of the genotype, morphological
markers are very useful in studying adaptive traits. While acknowledging the importance of
using local provenance for ecological adaptation our studies have shown that there is weak
evidence that variation in average plant height among populations is associated with
environmental gradients. High growth rates observed for provenances from Zambia and
Zimbabwe suggests existence of high within provenance variation which allows the species
to adapt to different environments without major genetic alteration.
The principal component analysis (PCA) shows that the twelve populations segregated
into clusters consistent with results from morphological and AFLP derived dendrograms.
The low percentage (22%) of the variation explained by the first two components in the
PCA could be attributed to high extent of genetic variability between individuals of each
population relative to the low variation among the provenances. Although there were three
clusters in the PCA only the cluster comprising of individuals from Mapanzure was distinct
and this agrees with clusters obtained from UPGMA. The PCA also supports the
dendrograms produced from morphological data, although there are some differences in
the pattern of clustering. This has an important implication suggesting that it is difficult to
predict the genetic diversity of populations based on morphological differences only. The
PCA showed that Mapanzure was the most distinct and Nei’s gene diversity showed least
genetically diverse; however, adaptive growth traits ranked Mapanzure as one of the best
provenances and it was the only population that had started fruiting after 10 years of
growth. Makoka appears to be ideal for growth of Mapanzure provenance considering that
both fall in the same altitude category and receive low rainfall amount. Strategies for
prioritizing conservation of species diversity should consider the level of diversity as well
as the existing threat of populations. The conservation in the different countries must
consider the inevitable anthropogenic impacts of cultivation of forest lands on the distri-
bution of genetic variation of the species. Our results indicate that populations from
Chipata, Choma and Murelwa harbour significant amount of diversity to warrant priority
for conservation. The identification of moderate genetic variation have important impli-
cations for utilization of the species including the development of strategies for
improvement of economically important traits such as fruit size, sweetness, colour, number
of seeds and growth traits such as time to fruiting.
Conclusion
The analysis of genetic diversity of southern Africa provenances of U. kirkiana will assist
in conserving the diversity of the species. The results show a moderate degree of differ-
entiation between provenances in both molecular and morphological traits. The QST values
were slightly lower than FST values though not significantly different suggesting com-
plementarities in use of results from morphological and molecular markers. Existence of
higher level of variation within and between populations suggests a vast genetic base
available for selection while high variation within provenances suggests that sampling
from a few populations within a country may capture a large proportion of variation;
nevertheless, sampling from a wide range among the countries is still advisable. Although
morphological and growth characterisations are influenced by environment, they can be
used hand in hand with molecular markers for revealing genetic variation. The significant
variation in morphological and growth traits in U. kirkiana is attributed to presence of
New Forests
123
adaptive genetic variation related to micro-environmental factors and selection of locally
preferred individuals suggesting that there is great potential to establish high-diversity seed
orchards. When deciding on the most appropriate domestication and improvement strategy
for U. kirkiana, heritability, vegetative propagation methods and genetic correlations
between growth and desirable fruit traits such as fruit size, time to first fruiting, sweetness
and pulp ratio should be investigated under different environments.
Acknowledgments The research grant was provided by Norwegian Research Council for Higher Edu-cation (NUFU) through Plant Biotechnology Project of University of Malawi. We acknowledge Anne-GuriMarøy and Dr. A. Holefors at the Centre for Plant Growth in Controlled Environment (SKP) for technicalassistance. We are indebted to Thomson Chilanga and Jarret Mhango formerly of ICRAF for fruitfuldiscussions.
References
Agufa CAC (2002) Genetic variation in Sclerocarya birrea and Uapaca kirkiana -indigenous fruit trees ofthe miombo woodlands. MSc thesis Jomo Kenyatta University of Agriculture and Technology, NairobiKenya
Akinnifesi FK, Kwesiga F, Mhango J, Mkonda A, Chilanga T, Swai R (2004a) Domesticating prioritymiombo indigenous fruit trees as a promising livelihood option for smallholder farmers in southernAfrica. Acta Hort 632:15–30
Akinnifesi FK, Chilanga TG, Mkonda A, Kwesiga F, Maghembe JA (2004b) Domestication of Uapacakirkiana in southern Africa: preliminary results of screening provenances in Malawi and Zambia. In:Rao MR, Kwesiga FR (eds) Agroforestry impacts on livelihoods in southern Africa: putting researchinto practice. Aventurra Resorts, Warmbaths, pp 85–91
Akinnifesi FK, Kwesiga F, Mhango J, Chilanga T, Mkonda A, Kadu CAC, Kadzere I, Mithofer D, SakaJDK, Sileshi D, Ramadhani T, Dhliwayo P (2006) Towards the development of Miombo fruit trees ascommercial tree crops in Southern Africa. Forests Trees Livelihoods 16:103–121
Akinnifesi FK, Mhango J, Sileshi G, Chilanga T (2008) Early growth and survival of three miombowoodland indigenous fruit tree species under fertilizer, manure and dry-season irrigation in southernMalawi. For Ecol Manage 255:546–557
Cao CP, Finkeldey R, Siregar IZ, Siregar UJ, Gailing G (2006) Genetic diversity within and amongpopulations of Shorea leprosula Miq. and Shorea parvifolia Dyer Dipterocaracaeae in Indonesiadetected by AFLPs. Tree Gen Genomes 2:225–239
Cundall EP, Cahalan CM, Connolly T (2003) Early results of ash (Fraxinus excelsior, L) provenance trialsat sites in England and Wales. Forestry 76(4):385–399
Esbensen KH (2007) Multivariate data analysis -in practice, 5th edn. CAMO ASA, Oslo 598 ppExcoffier L, Smouse PE, Quattro JM (1992) Analysis of molecular variance inferred from metric distances
among DNA haplotypes: application to human mitochondrial DNA restriction data. Genetics 131:179–191
Ham C, Akinnifesi FK, Franzel S, du PS Jordan D, Hansmann C, Ajayi OC, de Cock D (2008) Opportunitiesfor commercialization and enterprise development of Indigenous fruits of southern Africa. In: AkinnifesiFK, Leakey RB, Ajayi OC, Sileshi G, Tchoundjeu Z, Matakala P, Kwesiga F (eds) Indigenous fruit treesin the tropics. Domestication, utilization and commercialization. CAB International, Nairobi 438 pp
Hamrick JL, Loveless MD (1989) The genetic structure of tropical tree populations: associations withreproductive biology. In: Bock JH, Linhart YB (eds) The evolutionary ecology of plants. WestviewPress, Boulder, pp 129–146
Hamrick JL, Godt MJ, Sherman-Broyles SL (1992) Factors influencing levels of genetic diversity in woodyplant species. New For 6:95–124
Hartl DL, Clark AG (1997) Principles of population genetics, 3rd edn. Sinauer Associates, SunderlandHodgetts RB, Aleksiuk MA, Brown A, Clarke C, Macdonald E, Nadeem S, Khasa D (2001) Development of
microsatellite markers for white spruce (Picea glauca) and related species. Theor Appl Genet102:1252–1258
Kadu CAC, Imbunga M, Jamnadass R, Dawson IK (2006) Genetic management of indigenous fruit trees insouthern Africa: a case study of Sclerocarya birrea based on nuclear and chloroplast variation. S Afr JBot 72:421–427
New Forests
123
Kremer A, Caron H, Cavers S, Colpaert N, Gheysen L, Gribel R (2005) Monitoring genetic diversity intropical trees with multilocus dominant markers. Heredity 95:274–280
Leakey RRB, Tchoundjeu Z, Smith RI, Munro RC, Fondoun JM, Kengue J, Anegbeh PO, Atangana AR,Waruhiu AN, Asaah E, Usoro EC, Ukafor V (2004) Evidence that subsistence farmers have domes-ticated indigenous fruits (Dacryodes edulis and Irvingia gabonensis) in Cameroon and Nigeria. Ag-rofor Syst 60:101–111
Leakey RRB, Tchoundjeu Z, Schreckenberg K, Shackleton S, Shackleton C (2005) Agroforestry treeproducts. Targeting poverty reduction & enhanced livelihoods. Int J Agric Sust 3:1–23
Lengkeek AG, Mwangi AM, Agufa CAC (2006) Comparing genetic diversity in agroforestry systems withnatural forest: a case study of the important timber tree Vitex fischeri in central Kenya. Agrofor Syst67:293–300
Loveless MD, Hamrick JL (1984) Ecological determinants of genetic structure in plant populations. AnnRev Ecol Syst 15:65–95
Maghembe JA, Simons AJ, Kwesiga F, Rarieya M (1998) Selecting indigenous trees for domestication insouthern Africa: priority setting with farmers in Malawi, Tanzania, Zambia and Zimbabwe. ICRAF,Nairobi
Mashingaidze K, Musarirambi MT, Tongozha P (1991) Plant genetic resources conservation in Zimbabwe.Mambo Press, Harare, pp 9–15
McKay JK, Latta RG (2002) Adaptive population divergence: markers QTL and traits. Trends Ecol Evol17:285–291
Mhango JL (2000) Soil and nutrient requirements for early growth of Uapaca kirkiana seedlings. In:Bohringer A, Chilanga T, Chirwa PW, Makumba W, Mhango J, Moyo N, Munthali LM, MwabumbaL, Phiri R (eds) Achievements in agroforestry research and development in Malawi. Annual Report2000. SADC-ICRAF, Harare, Zimbabwe, pp 62–67
Muluvi GM, Sprent JI, Soranzo N, Provan J, Odee D, Folkard G, McNicol JW, Powell W (1999) Amplifiedfragment length polymorphism (AFLP) analysis of genetic variation in Moringa oleifera Lam. MolEcol 8:463–470
Muok BO, Matsumura A, Ishii T, Odee DW (2007) Genetic diversity within Sclerocarya birrea populationsin Kenya. J Arid Envir 71:1–11
Mwase WF, Bjørnstad A, Ntupanyama YM, Kwapata MB, Bokosi JM (2006a) Phenotypic variation in fruit,seed and seedling traits of nine Uapaca kirkiana provenances found in Malawi. S Afr For 208:15–21
Mwase WF, Bjørnstad A, Stedje B, Bokosi JM, Kwapata MB (2006b) Genetic diversity of Uapaca kirkianaMuell. Arg. populations as revealed by amplified fragment length polymorphisms (AFLPs). Afr JBiotech 5(13):1205–1213
Nei M (1973) Analysis of gene diversity in subdivided populations. Proc Natl Acad Sci USA 70:3321–3323Ngulube MR, Hall JB, Maghembe JA (1995) Ecology of a miombo fruit tree: Uapaca kirkiana (Euphor-
biaceae). For Ecol Manage 77:107–111Ngulube MR, Hall JB, Maghembe JA (1997) Fruit, seed and seedling variation in Uapaca kirkiana from
natural populations in Malawi. For Ecol Manage 98:209–219Ngulube MR, Hall JB, Maghembe JA (1998) Reproductive ecology of Uapaca kirkiana (Euphorbiaceae) in
Malawi, southern Africa. J Trop Ecol 14:743–760Paterson AH, Brubaker CL, Wendel JF (1993) A Rapid method for extraction of cotton (Gossypium species)
genomic DNA suitable for RFLP or PCR analysis. Plant Mol Biol Rep 11:122–127Rohlf FJ (2000) NTSYS-pc. Numerical Taxonomy and Multivariate analysis system, version 2.1. Exeter
Software, New YorkRoldan-Ruiz I, van Euwijk FA, Gilliland TJ, Dubreuil P, Dillmann C, Lallemand J, De Loose M, Baril CP
(2001) A comparative study of molecular and morphological methods of describing relationshipsbetween perennial ryegrass (Lolium perenne L.) varieties. Theor Appl Gen 103:1138–1150
Saka JDK, Kadzere I, Ndabikunze BK, Akinnifesi FK, Tiisekwa BPM (2008) Product development:nutritional value, processing and utilization of indigenous fruits from the Miombo Ecosystem. In:Akinnifesi FK, Leakey RB, Ajayi OC, Sileshi G, Tchoundjeu Z, Matakala P, Kwesiga F (eds)Indigenous fruit trees in the tropics. Domestication, utilization and commercialization. CAB Interna-tional, Nairobi 438 pp
Schneider S, Roessli D, Excoffier L (2000) Arlequin version 2.0: a software for population genetics dataanalysis. Genetics and Biometry Laboratory, University of Geneva, Switzerland
Sneath PHA, Sokal RR (1973) Numerical taxonomy. The principles and practice of numerical classification.XV. Freeman, San Francisco, p 573
Tajima F (1993) Measurement of DNA polymorphism. In: Takahata N, Clark AG (eds) Mechanisms ofmolecular evolution. Introduction to molecular paleopopulation biology. Sinauer Associates, Sunder-land, pp 37–59
New Forests
123

Vos P, Hogers R, Bleeker M, Reijans M, van der Lee T, Hornes M, Frijters A, Pot J, Peleman J, Kuiper M,Zabeau M (1995) AFLP: a new technique for DNA fingerprinting. Nucleic Acids Res 23:4407–4414
Voysey BC, Mcdonald KE, Rogers ME, Tutin CE, Parnell RJ (1999) Gorillas and seed dispersal in the Lope0
Reserve, Gabon. II: survival and growth of seedlings. J Trop Ecol 15:38–60Wright S (1978) Evolution and genetics of populations: variability within and among natural populations vol
4. University of Chicago Press, Chicago
New Forests
123