Genetic Diversity and Molecular Characterization of Brazilian Wheat Varieties Obtained by...
10
_____________________________________________________________________________________________________ *Corresponding author: E-mail: [email protected]; Journal of Advances in Biology & Biotechnology 4(3): 1-10, 2015; Article no.JABB.18628 ISSN: 2394-1081 SCIENCEDOMAIN international www.sciencedomain.org Genetic Diversity and Molecular Characterization of Brazilian Wheat Varieties Obtained by Microsatellite Markers André Luiz da Silva 1 , Marcelo Berwanger de Oliveira 2 , Elisa Serra Negra Vieira 3 , Volmir Sérgio Marchioro 2 , Francisco de Assis Franco 2 and Ivan Schuster 2* 1 Universidade Paranaense, UNIPAR, Praça Mascarenhas Morais, Umuarama, Brazil. 2 Coodetec. BR 467, km 98. Cascavel, Brazil. 3 Embrapa Floresta, Cx. Postal 319, Colombo, Brazil. Authors’ contributions This work was carried out in collaboration between all authors. Author ALS made the DNA extraction and all the PCR reactions. Authors MBO and ESNV managed the Gene Mapper analysis. Authors VSM and FAF managed the literature searches. Author IS designed the study, analyzed the data and wright the manuscript. All authors read and approved the final manuscript. Article Information DOI: 10.9734/JABB/2015/18628 Editor(s): (1) Joana Chiang, Department of Medical Laboratory Science and Biotechnology, China Medical University, Taiwan. (2) Anil Kumar, Professor & Head (Chair), School of Biotechnology, Devi Ahilya University, Madhya Pradesh, India. Reviewers: (1) Anonymous, Czech Republic. (2) Anonymous, University of Delhi, India. Complete Peer review History: http://sciencedomain.org/review-history/10101 Received 2 nd May 2015 Accepted 29 th June 2015 Published 8 th July 2015 ABSTRACT Aims: Evaluating the genetic diversity and molecular characterization of wheat varieties in Brazil, using microsatellite markers. Study Design: Random sampling of seeds from 32 varieties, was done. Place and Duration of Study: Biotechnology lab, Coodetec, BR 467, km 98. Cascavel, PR, Brazil, between July 2011 to July 2012. Methodology: Thirty-two varieties were evaluated with 23 markers, using capillary gel electrophoresis. After DNA extraction, and gels scoring, the genetic distances were obtained, the clustering by UPGMA method, the frequency of each allele and Probability of Random Identity (PRI). Original Research Article
Transcript of Genetic Diversity and Molecular Characterization of Brazilian Wheat Varieties Obtained by...

_____________________________________________________________________________________________________ *Corresponding author: E-mail: [email protected];
Journal of Advances in Biology & Biotechnology 4(3): 1-10, 2015; Article no.JABB.18628
ISSN: 2394-1081
SCIENCEDOMAIN international
www.sciencedomain.org
Genetic Diversity and Molecular Characterization of Brazilian Wheat Varieties Obtained by Microsatellite
Markers
André Luiz da Silva1, Marcelo Berwanger de Oliveira2, Elisa Serra Negra Vieira3, Volmir Sérgio Marchioro2,
Francisco de Assis Franco2 and Ivan Schuster2*
1Universidade Paranaense, UNIPAR, Praça Mascarenhas Morais, Umuarama, Brazil. 2Coodetec. BR 467, km 98. Cascavel, Brazil.
3Embrapa Floresta, Cx. Postal 319, Colombo, Brazil.
Authors’ contributions
This work was carried out in collaboration between all authors. Author ALS made the DNA extraction
and all the PCR reactions. Authors MBO and ESNV managed the Gene Mapper analysis. Authors VSM and FAF managed the literature searches. Author IS designed the study, analyzed the data and
wright the manuscript. All authors read and approved the final manuscript.
Article Information
DOI: 10.9734/JABB/2015/18628 Editor(s):
(1) Joana Chiang, Department of Medical Laboratory Science and Biotechnology, China Medical University, Taiwan. (2) Anil Kumar, Professor & Head (Chair), School of Biotechnology, Devi Ahilya University, Madhya Pradesh, India.
Reviewers: (1) Anonymous, Czech Republic.
(2) Anonymous, University of Delhi, India. Complete Peer review History: http://sciencedomain.org/review-history/10101
Received 2nd
May 2015 Accepted 29th June 2015
Published 8th
July 2015
ABSTRACT
Aims: Evaluating the genetic diversity and molecular characterization of wheat varieties in Brazil, using microsatellite markers. Study Design: Random sampling of seeds from 32 varieties, was done. Place and Duration of Study: Biotechnology lab, Coodetec, BR 467, km 98. Cascavel, PR, Brazil, between July 2011 to July 2012. Methodology: Thirty-two varieties were evaluated with 23 markers, using capillary gel electrophoresis. After DNA extraction, and gels scoring, the genetic distances were obtained, the clustering by UPGMA method, the frequency of each allele and Probability of Random Identity (PRI).
Original Research Article

Silva et al.; JABB, 4(3): 1-10, 2015; Article no.JABB.18628
2
Results: It was observed two to eight alleles by loci and genetic distances ranging from 0.31 to 0.90. The varieties were grouped into 11 groups. From the estimated PRI, 15 markers were identified that identify all 32 varieties with a maximum of 0.0001% PRI. High variability among wheat varieties was observed and also high efficiency in the identification of varieties with microsatellite markers. Conclusion: This approach can be used in breeding programs and for the protection of intellectual property of wheat varieties breeders.
Keywords: Triticum aestivum; genetic variability; cluster analysis; probability of random identity; plants
protection.
1. INTRODUCTION Genetic diversity is the basis for plant breeding. Thus, knowledge of the genetic diversity of a species has a significant impact on the improvement of crop plants, especially the diversity among elite varieties. In this case the diversity can be used directly in the generation of breeding populations. Knowing the genetic diversity in specific germplasm, one can define how to increase variability in the future. Molecular markers can be used to characterize genetic diversity in germplasm collections, certification of genetic purity of seeds, characterization of varieties, protection of intellectual property in addition to genetic mapping applications, marker assisted selection, prediction of hybrids between other applications [1,2].
Molecular markers can also be used to characterize varieties for protection of intellectual property [3,4,5]. From the observed allele frequencies of molecular markers loci, one can estimate the probability that two samples are of the same variety [2,6]. The Brazilian wheat production is 0.7% of world production that was just over 714 million tons in 2011 [7]. Despite an insignificant production globally, wheat is an important source of income for farmers in Southern Brazil [6]. In this region, wheat is grown annually in about 2 million hectares [8], and is the main option cultivation for the winter. Because of its regional importance, the genetic breeding programs of wheat in the country have obtained increasingly more productive varieties resistant to diseases, and with good grain quality for the industry. Mostly wheat breeding programs in Brazil use traditional methods of selection through phenotypic evaluations. Rarely use the aid of molecular markers in germplasm characterization
or marker assisted selection of plants or progenies. This study aimed to accomplish a genetic diversity analysis and cluster in wheat varieties in Brazil, from the genetic distances obtained by microsatellite markers; and identifying a set of molecular markers for the accurate identification of varieties, from the estimated probability of random identity, using the allele frequencies observed for each locus of molecular markers.
2. MATERIALS AND METHODS 2.1 Plant Material and DNA Analysis Thirty-two Brazilian wheat varieties were used in the analysis (Table 1). For DNA extraction, 200 seeds of each variety were ground, and 50 mg of ground powder was used for DNA extraction [9]. PCR reactions were performed using 23 microsatellite markers (Table 2) with the sense primer fluorescently labeled with 6FAM, PET, VIC or NED. In a final volume of 20 uL, PCR solution contained 75 ng DNA, 3 mM MgCl2, 3.2 mM Tris, 8 mM KCl, 200 uM dNTPs, 0.8 uM of each primer (forward and reverse) and 1 unit of Taq DNA polymerase. Amplifications were performed on Thermo Hybaid thermocycler (Ashford, Middlesex, United Kingdom) set at a cycle of 94ºC for 3 minutes; 45 cycles of 94ºC for 30 seconds, 55ºC for 30 seconds and 72ºC for 45 seconds; and a final cycle at 72ºC for 20 minutes. PCR reactions were performed in singleplex, and the electrophoresis in multiplex. Multiplex was set up by combining markers containing four different fluorescence, in a single sample, by combining 5 uL of each individual amplification product. This initial mixture was withdrawn and diluted with 1uL to 50 uL of ultrapure water. Then 1 ul was transferred to another PCR plate and then added 8.85 uL hi-di formamide and 0.15 uL

Silva et al.; JABB, 4(3): 1-10, 2015; Article no.JABB.18628
3
molecular weight standard 500 LIZ orange staining (Applied Biosystems). The amplified fragments were separated by capillary gel electrophoresis, using the automatic sequencer ABI 3130xl, according to the manufacturer's recommendation. The data were coded with the aid of Gene Mapper program (Applied Biosystems).
2.2 Data Analysis The genetic relationships among varieties were evaluated by means of a similarity matrix obtained using the complement of the similarity index for codominant and multi-allelic data with the help of Genes software [10]. This ratio is obtained by dividing the total number of common alleles by the total number of alleles evaluated in each individual.
The varieties were grouped using hierarchical method UPGMA (Unweighted Pair-Group Mean Average) using STATISTICA software [11]. Genetic informativeness of each marker was assessed by the PIC (Polymorphism Index Content):
n
jijpPIC
1
2
1
where pij is the frequency of the jth allele for the i
th
primer. Allele frequencies were estimated by dividing the number of times each allele appeared in a population of wheat varieties by the total number of alleles observed for each marker. Although wheat is a hexaploid species, it is an allohexaploid, and segregates as a diploid, and there are two alleles at each locus. For homozygotes, the alleles were counted as
Table 1. Wheat varieties used in the study of genetic diversity and their genealogies.
Variety Genealogy
AVANTE PF 89232/2*OR 1 BRS 179 BR 35/PF 8596/3/ PF 772003*2/PF 813//PF 83899 BRS 210 CPAC 89118/3/BR 23//CEP 19/PF 85490 BRS 220 EMBRAPA 16/TB 108 CD 101 AURORA/UP 301//OCEPAR 12 CD 102 IAC 5/ALDAN"S"//CEP 7780 CD 103 PG 864/OCEPAR 14 CD 104 PFAU"S" / IAPAR 17 CD 105 PFAU"S"/2*OCEPAR 14//IAPAR 41 CD 106 PG 864/GENARO CD 107 COC 75*2/BR 23//BR 35 CD 108 TAM 200 / TURACO CD 109 MUNIA/BAGULA CD 110 ANAHUAC 75 / EMBRAPA 27 CD 111 EMBRAPA 27/OCEPAR 18//ANAHUAC 75 CD 112 IOC 905 / PG 877 CD 113 EMBRAPA 27 / OC 946 CD 114 PF 89232 / OC 938 CD 115 OC 926 / OC 935 CD 116 MILAN / MUNIA CD 117 PF 87373 / OC 938 CD 118 VEERY "S"/KOEL//SIREN/3/ARIVCH 92 CD 119 BRS 49 / CDI 0303 CD 120 RUBI / CD105 CD 150 CD 104 / CD 108 FRONTANA FRONTEIRA/MENTANA FUNDACEP 46 CEP 88132/PG 876/3/BR 34//CORRIDON FUNDACEP 50 CEP 88132/PG 876/3/BR 34//CORRIDON FUNDACEP 52 CEP 88132/PG 876/3/BR 34//CORRIDON IPR 85 IAPAR 30/BR 18 ONIX CEP 24/RUBI"S" VANGUARDA OR 1/PARANÁ(RM)

Silva et al.; JABB, 4(3): 1-10, 2015; Article no.JABB.18628
4
two copies, and heterozygous loci each allele was counted once. The total number of alleles corresponds to the number of varieties multiplied by two, since each individual has two alleles at each locus.
The probability of random identity (PRI) was calculated as described by Schuster et al. [2]:
where Pij is the frequency of ith allele in jth loci and n is the number of locus evaluated. The product of the frequencies of alleles is multiplied by 100 to obtain the probability as a percentage. The estimate of PRI was performed for each variety, using the frequencies of alleles observed in each variety at all loci of molecular markers.
Table 2. Microsatellite markers used in the characterization of 32 wheat varieties
Marker1 Core
SSR2
Staining Linkage group.
3
DuPw115 ACG VIC 5B DuPw205 AAG 6FAM 5B DuPw217 AAG NED 3A, 3B DuPw167 AAGCAT 6FAM 6A Xbarc12 TAA 6FAM 3A Xbarc343 No
information PET 4A
Xgwm003 CA VIC 3D Xgwm102 CT NED 2D Xgwm135 GA 6FAM 1A Xgwm149 GA PET 4B, 4D Xgwm155 CT VIC 3A Xgwm160 GA PET 4A Xgwm161 CT NED 3D Xgwm164 CT 6FAM 1A Xgwm165 GA PET 4A,4B,4D Xgwm219 GA PET 6B Xgwm232 GA GA 1D Xgwm247 GA VIC 3A,3B,6R Xgwm257 GT 6FAM 2B Xgwm304 CT VIC 5A Xgwm413 GA 6FAM 1B Xgwm44 GA VIC 7D Xgwm526 CT NED 2A,2B,7A,
7B 1 The sequences of the primers are available in
http://wheat.pw.usda.gov/GG2/index.shtml 2 Repeating unit of the microsatellite
3 Source: USDA (http://wheat.pw.usda.gov/GG2/index.shtml)
For rare alleles (very low frequency), the information was used conservatively, replacing the frequency of rare alleles for 5/2n, where n is the number of varieties [12]. A minimum set of markers was selected for the characterization of each variety and all varieties at the same time. For each variety to be characterized with the least possible number of markers, the markers that showed the lower frequency alleles in the variety were selected. The minimum number of primers needed for the characterization of a variety is a set of primers needed to obtain PRI equal or less than 0.0001%, that means a different variety may display the same set of alleles at this marker in less than 0.0001% of cases.
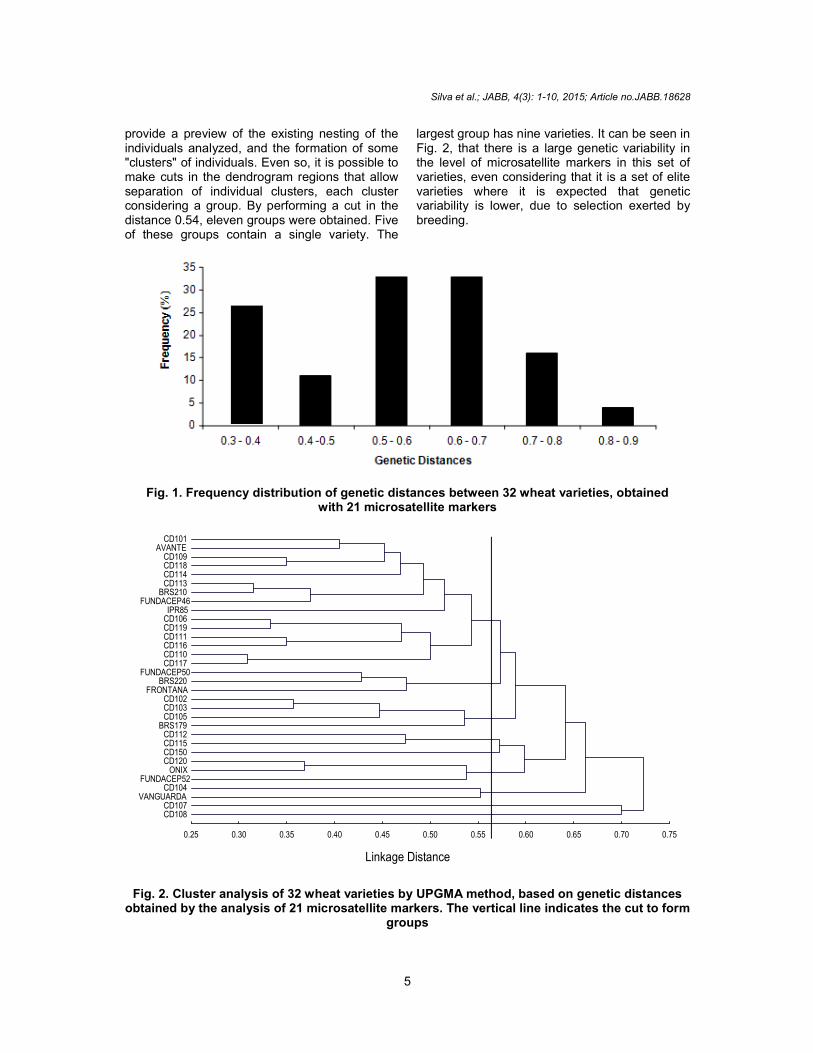
3. RESULTS AND DISCUSSION Twenty-one of the 23 evaluated markers were polymorphic. In these 21 loci, 90 alleles were observed, ranging from 2 to 8 alleles per marker (Table 3), with a mean of 4.29. The PIC values ranged from 0.219 (Xgwm165) to 0.842 (Xgwm44), averaging 0.593. Only seven of the 21 polymorphic markers had PIC value below 0.5. The values obtained for PIC are high considering the number of samples and the samples composed only by elite germplasm, where the variability tends to be lower than in germplasm collections. The genetic distances ranged from 0.31 (between varieties CD 110 and CD 117) to 0.90 (between varieties CD 108 and CD 109), averaging 0.61. Most of the estimated genetic distance was in the range between 0.50 and 0.70, but there was a high frequency distances within a range from 0.30 to 0.40 (Fig. 1). Estimates of genetic distance between wheat varieties are similar or slightly higher than those reported in the literature. Salem et al. [13], using 48 microsatellite markers in wheat, obtained distance values ranging from 0.42 to 0.63. Ahmad [14] analyzing 13 wheat genotypes from different sources obtained genetic distances ranging from 0.10 to 0.70 using 43 microsatellite markers. Using 36 Brazilian varieties of wheat, Schuster et al. [2] obtained distances ranging from 0.10 to 0.88. The cluster analysis obtained by the UPGMA method is shown Fig. 2. Cluster analysis using hierarchical methods such as UPGMA, is not intended to obtain groups of individuals, but
1001
xPPRIn
jij
Silva et al.; JABB, 4(3): 1-10, 2015; Article no.JABB.18628
5
provide a preview of the existing nesting of the individuals analyzed, and the formation of some "clusters" of individuals. Even so, it is possible to make cuts in the dendrogram regions that allow separation of individual clusters, each cluster considering a group. By performing a cut in the distance 0.54, eleven groups were obtained. Five of these groups contain a single variety. The
largest group has nine varieties. It can be seen in Fig. 2, that there is a large genetic variability in the level of microsatellite markers in this set of varieties, even considering that it is a set of elite varieties where it is expected that genetic variability is lower, due to selection exerted by breeding.
Fig. 1. Frequency distribution of genetic distances between 32 wheat varieties, obtained with 21 microsatellite markers
Linkage Distance
CD108 CD107
VANGUARDA CD104
FUNDACEP52 ONIX
CD120 CD150 CD115 CD112
BRS179 CD105 CD103 CD102
FRONTANA BRS220
FUNDACEP50 CD117 CD110 CD116 CD111 CD119 CD106 IPR85
FUNDACEP46 BRS210 CD113 CD114 CD118 CD109
AVANTE CD101
0.25 0.30 0.35 0.40 0.45 0.50 0.55 0.60 0.65 0.70 0.75
Fig. 2. Cluster analysis of 32 wheat varieties by UPGMA method, based on genetic distances obtained by the analysis of 21 microsatellite markers. The vertical line indicates the cut to form
groups

Silva et al.; JABB, 4(3): 1-10, 2015; Article no.JABB.18628
6
Table 3. Alleles, allelic frequencies Polymorphism Index Content (PIC), estimated to 21 microsatellites loci from 32 wheat varieties
Marker Num
alleles Allele Frequency PIC Marker Num
alleles Allele Frequency PIC
Dupw205 2 163 0.344 0.451 Xgwm149 2 156 0.258 0.383 166 0.656 166 0.742
Xgwm165 2 187 0.125 0.219 Dupw115 3 184 0.484 0.612 193 0.875 187 0.156
190 0.359 Dupw167 3 230 0.094 0.498 Xgwm135 3 96 0.250 0.398
242 0.656 110 0.016 244 0.250 166 0.734
Xgwm257 3 168 0.031 0.506 Xgwm164 4 118 0.703 0.468 194 0.375 122 0.172 196 0.594 124 0.063 126 0.063
Xgwm102 4 146 0.552 0.587 Xgwm247 4 148 0.115 0.388 148 0.310 156 0.038 154 0.103 162 0.769 214 0.034 176 0.077
Xgwm161 4 150 0.484 0.659 Dupw217 4 212 0.156 0.665 152 0.266 221 0.422 154 0.078 224 0.359 178 0.172 269 0.063
Xbarc343 4 149 0.484 0.675 Xbarc12 5 159 0.281 0.748 158 0.188 183 0.250 164 0.188 189 0.313 203 0.141 201 0.063
207 0.094 Xgwm155 5 125 0.031 0.739 Xgwm160 5 150 0.063 0.702
141 0.141 180 0.391 145 0.313 184 0.250 147 0.328 186 0.281 151 0.188 190 0.016
Xgwm526 5 122 0.115 0.751 Xgwm304 6 199 0.438 0.676 130 0.192 201 0.344 136 0.269 203 0.094 156 0.346 207 0.031 160 0.077 217 0.031 221 0.063
Xgwm413 6 87 0.047 0.667 Xgwm219 7 102 0.016 0.814 89 0.313 150 0.219 97 0.031 156 0.031 99 0.469 168 0.203 103 0.031 180 0.156 105 0.109 184 0.203 192 0.172
Xgwm44 8 169 0.031 0.842 173 0.078 175 0.141 177 0.266 - - - - - 179 0.109 183 0.094 185 0.125 187 0.156

Silva et al.; JABB, 4(3): 1-10, 2015; Article no.JABB.18628
7
Among the varieties with some degree of kinship, some were in the same group. This is the case of the varieties CD 103 and CD 105, which have in common, the variety Ocepar 14 in the genealogy, and grouped in the same group. The varieties CD 110 and CD 111 have in common the varieties Embrapa 27 and Anahuac 75 in their genealogy and also grouped in the same group. However, the most closely related varieties were in different groups. Varieties Fundacep 46, Fundacep 50 and Fundacep 52 have the same genealogy and were classified into three different groups. The variety CD 120 is descended from the variety CD 105, and these two varieties were in separate groups. The pairs of varieties CD 120 and Onyx, CD 104 and CD 105, Avante and Vanguarda, CD 114 and CD 117, CD 103 and CD 106, BR 210 and CD 107, CD 111 and CD 113 have common parents in the genealogy, and all these pairs of varieties grouped in different groups. Salem et al. [13] obtained consistent clusters when comparing the clustering of wheat varieties based on the genetic distances obtained by microsatellite markers and genealogy. Bertini et al. [15] also obtained consistent data between the grouping data from microsatellite markers in cotton, with the genealogy available. Priolli et al. [16] obtained consistent grouping of soybean varieties, using molecular data and the genealogy of the varieties. However, for some varieties, the cluster analysis based on data of molecular markers and genealogy do not coincided. Bonato et al. [17] using AFLP markers found no correlation between the dissimilarity estimates obtained by molecular markers and the genealogy of soybean varieties. The lack of agreement between the cluster analysis from molecular data and the genealogy can be related to the selection practiced in the populations of breeding programs. Consider the case of any one variety by genealogy analysis, this variety must have half the genome of each parent. However, the selection can lead to a large proportion of the bias in the contribution of each parental genotype in descending variety. By genealogy analysis, this cannot be observed. But the analysis of molecular markers performs a sampling of the genome of plants, so that the input bias can be perfectly detected. Thus, the cluster analysis, when performed from markers that widely sample the genome of the varieties, reflects the genetic relationship between them better than genealogy.
Wheat is an autogamous species, and all the plants of a variety are homozygous. However, in several microsatellite loci, two alleles in the same variety were observed. In these cases, the variety is observed as heterozygous genotype, but is a result of mixing seeds homozygous for different alleles. In all 32 varieties, the observed heterozygosity ranged from zero to 29%, more frequently at 5% (Fig. 3).
This variation observed at the molecular level in some varieties is due to the production process of genetic seeds of each variety. Typically, the genetic seeds of wheat varieties are obtained from a bulk of plants, generally in the generation F8. This means that varieties may be composed of a mixture of very similar inbred lines visually indistinguishable by morphological descriptors. DNA analysis detects existing variations at the molecular level between these inbred lines which compose the variety.
These variations are probably not related to characteristics expressed by the plants, since field-level phenotypic differences are not observed between the plants of these varieties. However, it is necessary to consider the existence of internal variability in wheat varieties, when using molecular markers to distinguish varieties of wheat. The simple observation of one molecular difference may not be sufficient to declare two samples as being of different varieties. It is necessary to estimate the probability of identity of these samples from the allele frequencies obtained from a reference population of wheat varieties.
The information on the frequency of each allele in each loci is presented in Table 3. Few papers that study the genetic variability in crop plants present the frequencies of observed alleles. In Brazil, Priolli et al. [16] and Oliveira et al. [18] showed allele frequencies of microsatellite markers for soybean and Schuster et al. [6] showed allele frequencies of microsatellite markers in wheat. With the frequency information of alleles at each locus, one can calculate the probability of random identity (PRI) for each variety.
PRI is the probability that two different varieties present the same alleles in a set of markers, and this identity is due to chance [2]. The probability of exclusion of identity at random (PE) is the complement of the PRI, and is the probability that two varieties had the same alleles at a set of markers not by chance, but because the two samples are the same variety.

Silva et al.; JABB, 4(3): 1-10, 2015; Article no.JABB.18628
8
Using the PRI, one can define a set of molecular markers to be used in identifying each variety. When the PRI is equal or less than 0.0001%, it can be stated that a second sample will only contain the same alleles in this set of markers, if it is the same variety. That is, if another sample has the same alleles in this set of markers, the probability that the two samples are the same variety (PE) is equal to 99.9999%.
The probability of random identity may be used in cases where it is not possible to distinguish varieties based on morphological descriptors. In these cases, there are always doubts about how many molecular markers need to be used to declare that two samples are the same variety, when no differences are observed between the loci of molecular markers. Using the information of allele frequencies, we could identify a minimum set of markers to characterize each one of the 32 varieties, and a single set that simultaneously identifies all 32 varieties. In evaluating each individual variety, the number of markers required for the PRI 0.0001% ranged from five to 12 markers (data not shown). A set of 15 markers (Xgwm44, Xgwm102, Xgwm155, Xgwm160, Xgwm219, Xgwm257, Xgwm304, Xgwm526, Dupw115, Dupw167, Dupw205, Dupw217, Xbarc12, Xbarc343, Xbarc413) is able to identify all 32 varieties with PRI less than 0.0001% for all varieties.
In cases of loci with two alleles (observed heterozygosity), the sum of the frequency of both alleles was used to estimate PRI. This procedure was used because in the case of evaluation of genetic identity between samples, the presence of either of the two alleles cannot rule out the identity of the samples. Using the same approach, Oliveira et al. [18] identified a set of 11 microsatellite markers to identify 32 soybean varieties in Brazil with PRI less than or equal to 0.0001%.
In Brazil, the protection of the right of plant breeding companies is guaranteed by the Plant Variety Protection, provided by the SNPC (Serviço Nacional de Proteção de Cultivares - National Plant Protection Service). Although plant varieties cannot be patented in Brazil, the Plant Variety Protection guarantees to breeding companies the exclusive marketing or licensing of seeds of protected varieties, during the period of protection. In the case of unauthorized use of seed of a protected plant variety, one must provide evidence of genetic identity between the protected plant and misused variety. This evidence can be provided by PRI. The set of 15 selected molecular markers can be used in cases of intellectual property protection, when there is a suspicion of misuse of seeds. Furthermore, these markers can be used to evaluate the genetic purity of commercial seeds of wheat varieties.
Fig. 3. Heterozygosity percent (loci with two alleles) observed in 32 varieties of wheat
0
2
4
6
8
10
12
0% 5% 10% 14% 19% 29%
Nu
mb
er
of
Va
rie
tie
s
Heterozygosity

Silva et al.; JABB, 4(3): 1-10, 2015; Article no.JABB.18628
9
In this work, an analysis of grouping a set of Brazilian wheat varieties were performed, demonstrating high variability of the sample investigated (Fig. 2). This variability can also be observed from the genealogy of the varieties (Table 1), which have few parents in common. It was also observed that most of the evaluated wheat varieties showed some heterozygosity, indicating at the molecular level there is a variability between inbred lines composing the varieties (Fig. 3). From the genetic frequencies of alleles observed at each locus of molecular marker, PRI of each variety was estimated, and obtained a set of 15 markers that can identify with 99.9999% probability in all 32 varieties. The data obtained in this work can be used for the protection of intellectual property and genetic purity certification of these varieties. The cluster analysis results can still be used by wheat breeders to guide crossings and to evaluate the need to incorporate greater genetic variability in their breeding programs.
4. CONCLUSION Commercial Brazilian wheat varieties have a high genetic variability. Using PRI, it is possible to identify with 99.9999% of certainty, all of the 32 evaluated varieties, and maybe, all of the Brazilian varieties. Microsatellite markers can be used for Plant Variety Protection with high level of confidence.
COMPETING INTERESTS Authors have declared that no competing interests exist.
REFERENCES 1. Guimarães CT, Schuster I, Magalhães JV,
Souza Júnior CL. Marcadores moleculares no melhoramento de plantas. In: Borem AE, Caixeta ET (Ed.). Marcadores moleculares. 2
nd edition. Folha de Viçosa,
Viçosa. 2009;177-208. Portuguese 2. Schuster I, Vieira ESN, Padilha L.
Marcadores moleculares no pós-melhoramento. In: Marcadores Moleculares. 2
nd edition. Folha de Viçosa,
Viçosa. 2009b;177-208. Portuguese 3. Dendauwa J, De Loosea M, De Rieka J,
Van Bockstaeleb E, Leusc L. Variety protection by use of molecular markers: Some case studies on ornamentals. Plant Biosystems. 2001;135:107-113.
4. Gianola S, Poltri SP, Lacaze P, Hopp HE Feasibility of integration of molecular markers and morphological descriptors in a real case study of a plant variety protection system for soybean. Euphytica. 2002;127: 95-113.
5. Donnenwirth J, Grace J, Smith S. Intellectual property rights, patents, plant variety protection and contracts: A perspective from the private sector. IP Strategy Today. 2004;9:19-34.
6. Schuster I, Vieira ESN, Silva GJ, Franco FA, Marchioro VS. Genetic variability in Brazilian wheat varieties assessed by microsatellite markers. Genetics and Molecular Biology. 2009a;32:557-563.
7. USDA. World and U.S. wheat production, exports, and ending stocks. Available:<http://www.ers.usda.gov/data/wheat/YBtable04.asp> Atualizado em 19/04/2012. Accessed on April, 2015.
8. CONAB. TRIGO – BRASIL. Série Histórica de Área Plantada: Safras 1976/77 a 2011/12. Available:<http://www.conab.gov.br/conteudos.php?a=1252&t=&Pagina_objcmsconteudos=3#A_objcmsconteudos> Accessed on April, 2015. Portuguese
9. Schuster I, Queiroz VT, Teixeira AI, Barros EG, Moreira MA. Determinação da pureza varietal de sementes de soja com auxílio de marcadores moleculares micro-ssatélites. Pesquisa Agropecuária Brasileira. 2004;39:247-253. Portuguese
10. Cruz CD. Programa genes, versão windows: Aplicativo computacional em genética e estatística. UFV, Viçosa. 2001;648p. Portuguese
11. StatSoft, Inc. Electronic statistics textbook. Tulsa, OK: StatSoft; 2007. Available:<http://www.statsoft.com/textbook/stathome.html> Accessed on April, 2015.
12. National Research Council. The evaluation of forensic DNA evidence. Committee on DNA Forensic Science: An update. National Academy Press, Washington, DC; 1996.
13. Salem KFM, Zanaty AM, Esmail RM. Assessing wheat (Triticum aestivum L.) genetic diversity using morphological characters and microsatallite markers. World Journal of Agricultural Sciences. 2008;4:538-544.
14. Ahmad M. Assessment of genomic diversity among wheat genotypes as determined by simple sequence repeats. Genome. 2002;45:646–651.

Silva et al.; JABB, 4(3): 1-10, 2015; Article no.JABB.18628
10
15. Bertini CHCM, Schuster I, Sediyama T, Barros EG, Moreira MA. Analysis of cotton genetic diversity by microsatellites and pedigree. Crop Breeding and Applied Biotechnology. 2005;5:369-378.
16. Priolli RHG, Mendes-Junior CT, Arantes CE, Contel EPB. Characterization of Brazilian soybean varieties using microsatellite markers. Genetics and Molecular Biology. 2002;25:185-193.
17. Bonato ALV, Calvo ES, Geraldi IO, Arias CAA. Genetic similarity among soybean (Glycine max (L) Merrill) varieties released in Brazil using AFLP markers. Genetics and Molecular Biology. 2006;29:692-704.
18. Oliveira MB, Vieira ESN, Schuster I. Construction of a molecular database for soybean variety identification in Brazil. Genetics and Molecular Research. 2010;9: 705-720.
_________________________________________________________________________________ © 2015 Silva et al.; This is an Open Access article distributed under the terms of the Creative Commons Attribution License (http://creativecommons.org/licenses/by/4.0), which permits unrestricted use, distribution, and reproduction in any medium, provided the original work is properly cited.
Peer-review history: The peer review history for this paper can be accessed here:
http://sciencedomain.org/review-history/10101