Effigies or Imaginary Affinities? The Conception of the Image ...
Upload
independentCategory
view
4download
0
BioMed CentralBMC Genetics
ss
Open AcceResearch articleGenetic affinities between endogamous and inbreeding populations of Uttar PradeshFaisal Khan1, Atul Kumar Pandey1, Manorma Tripathi1, Sudha Talwar1, Prakash S Bisen2, Minal Borkar1 and Suraksha Agrawal*1Address: 1Department of Medical Genetics, Sanjay Gandhi Post Graduate Institute of Medical Sciences, Raebareli Road, Lucknow (UP) 226014 India and 2Department of Biotechnology, J.C. Bose institute of Life Sciences, Bundelkhand University, Jhansi (UP) India
Email: Faisal Khan - [email protected]; Atul Kumar Pandey - [email protected]; Manorma Tripathi - [email protected]; Sudha Talwar - [email protected]; Prakash S Bisen - [email protected]; Minal Borkar - [email protected]; Suraksha Agrawal* - [email protected]
* Corresponding author
AbstractBackground: India has experienced several waves of migration since the Middle Paleolithic. It isbelieved that the initial demic movement into India was from Africa along the southern coastalroute, approximately 60,000–85,000 years before present (ybp). It has also been reported thatthere were two other major colonization which included eastward diffusion of Neolithic farmers(Elamo Dravidians) from Middle East sometime between 10,000 and 7,000 ybp and a southerndispersal of Indo Europeans from Central Asia 3,000 ybp. Mongol entry during the thirteenthcentury A.D. as well as some possible minor incursions from South China 50,000 to 60,000 ybpmay have also contributed to cultural, linguistic and genetic diversity in India. Therefore, the geneticaffinity and relationship of Indians with other world populations and also within India are oftencontested. In the present study, we have attempted to offer a fresh and immaculate interpretationon the genetic relationships of different North Indian populations with other Indian and worldpopulations.
Results: We have first genotyped 20 tetra-nucleotide STR markers among 1800 north Indiansamples of nine endogamous populations belonging to three different socio-cultural strata. Geneticdistances (Nei's DA and Reynold's Fst) were calculated among the nine studied populations,Caucasians and East Asians. This analysis was based upon the allelic profile of 20 STR markers toassess the genetic similarity and differences of the north Indian populations. North Indians showeda stronger genetic relationship with the Europeans (DA 0.0341 and Fst 0.0119) as compared to theAsians (DA 0.1694 and Fst – 0.0718). The upper caste Brahmins and Muslims were closest toCaucasians while middle caste populations were closer to Asians. Finally, three phylogeneticassessments based on two different NJ and ML phylogenetic methods and PC plot analysis werecarried out using the same panel of 20 STR markers and 20 geo-ethnic populations. The threephylogenetic assessments revealed that north Indians are clustering with Caucasians.
Conclusion: The genetic affinities of Indians and that of different caste groups towards Caucasiansor East Asians is distributed in a cline where geographically north Indians and both upper caste andMuslim populations are genetically closer to the Caucasians.
Published: 7 April 2007
BMC Genetics 2007, 8:12 doi:10.1186/1471-2156-8-12
Received: 28 December 2006Accepted: 7 April 2007
This article is available from: http://www.biomedcentral.com/1471-2156/8/12
© 2007 Khan et al; licensee BioMed Central Ltd. This is an Open Access article distributed under the terms of the Creative Commons Attribution License (http://creativecommons.org/licenses/by/2.0), which permits unrestricted use, distribution, and reproduction in any medium, provided the original work is properly cited.
Page 1 of 11(page number not for citation purposes)
BMC Genetics 2007, 8:12 http://www.biomedcentral.com/1471-2156/8/12
BackgroundApproximately, 60,000–85,000 years before present(ybp) the African exodus occurred and early modernhumans got settled in South Asia. They moved furtheralong the southern Asian coast to reach Southeast Asia,New Guinea, and Australia [[1,2], and [3]]. The exact entrydate of modern humans into south Asia, which includesBangladesh, Bhutan, India, Maldives, Nepal, Pakistan,and Sri Lanka, is uncertain. Various studies have been con-ducted in Indian specific to mtDNA or Y-chromosome.However, these macro haplogroups M and N lineages can-not explain the recent admixture from the neighboringregion, which suggest that South Asian people are likely tohave been settled in this region since the middle Paleo-lithic period [[4-8], and [9]]. Moreover, early Neolithicmigration brought proto Dravidian speakers from theeastern horn of the Fertile Crescent. Approximately, 3,500years ago the Indo-European speakers might have arrivedand contributed to the Indian gene pool. The most recentconquerors from central Asia and the colonizers fromEurope might have also added to this ethnic multiplicity.
It has been shown [10] that Indian populations exhibithigh degree of genetic admixture and a greater geneticproximity with other world populations. Present dayIndia is represented by a complex socio-cultural mosaiccomprised of 20 major languages and approximately 750dialects [11] constituted of 2000 castes and tribal groups[12]. The vast majority of these ethnic populations (atleast 80%) are the Hindus, socially organized into castesand sub-castes [13]. Tribal groups comprise about 8 % ofthe total Indian population [14]. A third socio-religiousgroup, the Muslims, which are represented by two sects,the Sunni and Shia, constitute approximately 12% of thetotal Indian population [15]. Several other minor reli-gious and/or ethnic constituents include Jews, Christians,Buddhists and Sikhs among others. The relative frequen-cies of these groups vary regionally within the sub-conti-nent [15].
It is believed that the Indian populations were derivedfrom a small number of female founders, and the ethnicdifferentiation occurred subsequently through demo-graphic expansions and geographic dispersal. This is fur-ther corroborated by the findings of shared haplogroupbranches, without specific clustering of lineages in corre-lation with languages or the socio-cultural hierarchies ofcaste or tribal populations (except for Andaman tribal lin-eages) [4,11,16,17]. However, it has often been presumedthat the tribes are the original inhabitants of India andresponsible for most of the genetic pool of India. Linguis-tically, the tribal populations are classified into Austro-Asiatic, Dravidian, and Tibeto-Burman. Previous studieshave revealed that the Austro-Asiatic tribes would havebeen the first in India [18]. These tribes might have
entered India through the northwest, as they moved outof Africa following a path south of the Himalayas, whileanother ancestral group moved north, crossing the Hima-layas, settling in southern China, and entering South Asialater from the northeast [14,17,19]. Basu et al. 2003 [14]studied mtDNA control region nucleotide diversity andhave shown a high frequency (19%) of the ancient auto-chthonous haplogroup M2, and lack of the younger hap-logroup M4, in these tribal groups. In contrast, recentanalyses of Austro-Asiatic tribal populations showed alow frequency of the M2 haplogroup (~2%); consideringthis frequency, it would be difficult to claim that they werethe earliest inhabitants of the Indian subcontinent [6]. Inaddition, mtDNA analysis of two southern Indian tribalgroups in comparison to caste groups suggested thatIndian caste and tribal populations share a common latePleistocene maternal ancestry, while no genetic evidencesubstantiates the claim that the tribes were the earlier set-tlers, followed by caste groups derived from them[3,5,7,22]. Most of the studies have been conducted tak-ing into consideration the mt DNA/Y binary markers. Wehave adopted a different approach by taking into consid-eration highly neutral markers (STRs) to study the geneticdiversity among north Indians from the thickly populatedstate of India i.e. Uttar Pradesh.
To meet this objective, we genotyped 20 tetra-nucleotideSTR markers among 1800 north Indian samples from nineendogamous populations belonging to three differentsocio-cultural strata. Three of the upper caste populationswere Bhargavas, Chaturvedis and other Brahmins, whilethe middle caste populations were Kayastha, Mathurs,Rastogies and Vaish. Two Muslim populations were Shiaand Sunni. Selection of the STR markers was based on theglobal survey carried out by Perez-Lezaun et al 1987 [23].In order to provide a comprehensive picture of the geneticsimilarity and differences of the north Indian popula-tions, various comparisons have been made.
ResultsAllele frequency distributionWe have observed 176 alleles at 20 STRs. The allelenumber ranged from 7 to 9 at sixteen STR loci (THO1,TPO, FES, VWA, D4S243, DHFRP2, FGA, D7S820,D5S818, D11S2010, D2S1328, ACPP, D9S926,D13S1358, D14S306 and D18S848) while ≥ 10 alleleshave been observed at the remaining four STRs i.e.D3S1358, D16S310, HPRT and F13A. Average number ofobserved alleles was 8.8. The maximum numbers of 164alleles have been observed in Shia, and minimum inVaish (146). All the STRs were in HWE. Locus wise averageobserved heterozygosity is shown in additional file 1.
Page 2 of 11(page number not for citation purposes)
BMC Genetics 2007, 8:12 http://www.biomedcentral.com/1471-2156/8/12
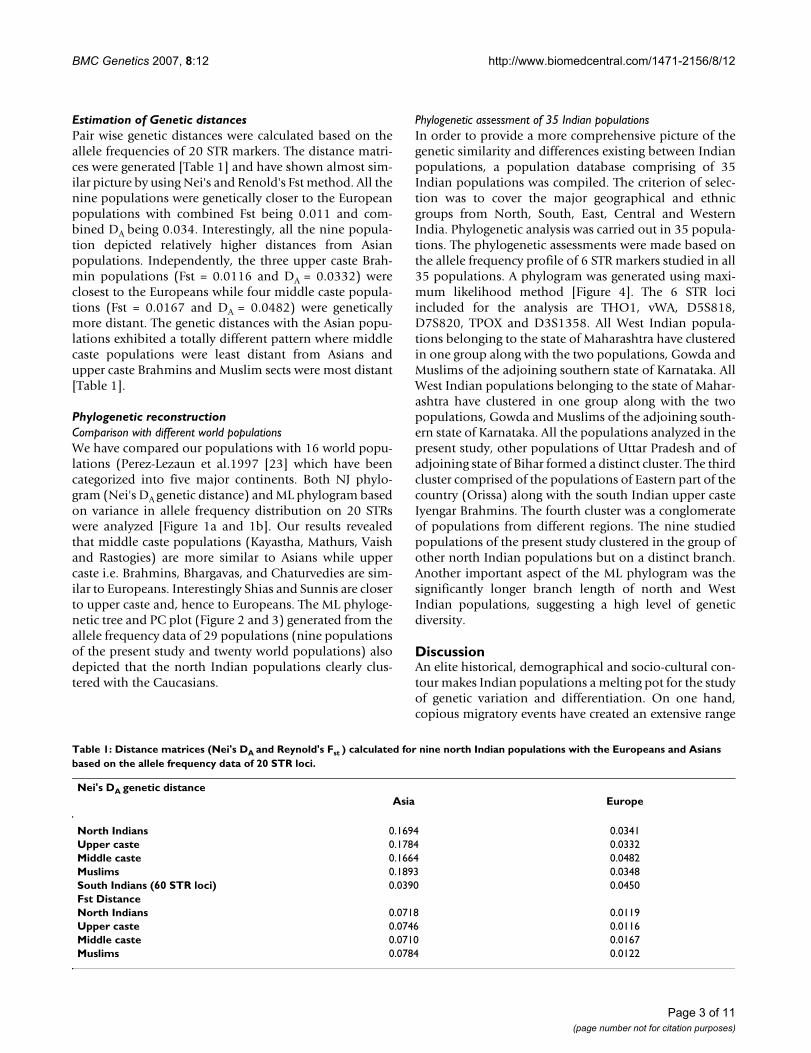
Estimation of Genetic distancesPair wise genetic distances were calculated based on theallele frequencies of 20 STR markers. The distance matri-ces were generated [Table 1] and have shown almost sim-ilar picture by using Nei's and Renold's Fst method. All thenine populations were genetically closer to the Europeanpopulations with combined Fst being 0.011 and com-bined DA being 0.034. Interestingly, all the nine popula-tion depicted relatively higher distances from Asianpopulations. Independently, the three upper caste Brah-min populations (Fst = 0.0116 and DA = 0.0332) wereclosest to the Europeans while four middle caste popula-tions (Fst = 0.0167 and DA = 0.0482) were geneticallymore distant. The genetic distances with the Asian popu-lations exhibited a totally different pattern where middlecaste populations were least distant from Asians andupper caste Brahmins and Muslim sects were most distant[Table 1].
Phylogenetic reconstructionComparison with different world populationsWe have compared our populations with 16 world popu-lations (Perez-Lezaun et al.1997 [23] which have beencategorized into five major continents. Both NJ phylo-gram (Nei's DA genetic distance) and ML phylogram basedon variance in allele frequency distribution on 20 STRswere analyzed [Figure 1a and 1b]. Our results revealedthat middle caste populations (Kayastha, Mathurs, Vaishand Rastogies) are more similar to Asians while uppercaste i.e. Brahmins, Bhargavas, and Chaturvedies are sim-ilar to Europeans. Interestingly Shias and Sunnis are closerto upper caste and, hence to Europeans. The ML phyloge-netic tree and PC plot (Figure 2 and 3) generated from theallele frequency data of 29 populations (nine populationsof the present study and twenty world populations) alsodepicted that the north Indian populations clearly clus-tered with the Caucasians.
Phylogenetic assessment of 35 Indian populationsIn order to provide a more comprehensive picture of thegenetic similarity and differences existing between Indianpopulations, a population database comprising of 35Indian populations was compiled. The criterion of selec-tion was to cover the major geographical and ethnicgroups from North, South, East, Central and WesternIndia. Phylogenetic analysis was carried out in 35 popula-tions. The phylogenetic assessments were made based onthe allele frequency profile of 6 STR markers studied in all35 populations. A phylogram was generated using maxi-mum likelihood method [Figure 4]. The 6 STR lociincluded for the analysis are THO1, vWA, D5S818,D7S820, TPOX and D3S1358. All West Indian popula-tions belonging to the state of Maharashtra have clusteredin one group along with the two populations, Gowda andMuslims of the adjoining southern state of Karnataka. AllWest Indian populations belonging to the state of Mahar-ashtra have clustered in one group along with the twopopulations, Gowda and Muslims of the adjoining south-ern state of Karnataka. All the populations analyzed in thepresent study, other populations of Uttar Pradesh and ofadjoining state of Bihar formed a distinct cluster. The thirdcluster comprised of the populations of Eastern part of thecountry (Orissa) along with the south Indian upper casteIyengar Brahmins. The fourth cluster was a conglomerateof populations from different regions. The nine studiedpopulations of the present study clustered in the group ofother north Indian populations but on a distinct branch.Another important aspect of the ML phylogram was thesignificantly longer branch length of north and WestIndian populations, suggesting a high level of geneticdiversity.
DiscussionAn elite historical, demographical and socio-cultural con-tour makes Indian populations a melting pot for the studyof genetic variation and differentiation. On one hand,copious migratory events have created an extensive range
Table 1: Distance matrices (Nei's DA and Reynold's Fst ) calculated for nine north Indian populations with the Europeans and Asians based on the allele frequency data of 20 STR loci.
Nei's DA genetic distanceAsia Europe
North Indians 0.1694 0.0341Upper caste 0.1784 0.0332Middle caste 0.1664 0.0482Muslims 0.1893 0.0348South Indians (60 STR loci) 0.0390 0.0450Fst DistanceNorth Indians 0.0718 0.0119Upper caste 0.0746 0.0116Middle caste 0.0710 0.0167Muslims 0.0784 0.0122
Page 3 of 11(page number not for citation purposes)

BMC Genetics 2007, 8:12 http://www.biomedcentral.com/1471-2156/8/12
Page 4 of 11(page number not for citation purposes)
NJ and ML based Phylogenetic tree depicting clustering of the studied nine populations with five continental groupsFigure 1NJ and ML based Phylogenetic tree depicting clustering of the studied nine populations with five continental groups. (a) Maxi-mum Likelihood (ML) tree with 1000 bootstrap replicates (b) Neighbor-joining (NJ) tree with 1000 bootstrap replicates.
(b)
Asia
Europe
Pacific
AfricaAmerica
423
694
345
1000
BhargavasChaturvedi
Brahmins 543 566
Sunni
Shiya
789790
Rastogies
Kayastha
Mathurs
945
625Vaish
978 Asia
Europe
Pacific
AfricaAmerica
423
694
345
1000
BhargavasChaturvedi
Brahmins 543 566
Sunni
Shiya
789790
Rastogies
Kayastha
Mathurs
945
625Vaish
978
(a)
908
VaishRastogies
Mathurs
Kayastha
561 983
Shiya
Sunni
703
BhargavsBrahmins
Chaturvedis
624318
932
Asia
Europe
Africa
PacificAmerica
460633
431
989
908
VaishRastogies
Mathurs
Kayastha
561 983
908
VaishRastogies
Mathurs
Kayastha
561 983
Shiya
Sunni
703
BhargavsBrahmins
Chaturvedis
624318
932
Asia
Europe
Africa
PacificAmerica
460633
431
989

BMC Genetics 2007, 8:12 http://www.biomedcentral.com/1471-2156/8/12
of genetic diversity while inflexible and stern socio-cul-tural barriers have structured this diversity into differentendogamous groups identified by the name of "castes".This term "Caste" is an assemblage of various socio-cul-tural customs; traditions and barriers that have created anabundant number of hierarchically arranged 'endogamous'groups. This social hierarchy system is unique and exqui-site because in the caste system, birth of an individual gov-erns and decides most of the proceedings of the lifeincluding the choice of the mating partner. Marriagebetween partners of equal status is preferred, and repro-duction in the caste system is largely endogamous [24].
In order to testify the hypothesis of social cleavage result-ing into genetic structuring even in a confined geographi-cal area, we have carried out various statistical analyses todetermine the level of genetic differentiation between thestudied populations. As mentioned earlier, the studied
five groups belong to two different religious strata andpractice highly restricted marital patterns. The level ofpopulation structuring triggered by the caste system fur-ther gets enhanced due to an additional level of endog-amy called 'surname endogamy' practiced mainly by themost stringent higher caste group [25].
We calculated the genetic distances and pair wise matricesusing two different genetic distance calculations, Nei'sDA, and Reynold's Fst. The distances were calculated fromthe European and Asian populations analyzed for thesame set of 20 STR markers by Perez Lezaun et al [14].Two genetic distance methods have been used to over-come the ascertainment bias resulted from hyper mutabil-ity of STR loci [17]. The estimation of genetic distancesbetween Europeans and Proto-Asians (mainly EastAsians) with north Indians at 20 STR markers clearlyestablishes strong genetic relationship of north Indians
ML based Phylogenetic tree depicting clustering of the studied nine populations with 20 world populationsFigure 2ML based Phylogenetic tree depicting clustering of the studied nine populations with 20 world populations. Blue: Caucasian populations; Green: African populations; Red: East Asia (oriental) populations; and Pink: North Indian populations (present study).
Page 5 of 11(page number not for citation purposes)

BMC Genetics 2007, 8:12 http://www.biomedcentral.com/1471-2156/8/12
with Europeans as both DA (0.0341) and Fst (0.0119)reveled that north Indians are genetically more closer tothe Europeans than Asians (DA 0.1694 and Fst – 0.0718).Another imperative finding was the differential pattern ofgenetic affinities of the three socio-cultural groups ofnorth India with the Europeans. The affinity to Cauca-sians was proportionate to caste rank where upper casteBrahmins being genetically closest (DA = 0.0332 and Fst= 0.0116), followed by Muslims (DA = 0.0348 and Fst =0.0122) while the middle caste populations were mostdistant from the Europeans (DA = 0.0482 and Fst =0.0167) and closure to Asians.
In order to prove the phylogenetic accuracy of STR loci, apanel of only 10 autosomal STR loci has been used toinfer phylogenetic relationships among well-defined geo-ethnic population groups and it has been observed thatdespite of the high allelic variability, STR loci are success-ful in reconstructing the accurate human phylogenies. To
achieve this goal, a database of 22 geographically targetedand racially diverse set – population from forensic litera-ture was compiled [33-41]. Both ML phylogram and PC-plot analysis were carried out and it was observed thatbasal cluster pattern of ML phylogram carries three geo-ethnic groups, indicating the role of genetic drift as amajor force of evolution [Figure 2 and 3]. Both the treeshave a longer African branch than any other group. Sucha patristic separation was also visible in the PC-plot anal-ysis [Figure 3]. The edge lengths displayed in these phylo-grams indicated the amount of evolutionary change alongeach branch. The scores next to the nodes characterize thenumber of bootstrap replicates (out of 1000) exhibitingthese specific bifurcations. The African populations havebeen clustered into central (Cameroon and Lisongo) andNorth African (Moroccan Arabs and Saharawasi Africans)groups. Such clustering was also reported by Cavalli-Sforza and Feldman, (2003) and Underhill et al., (2001)[28,29] on the basis of polymorphisms of 120 protein-
Phylogenetic reconstruction based on Principle component (PC-Plot) analysisFigure 3Phylogenetic reconstruction based on Principle component (PC-Plot) analysis. Blue: Caucasian populations; Green: African populations; Red: East Asia (oriental) populations; and Pink: North Indian populations (present study).
Page 6 of 11(page number not for citation purposes)

BMC Genetics 2007, 8:12 http://www.biomedcentral.com/1471-2156/8/12
coding genes and Y-chromosome binary haplogrouprespectively. This sub clustering further strengthens theutility of STR loci in deciphering the accurate phylogenies,even within the same geographical region. Middle EasternArabs displayed a branch nearer to Caucasians and tosome extent closer to Moroccan Arabs suggesting a strongCaucasian element along with African admixtures. This isindicative of the Demic expansion of the Middle Eastgenes, agriculture innovations and languages into NorthWest Africa [14], which is further supported by the nearmedial position of Arabs in the PC-plot. Recently, Y-chro-mosome SNP analysis by Al-Zahery et al., 2003 [30] alsorevealed a similar pattern in other Middle Eastern popula-tions. European branching pattern have resolved Basque,Spaniards and Portuguese in a separate cluster from thatof German/Austrian branch. All 9 North Indian popula-tions clustered on a separate branch emerging sharing thesame node with the Caucasians in the ML phylogram.
We further compared our populations with other Indianand the world populations. On the basis of allele frequen-cies calculated at 6 STR loci in 35 Indian populations(including nine populations of the present study), wehave deduced that the geographical barriers, and to someextent ethnic origin have been the major source of geneticstructuring of Indian populations along with little effectof socio-cultural practices. Similar observations have beenmade by Kashyap et al 2002 [27] in their report on 54 dis-tinct Indian populations. Phylogenetic analysis of the 35populations have yielded a geo-ethnically structured pic-ture [Figure 3], where it has been seen that three welldefined clusters comprising of north, west and east Indianpopulations were formed and in each of the geographiccluster, different caste and Muslim populations have clus-tered together. For instance, like Karnataka Muslims clus-tered with Desasth and Chitpavan Brahmins ofMaharashtra and north Indian Muslims clustered with
ML based Phylogenetic tree depicting clustering of the different Indian populationsFigure 4ML based Phylogenetic tree depicting clustering of the different Indian populations.
Kurmi Kurmi
ChaturvedisChaturvedis
RastogiesRastogies
VaishVaish
MathurMathur
KayasthaKayastha
ShiaShia
SunniSunni
GowdaGowda
Muslim Muslim KarnatakaKarnataka
DhangarsDhangars
Chitpavan Chitpavan
BrahminsBrahmins
Desasth Desasth
BrahminsBrahmins
MarathaMaratha
LingayatLingayat
AghariyaAghariya
GopeGope
ReddyReddy
ChamarChamar
Iyengar Iyengar
BrahminBrahmin
Kayastha Kayastha
OrissaOrissa
Brahmins Brahmins OrrissaOrrissa
SakanksholuSakanksholu
ShatriyaShatriyaGondsGondsBhumiharBhumihar
Jat Jat Baniya Baniya Khatrie Khatrie
Rajput Rajput
Yadav BiharYadav Bihar
TelieTelie
BhargavasBhargavas
Brahmins UPBrahmins UP
Page 7 of 11(page number not for citation purposes)

BMC Genetics 2007, 8:12 http://www.biomedcentral.com/1471-2156/8/12
north Indian Brahmins. Interestingly, most of the popula-tions of these three clusters have a Caucasian origin. Theclustering points towards the possibility the West Eurasianor central Asian immigrants appointed themselves to pre-dominantly belonged to castes of higher rank and bothlower caste and tribes were least admixed with thesegroups [11].
The results based on 20 STR markers have revealed that allthe populations have similar allele frequency distributionwhich may be suggestive of a common ancestry or a con-tinuous gene flow among these populations. We did Gst,Fst and AMOVA assessment for all the nine populations[Figure 5]. It was interesting to note that between group
percentages variance got increased as the analysis was car-ried out between two (Muslim population), three (uppercaste populations), five (upper caste) and all the ninepopulations. This finding revealed that the amount ofgenetic variation attributable to between populations in asocio-religious group is minimal as compared to variancebetween groups. Therefore, the three groups might differfrom each other at the genetic level owing to the socio-cul-tural structuring. However, the genetic profile of all thenine populations included in the analysis exhibit exten-sive genetic overlap either due to the same commonrecent ancestor or due to the fact that the caste system is~3000–4000 years old [26] and the time period is signifi-cantly small to create the genetic differentiation. Further-
Comparison of Gst, Fst and AMOVA results among three socio-religious groupsFigure 5Comparison of Gst, Fst and AMOVA results among three socio-religious groups. M = Muslim populations (Shia and Sunni); UC = Upper caste populations (Bhargavas, Chaturvedis and Brahmins); MC = Middle caste populations (Kayastha, Mathurs, Rasto-gies and Vaish).
0
0.001
0.002
0.003
0.004
0.005
0.006
0.007
0.008
0.009
M (2 pop ) UC (3 pop) M + UC (5 pop) M +UC+M C (9 pop)0
0.1
0.2
0.3
0.4
0.5
0.6
0.7
0.8
Gs t Fs t Be tw e e n group % var iance
Table 2: Pair wise genetic distance (DA ) matrix for north and south Indians with Eurasian and Asians.
Eurasians Asian
North Indians (20 STR loci) 0.024 0.058South Indians (60 STR loci) 0.045 0.039North Indian upper caste (20 STR loci) 0.015 0.074North Indian middle caste (20 STR loci) 0.030 0.042South Indian upper caste (60 STR loci) 0.032 0.058South Indian middle caste (60 STR loci) 0.057 0.032
Page 8 of 11(page number not for citation purposes)

BMC Genetics 2007, 8:12 http://www.biomedcentral.com/1471-2156/8/12
more, the spread of Muslim population groups in India isascribed to heavy admixture with local caste populations[13].
It has been proposed that the genetic make up of theIndian populations is an admixture of Caucasians andAsians. Bamshad et al. 2001 [11] studied 8 south Indianpopulations and deduced that they are genetically closerto Asian populations. The data generated from the presentstudy has shown that the nine north Indian populationsare genetically closer to the Caucasian than to the Asianpopulations. The phylogenetic reconstruction of thesepopulations along with other world populations has alsoshown that all the nine north Indian populations haveclustered with the European populations [Figure 1, 2, 3].When genetic distance were calculated between Eurasians(West Eurasia, Middle East and Central Asia) and Proto-Asians (mainly East Asians) with north Indians at 20 STRand with south Indians at 60 STR loci [11], two differentpatterns of genetic distance were obtained [Table 2]. Geo-graphically, genetic distance with the Eurasians increasesfrom north to South India while that with proto-Asianpopulations decreases. The other observation was thatwhen different caste groups of north India were comparedwith Eurasians and proto-Asian populations groups, theaffinity to Eurasians was proportionate to caste rank whilethe upper caste and Muslims were more similar to Cauca-sians than middle caste populations.
ConclusionThe phylogenetic analysis of nine endogamous/consan-guineous populations of North India based on 20 STR locihave unwrapped the information about the genetic affin-ities of north Indians. Our results have demonstrated thatintra-population differences were marginal still there wasa definite pattern of genetic variation found in differentpopulations. Finally, we observed genetic affinities ofIndians and that of different caste groups towards Cauca-sians or East Asians which are differentially distributedwhere geographically north Indians and socially bothupper caste and Muslim populations are genetically closerto the Caucasians. However, the genetic configuration ofIndians is as complex hence more genetic data from thesub-continent is highly necessitated to unravel the intri-cacy of Indian genetic composition.
Methods1. SubjectsPresent study is the first and one of the largest populationbased analysis (N = 1800) from this part of India. Moreo-ver, we have taken into consideration a statistically signif-icant sample size from all the caste populations. Total 200samples have been collected from each of the nine popu-lations i.e. Bhargavas, Chaturvedis, Brahmins, Kayastha,Mathurs, Rastogies, Vaish and Shia and Sunni Muslims
(Uttar Pradesh). All the samples were adult with mean ageof 38.8 ± 3.4 years and were residents of Uttar Pradeshsince last three generations. Prior to the sample collection,regional addresses and detailed computerized lists of thepopulations have been prepared from different districts ofUttar Pradesh. Random numbers were generated with thehelp of computer and adult individuals living in differentparts of Uttar Pradesh have been questioned about theirethnicity caste affiliations and surnames and the birth-places of their parents as per the order of the randomnumber. Only unrelated subjects were considered eligibleto participate. The demographic profile and other ethnicaland familial information were filled in a detailed Per-forma. Three-generation pedigree charts were prepared toassure un-relatedness in all the samples.
Whole blood was obtained by venipuncture and about 5ml of blood was collected in EDTA vacutainer tubes afterobtaining the informed consent from the subjects. Thestudy was performed with the approval of the institu-tional ethical reviewing committee of Sanjay Gandhi PostGraduate Institute of Medical Sciences (SGPGIMS), Luc-know and the government of India.
2. DNA extractionHigh molecular weight genomic DNA was extracted bysalting out method using phenol-chloroform as describedby Coomey et al. 1993 [31] and was purified by ethanolprecipitation.
3. STR genotypingA panel of 20 STR markers namely, FGA, D5S818,D7S820, D11S2010, D13S767, D9S926, D2S1328,D18S848, D14S306, D3S1358, ACPP, TPO, Tho1, VWA,FES, F13A1, D16S310, DHFRP2, HPRT and D4S243 weregenotyped using PCR based locus specific amplification asmentioned earlier [23]. One of the primers for each ofmarker was labeled with a fluorochrome – VIC (D5S818,D13S767, D18S848, ACPP, VWA, D16S310 andD4S243), Ned (TPO, D9S926, FES, D14S306, D7S820and DHFRP2) and 6-FAM (FGA, D3S1358, Tho1,D11S2010, D2S1328, F13A1 and HPRT). PCR amplifica-tion of all the markers was carried out by co-amplifying 15STR loci in five multiplex PCR while remaining five mark-ers were genotyped by single PCR. Size fractionation ofthe fluorochrome labeled amplicons was carried out bycapillary electrophoresis in ABI-310 automated fragmentsize genetic analyzer (Applied Biosystems, USA). Size call-ing of the alleles at individual loci was done with GENES-CAN v 3.1.2 software with the help of 500-ROX sizestandard (Applied Biosystems, USA). Once the size callingwas completed, GENOTYPER v2.5.2 software was used toassign base pair size to each of the allele at respective STRmarker and create the allelic profile of an individual fordifferent markers.
Page 9 of 11(page number not for citation purposes)

BMC Genetics 2007, 8:12 http://www.biomedcentral.com/1471-2156/8/12
4. Statistical analysisAllele frequencies at each of the marker have beenobtained by direct counting method from the observednumber of alleles at a locus divided by total number ofgametes. Deviation from the assumption of Hardy Wein-berg equilibrium at genotypic frequencies for all markersin random north Indian population was estimated usingFischer's exact test based on 1000 Markov-Chain algo-rithm steps in Arlequin v2 software. Bonferroni correctionto the p value was applied.
Two different genetic distances Nei's DA , and Reynold's Fstbased on the allele frequency distribution of 20 STR werecalculated to assess the genetic relationship of north Indi-ans with the Europeans and Asians. Both the distancematrices namely Nei's DA , and Reynold's Fst were calcu-lated using GENDIST option in PHYLIP v3.5c [32].
Phylogenetic analysis carried out for different populationsby two enrooted radial phylograms, Neighbor Joining orNJ-phylogenetic Tree and Maximum Likelihood or ML-phylogenetic Tree. The NJ algorithm was used to constructthe branching array from a matrix of genetic distances cal-culated from different distance matrices namely Nei's DA ,and Reynold's Fst using GENDIST option in PHYLIP v3.5c[32]. The option NEGHBOR in PHYLIP v3.5c was used todraw the phylogenetic trees from the distance matrices.Maximum likelihood (ML) algorithm was used for phylo-genetic reconstruction using CONTML in PHYLIP v3.5c.In both NJ as well as ML method, statistical bootstrapinvolving 1000 replicates was carried out using SEQBOOToption of PHYLIP v3.5c. Finally, a consensus of 1000 trees(NJ and ML both) was drawn using CONSENSE option ofPHYLIP v 3.5 [32].
Authors' contributionsFK carried out laboratory experiments statistical analysisand drafted the manuscript. AKP, MT and ST wereinvolved in sample collection and laboratory analysis.PSB helped in intrepretation of data and editing of themanuscript. MB helped in the statistical analysis. SA hasconceptualized the paper provided important intellectualinputs in the preparation of the manuscript. All authorsread and approved the final manuscript.
Additional material
AcknowledgementsAuthors are thankful to Indian Council of Medical Research (ICMR), New Delhi and Sanjay Gandhi Post Graduate Institute of Medical Sciences Luc-know for providing various lab facilities and other assistance for research work in the present study.
References1. Cann RL: Genetic clues to dispersal in human populations:
retracing the past from the present. Science 2001, 291:1742-8.2. Forster P, Torroni A, Renfrew C, Rohl A: Phylogenetic star con-
taction applied to Asian and Papuan mt DNA evolution. MolBiol Evol 2001, 18:1864-1881.
3. Macaulay V, Hill C, Achilli A, Rengo C, Clarke D, Meehan W, Black-burn J, Semino O, Scozzari R, Crucian F, taha A, Shaari Nk, Raja JM,Ismail P, Zainuddin Z, Goodwin W, Bulbeck D, Bandelt HJ, Oppenhe-imer S, Torroni A, Richards M: Single rapid coastal settlement ofAsia revealed by analysis of complete mitochondrialgenomes. Science 2005, 308:1034-6.
4. Kivisild T, Rootsi S, Metspalu M, Mastana S, Kaldma K, Reidla M, ParikJ, Metspalu M, Tolk HV, Stepanov V: The genetic heritage of theearliest settlers persists both in Indian tribal and caste pop-ulations. Am J Hum Genet 2003, 72:313-332.
5. Palanichamy M, Sun C, Agrawal S, Bandelt HJ, Kong QP, Khan F, WangCY, Chaudhuri TK, Palla V, Zhang YP: Phylogeny of mitochon-drial DNA macrohaplogroup M in India, based on completesequencing: implications for the peopling of South Asia. AmJ Hum Genet 2004, 75:966-978.
6. Metspalu M, Kivisild T, Metspalu E, Parik J, Hudjashov G, Kaldma K,Serk P, Karmin M, Behar DM, Gilbert MTP: Most of the extantmtDNA boundaries in south and Southwest Asia were likelyshaped during the initial settlement of Eurasia by anatomi-cally modern humans. BMC Genet 2004, 5:26-30.
7. Thangaraj K, Chaubey G, Reddy AG, Singh VK, Singh L: AutosomalSTR data on the enigmatic Andaman Islanders. Forensic Sci Int2006:283.
8. Sengupta S, Zhivotovsky LA, King R, Mehdi SQ, Edmonds CA, ChowCE, Lin AA, Mitra M, Sil SK, Ramesh A: Polarity and temporalityof high-resolution Y-chromosome distributions in India iden-tify both indigenous and exogenous expansions and revealminor genetic influence of Central Asian pastoralists. Am JHum Genet 2006, 78:202-221.
9. Sahoo S, Singh A, Himabindu , Banerjee J, Sitalaximi T, Gaikwad S,Trivedi R, Endicott P, Kivisild T, Metspalu Mait, Villems R, KashyapVK: A prehistory of Indian Y chromosomes: Evaluating demicdiffusion scenarios. PNAS 2006, 103:843-848.
10. Saha A, Sharma S, Bhat A, Pandit A, Bamezai R: Genetic affinityamong five different population groups in India reflecting aY-chromosome gene flow. J Hum Genet 2005, 50:49-51.
11. Bamshad M, Kivisild T, Watkins WS, Dixon ME, Ricker CE, Rao BB:Genetic evidence on the origins of Indian caste populations.Genome Res 2001, 11:994-1004.
12. Agrawal S, Khan F, Pandey A, Tripathi M, Herrrera RJ: YAP, signa-ture of an African – Middle Eastern migration into northernIndia. Current Science 2005, 88:174-179.
13. Mukherjee N, Nebel A, Oppenheim A, Majumder PP: High-resolu-tion analysis of Y-chromosomal polymorphisms reveals sig-natures of population movements from Central Asia andWest Asia into India. J of Genet 2001, 80:125-35.
14. Basu A, Mukherjee N, Roy S, Sengupta S, Banerjee S, Chakraborty M:Ethnic India: a genomic view, with special reference topeopling and structure. Genome Res 2003, 13:2277-90.
15. Renfrew C: The origins of Indo-European languages. Sci Am1989, 261:82-90.
16. Mountain JL, Hebert JM, Bhattacharyya S, Underhill PA, Ottolenghi C,Gadgil M, Cavalli-Sforza LL: Demographic history of India andmt DNA-sequencediversity. Am J Hum Genet 1995, 56:979-992.
17. Kivisild T, Bamshad MJ, Kaldma K, Metspalu M, Metspalu E, Reidla M,Laos S, Parik J, Watkins WS, Dixon ME: Deep common ancestryof Indian and Western Eurasian mitochondrial DNA line-ages. Curr Biol 1999, 9:1331-1334.
18. Roychoudhary S, Roy S, Basu A, Banerjee R, Vishwanathan H, UshaRani MV, Sil SK, Mitra M, Majumder PP: Genomic structures andpopulation histories of linguistically distinct tribal groups ofIndia. Hum Genet 2001, 109:339-350.
Additional File 1Observed Heterozygosity at 20 STR markers among nine north Indian populations. Locus wise average observed heterozygosity for 20 STR marker in nine populations (present study).Click here for file[http://www.biomedcentral.com/content/supplementary/1471-2156-8-12-S1.doc]
Page 10 of 11(page number not for citation purposes)

BMC Genetics 2007, 8:12 http://www.biomedcentral.com/1471-2156/8/12
Publish with BioMed Central and every scientist can read your work free of charge
"BioMed Central will be the most significant development for disseminating the results of biomedical research in our lifetime."
Sir Paul Nurse, Cancer Research UK
Your research papers will be:
available free of charge to the entire biomedical community
peer reviewed and published immediately upon acceptance
cited in PubMed and archived on PubMed Central
yours — you keep the copyright
Submit your manuscript here:http://www.biomedcentral.com/info/publishing_adv.asp
BioMedcentral
19. Majumder PP: People of India: Biological diversity and affini-ties. Evolutionary Anthropology 2001, 100:10.
20. Kivisild T, Kaldma K, Metspalu M, Parik J, Papiha SS, Villems R: Theplace of the Indian mitochondrial DNA variants and the glo-bal network of maternal lineages and the peopling of the OldWorld. Genomic Diversity 1999:135-152.
21. Kumar SS, Nasidze I, Walimbe SR, Stoneking M: Discouraging pros-pects for ancient DNA from India. American Journal of PhysicalAnthropology 2000, 113:129-33.
22. Thanseem I, Thangaraj K, Chaubey G, Singh VK, Bhaskar VKS, ReddyBM, Reddy AG, Singh L: Genetic affinities among the lowercastes and tribal group of India: inference from Y chromo-some and mitochondrial DNA. BMC Genetics 2006, 7:42.
23. Perez-Lezaun A, Calafell F, Mateu E, Comas D, Bosch E, BertranpetitJ: Allele frequency for 20 microsatellites in a worldwide pop-ulation survey. Hum Hered 1997, 47:189-96.
24. Heinz CB: Asian cultural traditions. Waveland Press, ProspectHeights; 1999.
25. Agrawal S, Khan F: Reconstructing Recent Human Phylogenieswith forensic STR loci: A Statistical Approach. BMC Genet2005, 6:47.
26. Rajkumar R, Kashyap VK: Genetic structure of socio-culturallydiversified caste populations of southwest India and theiraffinity with related Indian and global groups. BMC Genetics2004, 5:23.
27. Kashyap VK, Guha S, Trived R: Concordance study on 15 STRloci in three major populations of Himalayan state Sikkim. JForensic Sci 2002, 47:1163-7.
28. Cavalli-Sforza LL, Feldman MW: The application of moleculargenetic approaches to the study of human evolution. NatGenet 2003, 33:266-75.
29. Underhill PA, Passarino G, Lin AA, Marzuki S, Oefner PJ, Cavalli-Sfroza : The phylogeography of Y chromosome binary haplo-types and the origins of modern human populations. Ann HumGenet 2001, 65:43-62.
30. Al-Zahery N, Semino O, Benuzzi G, Magri C, Passarino G, Torroni A,Santachiara-Benerecetti AS: Y-chromosome and mtDNA poly-morphisms in Iraq, a crossroad of the early human dispersaland of post-Neolithic migrations. Mol Phylogenet Evol 2003,28:458-472.
31. Comey CT, Budowle B, Adams DE, Baumstark AL, Lindsey JA, PresleyLA: PCR amplification and typing of the HLA DQ alpha genein forensic samples. J Forensic Sci 1993, 38:239-49.
32. Felsenstein J: Phylogeny Inference Package (PHYLIP) version3.5c/ distributed by the author. Department of Genetics, Univer-sity of Washington, Seattle; 1993.
33. Deka R, Shriver MD, Yu LM, Herdreich EM, Jin L, Zhong Y, McGarveyST, Agarwal SS, Bunker CH, Miki T, Hundrieser J, Yin S, Raskin S, Bar-rantes R, Ferrell RE, Chakraborty R: Genetic variation at twentythree microsatellite loci in sixteen human populations. Jour-nal of genetics 1999, 78:99-121.
34. Chu JY, Huang W, Kuang SQ, Wang JM, Xu JJ, Chu ZT, Yang ZQ, LinKQ, Li P, Wu M, Geng ZC, Tan CC, Du RF, Jin L: Genetic relation-ship of populations in China. Evolution 1998, 95:11763-11768.
35. Destro-Bisol G, Boschi I, Caglia A, Tofanelli S, Pascali V, Paoli G,Spedini G: Microsatellite variation in central Africa: An analy-sis of Intrapopulation and interpopulation genetic diversity.Am J Phys Anthropol 2000, 112:319-337.
36. Dib C, Faure S, Fizames C, Samson D, Drouot N, Vignal A, MillasseaurP, Marc S, Hazan J, Seboun E, Lathrop M, Gyapay G, Morissette J,Meissenbach J: A comprehensive genetic map of the humangenome based on 5,624 microsatellites. Nature 1996,380:152-154.
37. Kimmel M, Chakraborty R, King JP, Bamshad M, Watkins WS, JordeLB: Signatures of population expansion in microsatelliterepeat data. Genetics 1998, 148:1921-1930.
38. Levedakou EN, Freeman DA, Budzynski MJ, Early BE, McElfresh KC,Schumm JW, Amin AS, Kim YK, Sprecher CJ, Krenke BE, Silva DA,McIntosh TM, Grubb JC, Johnston LJ, Sailus JS, Ban JD, Crouse CA,Nelson MS: Allele Frequencies for fourteen STR Loci of thePowerPlex™ 1.1 and 2.1 Multiplex Systems and Penta DLocus In Caucasians, African-Americans, Hispanics, andOther Populations of the United States of America and Bra-zil. J Forensic Sci USA 2001, 46:423-767.
39. Law MY, To KY, Ho SH, Pang BCM, Wong LM, Wun SK, Chan KL:STR data for the PowerPlex™ 16 loci for the Chinese popu-lation in Hong Kong. Forensic Sci Int 2002, 129:64-67.
40. Bosch E, Calafell F, Perez-Lezaun A, Clarimon J, Comas D, Mateu E,Martinez-Arias R, Morera B, Brakez Z, Akhayat O, Sefiani A, Hariti G,Cambon-Thomsen A, Bertranpetit J: Genetic structure of north-west Africa revealed by STR analysis. Eur J Hum Genet 2000,8:360-366.
41. Takazaki N, Nei M: Genetic distances and reconstruction ofphylogenetic trees from microsatellite DNA. Genetics 1996,144:389-399.
Page 11 of 11(page number not for citation purposes)
Copyright © 2022 FDOKUMEN