Genetic Admixture in Brazilians Exposed to Infection with Leishmania chagasi
16
Genetic Admixture in Brazilians Exposed to Infection with Leishmania chagasi N.A. ETTINGER 1,2 , P. DUGGAL 5 , R.F.S. BRAZ 6 , E.T. NASCIMENTO 7 , T.H. BEATY 5 , S.M. B. JERONIMO 6,7,8 , R.D. PEARSON 8 , J.M. BLACKWELL 9 , L. MORENO 3 , and M.E. WILSON 1,2,4,10,* 1 Interdisciplinary Graduate Program in Molecular and Cellular Biology, University of Iowa, Iowa City, IA 52242 2 Medical Scientist Training Program, University of Iowa, Iowa City, IA 52242 3 Department of Orthodontics, University of Iowa, Iowa City, IA 52242 4 Departments of Internal Medicine, Microbiology and Epidemiology, University of Iowa, Iowa City, IA 52242 5 Department of Epidemiology, Johns Hopkins University Bloomberg School of Public Health, Baltimore, MD 21205 6 Department of Parasitology and Microbiology, Universidade Federal do Rio Grande do Norte, Natal, RN 59078-970, Brazil 7 Department of Biochemistry, Universidade Federal do Rio Grande do Norte, Natal, RN 59078-970, Brazil 8 Department of Internal Medicine, University of Virginia School of Medicine; Charlottesville, VA 22903 9 Cambridge Institute for Medical Research, University of Cambridge, Cambridge CB2 2XY, UK 10 VA Medical Center, Iowa City, IA 52246 SUMMARY Visceral leishmaniasis (VL) in northeast Brazil is a disease caused by infection with the protozoan Leishmania chagasi. Infection leads to variable clinical outcomes ranging from asymptomatic infection to potentially fatal disease. Prior studies suggest the genetic background of the host contributes to the development of different outcomes after infection, although it is not known if ancestral background itself influences outcomes. VL is endemic in peri-urban areas about the city of Natal in northeast Brazil. The population of northeast Brazil is a mixture of distinct racial and ethnic groups. We hypothesized that some sub-populations may be more susceptible than others to develop different clinical outcomes after L. chagasi infection. Using microsatellite markers, we examined whether admixture of the population as a whole, or markers likely inherited from a distinct ethnic background, differed between individuals with VL, individuals with an asymptomatic infection, or individuals with no infection. There was no apparent significant difference in overall population admixture proportions among the three clinical phenotype groups. However, one marker on Chr. 22 displayed evidence of excess ancestry from putative ancestral populations among different clinical phenotypes, suggesting this region may contains genes determining the course of L. chagasi infection. * Correspondence: Dr. Mary Wilson, Dept. of Internal Medicine, University of Iowa, SW34-GH, 200 Hawkins Dr., Iowa City, IA 52242, USA; phone 319-356-3169; fax 319-384-7208; e-mail: [email protected]. NIH Public Access Author Manuscript Ann Hum Genet. Author manuscript; available in PMC 2009 August 25. Published in final edited form as: Ann Hum Genet. 2009 May ; 73(Pt 3): 304–313. doi:10.1111/j.1469-1809.2009.00510.x. NIH-PA Author Manuscript NIH-PA Author Manuscript NIH-PA Author Manuscript
-
Upload
independent -
Category
Documents
-
view
0 -
download
0
Transcript of Genetic Admixture in Brazilians Exposed to Infection with Leishmania chagasi
Genetic Admixture in Brazilians Exposed to Infection withLeishmania chagasi
N.A. ETTINGER1,2, P. DUGGAL5, R.F.S. BRAZ6, E.T. NASCIMENTO7, T.H. BEATY5, S.M. B.JERONIMO6,7,8, R.D. PEARSON8, J.M. BLACKWELL9, L. MORENO3, and M.E.WILSON1,2,4,10,*
1 Interdisciplinary Graduate Program in Molecular and Cellular Biology, University of Iowa, IowaCity, IA 522422 Medical Scientist Training Program, University of Iowa, Iowa City, IA 522423 Department of Orthodontics, University of Iowa, Iowa City, IA 522424 Departments of Internal Medicine, Microbiology and Epidemiology, University of Iowa, Iowa City,IA 522425 Department of Epidemiology, Johns Hopkins University Bloomberg School of Public Health,Baltimore, MD 212056 Department of Parasitology and Microbiology, Universidade Federal do Rio Grande do Norte,Natal, RN 59078-970, Brazil7 Department of Biochemistry, Universidade Federal do Rio Grande do Norte, Natal, RN59078-970, Brazil8 Department of Internal Medicine, University of Virginia School of Medicine; Charlottesville, VA229039 Cambridge Institute for Medical Research, University of Cambridge, Cambridge CB2 2XY, UK10 VA Medical Center, Iowa City, IA 52246
SUMMARYVisceral leishmaniasis (VL) in northeast Brazil is a disease caused by infection with the protozoanLeishmania chagasi. Infection leads to variable clinical outcomes ranging from asymptomaticinfection to potentially fatal disease. Prior studies suggest the genetic background of the hostcontributes to the development of different outcomes after infection, although it is not known ifancestral background itself influences outcomes. VL is endemic in peri-urban areas about the cityof Natal in northeast Brazil. The population of northeast Brazil is a mixture of distinct racial andethnic groups. We hypothesized that some sub-populations may be more susceptible than others todevelop different clinical outcomes after L. chagasi infection. Using microsatellite markers, weexamined whether admixture of the population as a whole, or markers likely inherited from adistinct ethnic background, differed between individuals with VL, individuals with anasymptomatic infection, or individuals with no infection. There was no apparent significantdifference in overall population admixture proportions among the three clinical phenotype groups.However, one marker on Chr. 22 displayed evidence of excess ancestry from putative ancestralpopulations among different clinical phenotypes, suggesting this region may contains genesdetermining the course of L. chagasi infection.
*Correspondence: Dr. Mary Wilson, Dept. of Internal Medicine, University of Iowa, SW34-GH, 200 Hawkins Dr., Iowa City, IA52242, USA; phone 319-356-3169; fax 319-384-7208; e-mail: [email protected].
NIH Public AccessAuthor ManuscriptAnn Hum Genet. Author manuscript; available in PMC 2009 August 25.
Published in final edited form as:Ann Hum Genet. 2009 May ; 73(Pt 3): 304–313. doi:10.1111/j.1469-1809.2009.00510.x.
NIH
-PA Author Manuscript
NIH
-PA Author Manuscript
NIH
-PA Author Manuscript
Keywordsleishmaniasis; Brazil; admixture; STRUCTURE; susceptibility; variation
INTRODUCTIONVisceral leishmaniasis (VL) is a potentially fatal disease caused by infection with theprotozoan parasite Leishmania chagasi in the New World, or L. donovani or L. infantum inthe Old World.(Wilson, et al. 2005) Infection leads to a spectrum of clinical outcomesranging from asymptomatic infection, documented by a positive delayed typehypersensitivity (DTH) skin test to Leishmania antigen in the absence of symptomaticdisease, to active disease characterized by fevers, cachexia, hepatosplenomegaly andimmunosuppression. Without treatment, most symptomatic patients die. Even withappropriate chemotherapy the mortality rate is approximately 10%.(Jeronimo, et al. 2000)VL has become endemic in peri-urban areas about the city of Natal in northeast Brazil sincethe mid-1980s.(Jeronimo, et al. 1994; Jeronimo, et al. 2004)
Genetic admixture reflects migration and mating between individuals from geneticallydistinct parental populations.(Griffiths, et al. 1999) Brazil’s complex history of colonialismand the trans-Atlantic slave trade contribute to a highly admixed population. Overall, it isestimated 58% of immigrants who arrived in Brazil between 1500 and 1972 were European-derived, 40% were African-derived, and 2% were Asian-derived.(Callegari-Jacques &Salzano 1999) Natal, the capital city of the northeastern state of Rio Grande do Norte, wasfounded in 1599 by the Portuguese, although other Europeans including Dutch and Frenchalso settled in this area. Africans brought to northeast Brazil as slaves were primarily fromthe Congo, Angola and Guinea.(Salas, et al. 2004) Native South American influences areprimarily from the Potiguara (Tupi) and Cariri tribes.(Krieger, et al. 1965; Da Silva, et al.1981) Although other ethnic populations have played a role in the history of other regions ofBrazil (e.g. Japanese, Germans and Italians in the south of Brazil), in the northeast, theprimary contributors to the current population have been European, African and NativeBrazilian.(Instituto Brasileiro de Geografia Estatistica [IBGE] 2007)
Our previously published analyses of this population(Jeronimo, et al. 1994; Jeronimo, et al.2004; Jeronimo, et al. 2007a; Jeronimo, et al. 2007b) and other studies of VL inBrazil(Cabello, et al. 1995; Blackwell, et al. 1997; Jamieson, et al. 2007) andSudan(Mohamed, et al. 2003; Bucheton, et al. 2003; Mohamed, et al. 2004; Miller, et al.2007) suggest a strong genetic contribution to the outcome of infection with visceralizingLeishmania species. We hypothesized sub-populations of individuals with different ethniccontributions, when exposed to Leishmania, are likely to develop different clinical outcomesof infection. We tested this hypothesis by examining whether admixture proportions of thepopulation as a whole and whether admixture contributions at specific genomic regionsdiffered between defined clinical phenotypes. Our approach to test this hypothesis employedmicrosatellite marker data from a genome-wide linkage scan,(Jeronimo, et al. 2007a)compared with microsatellite marker data from the CEPH Human Genome DiversityProject.(Cann, et al. 2002; Rosenberg, et al. 2002) With these genetic markers, wedetermined the ethnic contributions to our population as a whole and found regions wherecontributions from different ancestral backgrounds differed between phenotypic groups.Genes in these regions now become candidates for further studies of susceptibility tovisceral leishmaniasis.
ETTINGER et al. Page 2
Ann Hum Genet. Author manuscript; available in PMC 2009 August 25.
NIH
-PA Author Manuscript
NIH
-PA Author Manuscript
NIH
-PA Author Manuscript
SUBJECTS, MATERIALS AND METHODSBrazilian study participants
Brazilian subjects living in neighborhoods with endemic L. chagasi infection were recruitedfor a family study described elsewhere.(Jeronimo, et al. 2004; Jeronimo, et al. 2007a) In thecurrent study, three mutually exclusive phenotype categories were employed: (1) VL:subjects who had either ongoing or a history of active, symptomatic VL disease. (2) DTH+:subjects with no history of documented VL who had a positive DTH skin test to Leishmaniaantigen.(Melo, et al. 1977) These individuals had likely had an asymptomatic infection inthe past, and might be immune to reinfection with L. chagasi. (3) DTH−: subjects who livedin a household where 40% or more family members were infected (VL+ or DTH+), andeither in or near a household where an active case of VL had occurred, but they themselveshad a negative Montenegro test, negative serology, and no history of VL.
Ethical approvalsApproval for work with human subjects was obtained from the Ethical Research Committeeat the Universidade Federal do Rio Grande do Norte, the Comissão Nacional de Ètica emPesquisa (CONEP), the University of Iowa, Johns Hopkins University, the University ofVirginia and the National Institutes of Health/National Human Genome Research Instituteboards. The UFRN Institutional Review Board is registered with the NIH. All subjects orguardians of minors signed an approved informed consent in Portuguese.
Genotype DataA total of 405 (385 autosomal, 20 sex chromosomal) multiallelic microsatellite markersacross the genome were typed on 1254 individuals from 191 families at the Center forInherited Disease Research (CIDR).(Jeronimo, et al. 2007a) Initially, we selected all personswho did not have parents in the database (irrespective of clinical phenotype) and designatedthis group as our ‘Natal Founders’ group (n=321). This group was used to calculate overalladmixture proportions of this Natal cohort and for preliminary analysis of the statisticalmodels. Subsequent analysis of the three specific clinical phenotype groups wasaccomplished by again searching through all family pedigrees and choosing unrelatedindividuals from each phenotype group with genotype data available (VL+, n=105; DTH+,n=193; DTH−, n=110).
The microsatellite markers used for the Natal data were based on the Marshfield GeneticsVersion 8 marker set with modifications as outlined on the CIDR website. CEPH HumanGenome Diversity Project data were downloaded from Dr. Noah Rosenberg’s website.Lymphoblastoid cell lines from 52 indigenous populations were genotyped at 377microsatellite markers(Rosenberg, et al. 2002; Rosenberg, 2006) covering all autosomesusing a marker set modified from the Marshfield Genetics Version 10 marker set. Ideally toanalyze our Natal, Brazil cohort, we would have preferred to use specific genotype datafrom Angola, the Congo Basin and Portuguese Europeans. Because genotype data fromthese populations are not publicly available, ancestral populations used as training data forour study were chosen from 3 continental groups of CEPH Diversity genotype data:European [French and Basque, n=52 total], African [Mandenka and Yoruba, n=44 total]and native Brazilian [Surui and Karitiana, n=22 total] after excluding all relatedindividuals.(Rosenberg, 2006) It is likely that Natal’s “true” ancestral populations aredifferent from the “putative” ancestral populations used in our analyses. However,Rosenberg (Rosenberg, et al. 2002) suggested inter-continental ethnic differences are largerthan most intra-continental ethnic differences. Therefore, use of these population groups astraining data for the Structure program should provide a reasonable approximation to thetrue ethnic background.
ETTINGER et al. Page 3
Ann Hum Genet. Author manuscript; available in PMC 2009 August 25.
NIH
-PA Author Manuscript
NIH
-PA Author Manuscript
NIH
-PA Author Manuscript
Of the 377 autosomal markers in the CEPH Diversity marker set, 289 were common to theCIDR marker set. To accommodate slight variations in allele size due to genotyping theCEPH Diversity data and the CIDR data on different platforms at different institutions, theCEPH Diversity data were manually re-binned to match the amplified allele sizes of theCIDR data for all 289 overlapping markers, using two CEPH individuals who had beengenotyped by both CIDR and the CEPH Diversity Project (CEPH individuals 1331-01 and1331-02) as a reference.
Structure Data AnalysisSTRUCTURE v.2.1(Falush, et al. 2003) uses Bayesian inference and Monte Carlo MarkovChain (MCMC) modeling to cluster multi-locus genotype data into a user-specified numberof subpopulations (K). STRUCTURE has two primary outputs: estimated admixtureproportions both for each experimental individual and for the experimental group as awhole, and an estimated ‘Posterior Probability’ (PP) expressed as an estimated naturallogarithm for the probability of the ‘fit’ of the experimental data to the training data underthe model being tested.(Pritchard, et al. 2003) Less negative PPs indicate a better ‘fit’ of themodel. After initial testing, we used a burnin of 20,000 iterations and an MCMC run of10,000 iterations. All models were run at least three times. All PPs are the mean of at leastthree runs. We tested three different statistical models; (i) admixture model/correlated allelefrequencies, (ii) admixture model/independent allele frequencies, and (iii) linkage model/independent allele frequencies.
Z-Score Calculation and AnalysisFollowing the method of Zhu, et al.,(Zhu, et al. 2005) excess ancestry (EA) for eachpopulation (African, European or native Brazilian) at each marker was calculated for each ofthe three clinical phenotype groups (VL+, DTH+, DTH−) using estimated admixture datafrom the primary STRUCTURE clustering assuming K=3 under the linkage/independentallele frequencies model for each individual. First, for each individual, the estimatedgenome-wide ancestry from each hypothetical ancestral population (Mi) and for each marker(qil) was obtained from the primary STRUCTURE results. These data were used to calculatefor marker location l and for each clinical phenotype group (in comparison to each of the
three ancestral populations), ΔΠl, where . We next calculated the EA as
a Z-score, where . Z score distributions are plotted in Figure 4 andSupplementary Figure 1. Significant EA for each ancestral background at individual markersin a given clinical phenotype group was defined as markers yielding a |Z-score| > 2 and anempiric p value < 0.0005.
Empiric p-values for each Z-score were generated by permutation. A group of individualswas randomly chosen from the total data set of all three clinical phenotype groups and thenEA Z-scores were re-calculated at each marker and for each ancestral background in thisrandomly chosen group. A running tabulation was maintained for markers where thesecalculated |Z-scores| on the permuted data set were >2. This was repeated 10,000 times forall markers. These tabulations were then divided by 10,000 to generate empiric p-values ateach marker relative to each ancestral background (e.g. a p-value = 0.0010 represents amarker with a Z-score > 2 only 10 times out 10,000).
Z-scores > 2 for a particular marker, relative to a particular ancestral group, should indicatethe presence of alleles in that clinical phenotype group derived from one particular ancestralgroup more than expected. Similarly, Z-scores < −2 at a particular marker should indicate
ETTINGER et al. Page 4
Ann Hum Genet. Author manuscript; available in PMC 2009 August 25.
NIH
-PA Author Manuscript
NIH
-PA Author Manuscript
NIH
-PA Author Manuscript
the unexpected absence of alleles derived from a putative ancestral group in that clinicalphenotype group.
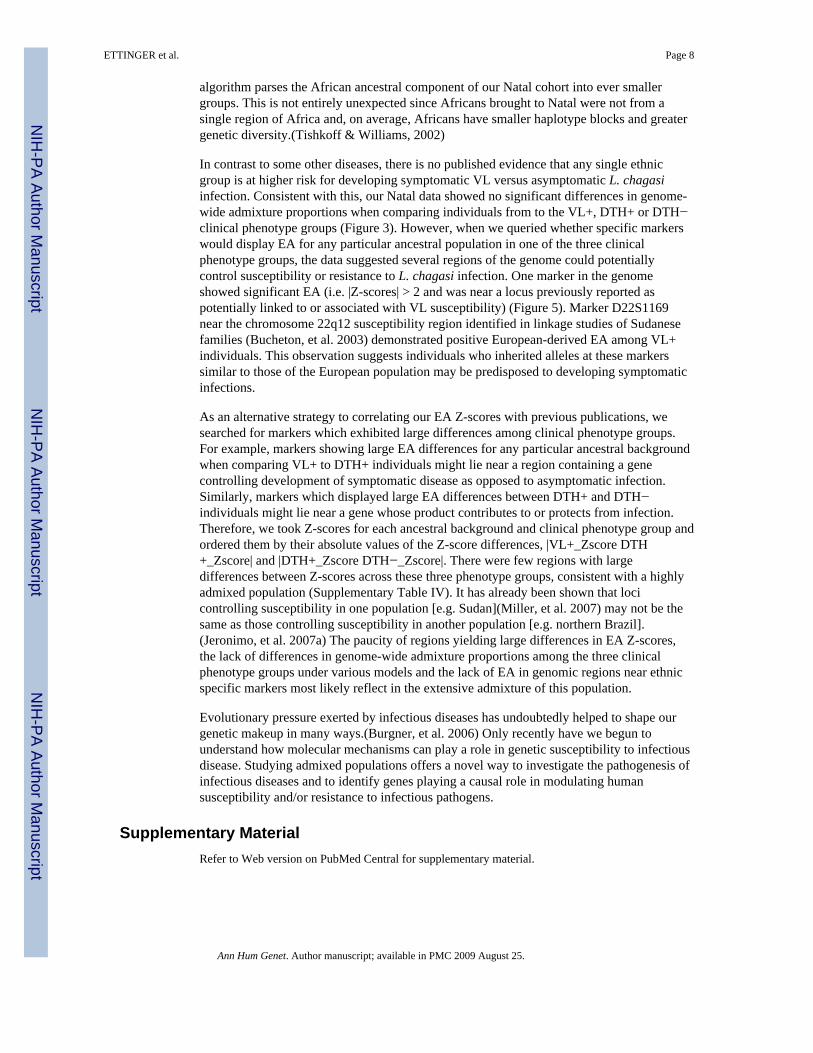
RESULTSSupplementary Table I shows the distribution by gender and age for all the individuals usedin our analysis (n=439). As an initial test of our method, genotypes of the six CEPHDiversity populations were analyzed by unsupervised clustering using STRUCTURE withthe ‘admixture/correlated allele frequency model’ assuming three subpopulations (K=3;Figure 1). This analysis correctly identified and clustered each individual in the six CEPHDiversity populations into three continental groups. Some European individuals sharedgenetic similarities with native Brazilians (as evidenced by the slight red at the top of someof the European individuals) and there was apparently one native Brazilian individual withsome European ancestry (see the green section contained within one of the nativeBrazilians). Since our CEPH Diversity populations were approximations of the known“true” ancestral populations, we did not test clustering of the CEPH Diversity project databeyond K > 3. Our interest was only to evaluate whether there were measurable differencesamong the “continental” groups, not differences specific to a particular ethnic group.Therefore, although genotype data from all six CEPH Diversity populations were used oursubsequent analyses, we felt it simplest to conceptualize the data in reference to these threecontinental groups (European, African, Native Brazilian).
Next, using the CEPH Diversity populations as ‘training data,’ we performed a supervisedclustering of genotype data from unrelated individuals in our ‘Natal Founders’ cohort(n=321) under the ‘admixture model’, testing both the correlated allele frequency and theindependent allele frequency models for various values of K. Under the assumption thatK=3 (Figure 2), our ‘Natal Founders’ group clustered more closely with the European andAfrican data than the native Brazilian data. Subsequent analysis suggested the independentallele frequency model and higher values of K improved the supervised clustering (i.e.improved the ‘fit’) of our data (data not shown). We also analyzed our Natal Founderscohort to test whether removing one or more hypothetical ancestral populations wouldimprove the fit to data from the Natal Founders. Removing either the Basque or Mandenkadata only marginally improved the PPs at K=3, 4 or 5 (Supplementary Table II). Therefore,all six of the initial CEPH Diversity data sets were retained in subsequent analysis of clinicalphenotypes.
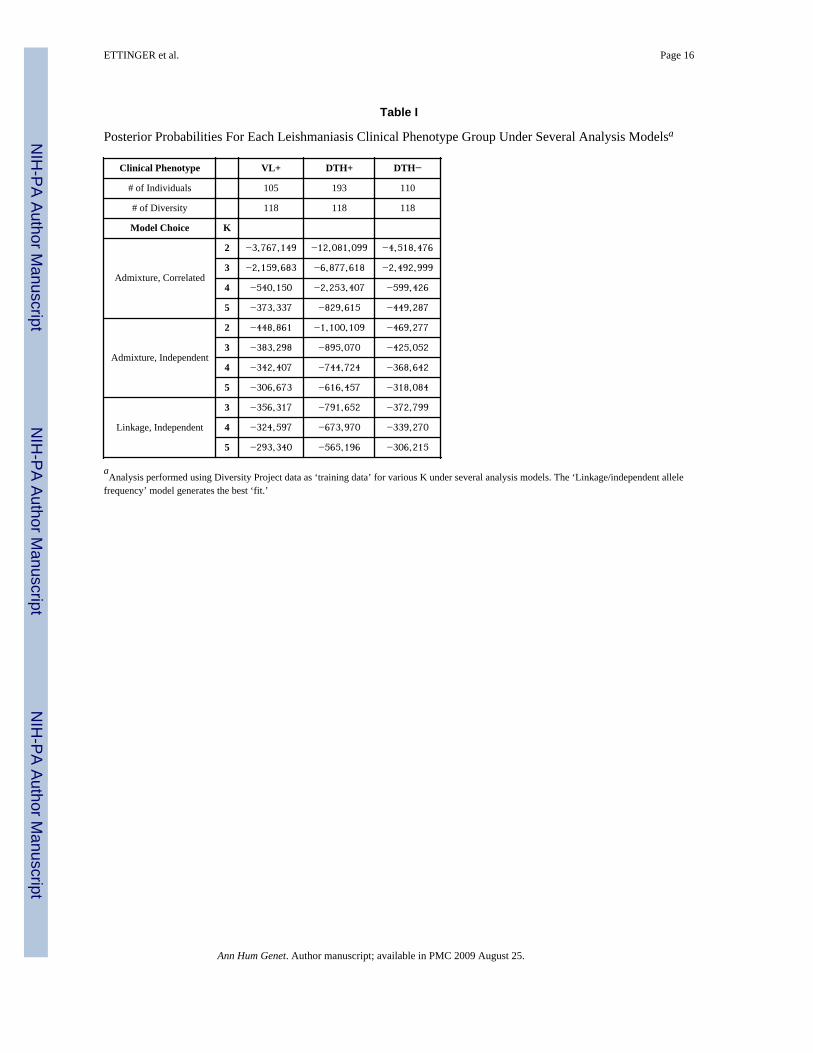
Next, we performed separate supervised clusterings for each of the three clinical phenotypegroups (VL+, n=105; DTH+, n=193; DTH−, n=110,) using individuals from all six CEPHDiversity populations grouped into the 3 continental groups as training data (See Methodssection for details of phenotype definitions). Table I shows the PPs for the VL+, DTH+ orDTH− phenotype groups analyzed under the Admixture model, assuming either correlatedallele frequencies or independent allele frequencies for K = 2–5. (K=1 and K=6 were alsotested, but these data are not shown.) Within each clinical phenotype, the trend was similar:as K increased up to 6, PP values became less negative, indicating an improved fit.Additionally, for each value of K, the independent allele frequency models fit the data betterthan the correlated models and the ‘linkage/independent allele frequencies’ modeloutperformed the ‘admixture/independent allele frequencies’ model (Table I). As describedin Falush, et al.,(Falush, et al. 2003) the ‘admixture model’ allows individuals to have mixedancestry and assumes each individual will have some fraction of their genome inheritedfrom one of the K reference populations. The ‘linkage model’ is a generalization of thisadmixture model that incorporates multipoint analysis and admixture linkage disequilibrium(see Methods).
ETTINGER et al. Page 5
Ann Hum Genet. Author manuscript; available in PMC 2009 August 25.
NIH
-PA Author Manuscript
NIH
-PA Author Manuscript
NIH
-PA Author Manuscript
Figure 3 graphically summarizes results from supervised clusterings of each clinicalphenotype group (VL+ vs. DTH+ vs. DTH−) using all six CEPH Diversity populations(represented as three continental groups) employing the ‘linkage/independent allelefrequency’ model assuming K = 3, 4 or 5. Two main conclusions can be drawn. First, foreach value of K, the three lines representing the three different phenotype groups essentiallyoverlap, indicating no significant genome-wide differences in admixture proportions whencomparing the VL+ group vs. the DTH+ group vs. the DTH− group; i.e. there was not adistinct ethnic group over-represented in one of these phenotype groups. Second, as Kincreased, even though the overall ‘fit’ of the data improved (Table I), the proportion ofEuropean ancestry for each clinical group changed very little. In contrast, when K wasincreased from 3 to 5 the proportion of native Brazilian and African ancestry droppedconsiderably.
Since we did not see evidence of genome-wide differences in admixture proportions, wenext analyzed each individual marker for evidence of excess ancestry (EA) to determinewhether portions of chromosomes derived from distinct ethnic backgrounds might be over-represented in one of the phenotype groups, which could contain potential susceptibilitygenes. We followed the methodology of Zhu, et al.,(Zhu, et al. 2005) which generates anestimated EA Z-score for each individual marker relative to the three putative continentalbackgrounds (K=3, representing European, African, Native Brazilian ancestral populations)for each clinical phenotype group (see the Methods section for a detailed explanation). Wechose an EA Z-score cutoff of ±2, which should represent the 5% most outlying data. Zscore distributions for the African-derived, European-derived and Native Brazilian-derivedDTH+ clinical phenotype group are plotted in Figure 4. Distribution plots for all otherclinical phenotype groups were similar (Supplementary Figure 1). Statistical significancewas assessed via permutation using randomly chosen phenotype groups to re-calculate Z-scores as a way to generate empiric p-values for each marker (as explained in the Methodssection). Selected allele frequency (AF) data are presented in Figure 5. Among 289 testedmarkers, only 51 markers had Z-scores >2, or <−2 in at least one comparison (i.e. at leastone phenotypic group showed a significant Z-score when considering one referencepopulation). Of those 51 markers, only 1 marker on chromosome 22 retained statisticalsignificance after permutation. The data for all 51 markers with |Z-scores| > 2 and theirassociated p-values are listed in Supplementary Table III.
SLC11A1 (which encodes a pH-dependent divalent cation carrier previously calledNRAMP1), TNFA encoding TNF-α and markers on Chromosome 22q12 have all beenreported to be associated with or to be linked to genes controlling susceptibility to VL.(Blackwell, et al. 1997; Bucheton, et al. 2003; Karplus, et al. 2002) The chromosome 22q12region has shown evidence of linkage for VL in some Sudanese populations.(Bucheton, etal. 2003) In our data, a marker near this region (D22S1169) also showed European-derivedEA Z-scores >2 for VL+ individuals only (p < 0.0001) (Figure 5).
Previous work has shown different markers in TNFA, which encodes the TNF-α geneproduct, are associated with different phenotypic outcomes of leishmania infection, andvarying levels of serum TNF-α have been associated with different clinical forms ofleishmaniasis. (Karplus, et al. 2002) In addition, the gene SLC11A1 (NRAMP1) has beenshown both in animal models and in some human populations to contribute to susceptibilityto Leishmania infection. (Blackwell, et al. 1997) Nonetheless, after permutation we did notfind evidence for significant EA at marker D2S427 near SLC11A1 or at D6S2439 nearTNFA for any ancestral background across any of the three clinical phenotypes.
In contrast to a disorder like cleft lip where the dichotomous definitions of ‘affected’ and‘unaffected’ can be clearly delineated, we have ordinal categories of clinical disease in
ETTINGER et al. Page 6
Ann Hum Genet. Author manuscript; available in PMC 2009 August 25.
NIH
-PA Author Manuscript
NIH
-PA Author Manuscript
NIH
-PA Author Manuscript

response to infection: individuals who have symptomatic disease (VL+), individuals whohave been exposed but who have controlled the infection (DTH+) and individuals who havebeen exposed but show no evident immune response to the parasite (DTH−). These orderedgroups should be regarded as corresponding to different host innate and/or adaptive immuneresponses. Therefore, to make comparisons with physiological relevance, we examinedmarkers with the highest differences in the EA Z-scores between the VL+ group versus theDTH+ group or the difference in the EA Z-scores of the DTH+ group versus the DTH−group (Supplementary Table IV). Chromosomes 1 and 4 each had several markers withlarge differences in Z-scores. Interestingly, some markers were found to have large EAvalues (i.e., |Z-scores| > 2) for all clinical phenotype and permutation groups examined (i.e.their empiric p-values were close to 1). These most likely reflect ethnic-specific markers(Supplementary Table III) but are not associated with our phenotypes.
There are several genes known to have clear allelic differences among ancestral populations,including SLC24A5 (a cation exchange channel at 15q21.1 identified as influencing skinpigmentation(Lamason, et al. 2005)), DARC (the Duffy antigen at 1q21-q22(Hamblin, et al.2002)), LCT (the lactase gene at 2q21(Tishkoff, et al. 2007)) and ABCC11 (the earwax geneat 16q12.1(Yoshiura, et al. 2006)). In our data, there were no significant EA Z-scores formarkers near any of these genes when comparing any of the thee clinical phenotypesexamined here (data not shown).
DISCUSSIONStudies of human leishmaniasis have identified several genes and/or regions that maycontain genes controlling susceptibility to clinical outcomes of infection in exposedpopulations.(Jeronimo, et al. 2007a; Blackwell, et al. 1997; Jamieson, et al. 2007; Bucheton,et al. 2003; Karplus, et al. 2002) Here, we examine leishmaniasis in a Brazilian populationendemic for Leishmania chagasi, the cause of South American visceral leishmaniasis (VL).This study tested the hypothesis that individuals in each of three clinical phenotype groupsmight have different levels of admixture of ancestral backgrounds compared to the overallpopulation, either overall or at specific markers. We considered three distinct clinicalphenotypes: symptomatic infection (VL+), asymptomatic self-curing infection (DTH+), andliving in a highly endemic situation without apparent immune response to the parasite (DTH−). We estimated genetic admixture of these exposed individuals using microsatellite markerdata from a genome wide linkage scan in a family study.(Jeronimo, et al. 2007a) Althoughthere were no detectable overall differences in admixture proportions among clinicalphenotypes (Figure 3), we were able to detect one marker with significant excess ancestry(EA) for a particular clinical phenotype group compared to the other two groups(D22S1169, Figure 5). This region of EA warrants further investigation to identify candidatesusceptibility genes predisposing to disease status.
Earlier studies of genetic admixture in this region of Brazil using limited numbers of geneticmarkers (e.g. red blood cell and serum protein polymorphisms) estimated Brazilians in Natalhad approximately 58% European ancestry, 25–30% African ancestry and 11–17% NativeBrazilian ancestry.(Krieger, et al. 1965; Franco, et al. 1982) We compared our Natalsubjects to groups of unrelated individuals representing European [French and Basque],African [Mandenka and Yoruba] and native Brazilian [Surui and Karitiana] populationsdrawn from the CEPH Human Genome Diversity Project. Analysis of the 321 unrelatedindividuals in our ‘Natal Founders’ group exhibited approximately 47% European, 29%African and 24% Native Brazilian ancestry (Figure 2). Interestingly, when we increased thenumber of hypothetical sub-populations (K) in our analysis, the putative Europeancomponent did not change appreciably, whereas both the African and native Braziliancomponents decreased (Figure 3). These results suggest as K increases, the STRUCTURE
ETTINGER et al. Page 7
Ann Hum Genet. Author manuscript; available in PMC 2009 August 25.
NIH
-PA Author Manuscript
NIH
-PA Author Manuscript
NIH
-PA Author Manuscript
algorithm parses the African ancestral component of our Natal cohort into ever smallergroups. This is not entirely unexpected since Africans brought to Natal were not from asingle region of Africa and, on average, Africans have smaller haplotype blocks and greatergenetic diversity.(Tishkoff & Williams, 2002)
In contrast to some other diseases, there is no published evidence that any single ethnicgroup is at higher risk for developing symptomatic VL versus asymptomatic L. chagasiinfection. Consistent with this, our Natal data showed no significant differences in genome-wide admixture proportions when comparing individuals from to the VL+, DTH+ or DTH−clinical phenotype groups (Figure 3). However, when we queried whether specific markerswould display EA for any particular ancestral population in one of the three clinicalphenotype groups, the data suggested several regions of the genome could potentiallycontrol susceptibility or resistance to L. chagasi infection. One marker in the genomeshowed significant EA (i.e. |Z-scores| > 2 and was near a locus previously reported aspotentially linked to or associated with VL susceptibility) (Figure 5). Marker D22S1169near the chromosome 22q12 susceptibility region identified in linkage studies of Sudanesefamilies (Bucheton, et al. 2003) demonstrated positive European-derived EA among VL+individuals. This observation suggests individuals who inherited alleles at these markerssimilar to those of the European population may be predisposed to developing symptomaticinfections.
As an alternative strategy to correlating our EA Z-scores with previous publications, wesearched for markers which exhibited large differences among clinical phenotype groups.For example, markers showing large EA differences for any particular ancestral backgroundwhen comparing VL+ to DTH+ individuals might lie near a region containing a genecontrolling development of symptomatic disease as opposed to asymptomatic infection.Similarly, markers which displayed large EA differences between DTH+ and DTH−individuals might lie near a gene whose product contributes to or protects from infection.Therefore, we took Z-scores for each ancestral background and clinical phenotype group andordered them by their absolute values of the Z-score differences, |VL+_Zscore DTH+_Zscore| and |DTH+_Zscore DTH−_Zscore|. There were few regions with largedifferences between Z-scores across these three phenotype groups, consistent with a highlyadmixed population (Supplementary Table IV). It has already been shown that locicontrolling susceptibility in one population [e.g. Sudan](Miller, et al. 2007) may not be thesame as those controlling susceptibility in another population [e.g. northern Brazil].(Jeronimo, et al. 2007a) The paucity of regions yielding large differences in EA Z-scores,the lack of differences in genome-wide admixture proportions among the three clinicalphenotype groups under various models and the lack of EA in genomic regions near ethnicspecific markers most likely reflect in the extensive admixture of this population.
Evolutionary pressure exerted by infectious diseases has undoubtedly helped to shape ourgenetic makeup in many ways.(Burgner, et al. 2006) Only recently have we begun tounderstand how molecular mechanisms can play a role in genetic susceptibility to infectiousdisease. Studying admixed populations offers a novel way to investigate the pathogenesis ofinfectious diseases and to identify genes playing a causal role in modulating humansusceptibility and/or resistance to infectious pathogens.
Supplementary MaterialRefer to Web version on PubMed Central for supplementary material.
ETTINGER et al. Page 8
Ann Hum Genet. Author manuscript; available in PMC 2009 August 25.
NIH
-PA Author Manuscript
NIH
-PA Author Manuscript
NIH
-PA Author Manuscript
AcknowledgmentsThis work was supported in part by NIH R01 grants AI048822, AI067874, and AI045540 from the NationalInstitutes of Health (MEW), Merit Review and Gulf War RFA grants from the Department of Veterans’ Affairs(MEW), NIH TMRC grant P50 AI-30639 (RFSB, ETN, SMBJ, RDP) and in part by the Intramural ResearchProgram of the National Human Genome Research Institute, National Institutes of Health. The work of NAE wassupported by NIH T32 AI07511.
Abbreviations used
VL visceral leishmaniasis
DTH delayed type hypersensitivity
CIDR Center for Inherited Diseases Research
PP posterior probability
MCMC Monte Carlo Markov Chain
EA excess ancestry
AF allele frequency
VL+ individuals with documented current or historical symptomatic infection
DTH+ individuals with documented asymptomatic infection
DTH− individuals with a documented negative DTH reaction who live in an endemichousehold
ReferencesBlackwell JM, et al. Immunogenetics of leishmanial and mycobacterial infections: the Belem Family
Study. Philos Trans R Soc Lond, B, Biol Sci. 1997; 352:1331–1345. [PubMed: 9355125]Bucheton B, et al. A major susceptibility locus on chromosome 22q12 plays a critical role in the
control of kala-azar. Am J Hum Genet. 2003; 73:1052–1060. [PubMed: 14557985]Burgner D, et al. Genetic susceptibility to infectious diseases: big is beautiful, but will bigger be even
better? Lancet Infect Dis. 2006; 6:653–663. [PubMed: 17008174]Cabello PH, et al. Familial aggregation of Leishmania chagasi infection in Northeastern Brazil. Am J
Trop Med Hyg. 1995; 52:364–365. [PubMed: 7741179]Callegari-Jacques SM, Salzano FM. Brazilian Indian/non-Indian interactions and their effects. Ciênc
Cult. 1999; 51:166–174.Cann HM, et al. A Human Genome Diversity Cell Line Panel. Science. 2002; 296:261b–262.
[PubMed: 11954565]Da Silva MIAF, et al. Migration, inbreeding, blood groups and hemoglobin types in Natal, Brazil. Stud
Phys Anthropol. 1981; 7:3–11.Falush D, et al. Inference of population structure using multilocus genotype data: linked loci and
correlated allele frequencies. Genetics. 2003; 164:1567–1587. [PubMed: 12930761]Franco MHLP, et al. Blood polymorphisms and racial admixture in two Brazilian populations. Am J
Phys Anthropol. 1982; 58:127–132. [PubMed: 7114199]Griffiths, AJF.; Gelbart, WM., et al. Modern Genetic Analysis. 1. New York: W.H. Freeman; 1999.Hamblin MT, et al. Complex signatures of natural selection at the Duffy blood group locus. Am J Hum
Genet. 2002; 70:369–383. [PubMed: 11753822]Instituto Brasileiro de Geografia Estatística [IBGE]. Brasil: 500 Anos de Povoamento. Available:
http://www.ibge.gov.br/brasil500/index2.htmlJamieson SE, et al. Genome-wide scan for visceral leishmaniasis susceptibility genes in Brazil. Genes
Immun. 2007; 8:84–90. [PubMed: 17122780]
ETTINGER et al. Page 9
Ann Hum Genet. Author manuscript; available in PMC 2009 August 25.
NIH
-PA Author Manuscript
NIH
-PA Author Manuscript
NIH
-PA Author Manuscript
Jeronimo SMB, et al. An emerging peri-urban pattern of infection with Leishmania chagasi, theprotozoan causing visceral leishmaniasis in Northeast Brazil. Scand J Infect Dis. 2004; 36:443–449. [PubMed: 15307565]
Jeronimo SMB, et al. Genetic predisposition to self-curing infection with the protozoan Leishmaniachagasi: a genomewide scan. J Infect Dis. 2007a; 196:1261–1269. [PubMed: 17955446]
Jeronimo SMB, et al. Genes at human chromosome 5q31.1 regulate delayed-type hypersensitivityresponses associated with Leishmania chagasi infection. Genes Immun. 2007b; 8:539–551.[PubMed: 17713557]
Jeronimo SMB, et al. An urban outbreak of visceral leishmaniasis in Natal, Brazil. Trans R Soc TropMed Hyg. 1994; 88:386–388. [PubMed: 7570812]
Jeronimo SMB, et al. Natural history of Leishmania (Leishmania) chagasi infection in NortheasternBrazil: long-term follow-up. Clin Infect Dis. 2000; 30:608–609. [PubMed: 10722458]
Karplus TM, et al. Association between the tumor necrosis factor locus and the clinical outcome ofLeishmania chagasi infection. Infect Immun. 2002; 70:6919–6925. [PubMed: 12438370]
Krieger H, et al. Racial admixture in north-eastern Brazil. Ann Hum Genet. 1965; 29:113–125.[PubMed: 5863835]
Lamason RL, et al. SLC24A5, a putative cation exchanger, affects pigmentation in zebrafish andhumans. Science. 2005; 310:1782–1786. [PubMed: 16357253]
Melo MN, et al. Padronizacao do Antigeno de Montenegro [Standardization of the Montenegroantigen]. Rev Inst Med Trop São Paulo. 1977; 19:161–164.
Miller EN, et al. Y chromosome lineage- and village-specific genes on chromosomes 1p22 and 6q27control visceral leishmaniasis in Sudan. PLoS Genet. 2007; 3:e71. [PubMed: 17500593]
Mohamed HS, et al. Genetic susceptibility to visceral leishmaniasis in The Sudan: linkage andassociation with IL4 and IFNGR1. Genes Immun. 2003; 4:351–355. [PubMed: 12847550]
Mohamed HS, et al. SLC11A1 (formerly NRAMP1) and susceptibility to visceral leishmaniasis in TheSudan. Eur J Hum Genet. 2004; 12:66–74. [PubMed: 14523377]
Pritchard JK, et al. Structure. 2003:2.1.Rosenberg NA. Standardized subsets of the HGDP-CEPH Human Genome Diversity Cell Line Panel,
accounting for atypical and duplicated samples and pairs of close relatives. Ann Hum Genet. 2006;70:841–847. [PubMed: 17044859]
Rosenberg NA, et al. Genetic structure of human populations. Science. 2002; 298:2381–2385.[PubMed: 12493913]
Salas A, et al. The African diaspora: mitochondrial DNA and the Atlantic slave trade. Am J HumGenet. 2004; 74:454–465. [PubMed: 14872407]
Tishkoff SA, et al. Convergent adaptation of human lactase persistence in Africa and Europe. NatGenet. 2007; 39:31–40. [PubMed: 17159977]
Tishkoff SA, Williams SM. Genetic analysis of African populations: human evolution and complexdisease. Nat Rev Genet. 2002; 3:611–621. [PubMed: 12154384]
Wilson ME, et al. Immunopathogenesis of infection with the visceralizing leishmania species. MicrobPathog. 2005; 38:147–160. [PubMed: 15797810]
Yoshiura K, et al. A SNP in the ABCC11 gene is the determinant of human earwax type. Nat Genet.2006; 38:324–330. [PubMed: 16444273]
Zhu X, et al. Admixture mapping for hypertension loci with genome-scan markers. Nat Genet. 2005;37:177–181. [PubMed: 15665825]
ETTINGER et al. Page 10
Ann Hum Genet. Author manuscript; available in PMC 2009 August 25.
NIH
-PA Author Manuscript
NIH
-PA Author Manuscript
NIH
-PA Author Manuscript
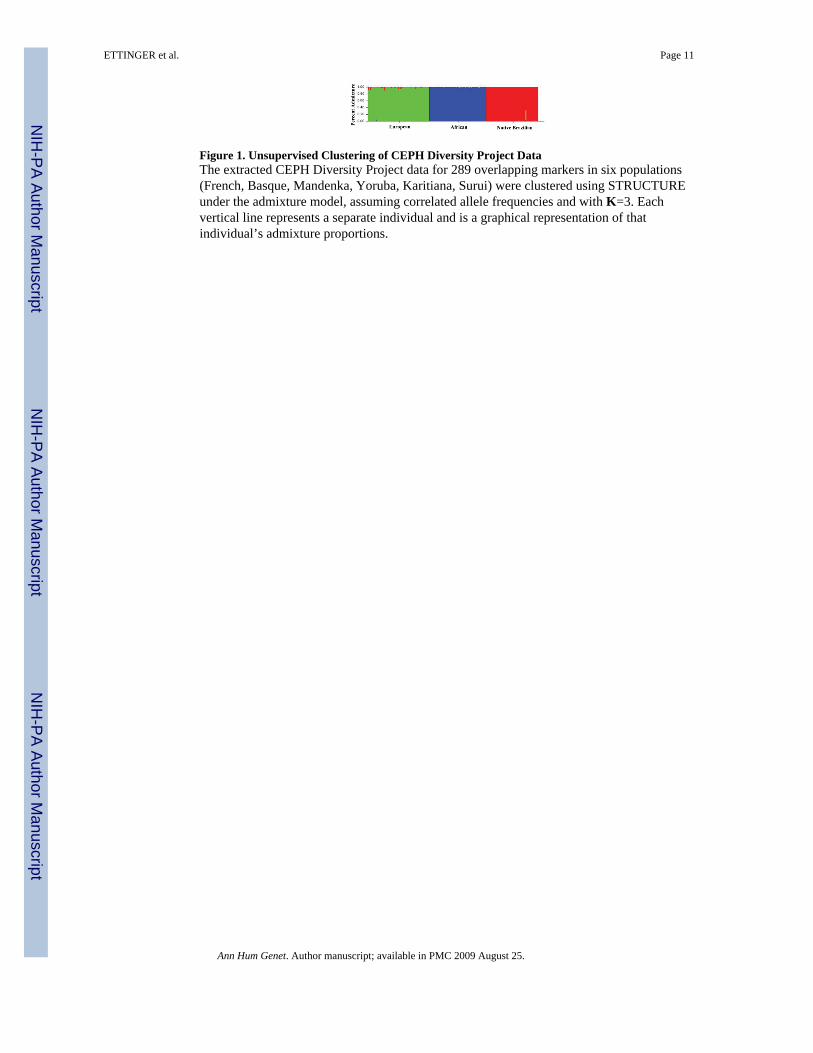
Figure 1. Unsupervised Clustering of CEPH Diversity Project DataThe extracted CEPH Diversity Project data for 289 overlapping markers in six populations(French, Basque, Mandenka, Yoruba, Karitiana, Surui) were clustered using STRUCTUREunder the admixture model, assuming correlated allele frequencies and with K=3. Eachvertical line represents a separate individual and is a graphical representation of thatindividual’s admixture proportions.
ETTINGER et al. Page 11
Ann Hum Genet. Author manuscript; available in PMC 2009 August 25.
NIH
-PA Author Manuscript
NIH
-PA Author Manuscript
NIH
-PA Author Manuscript
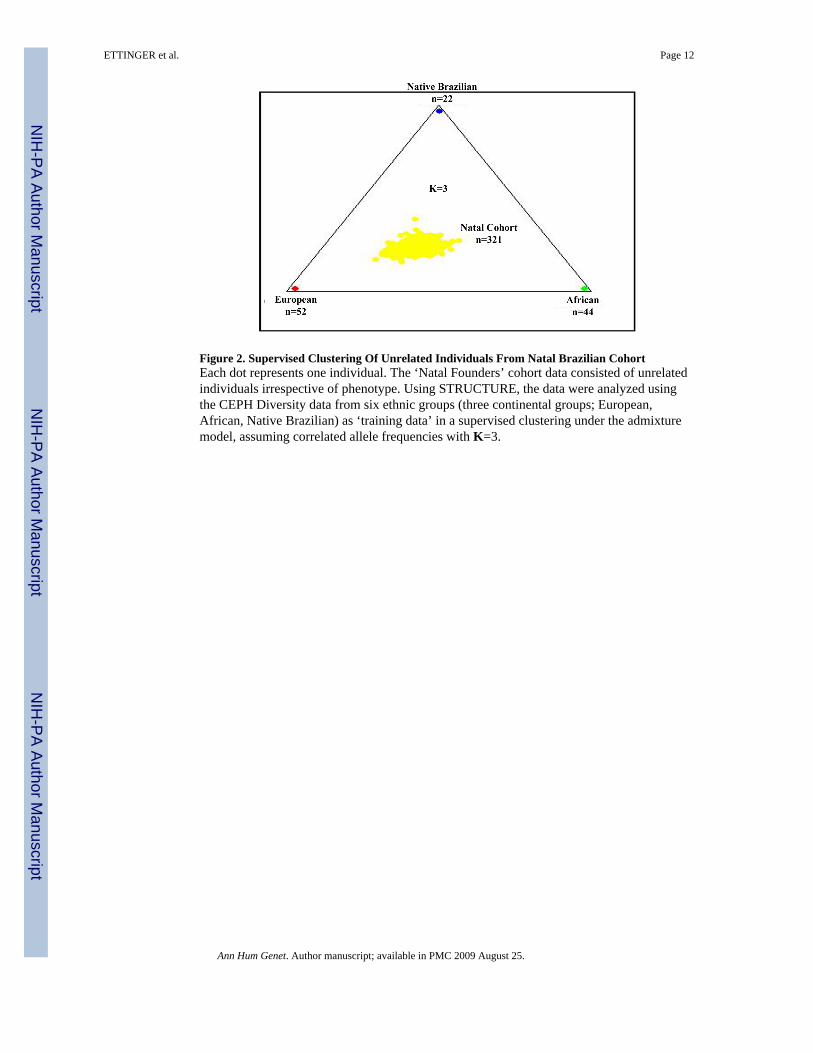
Figure 2. Supervised Clustering Of Unrelated Individuals From Natal Brazilian CohortEach dot represents one individual. The ‘Natal Founders’ cohort data consisted of unrelatedindividuals irrespective of phenotype. Using STRUCTURE, the data were analyzed usingthe CEPH Diversity data from six ethnic groups (three continental groups; European,African, Native Brazilian) as ‘training data’ in a supervised clustering under the admixturemodel, assuming correlated allele frequencies with K=3.
ETTINGER et al. Page 12
Ann Hum Genet. Author manuscript; available in PMC 2009 August 25.
NIH
-PA Author Manuscript
NIH
-PA Author Manuscript
NIH
-PA Author Manuscript
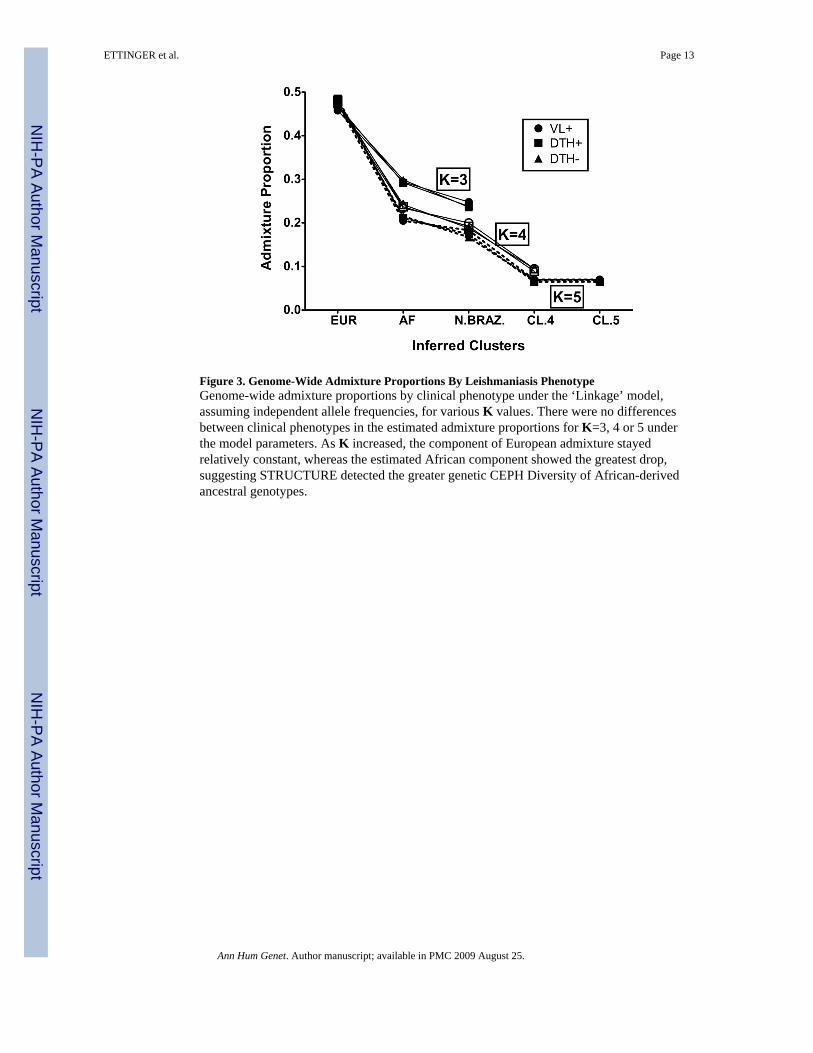
Figure 3. Genome-Wide Admixture Proportions By Leishmaniasis PhenotypeGenome-wide admixture proportions by clinical phenotype under the ‘Linkage’ model,assuming independent allele frequencies, for various K values. There were no differencesbetween clinical phenotypes in the estimated admixture proportions for K=3, 4 or 5 underthe model parameters. As K increased, the component of European admixture stayedrelatively constant, whereas the estimated African component showed the greatest drop,suggesting STRUCTURE detected the greater genetic CEPH Diversity of African-derivedancestral genotypes.
ETTINGER et al. Page 13
Ann Hum Genet. Author manuscript; available in PMC 2009 August 25.
NIH
-PA Author Manuscript
NIH
-PA Author Manuscript
NIH
-PA Author Manuscript
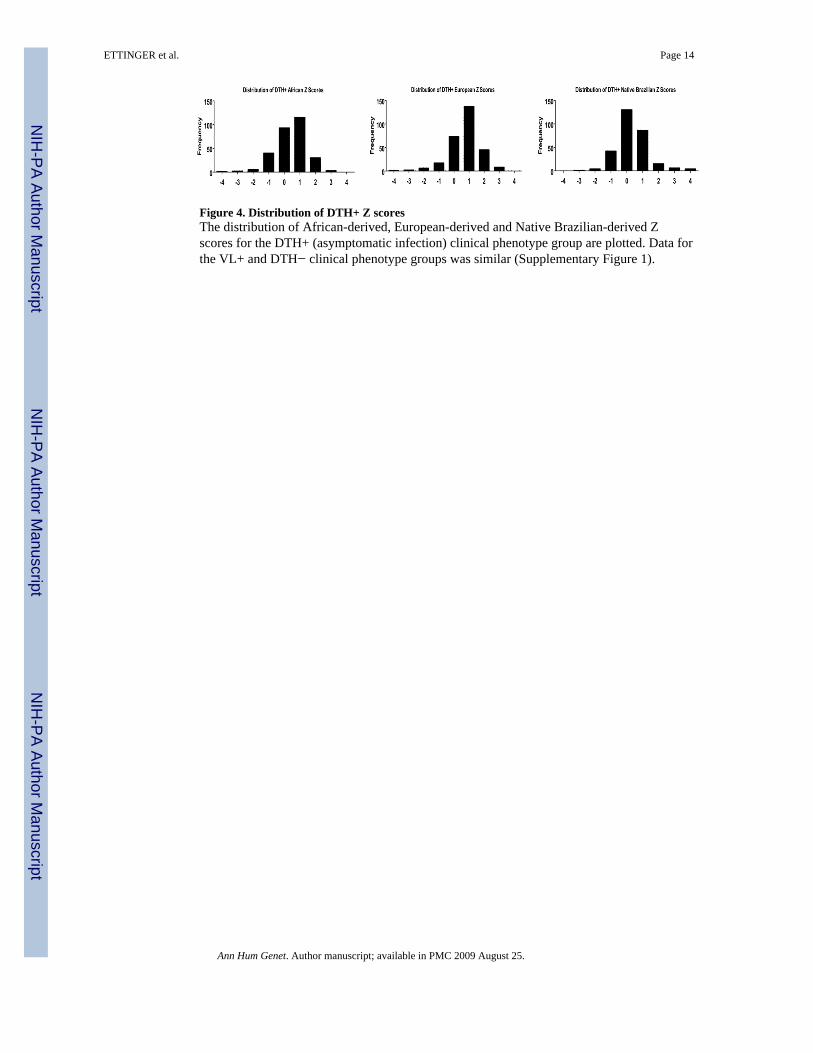
Figure 4. Distribution of DTH+ Z scoresThe distribution of African-derived, European-derived and Native Brazilian-derived Zscores for the DTH+ (asymptomatic infection) clinical phenotype group are plotted. Data forthe VL+ and DTH− clinical phenotype groups was similar (Supplementary Figure 1).
ETTINGER et al. Page 14
Ann Hum Genet. Author manuscript; available in PMC 2009 August 25.
NIH
-PA Author Manuscript
NIH
-PA Author Manuscript
NIH
-PA Author Manuscript
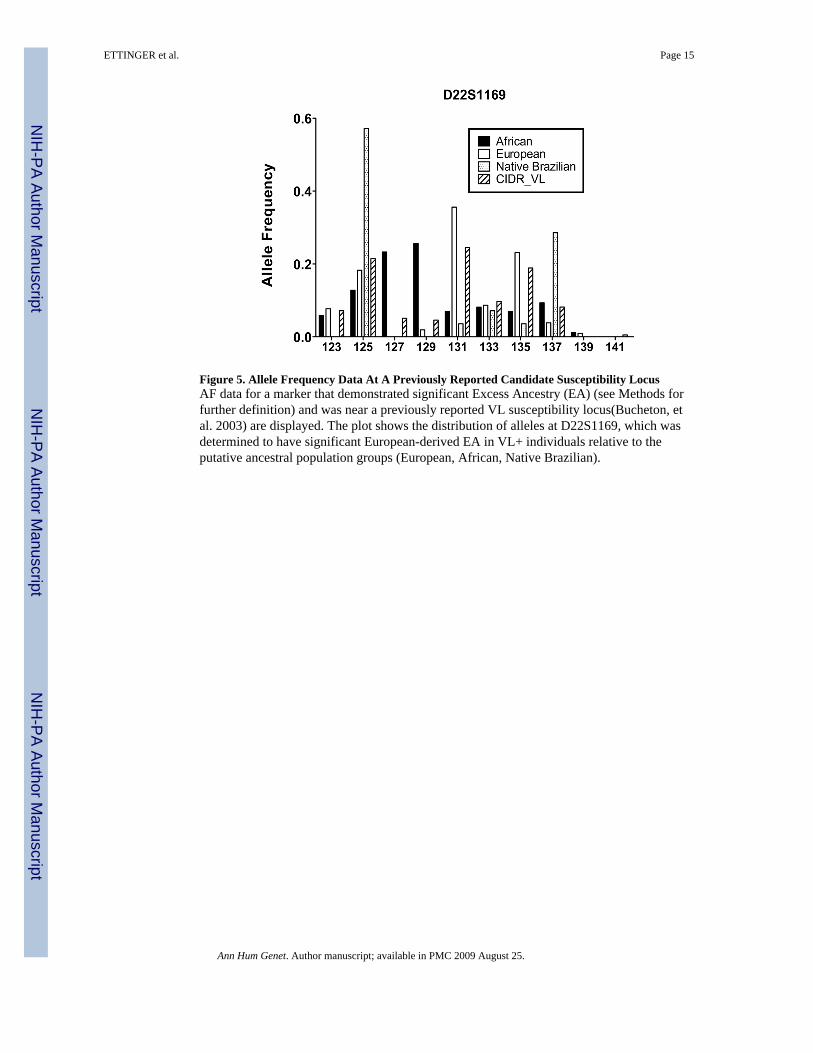
Figure 5. Allele Frequency Data At A Previously Reported Candidate Susceptibility LocusAF data for a marker that demonstrated significant Excess Ancestry (EA) (see Methods forfurther definition) and was near a previously reported VL susceptibility locus(Bucheton, etal. 2003) are displayed. The plot shows the distribution of alleles at D22S1169, which wasdetermined to have significant European-derived EA in VL+ individuals relative to theputative ancestral population groups (European, African, Native Brazilian).
ETTINGER et al. Page 15
Ann Hum Genet. Author manuscript; available in PMC 2009 August 25.
NIH
-PA Author Manuscript
NIH
-PA Author Manuscript
NIH
-PA Author Manuscript
NIH
-PA Author Manuscript
NIH
-PA Author Manuscript
NIH
-PA Author Manuscript
ETTINGER et al. Page 16
Table I
Posterior Probabilities For Each Leishmaniasis Clinical Phenotype Group Under Several Analysis Modelsa
Clinical Phenotype VL+ DTH+ DTH−
# of Individuals 105 193 110
# of Diversity 118 118 118
Model Choice K
Admixture, Correlated
2 −3,767,149 −12,081,099 −4,518,476
3 −2,159,683 −6,877,618 −2,492,999
4 −540,150 −2,253,407 −599,426
5 −373,337 −829,615 −449,287
Admixture, Independent
2 −448,861 −1,100,109 −469,277
3 −383,298 −895,070 −425,052
4 −342,407 −744,724 −368,642
5 −306,673 −616,457 −318,084
Linkage, Independent
3 −356,317 −791,652 −372,799
4 −324,597 −673,970 −339,270
5 −293,340 −565,196 −306,215
aAnalysis performed using Diversity Project data as ‘training data’ for various K under several analysis models. The ‘Linkage/independent allele
frequency’ model generates the best ‘fit.’
Ann Hum Genet. Author manuscript; available in PMC 2009 August 25.