
General Disclaimer One or more of the Following Statements ...
Upload
khangminh22Category
view
1download
0
General Disclaimer
One or more of the Following Statements may affect this Document
This document has been reproduced from the best copy furnished by the
organizational source. It is being released in the interest of making available as
much information as possible.
This document may contain data, which exceeds the sheet parameters. It was
furnished in this condition by the organizational source and is the best copy
available.
This document may contain tone-on-tone or color graphs, charts and/or pictures,
which have been reproduced in black and white.
This document is paginated as submitted by the original source.
Portions of this document are not fully legible due to the historical nature of some
of the material. However, it is the best reproduction available from the original
submission.
Produced by the NASA Center for Aerospace Information (CASI)
https://ntrs.nasa.gov/search.jsp?R=19760003468 2020-03-22T19:41:07+00:00Z

2) COLLATION OF EARTHCOLLECZED BY ERIM AIRBORNEReport, Mar. - Jul. 1975Research Inst. of Michigan)
CSCL 05B G3/43
N76-10556
Unclas39398
^l
^ ^ i ^^^
i^
.l.1 f,4.
^`' f^
NASA CR- / ^ ^^ .^^^ I ERIM 109600-33-F
(NASA-CR-14452RESOURCES DATASENSOF^S Final(Environmental183 p HC $7.00I^^
I
COLLATION OF EARTH RESOURCES DATACOLLECTED BY ERIM AIRBORNE SENSORS
V I R O N M E N T A L
SEARCH INSTITUTE OF MICHIGANFORMERLY WILLOW RUN LAf30RATORIES. THE UNIVERSITY Oi MICHIGANBOX 6 1 6 •ANN ARBOR •MICHIGAN 4 6 1 0 7
AE
w
r
PHILIP G. HASELL, Jr., et al.
SEPTEMBER 1975
Prepared for
NATIONAL AERONAUTICS AND SPACE ADMINISTRATIONLyndon B. Johnson Space CenterHouston, Texas 77058Contract NAS 9-14123, Task XITechnical Monitor: Dr. A.E. Potter
^^,^^Z tJ2930^^
^^ ^y^ ^ ^
^^ pGN C^N ^1 ^ ^ r, ^ C.tl
G y f^ rJ
^% ^C^ ^Y<^/a = ^ f^^. / "._,, ,,,. 1 ^^Z,^^^C
f

1. Report No. 2. Government Accession No. 3. 'Recipient ' s Catalog No.109600-33-F
4. Title and Subtitle 5. Report Date
COLLATION OF EARTH RESOURCES DATA COL- September 1975LECTED BY ERIM AIRBORNE SENSORS- s. Performing organtzation Code
7. Authpr ( s) 8. Performing Organization ReporLNo.Philip G. Hasell, Jr., et al. 109600-33-F
9. Performing Organization Name and Address 10. Work Unit No.Environmental Researoh Institute of Michigan Task XI
.Infrared and Optics Division. u. contract oi • cram No.P.O. Box 61f3 NAS 9-14.123Anri ArbOI?, Mlchlgan '1810? 13. Type. of Report and Period Covered
12. Sponsoring Agency Name and Address Flrial Report:Natiional Aeronautics and Space Administration March - July 19?5Johnson Space CenterHouston, Z'exas 77058 1 . Ponsoring Agency Code
15. Supplementary NotesDr. A.E. Potter is Technical Monitorfor this contract; Mr. 01av Smistad wasTechnical Monitor for Task XL
16. Abstract
Earth resources imagery from nine years of data collection with developmentalairborne sensors is cataloged for reference.- The imaging sensors include single andmultiband line spanners and side-looking radars. The operating wavelengths of thesensors include ultraviolet, visible and infrared band scanners and X- amd L-bandradar. Imagery from all ►wands (radar and scanner) were collected at some' sites and 'many sites .had repeated coverage.. The multibarid scanner data was radiometricallycalibrated. Illustrations show how the data can be used in .earth resource investiga-tions. References are made to published reports which have made use of the data incompleted investigations. Data. collection sponsors are identified. and a proceduredescribed for gaining. access to the data. -
17. Kcy Words 18. D[stribution Statement
Remote sensing, Multispectral scanner Ini"iial distribution is listed at the enddata, X-L band SLAR data_Airborne map ` of the. reportping, Earth resources applications ,
19, Security Classlt. (of this report) 20. Security ClassiL (of [his page) 21. Nn. oC Pages: 22t Price
UNCLASSIE[ED ' UNCLASSIFIED 181
^.,, k
!ir
j{^!^:ti
.yyk,
^,^ .,._ _ __ __,u.._. ^ ,^ ... ,v
_.
u^ ' TECHNICAL REPORT STANDARD TITLE PAGE
^+ _ _ _ _
{ I

t\^ -^, `i,
PREFACE
The general objective of this task was to collate, for the convenience of other• .investigators, the earth resources data collected by ERIM's experimental airborne
r imaging sensors over the period from January 1966 through. December 1974.
` Particular emphasis was placed on noting . sites with repeated coverage over this` i period of time.
This task is one of eleven. performed under. a contract for continuing researchinto earth resources information systems which employ remote sensing of the
`u environment from aircraft and satellites to gather data and which use automaticprocessing to extract information from. the data. The broad objective of thismultidisciplinary program is to develop information systems and practicaltools'which will provide planners and decision -makers with extensive, accurate in-formation quickly and economically..
This report is submitted in fulfillment of NASA Contract NAS 9-14123,.Task XI. The principal investigator for the task was Mr. Philip G. Hasell, Jr.
^^.-;of the Infrared and Optics. Division of the Environmental Research. Institute' of
'` Michigan. (ERIM). The work was directed by Mr. Richard R. Legault, head of '>
. , ^ the IRO Division..
`^ The principal investigator wishes to acknowledge the help of the following.' persons, who made significant contributions to the report: N. Roller, F. Thomson, ':.^..
^.:4
T. Wagner and C. Wezernak, illustrations of ;applications; B. Haack, J. Ladd,
`' D. Leu and C. Liskow, organization: of flight information; S. Stewart, data re- ''^;:^,;^, ^
,,
trieval discussion; and R. Featheringiil, report compilation. ''
^,i `'}
,, . PItIICED1NG PAGE ` BLANK NOT iID
.^
__ s
.,
-..,:
-- — __.;,,

u FORMERLY WILLOW RUN LABORATORIES,TME UNIVI MICR
^^a
CUN'1'r;N'1'a 3
•L INTRODUCTION .
^ ^^ 13
1.1 Background 13 ^1.2 Significance of Historical Data Sets 14 ^
• 2. MULTISPECTRAL REMOTE SENSING: ANEW TOOL FOR$ESOURCE MANAGERS 16
E 2.1 The Remote Sensing Concept ` 162.2 ERIM Airborne Sensor Program. 17 '2.3 Supporting Data Processing Techniques 18
2.3.1 Single Channel Calibrated Level Slicing 182.3..2 False Color Films. 192.3.3 Ratio Processing 19 ^.2.3.4 Multispectral Signature Recognition 19 :' '
2.4 Examples of the Use of Airborne Remote Sensing in^•` Resource Management 20^ 2.4.1' Agricultural .Crop Mapping, Acreage Determination
and Stress Detection 21r 2.4.2 Early Detection of Forest Damage 31 ^' i^ 2.4.3 Waterfowl Habitat Assessment 37;F 2.4.4 Regional Geology Interpretation 46Y: ^ 2.4.5 Eutrophication Assessment 56
^.i(2.4.6 Power Plant Discharge Monitoring and Thermal r.
Characteristics of Surface Waters 59 r ^;'^ 2.4.7 Coastal. Oceanography 61 '`^ 2.4.8 Wetlands Ma inpP• g 67 `'
2.5 Future Uses of Existing . Aircraft Sensor Data ' 73 ,t 3. CATALOG OF IMAGERY FROM ERIM AIRBORNE SYSTEMS 78',; 3.1 Listingof Sites with Multiple Coverage 78{; 3.1.1 Multiple Mission. Co^lerage at pptical Wavelengths 79^': _ 3.1.2 Multiple Flight Coverage by MSS and SLAR. 79ii ; 3.2 Total Listing of .Earth Resources Data. - 98 a
U' 3.2.1 Mission Listings 98
3.2.2 FlightZistings 106 ^ d
t^I 4. DESCRIPTION OF ERIM AIRBORNE SENSOR SYSTEMS . . . .. . . . , . . 118<, .
'`
4.1` M7 Multispectral Scanner 118^ -;4.2 M5 Multispectral Scanner 123 t y
^ i-^;, 4.3 lVllAi Thermal Scanner. 126., 4.4--SLAR X-L Radar 128
4.5 Boresight Cameras for Airborne Systems 129^ r°
r; 5. DATA RETRIEVAL . 133 ^`R #,
`5.1 Inflight Data Recording 133
5.1.1 Analog Magnetic Tape for $canners 1345.1.2 Film for Radar ^ 135
' 5.1.3 Film. for Boresight Cameras 135E ^_ 5.2 'Postflight Imagery Reproduction on .Film 136^ k^ ^ ` 8.2.1 lNlS Scanner Imagery, 136
!+;1 5.2.2. Radar Imagery 137c' 5,2..3 Boresight Camera .Imagery 138^^^; h^.
5
_^
,.
G BLANK NOT ^^pAGQfi,
.1 1.=.

RIM_ __ FORMERLY WILLOW RUN LABORATORIES,THEUNIVERSITY OF MICHIGAN
5.3 Postflight Data Reproduction on Magnetic Tape 1385.3.1 Duplicate Analog Tapes 1385.3.2 Digital Tapes 139
' 5.4 Procedure for Obtaining ERIM Data 1405.4,1 Unprocessed Airborne Sensor Imagery _1.405.4.2 Processed/Analyzed Airborne Data 140
,,
5.4.3 Summary of Data Request Procedure 140j APPENDIX A; LIST OF PUBLISHED DOCUMENTS WHICH USE AIRBORNE
SENSOR DATA COLLECTED BY ERIM . . 143
APPENDIX B: GEOGRAPHIC REFERENCE. SYSTEM . .. ,167 `'
` APPENDIX C; LIST OF ORGANIZATIONAL ADDRESSES. . , .` : : 175
`REFERENCES , . 177
DISTRIBUTION LIST .181
. ^,
v
A i.
-^ -. 1
s
}
'^
^
1
^I
I
^
^
a'
F
4
^.,^
i -..
; y3y
4.9
8 .1
f
^
..:
...
A
^^
^
I
}
..
.... _:.
g
1 ^,.;.
iv
r. 1 '.:.
^;:,;^^;
,;
E -
._
^
^^ .
i^

^^ .
^ .r._
_.
FI GURES
1. Mul^tispectral Imagery of :Davis, California Agricultural Area '23' .I{ 2.
_Crop Recognition Map of Davis,.- California Agricultural Area 25
^^ 3. Video and .Ground -Truth Maps of Weslaco, Texas ^ ^'ii, ^
_,
Agricultural Area . 26'^ j 4. Color - Coded Recognition Map pf Weslaco,. Texas Agricultural _
Area , 2?', 5. Ground-Truth Maps for ',Data C ',ollected Near Lafayette, Indiana 28
i' 6. Recognition of Wheat Near Lafayette,: Indiana at Two..Different Times of Year 29
7. Classification Accuracy vs Number of Spectral Bands, MichiganAgriculture Test Site 30
s^ 8. Acreage Estimation Errors .. 329. ;Color-Coded Recognition Map of Corn Blight near Lafayette,
Indiana, 3310. 'Forest Damage Detection Study Site, Sharonville State Game
Area, Jackson County, Michigan .. .. 36- il. 1970 Fomes annosus Damage Detection Survey . , 38
12. Fomes annosus Detection: Comparison of 1970 MSS SurveyWith 1872 Photographic Survey . ., . :. 41
':% 13. Pond _Detection Accomplished by Thresholding 1.5-1.8 µm Data . . 43
14. Changes in Pond Area Between May and July Detected inProcessed Data r 44
15. Typical Digikal Computer Printout of Pond Statistics 45'
r 16. Comparison pf Three. Multispectral Images of the Eastern Base.of the Stillwater Range (Dixie Valley), Nevada, Showing theLocation of a Fault Zone _ .. 48
17. Comparison of Three Infrared Images o£ the Alluvial Fans at the"Base of the Stillwater Range, Nevada - . , 49
^; 18. Thermal Infrared Images of the Pisgah Crater Area, California , 50
^' 19. Comparison. of Two Polarizations of X-Band Imagery of PisgahCrater .Area, California . , .. .` ; ^ 52
^' 20. Comparison of Two L-Band Images of the Pisgah Crater Area, 'California
__53
21. Suspended Solids 56
22. Analog Processed Ratio Imagery, Silver Lake. - Lake Ponemah,';is
Genesee County, Michigan . -. . 5?
,^ 23.:_'
Ratio Imagery, Cladophora Distribution, Hamlin Beach,{' State Park, New York .. . 60
.;
^',; 7
+
r^"
l^
_.

r_.
^^..
ERINt
v ^ _..________ _
FORMERLY WILLOW RUN LABORATORIES, THE UNISIERSITY OF MICHIGAN
qs
q
--
'ri
^..
I
24, Formation and Movement of Thermal Bar Showing CoastalEntrapment of Discharges . 62
^ 25. . _,,Barge Dumping of Waste, New York Bight. , 64s.
si 26. Digital Temperature Map, .New York Bight .-65 ^
_
` 27. Surface Chlorophyll Distribution, New York Bight 66
28. Pointe Mouillee State Game. Area . ., . 69
29. Pointe Mouillee, Michigan, Loss of Wildlife Habitat by 36 Yearsof Erosion 7U
30. Digital Map of Important Food and Cover Vel*,etation in Diked 'Portion of Pointe Mouillee State Game Are[? . 72
31. Imagery of Power Plant Site Near Grand Haven, Michigan, 74
32. Airborne Multispectral Scanner Operation ^. .119
33. Optical Schematic of .ERIN Experimental Multispectral Scanner,. M7 .120
34, Simplified Schematic of an M5 Scanner . .124
35. Scanner Unit . . , , .` . .127
B-1. Earth Zone Map . .169 y
B-2. GEOREF 15° Square Sample EJ Quadrangle .170
B-3. U.S. Zone. Map . .. ... .. ...1.71
B-4. USA Test Sites ... 172'.
., 33
I
:,
-
^
^_
-
aj
1,.3
'.._a
-` ^{
^
' -^^
I
^
t
I.
I ^.
GI`
_.
a
,,
^..
_
—.
^
^^^: _ ,--_

.. _ . ,. .. m . _..^. _ _ .^ ._..._ ^ _.. _ . ___^._ ___
«,. ..^:^..^^._..... ,..__ .^,._.. ^,v^..^_ ... ._ _-. ... ...:y.:_:. _,^,..^- ...,;:^.«.^.! : sue,__
j^
RIMFORMERLY WILLOW RUN LABORATORIES,THEUHIVERSITY OF MICHIGAN
}{{i
^ E,:
f •:, TABLESt
1. Aircraft Missions With Near Simultaneous Satellite Coverage ' 76
2. Sites With. Multiple Calendar Coverage at Optical Wavelengths 80
3. Sites - With MSS and SLAB Coverage . , 96
;14,^ M7 Multispectral Scanner Missions.-. -. 99
5. M5 Multispectral Scanner Missions . . 101({ 6. M1A1 Thermal Scanner Missions .104
4
j
;; 7..
SLAR X-L Band Radar Missions .' . .105 ,
,, 8. M7 Multispectral Scanner Flights . , .. ...107t:
9. M5 Multispectral Scanner Flights . .111
.,10. M1A1 Thermal Scanner Flights. 116
$ ^,^ 11. SLAR X-L . Band Radar Flights 117
^? 12. Typical Spectral Bands Available in the M5 and M7 MultispectralScanners 121
!' 13. Characteristics of X- and L-Band SLAR 130
'^ ' -^^
>I
14, Performance Characteristics. of Aerial Cameras . . 131' ,,
}:,.,.1
,
t:,i#i
,
;,^,,
it
';: ^
^ ^ ;
,:,
^^,
^,^,
.^x _.
s• ,,^
^^ ,,'
9
^B. Y ^.
S+.
k 4
v`
_..._ _

OF
,i '..
yi::..1 i^- LIST OF ABBREVIATIONS AND ACRONYMS
a A/D analog to digital conversion
aef' agricultural experimental farm
aes agricultural experimentalstaton.
AFCRL Air,'Force Cambridge Research Laboratory
AGL above ground level
' Agri. agricultural
Am. Electric Power American Electric Power Service Corporation
.Argonne Argonne National Laboratory
Bu. Mines Unfted . States Bureau of Mines
Bu. Reclamation Bureau of Reclamation
BW aerial. camera black and white imageryCDT Central Daylight. Time
cm centimeter
co. count y
+' Col. 'aerial camera color imagery
Col. IR aerial camera false color imagery3
I Corp. of Eng. U .S. Army Corps of :Engineersa
CRT cathode ray tube
CS'T' Central Standard Time '^idb `decibels
dc, direct. current
^' E. Tenn. State Univ, East _Tennessee State University '^
.EDT Eastern Daylight Time
: ERTM Environmental Research Institute of Michigan(formerly Willow Run Laboratories)
EST Eastern Standard Time
FHA Federal Highway Administratipn
' ,FIR far infrared scanner bands (8.0-14.0 µm) '
Fla. ' FloridaFM
,^.^:frequency modulation
ft -foot
GHz ' gigahertz (109 c;: cles per second)'-GMT- Greenwich Mean Time ` ^ '
HATS- Houston area test site. ,
IO
,.
syr ?^Ik. i.
^..:.}..
..
_ ^. l
I
!
_
..
g....¢

i __ i_^
^, {
_. ,,
in inch
" IR infrared
IRIG inter- range instrumentation group
kHz. kilohertz (103 cycles per second)
L-band radar frequency of 1.165GHz
LABS Laboratory for Applications of Remote Sensing, Purdue
University l
LC radar L-band with cross polarization •
ik lake
LP i radar L-band with parallel polarization.
MDT. Mountain Daylight Time
Mich'. Michigan
MIR middle infrared scanner band (3.0-6.0.µ.m)
mm millimetermMS multispectralM5S multispectral. scanner
MST Mountain Standard Time
" M5U' Michigan. State University
mts. mountains
.multi multiplen/a not available ;-
NASA National Aeronautics and Space Administration
NASA/GSFC NASA, Goddard ,Space Flight Center
NASA/JSC NASA, Lyndon B. Johnson Space. Center
NASA/KSC NASA, John F. Kennedy Space CenterNA5A/Lewis NASA, Lewis Research CenterNASA/^Vallops ; NASA, Wallops Station --
Natl, Park 5erv: National Park Service
N. C. North Carolina -
NE^p noise equivalent change in reflectance
' " NEST noise equivalent change in temperatureNIR' near infrared scanner band. (0.7-3.0 ;µm)North Amer. Sock. North American RockwellNOAA National Oceanographic and Atmospheric AdministrationNPWRC Northern Prairie Wildlife Research Center-
^,
nw northwest._
Oregon State U Oregon State University
i
t
s
it
' 4

i^J^.1 J J I
_l T I
Z
PDT Pacific Daylight Time
PI principal investigator
PST Pacific Standard . Time
Purdue Univ. Purdue University
r river
RF radio frequency
^ ^ se^k_.southeast
sec. second
SLAR side. looking airborne radar.
so. south
S. Dakota State U. South Dakota State University
sta. station
State Hwy. Adm. State Highway Administration "+
sw southwest
twp: townshipTVA Tennessee Valley Authority
U. university
U. of Calif. University of California
U. of Kansas University of Kansas
U. of M University of Michigan
UP upper peninsula Hof Michigan)
' USDA United States Department of AgricultureUSDI United States Department of InteriorUSES United States Geological SurveyUV ultraviolet scanner bands (0.30-0.40µm) `
vIS visible wavelength-scanner bands (0.40-0,70 µm)
w west
wR Willow .Run Airport
VyRL Willow Run. Laboratories (now ERIM);,
X-band radar. frequency of 9.3 GHz
XC radar X-band with cross polarizationXP radar X-band with parallel polarization
i12
s _ ^,,, ,
r,
^,
^... _^.F

COLLATION OF EARTH RESOURCES DATA COLLECTED1',BY ERIM AIRBORNE .SENSORS{ -'
1
• INTRODUCTION
`• '^ This report was prepared under the direction of NASA/JSC to provide investigators with;;` a convenient reference to the earth resources imagery collected by ERIM airborne sensors.
• during the period January 1966 through December .1974,.. The imagerywas originally collected._ 9
for a specific investigator, for a specific study, at a specific-time. However, the cumulative' effect of this random sampling of the earth's. surface is to produce historical coverage of some
sites, with multi-sensor coverage in some cases, with the potential for examining changes in ,sites over relatively'longtfine periods bg •comparing current data with the stored data. This.
'' collation includes data collected by ERIM's thermal. and multispectral optical. scanners andits X- and L-band imaging radar. system. .^
^. 1.1 BACKGROUNDNASA has. supported ERIM to some degree in its. development of !remote sensing techniques
,i
`' since the mid-1960's and to a significant extent since 1969. In 1974 NASA support of data :. ;collection using ERIM's passive optical scanners and active radar .imaging systems was termi-
^ Hated due to budget cutbacks and the availability of this type of data from their own and com-mercial instrumentation. With their interest in supplying earth resource investigators with
^. '
potentially useful data at minimum cost, however, it is appropriate that NASA should fund. thiseffortto collate and publicize the large . amount of earth resources data available at ERIM..
..During the past. five years, .about 75% of ERIM's airborne data collection has been supported` by NASA and 95a/o of the data have been collected at Government expense. Thus, most of the ^"'
data belong to United States taxpayers, constituting a national .asset. that should be-used to ad- ^. ^vantage in establishing remote sensing applications.
r `'' All of the optical scanner imagery is stored at ERIM on analog magnetic tapes in an elec-^ ^ ! trical format . easily retrievable for machine processing or reformatting on tape. or film. The ^ a
signals reproduced from the #apes can be inserted directly into ERIM analog and digital com-;^ paters and:the tape-to-filrn imagery transfer equipment. Processing of the raw data at ERIM';' is available as part of the data retrieval function.
,
F^^.
-;,! The: radar data. are. recorded. mfiight on film m a holographic form. This original record.^! ing must be optically processed to produce imagery .which can then be recorded in analog form1^1(
^:; ,R13;^ ,
^:
,.

1_ I I_ I I I I .f I
^. '. ^ .FORMERLY WILLOW RUN LABORATORIES, THE UNIVERSITY OF MICHIGAN
on film, or in digital form on magnetic. tape. The^inflight film recording and, in most in-stances, processed imagery on film are stored at ERIM for reference.
1.2 SIGNIFICANCE OF F;ISTORICAL DATA SETSERIM's nine year collection of earth resources imagery using airborne sensors con-
statutes a major investment which can be exploited to answer a number of important design
questions for future sensors. The operations over many different environmental situationsinsures that many applications -oriented sensor configuration questions can be addressed.The variety of scenes mapped, and in many cases the repetitive nature of the data over-theseregions, will allow temporal and seasonal variables, to be assessed.
Many important questions must still be fully answered before a successful operationalsensor system is evolved for monitoring those activities. of a dynamic nature encountered in
vegetative and water resource applications, The varied spectral bands registered over thisnne_year period offer an opportunity to evaluate the improvement in classification :accuraciesfrom changes in bandwidths and band locations, using data from the real world.
The imagery already collected is a time snapshot-sample of-'the environment, both in its... .seasonal cycle and in the statu's of environmental quality at .the time of monitoring. .This ^ap-luring over time of the electromagnetic signature of the. earth's surface allows a number ofimportant questions and measurements to be answered or derived. Even more dramatically,the. data base allows recently developed processing techniques and procedures to be appliedto the early data years. after they yvere collected, so that actual environmental data can beextracted from them.
An example of khis involves water quality applications, Only recently has it been feasible
ito measure chlorophyll a concentrations in lakes and coastal areas using a combination of
spectral channelsin a computer program. Thedata bank has a number of repetitive looks atthe coastal areas of eastern Lake . Michigan and the Detroit River. Both . areas have receivedmuch. attention by the EPA,. the State of Michigan, and the Great Lakes Basin Commission.. Anumber of industrial outfalls, power generating sites, and river discharges occur in the areasalready mapped. It is now possible to trace changes in environmental quality (improvementand^or degradation) in these areas, thus establishing a new and vahiiable dimension. in remotesensing of the environment. Also, the technical specification information on the best wave- - ^-^.lengths, resolution, season, swath width,. time between monitoring missions, and the like can beascertained.
A similar situation arises with. measures of changed in land use, growth of urban areas,..population projections and degradation of the environment due to large projects like highways,
t
! power generating sites and utility line corridors.•
^''
,; 14
_. ,^,
y . ; ,.^'
^' .. ^.. _ __ ^.::

-- ___ ' ______ ^~____-_ __
________________________________ _
^^^ ^^ ^ ^.
`
^m^^^
_. /
^^^o^o^ ^c^^^ m ^u^rya^^c^o^^ i^ ^^d oba^^^
armao^o±^^*e^^auma m^ ^ ~`^~" uu#^oreoLedlaodo bobeozoui ' , t^ua pol^^mo,'
p^auo, moa ^re^^ct^ma va| aud adnmbdobru^nra tobe ^olbnned, ouodolo cbeu^eduud
v^lno^lm lamouuo ^mur^ed.'

I
RIMFORLiIERLV WILLOW RUN LABORATORIES, THE UNIVERSITY OF MICHIGAN ^ °.
.. ..
^^•Y i - ^ _
MULTISPECTRAL 'REMOTE SENSING:ANEW TOOL FOR RESOURCE. MANAGERS '
1 2.1 T,HE REMOTE :TENSING CONCEPT.
^ ' Remote sensing. is a means of obtaining information about portions of the biosphere by^_
noncontact methods. This information is derived from an analysis of patterns-of radiation re-€
fleeted or emitted from objects in different and discrete regions of the electromagnetic spec-trum.' The use of aircraft. or satellites to collect remote sensing data provides a capability for
^
synoptic looks at environments that makes it possible to deal more .effectively with large or '..complex ecosystems, In this way,. remote sensing forms a bridge between. intensive problem-
solving oriented research on small study sites and the application of the resource managementtechniques thus developed to larger units,. such as counties, watersheds, or whole states. ;
__ ;
Remote sensing began at ERIM in the early 1.960's as an offshoot of military-and . spaceresearch into new surveillance and reconnaissance techniques. First efforts in multispectral < ':sensing were focused on the use of multiple-lens cameras which produced. several. images of ', ^,a scene in different wavelength regions by taking simultaneous photos using different film-filtercombinations. When it came time to' analyze this data, however, it rapidly bE•a.ame obvious that,.
- except-for simple cases where only a few things were being compared over a limited area, the` load placed on the photo-interpreter_by the .additional. detail this .technique provided. was over-' whelming. The rapid input, output and analysis rates of-computers appeared to be one way . to` cope with this enormous data-interpretation task and the problems of timeliness associated
with it. As a result, emphasis in the developing remote-sensing technical community shifted' to developing the technology necessary to record radiation signals from the environment in
i', multiple 'electronic channels on magnetic tape in order to make ahem computer compatible... a
At this point, in the mid-1960's, NASA became-interested in supporting this emerging tech-nology and initiated the first of its. continuing programs which have funded remote-sensing in- ^^
} vestigations aimed at improving earth resources management. From the beginning ERIM'saircraft and sensor systems have been a,major parE of the data collection team used by NASAto support these investigations. Simultaneously, aparallel .program, designed to provide investi-gators with a full spectrum of the necessary data processing and analysis techniques needed to
i accomplish their objectives, was also developed at ERIM. .^_
Since that time ERIM's joint effort in the field of data collection and data analysis have de-veloped into a cohesive. and focused program, During its existence it has passed through roughly
- three phases which accurately reflect the continuing development of the multispectral: remotesensing concept and its application to the problem of earth resources . management. These 'three phases and what they accomplished are discussed in the next section. _
Y #
16 i
t. M
t --
S

W RUN LABORATORIES. THE UNIV ERSITY OF MICHIGAN
k
2,2 ERIM AIRBORNE . SENSOR PROGRAM ^^,,The. ERIM airborne sensor program started in 1966 with modified military infrared scan;- ^ ^
ners mounted in a C-47 :aircraft. Over the next nine years the ability to routinely collect high7 3
quality, investigator-specified multispectral data. was achieved through modification of equip- ''s
merit, standardization of data collection procedures, and streamlining of the instrumentation`i
.operation which permitted a reduction of the sensor system crew from five to two. The scan-j
ner system was improved by constructing a single scanner (M7) for all wavelengths fromultraviolet to thermal infrared, thus making possible the collection of full spectrum, truly
multispectral data. At the same time, the system's electronics and tape recording- system..- -;were improved. ATl these_ developments helped improve reliability and data quality so that the ^ ^,
objective. of the Phase I.program - to prove the feasibility of collecting remote sensing data- a
witFl. airborne multispectral scanners -was realized. ^ g
The Phase II program consisted of collecting and analyzing data to demonstrate the utility I
of multispectral scanner data when applied to various resource management problems. Through^.
a program of data collection and analysis funded by NASA, the utility of these data. were dem-onstrated in agriculture,. geology, water quality, wildlife management, forestry, and other
_r<
natural resources managemenbareas. Later in this report, case. studies are presented which '
cite specific resources management problems in these .areas. and show the contribution madeto resources management by a variety of processed multispectral data. The joint data collec-tion and processing aspects of this phase, which reached their peak in 1969-1972, demonstratedthat where was indeed promise in the use of properly processed multispectral scanner data ina variety of resource management areas, and also helped justify the launch of the first Earth ' '.
Resources Technology Satellite [ERTS (now LANDSAT)], on 23 July 1972.
Phase III, the refinement of processing techniques and'ttie joint use of multispectral data
from satellite and aircraft platforms continues today. While much of the data collection capa-
blty has now been. taken over by NASA, the ERIM airborne sensors did collect a-number of
data sets. in support of ERTS and. SKYLAB investigations. While it is intuitively obvious that an •
optimum mix of sensor data for most. applications will be some satellite .and some aircraft data,the actual-working nature of .this mix. has not. been, precisely defined.. Because of this probable
eventual need for aircraft . sensor data to help solve resources management problems. opera-
tionally, there. continues to be a requirement for an aircraft sensor capability. One objective ofg • p of thisthis. catalo is to familiarize otential users with the results obtained from one. source
type of data.
The development of radar remote sensing techniques at ERIM has paralleled. that of the MSS
but has not-progressed as far in erms of specific earth resources applications. The ERIM -
17

FORMERLY.WILLOW RUN:LABORA70RIES:THE UNIVERSITY OF MICHIGAN gg
^
R" ^r
"
X-band Side-Looking Airborne Radar (SCAR) system, developed for military recannaissanc.einvestigations, was first used in earth resources applications in 1968. _ An L=band capability
ik was added in 1971, but the system has. been used infrequently for earth resources data collec- sI ;;^ lion. .Classification processing techniques can be used with the multiband radar-data; however,
the utility of the radar data for this type of processing is currently limited by a lack of quant- statve measure and stability from scene to scene. System design modifications hzve been pro:-
^ posed to overcome these constraints. Presently, the main. advantage of radar :remote sensingt ^ are its ability to see through. clouds, its range-independent spatial resolution, and its large
I swath-width at relatively low altitudes.
{^
2.3 SUPPORTING DATA PROCESSING TECHNIQUESr, _
^
s
A variety of data processing techniques were developed,in response to the needs of nvesti-—s to.^s^ntprPGted in natura l reconrce manag ment, to extract various types of information from '
a multispectral data. At the outset of the program, the basic need: was for a capability for-com-
puler processing of the multispectral data, n_order to help the human interpreter cope with-. 5
the analysis. load imposed by up to 12 simultaneously collected bands of spectral data. The,. _;
case studies. presented later in this chapter illustrate the :progress eventually made towardthis goal. In this section, the actual nature of several of the specific data . processing techniques
^. that .were developed and which are now in common use are briefly described 'to provide thet
reader with a better understanding of the rationale wi^ich underlies their use in the cited ex-amples. It is not the intention of this section to set.-forth in depth the limitations and mplemen-Cation of these techniques. Readers interested in more detail in this regard are. referred toAppendix A.
The. techniques that have been found useful are (color .-coded) single-channel calibratedp
signal-level slicing, .creation of false color films, ratioing and multispectral signature rec-ognition (or pattern recognition).
x ^
2.3.f SINGLE-CHANNEL CALIBRATED'LEVEZ SLICING' For certain. applications, ` single-channel calibrated level slicing is adequate. to extract the
desired information from electronically recorded data. The major difference betweem thistechnique and the density slicing techniques used on photography i that the slicing levels canbe calibrated more precisely. This can be done through the use.. of calibration. sources in the e.^^
' in the sensor itself (e.g., temperature calibration plates), and is successful because the dy-namic range of remote sensing data is recorded linearly and more predictably^on tape than onfilm.
t
18_.
<?t
i

NFORMERLY WILLOW RUN LABORATORIES, THE UNIVERSITY vF 1
l _^^! 1
i', _ Level-sliced. data can be recorded on film in quantized grey-level form or in color -coded :-^, ; form. For color coding, separations are first prepared,. then converted to color images byr; F
^^: _
photographic means. Alternatively,. data can be displayed on a color TV screen and the screen!'^, photographed. A special processing circuit is used to relate signal strength to mixtures of$ colors on the TV screen. _ _ _
^ ^^,; 2.3.2 FALSE -COLOR FILMS','' Another useful processing technique for multispectral data has been the creation of false-F color films. In this technique, three single -band images are- coded. in the three. subtractive^.! primary colors: . yellow, magenta, and cyan. Since the channels of data used are not restricted^` to those of the photographic region (0,4-0.9 µm), more information can be presented in this
format than is available from conventional color a,nd color-infrared films.;I,, -- __
_ i a s - o or i m ec mque, w en app ie o mu ispec _ral scanner.^' data, stems from the availability of narrower bands over a wider range of ,spectral data and
from the opportunity to optimize the contrast for each band of data. before creation of the color `:composite image. By proper. selection of bands and appropriate .contrast stretching beforecolor coding, subtle differences in a scene can be enhanced. The color -coding technique canalso ;be used with ratio images to provide a fundamentally dif''° ` •sF and potentially more usefuldisplay than that obtainable from the display of single-band date . ^ .
,: 2.3,3 RATIO PROCESSING _._
€ ^.^ Under certain conditions, diagnostic information has been found' in, the pattern of correla-'';i
lion that exists in the signal level variations observed in two spectral bands for different`,'I terrain features. This realization has led to the development of ratio processing, ' where ,the
signal of one scanner channel (spectral band) is divided by that of another.. . The ob9ect is to en-hence the discriminability of scene classes whose mean signal levels are negatively correlatedbetween. the two bands. Furthermore, because values of scene irradiance and atmospheric trans- Imission exhibit variations which -are highly correlated in adjacent spectral regions,. ratioing
'^i '
can be an effective means of signature extension when terrain, -feature recognition is planned.;^ using pattern recognition.
_. ^t^1
^ :^ Ratioed data that is to be analyzed directly is presented as a continuous -tone graymage,.^ 'sliced or combined with other color -coded imagery to make a false color film ( see. Section
a 2.3.2).
^, ,2.3.4 MULTISPECTRAL SIGNATURE RECOGNITION
s
;^ r Multispectral signature recognition is acomputer -implemented data -processing technique,,i
^ j for identifying various surface features in multispectral data. Perhaps the, most thoroughly
19

' i`_
RIME FORMERLY WILLOW RUN LABORATORIES,THE UNIVERSITY OF MICHIGAN,,^ ,.^.I
studied use . of this technique is in the recognition. of various crops in agricultural areas, butits. utility is not limited to that application. Its use is based on the assumption that the spec-
' tral signatures (i.e., the spectral radiances observed by the multispectral scanner in discreteii wavelength bands) of various terrain features are sufficiently different to permit recognitioni
iof these features by the pattern of their spectral variation.
' of the .recognition processor.^ Tppical computer palgprithms fognr recognition. require training
^ To' im lenient this ste s ectral si atures derived from training sets of known terrain - classes,i j I
or from "clustering" of multispectral data to define separable spectral classes,. are. fed to therecognition processor. After training (on, typically, a small fraction of the total data set), .the.processor uses an algorithm to .classify the. unknown data according to the similarity of a spec-
' tral signature to the set of training signatures.
The assumption that the spectral 'signature of a terrain class is distinctive enough to per- ^ `'mit good recognition is crucial to the success of pattern recognition techniques. Also, the`conditions of data collection, .including illumination, scanner system stability, -and atmospheric 'state must remain fairly uniform to allow .good performance.. .Since in practice, these datacollection conditions are only approximately uniform, various preprocessing techniques havebeen developed to reduce the sensitivity of pattern recognition performance to variations in ,,collection. conditions over wide areas.. The uniqueness' of spectral signatures of terrain classes.(under uniform collection conditions) is the fundamental limiting factor in determining theability of pattern recognition techniques to separate the classes in multispectral data. If two isignatures closely resemble each other, the separation of the. classes those . signatures repre-sent will be difficult, This realization has motivated the search for spectral bands where
various terrain classes have different enough. signatures to permit their accurate separation. ',^
This is termed-the optimum spectral bands problem. '
2.4 EXAMPLES OF THE USE QF AIRBORNE REMOTE SENSING IN RESOURCE MANAGE-MENT
Until. recently, natural resource managers were forced to rely on timQ-consuming and ;,costly ground surveys for obtaining the basic data on environmental conditions whiJ^h permitted ?intelligent decision-making. Today, the progressive resource/land manager can obtain most
of these . essential environmental parameters directly from: remote. sensing data. ;Resourcemanagers in nearly all fields have found aerial; photography an inexpensive tool . that greatly in-creases the: efficiency of their .operations. With additional.-training in the fundamentals of non-photographicremote sensing. techniques, managers .may now find. whole new areas of survey..improvements and environmental parameterization using the new multispectral and radarsystems.
20
y,
I
,
c

^,r;i('
!i
f^
{^k
^'
i i I 1---^_ ^_ERIM
FORMERLY WILLOW RUN LA80RATORIES, THE UNIVERSITY OF MICHIGAN
The list of potential applications for these new forms of remote sensing is almost endless.
Some of these have already been developed to an operational. or near -operational stage. Thepurpoe^ of this section is to illustrate the wide range of opportunities for effectively utilizingmultispectral remote sensing through description of applications of new methods that have.reached a useful level of development. Hopefully, each reader .will find in these descriptionssomething. relating to a management problem, parameter measurement, . data analysis capabilityor location that will provide a hint as to how his or her own work may directly benefit. by aninvestment of interest in this new technology.
',', 2.4.1 AGRICULTURAL CROP MAPPING, ACREAGE DETERMINATIONS AND STRESS;, DETECTION
In agriculture there are many requirQments for information. about large areas. The. mostbasic types of information usually required in-this regard are identification of crops growing.
} in fields, measurement of the acreage of: crops ;grown in a given area,. and predictions of cropyields. The assessment of crop stress (e.g., moisture stress, which could signify the need for
A ^ irrigation, or the presence of disease) is also an important. type of information... By knowingF.
crop acreage, predicted yield, and estimates of yield reduction because of stresses, production.estimates can be made.
?^
^^ One of the earliest demonstration applications'of the use of airborne multispectral scanner.,;^t data was in crop identification.. Initial experiments were begun in 1964 by 'ERIM ( then the^^ Willow Run Laboratories of The University of Michigan). and Purdue, using data collected with.
an early version of-the M5 scanner system [1, 2]. Since that time Purdue, ERIM, and otherexperimenthrs such as USDA-ARS Weslaco and Dr. V.I. Myers (now of South Dakota State
f^ University), have continued o develop and refine computer -assisted crop identification, acreage^' mensuration, and. stress detection using airborne multispectral data.
While many of the experiments have concerned the identification and mensuration of CornBelt agricultural crops (soybeans, corn,. winter wheat,. oats, etc.), there have been experiments..at recognizing rice and safflowers in California, and .cotton. and sorghum in Southern Texas[1]..The Corn'-Blight Watch Experiment was a major effort to attempt an assessment of the severityof .Southern Corn Leaf Blight in Indiana during the 1971 growing season: [3]. All these experi- ^^ments were conducted using data from the M5 and, in the case of the Corn. Blight Watch Experi-ment, M7 systems. Amore recent use of M7 scanner !data was to investigate the effects of.various numbers. of spectral bands,. various spectral resolutions, and various radiometric.precisions on a'multispectral scanner ' s ability to recognize Corn Belt Crops. This systems-study was done to guide selection of the parameters for the NASA . Thematic Mapper, a_second-
H generation spaceborne multispectral scanner [4]. '
21
,.= ,:_ _ ^,
€^; ,
:^

r-,- __ _. .. _ .._,
i
t
,, ,
^ wm......^,m...-..^,.
'i^
,.. _
` ^ ^- - - FORMERLY WILLOW RUf^I IABOR/1TO p1E$^ THE Uf^IIVEF51T y OF MIGMIGAN' _ -.
Figure 1 shows 15 spectral bands of multispectral scanner data covering the Californiai Rice Fields area north of Marysville, California. -The data were collected of an altitude of
2000 ft on 6/26/66 at 1600. hours. Three basic types of crops are present in Figure 1. Bare^I ^ soil fields are bright in the blue bands (0.4-0.5 µm). Safflower fields are bright in the near
sinfrared. (0.8-1.1 µm) and dark. in the blue and red. Mature and immature rice fields appear
I in intermediate tones in the near infrared. Figure 2 shows recognition of rice, safflowers andE ! ^ bare soil. The maps were prepared on the Special Purpose Analog Recognition Computer'
d (SPARC} using two of the 15 spectral bands available. Good delineation of safflowers, baresoil and immature rice are evident in Figure 2, although the recognition of immature rice
^ within the fields is not complete because of variations in the percentage of rice cover. This !.^ first attempt at crop mapping using M5 scanner multispectral data was qualitatively. successful,: .. ?
' ^ and set the sta a for later. more elaborg , ate experiments. _ ]
1 Figure 3 shows a ground information map of crops near. Weslaco, Texas. The map shows ( ;two types of .cotton,.. sorghum and. corn. Multispectral data was -collected with. the M5 scanner ^"
^' system over this area ,at an altitude of 2000 ft on .6/30/66 at 1430 hours. Figure. 4 showsrec- ^ ^''; ': ognition of the two types of cotton and sorghum. Again, good recognition within the field
boundaries and. good separation of these crops is observed. These results were also generated
,by SPARC processing using six bands of data. c
With these preliminary promising results and similar results . generated at LARS-Purduei
in hand,. more structured experiments were begun to assess the quantitative accuracy of -cropi, mapping.. One' of the. first.. of these experiments by ERIM. was an attempt to map winter wheat
6 in Indiana [5). Figure 5 shows the test area near -Lafayette, Indiana. Figure 6 shows SPARC `- ^recognition of winter wheat using six of the twelve visible-near infrared bands. Two. wheat itraining sets were used to account for some unexpected variations in . illumination, which oc-
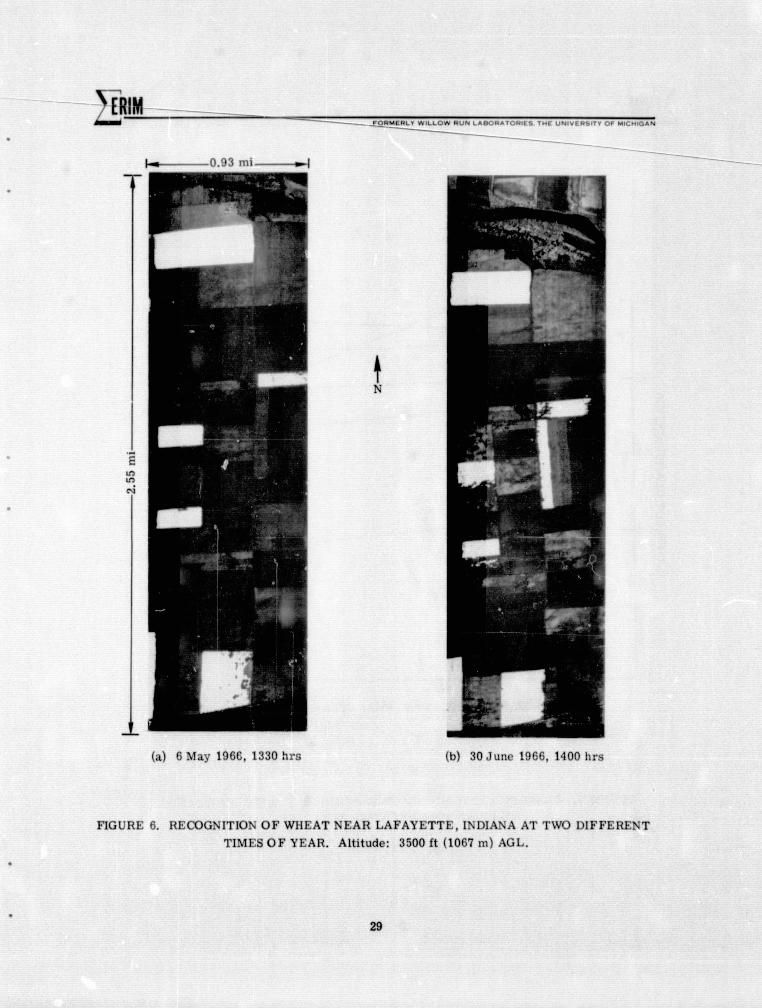
' curred randomly in the scene. The accuracy of recognizing wheat in May was 78.0 j'o. The ^ 'data shown in Figure 6 were collected on 5/6/66 and 6 /3Q/66 at 3500 ft altitude at 1330-1400hours. At that time of year, the winter wheat was green and presented a dense canopy to the
^ sensor.... Some. misclassification of oats and green pastures as wheat attest to the potential
i
difficulty of separating these classes with pattern recognition processing of scanner data.
iMore recently, quantitative experiments with crop recognition have been done at ERIM
( using selected segments of data from the. Corn .Blight Watch Experiment and data collected insupport of SKYLAB experiments in Michigan C 4, 6]. In addition to crop recognition maps, other ^:summaries of_ system performance were generated in these studies as well. These included
`,tabular statistics or graphs showing performance _as a function of the number"of spectralchannels. and of patial: resolution. As an example : of the latter type of output, Figure 7 shows ^ ;
j^the accuracy of recognition of the centers. of fields as a function. of the number of channels used '^..
r
^(
i
22
l `
_',;
e^
_ , ' ' e.: ^ ^ ne. ,.,-•.: •... ae.wvF ^. --5 ,...s .^..,^ „y.._.^ -aaxw.^e a«.xcwuvuwn
j,.f
are my .,_». w .,c. ^.eYw.^^1^

RIM _- ^ ^.
c>M! Wt ^ A' ^: I I1BOR11TnRIES THE UNIV ER$^7v OE MIS. MIG^N
"* ---► N
^ 1 mile ^
^I iw ^Q ,^ '^9`' u.;2 - 0.38 u
' ^j,
ti7^ ^ r^, ' .^ ^...
^ 0.40-0.44 N
;^ ^ _ ^^
J^ ^^^, 0.44-0.46 p
^ ^
^L^ _... a^r"^t'^?^'...^ :m....;.^1^a 0.4G-0.48 N
^„^A.^y, o.a8- o.5o N
,^ ^. ^- . _ ^^^,.^,. ^ ^` 0.50- 0.52 N
^'^
^' _...^ 0.52-0.55 N
J^^^ ^ x,.55-0.58 u
r . _,
^ ,,, ,..^--;r ii.5x-o.h2 u
FIGURE 1. MC LTISf'ECTRAL IMAGERY OF hAVIS, CALIFORNIA AGRICULTURAL AREA.26 June 1966; 1600 hours; 2000 ft (610 m) AGL. (Continued)
23

RIM^OAME RLY WIILOW v •. ^ ABORAfORIFS THE UNIVEA517Y Of MICHIGAN
r ^ --_ N
^ 1 mile ^
0.62-0.66 y
/^ ^^:'.:.^` ^. ,, -
" „ { 0.66-0.72 N
,^ ,,^^ ..
_ - ^' ^ oJ2-o.80 p
^.., oso - i.o p^`
r ^ ^
^:^ ^^ ^ err. _ ^s. is - i.s y
''1^^_. «^y
- ^^i ' ^.o - 2.G p
. ,^.^^rt
^^ ^`4.5-S.Sy
^ ^:^ .i ^iJ^~^^
A
.Y..:Y3^9 *^ ^ ^ ^...8.0-73.5
FIGURE 1. MULTISPECTRAL IMAGERY OF DAMS, CALIFORNIA AGRICULTURAL AREA.26 June 1966; 1600 hours; 2000 ft (610 m) AG L. (Concluded)
24
.; ;
`F

^^
i..._.._
^ERIMFORME RLY WILLOW RUN LABORATORIES. THE UNIVEA5ITT Oi MICHIGAN
^ '
1
1
r
^i
}
LEGEND
Red Relatively Mature Green RiceBlue Immature RiceGreen SafflowersBlack Bare SoilWhite Other
FIGURE 2. CROP RECOGNITION MAP OFDAVIS, CALIFORNIA AGRICULTURAL AREA.
r. 26 June 1966; 1600 hours: 2000 tt (610 m) AGL;bands used: 0.62-0.66 and 0.8-1.0 µ m.
25
^r ,. a,.: .....=.s

i
ta) U.t^-1.0 µ VJdeo
- ^.''.
^ ^— 2 miles
BRIMFOAMF RLY WILLOW RUN LABORATORIES tNE UNIVEA517r OF MIC NIGAN
uJ) SG 77 CN ^I
^4 ^N..
C CT
^,cle sal.I S II^, .
sav ^ ^S^7
Ct^OCNJI CNJO ^ Cr
s.,e 7NIJ Ip CND
CN 1^
(t J/ Sa 71Sf, 7A
to ^e Es .^ 7
u ^t le 71
IX
CNJf
I•
(b) Ground Truth Map
KEYN--^ CN = Cotton
SG = SorghumCT = CitrusBS = Bare SoilFF = Fallow Field
F = Farmstead
FIGURE 3. VIDEO AND GROUND-TRUTH MAPS OF WESLACO, TEXAS AGRICULTURAL AREA .30 June 1966; 1430 hours; 2000 tt (610 m) AGL.
26

^l 1.^
^j ^ ^ I ^
^ rr ^ ,
^ ERIM _____ _FORME RI ♦ WILLOW RUN IASORATORIES THE UNIVEASAT OE MIC MILAN
1^ ^^
2 miles --
^^ .
^^.
t
w.
_ ^
^ ^ ^.
.1 ^^
^^ r^ ^^^^ ^ - lµ'
1 ^! ^,.► .`^ ^ ^ ,1 ^^ + J^^.
'^^ + ^, ^
- ^ ^ ^ (i
^P •^ ^•^'
^. ^
Y
^f.^ ^^
^ R` ^ .
LEGEND
Red Cotton Cl:iss 1Blue Cotton Cl:iss 2Green SorghumBrown Bare SoilWhite Other
FIGURE 4. COLOR-CODED RECOGNITION MAP OF R'ESLACO, TEXAS AGRICULTURAL AREA.30 June 1966; 1430 hours: 2000 ft (610 m) AG L.
F2i

LEGEND
W =WheatS =Soybeans
C =CornA = AlfaltaP ^ Pasture
RC =Red Clover
SD =Sudan GrassO =OatsH Hay
r (Fleldq Not La !xiled areP Unknown C*.,psl
W17 _
S
C
r
ai. _ _
. ^,. ^ '9S
S
5 O e ^ i C iP y RC O O S W3
PRC _ . _p:
^ C C C
p S W3p R W
- a p SS P C
5 ^' ^,
C
SR' 4
CI
S p C —.
h RC S S ^+ ^i
g
... CW I p
RC S ^
7SW7i ^ RC g S C P
- N $}
P 1ti'2 CW
C C 9 S C S O 6S W2C >,
o ^ N ^ a r' Wz ?;
S ^ ^ s
^ jF p O
C S R ^
C C RC C r
S I,ii
WC S
l
C S 18 _
5 S S'i ! 1.i
P
Wll W12W13 C ,+ W
W. W 14
P
,1
11 p 12 13^ !
S
W19
t ^ $
^l--- U.,93 ml C ARC ^I 2.65 mi(a) 6 May 1966, 3500 ft (1067 m) Data
(b) 30 June 1966,:10,000 ft (3048 m) Data '
FIGURE' 5. GROUND-TRUTH MAPS FOR DATA COLLECTED NEAR LAFAYETTE, INDIANA''
28 '
i. `. - -'3
k. ^L
L .i`
l s
_
il^
F
{
{
1 ^• ^
^ ^^
- . - ._._. ._._..
uM^YIY
^ER^1^-^ iORME RL Y WILLOW RUN L^B^R^T^RIF S , TM( 11N iR_ T AC _ r y
n ^^ 111 ^I
(a) 6 May 1966, 1330 :ors (b) 30 J une 1966, 1400 hrs
}
if
If.
N
1
-1_:,
FIGURE 6. RECOGNITION OF WHEAT NEAR LAFAYETTE, INDIANA AT TWO DIFFERENT
TIMES OF YEAR. Altitude: 3500 ft (1067 m) AGL.
29
E..

RIMFORMERLY K
E ^..
lno D_____--Q Woods
O ^D Corn
O90 D w p Ripe Oats
Weighted Average ofp • Classes
• • OtherU_
k' $0
v:^;..7U
F ^U^ 70 ^
O^ Soybeans
UEc
fi0
504 6 ^ lU 1:
NUMBER OF SPECTRAL CHANNELS
FIGURE 7. CLASSIF'ICAT'ION ACCURACY VS NUMBER OF SPECTRAL BANDS,MICHIGAN AGRICULTURAL TEST SITE
,,
30

i for classification. The results demonstrate that for these data, collected by the M7 at 1030
ahours on 8/5/73 at an altitude of 10,000 ft, four-caannel recognition of the crops studied -corn,oats and soybeans is nearly as good as twelve-chai.nel performance,.. (It should not be inferred ,<"from this, however, that the four channels used, 0.62-0.70, 1.5-1.8, 0.41-0.48 and 0.67 -0.94 µm,
. are optimum for other crops at other times in the growing season.) Figure 8 shows the acreagemensuration accuracy for fields of varying sizes as a function of the spatial resolution of
digital data. The different spatial resolutions were sinnulated by averaging samples of digitizeddata. Because digital scene .elements containing field boundaries are often, but not alwaysmisclassified, acreage mensuration accuracy was found to decrease as the spot -size resolutionof E
,.he data increased relative to the field size.--The effect is most drastic for: small fields. ^.,.
These quantitative results of crop classification and mensuration accuracy were =d in theselection of bands and spatial. resolution for the Thematic Mapper, which may be flown on the ,EOS satellite in the 1980`s. '.
The Corn Blight Watch Experiment, conducted in 1971, was the first large-scale attempt„, to map the development of a crop . stress during the . growing season. In this experiment, pe- }
riodic coverage was essential for accurate monitoring of blight development. A camera in the
j NASA RB -57 aircraft collected" color- .infrared photography every two weeks during the growingt
season for sample segments which spanned nearly the entire U.S, corn-producing area. Air-craft multispectral scanner data were collected by the ERIM scanner system in mid -May; and ;^
!bi-weekly from late June through mid-October over 30 segments from northern to southern ^ ^.Indiana. Extensive. ground information was also gathered by USDA personnel and by invest-gators from ERIM and LARS. ^ ^'
r Pattern recognition techniques were used to map blight severity. Fifteen 1 x 8-mile strips ','of data were processed every two weeks at ERIM on the SPARC computer. As an example of
a ::the SPARC -processed data, Figure 9 shows 0.67-0.94 µm imagery and processed data of seg-
t^
;^: ment 212, near Crawfordsville,. Indiana. Also shown in Figure 9 is color-coded recognition of '-' two classes of corn blight -mild blight (levels 0-3) in green and severe blight (levels 4 and 5) int;
a
red. The blight levels were coded 0-5 representing no blight to severe blight. It was the con-
^^ elusion of the Corn Blight Watch Final Report [3 ] that the. two classes. of blight shown in Fig-
,` ure 9 were at least. as accurately mapped by the computer processing of airborne multispectral"^ data as with photointerpretation of high-altitude color-infrared photography.;^^,
i 2.4.2 EARLY DETECTION OF FOREST DAMAGE
€`. Each year as much as 50% of the timber volume added by annual growth. to the forests ofE;
`; ^ the United States is destroyed by insect pests and ree diseases [?]. In addition to :the timberactually, destroyed by these forest enemies, heir actions also result in reduced growth and
;IiI -;,
f t 31ri
L€ t

^ ..
,,.
"rs,
^^ ERIM' ^ ^'. UNIVERSITY OF
,
^^4
FORMERLY WILLOW RUN LABORATORIES. THE MICHIGAN ^^
4
i,
^.
Size Class3 0.40
,, • 0-10 .Acres
0.35. !5
^^;
G
,0.30paa • 10-20 AcresW! r
O^;.
E,, • 40-80 Acres
!0.25`
W i
0.20Wp^ • • 20-40 Acres y jUr^,
1
Fa
x,0.15
^^
d P
^ Y^
! ^ 0.10
•
xy ;^ •
;, •wi
0.05 t; _
• 80 -1.60 Acres
;:
0 10 20 30 40 50 60
SPATIAL RESOLUTION (Meters) ^ `I, ,:
^
ii -
} ,
";
r ^
32
i^ _ -
^u. d

^P:!MFORMERLY WILLOW RUN LABORATORIES, THE UNIVERSITY OF MICHIGAN
^ —N
—8 mi ^
n
^ ^ ^' ^ ^„ .fit ^ ^ ^
4^'
^#3• ^ ^ ^'.- .
i1
^ ^^ ^
1'Y ..^
.
(a) 0.72-0.92 µm lmagery
^^ - ^/ i , '^ ' ^ fir, s r
',^ i ^►
^_ ^^ ^ .^..^ -.ice,_ ^ _I/^ . -^._^ -- ^ ^ ^ '^
(b) Color-Coed ltecognrtion Map
Color Material Optimum Channels (µm)
Green Corn, blight levels 0-3 0.50-0.54Red Corn, blight levels 4 and 5 0.58-0.65White Not recognized 0.66-0.76
1.0-1.49.3-11.7
FIGURE 9. COLOR-CODED RECOGNITION MAP OF CORN BLIGHT NEAR CRAWFORDSVILLE,INDIANA. 17 August 1971; 1030 hrs
33

j^
^; _ ,
fI
!ii' impaired wood quality in the remaining trees. In the worst situations land may even be leftcompletely unstocked by desirable tree species...
In most cases, effective .control or suppression of these destructive .agents 'is dependent
largely on early detection of their presence. Unfortunately, this is all too frequently impossible: '
One reason for this is the extensive and remote nature of the susceptible-area. Another is thefact that the reconnaissance surveys required for effective early detection of pathogen activitywould have to be added to the already formidable work load of field personnel.
This means foresters must depend on incidental reports of tree damage and identificationof causal agents, carried out by field personnel either in addition to their regular duties, or in `response to the request of a concerned landowner who has noticed an unusual condition. By thistime, however, it may be too late to control or suppress the situation. The damage syndromemay have covered too extensive. an area or may be at a developmental stage that will. not re-spond to treatment; the particular time of year may also make it impossible to solve the prob-
lem. In the long run. this results in an increased loss of forest resources, a compounded salvageproblem, and usually greater costs for control or suppression when it is feasible,
The use of aerial reconnaissance surveys employing either trained observers [9] orphoto-
interpretation techniques [10, 1^, 12] is a partial answer to the enormous surveillance and ^ ,assessment task this problem poses. Large and/or remote areas can be surveyed from an ':.airplane for a fraction of the cost of using field techniques. Yet for several of-the more im=
portant types of forest damage, these advantages have not :been realized, since investigationshave shown that damage still cannot be spotted early enough to permit effective remedial action;the period of time required for specific organizational response still exceeds that margin
a
gained by the use of aerial detection methods. _
There is, nevertheless, hope for improving upon existing methods of aerially detecting in-cipient damage by two of the more destructive groups of damage-producing agents, bark beetles
'and root-rotting fungi. While these .organisms are dissimilar in nature .and mode of attack,. i ithe manifestations of the damage they cause to individual trees. share certain common char-acteristics. Following an attack by either agent, the first serious physiological effect of the ;stress induced in the host tree is an interruption. of the water transport mechanism betweenits roots and the leaves. A system capable of sensing the manifestations of this moisture stress , ,might provide the early warning of infestation or infection that is required..
In laboratory experiments, Rohde [13 ]measured an increase in r.iid-infrared (1.0-2.6-iCm)reflectance in Fomes annosus * infected needles of red pine. It is significant that. this-change
j _.
i
*A root-rotting fungus.I
34

fHE UN^V ER517Y
'•, was observed before any visible change became apparent in the foliage. Since imaging caps-
F i - bili.ties of the multispectral scanner (MSS) permit it to collect data in the critical. mid-
' ^ infrared ortion of the s ctrum which`s be and the hoto ra hic re 'on it ap pe , y p g p gi , ppears that theMSS may possess 'the potential to improve aerial forest damage surveys involving. these
^'• pathogens.
i f
As an empirical. test of this hypothesis, data were collected over a NASA forestry study. site near Ann Arbor, Michigan, in June of 1970 and 1972 [ 14]. The study site - is comprised . of
three distinct stands of conifers, each approximately 35 years old. Eastern white pine and red', pine are planted separately and cover most of the area, but a small stand of mixed hemlock
and spruce is also present (Figure 10).
The multispectral data were collected at an altitude of 1500 ft, providing an effective j
ground resolution. of 4 ft2 . ^ ,1
Olson (Principal Investigator) and Roller (MSS Data Processing Task Leader) realized that.
,^ before a MSS could ever become a practical alternative method of conducting forest damage
i surveys, any data processing procedures and analysis strategies developed must . overcome sev-
i eral important criticisms. These included: .=^:
,.fi i1. the high costs associated with MSS data collection. and processing; ^?2 the - complex nature of this technology, which makes it a high-risk survey technique; and3. the abstract appearance of the computer -generated results (either statistics or line- ^
3
i- ^ a
j printer portraits of a study site), which requires special ,training before it can be
(^ ; correctly interpreted.C
:y ^
With particular regard to this last issue, it was recommended that, in the design of the system,the ability to make ready comparisons between MSS results and photographs. and _maps should -
' be a high prioriay.
The ratio-processing technique developed for this application and illustrated in .Figure 11
shows promise in meeting. all these criteria. In the ratio-processed MSS data, the study sitestill appears much as it would in a conventional black and white photograph; the only difference
^ ^' is that the tonal values are reversed from those which we normally encounter. Tn this imagery'.
^ hardwoods are very dark, while conifers are light. The two MSS data channels ratioed were a 3
near-infrared (rTIR) spectral band, 1.0-1:4 µm, and shear-infrared (]>TIR) band 2.0-2.6 µm It is
^hwas hoped that by ratioing it would be possible to enhance the appearance of trees with. an in- :,
I ^ creased reflectance in the 2 . µm region, due to water stress, yet with normal 1' µm-reflectance,because no changes in needle morphology had yet occurred. - ;,:,
Six tonal anomalies were =found in the processed MSS imagery ._ These are the darker` areaswithin the conifer stands indicated. by the arrows in Figure 11. Comparison with the phofointerspretation results shows that - four of these anomalies are the known infection .centers detected
y } 35
f ^ q^ 1
E '^
;.
,.
Y
r.,3
4
;^

Close-up of Study Sit,
_}1 .^
RIM^ ORME PLY WILLOW AUN L1IBORI^TORIES THE UNIVERSITY OF MICMIG^N
3
BeSSey Lake
.^ `^--t _^.t^
Locatiot^al Diagram
'^'^ r. l , %' •.f ^^A ^
^^ ^^ w `•4
r S;^'^
.. ^ ^y^f F r' In ^ ^+
^,.,
/ s ^ , t^ ^' " ^", ',.^
•^
^ ^ ,^•^'`^y^ .jt
+ ri4 ^ '> ^.^ J
Fishville Rd
i.utz Rd.
**1,
R^^
Le end
White pineRed pineSpruce-Fir
^ ^` HardwoodsKnown Fomes annosus infection centers
1 ^4 mill
;. a
^^ ^ J
^^/^^^
^^^
FIGURE 10. FGREST DAMAGE DETECTION STUDY SITE, SHARONVILLE STATE GAMEAREA, JACKSON COUNTY, MICHIGAN. The original color infrared photography is 70 mm
format and was collected on 5.lune 1972 at 1100 hrs, 3000 ft (914 ►n) AGL.
36
.st«

J-^J^_. J J.. 1_^J___l_
RIMFORMERLY WILLOW RUN LABORATORIES, THE UNIVERSITY OF MICHIGAN
' using photointerpretation methods. All of these known infection centers were characterizedby holes in the canopy, actually dying trees, through which the litter of the forest floor wasvisible.
Very close scrutiny of the photography in the vicinity of the two additional anomalies re-sulted in the detection of the presence of one small dead tree and one which was highly faded(yeYlow-green foliage) in the area of anomaly 6, and no visible damage in the region of anomaly 3.
Examination of these areas on subsequent photography, collected two years later during arepent survey in 1972 (Figure 12) shows that both have developed into new infection centers{field verified). This indicates the value of a MSS data enhancemenk technique for use inforestry work. Both of these areas would have been unnoticed for. two more years if the MSSdata had not focused attention on them. It is precisely this type of early detection ofpathogenactivity that will give foresters the time they need to be able to provide adequate protectionfor our forest resources.
In an operational survey, strip film imagery of this type could be .generated using a wetprocessor in-flight, and. be ready for interpretation upon landing or for .immediate distribution
,. to field-checking crews. The job of aforester-image interpreter would then be to scan eachplantation. or stand. for obvious tonal. anomalies. Only these anomalies need then be checked. on
,, the ground.
', 2.4.3 WATERFOWL HABITAT ASSESSMENT^' Each year the. opportunity to observe migratory waterfowl returning to their northern
breeding grounds in the spring, and then to hunt. them in the fall as they once again head south,offers millions of Americans countless days of satisfying outdoor recreation [15] . In turn,sportsmen and others who enjoy the outdoors contribute. to the perpetuation of this renewableresource through revenue collected by the federal government from both. the sale of duck.. stampsand taxes on the sales of firearms and ammunition. -
^! The agency .responsible forthe protection and. management of migratory waterfowl is theUnited States Fish and Wildlife Service in the Department. of the Interior. Their research hasshown that annual populations of migratory waterfowl, unlike resident small-game species
r! (e.g., jack rabbits and pheasants), can be greatly .influenced. by hunting pressure [16). Largely,.this is a result of the fact that hunting is the major: cause of mortality among the young of the
.'`. year for many species of waterfowl, although changes in weather and the water conditions of the'^ wetlands in the breeding grounds are also important [17, 18], What this means is that proper
amanagement. of migratory waterfowl requires an annual adjustment of :hunting regulations toinsure that a sufficient number of birds remain after the hunting season to provide for produc-
^+ tion the' following year..;^i >:
37
:f
r,
!F ^^.
. ..b,

2.0-2.6 µto
1.0-1.4 ^: n^
..rc.:^a
0L)3.
:^.^
6r
Q
f..OCUEc0ti
^p
,,^
,,+,
R^S
" ^
1
c.ccU
^..^UC7
O.
/ORME RLY WILLOW RUN LABORATORIES. THE UNIVER517Y Of MIC NI(^AN
ltaw Data
RIM
FIGURE 11. 1970 FGtiIES ANNOSUS DAMAGE DETECTION SURVEY.Multispectral data and 70 mm color aerial photography collected on
6.Iune 1970 at 0930 hrs. 1500 ft (45? tn) AG L. (Continued)
38

__^__-__ ^ T r
I^.^.^
RIM^ ORME RLY WILLOW RUN LABORATORIES. TN [ UNIVERSITY OF MICNI^.AN
^ Data Processint;
;1lethod: Stereoscopic Photo-Interpr^t3uu;.
Circles indicate location of suspected
infection centers.'Method: Ratio pmcessir^ of near and mid-IR data
6M<•^'^;^
1
^y
3
4
Anomolous areas indicated by arrows
° FIGURE 11. 1970 FOMES AN NO SUS DAIv1AGE DETECTION 5C12VE^^.Multispectral data and 70 mm color aerial photography c^^llf^cted on
6.Iune 1970 at 0930 hrs. 1500 tt (457 m) AGL. (Continued)
39

i
I i
_.
^;
^ERIMFORMERIV WILLOW RUN
Results
2UNIVERSITY OF MICHIGAN.
r_. _...'i
'.
Four suspected F. Annosus infectioncenters. identified d^g
4
i
All four suspected infection centerseorr•elate with locations of known pockets
4of F. Annosus infection.
__ i
__
^,
j ^
u
•Six anomalous areas identified.yyk
Y
^^i
-
€j
{k
^7
7
•Four of the anomolous areas correlate1
^3
with locations of known pockets'ofF. Annosus infection.
"• Two additional anomolous areas remainto be correlated with further work.
FIGURE 11._ 1970. FOMES ANNOSUS .DAMAGE DETECTION SURVEY.Multispectral data and 70 mm color aerial photography collected on
` 6 June-1970 at 0930 hrs, 1500 ft (4 .57 m) AGL. ,.(Concluded) ',
40
,. _ ^.

r^i3
r+
^^
^ „#^` ^' r ,i t ^;^ ^ s
# ^:
^a) ^l^S Data Processing Results. 1970 Survey
o •known infection centers
e ^ suspected infection centers
,.
f ( I^' A
t .^ ^•y,
fir E^ crr ^ly' `^ k
. r ' Y ^ ^
• ^ ,^, t^
M, ^. S,GC
^^^a (y^ *,
^/^ yc^ f LJ, t'^^ ^^Ti ^^
^Y^^',yt `'a f
rS
r
}i
fx
TD
S
r
i
i7c
(b) Color Infrared 70 mm Phuwl;raphy, June 1972 Survey
Arrows indicate new holes in the canopy andfadir►k trees (blue crowns), which confirm
1970 MSS Survey results .
FIGURE 12. FOMES ANNOSU S DETECTION: COMPARISON OF 1970 MSS SURVEY WITH 1972 PHOTOGRAPHICSURVEY. The color infrared photography was collected on 5 June 1972 at 0930 hours, 1500 ft (45? m) AGL.
., , ..a.::;,:^w

_I _. I I I i l^
RIMFORMERLY WILLOW RUN LABORATORIES, THE UNIVERSITY OF MICHIGAN
In order to set appropriate hunting regulations, accurate estimates of the current year's.recruitment for the populations of the different species-of waterfowl must be available at thetime these regulations are established. Since the regulations are set in late summer, before. themigration. actually begins, a critical need thus exists to be aide to accurately redict - the size.of the fall flight from the breeding grounds.
To meet this need, over the past twenty years the United States Fish and Wildlife Servicgf (USF&WS), in cooperation with the Canadian Wildlife Service (CWS), haS developed systematic
^ aerial inventory procedures. for predicting. fall waterfowl populations [19, 20] . Aerial transects^ ',
are flown in May and July to gather information relating to sizes of breeding. populations, habitat
' condition, and estimates of waterfowl production. Limited. ground samples are then used to ob-tain correction factors for the large body of aerial data, and the adjusted results used forreaching management decisions.
1
j^ A problem inherent to the above procedure is one of timeliness. Predictions regardingthe fall waterfowl flight must be available to the various flyway council meetings held in early
j ^ August, when the bag limits and season lengths are. established for the fall hunting period.Aerial surveys, however, often are not completed until the end of July. As a resulf, wildlife.
^,.^ biologists are hard-pressed to evaluate and. develop the necessary recommendations in time to ^
i ^ meet this annual deadline.
Recently, biologists have suggested that a reliable brood-production index could be derived 1
I ^ for several species of migratory waterfowl in the glaciated prairies and parklands of the mid-continent from a comparison. of the number of wetlands characterized by open surface water
("ponds") existing in May and July, and independent of the actual size of the breeding population
i}}^[17]. Because water can be easily recognized using a single near-infrared wavelength band of
^ 1 data, the use of an airborne scanner system to record the terrain's appearance and a machine
processor to analyze the electronically recorded signal should provide a very efficient means
I^ of gathering. and analyzing data on surface water presence and distribution.
3
The United States Fish and Wildlife Service (Northern Prairie Research Station) and ERIMconducted joint. studies between 1968 and 197.2 to establish the feasibility of this approach, and
^rto determine optimum data collection and processing strategies and systems [21, 22] . Theimagery. that follows illustrates the results and. procedures developed during this work: (i)raw video data collected by the scanner (Figure 13); (2) the intermediate data processing step ,^
I i in which the ponds are delineated (Figure 14); (3) the final step, in which summary statisticsI i y
describing the frequency and distribution of the ponds counted are . tabulated (Figure 15). zi
I^
The advantages found to be gained using the MSS system are several. First, a uniform
criteria is em to ed for detectinp y g ponds and delineating their areas and perimeters. Second,^f
area, perimeter and shape measurements can be made more rapidly using a . computer than by^'
f 42i.
`,^

,^
1{
RIMFORMERLY WILLOW RUN LABORATORIES. THE UNIVERSITY OF MICHIGAN
♦ ^,
. • ' ! ; !..
T ^ I '
a
i^. / ., ^4 * t ^ , x
^.
..
' o ,.
a:
^ '^'., ^ . ..
at: :^.d. ,
(a) 1.5 -1.8 µ m, Raw Analog Imagery
P
b.
- ^_7 ^^P ! G
(b) Level Sliced Water Recognition Map, 1.5 -1.8 µ m, Digital Imagery
N
FIGURE 13. POND DETECTIOI': ACCOMPLISHED BY THRESHOLDING 1.5-1.8 µm DATA.31 July 1970; 0955 hours; 4500 ft (1372 m) AGL; Woodward, North Dakota Study Area.
43

^ERIMI ORMF RLV WILLOW RUN LABORATORIES. THE UNIVER517v OF MICNIGAN
r ^ .. " "'
Y'
^6 '.. ^^'n
y`
^`. T'^ 5.. ^_i. .l'"+ offs/
(a) May Distribution of P^nu1s
M.^
'^ w
^y
^" 1
b) July Distribution of Ponds
` ka
"^^ .^a^
I'.
_.. .;..i,4.
^^ n •'
FIGURE 14. CHANGES IN POND AREA BETWEEN MAY AND JULY DETECTED IN PROCESSED DATA.Woodward, North Dakota study area; 2000 tt (610 m) AGL, 1.5-1.8 µm data.
44

^ _ -T--
"
^ERIMFORME RLV WILLOW RUN LABORATORIES. THE UNIV ERSIT• OF MICHIGAN
► anJ, PJ79e-N.N, nAanTA. 2z riir 197o. "1Wi+ Gs-1.b RTCao.+s. lirE 1. 71c rT -^IVesle^;,7 n1a1,191,e7. ►olvfs uc n,DU 2^•
AITITUOE • t104.fT YEIOCITY • 207,ti/fEC SCAn RNTE • tS._i R^ RE_•_OLU_TION • S.1! NAAO _ONE fC^NLINE ^N Z• 0161T12E0NROIA AI fLINI NO,le9 ►61Nrs coLilfEU Ir vOl U6E lif3 NETYfLN J ANN 1.23 YOITiNtl • 0 'IC • l SM TN• 5, 62 FELL
SCAN LINC POlvl a^[n IeCRES) ►EkIME1E0 It<EETI SHdDF ^
--TI<iri-- ^ --- _ .Tim ^ 1. 6"18461 le7 ,279 ♦1•.19 .9:0IBAT5 l97 •trS2 759.166 -` 1.367 - •- ^-1tlAtl7 23l .1i6 272,234 .459l•S1S l59 ,37R ♦56.5911 ---- - .956 -^lJ5l3 190 ,121 )40.712 1.17♦-TlrSe-.^ .
-wit -- ^P -- -T.S4^-IiSev 216 1.57! /993.6P^ 1, 4a7IBe2^ l30 .CSU ^---- ^ - 169,165
_.904 --^-^ ^^^ ^--^---
Itl721 let i,^IR 775L,67: 1,461Itl733 ^ ^- X79 .^67 739.502 ^ -^ "^-• -^[. 107 --^^-- --iN7eB l72 .O1i 271.e7• 1.213ta^r^-- -- _mot_ -3s^^-- A--1 y R15 2^a 11.515 e197.C77 2.2BB1 RR )1 135 .569 X17.947 ,gee.IaM 1S 171 •7)D i72. 16.1 1.717leaf~ l9e ,760 •99.•92 .9•e_14919 l3^ .751 975.e91 1.1^.9
l 9v 279 -.73^ --- ^O.^^T__. _ - -. _-1 DTI_.-__
vaoJ. 1T108-N,^-^ARJTi; F2-7(a^T^7^, 1[115;-^;^j;; ^Ty^TfK^-- -LINESIe^G7 THAUI4 YIOr ►01'ITS l30 fHRU )AR
-- 'AaEA Ol3TRTFOTI 'N -------^ErtTf1ETEiC DT3TwT^ui MTiE^T3TTCITTIb1>-^IACNESI IFEET I
•1!+ TO .70 ^ 1)O. TO ee0. • 1.00 TO 1.10 7 •-_:fo ru :36" _ . --T--- -iii i^ X93----^-Tii-^T.3^-.lo Tn .^0 2 990. t0 1120. 0 1.20 r0 1.10 I_:aa to .SQ - -^--- ..--_-TSib^ ftr [ass. -- - 1 --fib-^ 7;z0---•--^- --,so ro .eo 2 lest. To wee. _ o I,^o To I.su z
.TO f0 .•0 2u.
2110. TO 2610. 0 I.60_TO 1.T0 0.ao TO :#___ --3 --ZaiII^)fZ9T!1. T`-T70 TtfT:.^6 - -D.90 f0 1.0a 0 1910. TO 3700. 0 1.•0 TO 1.90 01.D7 TO IIC---T--- --Zi05: TC--1631, ---'^ ---T^^^-a
2.70 TO ).^^ 0 1.7C. i0 396,. 0 2.00 TO 2.25 07.0. -TbT^'i'!IIS.UO TU 10..7 0 ♦290. f0__^62D. 0 2.50 TO. 2.1S 0
IU.OJ fU 15.00_
T --^ --^ --- ♦b2J. Tt1 ♦950. -_ --a_--_.._^^T^^T^3-____^ ___-._15,00 IU 20..W 0 •950. i0 5760. 0 1,00 TO 1,2 5 0
UVER 20.00 --^-- - O- "^^ "-^--^" _
OVER 5787._
^ I -bY^3:^_ _
^-`
FIGURE 15. TYPICAL DIGITAL COMPUTER PRINTOUT OF POND STATISTICS22 May 1970; 1013 hours; 2100 ft (640 m) AGL; Woodward, North Dakota study area; 1.5-1
' Pond Shape is defined as Perimeter Waterfowl managers are interested in pond perilr4n area
sfiape because it influences the number of breeding pairs that can occupy an area. Irre^shaped ponds can provide more shoreline suitable for breeding, all other conditions bein
45ORIG^^
pAGEOF POOR QU^

;:^
i;, ,,:
I =ti
`.
RIM^ I FORMERLY WILLOW RUN LABORATORIES, THE UNIVERSITY OF MICHIGAN ^^tI _... t^,II
_. _.
.. ^ +
' hand; computers also permit the display of summary statistics quickly and easily accordingto several different tabulation schemes. Finally, the increased efficiency with which the re- ,source can be inventoried makes it possible. to analyze a larger area, thus. increasing the t.sample size and, hopefully, improving the accuracy of the production index.
Present research efforts are involved with. investigating the feasibility of using satellite ,; jdata to rovide an additional dimension to the s no tic nature of this a )P y p pproach to the problemof waterfowl habitat inventory [23] . Results of this research may indicate a combined satellite/
^1 aircraft program as the most efficient method of getting the essential survey data.I
2.4.4 REGIONAL GEOLOGY INTERPRETATION3
Geology represents a particularly suitable application of modern remote censor data for
several reasons. These include the need for large-area spatial terrain information, the varyingspectral reflectance and emittance characteristics of geological materials, and the general '
j acceptance in the past. of aerial photography as an important part of geological exploration and
I mapping. This last reason has allowed geologists to readily perceive ;the value of extending . ^ ^,established techniques of photo-geology to newer types of remote senspr data. With these new `!types'of imagery the geologist is able to discern and identify terrain patterns of useful geologic
'.I + _3
detail which are either very subtle or absent in aerial . photos.
Data from two different test sites provide examples of some of the geologic information
available with modern imaging sensors: multispectral, thermal IR.,and radar. The two sites are .^(1) the. alluvial. fan and fault zone along the base of the Stillwater Range in :west-central Nevada,
k ^ and (2) the volcanic terrain of the Pisgah. Crater area in southern California. The fact that both^ of these. sites are in acid climates maximizes the .surface exposure of geological materials..
.The . Stillwater Range was one of the earliest geological sites flown with the M5 scanner system(25 June 1966) and Pisgah Crater has been recorded on four different multispectral and radar
j missions, commencing in 1967. ,_f , - ,..
The Stillwater Range, like most ranges in the Range and Basin Province, was formed by '.
Itectonic uplift along steeply dipping normal faults of Cenozoic to Recent age. Indeed, recentearthquakes indicate. that the fault zones are still active. In places these faults have resulted
,^ in scarps several feet high which commonly traverse the alluvial fans at the base of the ranges,rl interrupting drainage patterns, blocking roads, and providing evidence of the fault locations [24] .If, ^e accurate detection and mapping of the major fault traces and zones provides an important ^t Th
^^
key to understanding the structural geology of an area and is a prerequisite to the currentinterest in earthquake prediction. The continuous strip format and spectral detail of multispec-
tral images is used to advantage in recording andenhancingthese narrow linear terrain patterns.
46
^" ., ,
f
x
...v .. ,

Figure 16 compares three multispectral images of the fault zone along the eastern edge :3
G^ ^ of the Stillwater Range. Image (a) is a reflective infrared image recorded in the 1.5 to 1.8 µmrange. In this spectral band many_of the-surface drainage details and a road track across the
a
^ a•':;
`' valley alluvium may be discerned. .Image (b) is recorded in the 4 . 5 to 5.5 µm thermal range ^4{
• and shows grey tones associated withdifferent alluvial, materials. Image (c) is a ratioed image^' of two infrared spectral. bands in which the fault trace along the base of the Stillwater Range^^ can be easily perceived. . This trace, evident on image (a) as well, is formedby a series of
3
scarps, twelve feet high or more, in the alluvium. Comparing the 'images with data recorded rin the visible wavelengths, it was concluded that the reflective and thermal infrared data pro-vided better image contrast of terrain scarp patterns in these fault zones. Indeed, the fact thatthe scarp appears dark in the reflective IR and warm (light) in the thermal IR aliaws its lo-cation to be enhanced in the ratio image.
From a hydrologic perspective the differentiation of alluvial materials in this grid en-vironment may provide evidence of sources and flow directions of subsurface water. Figure 17 r "^'compares three.. images which, successively from top to bottom, provide better. delineation of the ^ iahuvial materials at the base of the Stillwater Range. The upper image shows contrasts in the
` 0.8 to 1.1 µm range which are very similar to those observed in the visible range. In other^,rt
words, it is unlikely that aerial photography which records in the visible . and near IR wavelengthswould provide. fetter differentiation of the alluvial materials than is shown in this image. The:, ^ '.middle image was recorded in the 1.5 to 1.8 µm range and shows many of the fine details of the ^,incised channels caused by ephemeral. streamflow across the fans which are not apparent inthe upper image. The lower image is a ratio of the 3.0 - 4.^1 µm andthe 1.5 = 1.8 µm bands.This image clearly differentiates the extent and general orientation' of these alluvial fans and l
confirms other observations that the near -IR spectral range provides unique discrimination ofJ
geological .features{25] . Near the base of the fans is the Hum6olt Salt Marsh, a salt marsh
playa.. The . ground water: is provided to this marsh from the Stillwater Range 'through thealluvial fans shown, and. is also affected by the tectonic activity of this area. ^ ;
Pisgah Crater, :California, has been. the .site . of a-number of geological investigations uti-izing remote sensor data. Its selection provided' good exposures of a variety of lithologic ^ s
materials — including _ lava flows of different ages and, surface textures, felsic materials, andrecent gravels and alluvium [ 26] . Almost no vegetation in this acid area obscures .the geologic ,: ^materials.
gu g ...from a study of the Pisgah Crater area,Fi re 18 shows three thermal infrared ima es.two of which a ear similar in contrast 27 The tpp [ ] . hird image is a ratio of the first two and ^
,` ,^#shows relative differences between. them. Each image shows an area of approximately 0.8 by5.5 miles. -Several features are worth noting. The two similar images were obtained from ,
^ ^^
^^
47
`^t
;^^,
a
i

1^`r
.^'k.
^^ /p^^M•
4
•,
r °
^^
..mow
XQ
a^^,..
3
^ERIMEORME RLY WILLOW RUN LABORATORIES THE UNIVERSITY Of MICHIGAN
:ult Line--1
Fault Line(a) 1.5-1.8 µm (b) 4.5 -5.5 µm (c) Ratio 4.5-5.5 µm
1.5 - 1.8 µ m
FIGURE 16. COMPARISON OF THREE MULTISPECTRAL IMAGES OF THE EASTERN BASEOF THE STILLWATER RANGE (DIXIE VALLEY), NEVADA, SHOWING THE LOCATION OF A
FAULT ZONE
48

E
E
(a) 0.8-1.1 µ m
rw - _r
c..^^}
..F)
H1 µM
T.
^^^ v..M^^
I i i I I ! (
F
BRIM _FORME HIS Wilt ': HUN IAFI . ^^^ u^FS THE t HS^T^OF MiCNiCiAN
(b) 1.5 -1.8 µiii
_ ._. _, .^. ..r.^...LL_ _. __ _ __fn.^ Ronan t
,,. T
:^rAl1UV1.^
_^:lal
^':^iley
(c) Ratio'i'^-4'1 µm1 5 1 8^1 MileMile _^ - ,"n
:^
FIGURE 17. COMPARISON OF THREE INFRARED IMAGES OF THE ALLUVIAL FANS AT THEBASE OF THE STILLWATER RANGE, NEVADA. Data collected 25 May 19f^6 at 3000 tt (914 m) AG L.
1
49

l ^^
^3
cn0
(a) Channel 1: 8.2-10.9 µ m ., . a.^.
(b) Channel 2: 9.4-12 m1 t^^ile
-E -- V
l:hannci 1(c) Ratio Channel 2 - R12
FIGURE 18. THERMAL INFRARED IMAGES OF THE PISGAH CRATER AREA, CALIFORNIA.Left to right: alluvium (A); partially covered basaltic lava (LA)^of phase 2; highway, fang)omerate,and gravel (f); Pisgah pahcehce basaltic lava (LP) of chase 3; windblown sand and silt (S); andPisgah as basaltic lava (LA) of phases 1 and 2. Data collected 30 October 1971 at 0840 hrs, 3000 ft
(914 m) AGL.

J_ ! I __l I 1 - I 1^^:,;
^'
- t; .
2 ^RlMFORMERLY WILLOW RUN LABORATORIES. THEUNIVERSITY OF MICHIGAN
1 1_.
3
scanner data recorded in different bands of the same infrared spectral. range..They primarilyr ` show terrain temperature differences related to the thermal properties of the materials. and
` exposure to the sunlight.. The data were collected several hours after sunrise and the southeast } iI^
slopes of the crater have been heated by the .sun while the shadowed northwestern slopes re - ;,p.
main cooler. Also, the double lanes of the highway to the north-appear warmer than the' surrounding alluvium (dark toned on the image). Striking differences are seen. in the ratio of
j these. two images. ^- ^
The ratio image, which has the effect of reducing image tone similarities between the two {
`
original images and. enhancing differences, shows image patterns of light and dark related tothe surface material and texture. For example, the annotated ratio image shows alluvium,
' fanglomerate, and gravel as dark and areas of basaltic lava as light-toned. Reasons for thesedifferences are related, in part, to the emissivity differences. of these materials in the two ^ 'infrared bands recorded [28J . In particular, because of the emissivity differences of .silicate ._
' versus non-silicate materials in the 8 to 10 µm range, in contrast to the 10 to 12 µm-rangewhere no such emissivity differences occur, the ratio of these two bands provides useful dis-crimination of geologic materials on the basis of composition and texture (particle size).. Be-cause this discrimination is based on the energy absorption of a vibrational mode of the silicon- J
c
oxygen.. band of the silicate molecule in the 8-10 µm waveband, this type of information is not:available from other remote sensor s stems.Y
Radar sensors, operating in the microwave portion of the electromagnetic spectrum,; also^ provide unique geological information. ERIM's high resolution synthetic . aperture radar col-
' lected X- and L-band imagery from the Pisgah Crater test site in 1971. The radar system has ^.the advantage of obtaining wide-area coverage independent of an exterior illumination source{such as the sun for aerial photography).. Also, .since the reflected. terrain signals are recordedat an oblique angle, they . are much more dependent. upon terrain roughness and object geometry ^
' ' than other types of remote sensor data. `..
tions of the X-band data. In contrast to Figure 18 where the cone is illuminated from the riza- 'I I Fi re 19 shows the Pis ah Crater and surroundm lava flows with two different of east,
,I „^, the radar signals make the north side of the cone appear bright. In these images-the rough-
• surfaced lava flows around the . cone appear considerably lighter in. tone, particularly in thelower (H-V) :polarized image. Metal powerline poles appear as intense brig_ ht spots along theright . side of the imagery. ^ ^
^ `^ Figure 20 shows. the 23-cm L-band images of the same Pisgah Crater area. Here the imagedetail. is much. coarser owing to'the longer wavelengths used, .but the alluvium-remains darker ,
^,
', than the rough-surface basaltic lava areas.yk ',
i @.'
51
y
I_

f 4
K` ^'.
^^ ^ ^_
^"
^'
. ^-.-
^^. y
,;. ±-
^F
,^`^' ^^
^:
i'"'"`•
^^. • "^
^. '^ ^ . u..
^.
RIM _ {pgME q lv WILLOW q UN l.A [ECJ q^T(^NIES Tl^E UN^V! gS^TY l)! M^/_MILAN
f
,.;^ - a,
`^ (a) X-Band 30' ti 30' Horizuntal-HorizontalN Direction of Flight —i►
{^• ^'^^,w r.
(b) X-Band 30' n 30' Horizontal -^ ^., t << at
FIGURE 19. COMPARISON OF TWO POLARIZATIONS OF X-BAND IMAGERY OF PISGAH CRATERAREA, CALIFORNIA. Altitude: 5300 ft ( . 1615 m) ALL; depression ankle: near edge 46°, tar edge 13°.
Data collected in 1971.
52

-^^ ."'"N. ^
r.SS
.^^ ^..
.a. .^,..
1~ '^f ^.[
{,{ ,
^. ^^ ^' ^ .
} _ •,d +^
i i- ti'
.. ;'^!
F
RIM ,{tiNMf N{ r W.' l' '{ l •fl^{kAf^^H^f S ' ^ MIG NIGI^N
y- ^,, ^
(a) L-Band 30' ^ ?^' Horizontal-Horizontal
N Dire^tinn of Flit*ht--^
(b) L-Band 30' < 30' Horizontal-Vertical
FIGURE 20. COMPARISON OF TWO L-BAND IMAGES OF THE P^ISGAH CRAT^R AREA, CALIFORNIA.Altitude: 5300 ft (1615 m) AGL; depression ankle: near edge 46 ,far edge 13 Data collected in 1971.
53

AEIFORMERLY WILLOW RUN LABORATORIES,THE UNIVERSITY OF MICHIGAN
r
2.4.5 EUTRAPHICATION ASSESSMENT
`' 2.4.5.1 Inland Lakes
.The protection of the existing aesthetic and recreational values of inland lakes is a majorcontemporary water resource management problem. The development of an effective . inlandlakes management program for the protection of these resources will. depend in part on theestablishment of suitable data collection systems and data analysis procedures.
• Eutrophica.'cion of surface waters is a natural process which is frequently accelerated by^ the activities of man. Numerous factors enter into the e, eutrophication: process, including nutrient`
loading .resulting from land-use practices and activities within the watershed, together withnutrient loading from natural sources. Hence, the development of effective preservation orimprovement. programs will require a data base which includes information regarding the exist-
ing trophic state of lakes together with land-use data for the watersheds in-question. The latter
is required for loading-function development and for the identification of land-use practices .and
activities which contribute to a degradation of surface waters. The information needed in large-scale eutrophication assessment and control programs is very extensive. Many of-the require-ments can be met through the application of .remote sensing technology....
A review of the problem. of eutrophication measurement indicates that over the years a widerange of parameters have been used to measure eutrophication and express. trophic state [29,30] . The . number and variety of parameters used for this purpose reflects.; the fact that no i
single parameter can serve as the measure of trophic state.: They also reflect the conceptualdifficulty frequently associated with the term, which has been used to describe: either the pro-ductivity status and/or the nutrient status of a lake. In general, however, an .attempt is normallymade to measure, directly or indirectly., the major manifestation of eutrophication which, ofcourse, is an increase in the concentration. of phytoplankton and higher plants and acorrespond-
'' ing change in the optical properties of the water mass. '
Chlorophyll "a" suspended solids and transparency are measurable by remote-sensing tech-niques and could serve as the basic parameters for eutrophication assessment. In the case. ofeutrophic bodies of water, the above measurements can . be supplemented by measurement ofthe distribution of littoral and/or floating vegetation as-well as by documentation of algal blooms.It should. be noted that all of the above . parameters and manifestations are widely used as indi-cators of trophic. state.
ERIM, in cooperation with a number of local. agencies in Genesee County, Michigan, recently
_ completed a program designed to introduce remote sensing technology into local environmentalplanning. and public policy formulation processes in an inland lakes area [31}...One phase of#his program involved the environmental assessment of selected inland lakes and their :adjacent
54
^^ ^, r. 2 _. _ .: ^ ^d

__ --__^_._^...^ ^.^,_,,,-.--.^.,..,A..,,-,--^....,...-.
FORMERLY WILLOW—RUN LA80RATORIES, THE UNIV ERSITV l
watersheds. Processing techniques were developed to extract information from multispectral
scanner data regarding water transparency and chlorophyll content. Results of theoreticaland. experimental studies indicate that; ( 1) the addition of suspended solids to water decreases.its transparency, and also causes an increase in reflectance which is more pronounced in thered than in the green region of the spectrum (Figure 21); and (2) the addition of cholorphyll "a"to water causes a relative decrease in reflectance in the blue region as compared to the greenand red regions of the spectrum. In general terms, ratios of observed reflectances in"theappropriate wavelength bands may be used as indicators of water transparency and-chlorophyllcontent, although the relationships are nonlinear.
Figure 22 shows two analog processed ratio images in which the tones represent the valuesof reflectance: ratios which have been found to correlate closely with water. transparency and
surface chlorophyll "a" content, respectively. fluantitative results were obtained using digital
processing techniques.. (An example of-. digital processing results is included in Section 2.4.7,Coastal Oceanography. )
Concurrent measurements of transparency with a Secchi disc and laboratory measurements
of chlorophyll "a" content have confirmed. their correlation within the range of 0.7 to 6.0 meters
of Secchi disc transparency . and 0.1 to 50 mg/m3 of chlorophyll "a" concentration.
As part of the above cited inland lakes study, the concept of a remote sensing trophic stateindex was examined and demonstrated [31, 32]. The terms included in the index were;
TI = kl ,i,^ + k2CHRS + k3VRS + k4Tratio + k50CH + ks
where '^'I =trophic indexT^ =transparency (standardized value)
CHI =chlorophyll (standardized value)
VRS =aquatic vegetation (standardized value)
T =transparency ratio (standardized value)ratioOCH =chlorophyll increase (standardized value)
kl , k2, k3 , k4 , k5 = weighting. factors
The above trophic index i a dimensionless number which includes weighting factors deter-f mined through principal component analysis. The standardized values. to be used in the equation
are determined for each parameter by subtracting the mean value and dividing by the standard^ deviation in each case. The last constant in the a uation is introduced for scalin,;^ q g purposes.
`^
The index was designed for lakes which" exhibit significant seasonal. changes. Ideally, the. first three terms (T^, CIi^, Vim) would. :represent the worst conditions encountered 'during-
55
'Fy
s'tt;.

r
e^
!^—rte ""
e
i
i
a
^^►
R
!.
i^
"c
rt
RIMFORMERLY WILLOW RUN LABOA•tOA1E5 tME UNIVERSITY OF MI[MIGAI.^
r°^-- 3.2 k m —^
(a) 0.41-0.48 µ m (b) 0.50 -0.54 ^^ m (c) 0.62-0.70 µmBlue Green Red
FIGURE 21. SUSPENDETI SOLIDS. Eastern shoreline of Lalce Michigan;altitude 5000 ft (1524 m) AGL.
56

i
Uc
w, ^^,L:
n.^'
a
c°, ^P„^ o .F.
FL
U13 ^.. .
^' x a ,
N
^^ ^v^`'► Y^
IRS'" ' ^ !+
Y ^
ai.M y '^ ..'.
` ^ - ,i
^ ,'^ ,^
7.x, y:,^ !!t- ,,
y ^' '^^^^
R) , ^ ^_
(a) Secchi Disk Transp^irenCy
^ ^ ^ `^^^i ^^'
^ ^ ^1^ a.,\ ^ 7
I. } `^`^^t^q. ° ^ f
(b) Chlurophyll a
^ERIM`- FORMERLY WILLOW RUN LABO RA T pRIFS. THE UNIVERSITY OF MICHIGAN
^ ^I
n G 7,^ ^
l °' `" G O
a^/ :d t
^ V . ^...Y
1` ^' o m
^^ a x
f.
^,
^ ^:
A «a
FIGURE 22. ANALOG PROCESSED RATIO IMAGERY, SILVER LAKE-LAKE PONEMAH,GENESEE COUNTY, MICHIGAN. 22 August 1973, 1017 hours, 5000 ft (1524 m) AGL.
57
1.

I.RIM
FORMERLY WILLOW RUN LABORA70RIES,THE UNIVERSITY OF MICHIGAN
f
a season; the next two (Tratio' OCH) are included in order to measure the shift between pre-season and peak conditions. Clearly, in the case of an oligotrophic lake any change in the latterparameters would be modest in contrast to the large: shifts which occur in eutrophic lakes. Acolor term could be added which would facilitate normalization of a data set which included bothclear and.colored lakes.
2.4.5.2 Great Lakes
^`
F Another indication of the trophic state of a lake is the extent of aquatic vegetation. In the
case of Lake Ontario, the inflow of nutrient. rich waters from. tributary sources, together withnutrient loading from major population centers around the lake, is sufficient to maintain a ref-
atively high level of productivity. This is evidenced in part by an extensive growth and develop
meat of benth'.c algae Cladophora.
Cladopho ra consists of long strands which are normally attached to a hard bottom in near-shore areas. However, at one point in the life cycle, the algae become detached through waveand wind action and are deposited on the ,beach. From the viewpoint of the horeline propertyowner, the subsequent decomposition of large.: masses of Cladophora produces highly obje^-tionable conditions which detract from the aesthetic and recreational values of the nearshorezone.
iA,ny attempt to delineate the distribution (and estimate the standing crop) of benthic algae
or aquatic macrophytes must face the issue that conventional methods of data acquisition aretotally inadequate, particularly when dealing with a large environmental system. The utiliza- rtion of some form of remote-sensing technology is clearly indicated for this purpose. a
In a project under the sponsorship of the U.S. Environmental Protection Agency, multispec- 3
trai remote-sensing data were collected for this purpose during the summer of 1972. along theU.S. shoreline of Lake Ontario.
In this effort, remote sensing technology was developed. and used for the following purposes:
(1) to delineate the distribution of Cladophora (benthic. algae) along the U.S. shoreline,
(2) to provide an estimate of Cladophora standing crop: (biomass) by coupling remote-
sensing data with ground-truth information..
To accomplish these goals, a processing technique involving the ratio of two spectral ^han-
nels was developed,for discriminating between Cladophora and. bare substrate, usually sand,under' a variable depth of water ranging from 0 to 5 meters. Asingle-channel technique wasfound to be inadequate because in any given channel the signal observed over Cladophora in -
rshallow water is equal to the signal over sand in deeper water. Using the: ratio of the signalsin two channels having the same water attenuation resulted in adepth-invariant index of bottomtype.
58
{

RIM^ ^ ^ FORMERLY WILLOW RUN LABORATORIES. THE l
Both analog and digital processing was used. In the analog imagery (Figure 23a) light ^tones represent sand and dark represent Cladophora. In the digital product (Figure 23b) a ^^light symbol represents sand and. a dark symbol represents Cladophora. Land. areas wereedited out using anear-infrared channel, and an automatic count of light and dark symbols was 3
used to estimate the total area covered by Cladophora. 1
The results show an extensive growth and development of Cladophora in the study area. ^^ Approximately 66% of the nearshore zone (to the 5-meter depth contour) in the western portion' ,, of the lake. and 79% 'in the eastern portion was found to be covered by Cladophora,[ 33] .
The results form part of the environmental data base for Lake Ontario and are published..in the EPA Ecological Research Series. Data from this report have also been incorporated ina technical report to the International Joint Commission [34] .
ii
2.4.6 POWER PLANT DISCHARGES AND THERMAL CHARACTERISTICS OF SURFACEWATERS ti
Temperature is an important environmental parameter which has a bearing on all chemical,physical, and biological processes. Therefore, documentation of existing thermal conditions-ina body of water is normally a prerequisite for (1) assessing the impact of thermal discharges,.(2) water quality modelling, and (3}.planning municipal, .industrial, and recreational uses ofsurface waters.. Once thermal standards have been established, information regarding tem-
r
p perature distribution must be acquired on a routine basis to determine compliance with estab-lished standards.
^`,^
Thermal. monitoring . of power plant. discharges is frequently an extremely difficult task to'accomplish using conventional methods. Normally the discharge plumes are large in terms of
areal extent and are. dynamic in nature, .Also, environmental conditions such as air #empera-i
ture, high winds, and waves frequently _make surface monitoring impractical.. As a consequence, , ^; 7^^ increased. reliance is being placed on the use of airborne thermal-infrared techniques for ther-
mal monitoring.
Several remote sensing studies of power plant .discharges have . been conducted for both,..?"
'; regulatory agencies and the electric power industry, dating back to 1967.. Two case studies areE
E ^
cited ' in the following discussion.^
fAn extensive multispectral remote sensing program was conducted during the period
August. 1972 to June 1973 under the sponsorship of the Michigan Department of Natural Resources, $^ ^ Water Resources Commission. A total of 275 miles of multispectral data was collected at ^,i'x^
lected locations in the southern peninsula of Michigan during three seasons of the year. The s
surface temperature distribution. resulting from the .discharge of heated condenser cooling water
^,,
59
I ,
.,}_ ^
^>
.,
,^: ;
:^,4
a^ c
,:

O^
'b^^^^^
^^
rn0
1 r^
I _^3
Vii:'
..•^'^:
v
^^
s
:ice
Ii;:
::..
^^! i
^, \.
4 (b
) Dig
ital
FIG
UR
E 23. R
AT
IO IM
AG
ER
Y, C
LA
DO
PfiO
RA
DIS
TR
IBU
TIO
N, H
AM
LIN
BE
AC
H S
TA
TE
PA
RK
, NE
W Y
OR
K. 20 June 1972.
cr

i
THE u n^v ERS1TY OF MICHIGAN^ - '. FORMERLY WILLOW RUN
' 4 i
Ts
^,.t?f
NC-Q1r-1GlC
OGV
3wz
awHHrnxUQW0.l
^+ - -- Z
}',^` :iii: - --- - - ^ ^
itn .......................................•--- c^
^ ^+ a ca::::::::i ::::::::::::::::^ :::;i:;:::..:; :=::` A Z
^ o' ^x 'l ^ , ^ ^ _ _ ^ E+u va v A
GO
- ^E+
t ^,^: iiiiEi°ii^iiiiii9'r"s•"ii6iiiiiEiE6g^ i .-': A
9.: --
.._..
.EieEE ----^, -
__ -_ EEi^E -- - x_ __ R,
y _ _-O
___ - A--_ _ __ _
- -- Ug
................1,:. f k NNn
_
W
+^...d - _— ^.y
.. . ^^J2.'_
OO
.._._......... WI ^^ ............... ^
d . ^ --•-•..........S
^ .^y `,..............................
'^ ............................ W i............................. a: .....................:.:...s^ ^_ ................................:................--....s^aiaui nnb '
^ ^RIG^^ PAG
s° '.
^F PppR
E I8QU ► ,

ZERIM - FORMERLY W ILLOW RUN 1ABORATORIES, THE UNIVERSITY OF MICHIGAN
into the public waters of the State was calculated and displayed using digital processing tech-piques. The basic presentation format consisted of black and white digital maps, which. dis-played scene temperatures at 1°F levels, together with tables indicating .the area for each tem-perature interval of interest. In addition, to these basic digital maps, data delivered includedcolor-infrared photographs of each power plant, black and white thermal imagery. of each scgne,and on a selected basis, color digital thermal maps.
• The data were used by the Michigan Water Resources C^:}emission in determining the Na-tional Pollutant Discharge Elimination System (NPDES) permit limitations for power-plants atthe locations included in the study [ 35] .
Similar studies have been conducted for the electric power industry. Quantitative data havebeen displayed in color-coded digital format, analog-processed thermal slices,. and color'-coded.analog-processed color composites. Analyses of the thermal distribution resulting from cool-ing water discharges, natural thermal development in surface waters, and mixing patterns
under a variety of environmental conditions have been examined.
Figure 24 presents a series of thermal-infrared images (9.3-11.7 µm), which show the Cher-mal loading. from a power plant and river discharge into the nearshore zone of Lake Michigan ^^
and,the formation of the thermal bar. The thermal bar is characterized by the. sharp thermaldiscontinuity in the 30 April scene.. The light tones in the imagery represent warmer water.The illustration is taken from a report prepared. for Consumers Power Co. Indiana and Michi-gan Electric Co., and. Northern Indiana Public Service Co.[36]. '
An important feature in Figure 24 is the coastal entrapment of the power plant effluent andriver discharge, and the transport of the discharge along the shore. The large.-scale current
' aracterized b a coastal. et structure •" pattern along the eastern shore of Lake Michigan is ch' y j 'therefore, discharges at or near the shore will normally -move along or parallel to the-shore,
`^ except at stagnation points. The currents are "bistable" and the direction may be either north ior south. From awater-quality management standpoint, the above features: have numerous ;!implications. Decisions regarding plant siting, location of sewer . outfalls, location of water in-
' takes, recreational development, ete., must take into consideration naturally occurring physicalprocesses as illustrated by the above example. . a
,, i
`3
.2.4.7 COASTAL OCEANOGRAPHY ,, iThe coastal waters adjacent to the New York Metropolitan'Region are subjected to extreme t
cultural pressures. The area is the repository for substantial-quantities of sewage sludge, in- 5i
^,,. dustrial acid-iron waste, and other waste substances [3?] .
;.'^ Multispectral remote sensing data. were collected at two points in the: tidal cycle in: the New ' =^j^ t
Fj l ^ York Bight on 7 April 1973, under the sponsorship of the National Oceanic and Atmospheric^, lk`
siI
,.^
' ai..
,^
- .. - ^:
,. ;'.
^m.. ._.. .._ _ ^ .. .. .... .. .. ..._.M_^—. ...m,,...._s...,,._.,._,^.., .,._....,,m..,..,^...^,....^.^a,..^u,. .....^^........,.,.,.......,.,.•,.,.,._ -
',

10 mph
WNW> 5 mph
Power Plant
Gr:^n^i liacnn Rivrr nutCil!r winos
NNW10-20 mph
22 April 1971, 1855 hrs
23 April 1971. 1810 hrs
Tl.., .....•^1 Tl,. .. F'ii.rn
30 April 1971. 1106 hrs
7 May 1971, 1153 hrs
NNE5-8 mph
`RIMFORME RLT WILLOW RUN LABORATORIES. THE UNIVERf ITT Oi MICHIGAN
FIGURE 24. FORMATION AND MOVEMENT OF THERMAL BAR SHOWIIVG COASTALENTRAPMENT OF DISCHARGES. Area: 14.5 X 2.7 mi (23.3 x 4.4 km).
62


DRMERLY WILLOW RUN LABORATORIE,S,.THE UNIVERSITY OF MICHIGAN
-^.
Administration. Data were processed to show the movement of water masses as evidenced by
' sea surface temperature, dye tracer, and turbidity patterns. Additionally, digital processing p^;'
was. performed to display surface chlorophyll concentrations and transparency. Ocean dumping ,,,
of waste in the Bight was also documented. The program was conducted in support of one phase ,I ' of the NOAA Marine Ecosystems Analysis (MESA) program in the Bight.
Waste fields created by barge dumping of acid -iron waste were clearly in evidence in .the
study area. Acid - iron in the process of being discharged, recently dumped waste, as well as
relatively old waste suspensions were detected. Figure 25 shows a typical acid-iron dumpingoperation in progress. The waste solution changes in appearance from agreen -yellow color toorange as the material. undergoes oxidation from the ferrous to the ferric state. Due to the low ".solubility of iron at the pH of seawater•, precipitates are formed. The ferric compounds pro-
`
duced tend to remain in suspension for .considerable periods of time. The oxidized waste field
is yellow or orange in color.
', The ability to measure small temperature differences can frequently be utilized. in theanalysis of a number of oceanographic problems including analysis of circulation dynamics.. ?,Shown in Figure 26 is a thermal map (9.3-11. . 7 µm) of the study area during an outgoing tide.
I - Th,e highly complex surface circulation in the lower bay and adjacent areas is _clearly depicted.The sharp thermal discontinuities provide information about flow direction, mixing, and watermass convergence. Surface temperature distribution was delineated through digital processing
of the scanner data collected in the 9.3-11 . 7 µm spectral band.
^^ The problem of ocean color analysis is extremely complex due to the fact that the aquaticenvironment is a complicated heterogeneous system in terms of its chemistry and biology, As
a consequence no simple, straightforward, universal solutions to the problem of chlorophyll.
!! ' and transparency analysis are. possible. All. attempts to measure these parameters through;re-mote sensing have involved empirical or semi-empirical methods.
,The techniques adopted in this. program are based on the anticipated changes in volume
I reflectance due to the presence of chlorophyll and non-chlorophyll-bearing particulates [32].I
IISpectral bands in the. blue, green, and red regions of the spectrum were utilized. The results
r^ of data. processing for surface chlorophyll -a are. shown in Figure 27. The ground - truth data,,,^ (and times of collection) are indicated next to the black squares in the figure. The results show
;; i a range in surface chlorophyll "a" from 1.1 to 35 mg/m2.f ^^
^^ ^ ,The use of remote sensing,. from both aircraft and satellite, is demonstrated in studies ofEj
the highly complex and dynamic estuarine and coastal environment represented . by the New York., ^ `
i BighE and adjacent bay areas. Interpretation s of analysis. of data. collected by conventional point-
samping techniques is likely to be extremely . difficult without reference to remote sensing data.
12
^
b
^^63
,^
.`,

15:18:40 EST
!^^^^^ Jersev15:33:28 EST
tic, Jersey
^ ERIM ----__ iORMERIY WILLOW RUN LABORATORIES. THE ONIV ERSAT Oi MIG NIG^N
FIGURE 25. BARGE DUMPING OF WASTE, NEW YORK BIGHT. 7 April 1973, afternoon data,10,000 ft (3048 m) AGL.
69

RI MI ORMERIY WILLOW RUN LABOPA IOPIES iME UNIVERSITY OE MICHIGAN
^I)Ot^ '^
^, ^
.,_ :;,,^
^ ^^^
. 1 .^ ... it ^ ,
•IJNh
^^
^ L
`4 ^ ^
^:
,^
i
FIGURE 26. DIGITAL TEMPERATURE MAP, NEW YORK T3IGHT. 7 April 1973, afternoon data.
65
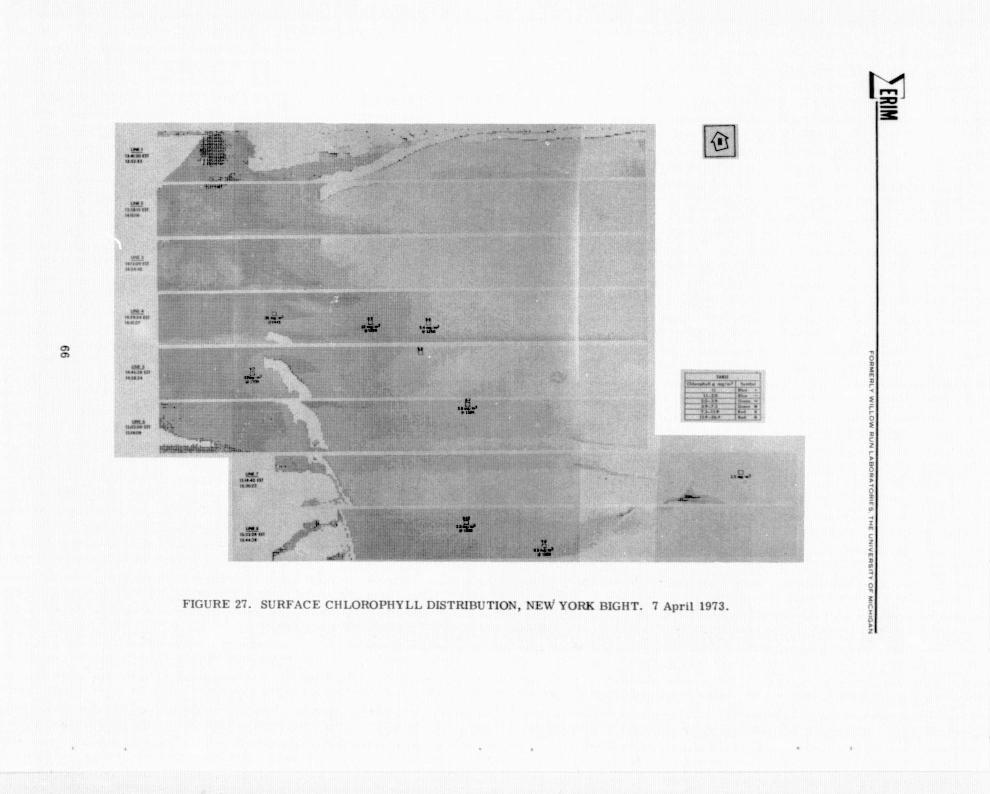
f^^^3
^' s:$:w ^
u u^+ u,^f3`^
; Ntt-'
^^uo^xNib
_^^
^::
1^ I1N^NMr ^•r
^^_:
?]
y wi~n ^w ^ ^? N_
Q1 p
^ ymN f .,
►t
^ ^..^wr m
^ ^^ sin. ...
^^.
^^U^r^ '1^^AM
^.. z4
w ^ ^ .. ..... ... .. . »^J^^
^y^
i
__.-
•.r .
T
'.^1, r
.51
^
FIGURE 27. SURFACE C1ILOROPHYLL DISTRIBUTION, NEW YORK BIGHT. 7 April 1973.

_,. _ .,
I
I ^I
^r ....._ _ --
i,
ERIM^ FORMERLY WILLOW RUN LA90RATORIES, THE UNIVERSITY OF MICHIOAI
The optimum solution is to exploit the capabilities of remote sensing technology and comUinethe information so derived with data acquired by conventional point-sampling methods. The
results of the remote sensing program in the New York Bight are presented in ERIM Report
No. 109300-5-F [38).
2.4.8 WETLANDS MAPPINGWetlands are defined generally as those lowlands covered with shallow and sometimes
temporary or intermittent water [39). Included in this broad grouping are-all. those areascommonly known as swamps, bogs, marshes, potholes, and wet meadows. Most wetlands canbe drained or filled, creating land. more. suitable for human activities. This has resulted in thepast in public opinion which regarded most natural wetlands as wastelands, fit only for
"improvement," so that they might be put into use . supporting agricultural, industrial, or resi-dential expansion. 3
Only recently has a public awareness of the ecological value of wetlands become. wide-spread., The ecological functions. wetlands. have been found to serve are convincing proof of -the importance of the need for their preservation. Among these important functions are the
following:
(1) habitat for fish and wildlife
(2) water quality maintenance
(3) flood and erosion control
(4) ground water recharge
(5) buffer zonesalong shorelines of large lakes.
Wetlands have social values too, providing open space for recreation, education and. research.
In many areas wetlands can also be used to grow cash crops,_ . such as marsh hay, wild rice,.and blueberries and cranberries [40]. i`
s
Before a plan can be intelligently formulated for the preservation of wetlands, however, ik
is essential to have at hand the information provided by a detailed inventory which describes ^"
'' their composition, location, distribution and .condition.. Unfortunately, traditional field proce-' '! dures for wetlands mapping are expensive, time-consuming, and often of limited accuracy..A
major cause of all. this difficulty is the poor trafficability of most wetlands; and_the constraints °^^k ^ p y' g q n addition, the vegetation communitiesthat this im oses on conventional surve m techni ues. I
of many types of wetlands are extremely dynamic and, in order to maintain. an up-to-date database . for management decision-making, they must be remapped frequently.
I
Remote-sensing techniques have spatial, spectral, and temporal advantages over ground- ' ',;, ,I based ;mapping methods that make their application to wetlands mapping a-.good one, principal>, I among these is the spatial overview.. of the. environment provided. by the aerial: perspective.
^ x
`
,^ 67:;
'... pi
^.
tl
i.

b_ w_ .x..^.d::..._^. _. _ ^,_ _._._._,....m, ^_...._^.. __ _ , _ __
RIMFORMERLY WILLOW RUN LABORATORIES,THE UNIVERSITY OF MICHIGAN
t
Spectrally, when a multispectral scanner system is used, several wavelength regions(e.g., ,ultraviolet and the infrared portion of the spectrum beyond 1 micron and thermal radiation) ,provide new ways . to characterize vegetation. units and energy exchange processes,. From atemporal standpoint, c#ata can be collected rapidly and : often, and. the permanent record thatresults can be used independently by other investigators, permitting them to make their owninterpretations of the data, perhaps for. entirely different purposes from those for which theywere originally collected.
The following project synopsis illustrates the potential of an airborne multispectral scan-ner system for aiding in wetlands management by showing how the critical mapping task can bedone far more quickly using computer data-processing techniques, The mapping of -the area under
consideration was performed for several :reasons: (1) to document existing cor,^itions; (2) to .correlate vegetation cover conditions with water level manipulation practices; and (3) to assessthe area's current and potential capability for useby waterfowl
Pointe Mouillee State Game Area. is located at the mouth of the Huron River, on'the Lake...Erie shoreline just south of Detroit (Figure 28). Centrally situated along the Mississippi' '^
Flyway, the marsh is both an important feeding and resting area for waterfowl during migrationand one of the few remaining public waterfowl hunting areas,n-Southeastern Michigan..
Unfortunately, the viability of this game area is being seriously threatened by both inaturalinfluences and man's activities. Lately the area's usefulness has been particularly impaired
w.through gradual deterioration of the estuary's marshland, and more recently, because of addi-
s
tional erosion caused by severe flooding due to spring and fall storms coupled with high waterlevels-in Lake Erie (Figure 29). '
Since most birds use the marsh only as a migration stopping place, management of the area
.focuses on maintaining a large crop of quality waterfowl foods. Most of the active managementis concentrated on a core refuge area of 369 acres. The management strategy employed atPointe Mouillee is typical of many midwestern marshes. Located along two major waterfowl:
migration routes, the marsh serves as a major resting a.nd feeding stopover point. For thisreason, .management emphasis is placed on supplying large amounts of waterfowl food, withenough cover not only to attract and hold a maximum number of ducks during the fall huntingseason, but also to provide for the needs of the birds during the spring migration.
The problem is really two-fold. First, to largely exclude cattails, which. are the dominant.i cover type in the. rest of the marsh, from the refuge area, and second, to favor the establish-
ment' of emergent plant species more valuable as food, such as smartweed, pigweed and burweed[41, 42 ] ..This is accomplished basically through manipulation of the water level. within thediked refuge ares;. Pumps are used to drain the area in late. spring so that the food species can
j,.
• s
^ 68
5

[V
l[GFRO
CC.000C^ wN0 tuff X! U AOAOhlb.dM
^ Wwll •OAO
~SC, •_ 4000 bAT fgAC
roo!! aAT war.s M^OOf
r(T rAASn
PI F^AC ^N4 SA[S
'^ EOAT IAUNCn^MO S^1(
Ol ^f[ f(f UOf^
ril!3 M• M•M
GAY! •tl A d(NQ
fTAT!To nurT^NC Ns (....^Nw.NI
R['11 ^f ViNU 2['NI OMITNo N•M.^ Fw1rTr^N^G[0 MUM + W4 UN''OMI M•mn.^.N
^ F(IIr^NFNT kiNrd.P.w ^..+^.• ties.^w,^ w
^ fwo^NC s.^NnoF. y'ew e^oNrnM^wT
l^
..w C^Cr
`(w'
^\
^ f
^ ^^
i
_^ ^:^
^ERIM _------------- FORMERLY WILLOW RUN LAOORATORIES. THE UHIV ERf ATV OF MIC MICsAN
ER/E
POINTE MOUILLEE STATE GAME AREArONCO[ AND r^1M( COU NTi[t .Y^C niUfN
MANAGED HUNTING UNIT
SICK
0 iN iR fN 'IM
FIGURE 28. POINTE MOUILLEE STATE GAME AREA
69
Sri

(a) 1935
8^^^b9C^7
JO
(b) 1971
^^';+ ^ ^
^.
.^
^'iC;UI2E 29. I'0[NTF. bi0('ILLEE, MICHIGAN, LOSS OF WILDLIFE HABITAT 13Y 36 YEARS OF EROSION.
J

F
6
, _... ^,Ii,
I^
1--. I I l I l ^.:
FORMERLY WILLOW RUN L, TORIES, THE UNIVERSITY OF MICHIGANBRIM
grow and mature; the area is flooded in the fall. The use of benchmark vegetation inventorydata in this context then would be to measure the effects of the drawdown date in the spring,flooding depth in Ehe fall, artificial planting of certain food species, etc.
To determine if a multispectral system could aid it t.^r ;<iding the timely information. re-quired for this objective, data was acquired over the site by ERIM on 29 August 1972. Multi-spectral signature recognition was. the processing method employed to extract the resource-related information, and the results are shown in Figure 30 [43]
In addition to open surface water, which was included to provide a locational reference, fiveimportant classes of vegetation were .successfully mapped. If these classes are then grouped.into two general categories—valuable food plants and less suitable vegetation—it rapidly be-comes clear that almost half of the area was covered by the less desirable vegetation, whileonly one-quarter of the area supported smartweed, the single most valuable food:
AREA FROM LARGE-AREA FROM...:.. SCALE PHOTOGRAPHY
COMPUTER MAP AND FIELD CHECKING
50.3 43.2
91.9 90.9 ',
124.1 109.2
115.2 126.6
381.5 368.9
• COVER TYPEOpen water.smartweedOther desirable emergentvegetation species
Zess suitable vegetationTOTAL
Analysis of the above data. and map showed that there were two types of non-productiveareas: areas of dead vegetation and areas of non-productive vegetation such as upland grasses..or brush. Field investigations of the dead . vegetation revealed it to be last year's smartweed. i
` On the basis of this. evidence DN17. biologists hypothesized that the water level in the dike hadi
i !
not been lowered sufficiently during the spring of the current year to permit the smartweed togerminate. The identification of the areas of less suitable non-marsh vegetation provided amethod of locating'the areas within the dike where it is necessary to increase winter flooding.
t ^, Before the initiation of this project, all. the management decisions mentioned above were ,`^ j; made on the basis of the refuge manager's intuition. -While these decisions. are typically sound,^ having their basis in many years' experience, the lack of quantitative data to support them does^ ^ little to establish effective guidelines. In the words of the resident manager of Pointe Mouillee, ^;
^ :^"I've been here 15 years and if I should. get . transferred or; take another job, there'd be prac-
€ tcally nothing on record o guide the next guy.."* fihe results of this project show that this nolonger need be the case. '.
^^^}
*Personal communication, Mr. Jim Foote, Wildfowl Specialist, Pointe Mouillee State GameArea, 25 August 1972..
_71 - ,
L.,
^. ;
,.,,

ERIM .FORMERLY WILLOW RUN LABORATORIES. THE UNIVERSITY OF M,S IIGAN
'qy.p' s;
P-. • ^ -. ._mo.'s ^^
. ^I ^' I -
^f.s-I
'.I^ 1
1 1 ^ ^}. F"^ I ^,
_^ G •. ^4
_ - ^ f1
.. ^ r=;^^^^.
4 L
i.
^
... :Liftl::^kji:c::.
... r.^ .^ .. r...
?i.
x.. L, ^.^
1 .
_... ^.. _.^^:. I _....,...... ............... ... _ .
_..... y
.6
?^i a..i
. • ;^ 3...
^:a.
{ ' ,^^
=7'' ^'^ ^ =.^'.
;^:
- —^ ^'x
,_4a
.^ _.......!RF^y
gg,. ? 1
I
I/ a ':: ^ P
.. _ ^' ^ '' ..s •.
LEGEND^ Green -Smartweed *Green -Mixed GrassesO Red -Pigweed )B Red -Vegetated* Blue -Mixed Smartweed and Pigweed •Red -Dead Vegetation
^ Blue -Open Water
FIGURE 3Q DIGITAL MAP OF IMPORTANT FOOD AND COVER VEGETATION IN DIKEDPURTIONOF POINTE MOUILLEE STATE GAME AREA. Data collected 29 August 1972.
72
ORIGINAL PAG F, IS
OF POOR QUALITY

I`,
_.. _.•r
.• RIM
FORMERLY WILLOW RUN LABORATORIES,THE UNIVERSITY OF MICHIGAN ^^i#
`:^z
'.a
;1^.
2.5 FUTURE USES OF EXISTING AIRCRAFT SENSOR DATAWhile airborne sensor data were .initially collected to satisfy certain experimenters'
desires, the fact that these experimenters collected ground information at the time of over-
flight makes the combination of ground and. aircraft data pote ►,;ially useful for purposes other1.
rI ' than that for which it was originally collected. Further, periodic cove^ • age of some sites. oc-
F curred between 1966 and 1974, and these data may be useful in illustrating. changes which have
taken place.
There are at least three main uses for the historical airborne sensor data base: the illus-
tration and quantification of change; the use of data to better define the configuration and
.operating parameters of future sensors; and in tests of multistage tmpling where airborne
data has been collected in conjunction with spacecraft data.
Change detection and quantification is of great interest to both nat^^:ral resource managers ,and urban planners. For example, a manager may want to know how quickly. a forest fire burn
i
area is being revegetated, or how fast a beach is eroding.. An urban planner may want to knowf
i
J
j how much new residential area is being added to a city. Even the lack of change may be im-
portant. If a power plant is installed and no changes m the shoreline are een after a number
` of years of operation, one might conclude that the plant had. no effect on the shoreline. TheERIM: scanner system has covered several such areas periodically from 1966' to 1974.. Theareas are listed in later sections. In each of these areas, change detection is possible. One
example,. a section of the. Lake Michigan shoreline south of Grand Haven, Michigan, can be5 seen in Figure 31. The breakwater shown is the cooling water intake for a nuclear power plant.
The heated water is discharged through a canal south of the intake. Figure 31 shows. imagery ^`
taken over a five year period, from 1969-1974. Other imagery collected at yearly intervalsA
over the period was also examined. No major changes in the shoreline or area. surrounding theplant are discernible on the fifteen-meter resolution imagery.. This places an upper limit onthe amount of change which has occurred during the five years-the plant has been: in operation..
• In fairness, it should be noted that. the plant was operating at reduced capacity for part of thisperiod. Other illustrations of change detection and quantification were discussed in the Forestry,Waterfowl Habitat, and Power Plant Discharges case studies previously presented.
A second valuable use of the existing airborne-sensor data base is in tudies to .define heconfiguration and operating parameters of future sensors, especially spacecraft sensors. The
^ aircraft data are particularly well suited to these studies because of their large number-.o£' :.arespectral bands,. the relatively fine spatial resolution as comp d to expected spacecraft sensors,
d :^
^ i and the relatively high. radiometric precision of aircraft muItispectral data.. In studies dis- I`r
^,^ cussed in the Agriculture Case Study, the effect of number of spectral bands, spatial resolution,
and radiometric precision. on the: ability ;to map Corn. Belt. Crops and to measure their acreage 4
was examined. Further tests of this sort are desirable to verify- the conclusions: reached from{^
z - -
73,.
,

M
(b) 24 April 1974. 1030 hrs. 8000 ft (2438 m) AGL
f^ rr,^a^ .
RIM _ _FOR ME RIY WIIIOW RUN LABORATORIES. THE UNIVERSITY Oi MICHIGAN
i— N
;^ ^Mr► ^
t
t ^^.
1 _ ..
Plant Intake Plant Outletlal 11 September 1969. nn30 hr5. 5000 ft (15?4 ni l Af;i.
FIGURE 31. IMAGERY OF POWER PLANT SITE NEAR GRAND HAVEN, MICHIGAN.
0.62-0.68 ^^m.
74

theri,^al channel in pattern recognition of agricultural crops as a function of the time of overflight,and to assess the effect of having a thermal band resolution somewhat larger than the resolu-tion of the other bands. Aircraft data sets exist to verify conclusions reached and. to studythese additional factors. Although the illustrations discussed have been from agriculture, data
sets also exist for other disciplines.
' A third potentially useful application of airborne sensor data is in multistage samplingstudies. The data most useful for these studies are those collected in conjunction with high.-altitude aircraft and satellite overpasses. In multistage sampling, progressively more precise .estimates of the resources of a large area are obtained. through the analysis of data of higherand higher spatial resolution. The higher resolution data . do not cover the entire area to be
surveyed; they are samples of the area. In typical implementations, the fraction of the total j jarea sampled by data of a given. resolution decreases as the resolution increases. In typicalmultistage experiments implemented to date, photographic data have been collected and inter-preted to provide information about forest. resources and agriculture. But multistage experi-ments can also be conducted with machine-proccessed satellite and aircraft daka to obtain more
;, accurate estimates of resources. .Several data sets exist which can be used for multistageexperiments.. They are those which. were flown. as satellite under lights, and are listed in
Table 1.
£,
,r
E
,.t
,: ,
}
a
{,,`: ;
i +";
x
^5a ^ ,
P';
^ -: ^ ry
.-
^.

NASAMission
No.
87 m85 m$5 m85 m85 m
85 m85 m85 m85 m
82 m
81 m82 m81 m
78 m/80 m74 m/77 m
73 m/76 m75 m75 m71 m68 m68 m65 m67 mS6 m66 m65 m65 m64 m63 m63 m
-^--^-^^-..-.,..,,.A,.,_^._ ^^, ._ .-_.... ^ ..._.,E__ _ _ .
i
2ABLE 1. AIRCRAFT MISSIONS WITH NEAR-SIMULTANEOUS SATELLITE. COVERAGE
.NASAFlight Flight
_ _ _ ProjectDate Time --------Site- - Discipline No.
30 Jan. 1974 1 '100 Wabash Basin, Ind. Multi EREP (397)18 Sep 1973 1000 L; Michigan Multi EREP (450)11 Sep 1973 0545 L. Ontario Hydrology EREP (427)10 Sep : 1973 1200 L. Ontario Hydrology EREP (427)?Sep 1973 . 1600 L. Michigan Multi EREP (450),,7 Sep 1973' 1345 NW . Michigan Forestry, Agric ERTS (321)6 Seg 1973 1000 So. Michigan Agric ERTS (136)
12 Aug 1973 0830 Woodworth, N.D: Game Management EREP {486)5 Aug 1973 0900 So. Michigan Agric EREP (410,
456, 472)25 Jun 1973 1015 Eaton Co. Agric ERTS (321)
10 Jun 1973 0830. Wabash Basin, Ind. Multi - EREP (397)8 Jun e 1973 0930 Eaton Co., Mich. Agric ERTS (321)
^ 12 May 1973 0730 Woodworth, N.D. Game Management EREP (486)4 May 1973 0930 Wabash . Basin, Ind. Multi ERTS (049)6 Apr 1973 1300 NY Bight, N.Y.. Hydro ' ERTS (081)
5 Apr 1973 0930 So. Michigan Radar, Soil Moisture ERTS {072)25 Mar 1973 1000 Lake Ontario Hydro ERTS (114)24 Mar 1973 0930. Lake Ontario Hydro ERTS (114)2 Jan 1973 1000 Wabash Basin, Ind.... Multi ERTS (049)
17 Nov 1972 0900 Tampa Bay, Fla. Hydro ERTS (081)
16 Nov 1972 0900 SE Florida Hydro ERTS (081)^^ 19 Oct 1972. `0930 Eaton Co., Mich. Agric ERTS (321)
1?Oct' 1972 1000 Wabash Basin, Ind. Multi ERTS (049)1Oct 1972 0700 So. California Geol ERTS (648)
30 'Sep 1972 1200 So. California Geol ERTS (648)
14 Sep 1972 1300 Eaton Co:, Mich. Multi ERTS (321)14 Sep 1972 1300 Oakworm Infestation Forestry F.RTS (321)7 Sep 1972 0830 L. Ontario Hydro ERTS (114)
29 Aug 1972 1400 Oakland Co., Mich. Land Use.... _ ERTS (086a25 Aug 1972 1000 Eaton Co., Mich. Multi ERTS (136/321)
.a _.^^.. ^'` `

,^ ^_^,,
I
i-,^..--
TABLE is AIRCRAFT MISSIONS WITH NEAR-SIMULTANEOUS SATELLITE COVERAGE (Concluded)• l^'''^ J
NASA NASA 7D3
Fli htg
F ' ht^ Project MissionDate Time Site Discipline No. No.
19 Aug 1972 0900 Tampa Baq, Fla,. Hydro ERTS (081) 62 m ^'19 Aug. 1972 0900' ' SE Florida Hydro ERTS (081) 62 m ^`
^,` 18 Aug 1972 -- .0900 - SE Florida Hydro ERTS (081) 62 m16 Aug 1972 0900 NY Bight, N .Y. Hydro ERTS (081) 62 m13 Aug 1972 0930 Eaton Co., Mich. Multi ERTS (136/321) 63 m
e
10 Aug 1972 1030 ' Wabash Basin, Ind. Multi ERTS {049) 61 mf 9 Aug 1972 ' 0830 Wabash Basin, Ind. _ Multi ERTS (049) 61 m^ 28 July 1972 1700 Woodworth, N.D: Game Management. ERTS (255) 60 m
24 duly ]:972 1015 " No. Great Plains, S.D. Multi ERTS. (119) 60 m '•23 July 1972 101.5 No. Great Plains, S.D. Multi ERTS (119) 60 m
22 July 1972 1015 No. Great Plains,_S.D. Multi ERTS (119) 60 m25 May 1972. 1130 Black Hi11s, S.D. Forestry ERTS (226) 56 m
f 25 May -1972 D745 Black Hills, S.D. Forestry ERTS (226) 56 m '.^ ^ 24 May . 1972. 0830 Black Hills,,S.D. Forestry ERTS (226) 56 m ^ ',
19 May 1972 0730 Woodworth, N.D. Game Management ERTS (255) 56 m ; _ ',,,i
i_ __
F ^: I
F ^ 1
^ 2r
J
f
i
^
0oA
^^
mN^ 'G Z
m
cz
^
I
EfmA^
{ .K0 (^f
^, ^^,z_ ^^..^f ^
ZI '^
k
^;
'..
^_ ..
;. ^ ^
^,!
,^avdlbiWB11 Ili.,ls.n.._ b^ e,,. .... s... _..uw.....a. ....,_._. ^._,. .. ..; ._•c..^.....,ava..u.da...»..<...._ ._v._, ....r:
_9
y

^.... }.
MY WILLOW RUN LABORATORIES, THE UNIVERSITY OF
3
- CATALOG OF ;IMAGERY FROM ERIM AIRBORNE SYSTEMS
The imagery of the earth's surface mapped by ERIM airborne sensors for earth resourcesinvestigations over the past nine years has been listed in several ways to aid investigators whomay wish to make_ . further use of the data. The sources of the imagery include (1) the M7 multi-spectral scanner developed by ERIM in 1971 to provide common regi tration of radiometricallycalibrated spectral bands in the ultraviolet, visible; and infrared, (2) the M5 multispectral scan -
ner developed by ERIM in 1966 through modification of military reconnaissance scanners toprovide multiple, radiometrically calibrated. spectral bands, (3') the M1A1 scanner developed byERIM through modification of a military reconnaissance scanner . in 1967 to provide, amongother things, magnetic tape recording of thermal imagery, and (4) the X- and. L-band side-
looking, airborne radar (SCAR) system developed by ERIM in the early 1960's for military re-connassance purposes and made available for earth resources-investigations in the late 1960's.The performance of these systems is described briefly in Section 4 of this report,
The original, inflight recording of imagery from these systems is stored at ERIM in theform of analog magnetic tape for the scanners and photographic film for the SLAB system.The imagery is available to all' who receive proper. authorization and who pay the cost of re-trieval, As an aid in data retrieval, the cataloged information on MSS data is stored in com-puter memory at ERIM. Thus the computer can be used to search for particular data coverageof a specific site. Information on the ERIM processed MSS data is also stored in the computer 1
memory. The procedure for obtaining either original or processed - data is described in Sec-tion 5.4 of this report.
The continuing usefulness of thin imagery is thought to be primarily in showing scene. 'changes as a function of time and in comparing the .appearance of a common scene at optical .andradar wavelengths. Therefore, sites with multplF calendar or multi.-sensor coverage arelisted eparately with the site as the index key. The index key for storage of imagery :from the. -
`^ various airborne sensors is flight date and time. The listing of imagery from each sensor uses
this. ERIM storage index. The imagery is listed both by missions and. by separate flights within.a mission. Since _the airborne imagery data sets . do not include ground observations or mea-surements at the site, the principal investigator's name, organization, and his publications us-
;, ,ing the data are noted for reference.
3.1 LISTING OF SITES WITH MULTIPLE COVERAGEMultiple coverage of a site, for this report, occurs whenever that site is repeatedly mapped
by the same type of sensor with. a time period of a week or more between missions, or when asite . is mapped by two different types of sensors. Repeated mapping of a site, either sequentially.
,.. 78

FORMERLY WILLOW RU
or at different times of day over aseveral-day period making np a mission, is not considered
multiple coverage.
3.1.1 MULTIPLE MISSION COVERAGE AT OPTICAL WAVELENGTHSA mission is defined as one or more flights over a site during one field deployment, or as
a series of flights to accomplish total mapping of a site. Usually a mission is accomplishedover a period of less than. one week in calendar time. Within the listing in .Table 2 of sites. with ,^
multiple calendar coverage at optical wavelengths, each flight is listed byflight date and time in-dex, In addition, more specific information is noted on the site location, actual dime. of data collet-
tion, the scientific discipline concerned with the imagery and the number of imagery spectral9
'bands in each wavelength region. Common specific area. coverage for all missions with multi-ple calendar coverage has not been established but the flights have been grouped alphabeticallyby state and county within the state. Information for those missions which covered rriore thanone county are listed under the first county in alphabetical sequence and then referenced. under
the other counties.
I 3.1.2 MULTIPLE FLIGHT COVERAGE BY MS5 AND SLARAirborne optical and radar imaging sensor developments and data analysis have tradi-
tionally been separate, uncoordinated programs. Thus, very little imagery exists of common
sites at both optical and radar wavelengths. In Table 3 we have. listed sites whit}, have been
mapped by ERIM's airborne optical and radar imaging systems. Whether or not exactly the
,,,
same areas at the sites were mapped by both systems has not been established for all cases,but we know that common areas were mapped for most sites listed. Again the flights are
grouped alphabetically by state and county within the. state.
i
i ^.
^ ^.. ..
;:4
^,;
,, ,^
..^,^t^;^1
79
_ .
s
,' !'
°;
i

LA60 RATORIES, 1NE UNIVERSITY Of MIC NIGAN
'TICAL WAVELENGTHSSheet 1 0! )2 Sheets
lcquired:Hr:Min
Sto
Ma )orDiscipline
No. of InstrumentImagery Bands
UV Vlti NIR MI FIR
646. _. fuLtf-__- -2- -1Q42__ __._ ^_ _l._
- ----- -134..... c4 t. L..3111..__ iureatr. -
-_ 314b.._. cL._ _2..1Q9..._ tL.__._ ._L S
_ 012?_.. i_. 2
-- 1501_. 9svletlt._Qltrty n
445._ .^Ettivtr- _ ^ ^ 4_ _1Z54_. 9aoltti7^ 4 ^_
_ _7.443 .___ 3x41_... tU+1ti 1
_ 214.x... _ 7 -_ .943.g_.. X111--'_....1445_.. AI11CL_.— -4. ._tt_.. .2734.. .thllti—
_1b4Z _. 9ceanoL.._.Oct:anot..
_. A ... _ 1.1314._
.._1534_ Osc 1 1._ 1705_ 9neanos.-_.. _._9 _.4__ _L
y FFt1M, see Appendix .•\.
Sheet 2 of 72 Sheets
Site Name Site LocationFlight Index
Date Time
Data Acquired:GMT Hr:Min
Sto
Ma orIDiscipline
No. o[ InstrumentImagery Bands
UV VIS NIR MI FIR4LRLX.____... __ _—..__._, _ ._... _
_____
0900__.
bSSO030 ,0800 .
._—..-
_. —.__—
_..._SE.C.o.aat.._QL_[laL.i4l..--------N 11 1 shoro .u6h..f4ynLY_.__----
_. IAapa_Ibx___._._____-________._—...----_....___-._
_.__^__ __ _._.___. .--..--^---.__.__.__
-______._---__._._. .Gllxl+-_2,3.7.._._ —
_(sal _X;owrd_ Cou4h)._.__._____.__---._.._-_......----...__.__..__ _MMN-773—,.---- --MIA,lh233_-..._..-._._...___^.._..__.x'273._____—_-___^_.^11NM t.73_^__.^-_---_.
.-.-^_..CAHN- 2s7-
._._ ..-..
17Mo.^219Auj^f^1So^T0 ,
1.QStp7019570
-- --....
fIIB^_ ..ZT33
O^SS ,07141222
_
'1335_ ...3710._.
___ 0921 ,1413._
1021__.. IlXdrolo^
----._ °^
_ Iroi----reTo87i
A^drolog_ .A drolo
-Z_0,0
1
--
.7
_00 ^9
^0
6
^a
00
18570 0130_ 125 135 t^rolo62 1 9 6 I-_-_-^---------.-..._.....-._.-._.
,_,._,•^_-.__GRAN 7^^.....___.-....-..-_..------
-2^__._06567OSSe 67
000..1200
._. 1153 _ .1659
.__1219 Ih^drolo _ 01606 8 drolo 1 9 6 1- _ _ _,-_-`
_banateE_.Gnuotit--_-___„,,,.,._.-,_.__
_-- _ — - __I+aDL-B1Y-
__ ..-.-- -._..—..- _tE.. N.11 .1.EQOF4S^21t. ^3S14.tYL__. -_- ___-. _-_ _._...--_:.._
PAlm BEACh_.Gcttugi-__
._..---...._—.SE.COaIL_.uLlterida —
__...._-_-_-----__.^lLBL01AL^ Ceunr^ -
^t ne t laa..^pupLy_,_
Bqt_---._.Tampa -_..—._._.—_._.._...------.___..._ ._._--_.__....._.T...-(Sti..H1116h4L471ih. _C491If71. ----- —.--... ..—. _
Do 14--
_ — '-- --- -- - ---.Bard......-- __^--_.-- -..^-..GtlAN..IA__.___--_.____ ;: 44 _34.2.1_ ^loiv 9 _ 0 ^
--.__. _^.----__.--_- ._GllHA. .ltl..._._..._^-_ __._ 24Sxp10. II]30 _..^.Zs4 _..041L _Gsalosx__ _fl..-.._.__._ N. !Si_._ _^ &t¢Z9. SAQO. li_ Gsvl
_ -- _.. ___ 9NAN..IA.__-_---• 19Ssu14 639.. .-._1241. __ c.o ___ —._ G111Qi Jll Sspb1 0440.
.12D0.__1153. __.1219_- Geraloslt__.. _ 9 _1.
— _-^^ _. ._GHAd, .R--____-^- SSsp61_ .__.1654_....._1806_. laolu67t-
^__ ,_.__--- ------- -_. .—..___^31^14_..-_-_.._____._.__._.
---- ^ u...-._._.___._.-_ .__...__ .-_.._ - -
^syxt is .^ollots-...------._____..._..-_...._-_.._-___....._._...._....__..—__------^.- --- ----- ----- -... —_-.
- VAndalii__--_ -____-._ -- -- 2Lua13 ^.-- S.IAC.A^L^---..-..._..._...-_---- 1Y12—..___._. —.._-__
_PsLd _Sswn[x ..____ .-.-._ _.... _..._.Pax[o
.-- .--..._ _..- ---.GJDL
-.__.. _
NOTE: (1) Fur q st of published documents which use atrttocne sensor data rollected be EKI^t, see Appenmx A.12) For geographic reference system, see Appendix B.(3) Fnr list of organizational addresses, see Appendix C.
a^
ORIGINAL PAGE LS
0^` POOR QUALITY

__ i!! _
I ..
RIM^ UNME RLV WILLOW RUN LABORATORIES. THE UNIV F.RSITr Oi MIC NICaAN
TABLE 2. SITES WITR MULTIPLE CALENDAR COVERAGE AT OPTICAL WAVELENGTHS(Continued)
Sheet ] of 32 Sheets
Site Name Site LocationFlight Index Data Acquired:
GMT Hr:Min Ma or1Discipline
No. of InstrumentImagery Bends
Date Time Start Sto UV V1S NIR Ml FIRPAxtort_..----._^_.... ___.-._._
_j.ee CountY__..__^.__._._.__.______.._^!DoY_..__........___.----^...___
^IBL__... _..__._.. _ _.-_.__ _._......
^Q!^^_...___._.-_. _
O1Ju1 .,0 .
20+177 .. 1100_
09 0_......134....
1!0!
-._1710_
20^
Agrlc, _
r1e.
9_
_0
_9..
7
.4._
♦_^... _1....
CJAM-0♦4 SJul)7 09110 153 2022 rie. 0 7 ♦ O 1LSvi toa . Camt
_^.._ _ _...^ _
^Pontiae_ ._ . ,^- CJ{L-O ♦ , ___-,_,_ 20Auj73 1200 _1909_ _202 lt0,ric. _ O 7 ♦ 0 1
-._ __...._.__.._.-..^._._-_-- _^-4♦4 _-._-_-- -- OSJu173 , 0900.. _,}547 _ . 2022 . re. 0. 7 ♦ 0 1l^kltl9....f.?uPSL__._-.._.^.---_ ....-_.._.-__ ._-._._ ._ ._.._...._ _._.----,.__Arrwa^7f^.__, CJU. _._.,,__, „_ 13Aus70 1430_ _1e31 20♦♦ Mult1 0 9 6 1 1
_.__..___.__._....._.__._...__^.__.-..._..__._{loaBtet^__,-_____
^^CJAL
0{Ju170 0930 _ 11♦i __
1710 , /^jr1c. 0 9 6 1 13Auj70 1430 1131 2011 th^ltt 0 9 6 1 1
_-___-___^ __-. Ctt/^ .-,- , _ 03Ju370 0930 3♦4 1710 r! 0 9 6 1 1
INDLUiA___.-. ...--_...__ .^_-__^ .__._-_ _ _
-_^_fl^t Ltna ^_,___ G,[CL-2 77 __,_,_._ 245e.Q71 1300.. _ 1705 7S A rte. 0 ! 3 0 1______ -, -,_ _GJCL-j^-,_, -,_ 1451D^1 100_ __1657 iM9 ric. 0 8 3 0 1._.__.r. L-277 _- 7 1.342. __Lti3.2 .. ^7^3 0 -- e 3 0 1
__._^_^-_ rstSh.:_i.Zi..^_.^ _.-_ 13Au^,71 1300 . _1616 171_ ric. 0 _8 3 0 1.^_..___.._.______.-__ St,1^.L-1.LZ._._.-._^.-.----- 03Au 7 }00_ _j600 ^7^. A_jric. 0 s 3 0 1
^,_.^,-._- .IV],-,jjt.-:,--, 12Ju^71_. 13_00 .._.,755___. _1902 A^rie.^ _0_ __s _3 n 1--^___ -jjj,__ ;^uc(7 ,300 _}^00 _. 191 . _ r c. 1 8 S 1 1
_._--------__..__-_—___.... Sed^k:2.TZ..__..._.....__. ____.— 7na^71 _1^ _1808 ^4. _Ajr1e. 0 9 6 1 1
_Jlontisells_._.___.._._ ^_.. t^t._Itt1lti.. CptlgtJt^ _^ --._ ^. J- .-
- _--Clay._Sr.440SY._...._.__..-_.-_____._.___ _.__._ .................__._.______._.._.__--_-.._ ^^ -...__ -._._ __ -_-_
_.._.cs ruaht_L1a. u7 —_._._.__ .(Os:Y1i1L.!<iltRltr)CQURLY.^.Y1eaB.. .--..__.-......_-..._...._
_._..11aXaYllle.^_^____..__...-__.___.__._^._._._._-._.
CL___^_..__- --.---_._._.__...
318eg7____
0^_.^
_^07 __ . _ . 1644_.^_..__
rte. 0, _9 6 1 1_....... _..___-__.___._.-_-_..__..__._ GJCL..._._.. _.. ..._..-._...... 1.LS9R70 _09Q0... ._....1007 --
OG-144 ,^^_- 0. ..6 _ 1 1
NOTE: (1) For Itat o[ putdlehed documents which use airtx)rne sensor data collected by ERIM, see Appendix A.(2) For geographic reference system, see Appendix B.(3)For list of organizational addresses, see Appendix C.
Sheet c _of ]2 Sheets
Site Name Site Location FLght Index Data Acquired:GMT Hr : Min Ma or7
Discipline
No. o[ InstrumentImagery Bands
UV VIS N[R MI FIRDate Time Start ,mod
l.^sv a --_------ ., _ .^^ -._..._ -_-_. _ __...... _ ep24AuE70 ... 1630 . - .214] 2323
r c .Aj_ric. _ .
0....9
.h_..1..
.1 ......
CJCL .-^ __ '^'-' 2♦Au^70 1100 ^^^ 1 02 1834 ire. _ 0 9 6 1 1Dubola Couatir -- _ -
_. __cs liidne L^a^ 334' - '- T§« rt a doua_ Z^--.----- _-- _______ _._. ._.-_.-
_..._ _.----- -
--
Pouat_a1a Count__..-C6 !i-i .
t_', ^--.__--_^- _- _''lIf
.. -^_L_3)7_.` .-_._.._.__.-- -sep7i' 3b0 ..-76dt_ -_l^o^_--.-.._
rte. o ^ 3^ --0 1CJCL-277------ 143ep^1 T(t00 -I90^
. ^S^ ^ tic. ^ 1
CL= 8i1ug>1_ 006..__ ^`I309 - ....16Th Asr c._
C;TZL=37T---`^2:.1CL-27.7_._._.._...._.__ rifug7T3u17I
660'1000"
TabB ib30- r c—1135 _7333__ . /iaiic. S
------- cC=27T J^373 --laTh rs^ : ^._ -..__-- -.-- .^^_^___ _f^un`Ti I600" 'T5T6- 603 ric. ^--.____-_.-^. ^^_,^,^__.______._ __
^May7 1060._.._^T_.
d33__ Asiic. _9_
^CD Flit 61a.^ _ 7See_Noat^oBar^Coun__L-_ - ___ _ _ -CB !11`hiLini 213 -- See Parke _G.unt^_____ _`^_
-__
Pulton Cow____.___-._^__,-Purdue - Culver EaperiBantalFan (See Marshal Cotmt7T--^
_
CSbaor.' CountZ__.-__CB Plijht Line 223 -^^_
__ _iiJ'C.1-2T1___^^_ '^ ,^•^ OSOctfl 1270 ^^h17 ^^ 171 - rte. 0 1LJCJ-277 lSSe 7 1^t70 ^'16I3^ 17]7- ric. 0 3-
.,_.__ CJCJ-27^ ., 2__u^_1..,1230 16^- 1 10 ^A^tte__ 0 - B 3 0 1
__,__.- GJCJ-277 -- i_
12A^71_ 1230_ 1544 1h37^ Aerie. 0 S 3 0 1C.1CJ-277 Ju171 12>D 1^ 1355 fir. 0' 3- 0 1_ _CJCJ-277
-16Ju171 1230 1610'
_1709 ric. 0 _ 8 7 0_
OJCJ-277 _ 30JUn7l _1230 1311 1602_
T1C. 0 b ] ll l__-.__. ^ ._ __ _T_____.____.. _. C1CJ-271
-_._. __... _ _ __-.. ^_^__ 27Mi^71 100Q
_1440 1373 ic. ,^ 0 6 l
Graut Count= ... ,-,.^-.___euntiej-toa ^_
._._.-_.__-_ _.*----'-See Nuntltt Foe_Co^ntj^-
....-___
^ _
^ ^ __
Grefne CountF _ __.,__,__B Fli ht LSne 220
_ _GJCJ GJDJ-277 060ct71 n900 16 ] 1834 t e.
_0 8 7 0 1
nV'r!':: t1) r'or ttat of puousned documents worth use atrnorne sensor data collected b9 ERIM, see Appettdlx A.(2) For geographic. reference system, see Appendix B.(3) For list of organizational addresses, see Appendix C.
e)ORIGIlIAI% PAGD L9
OF POOR QUr^^
^..._

^ ERIM.ORME RIt WI^^OW AUN IASORAtOn1E S. TNti UNIYE^rtiRV Of MIC N1G11N
lAHL6 2. ^ITL^ 1i'll'kI MULTIYLh CALhNDAR COVERAGE AT OPTICAL WAVELENGTHS(Continued)
Sheet S of 32 Sheets
Site Name_
Stte Locatton Flight Index Data Acgwred:GMT Hr:M1n Ma or1
Dtscipline
No. of InstrumentImagery Bands
UV VLS NIR MI F1RDaate Ttme Start Sto_llixht L 1gS. .-
----._._.._.__._.._._..---_-._.._-.._.-_.__ - _._
...._^.---- - --.._. ---^.^^a-277_.._....-. --.--._..._._t:JU^c1W-217 -.._
_._.t
ISSep712fAu171 _2fAu171
0900170-. _
1719. _lfit<
1610.. _
^-lf2a
--
r e.------Agrtc_ - 0 8
_a33
0 1-..ALte. _a 0
._.____-.--_-_ -- CJC.I1GJOJ - 277- --- 11100 ^ fi-2I ii1T^ h^,r^:__._.. a_ .-b_- __ -_...._
_--.._____.-^.rcaraai-:^i -._ -crc.► ,c.7w-i77-^ -_ _------ ---_CJ.W1¢JDJ_27-_..----_.---
2A^i jl! .miTf
l^aa_ti36-
r.r
^la3c_i7S6_
yr:tCe--
^ LLr r z -
.-.... .-.--- Ju ii16Ju171oiJ^i^i
_ ._.11!06 .0900 .of0o -
_..-3703. 11fI -
-I161- A^F cam. _-__--. -_ CJCJy6JDJ _- t77 T@Fl - AXr^e.-.^_
c.%w-27^ - -i7Tf- r e.---- ---- G!u^c^p,1-1.77_..-._____--_--__. .24Isn?1 49Q4. ..lAl!_ 1 -
6iaw G,IGE, riJ.f 1:334__ -__ 4SlIsXZ 94.4.4.. .. 1925__.. 1L1t1_.- _-__-- 1eICIt.OdGd-254_.._.._._- _..
SeLGK..2. 9.@]Q
.}QO4400
.1404_4900
34.
_..1431_.15QZ
1!142.._
^u1.tL_.Yorreisecon --- t^1.4..
eyl4ide..- 1 '
-- ._- fK.G.ISJ.. __ la<IL _. 1tr14- _Z.______- __ .9,1t:B..G,111 _._-- -,--- isy79_
O.Ssey70...244!_1
.Ault,- _ Gd0E ,9,1
- _....1L 4.- L
-- - rJO.^
Xuattnxta _^l -_.. .....__. .. __-__.-..--_.T..._.A.-4!!.- .-......._.___.
_. _.__.3At+c_37 .
__.._ _..Q144-
.._
__...._ _...1122
______-.1@14__.
...-__.
/sch,-llttatlattln___..-.___._____.._..
7 0-_.___...---.__.__._._._.-__.-._-__ .!"7.4V-.Q!!. -- 7,1sLLZ. nel 44 ♦ o- -.__ GJA,-4!!_._-- -._r ull.l
.QA+uli _1414.Q94Q_..._1141_
_.. 153Q._.1@4.@._ Aalc..__ Q_ _7 _4
-._._..__._-._-.__._-..^IISFl1t_SnsatY_.._--.._--..
G,Ji1,r1N4_.__.____.-.___.-.__.___ __--- - _
3.1._..1Sv1tL-._ ^ .L
51...cs rili^ee 1.t.. 20i _ G1.31Z._--- ----. Il _..11 sic..-..-------____- _.... 4JL4-27L_.._ _^..-._. _ _---. 1lSse71 1744.
140.13411
__.. 1457_14]2-141L.
._ 1-._-- -_-,...- --_..-____.-__..GICt.37L..__._--
4,ICJ.-27L-- _ - utll _-1732 _-- 4._ 1 .^_._---..._-_. uxZl _..Aacic.-
-..^_-._---- t:IL7.-.27Z..-- ral __11]4. 1111 _..
1lL._- 1574
RO
_ 1- ----__._-_-_..__...._... fJ.CLr2Il___.--._.---------.._._
- ^311u111
J 7
. . 1110i
krie ...___r.
_1n
.. tR
. i._3
_ 1^
..L1
NOTE: ( 1) For list o[ published documents u^hu^h use airtwrne sensor data collected by ERIM, sec ApJx • ndis :1.(2) For geographic reference system, see Appendix B.(91 For list of organizational addresses, see Appendix C.
Sheet ^- o! ^Z_ Sheets
Site Name Site Location Flight Index Data Acquired:GMT Hr : Min Ma or1
Discipline
No. of InstrumentImagery Bands
Date Time Start 8to UV VIS NIR M P[Rae - _ __
G.ICL 213 '_ ^^ _____ __^.JCL-53^-' ^ -
u13000900 --i3b0
1755 _15501lfAti
19021719 ^
_14i/
r c.A^rte. O ^ A 3 ^_ 0 112Ju171
0 Ju17iaJun)1
-rte_
brio_.
AR>rt^ _1 __ ^ !
^s-^^Ss_ 1 1
-r-__
t:7-tt. '27T-------------__.-.___ _ _ crcr:-^7------_-_____ rt^:71 lliba -146x _
- - c ne -.- _
- -i:JCL ----------- il;ep7T 303 13
1631..__ Ib
3S._1169I733-
_..r-ie
- i3`e: __.ARr1e.
3-- -3-JCL-37T-------- -C:1CL=377'-'-"-- -- -
li>;e'p71f1Au631
'I330I3b3
-- 1
--- cad:=f - u67f S3s - -17II r e.-i;JCL=i77------3,ICt-r7r.___..^_^__..-_ n^^ ^33a
--^r
-lie- -______ --- 33a-- ^r ^.-- OJCL- u 1'70- r e .
cJa:-3'77---_
3Ju1T1 T30- `fa3b--3...
Attr7cu.
-------
--'---
6JCi:=317--c.tct:=277-
Jul^i^niT
3300..-f3ii0
_..._i733!400
14029T3--
rse.^^'--_ I-
-6--R --
'------ --- -- -
Gltl.-217 - -- 1714 71 13-00 1 19W A r le. ^ 6Knox Countr_ .cs ►1tsAC Line 221 -- t:;ICa- 12 7---
OJCJ-6^-t^f
.^.33io - -1
-_
-
r►@r ^_r e.
a
GJC.1-277 ---- 26Au^{71 1230 1 2 10 A(Irte._,_---_
- _ _ - -- _..-._._._..__._
------._...-..__...-.._.
---G./C]-217G.ICJ-2^^^ _ ---G,iCJ^7 . -.--
G.1CJ-2^_ ^-- .---
12A_ug7127Ju1111 Ju17170,1un71
Tf70 -1 Il)
530 ^1!30_
..__7311
131- 1500
-- 4
--T6371553
_T109_^_..Aj1402
- _Vie.r e.la_.--
A^rtC.
3-
^s _ a__
S_
-r- _-3 -- ---
cs ►},}^c^s^ =2^ _____-...._.,--__^_-.._
_C_..1CJ-277ctC,l--?^ _- -_GJCJ'_277 _`
--_
2-bli )1o cIl1SEe^71
i^t1230
- 11
_ 1445
1333-TiiO .'1777
- rte.te.
rte__3-
_d
b-T-
i
0-__ .- __._.
.____.....__._-.CJCJ-177- .--_,CJCJ-277 __ __.-..__.._.-
2lAu 71171
1220_1230
162I....._1341
131016^f_ .
rte. __brie. -
_ _^^
_ 0i-
GJCJ--271 t7Ju171 1210 IS00 1111 rie.
--- - G!^?-17Z _.-__.-._._._. 14Ju17170Jun71
, 1230.1230
_- 120__1511
.._. 1...1602
Airi_e.._-__A t1r. 0 ^ A 1 ^ ^
_1GJCJ-277
NOTE: ( 1) For list of published documents which use airborne sensor data collected by ERIM, see Appcmdis :^.12) For geographic reference system, see Appendix B.(9) For list of organizational addresses, see Appendix C.
A2

^^. • a^a
RIM^RME RLY WILLOW PUN LAfOAA ♦ ORIEf. THE UNIVERSITY OF MICHIGAN
I'AIiLE 2. BITES N11'ti MlLllk'Lk. CALENDAR COVERAGE AT OPTICAL WAVELENGTHS(Continued)
Sheet of Sheets^- _12-._
Site Name Stte Location Flighl Index Data Acquired:GMT Hr : Min Ma or1
Difcipiine
No, of InstrumentImagery Bands
UV VIS NIR [ FIRDate Time Start StCB rl^ht Llee_11J _._--
_.._Cl._rliaht _Lin•. 2zs ....-.._..__LtnECf Couftll
G3r3 _.._._ ._. 2_"°Y___ - .. ..___ .._.-- ._._--. T. Wit._....__ __... __..._ _..,. __ _.......(Ihs_93pwlt. ^a^s2L.____.^.__._
. -.---.___._._Lio^..241.____.^...11ithc
_._ _ _-. __.__.._-- -rorcfr came . -
^ __.IIaGTDeae ___ GJLN _____^.r-- 118^p70__ 1300 150-7 1614 !o. `. _ 'T
_
._____ C.►CM....-.. _..-...__.__.-_._-._. 11Sep^0_ 0900_._^ 1^ 11 _ _AErle. 6^___-_
f^.lpt,----------_-._.— OSS_ep70 1400 '2004 2112 rie. ___ _ ^. _.---..-..--
_______^^_-__t:J0I1._„___._—_--_ OSSep70_ N00_ ISS2 .
_._1110 _ cic. 0 9 ^
gJpM ,_ -_ - 2Mut70 16^ -2143 _2]f^^ A^rte._
^ ^ 1OM__-_-.—..-.-_ I4Auj70 1100 _ -_ IaST-
--rib. ----- - --4
I.elu Cnuntr-___---_-•^_t71i._Li.. 20^ GJ{^3jj_ 2^Sa 71 1130 1554 t6'^ Ayrie. _
(^jjj -„-____--_^__,___ 16Ss^71 . _1130 . 1545_ - 1669 rie. 0_ ^-,.,-_-„ _^,(,7j-j71_, 29Auj71 1170 __1508 1620 A6rie.
.1^1-32L.. ^.u^,} )0 1501._ 1609_ . ric. ___.^- G.1.t^372._.__-___._ ....__._-___ Aup71 1_1 ,30- - 1505-- _1677 A^ric. 1 ^
- .^__ G,1Qt-2z2 17Ju171 .1130 , _ _1830 14134 A^iie. 3-G,1t^2 7 7 12Ju 7'1 1130 1639 1705 iic . ^
- _ _ .G.I.CM-277 @.lu I}^0 646 .1_ . 48 _._ -_ Airier 1 . .. .-S^ -I- T^_._.._._.^._._--.- .....G1Cl1-.3ZZ_._ ... __ 17Yay71 „ 1130 _16!..1_ _1739 Ajric. _ ^ 6
-T-
_^im.Lnunt7e_._.-,_.—_..____..-.3ndianepalif._.__._.__ __
...._.._— ____-____ ._._^.___. _. _-._-._. 04Me^73_
02Jan7309301000
1554 1933_ Mu t-3-1- T ^^ 119 -1'1d'1- MuTt
_6
___—^^. ¢JDR -•_ l0Aug7 2 . 1070 _1550 .. 3731_ Multi -_. ^. _ 3_ •
--...---.......-_---__.___.....____...__.__...Sr,lpl(_..__-Marshall . Cnmt7. _... _.._-
___-------__----
2lApr67 __
0900 1555 .-- 17__-..
Multi 1^- 3- T
_ ^urdtu..-__CtllYfi _I^BlfLllltAtl3...... .S*_1p^._..._-._ __--._._._.._______ 1SSep66 1200_0730 __0600
1 41 1921 _!c._. ^ __ .r.
-._!•^ ^-__-..__...__..^._ _..___.,_—_._.__
rn1D1.._ _.---------..----._3r__ _-.___^-_-
1SSe^66 .2-9Ju166_
_1720_ .1327
_•IS_.......1421
_!S9f15____ric.-
brie•6 - if-
y,1pl,__„-_______^ 28Ju166 1200 1721 1879 ^ .^T
06MaY6¢, 1170 ._?.^L. _ n a _ r!c_-- - --- --- -_...
NOTE: (1) For list of 1;u61ishetl documents which use airborne sensor data collected ny ERIM, see Appendix A.• (2) For geographic reference system, see Appendix B.
(3) For list of organizational addresses, see Appendix C.
Sheet a oI 72 Sheets
•
Site Name Site Location Flight Index Data Acquired:GMT Hr : Min Ma or1
Discipline
No, of InstrumentImagery Bands
UV VIS NIR MI FIRDate Time Start 3t0
so^73S6ep71.,
29Aut71aA^ii 'lf
D9oo__f900133009bfj^^
___^s lass _ Ajr ic . o t 3 _0 1___-__•---
------
cJtu-2n.__._.__ __ __._._.__._ ._.C.IDJ-277 _GJD.7-2^-' ^--CJDJ-277
__..^—_-17491716
^3Z^
1850-_ ,192518 '1---
Ajrie.Ilr!'e _^iic.
0 _0
y
t^^
li
333.
00
^_
11
.. 1 ..--...--___._.-._._---- — ^ani=3s7- _
__ __—^_^f---------__.-.._..
2^!!^-Ti-^uiiL..0400
0900 . -^dsb^7Ad
... i6^ieo7
_ ria. 1 "f-- ^^b- _ ____-^..__G.JDJ-277 16Ju171 0900 _ 1723 18- 2T_^ rie. - 1 -S SGJDJ-2^^7-^--.._.-.^ 1^Ju1^T1.. b900 _ ... 1T^^ rie.
— _ G:ID^. =' T7_—._._-_____
^lun'lI- 09b0 IEII^'___ "2T_ _i c._
---._-_._.-._-.----._._..
_ CD lit Llfi 22;-^ ^^^•
^^_2y7...._______
CJDJ-3^ -'-^y^TL06Uct71
11360900
1316-8 ^
164T13
ric. 3 b-
--,—^ -_ __
CJD.1-277 OSOct7'1 0900 _0900
1757 ^_
1855 ^rie._r1c 0
_8 ) 0 1
___
CJtU-277 - 15Se^71 1749_1724
18501847 4
rie`rie.
00 _
88
_33
00
11,- _-• GJDJ_277_ 28A^ua71 0900_
__- _--„ CJDJ;T77_...__-_ 12Au 71 0900 1650 1830 A$ric. 1 ^^^8 S 1 1_ - G.IDJ-277 ...__ 27Ju171 0900
09001700 ._ . 1807 rie. 1 8 S 1 1_
GJIIJ-27-277 16Ju171_1723 182i'- rie.
_1__ _8 S 1
t:JDJ-277 7Ju171 0900 __1550 1719 ric..0.
^S 1 1-_-`__-,
____GJDJ-27 7 _._--_ i__-____-, 30.7un71 0900 _ 1614_ 1727 Ajric.^ 1 8 S 1 1
,^___`' CJDJ-277 2271 1130 1546 1644-
tie. 0 9 6 1 1lbnroe Count_
^^--^-•^-- --
- 61o^Rlottog___ _. _ 06MaY73. 0930_
1SSf __ _1925_ , Multi 0 B ) 0 1----.__.____--_.______.....__. rawc .--- 17occ72 loo0 1^i iis6__
_tw`-iii -,
o_ e^ 3 o I----.___--------_-•-,-.1aJls^^n_.^tsz_ ___
CJD[__-- 09Au^72 0830.
1632 1802 Mu1t1 0 8 -) 0 1
Beckyille_.__ .- -...
OJDK.iGJDL,_,.-_._,__•_--_-____G.10[,.^L_--....-__._._._.-.._.-_
138^p70 „11Se^70 .
1300119011__ .
ISO) ..._1007.._.
164 _11^^...
A rlc^_icy,
00
99
66_
11
11-
-_—_..____.--__-_ G_,I,OIC^Gi}H_ OSS.p70_ 1600 _ 2 2142 /t^ricf. p- _9 6 1 1- ____--__ CJOIt^GJDL_--,_,_ , OSSe^p70 0900- 13 2 1_810 iie. 0 9 6 1 1
^.-^_- 63^R.OJ.D ^4^uj70 .1630_. ^14.z__ _233___ 3ijrlc t ,_ , 0 9_ 6 1 1.-GJDR GJDL 24Au 70 1100 1702 1834 A rSe. 0 9 b 7 1
I`iV-1"t.: li/ r'or us( o[ publtsned do<uments which use airborne sensor data collected by ERIM. see Appendix A.(2)For geographic reterence system see Appendix B.(3) For list of organizational addresses, see Appendix C.
83
^_

RIMFORME NLr WIIIOW nUh l •tsJRA^OR^Ef. tNE UNrvEnSRV Or M1C MIGAN
1 ABLE 2. ^I1'h5 Wl 'CH 11l 1.1' Ik'LE CALk. NDAR COVERAGE AT OPTICAL WAVELENGTHS(Continued)
Sheet s of 12 Sheets
Site Name Stte Location Flight Index Data Acquired:GMT Hr:M^n Ma or1
Disclpllne
No. of InstrumentImagery Bands
UV VIS NIR ll[ F1RDate Ttme Start Sto_flskz111! -_,. GJDK, L'J0 ___.__.___..___-__.-_ ._
C.JCL __....-_..._._-__----_._._.^^ ---._---____.-_cJCI._. -_--_..______._._._-._
AuR 02k Sep 711ASep7120Au/713)Aut7l
0(110001000 ..1000_
7180A
. 1902_-. 150!_ .
IA77..1606..
_ IASS _
. 19051f78_ ....161 .lNl .....
.16501555
A•4_£!._._ _A/rie.,_.. _A/r!e _._Aerie__
00 . _00
-^-
R•j
.^_.
b_
]7^-J
.3
_000- o_
_..I
_..
_ 1__1
_i.}_.
-._G!_111sAC..y1Rl^12____...___ ...___..___._.-_.._-_-.-___-_
__..._-____--^__0^__ ..__.._._.--..-_6JCL._ ^ -
1110_ !!iHe_....._A/rit.___._.Aglt.
_..-...--._- -.1L►u/71 . 1000--_.-.
F!44_._.____. 2^Ju171li.1u171
..l'..1__
^__
1 ^._____._._
~________._
^-_, _ 1000. __116 159_, ___-_,
__ rit._ _rle.
^__-3_-
-_-------. __-.__
G.ICL ---__-._..__.c^c%...__..____.-_^-----._
21Jus712 yam.
1000Yom -
1510_`i3^__
160)i^3f_
-
S 1
^^p!ecl.--- _..---...__._114VR11A144l--
-5^..!^la?.z.S^3slr]_ _.
-.._--
___.. -...r.-
listtlort._l:o5lrttX-._----- ---- -__.._.-_...._.... __..._....----- - --- --- - __._. _..-_...-CJt^.Ltaht-.L lea 2or -_ Ssg_L+^..S^SiL_______.___.- ---.._.. _._ _..._..--- ---_._
_9^an..TQUnts--__-----_-.-. __.__..-.__._....----_--_ ^. - -- ------_ .---CR Plishc ..l.1RS 21/ -t^C_;17,___---__.. -.._-.GI4K.-.271------_.__.^__.__._
2^5^_ 1T 21_.10 . ..,_lfli _, 20}x . _ . Ajrle_-.. 0 8 3 0 11SSep71 .26Au 71
}170_ ,11
_, 156 .. 16W _. rlt. 0 R I 0 1-- ,_-.___--{^pZ-, ; 1ti01 1750 J^r/e_- 0 - ^ 1 1t^2ZZ_..._ __. 3Au111_ .1129 ._.lu2._-
__ls_7o__ ^:1^. o_
-e 3- o T-
-------._ .c^11^-;17 _-_ __._.______.__^JAK-27Z--.- ----.--
7^^1i; 1_;10 - ie»: _ 2oi2 _ Melt. o _ e 1 0 1--.-___.-_..__._.._. 21r^lii 1 _ iK:^. Ieo6__. A rs tt• _- o e o
G^1%31Z. -.^_-_ I9Jua71_ 11^Q_ ...._160.9,_„ 1679_ .... 1^-
3751 ..._.-_1,71,.6.......U2S.... _180?_..
rle}.....-... .O .. 8 3 1-__--__.-.---___.._....__. _G,il?L:ZlZ_..____.._-._._........-_-- ^Ily1L^1 .1.1.70_
0970_Atrt_c:___.Molt! __._..^i i -
0_0_-ti
__9_8
_8_
- 6)..3
l0o
11t
Cumt ____-._..__._.._______.---___ _ __.._.._-.--.-----_..-._.
Oars couetf
.fn14Kc.25Q_._.._. -.-- ONIrY73se.ffiL-254...___._..------.____..__..___._.._._.___._..-------
ft7?. ^2 ..._1472.._._ .._----'__'.._.
Caruu _._.-.-._----_...-ti llislt._1^ 21] --.__---_.__ . _._. ._ _..-_..--_.._-----__.-.-_^_
.1.8.NI Ysit93111tffi ^tr) _._---tw11:l1 277-__. -.-----.-_.___-__GJCKr212_._-._ _-.DICK _221_-___ _
----24E^71
14571t8Au17-1,.
--.144Q.^1000,
-.----
18W ,^90I_
_ 1509__
_.._..
1fOS __1 Si __lfilti .,
_.._ _.._ ..._
Ajrle_, ALle.Jjrit._._,_
00
_7
00 1
O b 0 1_-- ---_...___ _GJCC--.227 _.--._--- su7.1. 1QQQ_ _ ^^_ 1650 ..
1555Ajric, ,-__A rlc.
^1
!d
_S_^
_ 11
1^^1T9 u 71 6 5
NOTE: (1) For ilst of published documents which use airborne sensor data collected by ERIM, see Appendix A.(2) For geographic reference system, nee Appendix B.(3) For list of organizational addresses, sce Appendix C.
Sheet -1^ of ^_ Sheets
Site Name Site Location Flight Index Data Acquired:GMT Hr : Min ^:a or7
Discipline
No. of InstrumentImagery Bands
Date Ttme Start Sto UV V13 NLR M FIR---- 1000
1000Ili6
IS10IBSf41Y _13bb160LIii2
1KSS
160316313ttlzTb40"T7501530
G1C[-277GICK ff3 ' -_ _ .._CdCR 2t3
-__..-._----.._-.
rJCll-2lT`'^
29Jun^1a6Y71Zs.^71SS^p7I
ARr!'e. -AOritjr►sTe. --1fMr-Tc:
T.^"..O_
_a.__f.._^
_a_
3^^^._a .3_
-T._T._.__._
----_-_---__cr rilahc 618._313_ . _ _--_ ^_ ^__ --- ---...__..-. _._ __ ._._. _-- --_-_--
GICk-27T _`------_--_... _.._
--- -
SKuR7T71ugT1
'IITO1130
Jtbi-is-___Agile..._-....
TiC..__
0".D_ ^_.. a . T _0. T-I-I:JCR-217-._-.^ --- IfAuj-71 II36 T7'li ^____.
._CJC[- 6S^uR71 . .SOa..._.1.6D0_. .1.733...... ^Tit..-A6^^t..__.__.
- _c3cft=377- - 3.f-17I_ LSO _Iba3_
.
IB3T -_77716
- -- c.jCK_t7)_-_-------- u 7I 1Tlif _ - r t. -- a-_.- GJC71=37T--_ - 3uIT1 T30 --Ii1I dIIb__ srie:
_ G3CR-i 4Ju'n7I --lbw ^ rTe. II-_.,_-
cJat^3TT--_-__.,-.--- ^'- 1T30'_ .
I'b7f _- -ITib-..-r e. -
P1k^ CowbCR ilisht 61a 226 - C.1CJ-fj^^-._-- OOOct71
b90900' a-
-Td3S- ^ r-T--^.....___.____._..._..___.siCi=297 S33cF;n S
..7b^T133.
830- -^i"ie: __
_i-ie:--
_
^--- - cac3=377-`-____
IS3^y71- WCJ- uR ^ -la>7 r e.
0.1C./-6ff'--- ^►uT1. 04b6 - - TSSb- -I63i ItRrTc: - 7' -3G7CJ-2jf _ --_ 2T.1u171 OD00 _ -1TOII iCOr e. T
- C,jCJ-^' ------ u T- -_ _" TbIi
- -pit:_ _-' - Git:J 377.._`_------ 3dIunT1 09D0- T7IT
_]t'RTie. T
ca-c/3i3-'--^ - -s^^l n^a 'SZa zuc ^rrt--Porter Count----"Z.... __
CR Plitht_ Lia-^1 .-..----^°_-.------.-___.__.----..-._--- - -.-----___-- ---,--,-
- --
__ -_.-..^GIMI^-_17T ^^_Gf011-277 -..- - -c.TOM-f>3_.-.-.
__. __......--_..
GJOF277 -..-_CJRI-27 ..._.__.caaK=zii -- __
Ti^^ep7i .
Au'7i3A^"fl
0 u_`71^I21u3'f
-1ily6
-
-._ISSC^_.13IT
_ISO/`_ ..1301 ^
_ IaSi
_ .IbS9...-I3if ..
^i iic: -.^^t. .
'0-^-
_
Ib30__d09 -6S/
-"1713^_
7^r-ie:._..Aerie-.-...
r e.^i^t: i
if^ 3
GLOM-277 2 un71 1110 ^^ Iti6ti - A rye.
NOTE: (1) For lief o! published documents which uae airborne sensor data collected by ERIM, see Appendix A.(2) For geographic relerence system, see Appendix B.13) For list o[ organizational addresses, see Appendix C.
84

Site Name Site Location Flight Index D'GDate Time S
rt c v __ ^..._._ip_.-^_...----_._— __._a.P_...__ _...._._.... _.._-------- --,—_,-. _
__.-_—.___..—._-_....._CJDM DLa............._..__._-.__..-._._.....---.GJDMyDL___ -
SSep70SS^70__....__U00_ .
0900_._
1
CJDM DL -._ 24Au^70 16]0.._i
--.- ----- ^^t^____-_-___.-_-._..__ 24Au^70 1100htoet Couo^ _ ___
-.^.4 i1^4^ 1^ ------ ^-._^.-.____---------- 26S^p71_ 1000..___;
--_^—._-_.—_— x_277 -- —. ies.nli i0008JD[-277 28Au 71 1000
-^_ ^_ _2;.1 _—.....
11A^1 1000._.
---_ ___
— ~^^CJDIC-277 _ ^ OSAu^71 11 ^ ^'CJl)IC-277 W9Ju171 1000GJDK-277 16Ju171 1000GJOK-277 29Jun71 1(100
_ ___ 1;JDK- 277 21Mey71 11100 . _CD !11th[ Lies 216 CJl1K-277 OSOet71 1270
--.r__.--..--------.... 277-.-_.----- 243e 71---E- 11)0_. -GJDR-277 1SSe^71 1110_-_...— SJP_K_2 26A^71 1170
..-------------_.. CJOK_277---__-- -- 12Apj71 1130 _._'.G,TDK-277 27Ju171 1130
_.--, _.- --- CJ.DR-277_ .. __---___. 21Ju171 1130 __--.-_—.— __-... retlL.-3.73— _—.-- 29.1po71_ . _ll?!0--__.---._.._-----.-..._,--_.. Gi4K-?1L--_..-.___..-_- 21t1t-y71. 1130 _;^Lt1bX_GvaBC1L .._.-.___.-.._._...__ _....._.._..__..______-. _ ..---.
ShelhwilL —_. —_ FR-M4`. 21Auj7^ 0400 „______._.-.-. ^ .. 4^?^-!1^._.__.__..__.—......___....--.___ O7Ju173. .0815__.._.._ ..... -.--.-.--.-_.--. —__._—._ GJEit-SK4—._.--._ 06au17) 0900- _._._^SDtDtgLSr.9JtRE2_-._ ._.-- _.--_-- --^-....._._.._.._.lJl )11tht ..11Dl^Z-._..-.__......_ SoIO.d-Z77....___..r._.-.-__.-_.___._.....
G,Ifd.:3ZL060ct71040c_t..71_
7
0900._09n00900
. _.._.._—_--.__._.--_
OTE: (1) For list of published documents which use airborne sensor data collect(2) For geographic reference system, see Appendix B.(3) For list of organizational addresses, see Appendix C.
85
ORIGINAL PAGE L^
OF POOR QUALI'T'Y
RIM _C• ORMERLV WILLOW RUN LAtlU RATORIE S. THE UNIVERf ITV OF MICHIGAN
TABLE 2. SITES R7I'Fl MULTIPLE CALENDAR COVERAGE AT OPTICAL WAVELENGTHS(Continued)
Sheet li o[ J2 Sheets
Site Name
t _ ^_--. Ctt_nijhc _Lia^ 20 .. _ _.__...__..
_---_._._._..____.___-
Stte Location
......____ata-231 ^---^..__CJ^1-f1,
_.-------__.._...____._.OJ/7t-371
---...____._.—.-
Flight Index Data Acgwred:GMT Rr : Min Ma or)
DiscipLne
a^. c'---Agrie.Arie--
rc....
_ ..
No. o[ InstrumentImagery Bands
UV V1S NiR M1 FIR
6'__ _..^_b --
-b-- - 3-- -0- --_ ... _. ...- - -_.
Date
Y4sep7I__x3ep71
u^7 _
Time
170'_110Li10
...
Start
_ 1354_Y34S...
130D'.
Sto
_fb39isx9.-id _
c,ia+=ffT 7Aug-' --------' ptit-f7T__ - 7AusTI- 170-._ ITOI- TE09- r'Te:__—^-- tx-fTT_"-------
"C11-27T---._-_-.-- -C3Q1-177
_.__
s^l^,uITI_.uriTl
nID_^..
1170 .. "
.ZSOS_ .. -Ian- As-1^--_ __...^9-__
1diS_
_1 ....- 17
r e.r c. -
^--------- y 17Q_...._._ --.._._._... ---...-r e _.- --
- - -
-
►oee Coot_Il^t ylse !3i— ,C1-
c-3u.Ci-fTf-_tt 170'
ZbSTx'6^
r c.ife.`- 'II' '3'_
CJDJ.CJ-37.E--_.-- 33ep .. .7.0 .. ..._I.;..
gr c.- -----^---- CTDJ ^CJ-37T-_--_ __._. ....^S . ^._ ._. T-^^-- - -a- r-- -
-------__- OJDJ,CJ-Z3'7 -u^Tf f7iS' ^ Tb7T' iie-' _E—..---- CJlJ1CJ=3TT-
_....._.--.__.. TJu ZS00-_ ISSS^ r e. ff- ->f- -- --- _G.)u^C]=
f7f .-_.---.--__ _^Iu17L 13711 f0"" T704` r c- ff--T
^GJU.CJ^7T un 70- .I.bOf.. E7rrie.`- T_.-_-.-. ^.____-_..
CD Flight Lig 270 .._.._._.-.__OJ^J,CJ-277 `- ---^CJ^CN=
f1^_...___._.._...__.__._.-..___....._
cJCJ^x-z^^ __ .—
3lIi1.Tf._ ....ctfl-ter_
I006_A^9d6 ..._
-'-Txr6-.-TdTS
TS77-ZD7i"n:o---
l.gi c.A[r e. -..^'a. ^
4'.3._
- CJCJ^CH-277-_.
c.ic.%x-2n __Se T-
i8e^ 'lif36
1215-'13x3 --iaf3 _
1
17r6_r c.
r c-__._ ..^-- -a -^-- _----_--_-,
---_---._..__.__._-_..__._..._..
_-_._.----.._.._.__._..-_.-_. ___ . _--.._.._-- --
c,icJ^cii-2n_--.--^_ _
^'^'^--__gin_.____- __--CJCJ1Ctl 277 ._..CJCJ^CD 2j7 ---_-^^C8-27 --------
few !i -_.fr^^_ fi16Ju^15iflimll'
1---
T230_.if3b_1270
_1210 ._1000
a3xx-_....
_^
1330_ T31:1 _
4 0
Tb7T'-..1
_
^17bf ^__Id03-.. 5
1844
rTe-_r ^.rc:""^"
efe^Agr e.
--6 .._.l^T
_
-,_...T-
-
-- --
------_.-..__.—.__._.....Pulu^c; _ Counter ..,.-_.._--.._.--__
A ric. ^ 4 ^x-_...GE...L.11ght . L.le9_.T.4^__-_-_ {See __St^rle} Count Y.) _.-.._
CJOX OL 113e 70 1300 1507
NOTE: ( 1) For list of published documents which use airborne sensor data collected by ER1M, see Appendix A.(2) For geographic reference system, see Appendix B.(3) Fo; list of organizational addresses, see Appendix C.

Site Name Site Location Flight Index Data Acquired:GMT Hr : M^nStart r:;o
Ma orIDigcipline
No. of InstrumentImagery Bands
Date Time UV VIS NIR MI F1R,__ F Sg,ht ne_ ,_ -_-_.` -'
GJCJ 237 _ _ _^_ __"-^_WCJ 111..._-----_....__.'^_
12Au`7127Ju171bJu171
30Junri
09000900 -0900._0900 ..
165017001723...1824161i .......1727
1831 ,,,1807 _
_A^r1c -rle.._^4_ ___.
ws.lt.Agrie-
1 ^^. .1.1r
^ 8_e..
..^._
S.3....3 ._..
. 5
1 -^.._T _
1
T-.T._-.-._..-----_ ---
--._ _ __ ___ __ .. ___._. __..--_-'--_ CJCJ-27T'GJcJ 271.-._—___--__-___..
O.ICJ 271 22N.y7S 1i76_ lSib _Idii A^rlc d T -S -_
cs rlsiuc I . n...:ib3 ^ tb3._...__
-271 ti^"7'1 150 13Si IEIf A^i`Ic T_. ------ -011- fi3ep71 130- ' ' 13iSI30S _
""I6i4 As"r"!e: "' 'd' ^"C.101t-3T7_.______,___....-.. ____ 24Au^71_ Tl^ 'la'16-- Tif-ii"c':__..-- -g-0J6M=277_..._...__-._--_._.-.._....-
1'3iiu^7LJuI
IT30 _ice.
1301_ ..I31S .
_ Ib09__S0._..
A^iie-_ii"e---_
Y _>f_ TGJ011-27T-----."—______-
- fal9c.igi-fiT --' 3Su li7C- ZS - rie: B----
.311'-----.__._._._--___ b.Tun 1316 __16ib 1'TLB -ii'c:_._.B._ _6.
3-
----_------.__________._.--- B?o!!-_._.__.^ -'----.-.._.-_.
_.L.170 ._. __^I- q- >•ar e .__ -q- Z-
8ulliv^a Couet; - — _^
111^,bt Lino__ .cg _ 219 .__^ _ G)CK $71 ___.___.___.- _ —_ 3&tTI I330 -3813 T7i6 . ^i-fe .--._ Q _6C.1CK-271^__-._._.._._.-.. _..-._
2iSep7f 1130_ _19TI_ "3b1T- i1c: --' 'II- _g `T" BcacK-§f7--
27f ^-` - .., GJCK11^^71_2BAu^1T
n .5a _
^lbbb ....-
.. _r3ia-I36$...
....Y'sza.._
. ibT6gr e.kiTe._._._..
___
...B_ ^_.
_.._
_I-_
_..__._ .-_-..
CJCIt 27f __._.__---_-.. _
ficK-z3T _.-.------------CJCK 271...______..___._
26Au 'f112iw 14Ju
1130`i3a_
i
1601 ._._iii2_
^ I6b^C ...
^I730 `_TSâ0'"373b-
)t^rfe-'--"_r_i't:---._.
AsiTe . ^--._
ff'-
T"
^
....e .
-7
3
-
T
-_
-____.-._......__._...._.._.._..___.-^..-------...__-___—..._..
__CJCR_-277_.----..._.__..._ ___...cJCti iii
rt7Ju1112 J^171
1130 -.....1130 .
1831 .1121
_3b12 ..... 1806
_A`tic _. __a-
B.._Z!'
_S-T
._T------'---'----'---- ..___
-_-- _.___..__-__..
QJCK 277..__ _-- 34Jue71 13b _ 1609 3736 "XSr r^___-AErlc_
_ B _ _g.. . 3 .. __^.^_-_..._._.._._.__-_ _..
_ _ __. ___-_.__ G.ICIC 277 _^_.- 21}1oy71 1130 16j9 ,1746 A^rle ""6 T-_... ^! i},J,^S_I.}pe_7i} ,(fN Kao: C_OYetY.L._SSDYiSDDftt Co9A4T. __..__ C! Z}lihl ^}at_2}0 - -
...._....._..__. _..0.1CL 277 ._._ --^'+I;JCL I77__._...
Ii8o^71143ep71.
1300300
1703"'1653
X733^-1' 09 '
_A^rlc_Ajrlc.
.-_0
-.C^... _. .3 ... _r-. _... __ _....
GJCL-277 29Au 71 1300
_1632 17I3^ rir. 0 a '!- 0 '^1
Flight Index Data Acquired:Ma or1
No. of InstrumentSite Name Slte Location GMT Hr : Min Imagery Bands
DisciplineDate Time Start Sto UV VIS NIR MI FIR— t _^!.._ -...._....__..... _ _. .-......._. ...... _._ _-___... .. X98.... Br c.
CJLL 277„ „ ._,,,, ,,,,,,,,,-... - _.._ OSAu671 1300 __ 1600 1735 Ajrtc""
0 8.3
0 -^ - 1^._..---. .-'---__ .^— _ GJCL .277__.__._-..,__. _._ _ __._. 12Ju171 1300 , 17Sd_ __1902 rlcVii.-- 0 -_! 7 b
_1
CJCL 277 28Jun71 1300 1800 191 - __Agrie 1' 8 S 1 1
CJCL 'L77 -'------..CJCL Dl:
17Mt 31 -sep7b
1300 .010
.. 1808_1552
.__1901 ^-Tb10
ARria _ _._^grse
._6-
. 9 .4 -
6^
_T .. .T-T-
_- [^I^.^tu Vielailj _, '-_.__ __
__________ _.__ _ _- WCL DL --__-..--_-_'--'-
-'-^_ .. r 13A 76 i43b.....183i__.. 3b4i" -__ TA3 . ____ 6- -g- -b"- .... 'T-'- --°------ __-.-_ -'-- _--__ - ^^>»'L___..._^-____ -._.-_
-13A.. u^70 I330 1537 1835
"'A ric _
cacl:,Di o1Jul7o 0953- -134s - iiln egr^_ ^ ^- 6- T-__-___._..__-_^_.CJCLDL-^--_
__..__..-.____OilulTb b331S __ 03bi' -0451...
_._^Ed^c- ^_ b_ T_._....._._......._._..
cJCL^Dh __ _:_^' __^___ _ -_ 3b.Tun7b 693:0 1331 - (3211' A';ile: d" `9 T T------'
_-_.__.._G.1CL,OL
'-08Ma 7006lL^^0
1300 1905 fIOS - Air1e _'__ _'^" 3.. 1--_---- ---_..-- -__ --GJCL^DL
-_0900 _ f3d9... la4f A4ric .__-_ 0-" 4
^ _7.. T._ ._-. C.1CL_`DL._^ ^----._._ 17Dee69 1.200 _ 'T61i .. ....1056 .... Agrlt...__._.--_---__..._--._-.-_ CJCLcI)L- _ 06Nov69 if ... "'lb '15_ .- 0._... Agrie_...._._. 3^ T -I—_ __-_. ^^.t^^_._....__-.-_._.._..._-.._.._._. 06Nov69 OB30 1421 I^S07 A rie. ''^7
.^._-_._-..-.---_._-- CJCL LDL__.-_..
OSllov6906Au^69
13 '- ^ 'lOJO _
_1807_.. 1132....
^ 192^..._ Agrie. ._.. . 0_.. 7 . -G.1CL^DL.._-- . I7b5 ^
--A'r1i<.
---- CJCL1DL__'---._._.__.._.___... OSAu7c69 1050- :: ^f3I _-i^73B' -ABr c ^ _ T---._..._._---__._.____.__._... G!^.e.0^___._..__.__-_----_.. SAug69 077NT T3F0 1T3a Agr1a --5- __1
-a'T
n7i..._..._eT.__ .B..T^^ ---.
r e..____
...a--.--._..__-____.—_.-_...__. GJCLLDL ..._._..
GJCL.DL26Jun693Jun69
1656'.....
17'60 ...---..__.____...._.._._...._.__.. _CJCL iDt 23Jun'64 11
n ai-93T_ .
_^^Fbii' A^iZc: _:__ . 0.._._...^._.._.__.- _---__... .._..
.._---..-._____-.------.---'_-'-
---- -'--GJCL.rDL___-_.._____._.___._._... 27N.y89.,, 1100_
^^ 111A .._ -1bfb.... ARile___._.. _ ^ ^----._. ..
-_._GJCLlDL ---^-.._..__..._._. _ 6MayG9 1.1.88
...
0630
..18T0... _.1.68.5....A rle.
---A4^e.'
-.a.._. _ 3_ TG1CL^DL_.. .- .__ _-'----_-'- -- 15try69 l2ii" 3103_
1619 -
-7_ _3 _i
^.______.______-.-__-- CJC1^r^.. _..__.. . ..__._ ._._____.._. _ 265^p68 0900_ _ 1531 ' A^lc___--_—_.....___.-._.___-_.__._. C.1CL,OL__- 70,iu16B 0900 1531 1813,_ Ajr^e__-.. a
.....7 T
_._ _.._-__._^_-_-_-_---__l---
^?^^Dti _.._._..__-__._. _. _ 1SSe_p6s 2030 ^ O1SS b23d - Ajrie.—i__ _ -..__ `-^ CJCL^DL. __— ^ __-. 15§op_66 1200 17i1 -1928 ^
_A rie. ^'^ - ^ 'T_ ^'4^ -
_. ._..__^^^^^^^^^ ^ ^
_C.1CL,DL..__.. ____ -__.......__ ___. i5S^p66 0'170_
1120 1 2E Airlc.-
4' Ti^ 1-WCL DL 29Ju166 0800 1327 1426- A¢rt^. ...9 ..S 2 ^
NOTE: Ili F'nr list u( published documents which use airborne sensor data collected by ERIM, eee Appendu :\.(2) E'ur geographic reference system, see Appendix B.(3) For list of organizational addresses, see Appendix C.
86

^ ^ ^
^ERIM^iME RLY WILLOW RUN LABORATORIES. THE UNIVERSITY OF MICHIGAN
TAHLE 2. SITES WITH ML'L1'1PLE CALENDAR COVERAGE AT OPTICAL WAVELENGTHS1 Continued) Sheet ^_ oI ^__ Sheets
Site Name Site Location Flight Index Data Acquired'GMT Hr : Min Ma or1
Dtaciplltle
No. of InstrumentImagery Bands
UV V1S NIR Ml FIRDate Time Start Sto.._._.L.311/Y24Lt,I1ClO1tY-..-_.-_.._...._. .Si 1Ck..Qk..__.-....-....._.._______.-...__ fl.J.u146. . 1209
.0815.z}w .1000...1600...
.... .1728....1j59 __.o;2i_
X549....,_nf^__ ,
18 iY_}441
.. _^^?_171nJa
Agrig.,-_..._A^r1cx_._....njr^._-.
rie.-..r1c,.__
__.._.__0.__^--.. 1 .._
1 ,
99..
-^_.S_9
S__5.__9._
SS
^?_ _1 _._._...__-___-----..-_-_ _.__.__._--.-________.._^_._.__
_..__.._...A___.. _.._.....___-____-._.__-- _-. _.
.Fr.,1ck,D6____.--_.. __...._.__.^.__..G!^,pL..._...----__.. _._ -.JCL,.p.^.._.._._._._.__.-....__--_-G[L^a^_....________-._---_.._._-_
j7Julfr6 .s.iuii^_
26Ju16630Jun6fi
._...^.22
1-_11
_..___ _______.__. ^^..^.___...-.____.._.... 30Jun66, _0670. _ , _.. 1357 . 152_ rie.^6-.- 1 _1 S ,_2 1__--. __.__._ 0JC1^..ILA_..__.._____...__._..._____._- 29Jun6ti_ 219Q. _ .. nti „ a a ----_-ric.
__0 0
. _0 _-1 ^
,- C.1CLiDL __^, 29JuR66,. 1230._ „ 1605_ . _1836 Aerie. 1 9 S _2_ 1-,--,^ ^_ ___ GJC6_aQI.__..___--„__,__^^ 26.1un66 1000__ -1716 ._1603 Agr ic. 1 9 S 2 1
OJCL DL ONlyfi6 1330 T n^ rie. ^ __
4 ^ ^T-.---..__...._...__..__.._.---._--.. GJCI . OL .OSM. b
.1^.__ ..119^^
..200^^
..A ric.
_
^C69Q9Fk9rY ^c!,^6z_.._._._..-_-__ ....__._.._._-._.- __- .- .- _.._-. __._..^D.P13th^Liue 230 - sei_ roteY_t7owt^...-_-,. -__ ___-._. -_Pdslf_.._-_.^._.__._._-. CJCJ._.._.-_ __ 11Sep70 1M0 _ 1507 1644
__-A^ric.
___0
..9 6_ 1 1_
..--._.._.._-.-- ^J,_-.- -.------- 11Se^70 0900_ 1007 ... 1144 A6Tic.- --0 .__ .. 9_
_ 6 1_ ^.,._._.- GICJ ______---____..--.. OSSe^O 1400 . 2006 .
^__2162 - Agric^ 0 9 fi 1 1
-.._..-.-._.___._...___-.___._.__ _^^.__....___-_--__.._-..--....^ J -
OSSep7026Au 70-
.09001630--
_15522363-- -
16102323
Ajrf.c_ALTSC• _
^0_0
. 9^^9
^_6_ _ 1
--_..---.._.....__.._--.--___ _G^^_-__ s^A 70 _1100 1702 16- Alric^_ ..._-
^b_
-I'-.^161ZCountv_____.
- ce ni.ee ,-LSp6_jjL ._ ,^__ CK.,^T7_._.- `.._____ tiso«9i_!230t t^^4` ,
1613_-..„ _-1911 . _ .
1566... _ ._1660.
1760 __ 2014
__t61ti_
Aerie.AEric.____/ytri_e_..-.Ajrlc.
00
-^_0.....
8_. A.._8
-3_TJ ^
^
00
^30
11-._.____.._._..._-_ ___.._._.. -. 1^.:3?Z.__-___-.__..-.-._._.. 26Sev71
-__._..-^_.__...... fi,I^K:17_L____..-__._.._..-..__-_ 1SSepJ1 _1101_.,-.____.___ -. _CrJCR_,P7^_.---...-i._ ---- 28AuL71..-1000 _... 1509
-....---_._....__...._......_-.._____-_._------._
_Sn7^K.-P.Z.Z.._...__-._-_--___._Cdf:K:1ZL_-..._ _..---.--._
2tiAyL71 .1.A}y<^b
_1130130
1601.__^4^2_
_ .. 1750...1530....
Ajrio_Airic _
00_ ^8 -!
^-10
_ 1'^
_..__....---_.._.__- _..-_----.._._._...___._._.._..._.-._._......_..-._.._.-------.--.-.--.c._.-_..
.__.__-_-.._-_.._._^__--.-.-----..-__..__.
4JC6-173_._.-__--____...._.._.-.---.CK-1Z.1_..._.._.._.._._.___.-_._.__...
GJCK=17_L.___..__-.__-._...-_..----f„LG.Kd11.-._..-_____ ___.G.IfdC:.2ZZ__.....-..._._.._.___..__- _..___
OSAuj71^^^.^11!!1.7.1.
.$1Ju^7129,^ un7
7
.. 1300 ._.1130..^j30 ...1130
3._31^Q....__. .l_609_._.._. _ 1738_
_.._1600..__._.^60_
X631_ .}621_ .
1
1735._17]0_2012
_ 1806_
174
.Ajric^Ajria__ .
. /brie..Ajrie__
. .Ajre __. _rtr,
0..... 100_
. _^._n
__8..._8____8_86q
3 ._S ._33
.._3....6
_0^1
0
1__11
0__0
1
1._1
1
lvtrr>; Ul r^or list of published documents which usltlrbarne sensor data collected by ERIM, eee Appendix ^.12)For geographic reterence system, see Appendix 8.13)For list of organizational addresses, see Appendix C.
Sheet 16 of 72 Sheets
Site Name Site Location Flight Index Data Acqwred:GMT Hr:Min Ma or1
No. of InstrumentImagery Bands
DisciplineUV VIS NIR MI FIRDate Time Start Sto
__yero1111on..CouotY_______.____ __._._.,,,______._.-... ____. .--^!Yu^i..___. ..._.___ ._-...._.__ _^^_.-._._..____.._._._._.._._ o6M.Y71 0930 .. ... 1536
....1925 ... Multi..-_.. _^.__ .
6. _.I_.....__0. ...r._._
-------___._-._...._____.--._
c.1cK__-_15occfi -
_Joao _l^iT i736" nu^Y'ci
__ ._^ ._g .^._ ._^_..T-
._...._^_._..--__ ----____-.^__.._..--_____-.--..._.
ractc.--------c.ic'[ _..^u...7.f. .b8ib......_.i33.L._ .. r_902 _ tful"t_i'.. __ ..0
__ _.. T-_-^--^- -----._ .-_.... ^^ --__..._..-_.-..___----.._- -T3Aus
TuiTO'3i3b .
5930'....T83L...."33Zd-...
._ 20d.6 ._._.^^_
^..-.. ^ ^.. . .i -
-.------..____...._.._ . _ . _. __ _ _.. _.___^_......_.___._._..__
_^^.... _. _ . _ ` _.^ l7dt) _..1453 .. _SIS&- 7i6ifc-_ ^ _ b-_ -I' -T-^rren Count--_._-.^_
._._ C6__P3 1tht LSM 2210--._..___....._..._-._...,-
(Soa T1p cuw Couatz^^ _ ---.. - -- -..-_._. _.-.- -Ta! OJCL I7^ug76
_1078 -T67r' -2aSa" XgFic- -6
----.--_.._._ _.-- C.7CL Ju225" 0555__ _IT64_ _Z7I0- 7^r'i-e: '_ `1S-
C4_Fl}ght Lines 227 --^__ S^^__S ^n_cir_Count-S_--_- ^ ^ ^----" _"-^ --^-_ .._ .-_C! Fllth! _LSne 229 CJCJ-277 -.^Y _-_ ,-^ Ob-OCt7l 0900 '^Ia§2 I^$1i- gr^lc: ^^ ^ ^^^^_.-_
--_.....__...__._.__..._-.__-._- c^cJ.-277 __._ _rti7i §5 IB3 R tl-c^-. -^ ._^..----_-..._ __ GJCJ-277_. ISSe^l 0900 ..
6.4_...__1935Agr^lc- a-...B
--.-_.._- ._.-___.....-.--
GJCJ-277 ._--.^-^---^-
u4 1. 0900 ... .-5832_ ICg^c.`-_.. ^. H6.lCJ-277 llAu 1I . ..0900
_jE30 ._ .._.183b_ milt: _..g
CJCJ-277 _. Ju 0900.. ._I7S6 .....1857 ^ r c.-- ._..--..__._-.^___...
.---._.GJCJ-277._.______._.._._.___._._ 16.1u171 0900 _ I A6ri-` B- -3- -
- -...^_.-__.._._.......__..-_._
OJCJ-777. 30Jun71 ^^5950 '--1$IZ ._ ... 2712- ^^Tc: T .3--.--._ -.
__CJC.7=27277.._..-._.._ _- _ 23l1i f1(1 23$6 - 6Si '7ytiic- _!>'
__^lT1L-_-_..._.-.-.._._-...__ . 4 Vand^rM^rt Count ^_. .._ .. -._.ffi^te Colin.4]'_._.___.._._-_._- ...__... -_---_ _.
CJOIrT^^ -..-
eP..I76T-
_ifc: '-"C!tliaht Llae Z01s _--- -
-.`..__._.._-._...____.CJ'D1r -^^
-277, 0J0L3-i-T1
9Aut i `i300 'ZbST-
--.._fb73-.-TEff9
_-'2733_ ..r e .
ai'c: ._.-'6'^"
'3
--_._......-._.-..__...._-.__..-_ __ ciu-i77-^._.__ __._._.._._..._...-._
.13Au-fl"3lau
iS50 Ialb _ _ - 1216- -^r1e: -. . Q _..__
^._
a -_..__._..._..-_....._...
_ -..Gmt.-277 __ _OJDL-277,--
f31Ju171
i7551130 ..
-_3'537_-^l3ff
_26111_-Ii3b- Tiie:
ils^ic.-._ -d
T T
_.____.._____._._.._._--._._.__---_-
p1.=zi7 lz^yi^"i 1__... ids --i55 r c. a_ _ "3-J L-277 2A,tun71 1700 1800 1916 Agrfc. - 2"_ _^ ._;... _..... ...^
...,.^. I .^ r^,^ L^^ ^^ t,uuu^nea uucumrms wmcn use avoorne sensor data collected by F.RIbf, see Appendu :1.(2) For geographic reference system, see Appendix 8.(3) For list o[ organizational addresses, aee Appendix C.
7
8^
ORIGIlVAL PAGE L'^
OF POOR QUALITY)

r
J _a
IN LABORATORIES THE UNIVERSITY OF MICHIGAN
OPTICAL WAVELENGTHSSheet 17 of 32 Sheets
Its Acquired:MT Hr : Min Major
Dlscipline
No. of InstrumentImagery Bands
UV VIS NIR Ml FIRtart Sto
.630 ....3^1_ .. -^1820 ...A^rla.....1b01
r c. -.._.
li^ric.,,___.0__if
_._f...--^-.
^_4 _. 0.-0-
._i ...1--
:bi7.._.._I73if.._..4rle:_._._ _0. 1-33b_ -`iTe^_` _3 ^1
!bow_ tuii"^i3i^ -bb5i ttiici _
^_.
ibo9i3oe
Ivoi--ieb6
xya^o3o^-xy_droTgy_
_1 __i_ _2 _...n
I"
lS^16b0'-
1 1...._`fbSi
"
Ilydrofo^_xydro-low_
1j ._ _.. ^_ ^._b.. —
"sii__i 1477 rZ.x^drufog 3""-_j.. _^_
EOiI-isio -
-^iIOifS9__
xYdt—olo^rNydro o8Y_. 3
_
_
^_. _ I ^... 'f—
i7ie'l!^). _..1410
1x21..-190T___
1621 __
t^arolu^pN^rdrolo^NLroloEY
1 - 9_^^_^
)-3^I
o6_^
1216
CSof1636
)26
1^IY-:1617
xydrolo^
xZa^oiogz_ .N drolo
f1
....__
9
.1-
^0
-3
=d by ERIM. see Appendix A.
Sheet ^B oI 32 Sheets
Site Name Stte Location Flight Index Data Acquired:GMT Hr:Min Ma or1
Discipline
No. o[ InstrumentImagery Bands
UV V1S NIR MI FIRDate Timc Start StoSE Sh_o_re_Lake Mlc . _ . _ ____
__ ___ __...--. _-._- .._____..__._.__ —..
_____^__._._.._._—..._.._—. -_._____---- - - _-- - --_._._._._._.__..__._..---------
Arenac County
CJDM, N , , _^-__ -y---GJDH N P. . .. .__ ._ ...__.-_..___-^^ipE,P___-____.___..._._..__._GJDP ._._..^__.__
ca.vP__..____.___.___—__--_GJUtt,r,P
^^-._.—___-_..__.-- ---------_......
c.iwt_-,.._.__—..—.__._._.
fir..... .22A r71-P22Apri109Se 7007Ha^T6
iiiuga^4Tityb9""fi3b:.ibs^ bb
____^^1430-.Ob00^^0900libb"-i^
..
ltoo
1959
16]S^1<3S -
. ' f139 '-lssf___.'14.S.b..393E
2109_303E-f'^3'F -
7t'i-...-4010_.._2. 0_
166 ..Nydrolo^
y.. ro ojyH drolo -X Q
droloyaro"Io^
^ya^aro8y
^drolotiy_..xydroio^y
_
1^- 1b^
9^^^99^
^ 4^-^4-
_
^3 - _-T3
_a_.3"
0^^^0-^^T
^2 ^^_._^^
_—
^.T
— Sa1inin MZ.....^.---- -.____ _
cJ^^4 _....__ _ _---^—_.----- _CJGF_Ti►p_r74_1^prTj"
+PSO-105
_"i31TI83H^'
_-fbbg _30bb_.
AyarTeq..tlyaioTos>
^_ CJCP SitaiTS 07a 1bSf- 7dT` wyTroTog_yG.1CP '- 12Jin73 1T00 _
._.._f$3^ 3bf^2.__. .WydroToBY._ _^ _^_._ .--_—_ G.IGP__- ^ ^" ---y...._ iOJa^^3^ 0900 .. ._.I4ZY ... -ibra
..... _y3rolo>lty^ ..
T
----^_.y.^`--._....GJCPcicP14_—_____ ------- 9e^^73
09t.sp70"idob_0900
_ i9F9_1 S^S
ii 5f_2037._.
H -droToRY.Hydro1o87 .. j
^Ba-^ County .._—°--_--.---.._____^
Saslow_ N ^N Arenee Couat7)Berrie Couab _."____. __..- SE Shora_ Iake !1lch laag ___. ( Saa . Alletaa Count-^ yS-^^-.._.
----__._._._....
_-..---
-----__-__....__ .__.^
_- _.._...._._.____-
_..-_
Charlev_o1x . Count.---^_^^^-__Charlevoj^_^. —' ^CICLIt^_^.^ ___-._ .. OBxay76 0930 f 16 606 Hyaro o^ -6_-_..__
Eaton .^.2u9I:T _.. _.-._.._.__.-^GII_EA ^^---_
...-_-.-.
09-Sep70_ .0900. .^..._i-43S_
3a37^^. ^H aro-i_ -- .^ ..
Cha r.33.4^!__. _.__._. ---G,[fN-279---
un 3 04 -...1^-^ A^rie^ -_
-_____...___.. rtt-27^!___._.?._...— 2^t^?i l00o iC53_
-_iilT rle.
-^--T `a
---._.._. ___......-.__._._...__ .____._.....__._. __......--.__.__.._-..
Genuan._&9.N.9t.2._._.
27^_^^►M-.._...1..__...__.._.__.._..__._..___._.___._.rt^1^-.?79 -____._-__-___..
1)Au 72_._._t_..__06Au^72_
0930..._..._..0930_ .
1613_-..._..,.._152.1_...
1459-^...1621 -...Atriey
rlc._.-..__.__...
^_a _
^
_ -n ..
.-^--
.^.__._ ___._._.....___.. _.-.__. 22Au17) 0870 . 1350 1645__
xsdrolo 0^__. ____-___...._.._ _._^. G3.G tL-_-_ 03Ju173 1030 . ,_1506__ - 1610 x^drolo^y. __ __...
22Jun73 0970 1357 1679 H drolo 1 7 ^^ ^^0 1
NOTE: (1) Fnr list of published documents which use airborne sensor data collected by ERIM, see Appendix A.(2) For geographic reference system, see Appendix B.(3) For list o[ organizational addresses, see Appendix C.
88

^
I
T_____._^,A
.1. ____,^w.t _
ERIM/.^kME RL^ J. ^LIOW RVN LABORAT(.1..1 `^ rME UNIVI I. ,:lti OF MICHIGAN
TABLE 2. S[TES 1477 ' ti MULTIPLE CALENDAR COVERAGE AT OPTICAL WAVELENGTHS(Continued) Sheet of Sheets-^- -^--
Flight Index Data Acquired:Ma or7
No. o[ InstrumentSete Name Site Location GMT Hr : Min
DtsciplineImagery Bands
Date Ttme Start Sto UV V1S NIR MI FIRt.at... Stud. ._-...---_._.. Gffi.._--...-._......_.___....---._.____
^?V_M..- -___....__...- _._--- -_ _...!'!^1 :.....
OSSap72.. ....0100
.....-----._1Q4
_....LiTf
Y._r°. °jy ..g7drolo^
^_._ .._.r . y ... 0 _.1____
^^._ -...__..-_.__ 30Ayj72_
10)0 _ . _155_ 16iS ^NydroloeL ^ '3-__ .. -- - ---- __
9inmn tgtlllejf_ 14Jup77
o7^^e73OSOD
o9ili1004
_i33b_lOS Lead UwGICl-, .,----- --- .—,._
c.ii:I __fTiT- ta^id-Uu -II- _r_.
c,^cr...__. 71 - -73- olio _i33s Tb3i!-
__ _.pN._.
_'
_ ..
------...___.____.._.._-- --___-_ ^R .._.^..-----_---._...__.- 3^ i63o' ^f6'S3 " ...175!_.._ l:aad'17i. >f^ledrin CountY_.. _----.__Illtrbiwuu
-
-.-_--.—. --GJ/I 1]A r73 1300_ - 11<fA _f6Ci drolop
_T T' i -
C,iR'u 1 Jae rbb 1D34 1dTF droTop_HYrCa S,A.Y0.tL—_—._—_._ __ _..._—_ __... ..—. _— ..._.____
Saelnay.jr,Y._....___ ..L^L90!£.ScowftY)_, _._fluiulrPaLL .Aut11Y___Port_ - III,.2 l0A r 4 1000 ?' ro oar
-__ ___ _- --- -.___- -- .._ .------_---.-,
G,lxR.4_ __ 29Au 72 1400...
19 8- Tli- Ttyarol-n _T-
7--_lnsiam CnunGY..__..-
ale. iar^-._East. .Laaaly;(ttcu_. ---
_G..IF_11.._.-...-_._._..._..___....-..-__ ^'m13 0930 _1426 162 _ rie. _T ^^T 'Z'^G,IFit._._._--------.__--. 190gt72 0930
17001653.. _1331... 7^ T- '^-.---__-_.^._._-_.._..
prj- _ 14Sep72 1802 _1a1ti Maltz-GJFIL.. 25A 72 1000 ....1475 1 -S[i--Mu T-
^gN,,,_., 21571 1400 1617 151 ASrie-' 0__--___. -_. ,__ __FN 17Auj71 1400 2028 1 ^ r e..-----'-.----
----_-_._.__-- ---_..._.-.
Ri__._._...__.-_......_-._._.^-_._ 06Au 71 1400 1926, 2-'013 A4r e._.-.._.._...._ GJIN._-- ---- 06Apj11_ 09ao.. - _^
-i7^s___
-7^6Te". _ - T _
-r
^- 07Ju171 14011 1107 2131 rIe T- 3---..__—_-.-----._ GJIII_..----.- —._
-221YY71 -----1500 9 -_--- r e...Jiackson_Gnuntl.___._-_----.
Sharcnvillt_.. ___-._.-_.-- _-SnIPN ._.___._._._-._..._...___..----_._..__ OS.Iw72 1000 1506
--._..._1659 Por^n t - _ ^-- ._._.._._._-._..-..__...._
GJPN._..__--- 1617et:70 _0900 . ._1465... 31a _oinetr3_ IIT..
_^ 7--____._ _..__---.--__...___...._ ._.__._.._---_.__---.GJPlt.__ ------...---- Ol0et70 . _1000_ 1335 1113 Poreu 6 - ^ ^--..-..-_-_--.._---.--__.__
- --...__..- ii,1FN-_ _ .---._.... _9.IFN
29Sep70 0600 1146 1312 ►oren_.S _
3 ^06Aug70 0130 0657 0831 ioratr^_..__ __-_- _..._..__.
Au 70 1W0 1525 1705 ►oran t_
^ 5_
a `^
NOTE: (1) For list of published documents which use airborne sensor data collected by ERIM, see Appendix A.(2) For geographic reference system, see Appendix B.(3) For list of organizational addresses, see Appendtx C.
Sheet 20 of 32 Sheets
Site Name Site Location Flight Index Data Acqutred:GMT Hr:Min Ma or1
Discipline
No. of instrumentimagery Bands
UV V1S NIR Ml FIRDate Ttme Start Stoft..:.,.,.,in. - FN..---..__.--_---_----^---... 07 J9^. ^_ 09 -._...._.n
140007001000 ..2100
S__._ . leM_1729._
.._1570___0229
__^.2__._.. 2019
1855_1642031
.-orestrY._.Torna^ _lorntrt..__lorestr^. _Ionn t
_01 ,0
_9 -_^J_
d-3_a._-
i 1_
T-
--_.--...---_.-_..-.__ _
------------...--__....__--_ -_..---._.
.GJ£t!....--.---.--. .--._._.._.-----V,J,7N.,__,-_-_-.___--^,_-.ri?.CS___-._-._--.--.__.___.._....------ti,ll'b,_.__-----..._..---_--._-_
06Ju170 .Oe.Iun70.26Noy691311uj69
_ _- jLi.._--_.- lulu 69 0900 113'3 1 or•ntry - -------_-.-_.- ----. _...----_--._.____.-- --OIAut69_
-._.0930 1ST_ _ i13b^-- Forin t _.. 3"
J.apeer . GautitL-..._----^---^--.._-._.lmlay. tier .--.______...___..__.__.._ ...-----_.-----^--- ----.ST3.HN_..----.-.-----._..-. ^-----2eAu 73 ---.1330_. __
1401-__ Ln ^e If- ^-4- ._
_.._._.---..--- -----___..- .14r-----_---_.---^-.-_._.__...31Mar73^_ 2^wz73
0970,i00o
_18071aT3
_i3t-18ba_13Sb
n3_Uie__.t:ind I^.e
^.
^...__ ---._ --_ 11A r73 1100 1911 19^ La set....gyee CeuerY —.—_._..—__.,._.
--....
t ^^^°••. _^.Slt- ---...- .fitQ1..LL_.___-._^_--_ 06577 1000 1138 1600 A rj ic. 0___._--- '14.17t_Qt.t:Y-279 - _Aug73 030_ 1327_ 1601--- A iic^
-d
_ f.IGY.__...._..._..-_-_._.._._-.._.-_.- 21Au^70 1030 1608 1747 tic. 9 ^--.^_.-__. t;S611.__._._- _ 21Auj70_ , 0730 _1307 _ 1430 _ Ajric. _
_ _ c,a:tt 20Jun70 1030 1533 1628 ^Hc. 3'_ ..S
--_----.--- -._^(ai._L^..^....fnn CnuptY..._—__.__
l eon _r16^. --.-..
.._. _._._.
^ ' y7( , _.,.-_
Q,un70
08Jun73
. 0730
0930
1300
^1426
_1416
1626
-rlc.
^^-^—rie.
-
3-
.- .^
^-
-T
___- .._...G,1GlS,__-__„-..-._-_. 190et72 0930 1455 1531 tee t1_- _-_..._... G1Gj. 2SAu<72 _1000 1435. 1 2 Molt ^^lacoitb _tountx. _ --_ _--. ..._.._._. _ _._.__-__. -_.__Imlay _CSfyL.___...._.________...___ . .iS6f_lf$lZt1L^R11u1Y 3
_ _- ... __ __. -_. -. -_ _._-..-- -- _ _ -
s ^- . -- - lOJipt14 1000 1427..- ._17 9_-_ pdro ojY-----__._4. .GJxN__ ---....__.-_. 111pr73 _1300_
1400 _0900 -
_ ls2s- 193 _
1465----
- 204 arolo^r -T-._ __ __-- _.... _
--- -..GJ1tN . _,__,__„_--G.Ilili_. ._-- -_--
12Jan73OJ}^77
2022 _1640
NydrolojXN^dtolojZ T. _ Y-
- -- --. __-._ GJBN _. __._._. .--__-GJIIN __-
29Aaj72 1400 192x_ _ 2131 NZdrolo ^' 7^_. __ ___-- _ _. 443u167 QfjO 1605 ._^2^._ . , Hydrolojy _1_
r+v> a: µ) ror use of puousned documents wmcn use atroorne sensor data collected by ERIM, see Appendix A.(2) For geographic reference system, see Appendix B.(3) For list of organizationa l addresses, see Appendix C.
89
fit
i

RIM^'.>RME RLT WILLOW RUN LABORATORIES 7ME UNIVERSITY Of MICNI(.AN
TABLE 2. SITES WITH MULTIPLE CALENDAR COVERAGE AT OPTICAL WAVELENGTHS(Continued)
Sheet 21 0[ 32 Sheets
Site Name Site Location Fltght Index Data AcgwredGMT Hr : Min Ma or1
Discipline
No. of InstrumentImagery Bands
Date Ttme Start Sto UV V1S NIR MI FIRDub in __.. .. .. .. _..___...------
-.__-.._._. _.._---^^... ^___^ __. .. _..fP
14S^p)2...
. 100 ..1 _
._.. 1909_.1., __
.-1469-.Pore^ary^orNtrs___
10
17
, 24
00
1^_^^-- -----------
MDnraa County__.-....--^-.^a _..._..____---_._^..__ 0?^_-_^._.__-_._------...._
GJGM ___OlOct7022Ju130
10000700
_1S7S_125
_171 ...1371
Lad tN^_La'Rd UN
0 .0
'..!
67
. ..2
..^__2v_ __..__ ^^-_._._. _--___^
'1Jui30 15 70 - 2050- Y900 . _
^_-'3W0
God OwIJad_ UN
03
9-!
7 22
21- C./QI___-__
CJGM T ^^ _^ _ _ 13Ju130 1700__ ____
^ ^ ^ O6Ju1711 1000 1876 201! trod Up 0 9 6 1 1_MBet Shore, Lltks trio GJQI,N _ l0A r7^ 1000 _ _1127 1779 .Ilpdrolo^r_ 1_ e 2 0 1
-----""--------clotctptsM____- ---__-._---
11A^r^^ Ot170 1400_
1T Nydrol33M.^73 tip 03" _T53s "1611- R^aro T ^_
GJCMTM _--'----____.-GJCM^t _--_--___--_
29Au T^29Auj72
1600.Ob30
_198_1101
'f1ST_1512
Xzdro^^-NYdrolo
__0 ^
cJat , t Osw^72 1000 1M7 1176 ^ NrdrolojL o_ 0 1_ _----_-_-- eat o9s.^ 0900 14ss o35 - xrdrolo^r 0 ^ 0 -
clot 26ROV69 1000 1570 1642 NYdrolo 0 -^- 6 1 1GJGII _ _- .---__ 20Mov69 1000
2100_1610W27
^ 1^'! _OSOS
Nlydrolo^_ 0 _ _S 0_ GJ- CNfN _ _ 13Aujli9 Nydroloj r^ O 0 0 _ 1
G14111N 13Aut69 0900 11120 11158..1827__
MydroloNydro losr_
0 9 S 1 1-^______ CJCIILM.,.-___..,____ 06Ju1 7 1000 _ 11103 1 9 I 1 1
_.___
GJCMyN __ -____-__, 1SDec66 1730 1857 2005 H drolo 1^ 0 0 1_.-.______ GJCIIy _ 18Nov66 1700 1935 200 __ ^drol^ 1 9 3 1 1___,-,__-.-___-_ C.1_(^a^l ,_..-- llNov66 1730 1940 27 Itpdrol^. 1 9 1 1 1
__.__._.__._.- -. 4?^_._..._.___._..__...^_._ _ 29 r66 1700 p • ^- MrdroloBy 1 9 S 2 1Muske^on_Couetr ...__.___ -- _. _.
_$e_s^or9..^1y ..74t 4t!! 311ss!LLCowtl ) _.._ Ottaga __CountL___._._._.._^.li. SttQiR. _ elkf. I6t.S.htitld_.....-. _.._
-.34EL .NYt'._4!1•Pobi^!!l.138_--_
. (>Nn .A13flSt9..G3!!9SYZ_.__ __- -. .- __..__.. _.
het. dkI4A .Couety)_^ . -
--_..... .&.t..__Clalr RSver(Leke . $t. taxi;
[„^^., c ^.(see MecpBb . County) ..__ _ .. ._. _.. _. _ ___ _ _. ... _..
NOTE: I1) Flrr list of published documents Which use airborne sensor data collected by ERIM, see Appendix :^.12) Fur geographic reference system, see Appendix B.13)For list of organizational addresses, see Appendix C.
Sheet ^_ of y Sheets
Site Name Site Location Fltght Index Da-a Acquired:GMT Hr:Mln Ma or7
Discipline
No. of InstrumentImagery Bands
Date Ttme Start yto UV VIS NIR MI FIR__ Po[t Huron-Port ^ylslg______.. .(seE . Nuroa. .^,4untY .._-._ _ .._.
-...- ---^.__. _
___ _..
----....___.. .. _ _......
_T1f11.S41a G4a4tY._-_-._ SltltMtt...6.±Y -_--.._-.-__._._ ^isst . Nucon . Cotmmt^-- ___._ ___ __...._._... _._....f.._..
.. _..-
Vs ur^o Count__.._n_.4.- --- ._.._1...----..._..----^--_...._ .SE Shore _l.^k^,„_Miog,^jaB,_,_-,_ --- _-._ -----..._......__ ___.-._B^_All ,<an CountYL ._ __-_
---- - ----- ---._-_.-.._..-
_.._.
_-
.. Ya^,O fenar CouatL._-..._.._^ . -- --.^_._-, .. - . -- ... __
_Atln_11Ib4r- , ^_ _.^_ ^wl^r3.44-_.---___._- _. 2tltov77_ 1100 1912_ _ ..1927
_Multi 8 2 0
_^
__T____._..._._.___..__._ -_ ^_
GJCiN-1p0 _ OSJun72 10001000_
_ 1SOfi ..__ t647
1659 ►orset 1 6 4 0 It:JCN-1.9^_ _ OSp^]r72 IB36 Land tlaa 0 ^5^^^ 3 0 1GJCM-190CJG^1-190 -
280ct71 000 ^^1652 ^^73 Multi 0 S 3 0 1--_ lSSe^71 1643._ _ 2300. 2701
--
_Land Us^^
-'0 1 0
___-^_ (hIGN-190 _. 160et70 . 0900 __1445 1516 Porsetry- 0 9 3 0 ^__ __._._ CJCN-^q0__.______r -- .____,.. 160et70 _ _ 0700 .. 0817 0611 _, Pores_ try "0 0--. 0 0_. 4
- ^_^-_ r,f^.-.12Q-__ oswr^o i>oo _171 1e27 Huai o e 6 i l__ -. 4tl-.144_ _ 2wv69. 0 6 S S 1 2 .. Molt-} __,_ 0.... _ 7 5 1 1
^_ Cd^(7--].p0 -,__,.___..-_ 210c(68 ,. _170 __ 1600 . 1717 _. Multi 0 7 6 1 1_-.___ tJSN_.144_ __ 09Sep6t1..
22MS^68_130 .,,1000
_2022 . 2112 .. Molt! 0 7 6 1_
1G,1Gti 134_ 166 1815 Multi _ 0 7 6 1 1
_ - - 4,IStl=141L _ov_4? _14Q4.. _..16 1650.-- Mult 0 7 6 0 0_ -- _-._..__.._ C.)Gli-190_._._.._.__ __ 27Jun6) .. 13_lp __ .^81j 1^4e,_. Multi 1 9 7 1 1
GN-.1 90 ^_._- 1 r67 000 171 Multi 1 9 7 0 1_-... _
__._qN-134 _-__-
Gdlij-144-_-._..,__ -_c66
18floy661^
. 1
_1520,- 18^7^ .
1975___[200
. 2WQ__MultiMolt,}
1'1
0!_
0 1 1
__--.. 4t^l.______.__-.-_._.^__ 1.4Nov66 _ 1330 2027_ 1940 Multi_- 1 9 4 1 l______._-.._.. ^1.9L_- ^. 28A3r66_ _ l .. _.pl!._ _.!.fit..._ Multi 1 ! S 2 1
Cd.Gl-..__-_ - 21MlttZ¢. 1^Q0 9^!!,, - '
____
_N^i_.... ► 1t3-._ 1 3 0 0_ Sn? efN_ _^-___..._--._... lIM^6li
_ r66 .1000_
_1a a Mul ti 1 0 1 1 1
-- ^-_ _ SetSil..__ -- _OLa.__ Mul t1__Nulty _,.._
0 1 1 1- _ Shc._._ ^-__-___ 2[iS66 4 0 1 1 1
-____.. _^__.._ GdfT__._._. __-- 0¢.t^p66 _g(_i s a Molt! 0 0 1 1 I_...._lord Lek. - _ _--...___ __.__._... -GJGH __._ _. ___ ____.._ _ 16M1tt76 _
4 7_.1 7P0
n_ 2;2^
42)12 Nydrolo ty_
H dro 01.1
_97
1 0
^0_ 1
1cvvre: til roe ust of pUDllSneQ OOCUmenIS WnIC q U5P alrC)Orne sensor data collected by ERIM, Bee Appendix A.
(2) For geographic reterence system, see Appendix B.(3) For list of organizational addressee, see Appendix r.
Q^
uxI^;INAL PAGE LS
OF POOR QL7ALI'1'Y
.^

ERIMFORMERLY WILLOW RUN LABO RA TORIEl. rN[ UNtVE R51TT OF MIO HtC^AN
!1
TABLE 2. 51TE5 WITH MUL'I'1PLE CALENDAR COVERAGE AT OPTICAL WAVELENGTHS(Continued) Sheet -^-_ o[ ^_ Sheets
Stte Name Site Location Fltght Index IYata Acquired:GMT Hr : Min Ma orI
Discipline
No. o! InstrumentImagery Bands
UY VIS NIR M[ FIRDate Time Start Storecd Lalca . _ . .___.
-._..-..-----_ ......... ..........._....._-- .._.-_.---.-.---------_...._
JGLL -_-_..-.^_ .SrY ^_. 110013)0_0170Q930_
IAG92102 ....
_162_13Sd-.
1H59?)S7 . _ .1733------177_
Hy ro__ojy _Mydrolo`y .... 0NJ!drolosy .MYdroloOY_NydroloOX
__,__ ___."-7 . 6 . _0- -1--9+1SJ1_.-._._._.-_-.. _..._._..----.._-.
GJGIt..._-- --_-011I^y72_80cR716N1uj69
.0_ -. f ^ 0 1
----..... cJ )l_- _--. 0 ..0 ^
.7T^
sb
^T
1^-.._._. .—.-_._-. .ri..•1.G11 -_._ .._-_-__-_ 26Sa^6e 100 __ 1932 , __ 2305
CJCM___- __„_ 27AAnjb7 1300 . 1l76_ ^lll6_ ,^_Xydrolo 8-GIL._.----..._----_.— ls0ec66, 1130 . 1lS3 _2006 drolo^y. T_ _b; 6_
- _--- — G,1(ip--- i6 r_66 1000--- ni. _. T-- - Frei_ 1 i_--___.-._-- c^cN...-..- -. 02reb66 1400 1112 1!1! ^
.-.----._..------- Q,1cN -..._.__...___._..-..-_-.-__- 06Jan66 . 1000 _ n a n •N^drola^x .N drolo ^^
Gaoru lrarw _ QI __ OIMa^72 1130 $10'! -. . 3i Iroiei^.-___ .0,lgp,,,--- 2lOee71 0_9'70 1662 i-Tim! ►orii^
wu... -. -__-- 0^--,---,--.----..T—.. 22AuX66_ 1000 1Sd6_.. 2027 Land lbe 0__- ^@_ 2SJu168 0900 1517 1621 Land Uae
.- .^_ 6Aua66 1000_ 1677 191! Lad tlu tix,01{, 21Ju166 1200 1619 n^ I+ad Uie 1-__ -
--.-- ,_„_,-_._ -
,GJCp__,__, 26Jun660414 66
. 1100 .1000
1670_-_165
_I.did bu- -----.-
----
—.---_ --nT n^+
...cic.'--.. T _
s. f..... eor .e[ _^s.--.__._- cJG[L- -----. 720Ner._7 --^_ .iolo ^-Isle ie^^ ro:..^. o T T
---c,1cN__._._._.....- _..—.— ._ 160ct70 0 .900 ., 1115 1516_, lorNtry__ 0
--,---.--,-.,-_ cN.—_-.,-,-_---,-- 160ct70 0700 0817 _ 06i1 iotntry a ^a—, _-., JGR -.-, - OlOct70- 1000 1S^S 1717 Iorest ^^0 ^
-_ tJl.- $45ep 70 _0600 1146.... ----1712 -cores-r1r 0 --
— .____-._._-- _.._.fiJGN...._....-.---.-.-.-_.-_-,^cl{_,__-___,_,--_--_,_
06Ju17026Noy69
_14001000
, _,_1136_„1530
_ 2019___1642 „
. cores[Tons_^r _
0-b ^
_^ _3_
_-. .f,1GN___._.__....__. llllut@4. ^.19Q 22p o71^ rorp-try_ _,_ 0----.-----_--__----—___.--.--...---_..___.._-.-....-..------.--------. _
_ —_-..- -Sa•••.^riald_Yooda ...__.-.._._..__
GJCN..__...._.-..._._._..----.._.-_.._.....______._.r.1cN_._..-____-- ----._GJGII- ---_-..-.
.1>/!uj69
.44.44RIEr .S?.._1444
_OQ00 . _..44.x_
}x. 331358_
ZQ
.1500... ►orat 0 S 1_ 1735 _
7 7_►orestry _„Torest
o-1
39
3..7
10
--^
GJCti__---- -- ^BAp^. 1.__ !._. _^!_ cores[ 1 9 S 2c;JGN __._. -. _-.. __...-_ ._.._-._....^:JCN
oSJun7216nct 70
_1400_0 00
._ .1.50.5144
.. 1.632 _1516
. toreltr7Fores[r
1_0
69
6..-7
_- 0 - 1
NOTE: (1) F^^r Its[ ^tf pubLshed documents u^htch use airborne sensor data collected by ERIM, see Appendix A.(2) Fur geographic reference system, see Appendix B.13) For list o[ organizational addresses, see Appendix C.
Sheet ^^ o[ ^_ Sheets
Si[e Name Site Location Flight Index Data Acquired:GMT Hr : Min Ma or1
Discipline
No. o[ instrumentImagery Bands
UV VIS N:R MI FIRDate Time Start ^-, floc le ^ —., _. c
0700b106
0817 - ^^dS2S_
__^^^061i^^ ^
_ .. 053!”
orss JioiNtryToresiep _.
b^^-^_._ b._0 ^a-__6
o..._z
0--.
T -___._._. . -.._._._.-
GJCN^^ _. _... ._...._.._._..___._.._._.__. 6oct70fbocElb -
- raCN- -- _ IOt: F7b-_ ibb0 -iT7S- ITIT- Toi^ifi7_ D 'B' TOJON --`— ^- lSip70 ^ ^ -IIZb- ^ - T713- oreic"ry'"^ ^ -?
- - - -`---- - cJCN _.._.__ -_- ugM O1T0 _ _ -Ob3T" ' -0L7T rit>ry - -_GN ---- -`----- SrCug70 L000
8900TSlS I70S. Toieikr^"- -6"- ---—^.__.-._._-..___._. -- 0,1011 - -^---^--- b77uf7b e7a- e a orsstrj _ ^
C.ICN u Tb 660 - - -30IY" oiu ry 1-cJCN Jun7il
6Nov0700-1000
^_ 759-_ o[iTiy - T-GICN
_oresi-iq' T__
_ racN _ ugb9 2Tbb 3f9 a3Ii' oreatry_ - _- a:1CN__- ^uTbi_ blb0 1300 oiii-E'ry-_...---.----
GJGN Au[d$ 0l70
_-1358 orea[iy T
CJCN-----A rbP_.. 1 ^^ n a ^^ - n s onTtry
^ ,of M ^San^cal Gardens OJGN OsJunT3_ _ObO^ --Toraatrr -
-------- -__---- each.--_--._--._.. o^iTB2Nov6d_ ltovbb^ -1Ju166
lo0ffIi00-TITC_-- 1200
-I333” "17I1` Toiatiy" ^
Yhitwor[_Laka _.-c.lcei --eJCN---- -_---OJGN
473--^..
-3023_nTa
or•i^ryAuTtT-
It^r
--
cacn ------- -+--- 8A^S6 1Ob0 - n a n7i'- ltu7ti'
-----O.1t01 Feb6b- b0 Tt^-^ ^ff"OJCN ------ Janbb - o • nTi c
-^l i ttaksr ----- -----c.►cN.__, b^u1-bb ^idOb ^biT- ^,Tii'"---- cJON -- ut6b _1 id'!7-
_n!a"ib;IcT--_
t -Sr----_-- ^^ ---- Jul^b -
------_Tpsll^at1_...__-.-.._-....
G,ipi-racN,_____--
iJun6b-2€l+.eb!
iiiclub
-ib3b-_^ -.__. ^ _
3318 T636 elict------._----- C,1cM __-- -- -- 2§AuE6 TOoo_ 3iD_ _362T
cJgt 3Ju168 0-'35b ti_
nv"1't5: I t / roc ust of pumisned documents which use airtxirne sensor data collected try ERIM. see Appendix A.(2) For geographic reference system, see Appendix B.13) For Its[ of organizational addresses, see Appendix C.
i
GOAL YAG^ 19
1 YpOR gUAL^^
91

LERIMiORME RLV WILLOW RUN LABORATORIES. THE UNIVERSITY Of MIC NIGAN
TABLE 2. SITES WITH MULTIPLE CALENDAR COVERAGE AT OPTICAL WAVELENGTHS(Continued)
Sheet 25 of 32 Sheets
Sete Name Site LocationFlight Index Data Acquired:
GMT Hr:Min Ma or1Discipline
No. of Inatrurr.ntImagery Ends
UV VIS NIR MI FIRData ' Time - Start gto,.. v ^._ -_ _ _.. Nov.___, __ 100
170010001700_
191_1849__ ,.
._ 127__2225_
19 ,..1859 ,.,.,179 __2312
Hydro °_iYNydrolopr_It^drolopr ..IlYdrelo^
0 _ 7 ^.-_ 0 1__Dstcoft .^}vif._..-__.
GJON _
^^...___ ._____ ______13So17T1,OApr78 }__
1 .. _^..!
?1
_40
_._i -
C.Ilti 1WYr7^_.._.._._.^_...__^-_. -OJCM _ _- 13A^r73 1100_ , 1^2t _2041 Midrolog 1 7 3 _ 0_ __-
- -_ ._. _.----_ - OJG11 -0JG11-__-__...___......-...._____.. 23Mar7312Jao37
09701100
1526-._ 11I^ ...
1614_ ......- 2022
N rol74 °a-rol -7-_. _.^-. ^ 0
-_--.-....__,_--- GJGII_ , ^ 10Jm73 8900 ., _ 1115.- 1640 drol--...-- 1 - 3 0_G.JIAI _._____.___.____ t9Au(72 100_ _192e _2151 Nydrolo^_ 7 3 0^_--_.--_.._.,_. ^^ -
1'3Ju170 1300 20T0 trR^ Uao__.._ OJGM_ ^^ ^
_USMar70 1100
1900__1701 1823 Zdrolo^
_0 1
CJCN. _ 26Mov69 .1000 1330 1642 bY.drolojX _0 6 ^
1___ _--_ O.ICN .--____ - 20Mov69 1000 1610 ._ 1723 drolojL 0 9 S 0 1
.. OJGM . 13Au869 .2100 -27___O< OSOS_ ._ NLrolojY_ 0 ., 0 0 2 1^__ GJCN 1 3Aua69 0900. 1620 1658 l^rol^r__ 0 9 S 1
__- - OIQI_-___-^_____^_. 22A 68 150 _2014 . 2023.-_._ dcolojy 0 _ 7 S 1 0-__^__,__ G,1GN _._^.__-.
._^06Ju167lsw^66
1000i^7o -
1605 1827 NzdcolojY_ 1 9 '-!- 1 1-'- _-_-_ _c,rca less" zoos x,^e-ro_-io^ - Z_ _ 0 1
--- --_.._- SSi.sijl3.E.^.^!52^f_^.4._...^13..-Yy^g^ygAlroort__-.-.___.
@JCII _---,---_...-_'_---____---^S^e._N^ee^_ CouetYl-._.._.____ __._GJCN ___
14Nov66 .
020ct74
_1330
1000
190 _
1455
_2027_
1609
NYdrol^.
Mult!_---
_
1-
9
CJt01 11N^r71 1700 22TS 2312 Nult! 1 9 1 0___ __ _ __ _
CJtal ^ ^^ ^ 20Mov73 1100 1912 1l23^^_
Mnit1 _ 1 - ^^8 0--__.._.._-------...^.__.-_._._-___._.._.._.._
`---_,---
^^ -'----- _ 06§ep)7_ 3000 -138 1600_ -!lull! _ -0 6 S_
0 1CJGN._.__-__--_...-_.-_--._S,1CN_-- -- -^-
O2Aut7) .251ua77_
1500lO1S
_,196_ ,_^19_ .
.,_19Se_ .. 1924 .
MultiMulti.-_
0_p 6 _ S__ 00
1
- -.--.-.---_. -0?ON__.._._.._._-...---__...-.-... 21t1^ir77 _1000.1^_1330
145 , _.....^SO_i_.
2 02
_ . 1350_ ._}i}9_
2157
Multi-.-_Mule!____Multi__
11
_0
7_6
!r
2 ._4
1
000
111
--__._._..-..._^_....___-__.._._..-_...._-_----_--.---__.._.
SeJO!!____-._.__._.--_....___-..-.----...G.1§N _^.. ,_
4^! u ?_06MU^72 .
_ -.-._.^..- _ OJO!!__--_.-__. -_-. 28octTl^.lArz.L71
0910 . 1632_ __1733 Molt_}_` _0 ,_ 8 7 . 0 1_......----._.__.... _..._.......--- _...__.._.. GJGN__.....----...___...-----...._..._ .._...._ }600
300
122 ,1 00 2040
2002_.. 101 51_.._...f
1_..fi
.9c
...-
i
0. .._1-t
NOTE: (I) Fnr lest of published documents whuh use airborne senwr data collected by ERIM, see Appendlx A.12) For geographic reference system, see Appendtx B.(3) For list of organizational addresses, see Appendix C.
Sheet 26 of 32 Sheets
Site Name Slte Location Flight Index Data Acquired:GMT Hr:Min Ma or1
Discipline
No. of InstrumentImagery Bands
UV VIS NIR I FIRDate Ttme Start StoVlllw flan A1[oort__.-.__.^..
_____-^ _ _,_._-__ _,___--__^_ _,-_._.`___•,_-„^,
^GG,TON __GJOM --._-_GJI:NO.1l:N ^- ------
20Nov6903Sep69 ,03569OfAu8691211ax69
1(100liQO0715
1610,_ 1625_
1321__
172J. 1778_ .,_1520 _
Mu t ..___ _Multi ___Mu1tf . ____
0_0
.9-_7_
7. S
S11
__.....11,
0930096511001730. _1000
1358I11S
-1610'_, 2022
1508
1738___ 1512_
1650_2112_2023
Multi _Multi ^Multi -"Multi -__ ,Multi
0_0 '000
^ 7^^_^
/^
S_ .5^'6
6
1 1_T
__.._____...._.-_-`_-.._.-..^___
OJCN0?Q!._.._. _-+___CJCN - __
26Ieb6909S^p68.22A^_68 .
_1
1^
OJ011 25Ju168 0900 1513 1624 Multi 0 1
~^^^-.f..._._._.. ^^____.._._.._.^._--_..-.__.___..
GJGM22May68. _.08NOV67
_1000_1000
__ . 1646 ..1600 -
. __18151650
Multil6i^t! -^-- ^ 0 /
10__
______.._- __- 0,1cM'-______.,--_--^_-.. 23Auy6i _1700 ,__199® 21]6 _ Mult! _ 1 9 1GN 27Jun67 1700 1647 1948 !br-ltf 1 '9 3 1 1
_ G^GN . 15Mar67 1000 _1120 lI1S Multi 1 9 3 0 1-__- ^_-_ -__ 4Mar^7_ 43_7_ 1735 Multt,______ 1 _4 3 0 1
_ .-.-_. QJGN .` __T-- 02Maz67 ,;000 1710 1848 ^Iti_
1 9 3 0 1_ -___._.-_-_..__- G^^_-_..-._.._.-_...___.__...__..^__ 15Dec6fi_
22Nov66,_1130_
,1100__1837
_+OOS_ Molt! 1 0 0 1 1
.,I^1 _ 1935 2025 Multi_,_ 1 9 1 1 1,--- ^.,[CR^-_- 18Nov_66 _3300_ 1935 _. 2010 Multi 1 4, 1 1
-._.._^^___-,^__.-.!___
GJ.C.N...__.___._._________-.___--„_„Sn!S^
,16Nov66_O1SeQ66
1330_13Q0
1940_. 2027 Multi_ 1 9 4 1 1901 1940 loras^tn I , 9 S 2 I
--___ ,_.,- - _t^_^•i 30Nuj66. 1000 1535_.. _ 1611 ttultt _ 1 9 S 2 1-- ___.__ 5^.._.____^.-_.__^.__.- 2^Auy¢¢_ ..1000 . 18.37 . _ . __1^.. Multi__-. 1 9 S 2 1
__-,_-_...__Y_._. _ __...
^- _
. fg--, _GJG!i..-_,_,__._ -S.J@k-_^ ^---_
2 Ju166_25Jun66$f^Er66
21lf^r6t,_Illur661►4r66.
02►eb66
121100IOOQ_
_1100
.444__}00,)Z.......g/^_.
-"1^ ,I63Q._
._ S._....X30_.
-_
1^1^R
_A.9____R^^ ,__Q(f!-
Mulcf -_Mult1Mu1te _Mult!Multi^3-...____
_,_^1_ .
_1 _1
... 1
" 9091
00 .
S2S311
_222011
1110_11
__.___...,_..-_-.__.._..-- -__.__._-.__
GJ011_„_-__.-._._.-_._GJ@It __________^+.._-..-.^_
_ --....._ _ _._-^.._._.._-... _..^. ___.-.._.-.__._. _._. ._...
Se7L.__ _ _SiJ.reN.__. 1100 1,7i 1 9 Mult 0 0 1 ^l 1
_GJGN.____._.__._....__._.._ ---__._...._ _ Q¢.jan6¢ 1000 .- nj^_ . q/S. Mul[1 - _... 0_ 0 1 , _ _„ 1 1
NU"PE: (11 For list art puhlrshed documents uhu h use alrtxmne sensor data collected ny ER[M, see Appendrx A.(2) For geographic reference system, see Appendix B.13) For fl:t of organizational addressee, see Appendix C.
92

RIMFORMERLY WILLOW RUN LA^ORATORIEf. THE UNIVERSITY O! MIC MIGAN
TABLE: 2. SiTES WITH MULTIPLE CALENDAR COVERAGE AT OPTICAL WAVELENGTHS(Continued)
Sheet 27 OI 72 Sheets
Site Name Stte Location FLghl Index Data Acquired:GMT Hr : Min Ma or1
Dtfcipltne
No. of InstrumentImagery Bands
Date Ttme Start SYo UV V1S NIR MI FlR
Monrw Couoc_.._ —..1! —..-- —----..
._....— —..___—. __^. _.__.—_--.GJVLt!L_
_._ --_ __237br73. 1000_
i400
___
150
__..
}{20__
..__. _...._
tf^rol_
.. _
1_
-
^
_ ..
S Shon lab Ontario ___^=.., aJLr^lgzw 31,mv3---- ia3 227• rolop..
roles!.,tt^dr01^-
t : o i____--—_._.. cJ%e to Ili
.-'-^-^---'—'--'-----.
OJuR72.. ^...
ONS 133 -..__l._..._..
472_^_.1..__.
_1-
_^0
00
HuuuCoua^..-.-----'---'Nw! Yor. k_Mf -----._.-ILIALiprl^-^^--------
--._._07A1r7707A^r77
_._.1700 _x•00
1K1 _1^^1
_ --1547
._._......__._drol 1 2 0_ 1_--__
IUAL^1'L-1^— Nzdrolo^_
1
_• 2 0 1
'— NJ•L-1^iustrf
__ ._
—^—
r^3 1300 - T N^drolog 1_ __.7- roi
Ili.jr: Couoti ^ _- -^- -^- - -- -_ ...^-._--S Shoritab_ Ontorio - ^8« lloare^ Comte__-.__ _
_.
Orlun^ Couatr , _S Shora Lob Ootfrie ^^lbnrwEoi Count
OweRO Cowtz_S Shon Lko Oourlo----.-------_.------' ^---.....---- --- ^--^fw Moores CouftZ_
^----'^-^--^------— A----
^arne CouetrS Shoro IaYo Oetorio •oo Iberoe Covet
_ _
IIOKt71 DAEOTA —. .--ioater Coup1-_ _.._-._.. _._.
Moodrortb ,. ___ fEEC,i•i1C-216.__ . 02Av1 7 0870 1, Orr MOt__ 0 6 S 0 1i[EC^iEyiC-216-- ,-._ 32Max77 0770 1]16_
1.79_1533 t.re_M{t. ^ _'^_ 0 I_.-_._.^._..-..-..__--_
.—_-.^...^_-... __._iOC-t14 _ 26Ju132 100_ _27,}0 iSQ7._,_ Caf^_.l^c,_ 1 .J T 0______. - TI^C^Ce_216 _ _.—.— 19M^ rL72- 0730-- 162 - 1840-- Gro, Mac_ 1 7 4 0
-I
----------------._-._.-.._---.._.....^.`__
^1tIG,GC_216 -------_,_--11CTCiCC-216--------,---1gC,GC-216._._....._..__—.
71Ju170_31Ju170.I7l4Z70
2170_ .0970 ...0010_
.0601..._..7}N-_
. 0710 ._ ,.
07tH ..-.1619 ._..0816 _
Cre_._l^t._ 0 0 1_„llLt..
cw._IIL._0
^._9
_06
_ S__11
1l
__ __ _._. _.-.__ CKPC,CC-2;¢^ _ 22Mar7.Q. 09003
_15)7 _2
1,7}2 , _. Ore_Mil:... _C 9 ._4 1 1C- Ma 7 1
NOTE: ( 1) For lift of published documents which use airborne sensor data collected by ERIM, see Appendix A.(2) For geographic reference system, see Appendix B.(3) For list o[ organizational addresses, see Appendix C.
Sheet 28 of 72 Sheets
y:
.
Site Name Site Location Flight Index Data Acgwred:GMT Hr. Min Major
Discipline
No. o[ InstrumentImagery Bands
Date Time Start Sto UV V1S NiR Ml FIR00 ort -
Kidder Countz-_----- --_Yoodvorth _
-----7>I-.: ^ofur touRtT------ --_...__.-L_ -__ --__ --'---. ._ --^StutaRa_n Cowt^ _-- _
Hoo rc - -----• la Counti
-fur ^ouety7-
rt _ K7oiiir tL____ --- - - ^.-_
- ---^-OK-LAtgIIA - ^-- --- ----_Johnton ^^o^ue^.-_
Mi^l^nk ^_-_-
iJJEJF^7^—iJJEciJiE , GF _
--^
_ueuR
31200
^
_11 _O1T_
^Cwlo^ . l 4
0 A4
___
—
iJJE-178^T'JJE-17^ _
6Jun70^-un50
0900 -^^OS00
141^^10^- -
1537
1, 14 _Geolopr_Caol^__
9 1
11
-- --—__iJJU178iJJL-17b^ ^
-- ^-
-^--^^ -
2SJun70un10
24Jun70Jun 0
27Jw 0
0900030015001001370
14711052__
1616 _1200^^
l.aolo^-_Ceo-lo•y ._
1 9 3 0
-_
-
iJJE-173-iJJL-1781JJE-178
20t
IE70
'22201f o
Golo^Ceo _Oeo
-
9 0
-^._.—_. _ _._..__ —OEirpf _- -
Clat^op CouR)_-.tlwport to Artorlf _-
----- ---- -- __.----Coof t:oilRtL-- _ ..-_
•rookio[ to C000 •fi—^___ _ _—_,^_`.-._-._ _-.
Cur Cou c
--- -_OJLQcDtOJtlA ,RA,IC)l.JA ,7^^Mlt^^ _
DRLA L• G KE JA Jl IN 100.11!Qa_._^..^_.__^__e.rt.-e_.^JI.QLDQdiL•EA E^JAEJD [tM^1S
DJNT- , Jiat^LialLJnt1AJK^tUiL11D.1Ni,JP,t2,LllA1Xf^JN c Kt7 cLl1^0.TIlp^JP , IR,Li 3 OJIt1I^JN , 1C11,LN
ep .3-Se ^
0•Jul•9-Se^d9
15566903Ju169--
133009001170-lt>DO-30451400___._
-f1^T- ^ .S _
TiT7----.- _^ib3S-19062257 ^_.. .--
'FITS_-...1S3b ^0003------2059
-1__-000___.-_
Oceam__ .Ocoi _--- .. _ -._lXwno)(__OeunoOceaaoj___-
1 T_
T4
-
T-
r.vaa. tai rvr use v^ puwienea aocumemf wCtcn use atrDOrne fenfOr lrA[1 COIIQCted Uy ERIM, fee Appendix A.l2) For geographic reference system, see Appendix B.(3) For list of organizational addresses, see Appendix C.
93

RIM• ^RMENLY WIIIUW NUN IASO NA rORI[a. rME UNIVER61Tr O^ MICHIGAN
TABLE 2. SITES t4 't'I'H MULTIPLE CALENDAR COVERAGE AT OPTICAL WAVELENGTHS(Continued) Sheet zn of ]2 Sheets
Site Name Site LocationFlight Index Data Acquired:
GMT Hr : Min Ma or1Diaelptlas
No. of InstrumentImagery Bends
UV V1S NIR MI FIRDaft Time Stn-.^ryoltt nao _1Q._f841...0.fY__ .l1Se44l. _^948.tZ __
. _.._. __ _.4^!4,^^J4,n,^^,!^4,.^ -_.
__..
2as^t _ 1]00 .>SOO
-
_ tiiiflit
.
2^ii1oi3s
K^ieeS -oe.:.^_ :
_f .... .^.T'" -
3 ._^suAlAS__C491ttY _.. _ ...__-_-lwrchlslMl is tlar•orc
.T .i___I-?^!4,^ •^d►,ioq,_r3,ta . l.r lsa^A9 ____^.^._ _-_^
ttr<1 IR , /. ^ Ji _W^ ICT LQi l,l' ___. ^1_.. 1'1L _x'32__ La►!!4t!!►l^^!tR4^^^llTr ____
l^s 6!^. a^00_. li^S- 'f63b _ •^f._ _^'- i_—, _—__—^— ______ uli9 115b -1bff^ 3^1T- Ness• _
---__-
._li0lSRltafS-_.._..__"____-_._ _..-_. ...__-.... _._-._...__._-- ......_..__ -_-Jlaafhlaat! _t4 S^ t:mrtr )_ _ _._
--
-J3acsl0... .GSltnsx.. _ -.—..-.._._..-..__.-_._ ^ .__.. __ r_!xâ9r.E..[4_l4LF^!-__.-...-_.._._.^4.F.[11#11M)_54...f^4.E1._..
S••_cl^c^ _ couec ^----__^#uCount
.-__- - --- __ ^- ____._._.
111Laeak_SrsvatY___-... _----.----_._-. __-__-- -•-- _ ---^-- ^'--___1(elQllr t co Astoria _.C}^4lop Count7) _.___._ _ __
341[IU_DAK4TA.._-- __-_.- __ _____-. __Luuance. _Gnt+ngt-----.. ^.. ______.._____-_.
2_SM•^72 11]0 1139 i _t!,I1^1st_. T7^b-- FOTNt--._._._._..._. .--- [,11^14^...--__....______
hI^L^Z_____...._.-..__.-__._2SM^y72TMY^T2 ,
07iS000 ,
1^---1321
1S,_1525
on•__r1 --torNtrZr _
-a_
T-----.---__.
- ----_-.--. ?!^1l1-.^.. _.__d^.141.
22Julti9_22Ju169
Ol701270
1306_....190]_
16II-1 SK
lror•sctrorNCq 'S T
_-._. ^Qc144-_._.__^.^_^ 21Ju161 1170. 1070
2oS172] _
2 _1!21 _
Yocs^cri_.ton•
___-..__._._._._ ... -__ _.[714-14L. 21Ju169
lfi4-.#4L__ __..-_-..._ JOM• 6!29May6B ,29n.Ybs.^_LN.
0770 _ _.._..------_--.-. l4-1lt.__....____z^_-_ 100 791 __ 207 __ for6•t -._._ . _ _. 3 3- -.._._ _tIlS^141.__ ii7o
0!]0 „_#wr._ is_ss ror•^c T _ T---____ _
---_._ _-- _-...-- __-- __ _ _
hllSlrl4!__-.__.^_ -- _ 1321 . __ . 161T- ►oracrz- 7
NOTE: ( 1) Fur list of published documents which use avtwrne sensor data collected by ERIM, sec Appendix A.(2) For geographic reference system, see Appendix B.(3) For Itst of organizational addresses, see Appendu C.
Sheet to of ]2 Sheets
SRe Name Site Locat i on Flight Index Data Acquired:GMT Hr:Min Ma or)
Oisctpllne
No. of InstrumentImagery Bands
UV VIS NIR MI FIRData Tim• Start StoTENNES SEE _ _._.__._..,-_ ... ____.__.
4144..1100
1^..__ 17 _ !w1t.1_ .._ ^_Tenpltss! Vall•r_ _ C,IR 9Cy . __.__.._ .^. llMar71)iepl0
_...----------_------ GJII,hCy^_._......__.. __ 1N 1_...-_ 170...._ !I!+_#4.1_-.. 0 _ `_ _;E.__Loudon .. Covn_d_... —...____T^nn^^se•_ V•11•fr-ll^r^_.4_4°9^1_ ..._..-----^E!E!. Y,J}#
4ee.,_sloust: _CoimtZl_-._^.^--_.__.._-....__.._..^__...._.._
(gN dame f1ol.et^_-. __^.
--__.
--____. ..
---
TEJGS.___..- ..-_.---._ ^ _- .... .._____....^--^----Iiairis i Chub^n CowtiN _Nowtoo ArN ._.-_ "__-fl^tlr 17^ -- 12Nor11 1000 l6SS 102] Multi 0 B 3 0 1_
'"r10to- 175 _ llsov7l 1 ]00 1915 __ 2030 Multi 0 8 ] 0 1
--- ,-"^.#Z^_ _ #ir^^ liitio -607 173_ Muic.^_ o e ] o_ .^,- _II'K¢^7^_______„-___^-____,. 09M•r71 0400 1855___ 2M9 Multi ___ 0 0 0 0 2
THK^17^________ _ 09lUr7 ) .08t4r71
M04_2000
0622 _ 0717 Multi 0 0 0 0 2- ___RfKO-1 7,x,-_ 0211 0741 _ !lull! 0 0 0 0 2
-__^^_ _, .PyKO- 115 -_-_ 0&1r71 160Q _ 2tM__ 2321 Mult -._ 1 9_ I 0 1._--.___.__.__ ^^11^._.__.-.._-..-,-_. 081Yr71 1200 . 1652 19M Multi_ 1 9 ] 0 1
^_ _ _Q-175 _ _-_ 0811^7 , 0100 412_- 152 Multi 1 9 ] 0^lAn3t¢SBunn _ -- --- -_ Sae M•nusl -_^__ ^--_._._, 114M^r71_ _^^ 1219 .. _, 701 „__. Ajrle^_ O O 1 1 2
..__^ FHIQj-_ , 071Lr71 OS #27s-___ ,^L3__ Ajric_ 0 9 ^. 1 227^E11_ #70Q 2014_.._
3^-001 _...1131._..
211! --1144..._.117_
AL 1e•.!^tris_^
. 0 _ 9_ 6 02
2.1_
— -- TMt9L__ __.t'tit41__-..-__ _.FH10t_._.._..-___ __.._...__- _.FHHtt.---^_._-._._^_
Q.2t1!att44Q},)un664>=1^ti44..3].bL4ldvnb6
1444140Q.
---__..__._ __
^__. _.____.____^_^. _.
Atric_ 2 1Rl^_ fat#sue..- z 1
fHIOL_ __ _...._-- LZ. AiFlf^ tl _^_._- -__.....YsaLcY _ __ ..____.. __..----
FNHti_ _ __ __^FHittl-07L__...__ _.___-_ _.__
_n ^
24tlaz44 ^ 42_ i_ 2 1QSt1sr71 _OSfO_.._1219.. 13Q3 _ Aaric. _.
c._tt 4. _1_
7__.1 .^-
NOTE: I1) Fur list of pubLshed documents which use airborne sensor data collected try ERIM, see Appendix A12) For geographic reference system, see Appendix B.(3) For list of organizational addresses, sec Appendix C.
94

RIM, w , .f.r.MERLr WILLOW RUN LABORATORIES THE l.'. • I .^
TABLE 2. SITES WITH MULTIPLE CALENDhR OOVERAGE AT OPTICAL WAVELENGTHS(Continued)
Sheet ri oI 72 Sheets
Site Name
• aco
Site Location
rxxM-01^ _- ^ _ _-- _ -._.-t'xMM-633-- -rxttM-6f3-_ — ---txwi-b7'F— - _
Fltght Index data Acquired:GMT Hr : Min Ma or^
DiscipLne
r e. _^u _..
No. of InstrumentImagery Bands
UV V1S N[R Ml F1R
^l___^ _s . ._2 _1.._
Natee
o2.1uns61Jun661Jun66
Ol.lunti6
Tlme
10001100ii6
Stmt_
tN>a ;.OOOS -1^3i -YT33"
Stu
Zi^i =.OBIf . ,-3i8i3
313 --
--__-__ _..-._..____-_- __-. Aerie._._.
wtrs^.tie._.._
I3
9--i-^
SS--'F-
2
^-
11^--.-"- _ . 6Sf ..__ ..-.
Fiv _di..
b06...
eTi -- n • - r e. l'
OSSO536
f3S0
-
Yi1LcLComt^^^^__4 ills v-
--^^- ---•--^-^---_
IHM--- _19NOt1-^--- _
- t'IONI ...-^--- ----
O^Marfl^tieTf
eE
_1fT^3^261i ---
_33-01 - A^rte.
Air eI-.;- r c.
-.- --. ►1NN 0-fJim66 1000 -^3T-- T--- r e.._._ .TTFOM O1Jun66 11100 OOOS 00 1 ALric. _ 1- ^^}INI ._. .- -.. 3-1Mi1r66 100-6_ .. n^i ^^ _ n • /l 1c. -^-
V INGINLA -' ----- ._--^- -Au uata Count
Boonton CJlU.MI 1SDae 1 1_
16 t9u ti_b-
.^--
^^!, -._^._..— __._._. la>K_ 7.0 2_:0o ao_o --
a:2 u_nlct _0 0 0 1_ ---.GJMJyMI r70 1000 ]SCI 1 Multi 0
--^ -' -_-^_
CJMJyI^ __^ ---,_-. 07 r 0 370 0 SS 0616 !Y-^! -
-.. _YASNINCII)N
_-_._ ..-._ _. _._____-- .._._
Crant CounterMoron Lab-- _ _-- ___ IS1tANaAC-207 230ct69 OS 1 1S 1500 _ Multi___._...-__
^ AC 207OIAN AC 207
420et69220et69
1960- 1130 -0930
O^SS _200
1759 ,_
0 S ___ .-_!W_It12^2) _IM1
MultiMulti
0...
0 36 1 1
NRAl,AC-207 220ct69_... _. -. _-___
____-.QAD,_AC-207 2SS^p69 1000 , 196 20^ __. _Multi _ _-_
NOTE: (1) For lief of published documents which w(2) For geographic reference system, see At13) For list of organizational addresses, sec
Site Name Site Local,
a_ountY..___--._.___._.__ .YSad tivar
--_ _... .DKPA
DKPAW fTA -_..__.._.--.__...._.--.-.----._-._..-___._...-^._._.__..
---- --__-._.----- ^A ^-.___...-...._
tiiti•X_-... -._.
.CAI^A^O► _.___.._..-._.. _..-.._.....-..._-..._.-
C1i1-273•..-___..-i N lhora^ca OBtario__Guel^--_ __.^_.__ G.1Kt^.^lR^'^39__.r
- GJLT ,IR-239 _-_ G.1Rl.rlR-239 -
CJLf- 239 _GJLP-239
G,)I?-239CJLP-239GJLP MP-239
WL1-239
NOTE: (1) For llet of published documents whlch u!12)For geographic reference system, see Al13) For list o[ organizational addresses, sec

`RIM _rORM[RI.Y WILLOW RUN i ABO RA TORIES THE UNIVE RfIT ♦ Oi MIC NICiAN
TAliL6 3. 51TL5 WITH MSS AND SLAR COVERAGE
Sheet _ 1 0l 3 _ Sheets
Site Name Site Location Flight Index Data Acquired:GMT HnMin Major
iscipline
No. o! Instrument!m er Banda X L
UV VI8 NIR M FIR P C PDale T/me Start 6
Mom Coua E -----`--^----'-ItJp_,.__-._—„^_-._. 0^0et71 0715. 1315..__ 1740 .. _ . Cew_lefi_ - - ...- A_ '_ t - -
---_.^__-._. Lllp^--__^. ___ OSOet71oloee
0'707 .loii .
1407 ..l^ii -
1735 ._-2033 ^
Gelo^__ ,c«ef^{T...__..
-_.
„_:._
,._-
--
_--
1-
1 11- _ ___-_--
s.iiti___ --..__. ___
i'^iebi oi33 i^1is ^1ii5 -. Ceoi - - - - 1 - -
Ia^_r.}il Cowt-_1.___—
^^.--. _______ _.-
^' 2 __..--.^_ __
^$ip
Ol0ee72
_oloo
OS00_1200
s f-____. _o'o1oJL'._ - - - - - -
1217 _ 1113 ._ .. _Golo^r _ - 1 - - - - -iJOL-002 303op72 2102 2223 Gtol _ ^ - - - - -
---------_.___._--_-_.__ tJ01-002 '-'- ^_^6JDL-OOt '^ ~
OSOtt 1 013 l^^f_ hb0^_ Cwof^_- - - -
020tc71 0650 150 171' - GaT^----.^^.__._ -- _f3T^L-00^- ___....--.._ ..__ -
L.l^t{-002 ,^__-^,—.--0}0ci7 0157 1657 192 GioT - - - - - - -^OOcttO 0730 160 - 1645__. Oeolo_pi ._
_t- - - -_ ^_.
61D6-007 _?10ct70 -0/00 1)1^_ . 1756 G^olojX_ _ - _
--------.-.-.—_ -n_ _^..- - -- ---_---._.--- -
Ocooeo Coles r74 0023 1223 180 H^ ^- - - --_ _ _ 1^gr74 0130 4-. 1^ rte. _ - - = -
itlRIAIA____r-_^n318s1vIl .SB4atZ_ -._.._
-.__ - _^Sr.L^l___v
--Q30c^3 0251 07_- 112 ,__ _ Ririe;._ . - - _- - -
-_-_._- --,__.._ C.)EL,- --- 13s^ 73 MSS 1iSS .1701 rte. - - - - -_^31^_..._-^.-^ 21A 73 _0100 1430 1ti20_ 1^r1e - _ - - ---.-._.....-__. _ - ----
_.^._^__-._.. 1;1^__-_- 7Ju J3 0615 1346 1500_
rie` - "1 - - -06Ju173 0900 1541 Is0! ric.
_.KAd^-.__- _._.__---
__ilou¢^^_--__-____
LIL!_.— 04A r70----
. 100 200 _2Tl'F_f--_ Cso off_ - _ _ -26Mar10 2300 OS10 0654 aeolo. - - -
NOTE: ( 1) For list of published documents which use airborne sensor data collectetl by EHIM, see Appendix A.(2) For geographic reference system, see Appendix B.(9) For list o[ organizational addresses, see Appendix C.
Sheet 2 of 3 Sheets
Slte Name Site Location Flight Index Data Acquired:GMT Hr Min Major
Discipline
No. of InstrumentIma er Bands X L
UV V1S NIR M FIR P C P CNate Time Start Sto- u^^s _oun Y______-... _ __ ^P_,. .._-.._ __-_..._. _..__._.__ _riq_._ . - _ _ _ _ _ 1_ .- -
/JRJ_--.J.--_-- 243ep69 0940 1440 --- - 1603 ric_ __ - ._- _ - 1 - -
--FiiCR1L`i0t'-- __-..__.___-_--3ay^oua`ky-"_-_—_ -iToriroi cawc ^-`^_ .
o^i.^ councL_"_.__.__
cJtSi;it._-^ .-_ _.23t;1T'__.-..._. _ - _
cJO_i;N.-_.-__-.__
_-..-.._
bi0et]Api<
i__ r7_ 3I3b1S_..oboo
..
^
-f73T' 1T3 Mu t! _ - - _ _ 1IlIU9i1 __ 2S1T""...
foie"_Mlifi! ^-i^ii1.-"
__f i_. -- ^
_-
- -- -
_.^^X°!..^0°° _^__- t2t,N .--. pr 0980 li X338 MuIt1 - - _ - _-_____..._.--___.______----_
^_V__.___.._._-_.--._.^;X._..-.---.._.--_-- 3IMa^7 Tp33 T3I3_
._ _.I737_ t1 _- - - -in73 3ib0 1 .431._-” _20if _ iiuTt?'^"- T
- - - -_.^_--.-._._^._. .^^^^__^,_____.___..__
b3•MA1_ ibb0 Y3iT -TN3b^- IeT- _ T-
- -- -o_--- -- -- -_Carter ComtZ____-___ ,.. TJiltt------- -
r3ee __-333ao37lSu,i7-
^_1300 _TT'S2_ _
^34-Ii
o'__.-
-t:_o ott7
-
-
-
-
- -
- -TJNE` .u'nl' 64b0_ fZi3` ..^Io ^. .'4^ - - -
-.- ---_ __-__-________
-___
IJMt:.__^ ._._
_^6_..--___.___._._^_..._...._._._
iJt1E
aJun-TO-, ^un70S.Iua70
0' 00^ 1^ Geo oU' - - - - -400
0500_ll3i"fb
_ _I3Tb
_LreoSo_..1^__
- - -- -
TJME -"-- Juq'!b 'i3b0 'F0
1723 _i3li^ osys -_
rJSS AJun90 1200 T42^ _ Oeofojry I 3 - = - -
.--^-______._.._ rtesrJ86-_^_fJMt;
23.iw1 ol^ct69Oloct69
Pl3bOfLS0800
ice-fI13-1300
"^r."-i^1T^3
0:oi^Cao3o^
ric.
-
- -
-
-
- --- -
rvvEC: li/ ror q 6t DI puousnea aocuments wmcn use alroorne sensor aaTa couectea oy Ett1M, see Appentl ►x A.(2) For geographic reference system, see Appendix B.(^) For list of organlza.tional addresses, see Appendix C.
96

^^RIMURM[RLT WILLOW RUN LABORA TORTE f. TM[ UNIVERf ITT Of MIC MILAN
TABLE 3. SITES WITH MSS AND SLAR COVERAGE(Continued)
Sheet 3 of 1 Sherts
•
•
Site Name Site Location Flight Index Data Acquired:GMT Hr: Mtn Major
Discipline
No. o! InstrumentIma er Bands X L
UV VIS NIR M FIR P C PDate Tlme Start Sto
rris EI,^----- -- --- -
_ Si►vr3 7Ayr7222Ap'i7711Iyi•T!
2rov7111Nov7111tbv7Le9i+:i:^I
b^^0^23 _.07fbIbSb160tf-1300 .100aocob
iI3--I53T ...._-Tllb" -I6S^ _
_ISIS-TiII7Tess _
TtiiS_..._
iIT--
-Tii--MuIENulty-KuIE3.-.-
- - -_-_-
_..-
_-
ttr^ci^37s-""._. __
- - =_ - = - -fHKQ-17S- -__ c s - - -_
Ka17S--- _ - - _ - _ -_^ !'NKQ-17S—_ -- IE2I -'30SQ -
It^IEAo7fi----
- - - -"'" KQ-T7S---`-- _
n+KQ-I"^--.. --_
rtutiri7s"
- i-- - --
__,_—T7lT__ HuIFi- - - - - - -
--- zap_ 1(uI - - - --- -_ KZ^I7S i--^
tNKp=T7S -----ODl4i7TO^7IOBfii^7S
0000"2006-1606
"062L_.._
OSiI _ItT— - _ - - - - - - -__._ - t13i1- xuIFi--- - - - - = - - -
--- fitKQ=I33-- _igtQ=T33 0&Is^r 1
08Ft^i7I72Ob-bRbO-
-TiS7-"2"-
I1iII uTtT- - - - - - -_
_Tloio--f23 T33I" - liiaTf^ 7 - - - - _^_ biAi 7I iIII^ - - - -
a.vr n. ark r aaea va t.aavaae uasa. uaucua ar^ua.Il aal uur ur ^runur tlalia Cv1leCleO oy Gtt1M, gee Appenolx A.(2) For geographic reference system, see Appendix B.(^) For list o[ organizational addresses, see Appendix C.
97

^E
3.2 TOTAL LISTING OF EARTH RESOURCES DATAAll of the flights for which ERIM has retrievable earth .resources imagery are listed here
this section. The sources of the ima8ery are the M7, M5 and M1A1 optical scanners. and theX- and L-band SLAR system. The imagery is listed first for quick reference by missions and
then for more detailed reference by individual flight. The, missions .and flights for each sourceare grouped separately with both listings in reverse chronological order.
^' 3.2..1. MISSION LISTINGS. ^^ The missions for each imagery source are listed by (1) the time period of the ±'lights,i (2) the mission title and NASA mission number if one was assigned, (3) major scientific dis-
cpline, (4) principal investigator (PI) who rnade use of the imagery, (5) his organization and
(6) data collection. contract number and agency. Organizational addresses are fotmd in
Appendix C.
The PI and published documents .are the sources of the sitedescriptions and surface . con-ditions and . measurements which may be required to support further analysis of the. airborne `sensor imagery, A reference list of documents which made use of the listed data is presentedin Appendix. ^..
The missin! ► ^: flown with the M7 multispectral scanner system are listed in Table 4. This.
system became s-,pa:^ational in June 1971 and is still available for data collection operations,providing twelve :.,^aeL'^;.^bie spect.rai bands in the ultraviolet, visible and. infrared wavelengths.
^
The .missions flown with the M5 multispectral scanner system ;:re listed in Table b. Thissystem, which first became operational in January 1966., was retired from active use in Decem-ber 1971.,
a
The missions flown with the M1A1 thermal .scanner system. are listed in Table 6. This sys-
tem was first operated with magnetic tape recording of imagery in 1968 and was, retired in 1971.
The missions flown with the SLAB-system are listed in Table 7. This systei,i was first used
for eart4i resources data collection in 1968,-and is presently devoted primarily to earth re-sources mapping. In 1968 it had only a single imagery channel at X-band frequencies. In 1969a second X-band channel was. added to provide both. parallel and cross-polarized imagery.. In1971 an either X- or L-band capability was adder(, with dual . polarized recording. In March 1973the current capability . of simultaneous operation. in both X- and L-band was achieved.
{ ^.
4
Y. '. ..
i.-
L
^FF
^,
1
-•
98
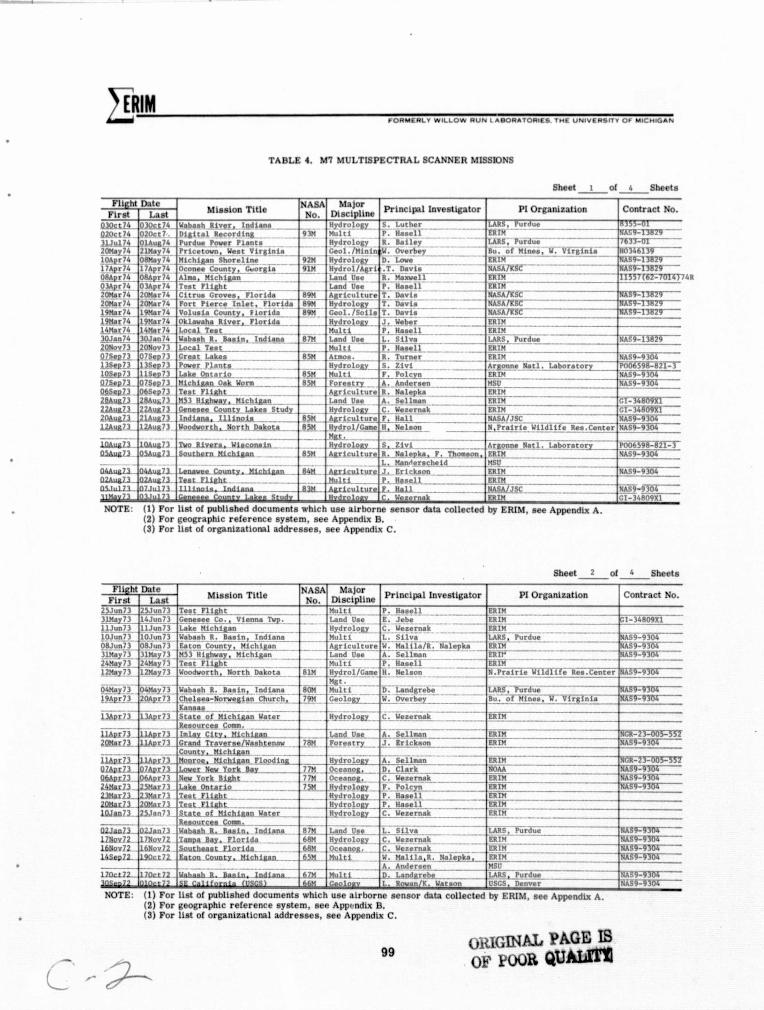
II
RIMFORMERLY WILLOW RUN t ABO RATORIEa. THE UNIVERSITY OF MICHIGAN
TABLE 9. M7 MULTISPECTRAL SCANNER MISSIONS
Sheet 1 Of 4 Sheets
4R
•
Fli ht DateMission Title
NASANo.
MajorDiscipline
Principal Investigator PI Organization Contract No.First Last
Q2Qg);^4._..
4T4EIL^ ..,. c[74_
020p^^_
2IM^Z76^_
MAEP^h R}yer^ _ Ind1uNtlijltal . Meordpj ..._..-- --►urdw rewr._►Lec._--.^rlePtwR_ LW^t Yir^laia
.,1111
_..
NydrolojyMolt! - _--RydrelogCaol7Mlq.
S: Luthert. Rawll .. - _R. aalfaY -• ^^-^_ '---__
LABS, ur ueERIM _.._.__. ... - ....--- ----
-9=I78Z4.._.__..
31,8t11^. . 41R.20tYi71 .
LAR$,-7n^w----- -DT"du.TMiaA/-71. ^qi6^ _ 33bIT^-
l0Apt76.17Apr7108A^^__
OdU-=7^17Apr71..._..pr^03A p76 .
Mies 51ar^lin^ - --OcoaN Couot] . Cwr^^_-AIY^ . M1th1.j^C ...._......... _!N t 11 [
-
---...
.__..._._.
"
Hpdiofo11p^co1 ^Lind Daa -..Land Uw
D. _Low -_....^. D^^fi _...f....11^awYT-_-.R Bawll------
-
^It^fi--- -HASx^I[I^--- - --
g-I78Z1^-Sg=T721Z^-
ERIM ..___--...__..-.__-__3S7rb'f-70I3T
03A r76 ERIM -- -- -- -----`2011ir76 2olllir7l -_^yCitrw^Crmr. Ilu^tda e!M tieoliur'. r: Dori: MASAT^^- -I78I9--ZOIY^7619wr7^.
2 oegr7l19IYr76.
loci ^^ie%Inl^t,_Ileridavolwi._counti, tloria.
!N _ .pZdcolog -c.oi:TEoti.
Di^^^---._._S^/R3^_- _^__. A3g=T7SZ4-
r:^^Dovi:-_----..-'._..._. .^^._._. .._ - ^-
19t[g7614M1r7t! ....
1.plISr7^14^r7^
OL^!!lt^l! _^.^rlliL^4F^1^-._Loe.._ _^T}.t!_ .__.._-__
__. _.^.__...._
^T4^?17CMu.^J^....._.._.__
^r^wl!r-'---P^BaNll ---
LRIM__--_._ _ --... _ _ ..-..LAIM-----'-_
_------_--_--^
30Jaa76_ 70Jap7^_ . WA4^R___Raa^a.. Iadiaaa qM _ Laad . ON L. Silva L1RS[-hrdw ^ NA 9-13'[9_jQNov7^___ 20Nov7^_ 11...1<llt.E- .. _- Mu1,1,^.__._ P. 14N1^--- _' GRIM--_,--
^ - -^------^-07SSp7;l_ 07S^p1^__ C;^[a .,_I^l._-..- sSM ACfo^._.-_^. L.,_hrn.r LRIM_
NAS9-9304llSlp^ _ ,fQ,^^7.^...
3$^p73 .13lg7
Poy!£._r.^i4tt... __.-......__._Ii^Ottar o -- - ^ _
. X^!droloj^.Nu^^,-
5... Ziv1 , _ ,. __..._.._._.__._i. iolcro
Ar_^anm_Mat l. Laboratory- P00-^59^-821-3---ERIM NAS9-^__
4.ZS^ttll_.. ZSaRll_.111t61nR._4sls_L+QII!.--- ° ' i aatn .-.. A.__Ao^^^a^n -MSU '[email protected]
9G Sey7^ _2SAUi 7 .l
L.ll4...I13fh.S_.__.._._.._.___.._._.__^_lI1RM_!Y,_M!;ehiaaa _
__......_ l^iTicultuc. R__II^I^Iu.._-- --dIIM_._.---......._...._-----
-, land ON.__._ A_Sallgn --
ERIM_
G'I-36gb4xi--7.3AL^t?I_1pA4ltZ3._.
^^AiFR .7;l.._LA.ut7.^.
...^lfl.._CQYP_.tZ_.^l14!_!_ StudzLp4.IRRa,. 1111n411...-.--
__..._
..._.
.It^dro-offAtr}^ulcur.
C._ Wa^ro^k-i _. Ii^ll _-__
ERIMNASA JRC -._..--
CI -3^`NAS9-4^TOG^_
12AY[73_..---
IAYt7i...._ ___
Noetltw.r.tlt._It3.Ftlt.-Ri+IsQ4!... _..... .___.__ _ __ .- ._._
ems........
ereroijc::.Mat. _...._-
M, INIwa .._ _-_
N.tPr.trt^_ 4t1d11f. b._Gnt.r NAS9-9^Ob__
1. 11w. . l1YeLR, Yiacoaaia _- _. ... L414RY__ i1Yj- __ __ ___
A;iaa^a Il.tl. laboratOn P006598^21-^pyus72_ . w^^.f... .__. .._ 4ltYF _'--Mttb!l.I^a._En..-'1Lorwi dIIM MAS9-9306
t14AusZl.02AURL7_.OS.1u123 ._
OAuRl3..D2AuRI1 _DIJu173
7'i
Leaawa Countl[. Michiva ._Teet Fli;ht._....___..__... ......__..__llllnois, lndlaaa ... _
.a - ^ ud
.!!M_. ARtltRlttir! ._ _^rlslEl94._- ERIM_`_____._._.._..-__
NAS9-9304
@ 3M_ltvlti_._._ P,_._N!l1.1^.....-. ^?M_.
_
'NAS9-9^OZ_^ _CI-3480981
AaricultuLH dr
1.....lhll__..____-_--......_.._----tiASQ/JSC_„_--__--.
ERIM
Ntrra: µl roc ust of puousneo aocumen[s wnic • n use airborne sensor aa[a C011sCtsA DY ERIM, see Appendix A.(2) For geographic reference system, see Appendix B.(9) For list of organizational addresses, see Appendix C.
Sheet 2 p( 6 Sheets
Fli ht DateMission Title NASA
No.
MajorDiscipline
principal lnveatigator PI Organization Contract No.First Last
25Jun73 25Jun73 Tea[ Fligh[ _
Gaaaaa Co. , ^ t nna '11r^ .-Lke M1chl.gan _....------_..Vabaah R Baainf Indl^naGton _Councyt Mlch! u^._._._ _M53 R1EMrii. Hichiyaa_T^Pt [liiht ._.-._-......
MultiLead Uu -^
P. NasellE. JeM
ERINERDA ^ ^^^- ^ I-34 809X131Mgr73,
11JuoT3_ .lOJw73OsJuo73 ._]1MaY732^M^73-
16Jun 311Jua77lOJun)3__ , un7^ _
31lYY73_2lt[}x73_
__.__.... tiydrolojy--Multi
rieultun^OuMuTti-
_._. _.
C._.Wwrn.k __-L Silva _ _
Y__Mali^la /l Malepi-iaA. S^^iaa
_
fiawif "- --
ERIM .^_._..---__..--_--..._LARS PurdwIRIHfR1tT-------- -EA1M
_.._._._._59-9304S9 ^30G----3`4-43b6-`
__ ^
12lY^73 _ 12lI^Y7^_ YoodwrthL _ NortA . _D^kota __ RIM H ro^CaaN H. Malaoo N . Pra1rU 1 1 • Raa . Caoter -93bZ--.-.--._.. _ -
--t
MMa^r 7 3_19Anr73
.._._1'7370AOr73_ ..
YQN^h R RuinL Iodlana .. _ .Chelan-Iloert ian Chnrcni..._
_-- .7/M._ ..
Multi_.-.....c.clog_
. . , _faeainM __-. _Y. overM__^ .,
t.AA$, fuid^u^ - ___eu.^ o-I iIlaai,^Y^RTa^a _
A3'4-4362--4=436b---
3.IARL7^ I.^A2E7 S+.S!!_of_^e1J,^gYacEr _. _-._.._ Nrdrol C. Waaraak ---._. ERIM.--._....-
.---._Pouzc Coate.----^- ------- - --'--_.__.. ...._._..--- --------
11ARZI^ _. IH1R7L C.S.LY..lI1S.RIgR__.- ._ 0 A. Sallaaa_-._ --- ----ERI71 _ _ NGR- - -291faLZl. 1(IPLJ^ rsR4._1^!^ir!! !IW!ehS.iBiM!..-. 7al1 ._.. Toit^tr^__ . J. tricluoe _-_-_.---. ERIH-__... __ NA'S4-4364--.._.._... .__._. .OounSYA_MIuh1Ra4.. .... .. .___.._ _._.._..__ -1.lARiI.^ 1.A..p^ ., _Or9L .. _111ShSSSn mood in( H drolo
__.._A. 6a1Lani^
ER IN -'- 2:k-3^3-1f6T-3S7UlARLI3_.. 7AR eI_. NRft_7sZk_ bZ_ 7^ ._ Oeeano_ -j^__-. DiClark__
-. _ ----NOM 54--9764--
4bARlv7.2_I9MRL1^ ...
6ARr.7]_.SNaLZ
NfK..Y9LIt Q1RbC..._...__'-_.--_-..LakR_9ntaLlo__..---`----
77M . _.. Oes^aojL _ .. _ C. Ws^rnak_...._._ ..--.-'---._ ERIM __.. NA S4=43bz-)_311--. d;ol_off. i. Polcro ERIM.___- g76Z--
2]MaLZ3_. 3MaLl1. . .tlt.._lLtiRbt-.___-_-_- -..._. NJdzolo^___ P._Ila^all __ ERIM2UkLLZ3 _. 20MaLZL. Ttdt._i.11tI1L ..........-_--_-...._. H drolojY.._ P. _f14^^11 _....__..-......_
_ ___ __eRItl
14.IAnI^ ._ 25J.n71... S.t.A^t! _sf....MlfhltlP_^Elr ._-.... Nydrolop! C. Yaa^rnat-----------
ERIM---- .. Ru9.urss.R C2R^ --' --
-'- --OZJaa23._. anZ3 YAhuh .R^_llaRlR. TDdiYa_.._ 47M. Land YaL- L. stivi -._-_ LARS^ iir w ---
1ZNaYl2 ._. 17NoY72lbdov7l _19Sep22....
16NoYZ2...ct71.
Tampa B.Y,...l14LLQR.- _Southeast ..I3aL1ds ....._.__.........Eatoa _ Caimtl<^IticAlRan_._
6EM_beb_...4311.._.
lil+drolo^ _ .. C.._Mes4rtuk__-.- ERIM -436L^--49i!tN4St ._.-71!1#.!!1_.._.....-
E.r_.>^iar_n!k___'-----Y. ^t a,111^..R.e_..!Ia3i^ks^ .
ERIM --------_.._.-- _-._....ERD'! ^----_..---------
x.4364--=-4367
--^--
4_--- ._-...- ____.__..__---.-__......_._. ^. _. _..__..--- A _And^r^en NSU170ct .72_. 110ct12.. Yabaah. .H. Eaa1n... .Iadiaaa._.. _4IlL_ Hulti_... _
I ^eolo ^.._ Landgrebe ,_,.____.,._ _..
L. Rowan K. WetaonLARSL Purdue 3-4^-^36L-`USCS Denver NAS4-^36G--
NO'PE. ( 1) k'or lls[ of published oocuments which use airborne sensor data collected try ERIM, see Appendix A.(2) For geographic reference system, see Appr ndix B.
^ (3) For list o[ organizaticnal addresses, see Appendix C.
ORIGINAL PAGE IS
^-^• 99 OF POUR QUALI'iTYI
'"

^n^tR- _—T_____—
. -^
ERIM^ FORME RL ♦ WILLOW RUN LABORA 70RIE a, rNE UNIVERf ITV OF MICHIGAN
TABLE 4. M7 MULTISPECTRAL SCANNER MISSIONS(Continued)
Sheet f of c Sheets
Fli ht Date Miselon Title NASANo.
MajorDlacipllae Principal Investigator PI OrgaNzation Contract No.
First Last30Sap 72-. , lOrt12 W13oraq SarlaLa^_Ca^^t. __... Qeol ojy .__.._ pc._^^.___—_—___... FHA, uaahinjLo4a U_C^ _--.. .^.^ 7.3.N! .-_._llSsp72 .11!S^p7207Sep72713AYt32l0Auj7] .2l11uj7 229Aut1t
USK72 _11s^72...7$K7^_SRg72
aoAuif3_ ug73fAua72
Itich!(ag0akron.._._.__._._..__.lgt._*^t_.._.____._.-._._.._._Lake Ontario J _ --._GNaM Cowt Laiiaa Rtu^f«ra« Co , viann. _Lake N1cA^76, p1e1bl^jaOakland Coue^ i . Tt .___._..
sSN_ .._.
^._
_._
iorfftrZ...._....tlydrols^r_ ._NYdrolo^. ,__ilydrolo^r>..ad tt..^drofo^ ,_Laad . UN_-
A._^!r!M..__.._.. ...._..t'1SUP NaNll_--_--.T Totals _.—C ilatera/^ _..
a•e. _1Nunr7i _
L Iania^1 sattinllar
....._..----._^._-___-_....-RRIMQIM
_-,_T___._—___.
RIITII _ _.___gitiit __._ _._..... _--__ _t1t^1RRIM _----
.__9-9701--_
9-9304_- )< --3caA3_ --
_'-NA39 i'104----
13Auj73 ;1uti72^Mouille^t tlich^ _.-Raton CoustYr NiekiW..-... ^3M .,_ Multt^ --._.
_A. - nfn ^f^^ -
-.-^ -.-
_...__._-- ._ - =^^'-
19^7;L!!!►ut7t46Au[7^ .44A+as72Q4_Lt^R72x4aun7i2lLiY3 .71
9Auj]2_YAuR726AuR72Oltus 7 7
Aua72ld!!17l
Y171.
Taapg^i !1?Ei4a.__.--St ^J,or}tea ._ ._...----Na_M_YOrk ^^.4.. ..___.—._.W#haRh. .E:._.1u39, (!Nll^9l.....
f9t._fT .tfht _.._L;tt^ QR1Rr t9. ie^) _
tk• Nott^ .QlllNS!_.....
6Zlt _62M..62l1_4)!!_._
___.._ . _44h_..
^. ^9^.a2X _ocanoie_.OcNOOiu___M111 1 _._l^rteultun^4ro1PRy ....
o CwtyslT 1L-
C WNraak `-C-_Ve^^tnak __... _. _C Y^s^rwk ..; Laedjr^M _._._
t^ ^'---n__-__.. _..--._—_^^__..._. __ _uRR ►urn _ _^......
s _89-9ST14-'
NAS9-9304 _^N/is .._ ob -"
► N^Vfll^< Yete;nRk __._ .. —_._tl _INlaon
CRpI __ __-----6lIN_ .. __ -_-- R RO^TIf---
M.Trairia Yfldli^i^a.Cinter_._ S^-^307^-_ __ _
22a.Y1Z2__2t1J.ua721Zaun72 __USa>an72_2AMay72Z1MaY .1214MSy72
4au17Z_un72 _
BJun72aun72
"25NaY7221Itay7214May72
N.Groat. .lLiloa .._$<.. CMk4ER.__..fQtL^isRk,. Ok1ahGM ._...__.__..
Its Atisric ( tuSA2...-_...._Ann. Achoi. .MlchiRan..^_-._B1ack. . Hllla. Fortat.[Y._.._.-__.aleck NS1L^. .Ru._nt Mina _Yooduotth.. >tor_s dtnu .__
34tl._^. _
. 3711__..5M_..
._._...__
Ntla: .41._....__.Sel4.;GciY_ ..ydro],gRy.__..
4rRRtT1.....IRrRR.iFY..,._GRQ1OiT___.YXd[A1L
V:__^ .aE!.__..._.._____..__ ...Kx_.^^!p!.......-_-.-------/y_Tolc^a _-. _---^, _o.,}wg, _ ._ ..._.. -. _.R,... . 11ft.^hf.._.___...__.__. __?._..asrkaea/T• Yataar __
,._AR1a4R _.._^ .____
S.Oakeu_Rtab V.. Rrookie sV^__Mav^i - _—..611IM9s._o[ _M ..---. — _..__^-U_.S,fere,=t.._S^n!ic^ Nrlul^FRt^71 _
lSlLFi9 ^^11[e Ra!_Ggtfr
NAS9-9fNASA-^35^^-NA59_9^04_NA59 9304 _,NA59-9304tl0-220066_IIA59-9304
--_--12May 7 212ltaY7211MayI2.OSNay72
2MaY722tLY12
Y72S11ty72
Yallopa /Palntar.. . YlrfSa3A....Can6ridae. MazltlAShc___ _Belt3sara..._..._._..---.--^...SE Mlchlpn._..___.._.__._.__.__. SAM..._
_.............__.
Sit.._.
ARricY1W1l^lll _..._IlrbAn ._.._._
Wa._..
...RRISSR .._..._.____ ..__..4L.....RobdR _...___--.---
._.CRRRR/R Oucealt __..... . L7txaA.. .....__..._._ ..._.
P
w!NIA..Mwllopl. S,4at^oolVir1lei^+ 5•_^!'^-_-_-.-...-_U.ot dlj([prnia• _ U. et M_^._ELM.__.-`-_--BRIM
AS6-2058 ._,__
NA39_9306NA59-9J04
NOTE 11) For list o[ published documents which use airborne sensor data collected by ERIM, see Appendix A.(2) For geographic reterence system, see Appendix B.(S) For list o[ organizational addresses, see Appendix C.
Sheet c of 4 Sheets
Fli ht DateMission Title NASA
NoMajor
pied line Principal Investigator PI Organization Contract No.First Last
11Nov 71.-.Q)Noy71 .^BOct7l ..
12Nov 71-'__-- _SNoy71 .a0ct71 -
_ ,__ t7118a^71 _
fpNp71 .71lSSap _..
}Sa_p71 .29AuR71.,
^tZl.
Nowton Ara Teat Sito HATS_'_--.__... _._AtLnu^_ C^orj .1^..__. _ _Loca l Tait _..._._.__._-_.--Corn _ llijbt_- _—._-1^yA°-^OYZ_^ 1fBU. .A^.h__
c^utae covnt^^nirp _iaat .11 t........._... ._._____.__^Cora QSght „Corn_llifht _.__...._.__._._.I Cowit^6 16U llth—
S1MS7M
.....4ili°4^tl-
_. _..__4!M
;^4^ ...
Multi...._.__^ .__fonatryMuni ^AFrTcul[uiei1g_rlcuTtun
i;.na.^N _._Laad UN .__ ..A^rieultunA^rieuTEursA1rieultuFa
R. Rrb __._ . _.R Al rich)R.IbI ar ^T ^ tiai4li_
_._.._.... _.
1.andtii6i_^_-___... iil]Ct3;luravN-
tt ll4TiT /g .^iTeV^ .
Tarp .. 7c .. ^^ _ a....
tlasall -' ._._
^Land^rk►a _-^ ^^Laa^dra6i '-
NASA JSC ._ - ___ _ ._Y _u $ Honat ry ea, r le
-'—_ERTA ____..--._.-__.^.
^^-____ ..._ ---- ---.^-- _ __....__—_
fli'sS ur wL^3.7u^w__.-_._..-..__-_.__
AS - _D B3i1^
9^71Ti`_^^---
^oz,--.__-_-..
=97Ui--4-^^y__
2ate7 121Sas7l
lI8sP71S 7^„!p 1
^43^p71
^40W7LiZAYRZI Ma-Tia7N. i4Ti► ate.-- .^....--- ^b-
11Aut71_QSAuRZ1
IAYRZl..1....
EO. )l1f,RAt_._.- __.__....__..-._.R^f►Rlt.._CâVAtX. _4.!!^V •>r
^3M._..^2M
-._.
Atricultura/^ricultun
_
D.._LandRnM_-,^.__ ....W.._Il^ll^/ll., MaliA. tdllln ►oi.. __P^
-
t.AR'§^ Fiirdw ^ __611311
_.._._...- -___^_
N . SrU -----
-_-._-^54=9386--S9=II30i^-_ _ -
2L1u1I1_L2au171 ._OI1Y171...
Il_a.Nlll...
Jdt _L411RhC.. _. ___._ ____C.¢ra_.RllRht__.._-_...__-....._._
_At._Lsa__
4 -.
_^1M ,,^
rleuleurf^rf,cultur^
rleultura
_D:. __LmdjnM__..__-__.D,., Laadgeebe____...—_.-H. Milil /Il. wlaek^ _
LAIC$. ^idni _.—..._. _ . Fu wIRiM- __.______ ____-__.___^
-=4TRi'--_^_
--._-.. ------ ._._..,...._....__...__—. .. Rlll n^loa .3.T_____-__--
2d1un71 ._ nlil. _ t11i1L_..._..__...._..._.....__..._.._
_l911... ...—..-.
It1FiS^4un-
D. Landlr^b^.__----_ ^z-.^d'^!...—^._.- -^:_^^^
NOTE: ( 1) For list o[ published documents which use airborne sensor data collected by ERIM, see Appendix A.(2) For geographic reterence system, see Appendix B.(9) For list of organizational addresses, see Appendix C.
100

_i
RIM
I^
iJRMERLY WILLOW' RUN LABORATORIES. THE UNIVERSRY Oi MICHIGAN
TABLE 5. M5 MULTISPECTRAL SCANNER MISSIONS
Sheet i o[ 6 Sheets
F1 1 ht DateMission Title
NASANo
MajorDiscipline
Principal Investigator PI OrganizationContract No.
AgencyFirst Last_ 17Se 71
11Auj7106Auj71
^^
1757113Auj71OfiAU^71
-
Canaa^^ , _CountZi_NI _.. _Coro E1iZltt _
. ia^hN CountZLMI _.,_
__.., ._4111
Land . _Use __.ricultup
P . ._ Polcy} /A._ Salla}n __ .D _Lasljr}M
, ERIN,_ _._ _._._ . _....__LARS_t Purdw
CI-Y102 7
IIAS9-97012M Ajrlenitud
-
_Y. 11n113a7R ... RQaJ^i . _ _ GRIM, _.. _. __ -'-_
--NAS9-9704
-^^^ --
29JuTZ1^3'3uI3i6^ulfi
^63Au^^u 3116Ju1710-3Ju 1
MichiEaa 9tata .fanCoin Rli t^Coras'1?jhe -_
_Micpi^aq. _SUta Aj. ^is .
13M'
40N _
riCYltuea^uTcun
riwltun
A tllin^bwD 3.an n6aD_ Las
d
^?a#rba
M _Ilalila7R__Ibla^_ _
MED, LaBaia^ _-LARE Purdw -u^tS,^u_r_3_w___Tt^IM _
_NAS9 970A-NA54 ^ l$T-_NASA--$ SbI-_ ... _.
2^1ua71_
07Ju171-__....._.
Corn Eli t IOM A3rieultutaA. Lll! boa .--D. Laed_^bi ,__'^
MSU, Laaa^LARS, dui
_NA56-3^^d
2EMa7)112MarZ1
_ f31^y712YtlEltll
La1t^ Michijaa .----.----.Gh1EAU stm Pates
^^
- _ M1'drolojY P. 1'olepa _ __----- aTIIM- _ A3a-3^S^-
-- _ dtz _lfRl .tl#lL^.. Nalaaika IM,_j^l _.__,___ ---NAS9=9.306
111LY. Zl ...ComJllih[--_-.- <...2LCDla6ald_.. _],^,$.. Purdw _ N 9-9304_10MAY J.aka_OataKL-__..--.- -- - -YaEOSr_--.._...__.-___. _LdiM .R^17^r19-G--.__.--- .-___ 0 6.nom. w -,.ice ^_.._._ let^.e .__.-__ Indiana-Mich-
an Pover Co.O^tLy71
-^OAE471 3007jM}Y71... Sp}I^ur TorBah}p . • MI .._..-
Itichitaa _.--°-- Multi....--_-..__
droloT.,_ ^}leLn._.._.._....-.-..._f. Pol .__-
EEIM..._._._..__._ERIM
Po^ T4^^S--Northe^ rn_ Ian I'
--_.-.__ _ _._.___ __-_ ._._ ----- -ana t•u^ 3er-__ _. _ _-_ vice Co.
22Ap^7 2 ._ 7 L}(^piep^^g ,__-„__„ ._ tlZdrolo __ P. PoleLm_ ._`^-^-- ERIM Conaurr i^_ .^ rho-2 7 1,pea1 T}^^_ Tat _ Pi tlaNll 611IM-^-- -' NA-54-^43bT.-llw 11^!!EIl !!!?1.^31Z.-_-_ 3Alt_ .. Mult1 _ E. l4eDOOald . L^ Purdw __. NAS9-^_-
^8►1}rj 091I}fZl. Mo1M,,• oai_TI--_-_ _ 3SM .__ Multi-_- M_ .ibltar ERIM _ _ _ §9-3364-_NA04NaiZ II ..L4[ .C.J.lY14E_.lflZa._^__._ 7SM . Mul ! M. Nolt^r ,^_^ ERIM . __'___.- N/i3^-4-SSIi -
_.^yab.Zl_3411IIC . 70 ^,DSIP
Q4MREZ^.. _4t!Rl}eoLlE -_._.....StltNlS49a_I!A.___..._. _..._-
32M__--
AjrlcultutlaMult! _--
^d._._._.___C._MlnJ^nD._Nobla -. .__
OEDAt _ Walaco, _VA-Ntrp. A^iatra^ tom_
N_A59-^3aZ --HvY . R^i. Coda.
124cs.Z414oL .4Z2
.3^s4ZQ.Qost19
_P^ah Craur. CAL ...__4>.l.^P_ill._.S^_.. _.__
}j,M_ CaolojZ_°- R._Vige^t,..__^-_ . ERIM-_ NAS9 X304...-..__
24M
Oc^anoj.--.--
Fore^^^^ - ^
R.._.Roryath - -
^^. nlson
EIIM-_------
IM Ann Arbor
DOT-ACC--^S^-A ----NAS9-9704'^h ^ ^^^i^r. ^^,
NOTE: ( 1) For list of pubitshed documents which use alrtarne sensor diti C011eCted by ERIh[, see AppendUt A.^ (2) For geographic reference system, see Appendix B.
(3) For list o[ organizational addresses, see Appendix C.
Sheet 2 0[ 6 Sheets
Fli ht DateMission Tttle
NASANo.
MajorDiscipline
Principal Investigator PI OrganizationContract No.
AgencyFirst Last
^5^y^^ >1Il AoaAtbQZ_..Taat^lta.. _tll__ 24M__.FazaatzY-Multi
C._.OLoa. _R. MacDonald
lIIi..Am..Jutbaz _ ___..._._LA1S Puidus --_
_N!!59-9^^4._..___NAS9-930423Sa^7b 23SaP70 _Taaaauaa Valla^__-___ 22M
leS.-p7o 21sap70 Plorida^Sint Eol. 22M Mult! A. CewrSap? 118 -p70 Cora Rli l^,t _-^__ 2lM AErieultun R. MacDonald__._,__..,___ _LARS t_Purdw _- NAS9-9304
a9A.^a 9§.e7G ?-iwi ylaata _ xrdiofo !__ t.-Fele^a _ ----- ERiM Con.-iae
^SSi^T bSl;epTb Wra^3^^--`'- -- -°- :2aii Ajeleu-Ttnri ._itacDoaildi" ^ LARS_ ^ 6uidw`--^---- NAS9r9306 -^7Au^70 23Au^,) _ . _ _Gtl»art Mowtaiat_ME _ 21M Multi P. CaaaaL __ DSCS• Demrat NAS9-93042 Auj70
33Aig7b^^24^A^u^ _70 Cote Eli t
llbaav ^oa^it-f281[3iSi1"
A^ricultun R. MacDonald-- LARS ` Purdw NAS9-9304NASA 4
1^Auj7b23AuE7i3-AuEia
aaw. _.Tu-^^^Ti^o^noa Co.LLID ^_ 2bN_
A^rieultur.N^ricu^tuie
3'iala^ti-i _. _.^_.-_
. ^^^ltieDeaal3 _ ^Ea3M _I.ARS, T'ur3w
-^63 -__NAS ^3bt-^
^.SAuE70 06Attj70 dan Arbor, MI-__ 20M Pona-trL C-O^soo_ ^_
tM Ann Arbor NAS^^4-_31Ju170 31Ju170 Jaratoua^ ND _^_
_19M Multi J. Johnston USGS^_WuhlaEtoa , D.C. NAS9-9304
' F. Po1cYn_._.__...___._ .ERIM ^----^----.._.._.Ju17 29Ju170 Mmltou, COLA M Multi R. Driscoll _ USDA.1 Colorado NAS9-9304
21Ju170 22Ju1 70 1,oeil __ - Multi_^i
M. sair_ LRIM P37615-70-C-_3692
17Ju170 17J-^ u17b Trawne _^LMI N drolo^ Y_ Pol_e^a _ ERIM _ _^
Nsi^B16Ju170 17JU170 _P^ll^ton1_M .-__ _., Multi E. Mont/T^_N^i ERIM UM IST lsoo13.1u170 13J^170. D}_t colt RivarLllillou btun1_ Lead Uaa M. Fair ERIM P33615-70-C-
and _^!}.L ^._^^ _ . 1698 ---06Ju170 07Ju170 Aaa Arbozy MI lEM_._ Pore^t C. Ol^op_. - tM.1_Ann Atbor NAS9-930430Jun70 O1J 170.. Pur^,w^._I[ID_ 1711 ricultura R. MacDonala _ IAAS1 _ Purdw NAS9-930423Jun70 26Jun70 Mill Cnek,_0[ 16M Caolo L. Rouyn USES Aritoaa NAS9-970420Jm70 20Jwt70 ._iwoawa _. i Yuhcaaav Cw,MI 15M ricultur. R. Nalat+ha ERIM ^ ^
_NAS9-^3^4-
08Jm70 08Jug70 _Aan_ArbQ^__MI ._ , __V- ISM Poreat C. Olnoo_
[Ktytnp Arbor ____ BA59-930623It}Z70 23naZ70. _llinw^ou Pot _Rol} _______._.,. 1411__ Multi__ - J,._Johnatoa __ . USCSiWUhlnEtoniD. C. NAS9-970421Ma 70F 2 MaZ70 _Notch DUtot} _ 14M Multi
- _J. Johrton _
_DSCS Nuhiatton^D. C. NAS9-^3n6-
-.._ .__ _._.__..... ..._.. _._._. _._.___.._drnlo
!. KlattP. Poloyn ^ _`__._
NPNRC1,Jaratam07May70 07Ma_ ,Z70 Lake Michlgnn ERIM - - IND MI Llee-
._ ._.... ___... __.. _..._____. _ tric Co._.._ ___. ____ _.. _._.. _._____ _.._......___.06Ma 70 06Ma 70 rdur IND 12M A riculture R. MacDonald
_..._........-_f.ARS Purdue NAS9-9304
NUT!3 : ll) r'or uet of pubitettsd Documents winch use airtwrne sensor data collected by ERIM, see Appendix A,(2)For geographic reference system, sec. Appendix B.(3) For list of organizational addresses, see Appendix C.
SAGE ^ioi ^^G^3A^' Q^^1►^
QFi ^^'

^`ERiM`^, ^ ^)RME RLr WILLOW FUN LABORATORIES, THE UNIVERSITr OF MICHIGAN
TABLE 5. M5 MULTISPECTRAL SCANNER MISSIONS(Continued)
Sheet 3 of aSheets
Fli ht Date Mission Title NASANo.
MajorDl^i ^ principal investigator PI Organization Contract No.
pge^YFirst Laet.IISApz]D. z10. ^(A.... _ ^tll t r_!•opll..__..._..-.-_._ ^/!._^C._^.1.RSf.E!ll:..liul._._ _RSi.Cor...^6Mfr70 2¢lI^g70 . !tllQa^_....._.. _..--.__-__.._ -. Multi ..__ Ae..^b ..^..__.-.._._. ^,.WUhin^on^ D. C.,-A FH-11-7116 _^OMRr7Q .. .14M!!r_7P _ . Ak4P.ffil...#^Za^._..-____-_ -_-.... Oc^^ao__i.- M. Rolipinrkl -_. U80E ._MSgi..._._.-_-^ lAS9_9 704
^ Dae69 17Dre6,9 Turdw. IND- OM _Ajrltulta __ R._MieDoa^ld ^_____ 1.AR3, Purdlr -______-_ NA99=9704^,_-,__c. Johisnain t. uraw_..___._.....__..
26Aov69 4poy49,--___ _-- --__--^,_/^bs,Z/a ,Fgtn. Mi_
_..._I^1Q,1
__._ _C._0}aai- __,
_i1M Mm Acbor __ --^- NAS9_ 30 4
F.__Toleve-- ERIM...-" - ---20Novfi9_... _.20Mov49
_._..._.....___ __----- +_._.._.4trolt Ritar. MI_^_ Multi -----t Po1cLn-_ _ ERIN NSF OH- 0
---OSNov69 06Rov49 urdw^ IMD Ajilcultu. l MaeDould ---- -ue -- _ ..t.AIIS -€urd NA^4=^4--2SOe469_ 270ct49
__-._____..._.-Lop Anploi ionser^y CAL
---..ionsc S_Wrc_ -- _ U$ io_nat S^irviei, ^irFiIa U DA^1-T33
240eS69 ^403rs69 , Wk^LYA__.,. 6uek_a -„,--
lonitr^_, Isnt^Colwll -_- U ^_C^.. Seikiley___--__ -ODD-SBZIf^^4aS6.2_ .x.5«9 .MRl9R_^!a_WA.--._..^._.
_„_._.Gaolo^,_ C_IUlithofir .
---Duruu of Aacl. Dsnwr Z=bb n^+AZtr
--24Se„p69 24Sap69 Y1nd Rlw3A. YA_--
To_rsstr^_ P_iN-his U^nat Iry n, r e7r A3^^30Z2S3aR4 .4. SSiA49.
_,.11cau. .L^k4.-llA _.-__._____.
_i.....- 'lv1S ._^_ c , , _M^1}Z,t^otK -„ Euruu of 6c1. Denver NASD- 3 _
14SaP42.. 246râ4.9 QLa1¢Il..CQ{Il.t___..._-._......_......... OtL.. ^5SR9o.L-, Y._ Paarej ^_ OSI) Corvallis_ NAS9-9704_.Q3SS^4.v R2srP49.. Vf.Rht1011L .Sdts.._W.l.lor._R.V.D.. _^..._ .Multi.___._. }t_._Maavall _.._.__ AIM.__-.-.^_._.-. NAS^^3SL13Auf42 _ 7Aui49_ ArD4L_P£LlIS.Af^.^tl......ADG 1t1 LoTESIdL -._ . 0 sos^._L-.._. _ 1M Ana Arbor-1_--^ NAS9-9Y14
13Auf42 13Aut49. Ik2241L_. R11ti[a MI- _ _ 1[i --_ S_ S^^t ._ ERIN NSF GH- -S^S--NAS$=9_LLAUf44._
_QSAufG9_11AU1t44. . Lakt
.O4Auf49_etlGhlfaf. .__..__._._....._
-.. e>JCdYa,. _1tlD.._._1M _Hydrol^ ,
1!f214Y1<^EP. PolaY9...___._-._-_.R_. , M^a DOOa ld
ERIM-_--.._..---LABS Purdw_.__^ NA53=^-
.44Auf4 44Aut44.. ADn..ALt!eL..l41 ._. -_-_-- 7M ,_ lore C....Olson-- --- OM^Ann.._Arbor -^^__ A - _131u14L...21Ju142..
31.u142 _22Ju149_
Hifsnnel . fl..Rlack _ t1111f, .8D.-
_¢M_G1'!_...
M^II,jl.----ZsI!!FQ .._
]..._Snell _.._^.-.__...ERIM _.._..__._ __P;Wab^r
--_----US ion_ae Sarvles 4rkala
--
A^-930^^ _Ne5^-9^-
----14.1u14t...15Ju149.---__.
.8ucka_.Laks,._.SRL_._-_ M lore^ry J..._Iwat_-__ ^_4f_^s_^r^i_!L IiAS^^^1Z14^3. 15Ju144 _Ylnd_ Rivar, NA ._-__._._ ... .4iL
,. _._F9tllS.A__ ,_W9b*^._^^_ US ioraat Serriee^Eerkei^ NAS4-^Z ----
.Il31u149 _ .12Ju144 COZxa111t... .01E..____.._ _6N _._}!L
_9^1.1P4b_...1REr.1aY.lt..
W, , Paarcy_,__,____--_R_.M^Donold
OSUy Corvallis __-_-____LARS^._Purdw.-----' _
NAS9 -9704NA54-- ibL--15Jun44...
zT_a(.^A914Jun49.-2RLy49
.Puzdua .__1tlD....__----'----...yaks MichlBad.._----._._.._....
-...._.__. _NFdLQlof7:__
_-.__-......,_P91.!<79....__. ER>21 _.^ N62703-bT-^-_... ^3
^^May69 27Msy69 TiPpee^noe CountZ,_T>^. __.._LM Ajrleul-tur ._ Aac^6ouiTd- Tur us^-^"^- _ --
M 59 Ma fi g Hrr hur P N. R36 FHA Yaehin ton n. C. FN-11-7134
NOTE. (1) For 11 St Ut published documentti which URQ alrbgrne Sensor ^7.1LI ^' nlleCle q Dy GK1M, eee Appen g lX A.(2) For geographic re[erence system, see Appendix B.(3) For list of organizational addresses, see Appendix C.
Sheet a of n Sheets
Fli ht DateMission Title
NASANo
MajorDiscipline principal Investigator Pi Orgalazatlon
Contract No.AgencyFirst Last
12Hav49OBMar_4„9_06M^r49___._-..24fab49
12Mav49_12Nar69_07l4rti9-_.-__.24hti49
Loeal.__T_!^_____.-._.-...-.._38n..91.P14a.._t^_._..._--__-....._.__SaatA_b^rbara • _CAL -...._......__.._..----__._._____._Local ivat
.._..._...__..^__
_........__
...►.(_41t .1............._...M.1tl t.1......__._.Oe. wL. _........__._.__.........._Multi _^
_r.a...tytll3.1..__....._...._.__._......._!!.r_. _4.R!^ ...__-..._._._._._..._._.._P__PO^njP . , lharoa -
__► ^..9}!!oZ!L_.-_.__..._..__P.,_9uQ11-
...6144L ......_.__..__..__._....V_.-.____
._^RIM__.._....__..^__-.._____-6lIM----.._...._.._^._.^._..___...4•S e.._P125e_ o .. T SQr1orERIM
-•
II!_----0 33^..-
_1.4.-12-51Z__
P--210ct48150et6824SaQ48,
210et48150et6824SS14e
._Local -._._._
. Kno>Nil la ' -lENll,_,,. __,,,,,,__,__Enrouta Tut__ ,__,__„-
,_^_.-._.
, 2M ,,,,_.
_Multi....._.._.__.__ droloyY ..N drop
^,-__,C.__Olson __...__.._.._.__..._.__R._ . YSeasrP._Nasall.,___--__
._^ ._^ Alber ^...---'--^E Toan Std DnlvJohnson , CERIN -^_----
NASY-1404NAS9-8^8 _ERIN
.24§e^8 245ep68 T1DWCanw Count7 . IND 1M A^rlwltu _-^_ NASA/JSC23SSi6820$^y68
275ap68_208ep6!
.Mono L!1_et _CAL-._ ,__.._._..lucky Iak}s_CAL ^_-
._-_ _Osolopr__ .,Mint!
R. lovLrR. iwlar
_North As>.rlesa RoekvallNorth Aasrlcan Roekwll-__-.
NARNAR
17Sap48 _178ap68 fort Co111no^,.. COLD ,.,_ Multi` ^. lorlsr-. ^,- - ^NOrth AsMrioan Roekrall NAR093op6B _09Sep68 Local Tait--„`__.^.._ __.,_„_ „Multi __- .. P._Au^ll-___.^._. LRM_ _ ERIM22A^6822Auf68 ,
22Au16822AugtB _
Loeal Yut_Detroit ,. _I;ivsr. MI _.,-,
MultiMult1
P. Rauh ---Rusl -LRINEAIM
P.RIN12-14-100=
_ USDA• A8r1. Ras. Sarvlu 9503,^OJu1682 Jules
30Ju14825Ju14
_Tippac,^aoa_Cowy-tv . IMp,.__a,^^T,zot _,-_,-,-,__,.-,
__- .A ,rtcglt,_ .Mul 1
M..__Ho[far _,________.__,P^MU^ll
LARS, . PUrdw __EAZ_M _
NAS 9-A 381_E_RIM
31Nav69 .31►_47Ck _WS9SM+e£tb..^-. M lt}-,__ A. M1.194^__^. C,^_Ja^es SGS-I4-OB--
39RtaY48.. 3pNay4b . .RaAid_G1LY. _8)?. _ __
T4ilfSLl _. _R Ntlll i^?^^b_...-^ ^_ _
S !o>!st Sarvin. 8erkelsonl- uzolPO 162915
^HaY4 33t't+tY48. .1.4Cal.s!!S___.-_._. _MJtl11-- P..,t4oe 11 _^ ERIM .--------.- ERIM_99dvs4Z $Hsv4Z ...yQS.a1. Tlac_..._ - M9lL^_.._...- .Pe.._H!!FLl......-'--_-_.__ ERIM__-"-'---. F.RIN,4Ssp4Z..144et4 ..bAZS.OY.AK._-.. -_ Myt}t^- _ R,HOrvlth ,,,,,, _6RIN II SCS-I4-0R-
_ X01-11201
14SaR4Z. SsA4.Z . .YR3141dttow - YFO ^ _._ M[11tL_ M^.>tffi.!_..-_ SCS• _Washleajtony n__ C. USGS-I4-0R-
42StQtIZ. 6.Z. .1{Li{l.w-.^.......^.._--._...._ _-_ pC.RRROE,.._ .^Is...It1iRI_._--------- U.SQSa.Mlf!^1_....-__--'--001-11201USG S-14-08 --
._-.... ..-__..._- -...__...._..-^.. _ _...`. _.__....____..._.._ Y.,._@tt!Phl.lb C31^rliaatoa ,_ Ml1-1121 -1A4Z .IftQl._.21L__.__^-- ._. Ll- ._ Y ._111FS9.h1 USGS,i,Ar is VSCS-14-08-
_......_ _..__ _........ _.._.__.__.^.__..___ .._. ...._.__... __..._.._._ ._.. .__..._.__._-._.__^.___ ....._...__ __....__....._.....___.____..._._. Ool 11201.._._-
N(1TF.. (1) For list Ot published dOCUn7BI1t5 WhICh use alrbMf7C FPnSOr gltf CO1IeCCe q by CFtl^1, see Appe q d LC A.(2) For geographic reference system. see Appendix B.13) For list of organizational addresses, see Appendix C.
102
_ .-v.,,,^.... ,_-_ ., . ,. _ ,......._ ,_.

RIMFJRME RLT WILLOW RUN LABORATORIES, THE UNIVERSITY OF MICHIGAN
TABLE 5. M5 MULTISPECTRAL SCANNER MISSIONS(Continued)
Sheet S o[ b Sheets
Fli ht DateMisston Title
NASANo.
MajorDiscipline Principal investigator PI Organizatton
Contract No.AgencyFirst Last
^4Sep.41 49SaA.41 _ARIu¢llla.. _. _ Multi ___, Y._Hgphlll_.. ,_ ,.__._...-..._
USCS^ __ ArlSnjton USCS-14-08- _001-11201_ ___ __
038ap67
3 ._
_0^$ep67
uB^7
. f1A.^^.-.-_----.
Lee -fief
. _.. Malt!_
c
1. t;ld.r-.._- -.__..-^.Y_Rei^h1l3 '^F, ie.eTi-
_ _,P^^_ltorrlaL Tbna.... ^ULOf --Atli-a^toa_ ---
- --
TV2%29AVLRIN --
_ .__ ._- u 3STu 6_ ofido^T^ett^tierC .Low --^ LA LRIMYtOnl
-_-- -.
_
21Jm6'7 37.)in67 Lxal Teic --^^-__
Multi_
P. 14a1I--- LA EAIM28 r67
.. .^....-r6 7 '- Mult! R.^^i -^-^
_-CARS, Pur^ir Po ^8^
-iSNar6 13^rK_ .Tndiin^poIji. TM6^_—_
_iiSllov-Tim-^lI_ _ -- 11u1_T:=- -tf. -IiTi -I^kTFt---_--- - DA elf 6Z-S-AMC Ont)1'^-
1 r6 l/tY _ Y11 w Rye. t . ^l^illTa^. SoaB.a_
LtTM pA 2 ^^--_ _ AMC ^0^13
02Mar67 12lt^t67 Ylllw_AuB_L._ tWitl_
Y. Maltla lIIM DA 28 047-__.._.. -_--._.- -_-....---'- _.- - -
_..AMC ^^TT^-
15Dae66 1SDec66 Local Tnt.^_-..____.. __._, Multi-, --.-P. Hap ll
_ ___IAIM ERIM
22tlov66 2211ov66 TaK_ , l.oa^l —__. Malt! ^ _
P, Haeell -•-___ERIC ERiM1811ov66 18Mov66 Loeal Tot
___.. -... _ -Multi
_ _ ___^^. ^IIue1I- ^ ^^ ^ ^ LR^t R^
14Nov66 14Mov66---
Loeal Teee Multi Ya^f ^t^- kit - Ft---13Sa 66OlSep66
153^^6O13ap66
Purdw1. 17tD _-I.oeal Toc_ -
AjrleultunPone t i
L_ Hoffer_^, piiilI
LAll3`,__^u^___ ^EitTtt ^-
NASAJti$LT75-
30Au^66 30AuA66 Local Tut llultt P. Raeel^ -- ---ERIM -1!Tt2}t----25Au^6 23Auj66 Loeal Tot Multi
_P, Haar ^
_^_Eltfft-^^^ ^^ _._
26Ju166 29Ju166_ ___Purdue IMD ^-
-^rioulture A. 9oi+^r_.....-_.-_-- I.A3lS,-^u-r'd^r__-_----.
2L1u166 _.l^el T..---5--- -- llu1^L--- itaull - jLI1t----_
ERIM _..l"^^- Im ^pjfer .lIAl^. SA NSG
24Juo66^QM_lY6^-- -
24Juo66.... toeal43 .YP64-----
Teet - _-.
..W!lli4.£. 7X..-----...-------'-----
_,..,___
__._..--
Mult1 _._-A^ ,r!alto--------
P, Hutl l -_ -
R. LaBar/V. thenLAIMDSGi_ We—^ieo -
ER M^ USDA^^13fb^-
_l .(^jt¢6 26!(a^!66 _^litornl^----.- ._.. Malt! ---- --A. Colwll U of CiAarke^jHe 65 I
__—_--rtcult re
Y.-8^ih111 ..----P. Haull
U§C111 Arli-jn ton -_-____EAIM
^C^^T4t^NA3ATNS^S 1'T
NOTE: ( 1) For uet o[ published documents which use atruorne sensor data collected try ERIM, see Appendix A.(2) For geographic reference system, see Appendix B.(3) For list o[ organizational addresses, see Appendix C.
Sheet a of 5 Sheets
Fli ht NateMission Title NASA
No.
MayorDiscipline
principal Investigator PI Organization Contract No.AgencyFirst Last
04Ma^66_29Apt66
28-pA _r66
04ttay662_ . A^r662tl^rfi6
_ Local . Teet _._-Toledo ON, Wn.Lri^ -Am Arbor^ ._IlI _-- -
AgricultureHYdroloI•Wltl -
P. Hs^ell _P, (Will _ _!. Yaee3i- -
ERIM _ _ _ __ ___ _6AI11^^^^^ ^ _^ ^^^-^ ^ ^ ^ ^^LIIM
ERIM _NASA%NSG^17SRASA NSG 175
_11Mar66 21p^r66 ABn Arbor. !tI -- _- Malt! _ ;Aw11 ---- _ __ EtDt --------------- p^ 28049-AMC-
02feb66 021nb66 _Am . Arbort _ .1Q -_ --` Mini Ha.a-IT _ -_—_------ -
R tom-_-- -I_iS6r^--DA 280^_-
OGJan66 06Jw66 _. Asa Arbors M -- _ Multi -F. Naeil3- ^ ER DA 2804^ANC-AlIC_- --- ---- -- -- 13TH------ ---
w rr. t t t r or ust or puousnea aucumrnts wmrn use airnorne sensor data collected I1J ERIM, see Appendix A.(2) For geographic reference system, see Appendrx B.(3) For list of organizational addresses, see Appendix C.
I n
103

'. ,.
i
TABLE. fi. M1A1 THERMAL .SCANNER MISSIONSFirst LastFlight Flight Major Principal
^' ` Date Date' Mission Title Discipline Investigator PI Organization Contract No.
19 Jan 71^'
28 Jan 71 Puerto Rico Hydro Dr. T:P. Rooney AFCRL F19628-68-C-0076O1 Dec ?0 05 Dec 70 So. Calif. GeoL br. T.P: Rooney AFCRL F19628-68-C-007617 Nov 70 18 Nov 70 US East Coast Hydro Dr. T.P. Rooney AFCRL F19628-68-C-007614 Jul 70 22 Jul 70 US West Coast Geol Da T.P. Rooney AFCRL F19628-68-C-007630 Air 69 02 May 69 _ US East Coast Hydro Dr. R.S. Williams AFCRL F19628-68 -C-007609 Apr 69' -09 Apr 69 Yellowstone Geol Da R.S. Williams AFCRL F19628-68 -C-007610 Jan 69 11 Jan $9 Nevada Geol Dr. R.S, Williams AFCRL F19628-68-C-007G21 Nov 68 18 Dec 68 Puerto Rico Geol Dr. R.SI Williams AFCRL F19628-88 -C-007619 Oct 68
i
Ol Nov 68 Iceland Geol Dr. R.S. Williams AFCRL F19628-68-C-0076
;: .,!
r,;
^'
..
is
u {
al}c',
,{
9 ,,
fp
'
L
^:.
^ I
_.
t .;^3- ^i,
-
_
^
^,y
^,,
itS
C
t
0asai
O
IOZnz

i
i
,. jTABLE 7. SLAH X=L BAND RADAR S115S1O\S^
First Last
Flight'. Flight NASA MajorDate Date Missiar. Title D!o. Discipline Principal Investigator PI Organization Contract Nu.
i 18 Apr 74 18 Apr 74 Oconee Co., Ga. 91 m Agri T. Davis NASA KSC NASD-13829' 03 Apr 74 OS Apr 74 Phoenix, Ariz. 90 m Agri A_ Potter/T. Schmugee NASA!JSC^GSFC NAS9-13829
^ 13 Mar 74 13 Mar 74 White Fish Bay. Mich. 73 m '_ Hydrology R. Gedneg, NASA ; ^Lewis NAS3-1823907 Oct 73 12OCt 73 Fla. Waterways NASA Hydrology E. Hecker NASA/KSC NASIO-8333.
AS Oct ?3 OS Oct 73 Mich., Ohio, Kentucky Geology L. Porcello ER[M NASIO-8333
13 Sep 73' 03 Oct 73 liuntingtonCo. , lnd. -88 m Agri A. Potter NASA/JSC NA510-833328 Mar 73 OS Apr 73 Southern Michigan 76 m Hydrolq;y L. Porcello ERIM NAS3-9304.
i- 13 Aug 72 13 Rug 73 Georgia Co's NASA Agri A. Potter NASA ,^JSC F33615- 71-C-1895' ^ 17 May 72 19 May 72 Georgia & Florida Co 's NASA Agri A. Potter NASA/JSC F33615-71-C-1895-^ 17 Apr 72 25 A r 72P Harris Texas
^NASA Agri R. Bryan Erb. NASA/JSC NAS9-1103651 m
I r
p OL OM 71 08 Oct 71 So. Calit. 48 m & Geology R. Moore ll. of Kansas NAS9-11036
^ 24 Aug 71 31 Aug 71 So. Calif..: 48 m & Geology R. Moore U, of Kahsas NAS9-1103699 m
j ' 22 Jul 71 21 Aug 71 Garden City, Kansas 48 m & Geology R. Moore U, of Kansas NAS9-11036+ 49 m
. ^ 23 Jun 71 23 Jun 71 L. Ontario,. N.Y. — Geology C. Freeze Corp. of Eng. (Det. Office) DACD35-70-t;-005623 Sep t;9 Ol Oct 69 Kansas, Okla. NASA Agri R. Moore U. of Kansas NAS9-10211
29 Maq 6S OS Apr 68 Mich. &OntarioJSC
Hydrology :Bill Marshall ng. ( t OfficeCorp. of E I)e . ) Sub Acct. of Parent! 6400 '"Project
<` ^ Michigan `whoseContract No. is
w1 DA-28-043
.'j.
`, ^..i
1.,..'
^:^I..
t^:
fI,
^.._^
{{I'
;II.
Irn.^
r^
0iO
N
C2
InJi
O
.. ..^ ...
...., .i.

rf
I
RIMFORMERLY WILLOW RUN LABORATORIES, THE UNIVERSITY OF MICHIGAN
3.2.2 FLIGHT LISTINGSThe Specific flights for each imagery source are listed by (1) the. flight date and time .index,
(2) the site description consisting ofthe coded site location and key objects in the scene, (3jthe nominal spatial resolution within the scene, {4) the coded identification and number of
^ imagery bands,(5) the coded identification and number of boresightcamera bands and (6) the( total length of the flight line. Descriptions of the site location and imagery identification codesI
are presented in Appendix B. A flight is identified in his report as a planned single airborneoperation including one takeoff and landing.. However, occasionally two or more planned flightswere accomplished in one airborne operation, When this happened, .the listing of flights wasusually made as planned, not as accomplished.
The site location code identifies the one degree quadrant of longitude and latitude that
contains the site flight lines. Sometimes a site is partially in several quadrants. When thishappens all quadrants containing imagery are listed.
The- flights made with the M7 multispectral scanner. system are listed in Table 8. Flightsmade` from June 1971 through December 1974 are included.
The flights made with the M5 multispectral scanner system are listed in .Table 9. Flightsmade during the active time period of this .system,. January -1966 through December .1971, are j
included.
a
The flights listed in Table- 10 for the M1A1 system are those made during the active life of 3ahis system (1968-1971), when the imagery was tape recorded.
The flights listed in Table 11 for the SLAR system are those made for earth resources in-
vestigatons over the period January 1968 through_December 1974. -
,,
106
.., Y;
. __
^ _ _._ ---_. ----- --- — :: - _ --- ---- j ,.^

TABLE 8. M7 MULTISPECTRAL SCANNER. FLIGHTSSheet 1 of 7 Sheets
Nominal No. of Scanner o.BoreaighTotal Flight
Flight Index Site Description Spatial Spectral Hands Cameras.Llne Length
Resolution(meters) UV VIS NIR I FIR BW Co1 . Co1IR
(kilometers)Date. Ttme Location Objects
030ct74 0900 GJCK-250 Wabash River Basin 3 7 1 9 l- 1 ^1 1 1 34020ct74 1000 GJGN-190 - focal Test _ 1,2,10,. 1 9 1 - 1 1 - - 58
OlAua74 0500 GJEJ Indiana Power Plants ,_. - .^._ 9 .____._... - - - -...^..,._ 2 - - - 34
31Ju174 1100.r_ ,__GJEJ Indiana Power Plants ____._ 6,10 _1 9 - - 2 1 - 1 34
__^ _____31Ju174
_____.0400^GJE,1
^ -..._-_.__.. . -_Indiana Power Plants 9,Y - - -
..Z..__- - - 34
21May74 1030_
GJKK ^""^rt^+ - ^^^ "^" CoalMines.-,,: _ _ _^^ ^_^
».^,.^,,,,,_
2 ^ ^"^^^-^•^
1 ^ "^8 ^ 2 1 1 1 1 12520Ma 74 0930 GJKK ^•^^^^- Coal M ines 2,a -^^ 8 2 - 1 1 1 1 1 308May74 0930 , GKFA,EA,EB!•-•^_,^ Michigan U. P. Shoreline S 1 8 2 - 1 - 1 1 11507May74 1400 GKGB , FB,EB , DB,CB Michigan U. P. Shoreline 5,8""^^ "' l • $ 2 -^ 1 - 1 1 317O7Ma 74.._-y 0930 CJHP HQ CP , G GKGA..^_E_1 ..... .QI ,.- .m... ... _,..._. Lake Nuron Shoreline (Mich,5.-..-w._ __^. 1._. ,... - 1- - ^^26Aor74
__1000, FK^I B ,, GKAB,BC,BBxCB CA,DA, EA Michigan U. P, Shoreline _5
'
^SW^'
f'^ ^2
- ^ -
24A r74 1030 GKEA,CJ^,DQADP^DN,DM ,^_, Lake Michi^an.Shoreline 1 - -
17A r74 ;0930 GJGD A.E. SS. - U, of Ceor^ia-^ 2,3
^'~""
1 7
^ 832~
--'1 1
---1
-1^^23• i-l0A r74 1000 CJGM GN^HN,. HP,HO
^^SE Michigan . Shoreline,
-3,5: 3 - 1
BA r 4 1000 CJFP ^„-„,,_,,,,,_,_,_^. 011 Refiner 1 2 1 7 ---
^ 2'1 - -_ 3803Apr74_ 0900 C,1CN Test Flight -. ,,_-.,,^._^„^ 1^8 _ 1 7 _ 2 1 - -
2UMar 1000 GHKN Fort PierceInle[ 2 - -^8 3 - 1 1 - -
^Mar7 1000 GHKN ^^^^ _mmT.^.. Citrus Groves 5 - 8 3 - 1 2 1 - ^^^
_
^^'-”19tiarZ 0.27.0 ^1l7Q y__ Boils ^, 3,6 1 9 - - 2 - - -^Me1jr^ , ^^ ,OQ CH7_Q,__,,,_,,._^,,,,^_,,,,,-;;,_,„„„ ^Oklawaha River; Florida 3 _ 1 9 - - 2 2 1 1 22_
Ga_l.(riarzy- 1,7QQ_^d^N Ann Arbor. Michigan , 2 L3^Si10 1 9 1 - 1 3 - -
1 ^_7DdanZ4__ x.1.49_ G3!'tL.P.L^,^L350 Wabash River Basin 8-^^
- 9 2 - 1 1 7 1'LO.20Nav _11.0. GaGHrJ.20....-...-._.....-.__^_.: Belleville., MichiRUn 2^'^' ^^-1 8 2 -
-y1 3 - 23
18$.eAZ ..IO.QO_: GJRN=.b_6] Lake Michigan _ 1 5 6 10 1 7 Z 1 1 -'1
1 395513SER. _12OSL Q,ION_^.,^..__.__._,_ Michigan „Power.Plants „ ^5 _ 1 7 3 ^__ 1 2 -
.11SeRZ3_ .DS_45.- .O.ILF.d79 Guelp Ontario^
1 3 - - - _--
1 -1
- - 68232.10&eRZ3_12.OLL.fi,7Lk ifP=234_.. Lake Ontario 5,,6.,8,,,,,,,_,,,,:,,_„ b 5 1 1 1
_07^eP.7.3._ 13.4.E ,OJjig_279 ,_,_„^.,,„,_,_w,,,-_,,»”, O^Y^Worm„_Infestaton ^^ 4 6 _ 1 7 2"^ 1 1 1 1 39,.OZBepZ3., .1b.0.0...GdD.R-^1b.7 ^ LaJce MiclLigan Y 5 10 1 7 Z ,^ 1 1 1 1 39.OfiSepZ3 1DD GJ.GN..GM_ ^_ Agzicultures_Wi_llow Run
-1^2,4,5_^10 , ^ _ 6 _5 -
4-1 1 1 1 77
16728AugZ3._ 330... ,GJHN.^____......Y_ eD.d_llaa^.H1S1]W.B^y-S7^e 8 - 7^
1_ 1 1 1Genesee Count Lakes 1 5 7' 4 lv 1 1 1 82
NOTE: ( 1) For list nt published documents which use airborne sensor data collected by E(2) For geographic reference system, see Appendix B,(3) For list of organizational addresses, see Appendix C,
F11ghtIndex Site. Description
Nominal..Spatial
Resolution(meters)
No.Spel
UV VI.Date Time Location Objectsug gr cu tore
20Aug7512Augj3.
12000830
GJBL',AM^O^i^'^•"-"^^-"4f^^"FKEC,FB,FC-27.^ ^^----'^
_ __Agriculture -"'_Wat^^^^ev^^owl Habitat"_"^^^_" ^_-•-_^-^^
14_^4;5 -"'^ ^`"="
7-"6
lOAug j3 1615 GJCQ ^ Wisconsin Power.P a3-^n_tg ^ 2_4^^_----^ 1 gOSi1u^
OT,dug^0300950"
G.1PN-^^h-'"' ^"'^GJFM.FN,GM,GN-27
9_"_-^....._...._.-.. Agriculture ^"^"Agr3cuituie-..__.....-.-.....,^.„...... T, Z,^S,Tb -""..2............_..,.,..., ^-,......_ 8_..^.O^Aag7O7Ju17306Ju173
150008150900
GJGN _GJEK,EL-O^i^i - ' ^^^•_GJEL,DL,E&-^i^^ -
Wi^S.ow Run M4AgricultureAgriculture - -^
11^....,._'^_-14_^_^^'_"--'"'”
-W'=
-""
_fib7
"""7^oSJul'T3`03Ja173^
Q9 01030"
'G.IA^J,Ak, -BL;I^M=b7:4GJGN'^-.-....;.-....,.._._._"-^^'^^^Genesee^County^Lak'es
Agriculture _._^ - ^l'
--1
-T_7
23Jun73 1015 GJGN Agriculture, Wil3ow Run ^'- Z'3'-"^'-_^ '7^
22Jun7314Jun73
D9300500
GJGN.GJGP
Genesee County Lakes -Land Use •
f_--4`^"""'"-"-^"^" f'
`7-"T
11Jun73. 1000 GJDM,DN,DP-167 _.: SW Michigan Shoreline 5—^r
-T10Jun73 0830 GJDK,DJ,CK-371 -^^- -'-'^_^^^
_Wabash RiverBasin ^ 5 B
OSJun73-
0930 CJGN,FN-190 _ Agricultuze ^
^ -'-_ `E,1307Jun73 0930 'GJGP '^ ^ Land Use" ^1 -7^31Ma 73 0930 GJHN LandUae - :Hi hwaySite. 8'-^-"-31Ma 73 0930 CJGP Land Use 4 1 731Ma 73 0930 GJGN. GeneseeCountZ .Lnkea. _ 5.-24May731000 GJHN, GN LandUse -Highway Site,. 1,1Q - 1
Ford Lake -12Ma 73. 0730 FKEC=FB,FC-21fi^
_Waterfowl Habitat - 5^ _ 1 7
04May73 „0930 GJDKzC^CK,DL-250 ^ Wabash River Basin 2,5,10 _ 82 A r73 0600 FJJA,HH ,.-^, A_gTicul tut c^ __.^^`^
Agriculture „TT,_,_,,,;^6 _ 1 6
1QA^r73 1130 FJJH,HH 4 ^ 1. 61,7^pr73' X1300 GJGN_,CP HN,FP SE .Michigaan' Shoreline 1 2 3,5 1 7^l}1^r73 110_Q_ GJHN
mm
^^Land Use - H^hway^Site ^^ Sµ 1 7
.J,a,Qp"r1,3. X100,,;_, GJEQ^;,:,_,^,„+, Forest Site 1.2.4L' 1.. 7llAor77 _0.&.3.0 _GJ^M _ ,^_ Lake Erie.Flooding 10 1 8
HJAL BL-188 Water Pollution NY Ba 10 l 8
}p.E I
^!f
a
i,NOTE: ( 1) For list at published documents which use airborne sensor data collected bg 1(2) For geographic reference system, see AnnPrtdL: B.{3) For list of organizational addresses, see Appendix C.
1
i
.•. 10? .
THE UNIVERSITY OF

FltghtIndex_
Site DescriptionNominalSpatial
Resolution(meters)
No. of ScannerSpectral. Bands
o.BoresighCameras Total Fli htg
Line Length(kilometers)UV VIS NIR MIR FIR BW Col. IADate.. Time Location Ob)ects
25Au 72 1000 GJ FN- GN- 79 Agriculture_,-^ ,_ 1;,.2x 4 ,i5^6,,,1 ,^,-.,, 7_„ ,-,4 - 1 1 1 1 .33219Aug7219Aug72-;0900
0900 GHHN- 233GHKL„,KM^^,^ _^Y ^
^
3amPa.»B?Y... .^,.^^.....-_,...._.SE Florida Shoreline
14. ___.._,....:,...,...1,10 1
_,:8 ..8
-?....2
»,,,,-, ^-
wl.,w,,1
_.,.1_ 1
_1_1
11
171 -. ,_,- 39
18A^92 0900 GHKL,l01 SE Florida Shoreline____ 2 10^^ 1_ 8_^ 2 _^ 1 1 1 1 15316Aug7213Aug 72
0900,0930.
HJBL^188GJFN-279^ ^ ^-^W W^
Water Pollution .,NY .. BightwAgriculture ^^
10_. __. ^,..1^2,4,5^
1^-
8µ7- ^
2„ 4µ
-
^^-^
1_1^^
11
11
1l
7656
l0AUg72O9Aug72„ 0830
^
1030 , .GJEK,EL;,;FK,FL^CK^GL-250 ,GJEK,Eti^FK^s FL,CRSGL 250 _
Wabash River BasinWabash River Basin
^^^-^-^ ^
2 St10,^,,,,,^2,5,10.
^;,^-
_8_ 8
^
- 3 _
^ 3^_
,^- 11
^
2
^ 2-
1 1 - 147L L 173 '
04Aug72 0970 GJFN-279 Agriculture 1,2,3,8 - 6 - 1 2 - 1 6531Ju17228JU172
14001700
GJLP,MP,NP-239P&FC,GC-216^^^'-^ ^^ '^
S Shore Lake OntarioWaterfowl Habita't^^"^^ "„»
22;5^^^^^-^^'^
1^ 1-
8"»^
2 -0
Y1
11 2
-1
-27119
24Ju172 1015 FJDP,DQ'CQ,CA-269 „_ Soil__st-,Landforms -_ 10^ - 6 9 - 1 ^^^^„^ - 1 106.E23Ju172 1015 FJHQ JQ HA CA-269^^a.._.x__.x^..___..^_.....^..-^_ Soils, Landforms__^ ^,_^-,,.^_,^ 10 ^^; -.^ - 6 5- 1 4 - ` 1 6022Ju172 1015 FJJN,JP-269. _ So11s Landforms 10 - 6 5 -^^1 4 - 1. 1530Jun72 0530 FJJE,,FE,GE-178„_,,,,,,_,„;,,,_,_,_ Arbuckle 6 Wichita Mts,
^1,, 3.7 ^,^,M ,. 1 6 4 - 6 2 - 194
28Jun72 1200` FJJS' FE, CE^178.. y, Arbuckle d Wichita Mts. ' 1,3,7 ^1 6 4 . .. - 4 3 1 - 10820Jun72 0845 GJLP MP NP-239
R^^ S Shore Lake Ontario :
^'^1 ^.1.. - 6 2^ ^ 1 2 2 -- ^-..'
18JUn72 0400 GJLP-239„„, W,_6 S Sfiore LakeOntario 2,4,5 - - -2 - Z - - —97177u 72 1200 GJLP-239
^^ W 6 S Shore Lake Ontario 1 3 5 _. 7 - 1 2 1 - ^213-_____-OSJun72
._1000,^.
_GJGN , FN^190 ,_„";,_ ,^ „^,__,^ Forest Site ..- .,--,w-.m.-__..,.._..- 2^3,-^,,,^,_ 1 6_ 4 - 1
^,_2- 1 . 1 •^' 100
25Mav72. 1130' FJBf^149__,,,_„_„_,_, Map Diseased . Trees^. •^ 2 8 ^ 6 5 - 1 2 1 - 39- 25MS 72 0745 FJB(^149 Ma^Diaeased Trees 2,8 ^ - 6 - 5 - - 1 2 1 - 23^4^py]^,_ .G_g.^Q. FJD^IQQ ,_„-,.„ ...... ManDiseased Trees ^_. .___..._..,._....._,_..^^w^.8 -_ 6 5 - 1 2 1 - 3^.1ttaJCZ^ j^QO:, --FJAO _____... Black Hills• . GeolaRY 5 1 5 ,^4 - 2 2 1 1 1,16_3gM :Q.Z^9^ ^K^Q,^C-216 _,,- Waterfowl Habitat. 2 5 1 7 4_ - 1 1 1 2 2161 ..2.L40_ Sr.J411.__.._ Virginia. A.E.F. 1.3 _ _-. - .^._ 2 - - - 19_;12Meyj2_ _7,.1,Q.G_ G„d,QH,^_ , - Virginia A.E.E. 1 3. - 8'
,__ 3 - l^ 1 1 ^2 19 —-12t1aYZ2, .A.9A.0_..Gdl',1^.^„„„_ ._....'.._.,--^....:.......^.... r cul useL+e._^'-___F,_._._ .....,»,_..,..,._..^..._ 3,_.....-.^^ ..».._ & - 3. 1 . ^2 ^.—_
_ 1_3 1:_......_._...
_11Mayl 1345 GJl'..K:.. Q.4J^LtownBaltimore_...._..._ ^,5.^.__._^..._' 8 3_. _.. -: 1 4 - _ 7/_11MWe1 1G15_ G.dF$-.Q1Z _^ Dottcttown Baltimore 3,5 _ 8 3 _ 1_ 4 - - 77itM^o79 ..^,a.P1L-A ctwntovn $.g.]^more..^,._.,,.....:.,.,.3, 5 8 3 _ _.__._ 1.` 1 _ - 77:
W Hands ^^ 1 2. 4 8 - 8 3- 1 3 - 1 .134
^.. ^___ 1 _ ^ _ I _ l a _ _ ^ _1 _ _ ^ :j.,;
a^R^M r
FORMERLY WILLOW RUN LABORATORIES. THE UNIVERSITY OF MICHIGAN
TABLE B. M7 MULTISPECTRAL SCANNER FLIGHTS{Continued)
Sheet 3 0[ 7 Sheets
r
Flight Index Site DescriptionNominalSpatial
Resolution(meters)
No. of ScannerSpectral Banda
UV VIS NIR MI FIR
o.HoresighCameras
BW Col. ColIR
Total FlightLine. Length.(kilometers)
Date Time Location Ob acts0 Apr73 OB00_ H, JAL, EL-168 Water Pollu tion , NY Bad__ 10_.,,,^,,,,,,_^,_,,,_, _,,,_1_.__,8 „ 2 - 1 1 2,. _,_,; 30A06Apr7325M^r7324Mar7323Hnr73-20Mar73
. 1300100009300970-1030_
HJBG-186 _,.GJLP^sMP.,NP^239 ___„ __ ,__ .5GJKP, LP,MP,NP LPP-239GdGM,GN ^_^_GJGN.__...,,......,r.M,...._,,.,._., .. __
Water Pollutions ,» NY , Bay _ .10Shore Lake Ontario »__
.Guelph 6 SShore L. OntarioLake Erie Flooding. M_Borest^Stes ^`._ —
^5^7s^ ,9^^4 10 .2 10 _1 „^^^ ^
111
^ -^-_._._
B8877
2224 „”
.. 4
-
^-_„.d
111
^11 "_._.
1113 Y
_ 2
222-1
-11.-1
7777
_23B _,-,3519
20Mat73 1030 CJGP --,..._...__.,,_._ Saginaw Bay ,. Flooding ....._.__.w..m5,10 ^ -...._......._....7 3 -._.. 1 1 _1 1 114
25Jan73 0900 .GJDM , DN,DP„-__,-_,,,,,,,„ ,„_,_,,., Y'
SW Michiga„n Shoreline 5 1 7 3 - 1 1 1 1 6312Jan73 1400 C7GN, , CPfHN LFP ^,____^, SE. M1chi an d Saginaw 8n 1,5 ,_^, 1 7 3 - 1 1 1 1 35
Shoreline ._.....^.SE Michigan d Sag inaw BaY
,...,..,_..».__ .._ _:..._...lOJan73 0900 GJCN,GP^fIN..„-_„ _^,,,-_,,,-„ 1 3 5 1 7 3 - 1 1 1 1 66
Shoreline _,,,,_„_,,, _02JSn73.
_1000
_C^DK^250
„_„^__Wabash River Basin ^ 2.5 - - 8 3V 1 ^ 1 1 1 30
17Nov72^1„§Qlovj.^
OQ00Q22_
,,,,,,,,,,,.,_GHHN;,,,233
_^^_____
CHKL,KM^^- _,.,,„,„„_,,_,_Tam a BaySE Florida S,f1,ore^ine„_,.-,__,^_;
11x_, ,11_ _,_„^
11
8_8
22
--
11 -
22
1_1
--
106181
1^Oct72 ,, ,_Q^^O„ GJGN,FN-,1,Q0_,_,..,.,,,,,,,.__.,_,,, Lansing-6 Ann Arbor,Mich. 15 1 6^ 3^ - 2 1 1 1 71170ct„Z2_ 1,00 ^ CJCK CL,OK, ,DL-250 Wabash_,Ryec Basin ,,,,_„ 5,,10„^_,,,,,,^ ,^,,,,-_ 8 3 - 1 2 1 1 97
10et72 0 00 EJEF , DE,DF,-130.,_,,,„,,.,,,„„,,,,,,,„,,.,,:„,,,_ SE California,,,,_„,-,-__,__„_„^ 7 ,^,1 5 3 - 3 _ 2 - - 163
Q1gaC7^ Q3Q , -QQ2.Eap Halloran Sorings ^^96 1 - - - 3 - - - 56
305enj , _1200_ EJEF , DE,DF_„130 _„.,,,,,,,,^_,,,.,^ , SE California ^ ,_„_ 7 1 5 3 - 3 2 1 1 163
^.SeRZ.3.. 3_QQQ._ E^RF_-QQ^..r...,__...,».,...-,. ..._. Halloran SErinBs._,._W.._.......^ 3,6 -^,_ 1 6 7 - 2 2 - 1 56__3.4.5&RI.:Z_ _1^OQ^. GZ.£N.._._. __ A riculture 2, 5 - 7 4 - 1 2 - 1 1 ` 19:_34SsRZ2_.13QQa,13SeRZZ 13Q0
G,I1:4...ZZ4^_.._.._..__..,;.^...GJGN __,, ,,, __,__,_,_^,,,
OawormInfest,Btion„„,„_,,,,,^Ford Lake 6 Be lleville Lake
3,46, ,,2
-_ -
7^4
4-^
11
2_,-
1-
1-
5818
.4ZSaR12_ QS.^Q_ &LKP,MP 23y _,. Guelofi ^-0n [ario ,____,,,,______ 4 s 5 1 8 2 - 1 1 1 1 142
..1I5.8EF7.2:..
..3.GlwBZ2.__09.i1Q.._.1.03Q...St.^#GRL.._
.G,].Gil..,.«..._........,-._..__.....,....,.,.:.. ,.......^.__._.__._:-_^ _._ _
QG^L?9F_e CourLty_La^Ces ^___.,,,,_.„Land Us e
1 __5
1i
77
33 '
-- V
1^1
^1__2
-,^-
11
3463
:29AupZ1__
3.QADSZ2_1.OJG_.G,iGR._.1._4.0.0...___
<__.__..._.,._.__..GJ,GH..GN..HN...faP_.HQ..CiP.Q.
^_
C^nesee „County Lakes „,-,,,,Sr$_ M.7^Cb3SaD b Saginaw Bay,,, ,,_$,^orel^ne
4,__,w,,,_;,.,1,,2 5
11
77
53
-
_
11
21_
-1
11
7794
29AugZ2_ ..pfl30.._ .GSGM,.GtL-.231.._...._...,,._._.__.v.+..._. .^11^auil.lee?f€G3B.RSI.N_,.,._.^...S e
3.,4 _-.^1
_77
-4 ,,,,,3
,-,;,,,, 1 _^1^
1^1 T
11
11^
11169.
NOTE: {1) For list of published documents which use: airborne sensor data collected by ERIM, see Appendix A,(2) For geographic reference system, see Appendix B.(3) For list oI organizational addresses, see Appendix C.
Sheet 4 of 7 Sheets
NOTE: ( 1) For list of published documents which use airborne sensor data collected by ERIM, see Appendix A. ;(2) For geographic reference system, see Appendix B.(3) For list. of organizational addresses see Appendix C.
. I,
`^L108
A ;,.`
;,
,_. - --- - - -- -_---- ----^T _ -- - --- - -- ---- --_ --_- -- - - - -^._ A ,.
^^.,,_ - _

_?
Nominal No. of Scanner No.BoresighTotal Flight
Flight Index Site Description Spatial Spectral. Hands CamerasLine Length
UV VIS NIR MI FIIt BW Col.^Resolution(meters) (kilometers)
Date Time Location Ob)ects
-'26Aug71 1130 GJCK,DK-277 Corn Blight SV^^^^^ - -8 3 1 1 1 - 1 8317Aug71 1400 GJFN-2l^2 M.S:U. AgriculturalFarm 1^^-'^^ - $^ ^ - 1 1 - 1 3817Aug71 1130 GJCK,CL,CM,GJGN-277 ^ Corn Blight ”- _ __. 1,5 -_^^^^^^^^„ 3 - 1 1 - 1 2
13Aug71 ^1300- CJCli,DL=277 - Cocn Bl ghc "'"'"”"_
'5`”'-”""` „ `""""= '"8 - ^„3" -13Aug71 1130 GJCM, DM-Y77.
_ _Coin Blighi""^- ^"'^ _ '^'-""^ S-' —'
_^^ =-^ "^ - ~^T—
12Au871 130 GJCH,CJ- 277_„....x...... Corn Blight - 8-"''3 -^ Y .^ - ^T^—
12Aug71 1130 GJCK,DK-277 Corn Blight 5 - - 1 - ^^^^—
12Aug71 0900 ^CJCJ,DJ-277. Corn Blight 5 -3_
- Y13Au^71. 1130
r._..^.GJCK-277-^^^,^y^„^'uy^'^
___...^_.. ____^Corn Blight :_^ M--.yam„^ 5^—_ ^^„'-'"_ _ -g". _1- .. -11Au^71 1000 GJCK,CL,DK,DL-277 Coxn B13ght ^5 '-'^ -„^-'” ^- ^"B - - ^-06A^71: 1400 GJFN-282 ^^„ M.S.U. Agricultural Farm. 5 - _ - '7.'^ - ^S6G_—06Au 21 0900 GJFN-282 ^_. M.S.U..A&ricultural Fa^rm.^ 1,2,5 - 8 - - X3395Aug71 1300 G_JCL, DL,^K-277 ,
_._^^Corn Blight ^--~- ^ 8
-'- - 'b'l--
31Ju171 1300-^
GJDL Dx_ M-277 Corn Blight S' - ^"'„ - 1 -„I - "5^-31Ju171 1130 GJCL,DL,DM-277 - Corn Blight - 5 - - -29Ju171 1130__ GJCKxDJ-277_ , ^ „^^ ^'„,_ ,^ ^Cocn Blight ^^ - _ S ^ _ - - -
-'29Ju171 1000 GJCK CL-DK-DL-277 Corn B11 hg t ._3,5^^
_ - -"8 -- I^27Ju171 .1230 . GJCHa CJ^277,,:,^^^„,^_, Carn Bli hC 5 - - ^—
, 27J_^ u171 1130 , GJCK;DK-277 Corh Blight - 5^^ - ^ -^
^- - ^-27Ju171 0900 GJCJ.DJ-277„ 'CornB118ht^^^,^.^^5^_ '^ ^^^ - -'^38-21Ju171 1130 GJCK,DK^277. ,t Corn Blip^ht 5 ^ - -1¢Ju171 1230 CJCH•DJ-277 Corn Bli ht 5 - - -,3¢Ju171 1000 GJ_CK,^CL,-DK.OL-277 ^_^ - Corn B13 hg t ^^„^^._ 5'""^-'^^^^- - - 8 ! - - `i7-3§Ju171_ .Q,^00. GJCJ^DJr 277 Corn Bli ht 5 - .^ - 98
130,^
GJCL,CM-277 ,^^_ Corn B11Bht:. 5 ^ - - 1 T- - ^^'3^^^;,2_Ju^71 1300W QJCLyDLw277 :..._,.,,,__-,,,-_:. Cotn Bliyht,,,,.,,__,,^_,_^,^ 5 8 - 1 -. 1- '^H—_],.2^uh]1_ 1130 GJCM DM-277 Corn Blight 5 .___._.r.^._ -.__„.r _..._.. :._ -_...._ - ,. . `9^.QZ^L4 7 _J,400^ GJFN-282_, M.S.U. Agricult_ u_ral £army_ 1,4 _ g _ -_ 1 ^._
^ZJt11 Q.92SL. GJDJ,CL^277^,,,;^„__.^__-„+; Corn Bli ht 1,S - 8 - 1 --.39,1un 2.3.0_ Cc.LS^iI:,&'J- Corn Bli ht 5^ - 8 - -
GJCJ nJ-277 Corn Bli ht 3,5 -- 8 3 - ^^ - --9^8-
FORMERLY WILLOW RU^d LABORATORIES. THE UNIVERSITY OF MICHIGAN
TABLE 8. M? MULTISPECTRAL SCANNER FLIGHTS(Continued) Sheet 5 0[ 7 Sheets
8F11ghtIndex Site Description
NominalSpatial
Resolution(meters)
No. of ScannerSpectral Bands
UV VIS NIR MI FIR
o.BoresighCameras.
BW Col, 01IR
Total FlightLine Length{kilometers)
Date Time Location Ob ectsCJ ..._M_____ Local 1,,3 ^, 7 4 - 1 _ _4_ _ „„,J ^.¢J
12Nov71 1000 FHLQ,KQ-175 _ Houaton,,^Texas , ^„^^,_' 2,,3.5 8 3 - 1 - 1 -11Nov71 1300. FJJA,KA,FHKQ-175 _-___,- Houstont_Texas ^ 5 __,___ 8 3 - 1 - l - $011Nov71 1000 FHJQ,KQ-175. „-„^ ,^ Houston Texas ,,,^, „ ,
'^1^5,_ . - 8 3 - 1 -^ 1 - _ 128
OSNov71D4Nov7104Nov71 -
080012000800
GJFD-217GJFD-213-"^"—^^^^-GJFD-21'3
Forest S itesForest SitesForest Sites
101030
---
8B8
333
---
111
---
111
---
324040
03Nov71 1200. CJFD-217 Forest Sites 10 - 8 3 - 1 - 1 - 32280ct71 0930^CJGN-190 ^_-_ Ann^ArboT, Michigan 1^Y,5,10^ - -_8. ^^^3 - 1 1 - 38060ct71 0400_. .......^..._t...^±.r.._._..^_._._.^GJCJ DJ CH-277 ^^"-„^^^^- Corn Ali ht__.^__..^....,__._....^...,..._............_..._ 5_____..^_._.._ -__ 8 3 - 1 1 - 1 110OSOct71.1230 GJC, H^,GJ,CK,DK-277 ,_^ Corn Blight b - 8 3 - 1 1 - 1 123OSOct71 0900 - GJCI,DJ-277 _ CoinB1{ h[ 5 ^ - _8 3 - 1 1 - 1 9824571 1300 GJCL DL-277 ^^ ^ ^ Corn Bl^ht ^ 5 - 8 3 - 1 2 - - 80245e 71 1130 GJCK,DK-2'7 Corq Blight 5 - 8
-3 - 1 1 - 1 82
24Seo71 1130 GJCMiDM^277 Corn Bli hg_t,_^,r__,_,^ 5 .^,__ - 8 3 - 1 1 - 1 9124Se 71 1000 GJCK.CL ,DK.DL-277. __,„„„___,_,.CornB33ght 5 - 8 3 - 1 1 - 1 83
21Sep71 1400 CJPN _ _ - M.S.U. Agricultural Farm ^
1,4__, ,. , - 8' 3 - 1 1 - 1 4318Se 71 1330 CJGP Flint, Mich^an -.^1 2,4 - 8 3 - 1 1 - 1 12117Se 71 . 1830_GJGP
_M,
^^FlintyMichi a& n ^1 - - ^- - 1 - - - 49
17Se 71 1530 GJGP ^_,,,_ Flint, Michi awn _,_,,,_,,,,,^_„_ 1 __-,^-
- 8. ^3 - 1 1 - 1 31153en71 1645 GJCN-190 Ann ArborL MichiBan _,._„_ 1 - 8 1 -^ 2 - --
„1.6
-155e 71 1230x GHCH.CJ-277 N,^^^-^
Corn Blight , ^
5 - S 3 - 1 1 - 1 74'15SenJL 1130 _, +^CJCK AK-277 Corn Bli ht
^^'^„^5— „., „Y B 3. ^- 1” 1 - 1 _+82
15Sep71 0900 GJCJ, DJ-277 Corn Blight^^ 5 - 8 3 - 1 1 - 1 _9814Seo71 1300 G,IOLiDL^-„_,277_,.. ^ Corn Blight 5 B 3 - 1 1 - 1 981 Sep71 1130 _ GJCM, DM_ ,277 Corn B11ght__,_,,,,,,,r_„,^,,,,_„_
^5 - 8 3 - 1 1 - 1 91
14Se71 1000 GJCK,CL.DK^DL-277, Corn 8118ht 5 B 3 „^ 1 - 1 - 1^ 64
24A518Z1 1^3Q_, G;7p1,DIL_2^^ W^ Corn Blight,_,__„^,_„ 5^,,,v_ _ v8 3^ - 1 1 - 1 2929AJ! ;134 ?^k.liL^7 _Corn Blight.-^.^^__^^^^._ 5 - 8 3 - 1 „ 1 - 1 80,gQp^ 11^Q_„ GJCM_,DM^277 ,^„_,,,,,-^„_ _`^ Corn Blight _ 5 - 8 3 - 1 1 - T 1011.8Au87 123A._ G.7^li,.G.I^Z D Bk1Sl15.^. 5;^, - 8 3 - 1 1 - 1 7428Au 71 1000GJCK CL DK DL-277 Corn Bli ht 8.
NOTE: ( 1) For list of published documents which use airborne sensor data collected by ERIM, see Appendix A.?^ (2) Fc:• geographic reference system, see Appendix B.la
(3) Eor list of organizational addresses, see Appendix C.
ti, Sheet^_of ^ Sheets
' X *:OTE: (1) For list. of published documents which use airborne sensor data collected bq ERIM, see Appendix A.(2) For geographic reference system, see Appendix H.(3),For list of organizational addresses, see Appendix C:`
.. Y 4
t^
;z 109a
,,^,
ri
r
—^ ^.--__.

RIMI M.,.{ MIME HI ^ A-. ^.N H . ABURATUNii ^ ir. {. UNIVERSIT. , ..♦ h
TABLE 8. M7 MULTISPECTRAL SCANNER FLIGHTS(Continued)
Sheet ^ o!_2_Sheeta
Flightlndex Site Description
NominalSpatial
Resolution
( meters)
No. of ScannerSpectral Bands
o.BoreslghCameras Total Flight
Line Lengthlkilometere)UV VIS NIR MI FIR BW Col. IRDate Time Location Ob'ects
unIlJue71tlJue71i^
10001300 ..i33
— i=...........C]CRtCL OR p. --V
CJCL^Otr .i
__----^W _
saw oit=lf7'-__.._._..^—
re t iCorf^l! t __...Con t_TM.^i _^_ ^
^._._.._.__
--• —__-___---_
i-- -S-
3-_ ^-_ —
^,--I--^.
----
i"
r
—af __.
Ib'F—^--___-^—
--- -- ----- —r-__
NOTE: (1) For list of published documents which use airborne sensor data collected by ERIM, see Appendix A.(^) For geographic reference system, see Appendix B.(3) For list o[ organizational addresses, see Appendix C.
l^n

RIMFORMERLY WILLOW RUN LA^ORATORIE S. THE UNIVER:ITV OF MICHK,AN
TABLE 9. M5 MULTISPECTRAL SCANNER FLIGHTS Sheet t oL io Sheets
•
Flrght Index Site DescriptionNominalSpatial
Resolution
( meters)
No. of ScannerSpectral Bands
o.BoreeighCameras Total Flight
Ltne Length
(kilometers)UV VIS NIR M1R E'[R BW Col. 1RDate Time Location Ob eels,12,SPp,ZLj^yj7
1 .830_ .11)0 .
GJG. .. _.^_-.- -- -GJCNLn1-277---- --.._P !n(,_ XichlLe __-_,___._.. _Cora_falL t S 1
-2 1
_.. _.. .1 __
- i --___91 ..___.
u i 04Q0 GJCJ^-.t-211 . Con_ 8 h -_S ^_._.-. .r _ f -_.
-
:_
- f
-^-_-
-^I---]lAuy7} 1000__
G1C1C1CL,OII.D1.-2___._- _
Cori. ^l^t -- --_... ..----. _ ._f._ _ .i_
,Q¢Auj]1 . lAOq_ . CJPN-282 M.S^II. A^rieultura[ Iio__-_ r . - _T -_.. _T _. -_^._-
Qti^ 71 0900 ., GJ_ft1-^ _ _ -..---.-_..
Na.U:-A^rievfurifl. _ 1,73--_...1._ = - _ _ . --_^--
9T^Nt?. X34. citic^a,nt^---.. corn._^it-^-.. _
---Corn^B^t
3--.---_. __ __ _1. _ - _ ^.-_
Ju 7..J^,jy,Ju171^9Ju1.1127Ju171
130^_... _..170
1000_0900._
OJCL DL d1-277.._.i .._.i_._.. _..------CJCIC,iW_277CJCItiCL ip.-^GJCJ^DJ-T77_ . - -- __- _
'----1^-------_-_ - - - _^-
Cora 81! t__.__ _,^^h^re 81L8ht _--_
t7ore Yi_l^t- ---- -
,- -____.
1 -.-
33`
T_ --
--
_ "3b--^-
_ _ _Sul)} . 000_. CJ^CL.DK,D^ Coro^TlBht-_ - - - -bT--143.17 0900
_CJCJ ., ,^.l-277— CorRiCi t ^...-- -- - - T- ^ - - T ^_ -
^Juj1 1190 GJCL .at=2ii _—.,__— --- con^iii ht^^ ---^--^ - T - -__
-^f-12Ji117 1.14. c,^CM,gt2n core s ijhe_---- -- - T - - --^7-'-_4Z^ 7 X00 _ GJPM-252._-------- _, X. B.O...^rlculturaTPaa --
__ _._ -. -_- .^--
.41.[ltll Q0__.
G)D.i,cL_- . 217 ...----._-..._._G.ICJ .DJ-27 7 ._
CorR ^l^c_..--------Corn Eli t S,3-^---^^^-
i - T __ ..T _ - T _._^-
- 7 - -24duD1 .44Q. GJpt.QLL a IBC lM,'^)j__ . Cora ili ht --.---
- ^1$,IS141 1109 GJCL,DL_2.77--._...--^----._ Cora ^li^-...-__...---.... 1, _ _ ---^-_jQ^ypjl 130 GJCM,OM-217_ .Cora sl! t_ ..-----..-'_ _ 3 ._
_ -
._
14T1tY 6QQ_ GJDN 0M^D!- 6^7 ------. Cook lover t sat ^---_
-^ .4489.._ SriOlt .R1,4L-1 __ I T -111yy 4D_. GJPN-282__.,__,._.—,
cook. ►ow -Flint --X.B,U_ rieultun hn 1T^- ^- -- ^-.6.....
-I _.^ - --
'21i1aY2-21Xax7171111aYI111tlay71
.1129-
11,}4.__
.1200.
G,701t.AI,Sc?.-177-----415,/.O,I.fiaS^2ZL__-'-Sei^.l?tC:^Z?.._.._-_....G,I^1.,LK.^.t-2LZ.._._...-------SnTGM.SI1.,Q1,:111_--.CrZI^Rf.9J=T1? _-------G1t.P_...._..__.._.---_---
Corn 811[ht --_-corn_ . ^lidrtC_orn_ttli hj-t--_-___.._.^_cor_s ^li^ht---Corn ^lijht __.V` _Coro ^iijhc ..-,---.-----M..S.ttort. Lak^0a^i10 __.-_
5-- --_
^---115._ ._s_ _
Tb-__e1._.__.._.._
.--_- "--
_ _-
-
;-i4-^_4_._
_S-__
3-.^
_d-"...
T
-..-
r.T-
_T"._--..
r
!-
.___.
_-
-
=
-911-----
-E^---
--Zli9--_
tvvrr:: tll r'or ltet o[ puollsneD Documents wntcn uee alroorne senttor aW CO11eCteD uy ERIM, see AppenAbt A.(2) For geographic reference system, see Appendix B.(3) For list oL organizational addressee, see Appendix C.
Sheet 2 oL to Sheets
Nominal No. of Scanner o.BoreaighFlightlndex Site Description Spatial Spectral Bands Cameras Total Fli htg
Resolution( meters)
Line Length(kilometers)UV VIS NIR MIR FIR BW Col. IRDate Time Location Ob'ects
aflirty 1 6900... GJLP -
_...- ore a tar oSX Shore Laka Oetarlo _
,S __ 1
_9-.9
.3._..7
..._-
^_.2
__11
1 ...._.1
1_
^2 ____- 55^7iL^7^1^y7I
i^00^^340b_
CJDN DIt,DP - ^ -- -^---------CJGN
Coo3c 'eivir 'laat ^ ^ 5,10 ^^^-^--_
T-_-_- _ 9^^ 9^^^--
- 2 ^1 ._
1 1 _ 128-
- d --_-_-^oada-- 1.2,5 1 9 6 - 1 1 1 1,_ 923bAp"cTi 370 6:1DN';Oti;6F-IdT —ook?iwr Tliet _—._.. .aa_---- ^- —y- i-- ___ -z-- -i i 1 -- 3i .-"7i£tpi71
-_..C7uN,bA;60--I3T------ cooE"►awr 7Taei---- ,-f6_..__ 3_ .^_ .T - .^..._ _1_ 1 . 1 9s33n^:7I'
^GJ""tNf.-lifi.Dg=TbT----
^Doti-love'i^?laat..____._..- .._- ^^^^jb- i. f j _ - 1 1 1 66
2SA v _ 1 bJDNOM,Df-fbT- Cook^^Pover ^lag t^_ ^--
5,10 - 9 3 - 2 1 1 i 57 -rTf a48b G1DN,1711,D^-SaT- '--___
--oci-1'owr 1'Tiot -
-.IU--_..._
--__^_ T._ - 2
_^ 1
_120-f _prTf ^D f-OM.u^Tb 'S C^"oof' iow^ ^laat - - - - - - - S3_r7i
'f-Lr7^
^..
0680,.GJDIi 3 O11,bf-ldT - __CJDXs011`-1-37-
Cook Fowi_Float -__--Pwf[-ilaRtCook
S,hO-----__ 9 3 - 1 1_ 1 61
S^lO 1 3 - 2 1 1 1 1122LA^71 1400 CJGN _ Tiat llij^it _ 1 10 1 9 ) - 1 2 - - 1611ILr71091Lr71
09000400
GJFPtGi PG -- -------
Y D1uua^Trua St 10 - 9 6 1 1 1 - 1 144PIQQ-1 S .__ Xowtoa Aru taut Sitaa 2^^ - - - - 2 _ _ - S209Nar71 0000 PX^-17S Nowton Aru 7aat Sltaa 2 8 - - - - 2 _ - _ 5208Xar71 2000 ^__TNKt^17S _ _
^- ^ ^Xowten Tait Situ ____Aru 2,8 - - - _ 2 _ _ _ Sp
OBXar71- 1u00 hilt 173 _ Xowtwi Aru last 31taa 2 8 1 9 3 1 1 1 1 5308t4r71 1200_ . PHICt^17S Nouaton Arta Taat S Staa 2 8 - 9 -- --1 1 1 69, OBNer71046fer71
08001100
PNR^_^17 3 Nowton _Aran Taat Situ _ 2i3 1 9 3_ - 1 1 1 1 69FNE^173 .--- ^^ Nouitoo^ Aru Taat S1ba - '- -T,5 "-04Xar71 OSSO PX104-072 rlcuitura , - - 1 1 - - - 6903Xar71 OSSO PFIit#1-03 rlcultura ^ _ ^ _ - _ a'q'-27PeD71 1300_ f10Dt-072 rieu tui ra - ^'f----
-9 6 - T i 1 - 7815Dec70 1000 CJMJ^M--_ 18May 81tu 1 '^,^^i ^
_^^'--
14Dec70 . 2200_ GJMJ_iMB ___ -_ ijhva^ Sites S - - _ _ _OtiNov70 .QSNov70
0870 . _1330
CJQN.LPItafJ^_47-252 ..-...,OJQp,PN, ►J._lLl
haupuka (41'_..-.._--- 1 ^ 10-_ ._18 ^
9 S - ^_ 1 ^ --^84
06pov7Q 100_,-2S2 --_
CJ^1^iQ[-232.__-.-aP^ake _^___-
haapulu__^__1 S1__
__T
.99
_..S
'.-
_1 2
-_1 1
'^-10100ct70 0730._.. LJLP-002 _-_-__ PSaeah Craur
.__-.1,7
- 9 3 1 1 1 S144^47Q 0800 . ^.EJEP-002 ._.__ PipLah Cratar _ 1,3_ 1 -9 ._ --^._.. - 4 1 1 1280ct70 1200 EJAD AE
—__.n
_ - -........ ,., .- „oa w Nu,. ,^ uvi uu^c wmcn uee a^rwrne nenaur aaR COIleCteO [ry LIUM, eee AppenDUt A.
(2) For geographic reference system, see Appendix B.(3) For list o[ organizational addressee, see Appendix C.
111 ^ pl.^^
of ^° ^^

RIMf ORME RtY WI^^OW RUN LABORATORIES TM[ UNIVERSITY Of MICN•GAN
TABLE 9. M5 MULTISPECTRAL SCANNER FLIGHTS(Continued)
Sheet 3 of to Sheets
Flightlndex Site Description
NominalSpatial
Resolutton( meters)
No. of ScannerSpectral Bands
UV V1S N1R Ml FIR
o.BoreslghCameras
BW CoI . COI'lkilometers)IR
Total FlightLine Length
Date Time Location Obj ectsct
^OcF70TtT0ct70"TbOet-70
0600
07000001_GJGN,/fi-
_ _._ _.. _GJGN _ _.
cSON-ri------__.-.._.___--
ore^t ites ...__.... .... ..►oro^t lStes _
►oio^t 6ite^ __ -_--^)eenit lias
1_,;,5,10.. _
2 ._...__ _.l --.
_-.--_'.
. 9_.
__-
.) _.-r_..c.
.r_.-._
_-_
3...I_...!
_2.-_
__
1.. 1._-
_..__._l2. __.to
-_22_.._2.. _ -..._ _1L--._
-DI&t70"3DBep703SS^y703I'Sip10"^^p70-
100011300II0004704770
CJGN ,IU - -'^- `"-cJCw YN
.-'_._-- ._cJF► CT l'0 -- . _.cxJty 3tt tiff
_. ___. __cNJF,Jff--------_.- _.__
___onK_ litq._. _
ion«c llceE -^-- __p Diswsrrd - Tress ^
loll II01lE t- _ii ti^ .}ef toaR^^Roi.:
_1 2 3.0.10
2a 7e^f;^
-_-____
!^ .9
6 ..4 _! _
__.__-.
. 1
2_._
.3..._l.
1_-
1.. -__.._ZL.--74
}_.._ _^i _ _._ 18,yip
2 ^ '- .
' ^-__-
_.^-
^., 4._...
-_-_
--
--
98^149_
TDSip70iasP7o
01!00al3o
OtfJ► Jlr'^ "_-_'-cx3r JK rtr ----_ _
ltiii ^OI^E filar ut ouiitikl6l•: ifc.r heTlJc loR
---" -I- ^,,.
- 1 2 1 _1 1}3->ao- - T - ^ "6 i• } i ie7 _
T13:p70 f700 rabL=3S0---- -- - -- in iIilht_____..___ 9_-_.- - ^^--
6 1 .-
1 _ 1_ - - _-l4fL_T13ee70a45e37b03510 ^OSS. 70
0300 -_CJOL-330- t_ore Tjhi ___ _1eA11jip powr ►^^ti _+
77 3
__ -_ 9. ,_,_ ^ _7 ,!6
1 ...-}1_
1 _^.
_},
1 - - 704b014b00900
GJl1t !N Gi,Q1 TCK^i1GJ^L-fSO
.._._. .. .__ -CJDIr2S0 - -
^ - 1 _...1...1
1
i
-• -----
-^^---Con !11 h/-t--'-^ -^ ra llilht --. '---3
--.-
_'.._9
27Au!_021Auj70
20001000--
NKFJ1=}^0 _._ __.-.__.NKG=7^0^ _^___._._. __-.
_tMart Nt..,,,ll^iw^-__._........tAurt Mt. 11^itr_.._..--'---t
2 ,,^ .1 . 2 .____.^ --
-'.- ^- _ 1 } - - ._ 19_ ' _`._.
.-_..
_}.._._ ? _ 1 _ 1.... _.__._._16---
24Auj70 161.0 GJDNL1H.yDK.,pf iCJ-27)_-...- __rn ili^t._---._. . _ . __......_ - _ 9_. _6... 1._. ._ 1 __ 94__2iA a70.2L1uL0
110010i0^
yGK,DL^Ck._ ,W _277 __._.. -._^ QI ^
^ `__.___._._.__-,._orn ^111(!t..._...____......__-.
reniturt_.___.--.--1_.._.__....__.1 S_
-_1 _
_9 _9
6_ .6_
1__--
11 -
1 .2_-
1__ .1 -
1l
99 _22_ -2L1ul10
13Auj7007301070
GJ/01 ricuitun...__- IyS t10 }_ 9 _, 6 -_ ._6_
^.1..
1..^._
_2 . _ , 1 1 92_GIOb.CL -
'-- -
__..-rltultut• ___._ ---__ -- li..^ .._.._.__. '_ _9 .._1 _ 2 1 08-_2'----11A^70
06Auj70OSe 70
137001301000
JOLiCL rieultua --or.Et 31tn
2 S. _- - . 9 6 ..._ ._1_ 1 1....'._
2 1-
___.__ 16^-.-70CJGN,rII_ 2 7 -
__.
._ _.-- _.-_.___9
9__ _
_9 .._9
- 9, __
.-_...6_-_.646_ _6
1 .1}_1_,
.^1_1..._.
7WQNi►! orwt, Sick_-___ 2 7y4,6^30
2 _3.„}a=as ..__...1a7as.-_.i3 -___
171
_}_ ,1
2 69 .-31Ju170
1Ju170_29Ju170 ,
?7I0031Q ,.09Q0_ .
IKTC Lt7C _ _ _FKFC,CC ,_._-^-,^_.. _.EJQK ,_ , _,-EJQK __.,....__-y.EJQK,___..__. _......EJ K
Nr[ovl_11•k1t•trat•r[ovl , 11 ►133 ._.___ _.
.on•t.31us _..__.._...__...._-._._.on^t Sltn-.------____foreet,5lte•_. .._.... ._...1..7___.._...._...Fore S
_ ^.,2._
-1
-1
-, 77102
?._..t .__1
--_- _..
_2 .„?._l..
._-__-
29._..__ _.23__._-
28Ju170---.... -3BJu^7Q28Ju170
150011000700
NOTE: (1) For list of published documents which use airtwrnr sensor aata couectea oy arum, see nppenaix n.(2) For geographic reference system, see Appendix B.(3) For list of organizational addresses, ser :Appendix C.
Sheet c o[ In Sheets
Flight Index Slte DescriptionNominalSpatial
Resolution
(meters)
No. o[ ScannerSpectral Bands
o.HoresighCameras Total Flight
Line Length
(kilometers)UV V1S N1R MIR FIR BW Col. [RDate Tlme Location Objects.'.i.,IJ1L^9..Z1.1u120.. 1130__1LIJtl141Z.J.w1I4..
42A.0_
OA444iQQ...1^R0_.._.
. G.ISrL.Sr?l.._.----- .._-.._._._
.Shli4,^ll!_.___ -._...._...-._ _._.....__.._.._._..
_.G1.G19..@L. _...._._ _.__.______...F'over . Statlon . Cemeot. .Plant.Povs[ _Statlon.cement Ilt!!LE_NuclllL_POxir_Plagi......._..._.__..11s.19J1}5l^^1109.----
1.1... ..... _l.l__.. ...._?y5L6 . __.._.....1
._r____._.
99
.._?_.-
33__
_7_- ._
_.21_...
_'._3...
.2
._?_^..
2__2..._..1 ..__..
.....--
_.1-
-..._1...-
...-._..J.4-----14.- -4n2^
ly?-- -15,Iu12413.Zit1?0^ZJu114^6Jitll9!)1,Lu174.
O1Ju1 .74.
.1204._1300.. .430.4..
_QS:04_.
4544
14r"1.._G,I411yQ1,/1L-
. 9^A_-- --_.__...__._- _ L?!-__-.-____.
SetSr7al11 _..._---.-----__-__-'_._..__.__.
...Sc4L4RiSLi^_....^....__
_G,i44.._.-.-._______.
1lolojlul. 6ucios,_-_,-'---IMwcri^l_lia^_---- --toi9aS....!<1Etl...------.._.►oS!lLSj:S!!___...__-__-......
„ 1 tt 10 .,,.__....11?----.__.2^7.6^1U
_3, 7a<y6,10 .
. 1.._ , 9_ _! _' 1 1_ 1 1 34_'.__ _.___
9.. __1.... _?. 1_ 1_ 1 .- 47--9 ..
9 ,.6 ..6 ._
1__3
1_1
_22
-_
111
57 -69 _
Alrltultyt} ...._.__-------
5!t14kT!_...__.__-..-.___
1y2y 3-y4^310 --.s- _...
_^._
9_-
. 6
-__.....
1 .
_. 1
1 ._
7
_2
-
1
-
1
..-
2 19
38^OJun70
26J Ua14..25Jun70.-....---
14.1ua70..0904......Li1L._._..04.14_.
0900-._---...1540......_TJJ=
_..Qeil^....-...__.__.-.--_.-.----- _.__.----.._..-
iJJ! -_,.._-.-_.._.
-.1Sttltvn ----_1Wsk osltx4P!._s.9_!1!_......._-
5^..00yy4c[.p.P9.._so_i^__ek butcr E, ^So^ili ^^^-._.-_ ?^.._._----._..-..
-_l.a?a3-
.x,2.10__ __1 310_ts__.__.
1 ..
3 .-
-
..9._-
^
^._.-
- 1 -. 1--1 .1-
. 1 ..j
-^^^2...
2-
-1-
1__
168125
_:
- --
88125
25JUn70 OS00 iJJL bck,0y_tcrep^.,.lioili ____- ^>_. - - _. _ - - - .B2-_24JUn 7024Jun70
1500 -1200
^^1]J!fJJ!
Rock Outcpey^ . ,__Soi_1• -___lock OuterwE.^ !oi -j,. _-
1u10._...1 0 _
1 ^ -- -
--
--
--- _,_
23.tun70 1730 ►JJE .-_..__.._..._____._ k0Y.E4E^9^.^9111-..- l...a.- ^ _ - _ - - 4220Jue70__
_20J_un70OBJun70
1030_0710...0700...
_^?©! _._.__-..._______._.__CJQL..._-.__.____^
CJ(alafi.--___._.....__._._.._.......
Ajrlcultun .___-_--'---Tito?_tp^_.._..__.__._.__.._.____
Ion^t.__Sit^t __._._._..--
1'^ _------.1y.Sa19_..__?aiab.a^_ ..1.
_9...^_9
6_6^.
-_'.....-
1.._.
..._.Z..3
1-- ,-._92._._
__ -_2^Y?0.23 y 73..
0370_..0010-...
x.5.!2.-._..__.T-fKTCsCC ... --'---•--nisC,^_._.._._._-_._.._.__- .
..i^FCa . _-._.-
w iiffovl_xi^tl^--'---.._.w t^rtw_1_8461.5l1E....-._-_....y!c•^tav_1_x.b}S.c___-_--.__._Wtarfov_l .-.tyP.1IJ.t-
?isa19_-.._2.i3.__...__..__3,s ..__-...
.--:-
..4___c........5__.
_6.._...1
_6.1.
.1.._
.1..1_
.__1___1__L
_.__r2.._
_
_ZlZL--47z2n.^o_
21ILv10 _o9Qo_
?'}---.- - 4._ 0.._ l ._ .1 1 6407Nly70 ..okwY7o.OfilLyj4
48APr10.9?APxZ4
A
1100_ ._1300...0900 .
000 ..3730
0
...CL7Gl..1!flaP^:107 _.-..._r..__SiC4.pL_,S3t_-.-----._..-_
_GJpy__,,._ -._..._
4^k._pareC._t1lNS..-_....-._._r1sJtlt^►ra__.,_..-_
i^rieullwttE__.__..__..-__Hi8hvllZ ._ Sltiz_._.__.._-..........
..1^3__.__._...2.5.E
_.1.=.^^.__
_.__-
..._3.__.!_...Z..
4_4_
.1__
1-. -
JZ_1_.
_G.1N_J..^.__..___.__.___..____-_.GJNJa91 .._- -'---FJK] LK
2.f_._ -_ .4._ 4 .._ _1__. ^_ 38►tlghvlZ _$1.LL.-_---..... 2.5..-_.._._ ..' - _2 1_ 1 _- _ -..-.. ._._ ..31L._--
4
NOTE: (1) For list of published documents which use airborne sensor data collected by ERIM, see AppendUt A.
(4) For list of organizational addresses, see Appendix C.
^ )12
(2) For geographic reference system, see Appendix B.

RIM --FORMERLY WILLOW RUN LABORATORIES. THE UNIVERSITY OF MICHIGAN
TABLE 9. M5 MULTISPECTRAL SCANNER FLIGHTSICnntinnedl Sheet 5_ of to Sheets
F'I^ght Index Sile DescriptionNominalSpatial
Resolution
(meters)
No. o[ ScannerSpectral Bands
o.HoreeighCameras Total Flight
Line Length
(kllometers)UV VIS N[R 1 FiR BW Col.^Date Time Location Ob eels
. 26lLr70 _11Mar70
, 23,00_.. 0830
iJKK^LK, KJ _ __.._._G70ZL_ 169 ,.,_._.._^_--.-..
Nighvay_ Sltt__. ._Pt^on._I4Z__,--,
.....,. .^ _.._.. - -- _. _--' -_ _^ _ .- ._^ _1 2 7 .- - 9 6.._ .. 1 . - _ 87.
10lIar70 060 CB[a. - _ _li^e•re.1^_._,.____i... _.,1.17_______ - 9--. 6- 1._.. 1 1 1 211OSlI^r70.-..._.__. 1100_.._...._. G1G11.-____. Lota1 Te•t __.__._.__ 1 2 10-t.L _.- _S 6 _ 1 1_ ?-- - - - - -- TO
-_17Me69 _1200 _ 6JâL___Y_.____ _Ajrleultun I S - 7 6 1 1 1 1 1 37326Nov69
-, 20Nov691000
_1000 _G1GM Gil tw --_
_CJGNLOJ .,_.__--__-_Tori -LWgT tollutlaa .__.,NabrlolTuEloa
3L,1 _'-I
-_-
_ .... ^i
,__,.,-
1 ^_„.2
1_i
11 ..
S75 7
,^Nov69 , _ 1. 100 _GT,pI.,_-,- -,___ rtwltun--__
.__2.SyS _- - _ 7 6 _1 1 1 1 . 1. 26 206NOV69 OS]0 GJBL A^ritultun __
- .2 S
.^- 7 6 1 1 1 1 2 78
OSNov69.j0,^69
1300...1070
_CJOt, _._._.-...------.._..Ajrlpultutn6JQ ,__-'--
-_Saag _ti1l^iGd_Tra+a
7 - 1 1 1 1 1 21^-1.7__„ - 7 S 1 1 2 1 1 14
-31.4^t6 9^^Ostb9.^54s144.
_ .0800„ 6J(OT , ....---,,^_-, - Smog Blljhtad Tn^a-- ^ ^3 - -- 7 _ 1 '- ----- 1 1 14---
_3.170__134.4..
1=?C^------ _-___..AtPR ...._
Sw Bli_... .. S _._ _Lht^d Tre^9 ..^to •t Situ
1r2a3 - _7 S 1 1 2 1 1 19__♦ 6 _ - 7 6 - 1_ . 4 - - 30
_139st44._4534._^A!•AC Sol1^., '^ - - - --- - -_1?OS169 . 1900_„ _ggAliAC - Soils 2 S - - 3 1 1 - _ - 76
^4£L69 4^,0.. EKAlsAC-_--..----- SotL _.... -. ..__.._.._^a3 _._.. - . 7 6_ _1 1 1 1 1 )6^O. s,^ 0^_. , B.ice.- -. So1L _- 2 - 7 6 1 1 .. 2 1 1 46
-^kSsr4.4 ..1.4.74 _41U A_----------..-. _P_1^^^P^d _ T^^^_-__--__. 3....-. - ? .. s 1 . 1... 2 1 1 22X45 lz9.^55^69
.07.70.1400_ .
. ^^___.-----. ._..._..-ELAC Ate_-____-,-__,_-_
Di^^wd TrN^_.._^.__. ._.3 --- 7 S 1 1 2 - - 13_Solis __i 2 3 5 10 --- - 7 S 1 1 1 1 1 61
14^sP4 _1140 _.WIiQ^J0.R0.L0.D.11Ry,T?i^^..... _ O^a^on _Cout^l , wagtnt 1 1 6 2 1 1 1 1 - 560---- -- -441_.._._..._._....-------- ---------- ---
-^ - ._-- --- -'23Sao69 . .1334... .D,I,LQ^.1Sl^r!,^l.>^,!u Orw^oq _Coaa_t^l 4^nn 1 1 7 2 . 1 1 1.. 1 -_ 520
_0.444. D,1LQ.OICIIA.6A.lA.ri.tu .wA._ Orytos Coaetml _VOtarr __ 1 T ^_ 1 . 1 1 1 - 120--.._.. _ -.__ .1,R t91-4.4Z.------..__.._._..__-- -.-_.____----_----...-- ----1LSat@4 11,IHP7P . ttP.l3!.D,11Hl,.JN,KN`_ w_4cstelL Ot?^1s3__ ^-tlf! __ 3_-.. .-- 7 2. 1 1_ 1 1 - 600----.._ -._ c09Z ---- ...____.......--- --__._....__ _----------- -..1SSayb4 4Q .AIH4.10.[O.^1HP.JP^1^.`-- -Qrl3?t!_4^Jlltll_WIS.IJ^.__._.._ 1 7 2 1 1 1 1 - 400_._. _ . __ ... L31-00I _ _ __...._. ...__....--
NO'CF. ( 1) For list o f published docum^,lt.v which use airborne sensor data collected by ERIM, see Appendix A.(2) For geographic reference sy:;tem, see Appendix B.(3) For list of organizational addresses, see Appendix C.
Sheet 6 of 10 Sheets
Flight Index Site DescriptionNominalSpatial
Resolution
( meters)
No. o[ ScannerSpectral Bands
o.BoresighCameras Total Fli htg
Line Length
(kilometers)UV YIS NIR 1 FIR BW Col.^Date Tlme Location Ob acts15SeP6__
16Se 69
1043
0900
Wt^,JP, ^KP, ,LP^I) ,llpt-,JNa/ iLN-007 _ _ _-11.iw0,J0.[O.LO. _^.76PyJPyR
O^joq_Coutal w^ur^_ _ _
, On,Lon . Gouts( waN_^e-- .------
..-.-._ ___....._ _ 1 ..
. 7
6
_4
_^ _
^ ._. _.l._.
^..
_
_
._.
-
-44$..-_.-
X44._3_ ^18-007
03Sap69075ep69
. 1100.0715
__ GJGN__---..--.-.-.-CJOI7 - _ ---- ---'
_,Aj-ricul_tun_--_.._.__.__Aerleulturi ,_____-_---_
__.._1sY LS.t 10..
1^2 iS,^10_--'--
7-'7
_SS
1 -1
1_.1
____-
1-1
_. 1-1
.. 64-___58
_l^!+L9.....2100 ._0_7^,^!-- --- tenu Sitsa-..-------_
2 3 6,9_. - _ ...^ 1
_- - -17Aua6.9 2100 GJfA1^CM .____.-- lister Pollntiaa 1
------- - 2 1 - - - S3
_13Aut69 090e GJ4^I, ,PII_ _ Poreet S itu -- _^^ 6^9 , _ --- 7 S -1 1 3 2 1 5913Ay^69-...._ . 0900 . GJCN,GM _-_ _ Vmur Pollutlop 1 - 9 S 1 1 3 2 - 53
^lAu 69_. _0930 G10N^DM., .1><.-.}67 Cook_ Powr Plan._- - _-.-4___--'_--__... -----_.._s -..-..__ .-.1 .--7 ---'_ . 2 ---1 1 ^ I _1_
_ 26994^vi6?. _._1434 . GJDL-_._.-_--__-_--_ Ajricplture .--.-...- 7__` . - .j- 7. ..^ .3 _. 21445AAE@4_. .._14 . _^Q4...._._.__..-_ Ajtieglture __ _ - 7 S 1 , 1,_ 1_ 214
OZ04 CJDL _ _ !culture __^-.. 7 S 1,_ 1 _ 1 ,10 -Q7ilutt4.4.. _ Q4. CetS6.RL- _ _L4Llat..$S^s,(Z._.` - 7 _7_ ^. ^ 1 42133.Y1^2_ _0245 6,gC.00 H^tsE_Po13PS140_. _ ♦ - - - -^- 1 : - - 2701ZJ1,1L9._22.Iu1fS .
._1234_Q9
_IJ^Q ..._...----_-._--..._._... F.tsR^s.4-I3HQ___._
_ins._.___--.---....3.5.8_....sess,^Q Trtea 2 5 8
- ^ sS
^.1
_i1_
_--1
1-
1- 38
43ZLLu16.4_ _1. dls4.___..____-_.- ^- seeesd. .TZSS!_- __ 1,5,$_. - 7 _ S _3 1
___ 38
11.1 _1030 _.PJML- ----.._ _RlssaaeQ _T.rss!_-- _ .._2a.5.a8....-. - 7 ^ 1 1 34_3.G,1u144.. _1000 _ I1IPi ___ DsL_g11si_____ B - 1 1 2 1 1 4 515du169_. _ 103Q _ DLYA._.__.. -____ _Q4lftllsd_?.tsss._._ _.^.-_ _- 7 S _ 2 , 1 2615.1,+1119._ ._06.30 OgPd-.---- -.. lsd_.2LW.-_.--^ 1._-- -_ ._Z ._7. -1- -^ - - 2215.1. _.1.330 DKRi._-'---^.--- ^tees_•sA_.itua..__,---..? - 7 S,_ 1 1 2 1 1
_22
15Ju169._ _.0800. _OSYd_____..._... _.-_.__.._._ 4rst9n OQasul_4titlrt_ -. 7 1 - - - _ 26t 7 i „tA9..t zy.
.I18Juli9_
1500..._ 44Il0._
A1L0.1^7 .A.!lA.I.g.Z3-4III-__.. ALLO.LP.LH.Llt04Z.._...._.D.)L0.11[LA.gA3A.
4reYan _C44lSil_ WeSf2/_4rtt?n _ C4!lstsl... HStR[1......_-Ozes¢4..Cvsatal .ltata
1-^-.
--
¢6
4_Z^
1. _^--_ 2_
_ 22
11
--
4 48680
_ - __6 ^_ 2 2_
1 - 560-.._...Q¢.1u169 _
_-._.._1130
_!tn-OA7.....__..-_.....__._._......__ _....__.__.._..__..D.TH9•.?9L^L^e_^^_•^,F!^.
-
_-_._._._.
_Onion _ Coutai_Miun^
`f^^-- - __4._
2
... - - ^--
n5 L.116^ V.lnLP-007nTLH LN LPL -007r _ Ore on Coastal waters 1 -
_ _6^
^-^1 2
- ---^
- r.
^^ ^ I r ^ i ^ r I r list of publishe6 donlmcnts which use airborne sensor data collected by ERIM, see Appendix A.(2) Fur geographic reference system, see Appendix B.(3) For list of organizational addresses, see Appendix C.
113
i
^^^^ p^

^_
LERIMFORMERLY WILLOW RUN LABORATORIEf. THE UNIVERSITY OF MIC MILAN
TABLE 9. M5 MULTISPECTRAL SCANNER FLIGHTS(Continued)
Sheet 7 0[ 1n Sheets
Flight Index Site Ik' scriptionNominalSpatial
Resolution
( meters)
No. of ScannerSpectral Bands
o.BorealghCameras Total Flight
Line Length
(kllometera)UV VIS NIR MIR FIR BW Col. (Rpate Tlme Location Ob eels03,iu149.0],lull9.---...._24Jg33vA49_.2SJw44_.2SMfltb4.
44..144
34.3_>^304.
13iQ
_....1N
Wt,Q ,RKL!Lnn , LB,tip-007_....____.W^.dRFI^ . Lr .R^a .a^a_
4QL _.-----CJDL __-__.__.__^?Wr -.....__.__.____. -..__.^7_pF_--_: _-_.._-_ _..Se10[-34Z_._ -,__._._..___..GJQ4._---.. ___ ._.
4ilia0 C919ta1 uacen.___...OEl^...r?!lSwl oaten -----
__. _len1S!!i! . _ __-_._...^Leultur^_.__ __Ajricul4un ..-- - _...-. _- ..44ek_?4^t ^.^5_.__.-_-.._Atrteu7.4vc!_....__._..-__..
. 3 __.-1----..._
. _.S ___._3_.____
_.? _...____ _.3-.-
,.5 .._.___._.
-__'..
____..-
--___-..
6 _6__777^-Z.._
4_^ __....
SS___..._S`_.
..a.._.
_1.l --t_ -1i
2 __?..
11 ._
- 1..L___2_2 ..a
^..
1_I1
r_
-11_1
f60_ _____..
_^---^!9 --
227...13f
^.-1--
I .1
-1_i
^1
-..1
_!^le7 _--21.t1aYb4.._ _3100.
24MfY44_ISi4Y49_15ftaY44._...120013t1aY69._
_2100
4b00
G1Q^- -c.11k_ ._.__._...- _.__ . _..-___4^1.-_^
^le!a.4!t5!........-.---Bijhr_ll 8!a _ _ _.---- --[ii _.aY 61^! _-_ _.
•7
-
.^_7 S
11)
11
7-
1-
1-
1S4In_..
^ ._- '_ ! _ _S __ 1 3 1 106CdD4____.._-.--.-__-_.._._ .41I!_4935HL! ___..__. _. 7 S 1 _ 1_ ) ,_ 1 1 _179
12tlfXb4_1211azb4 _
_024_1400..
GJCII_-_..___._. _ Loc^l2^^E-...---._._._Q}91o. .^$41_^. Spa -----
?__.---._-.._ 1•taS^10 .
_.--
^_7
.5..S
1..1 ...
_1 ..i
^._S ._ .
-_
_1
29 .-168 -&d)?G.Lf.pll,Lll.^_.-...-.._
Q&larb9.02Macb4.OI1Lrfi4..0fil1ar63...2fiFehfi9.21Dctfi8.150ctfi3_
.1100..170.
_Ofi1509
EJ^a 'L:^..^'1>Q-___._-._. Qilti41fO3SNi^i-- 2..10.---._
2L10..-..__.?,14........2 10___.._._
-.'_1__
7S__a
S5....S__
11 ,_1
1- 2 . _ .
1
I . _7__3
1_7)
111
77
ISO __1 6
6JA&___---^..___ 933.34113____..___._-...___EJAE ___.___.__ __....,..__......_.._E;J^1G_^_.-__...--
413.@41 .1.1___--...--_-.--..__.__..0 _5.4 13_. _ -_. 7 S .
_%._ _^ ..
^2__
__._=1
1TSi-__-_-^11 _
37.1100..10]0..1000
GJGH. _---.-_.. ^._._.__.GJGY.__.._......_..____-_.__..__......._...GJ![.0T_.---_
!iR[._L413Li141-_..._..____34!sRl7f^f..._._...._._._____.._..-._.....?.LZ..____._._.
Stll._1.IH!_^.45!!i_^1_!!34__-_
..3..... __.._.___ ^_'
..
7_S_6
1 _1 . _ .
._ i ..i__ 1
• 10 _ - 7 6 _ 1 - _ ^
^IbB-'--ZfiSePfi42fiSep6fl235ep6820Sap6f17s_p6S
1!(10.0900.090009000000
GJDt1.0L __.---._._.GJDL 147__ . _ .EJSH E_1Al- ,AN -.WPLiIJ .-.-_-^J1L -,.-.-----.GJGII .._-.. _.. _..._._CJCIL ..._.____...-...._-..__-_._.__..c,7c^__CJDL.__ _-__---.--___- .CJGH_,,.___... _ _ __FKFC GC
1lfFl£k3tHfl .._.__ _.-__---.._P^dII .41i0L. -.
Rock Outero^a. 1fu^%onC 8itaal _ Ajrie- o^un__$e!T brualasd _^_ix -..Tut,_Ili^it ._- - __.._--D^croitliws__.___-_--__--A^rsaulia;: _..Agrleultua .-_.__._.._._...^ricultur^__ , ,.. _. __.__Ms[er[ovl HAhita[
li^a^ _..0 _
3...1^.
___1.^.^.3.^-1•Z-^3^-164-....
_.. --l,f,s^io
...ES _1^^3^F02 10
..^.._-__-_
__.
.-----
_^7
7-'_.
_j ...,^--
77
6 .._ 6
S
_ d^_ ._
3 .. .b-^.bF
a_..T.
1 .1F
3._.
-1.i...
_
1
I^-
1-1^ -
1^ '^-^ ^- -
-_
2^--113^.-i3^-3^--._..^11T-----f3---_
_ - __123
..-
i.T..T-1-
..4_..
f-.}_...'F_.
1f._Z?
-3 -
__.. -09Sa _ 022AyStiB2iil^4elOJu16S25JU168
na FB
11]0 , _.DSO
>_aoo. 0900_09000730
..._.11
.1..
NOTE: ( 1) For list of published documents which use airborne sensor data collected by ER1M, see Appendix A.(2) For geographic reference system, see Appendix B.(3) For list of organizational addresses, sec Appendix C.
Sheet s of to Sheets
Flighttndex Site Description
NominalSpatial
Resolution( meters)
Na. o[ ScannerSpectral Bands
o.BoreatghCameras Total Flight
Line Length(kllometers)UV V[S NIR MIR FIR BW Col. 1RDate Tlme 310eattOn Ob ecb
vm,vse29MaY6829Ma^rbl ,
_29Ma^rbS22MAr69
_9111urb7.160c ,t67160et67
-lio^^b^.110ctbY
100ec67_.--00etb7
030et67,03oci67
.4734_1.00111.0Oq0
_1ppQ1000 .OS70o3oibib"
^^1T70.._._000..140009^_
FJBQ__._._..__--.---.____......_..., FJf4 _ _TJ^Q_ ___. _---_--..._/`nq---.-.-_____._..G,1^l--_-__---_ -__......T!!S._!110A[....GnIGH_..----__fL.1N ..t+LJM ---" __.-.__ .6tiiN ----__.._..__ ___ _Dl.fll ----^-11..M---....__..._..__..-.._.., .__.._._
_^^_____._____...-_---.._._DLJM11.JM
lliasaaad Trae...._..__.._......__...._....Dlaeuad Tree,_ ,. ,-,- .Diw^wd _ irNa ._._--_lii..a.^a..rr.....-.__._.__.. .._.i_-
_.__.-........._l^sttl ltigut ^ aad_^ia^Tea .._.. _.Il^at floe and $ia to_ii:ai ra, :na
...§:: i^: --__.
eaie-iflov^aad- Sn^Tci ---.Nair - ^lldi^nd^$^i .._ici . .....__.
_^4at Ilow snd_54 .. tc^ _ _._Hnt , lloy ind _Sep, Ie^ . - ___,Hilt Moir aad 6u Ica
11
- 7.7__
46
11
11
-^1
-_- - -
-...--
__22..22. . -.
1 .._-----.._.._._._3,3.,74....
_'t t^..._f _..__.-_
-'F^------. 1......___ .....-..
_1 _-_._21 0 , _Z -
,...' __-.......-..
_-. _ _.._
----
. 73..L
_b
_^.k
1 ..^i...^._..
..1__1._.L-.
?_.-_.
._.
._1_-..
._
1_=--
_...19---
?2.--
9.$
^-....-_
^_.]
. j_
..i...
z--_1__.._l._.
-^ _^
_^..-
_^_-
.l-=
-.--147---
_2.__-1 1 I1S
.^..--_
9_.94 -9
_3 _.
3b6-
_111
..1 --11 _^I
2^22 _ ^Z
11 _
^^^1 ^1
111 ^ _1
125_147
13448- -
30$^67. 100 - tl..M __-.. Haar /lov and _Saa- I. e=_-- _ 1 2 1 9 7.._. 1 ... _1 .. ?. __ 1__ 1 . 109
_30Sas67 0900 tiLJM -_-----^-- Hpt flar _aad_S^ Id_ . _ .. __ 2 - 9 7 1_ 1 2 1 1 109225a 67 OS00 .---- ^4.-----------._._. Ca^tMrFil Ai^e___^._._-... .11_ ._ _ ., _ 1_ 9 S 1 1 2 1 1 162
_215ap67 1900 _ LJItO Wo_har^al Araw 11 ___ _^... -_ 1 1__. _ - - -112205^p67 2200 EJKs,-__ ___^
__ -.-.-Ga_otA^^l Anal __
°.__11 - - 1 - -
_ __115
20$7195^^67_
0200..1100_
.LJR4_._._-_---._..__...__IJRQ...-..__...._.__
C4otMrrl. Ai4M _.._-._._Ciethinrl ,Aiaaa
11 -._ - .- 1 -- 1 - ^ - - 79.^1^ -.....-_.. 1 3 T
..12^--
075ee67 070 . GNKL__._..---.--..__.._.._._..-._. Coeul..MUari _ :... .____._. _^
2 .S . 10 _ -.. i.._. -.. _- 1 127
9454Y4. Z_Qf_5^467 1200,-
W00 .. . ^4,?1!.__....._ ..-_.__-.... QIXN1, JH . __.-
Hatar Pollufionl_.Ajrtc._-_...._?^SYabv. Pollution. lyric.
._.. _2,-,
-1
- 2"- -- - _ -^
4 ti ^^^ ^^^ ^__......
1 - ^ ----30^$SP67 .13.34._ GJBt ^------ .-_-^_ _-- AaMvill^iHC _-_-. • - 1 _^. _^ 7_ 1 - -rj-.. 1 1 S ...--
9.4.Ss447_Q^Se467^)SeP(.7..^LeFkZ^y167
0474.1740.9 _
. 1700 .1000
C2N4..-.__._.___.-.-.-.-.___C,JpO_.-.------..____. _G_?^.-..-....^._.___...__O,ICtI-------.-..__.-._..___._CJQLCJHNA CJQt .- ^_
IVA Daar,_CllaeA , Rtv ,__lYA- Dar_ _ C1laeA li^fr _-Tl'^.. Dfrt C31tyh Rl^s[Liai11iy^c.._.__...__----..__ _.Hac^r - lollu4lof ______
^-__714 ,- ----
_ 7,^;._
_6 _
_1 ^ ._. ^_
1 _1
11
lOT-03^--
• .. ._2.__-_
_'.1
7 _.!
_6 _6
1 ._.1
1 __l.
2 1 1 _60 ---__ -._ - 33
2 10 - 1 9 - 7- 1 1 2 - - 326_zzava67
71300900
G.iGN ___C.1
Te9t..1311shc_ _ .. _ _._ _Hf tiv Site
1,3.Z _ ._2 3
11
_s _.9
__s7
11
11
_2
_-_ __ _._^e_224
NOTE: ( 1) For list ^d published documents which use airborne sena^r data collected by ERIM, see Appendix A. "-.(2) For geographic reference system, see Appendix B. -(3) For list of organizational addresses, see Appendix C.
114

RIM . ^)RMERLV WILLOW RUN LABORATORIES. THE UNIVERSITr Of MICHIGAN
s
TABLE 9. ht5 MULTISPECTRAL SCANNER FLIGHTS(Cnntinuedl
Sheet_ 9 of 10 Sheets
Flightlndex Site Description
NominalSpatial
Resolution( meters)
No. of ScannerSpectral Bands
o. Borer " TotalCamere FlightLine Length
( kilometers )UV VIS NIR MIR FIR BW Col. ^Date Time Location Ob sets
,SMo-6T_14gar41
...1044._ 1004...
_^dSeil__._...._. _...._........... _.__.___.....0d9L.__.__.._._-..._-__._...._--
r4.e.eliync._ ......._..----_'E!_•.i.Ll^.._.__.^.^.
3.?,.5_....__..?a3-._.__.
.^ _.._ ?.....c _?.... 3.. ..1.. _41_.--._.
i_. _9_... ^__. -_._.. 1... _2... .102Har6 ...1440...SnlGil. __.---.._ .T!lt._L11^1tL....__.._...__._-_____. ._.L2a!___._._ ...1 .. .1. _r__ _!_. ._' - 45
_15âls44. _1130. p?4F.^1^ -.__ _..^1.a...Dt!t.tsi.I.._Itt^!_.E_-._. .-i.? ----- -1. -_ - .^ 1.... ^ - - l^_-
^2t1wt64 _3444 . GJgI._____..___._.-.....^_ _W4lpi^al .. Clfdam 1 2 3,♦ ..._ _.._1 ! 3 1 1_ ^ - 2^8Nox4^ _.1144.. G.1(^ G.ltil v_ac^ Pol}SR4?2..._.___..- 1^2 ._.... ^ ' 3. 1 _. 1 .._ 2 - - 11714Nou4 _.1330 WG3I.G,70It ...-_.---_.____._ iRSal._RlS1t411_.141L!>L__ >•,? ._.__ 9 4 ^ - S
15S ..1010 GJDL-044._. --_ s _I,?a?^__ r_. '.... ._^. _1 1 - - - s0_1SSep44 .12.44.. _01>?L.9.lZ __. ^^tt17:!__--. 1a_2^^ _ _ 1 9 _3 . 2 1 2 _ 1 1 96_15SsD44 _.4.214- &,IR4_.._..___..---.._...-._...._.___ _£u1tyF_^.._._-^_ 10u^1e. -1 9.. S .. 2 1 _2_ 1 1 137
__fI1Sa! ..1304 G1GL.._--.--__----_ _?.vllKt_g1.L! -__- 1 2--_.....
1 9 S_ 2 1 2 - - _, 19_30Au¢44 1004.. GlGL-_- 1'vs11..3!!t.-.^--- ^'-2^'3^--- - 1 9 -. S ._ 2 _1 _ 2 1 _70
^Au^29JuI6^--_..._
1Qpp0800 -..__..._
_Gl _.-.-_..-.^.-B.IDL._....._..-_..- ---.Lucll.Ssl.c_.__._.
rieultur.^----`-----._. 2 _
^^1e_a__.. -9^
_S_S ^-
22^^._....
1_- ^__..._
2 _2_._.
_1 .1.
--
32_ 64
_2.@^1.ul^k. . .24.4.. CJDL - .ASL1S.ultuz>L_._._.^.-_._- ^ 2.. Z_ _ -.2 7Ju144 .48.1L...G.i.LH^..--___-.______.._._.._-.__. ..klrstz000k,- .A^Llcultnca._-.. _..1,2.1....__ ....- _..i_ R^
2114..Se.1121_ _ 11Y!.4L&.}F.a_^f.Y1tlF!- 1 2110 _ - 1 1 - SB __26J..16A _1040_ _SaJ111a-.-...-.._ .Atrlcultuts__________...__-._. ^4^¢^! 9 1 9
_-2 -2_ 1 1 121
t r,tAA .30Jun66
_11401400
..GJGfl---_ --._-_.__..GJDL
_IA.Ltt1...Tllt_..___---.._.--...A iculture
_^,^2.i}D.._..[ ^
1 . 9 ,55_. 2 . _. 1 2 1 1 _11^__
^01uu4fi _0@34_ _CeIDL_ _.-_^_ ..AtLltYltut^_..-________._._ _?a3_0.__.._ _.1 __S_ 3 _ ^ .1. 2 __29JUn44 _ 21311 . . G,IDL -. la.L4CIt^.. .Lf11Cy1 .tllrL-.. ._1^Z.I __ - ___. 1.. 1_ _- - __ 21
1fl1un44 .. .1400_ Gd1?I` .._^_ L.1rz!ltask._ A[rieultun _?al._„- ,,. 9 S _ 2,_ 2 _. 1 1 SO
_.241unti4...1140 GJGIi.._______-------.._-_-- L2sra1._SfuJ`_.-____-_.__ _7^_^_ _S_. _..... ...^ .3.. 1_ - _- - 32
_I)2Jun44 . _1000.. FHflt___- ----.- _sulcultuLS.__^- .2... ?_ ^._ 24...(]111n44.._1804 FHGtl.^ __-_....!!fiis!i3.LUilL---_-'-_._._..- ^___.._._._..__ _.^ _ s. .3._ _1.. }_ - - _91^1Jua44... . 1330 F11GM...---___-_.___...-___......__.. . .AarltulLUS^.__.-__^.._-. 14.1,14 _3 9..._ ._1. ..^ __3 _. 72
n tJ 0504....Fl1Gtt.^._---.--..-.- ._ .1^arisultun.._^,.^.. _?_._--- - - 2 2 1 . .- -. - 67at Mav6A
__90Hay6626Ha 66
_1000.. 1490 .1330
^- ----£HGM ....._ ..... .. ..........._ _ . _. _DJPH DJPJ
StY1LYL^ - _ASr1cu1[ureHa and Pault A ric.
x...14_-.
2 ^^_
1
^
9
_^_
S 2
..^.
1 2 1.
1
1
6^___
37
e NOTE: ( 1) For list of published docunu^nts which use airborne sensor data collected by ERIM, see wppendtx w.(2) For geographic reference system, see Appendix B.(3) For list o[ organizational addresses, see Appendix C.
Sheet 10 of 1n Sheets
Flightlndex Site Description
NominalSpatial
Reaolution
(meters)
No. of ScannerSpectral Bands
o.BoreaighCameras Total Flight
Line Length(kioometers)UV VIS NIR MI FIR BW Col.^
Date Time Location Ob eels25Ma 66
.25Ha^624May4.6_ .24Ma^66Y017a^ti6_
1 . 0012001000 . _0530 .0665_
EJBKEJNC______ _,^__ -___._EJOHtEJ,AJ, AH^DJI PN EJAH _ -DJPH DJPJ ...--"--'---__...----..DJPK__.__....-----'--
_Fau t• one_Paulo Zone
^ A^ric_^Mono_LIu^YOieiite _^rlculture _.. _...
Sitia-_Pornt -__-
1,2,6 _'F,3,T- __22--__..-_
1__-T _.
_.9
__^..
5^^ -^. i _._3_.
^^^^2 _
'1- Z ._.._,1
_..1_)..^._T .
2-'2__
1__
1__
_102....-.^_^-__
_ _ 119May6619l1ay66 .18Hay6fi_
14001000 ....1000_.
OJPK DJTLe---6JAP _.-.-_-_._ __. __ .BJEIC1DJPL
iornt Sicu --Noichirn.. .G^i'^oinli ._Northern_G^ornia --_-
. .ILA._._._.......^ __.._.._-
.j._
^.....^
_..3._ T._.Z .....
-._. __2...
^'^...
T
.T _^^-
^0. 17Ha^66 1330
_-_-__.__..-DJPHiDJPJ MOLtha[n C
alm_..-. ^._._ .E_ ^_. _.S.__ i .. --^.L-
OtiNayti6OSM^66_
13301300_... .
_GJDLGJDL
___.._.__-_--._..._.._.__.__.._. ...tyFri^Eura ..._..__.....___.....-._Agriculture
T__....-.-
';----.__..__.......T.._._ _
...
_T_._
..;_
...1_
..3.....
-^
T__3.
^. _T..^-
_._^__
04May66 1730 .. CJGIt _-^--_^_-._ Tea i^i^h t ^, , - - ^iZ-04Nay_t6 1000_. GJGlI _.- _Local-..__. -' - -'- S ---.... ..I_ _ ._ .T_. ..^ .._ .T_. ..S_ __ - ^_
_2QApr66 1300 ._ G.TCl1_.._y--.__ Lake Erie 2._--._.._ ...9_ ^._ _ _ '^^-2.@LlpE.¢6_ S.Q.QO CJCN^ Irks Erle ^'1^-^^ _^ 3 ^^ -. - -TF-211iar66 _
.1400 _
--,GJGN . -_ Taat Plisht _ - ,^--
__ ^^^
_- - ^'1- - -
141ta~r66_ 1000_ GJCN '--_-,---._..__._...._.... Tut_P116ht--___--._-_._ ...^ _ - - -11Mer66 1000 CJGN iea F11 t 1;F ^^^
... _-3T-
^F^66 1400 .- _
GJCH Local_ _- _ ^^ _ -_ - _^4.._-
Q^Jas6 6 . 1000...-_
GJCN -_.-.__..____-__...___-
._Local_..----_.._.-..-'---.- ^_ ..._ .._._-18.._
-_.-- -- ..- .. _ _._ ._
NU1'1_ ^ t) k'i^r Ilst .a published docunu • ws which ua^^ uirborn^ sensor data coR, rted by ERI^1, see Appendix A.
(4) For list of organizational addresses, see Appendix C.
115
(2) Fur geographic re[erence system, see Appendix B.

Vii_
F(JRME RLY WILLVW RUN LABV RATVRI[S. THE V^'11VERa^IY
TABLE 10. MIA1 THEkMAI. SCANNER FLII;HTSSheet_1 _o(_ 2 _Sheets
Nomtnal No. of Scanner o.BoreaighFllgtd Index Site Description Spatial Spectral Bands Cameras Total Flight
Ltne Length
UV VIS NIRMI FIR BW Col.Resolution
( meters) IR'(kilometera)Date Time Location Ob'ecta
an 81co ore ne_,.,wrto .z........, - -_ .- 1 - ___ -_.,___ .-,_.. ,-_._.. _.. 1NQ _____.._.___ _ ..19Jan71
_ -_2330
___._..._..___ _...---. _......-.HHJD
._ _......._ ...... .........__...._..Bt. Cro1x ftanllna 1^5
._ ._'._
.....- _.__
_.........1. '.__ - - _ _.._ 14r1
-19Jan71 OO1S_._.. ________
HHJf __._._ __ _._^.-. fp Jwn flanllao ._- _ _ lal^^ - _ _ ^. .; 1_. - _- - _ 56Q__OSMc70^^03D^cf0
1130030_
fJCC _-__.-^..1L1CG _^
_ . n-Dqj Lb_-^._..n -^^Lifie
10 1S#3^^^—. ^
__. _.-
__- ^
.. 1.r
-- ^^ - -
770 .-360
oiDa^lo Tii.i
.... ^.^.__-----'..^._..r_..
ti!r_e!n_^._^..k!__ ^_._.__. _= - - ^ - - - -
_:eo
16Noy70 .. ...1^__ ^?-- Muue uNeb Slav !ae__ 1. ^ _.. -.
- 21 017lIov70_ 210_
-_...._.._-_._----._._.._.._...HJGQ__.—._______._...._._ _.__ lblai $horGlim .-'--.-.
_33-- _-_ _ -_ 1_
- -- _ -
_.._ --670_-
22Ju170 1000_ RICO -__-
6 Gliloraia Dr^bkN 1 .._-.___ - - -- 1 - - - - 210_19Ju170 2100 Ne^etain t'giia ^..._ _Y. _._._ - - - - 420-_..._._-_.18Ju170
....___2100
_.. _._._.._....._..._._.._.._..___...,.._._...._llKff
_.__..__..... ..__....... _... .. _____Monania I.
_ ... _ _ _ _2 8011.Iu170 2130
__DIIlrA ^ Mawtain 1'aab --^
_- -
_-
_1 - -
_- -
_70
O1Ma 69____..Y.-- 2145_..__._ _IIJCM _._ -... G ^ Cod...$tarQtp - ._..... P. ._ 1._..._...._....__ .Y.._. - -_ 1 _-'. - .-... _ - 112030Apr69_ . 1200„_ „ IUC^.-_--.__..._. huob^cot_Sho^ellae ^! al? ..._ _ - '_ _ -._. .^ '_. - 1190
^9_RP r69.. 0}^ V^.^...._____- _Th^etil_Marllp _,._. S .-^.- -_. ._.. -_. _.__.-
_ _.-
.^ --
._--
_ 980 -840llJan69_ 0333 .. „fJt,1 _..__ _$Yr..^O1..MD1p.!u10.-'---_ S_-- . -- 1 ._lOJra69 067 , L1^J.Q07_.__...._..._.__.._..._.._.- _Il000 Crater_..__.__..._ ---'_---... .^_. - ._^ - __- 140
-e6fl.IBp 9^Q . IOIJf foils 6 Carp---...-_.._3 4 .- ^.. -.. 1 .- - -
._...- __ 160___.- _
1_Z4a^4e._ ^f94. !l^E..__._._.__.._-._....__...._.__._...__ _^il^ ^ Cava.__._._._._._.._._... .__.------__.- ^_ - '._ 1__ -__. 11016Dec6B . OQO.$_....HN.TC --_
^^ -61_Ya9^!! ____..___^__ 3 12____-.- - ..
- 1 . -__w
..___ _
_ _T_17`_-
0900 HNJL ►wu iiew - - 1 un_
1b -1SDec6B_-...16,p} , 8^
_ _-......Q.L?4._.._NNN..R
_...__.--- ^__N_.._..____.___.^.
.....____._.._..__._..___.^._--141'i3ues
___.__._- -
_- -
_un
--ovn ---. _
_--_._.!(^.,
1DDe c68 . 0$00 ... -IpIJ6.,,,..__,_.^-,._-..-_.-_._.
Salina .,_._._. _,..._.___. ____._..^ _.^. -
__-
....._-
_-... ._-. ..un...
ore f4s_444s^k4.. 194.1._. HLU^._.___..._.. ___._..._.._.__..__ Pwrto R^4..._..___^._,_ _. ?..---__ -_... '_ ^ .1 -__ '__ -..- --
_----F6f^_.
9.3pasStQ. ]3... _146Li _ --_.._____. _Pe!gil. .l^^r! ._.____-- 7 - - - 1 --
w 2100 3De s4e_. 44.;<4...... .!^1^._._..___-__..__-.---.__.. _Tunta_Tieu^._..__-_._.-..-._ 1 3_.-___- - - - 1 -_ - - 1409.1Rec.58... 1.8.54_. _F41( [i__._._....._._..---..___ .__. .h!QLl..l1,^9,....__.._.._-__..__. ^......___. _. c_.. _...._ -_ _. 1 __ -_ oun - !_i^o.._
w__..._.__...._._..-wnQ14sc@!! .1.2.64 _ _ MNJE.___--_____ _-.._.__--._ .F.!m1.e....Ptcw.--.___-^___ 3 6___ `. - _. 1 ... -
--70__
- 110 ..,.__z---TSNux4@_ BIO._ _HNdIR ----._..._.__.__..-._..._.___... P!!at.all wt_....._____...--- --..__^.._ -_.... ^.. -.1
_ _ -24Hox68_ 1930 HHJD. -_^^__ Yonss _^i.^_Cca1L.__^^._ l.t ._....___.__ - -... ._..... _. 1.. -.. -. r. _ ..-__ 7
ovn._____. ___.
1401 un
NOTE: ( 1) Fbr list O1 publlfheO AOCUrnen[8 Wt11Cn UBe 1lrDOTDe fen80r Oa[a C011eCted b^ EtilM, see Appendix w.(2) For geographic re[erence system, see Appendix B.(3) For list of organizational addresses, see Appendix C.
Sheet 2 of 2 Sheets
Flight Index Stte DescriptionNominalSpatial
Resolution
( meters)
-No. of ScannerSpectral Bands
'o.BoreslghtTotalCameras Flight
Line Length
IR'(kilometers)UV VlS NIR MIR FIR BW Col.Date Time Location Ob'ects__, Nov6
O1Nov68.260ct68 ,230_ct6822t)et6f190etfib
0 10
1950 .2040.2133....2015'Ffbi_
HHJE ___ -l.l.LL,._..-'-_---__.__._____...__..1.T.__-_.-. ^._.-^Il _-_..._._.-.._ty.. _.------'
. uerto 81cofurtsoy_Yoleaao _ -furtaaZ Yole^no _ `_..__._suit__^_Yolcaiw____---_ ..
.Baru Yo3-e ^po __.__ _..iuii^;iioTeaeo__.._._ _
^S _.....
125l0^ls _.._____1..12
^ S__._-__....
-
'_.._..-.._
-__,-
_:^-_
--
.1 ._, 1.
-
-
un
-
oyn
- -
70
140-_--
_i .1i,_..
.__._.-_
__._--_
-.-- '-
^.-
_
-- ____^_.,
42070 -^140
nu rr. ^ tI rnr u5^ ^^i pui,uei^eo ^i^^rumcnts wntcn use ,ur^n^rnc sensor aaa eateccen by elttm. see wppenata A.
(4)For list o[ organizational addressee, see Appendix C.
116
(2) For geographic re[erence system, see Appendix B.

RIM^ ^ ^RMERLV WILLOW RUN LABORATORIES THE UNIVERSITY OF MICHIGAN
TAHLE I1. SLAR X-L BAND RADAEt FLIGHTSSheet 1 0[ 2 Sheets
•
Flight Index Slte DescriptionNominalSpatial
Resolution
(meters)
No. o[ RadarImagery Bands
o.BoresighCameras Total Flight
Line Length
kilometer8)X L BW Co1.Co11RDate Time Loeallon Ob eels P C P C
191wc.1.4...DSApL74....
44.4.31404...._
_4!^D._--.-__..._ .._____E.txO._.._._..-_....____..._...___...-_._
•_.^_. _._.__ __-.— _^l(__M4.^tRLe._.__._._.__..---_
_._._..._. ._-__.__3.4..___._.._-__
_ -- _ - -. ___.$ __^260 -.--1_ ..1_ - - -
D3Ay.L2.4.13Itai74.124ct73..
4923_1408...D418_
_EJxo ._..__._._...._._._.-__.atFB _.._..__.._.--_----____.___.._k^kt._?.^1....._clirtF_.-----------
.^it33...MO4!cttFe_..-_—._.__,.._....____.._..._.-._........._.10....._____
-!!lLL.SSL.._Ie_1„y_1¢_
_....t4_...__......__..____-.._.,
1_^ .
^__..3_
.,3_
._^_.....L_^_
^-
_--
-_'..
_.._34_-3^-_._
}0 - -_-___-, 1. _ - 'D7Dct73...DSDct73
35.. .S?#KF_.__._._....---__....__.._.._.G.1GK...........-..----._...---..._
l.Lt►^itr#_^1!e4T._..-.__-___-..I14Qd18s... 11lotsc_.____---
_..^...._..__._..__._.....1--. .14_._._._.____ 1.
-.L _1...._
.t_- _^. _'-
=-
7_
D3Dcc73.13Ssp 7 3
16i!_..0435.
. G1EL _-----______....-_....._...GdEL...-..-..___-.__..______
.-ALLlcttltnrl_...__-__^ __32----__ ^ 1 - -.^L1gt^lEMr^ ..____.__._. ^0.____..-.._. _..^ 1 . 1 . _1 _,... - - 60
_OSApr132B)1ar73..13AuQ72..1105.19 7lex. 72__
D430_.1031
G,IGN. -_-----.--.._.____.. _GJGN ____..._.-_-.___ G.TFII...___--____..-
_/loo4in4 .l^td^..._.__.._--_ LlovdtnA, .1^_Q^._ ._.S1NEt MvuntAls---.-_--
._^^_...-...__._... .^ _.L_. 1._. i ^_}Q_____ _. - - 100
.._._..__-._..10ib------
..--
-_
.. '--
^
-
--
-
_160____
i2o6x00GJEE. Nouatale_8veatcx;17 -”- --- — __.
--^-----'--
ttirlaedo A.^- __-` -
23Apr72 0835 . .. flOfQ 9ouaton Aiu .-i-- 1 _'-. 1 - -_ - 1 - - 100^3Apr7Tt^__22Apr72 .
d^§^tS7Z^
l4x;Q __._.____._.--------
MtKQ.._-^----.._Rtou^taa Iru_....-`iou^.LOa. .
Ana,.__.___.-__. _._. __..i^...__._..._._.._.._. l -__. '-_ -._.. -3 .... . -_-^ -_^_
loo`lb3-.--
_17A^r72080ct71
1.. S _0715
.----.---.-.__._-_.-._._.._.LJlB-003
6owtoa Aru-Mono Copt------_-_-
I^^----^ __.fib....._.^'^' - ---
--
1-
--
--
- _100 --60
OSOct71 0707 {Jle-003 Mowo Craur Cb--_`--'-"'-- 3 - _ - - 70040gt71 1018 8J18-00^__....-___..-.__._._.._. Moao Cratir -- - - T - - - 60-.^_030cc71 ,. 0732 R1D6-004 .-._.--_ ff. ijih Cii[ni-_ -__ -_- _-fb- _.-
_ _ - - _ ....- 7S_..
020et71 06.}0._..LJDL-002_._..—..._ _- t^^.. . Ci^ur 1'0 T i - - - - - -30oloct7l . _Uut71_ .
,27Aua 71 . _ ,14A^t71 _
0957x.14._,
O,Z21 ._.1^4
-WD6-002 __._..._^.-----_EJD6-002---•----------_----
.-00.2 ..._^_.._._._..._._____.._.-^? ......-.....___-__.
--rim Crates _._._._._._!a_ .^h cr^atar__
.TSajah_^:raur _.._..^__......__Ti^^b Criui _ -__
^3Zi.__
1i__ 1. I_ -_3_ 1
-i-
---
-_-_^
_--SU —_6U _
.10._..._._.__.___- .' ^ 1 1 1^ - - SU10 -._ _ _ _ 1 . 1 - -
. .--.._ ]0
21Ae1s7.1_.23,Iu111_.
^5 _I1S
T.J1^^76___.____ _..---_..-.----..1^1-914__....._..__-.-__---..
-^fziculc•m.--._-^--.__.Atricullun ._--.--,-.-_-_..--
10_...._^. 1 1 1 . 1 --- - ^`-10 _ 1 1 1 1. 1 - _ 4p '--
12Ju171^:^ I
0653n
[JEJ-076 __ ...... _.....__ __..r„^ ,p
A1F..ie ytl turi._..._.. _.._.__._Ee a mente
.. _10_-__._ . ._...10 1
1__...._i 1_ _ 1_ _l _1
-50
!:U"L`E. ^ I ^ Fl,r 71st of publltihed documents which use airborne sensor data collected by ERIM, see Appendix A.(2) For geographic reference system, see Appendix B.(3) For list of organizational addresses, see Appendix C.
Sheet 2 of 2 Sheets
Flight Index Slte DescriptionNominalSpatial
Resolution(meters)
No. of RadarImagery Bands
o.BoresighCameras Total Flight
Line Length(kilometers)X L
BW Col ColIRDate Time LocatioB Ob ects P C P C
-SGS"6^^ 020ct69=Oloet64
Y68ep69_2^sap69.
_291y,F68
..-----0745_ot00_.__TOsOS .090 .-..
._._.._._..
-_pJ.........._g __.__._-____-^.1,181^_.._ ................____....__...__._..
----------..__._..__.._. 1JLJ._..._..-_._.-.-__.____1JW._ ....----..._._._ ___..._....__---
._0!^!__..__..._._____.-_._._
... rlA,t31AL! . _^tuhwo 7iricIiaa^ —^....._..____._.._.._..._._.._.._-......_.__........_Ajrieuiwn.__.._.__. ricultun_-._^__--._._^icultur^._ _---__ __ -._ ice._..-----......_..-----.--
_^'---------_.10_-_.._........__._-._.34.__-___._-10_--_._.
--1Q.----.-. _._.
-- ^^__ __.-
_..__1__1_
1_-_1
..1_
1-1_1.
' _
---_^.__-.._'
'...
-
-_' _^.
-
^1
^-
r
-- ^ _ ^-`SII__.----.30---lQ.
_^4..-
-----
tvu 1 r l t) r ur uet of pu hushed documents u'hu'h use ali lxlrne sensor data collected ny ERIM, see Appendix A.(2) For geographic reference system, see Appendix B.
- (3) For list of organizational addresses, see Appendtx C.
' 117

.._ -'_.
-
^ FORMERLY WILLOW RUN LA80RATORIES,TNE
F 4 ,
DESCRIPTION OF ERIM AIRBORNE SENSOR SYSTEMS
In order to interpret the sensor imagery properly, it is necessary to know the sensors' ^;functio^^s and performance characteristics. Therefore, these items are discussed briefly inthe following descriptions of each airborne sensor . system..
k^. ^^.! M7 MULTISPECTRAL SCANNER
ITheM7 scanner, covering a wavelength range from , 0.33 to 14.0 µm, can operate in up to ^ ;
', 19 different spectral bands of the ultraviolet, visible, and. infrared regions (see: Table 12^. Of w
these bands,. 12 are selected for t <<pe recording at any one time on a 14-track magnetic tape a
machine, As many as five separate radiation reference sources are recorded sequentially for
calibration purposes along with the ground video once in each scan line.
The simplified diagrams of Figure 32 illustrate a typical line scanner--and its method ofairborne use. As shown in the optical' schematic at the top of the . figure; the scanner basically ,;consists of ar optical. telescope with its narrow field of view redirected by,a rotating flat mirror.This mirror causes the system to scan. in a plane perpendicular to the longitudinal axis of theaircraft.. A radiation detector in the focal plane of the telescope converts. the focused beam ofradiation to an electrical signal. First, the optical.. system's instantaneous field of view (groundresolution element} scans laterally across the aircraft ground track through an opening in-the
.bottom of the-aircraft. Then, before making the next ground scan, it scans radiation references(not. shown) which are interpal to the scanner. By the time the next scan begins the aircraft hasmoved forward, so that- subsequent line scans build upon one, another to produce a continuousstrip image of the terrain beneath the' aircraft. '^
The multispectral scanner evolved from this single-channel scanner concept. This evolu-tion required replacement of the single detector element. with a system' of beamsplitters, dis-
persing optics, spectral filters, and multiple detection elements. Figure 33 shows -the opticalconfiguration of the M7 multispectral scanner. The radiation intercepted by the 5-inch -diametercollecting aperture is directed into the Dall-Kirkham telescope, .which has a 3-inch-diameter
rsecondary mirror. The incoming radiation prevented from entering the telescope by this sec-
^' ondary mirror is directed upward by a folding mirror' to Detector Position L This 3-inch-diameter collecting aperture: operates over the broad band of 0.3 to 14.0 µm. To providethermal data at this position, a focusing lens designed for the 8.0 to 14..0 µm band is used incombination with a cooled. HgCdTe .detector. A dichroic mirror mounted ahead of this lens
''^ , diverts ultraviolet and visible . radiation. onto a photomultiplier detector which. is filtered so
^ that the energy. it receives for recording is restricted to a narrow pre-selected band.
r .
--4`
^^.
^*118 -
,^ _^ '.
_ a ,
-.
^ ^: ^ ;

.•
RIMFORr.^I HL1' WILLOW RU ^.. •H^)RA TORTE f. TN( UNIV[Rf ITV Oi MIC MILAN
Electronics - TapeRecorder
Rotating TelescopeScan Mirror ,,^— n
(/ // Detector
`-^- Itadiatil^n I Q L Aircralt skinFrom Ground
Horizon
^ Terrain
Training SetScan Line
Ground Direction ofResolution —Scan
Element
_ Directionof
-- Flight
(Total Field of Views _
FIGURE 32. AIR130RNE MULTISPECTRAL SCANNER OPERATION
119

Photonnrltmhers 112)
Fiber-Optic Bundles
l r''+J
^3Top of Aircraft
Fuselage Thermal ReferenceGraybo.iy No. 1
Opal GlassDrffusmg Plate
^_ DetectorPositron No 1 A
J (2Oto140um)
Sky IlluminationReference
'^* -+ ^ Lens Detector-- ^ Posrtron No 2
Drchroic ^10 9 to 2.6 pm)^^- • f Beam
Splrtter
Dichroic/ Beam-5plrtter
^ ^ Fiber-Optic Arrav
^^ ^ ff, Reimagmg l
I / Dispersing Prismi
\Collimating Lens
Entrance Slit
Folding Mirrors 121 \`-_
FIGURE 33. OPTICAL SCHEMATIC OF ERIM EXPERII;iENTAL MULTISPECTRAL SCANNER, ht7
Thermal ReferenceGraybody No. 2
To Scan ^^" MotorO ^^
Scan Mrrror^
Reference Lamp
'" ^ ,Spare ^ ^
Cal^bratron 1^—„Foldrng
Reference Mirror
^^ _ Port___ Field Stop
- Condensing-- - -_ Lens L
' -``"
r`
"^-^
-^_ ^
Folding' M1Lrror
Detector
^ ^.
^iDall-Kirkham
Posrtron No 1B Telescope10 3'i to 1 0 um1
nR
f
cfA
2
Q
z
vzcz
rv
fI
1

F
`^
^,
^^;
'`"^^ ERIMS?1,
u
o'}[
-
FORMERLY WILLOW RUN LABORATORIES, THE UNIVERSITY OF MICNIGAN
^gg.3
j'
T[
j.[
9
a
yl
U!
^^
{[^♦. ^
_
7
4
i [$ TABLE 12. TYPICAL SPECTRAL BANDS AVAILABLE. „ IN THE M5 AND M? MULTISPECTRAL_SCANNERS
^^}`.-
t
1 Wavelength.- m) Color
'i 0.33-0.38 ultravioleti:', 0.40-0.44 violeNJ i
^'`blue
blueet,. 0..46-0.48
,;0.48-0.50 blue :green.
0.50-0 . 52 green0.52-0:.55 yellow .green ;
_ -}^^
0.55-0.58 yellowi' 0.5 8-0.62 orange
0.62-0.66 orange red
!! 0.66-0.72 redj^ 0.72-0.80 infrared (NIR)
0.80-1 .00 infrared (NIR)^;
1,0-1.4 infrared (NIR)
r; 1.5-1.8 infrared (NIA) 3
2.0-2.6 infrared (NIR)' )
'' *4.5-5.5 infrared (MIR)'` 8.0-14. . 0 infrared (FIR)±? 9.3-11.? infrared (FIR) '
10.5-12.4 infrared (FIR)}^
;!ii ^.
4:
u
_^
^^
-
. { -
.
^.
I i[ _ ..
`. ^!t..
^1 *Not available in the M7 scanner unti1.1975.J
121
E t1
^!
_ _.

^mmFORMERLY WILLOW RUN . LABORATORIES, THE UNIVERSITY OK MICHIGAN
K d
7
!J
The radiation collected by the effective 4-inch aperture of the Dall-Kirkham telescope is.folded into a dichroic mirror which reflects radiation below 1.0 µm, but transmits that oflonger wavelengths. The radiation thus transmitted is focused onto three separately filteredindium-arsenide detector elements in Position 2 by a lens achromatized for the 1.0 to 2.6 µm.region. This dichroic and lens can. be readily changed for different detector configurationssuch as a second thermal infrared detector at this position.
• Radiation at wavelengths shorter than 1.0 µm is focused onto the entrance slit of a prismspectrometer at Detector Position 3. The spectrometer' divides. and directs visible and near- h.,, ^ ,
infrared. radiation through afiber-optic image slicer to as many as twelve photomultiplier,tuhes.
The radiation reference sources are positioned in line with the scan mirror, so that eachsource is "seen" and registered sequentially-once each-scan line. Five reference sources are
used: an NBS lamp packaged to simulate a point source; one ambient and two temperature- 1
controlled graybody thermal references that fh the collecting. aperture: and a sky illumination 'reference . consisting of an opal glass diffusing plate mounted in the top of the aircraft.. Throughelectronic control of the lamp and graybodies and by attenuating optical filters for the sky llu- rurination, the radiation from all but the ambient temperature reference sources is under operator
control. During data collection, all internal sources are monitored and recorded manually by " ^ ^ '.the operator. To assure their validity as references, these sources are calibrated periodicallyagainst external . standards in the laboratory.
The scanner views the terrain during 90° of its scan, providing an external field of view(FOV) f45o from nadir.. A nominal-0.1°C NEST and a i% NEOp are achieved* The system 3operates at a constant scan. speed of 60 scans per econd. Electronic bandwidth was tape-re-corderlimited to a range of DC to 80 kHz. The amplitude and frequency response . is linear within3 db over thisbandwidth. The scan angle response-of the system is within 4% of the nadir valuethroughout the scan. FOV. The instantaneous FOV of each.. spectral band is 2.0 to 3.0 mr, de-pending, on the particular radiation detector . ox limiting aperture size, The imagery is roll-
stabilized and the scan plane can be adjusted for oblique viewing from the normal vertical toany position up to 52° forward of nadir. The radiometric temperature accuracy of the thermal jinfrared bands is approximately l°C at the scanner aperture.
All detector assemblies in the M7 system are aimed along a common line-of-sight. Thus.-
all spectral bands are in registration except those from a special detector assembly which has
*NEOT = Noise Equivalent .change in Temperature.^NEOp =Noise Equivalent change in reflection.
._ 122
t.^.^. _ . :- -^ ^__

I I I I ^^ v iFORMEFLT WILLOW RUN LABORATORIES,TME
7
elements positioned side by side along the scan track at nadir. Only one of the elements ofthis detector assembly is in exact. registration with other scanner spectral bands . (See Ref.
[44] for a more complete description of the M7 scanner and its performance,)
4.2 M5 MULTISPECTRAL SCANNERThe same . or similar four detector assemblies used in the M? scanner were previously used
in a different configuration in the M5 multspectral scanner system. The significant differencein the two systems was that in the M5 system each detector assembly had a separateline-of-
sight. Therefore,-only those spectral bands within a single detector assembly were in registra-7
tion. In the M7 system,. all detector assemblies had a common line-of-sight. For machine pro-
cessng of the data, it is necessary that all spectral bandsbe in registration when collected or
bear some programmable relationship to each other: so that they may be brought into registra-
tion during processing.. ' 'I _ _ _ _
In 1965 when the M5 system was developed, it was configured around readily available air-
borne scanners originally developed for military . reconnaissanre. The twenty multispectral data `^
channels (see Table 12) were obtained by using four detector assemblies, one installed in each
end of two dual -ended scanners. (See Figure 34). A choice of detector configurations was .avail-
able, but the basic grouping for data collection was:
(1)Scannerl
End A: GeHg detector filtered for 8.0 to 13.5 µm
End B: InSb detector with 3 elements filtered for 1 .0 to 1.4 µm,,,• ;
2:0 to 2.6 µm^ and 4.5 to 5.5 µm ^ an
(2) Scanner 2 ''
End A: Spectrometer with 12 .photomultiplier detectors over a range of 0.4 to 1.0 µmEnd B: InAs detector--with 3 elements filtered for 1,0 to 1 .4 µm, 1,5 to 1.8. . µm and r
!, 2,0 to 2.6 µn
7
^;
As assortment of detector/filter. conbinatons was. available for substitution in End B of ]
each. scanner.. These include a photomultiplier filtered for 0.33. to 0.38 µm, single element`^
InAs or InSb detectors with filters for any of the wavelength bands shown for the 3-elementdetectors, a single element HgCdTe detector with a selected wavelength band. between 1.0 and .^.
12.5 µm and a dualelement HgCdTe detector with two wavelength bands between 8.2 and 12.1 µm. ..
The scanners were modified to provide a single scanning mirror surface for each detector
assembly at a fixed scan rate of approximately sixty scans per second. The single scanning
surface was selected (by covering one of .the two scan mirror surfaces). in order to restrict:
the detector to a single radiation -input at any one time. The scan rate selected was the maxi-mum available for the particular scanner and was fixed to simplify canner controls, Most-of
123
^ _ _ _^ . _:
f
...,

RIM^NME RIY W1LlOW RUN LABO RN TORI[f. THE UN^VERf ITY Oi MICNIG^N
Electronics --{ 'TapeI Itec•order
Spectrometer Rotating Filtered 'Scan Mirror Detector
^ ^
End A ^ ^ — ^\' E^.d B
Radiation I Aircraft SkinFrom Ground 4^ I
FIGURE 34. SIMPLIFIED SCHEMATIC OF AN M5 SCANA'ER
124

z
-^

1_ I_ i I i l I -i1- t
RIMFORMERLY WILLOW RUN LABORATORIES,THE UNIVERSITY OF MICHIGAN
the data were .collected at low altitudes. This required the maximum scan rates, and the scan
s overlap at higher altitudes was. acceptable. With. this scan rate and a normal aircraft ground^^ speed of 120 knots, acontinuous-registration of terrain without scan overlap was obtained at
'{ I an altitude of about 1,000 ft.,^
For calibration of the radiation input( to each detector channel, scanner 1 contained two
^ thermal reference plates and a lamp radiation source, and. scanner 2 contained two lampsources and a solar reference Source; these were registered in the detector outputs during each {line scan. The thermal plates provided two graybodies as temperature references for the
.thermal-IR channels (4.5 to 5.5 µm and 8 to 13.5 µm), and the lamps provided radiation. refer-ence levels corresponding. to the reflected energy (from solar illumination) H of typical. targets inthe data channels from 0.3 to 2.6 µm. The dark interior of the scanner was registered as the '
'. zero-radiation input for the scanner channels in the 0.33 to 2.6 µm region. ;
The electrical outputs of the -radiation detectors were ,amplified for 'standard FM recording' ',
w
on magnetic tape recorders with an electrical bandwidth of from near DC to at least 20 kHz.
With appropriate selection of .amplifier gains, DC restoration, and special electronic filtering
in the tape playback, a bandwidth of DC_to 40 kHz was achieved in some data. The maximum-
- information bandwidth of the scanner itself was approximately DC to 70 kHz. The separate de-tector outputs were displayed on oscilloscopes to the airborne operators, who selected the
': appropriate amplifier gains. to match each signal level to the dynamic range of the tape re- 'corder.. - A separate tape machine recorded the output of each scanner.
', ^ System performance was adequate for registration of terrain in all scanner data channels
during daylight hours under all. weather conditions suitable for Visual flight ,rules. (VFR) aircrafkoperation; .however, no clouds could be between the aircraft and the terrain.. Only the thermal
,' channels (4.5 to 5,5 µm and. 8 to 13.5 µm) were operable at night or twilight.', Data. was collected
j at: flight altitudesfrom 500.ft above terrain to 15,000 ft above sea level. However, at 500 ftscans did not cover all. the ground-under the aircraft .because of the limited maximum. scan. rateand the minimum airspeed of the aircraft, The best scan overlap (approximately 50%) occurred
' at a flight altitude. of'2000 ft above terrain and at a ground speed of 120 knots. The fixed scan rate ;f produces increasing scan overlap at higher altitudes.
' ^ The .nominal unobscured FOV of the scanners was 80° across the flight line and continuous
' in the flight direction.. However, when the thermal. reference plates were used with scanner 1,
1.the unobscured external FOV was reduced to 37°. Thelamp reference sources for scanner 2 ,'
:.were :registered during the period of internal -scan so-that the .external FOV for this scanner was;.
^^ ' unaffected'by the calibration sources.' The scan . synchronization signal was stabilized about the `:^^
i' ; roll axis to reduce significant pattern distortion-in the imagery representing scanned terrain.
^ No corrections were made for aircraft pitch and yaw during the scan.;. .^: ,
' 125 ^f
- - ^'^
^ ^ ,,^ __
t
t
k FORMERLY WILLOW RUN LABORATORIES,THEUNIYERSITY OF MICHIGAN
The M5 system provided a maximum spatial resolution, or instantaneous. FOV, of approxi-
mately 4 mr, 'limited by the tape recording bandwidth. The quantitative measure of the signallevel (radiance) in-each band was established by interpolation between two known. radiation in-puts at the scanner aperture. The radiation inputs were common to data channels within a
scanner and could be compareri between scanners. The radiation measurement accuracy of theM5 system was approximately the same as that. for the M7 system. For a more complete de-scription of the M5 system and its performance, see Reference [45 ]
4.3 M1A1 THERMAL SCANNER.The M1A1 airborne infrared scanner system was designed and constructed by ERIM as a j
geophysical research tool for the Terrestrial Sciences Laboratory of Air Force Cambridge Re-
search Laboratories (AFCRL). The system consisted of the line -scanning unit and the image- ]
recording unit. The line-scanning unit was derived from an AN/AAR -9, XA-2, furnished by
AFCRL. This . scanner underwent extensive modifications in video and synchronization elec-
tronics, , optical configuration, and detector assembly in order to improve sensitivity: and reso=
lution. Significant improvementwas achieved in scanner performance.
The dine-. scanning unit (Figure 35) consisted of (1) a four sided mirror, (2) a friction drivesystem to rotate the scanning mirror, (3) a Newtonian collecting optics system, (4) a,liquid-
nitrogen -cooled indium antimonide solid- state detector sensitive to radiation in the 1.0 to 5.5
µrn wavelength - region, {5) a solid state video preamplifier, and (6) synchronization generating
circuits and a vertical gyroscope stabilizing network. All these were mounted on a rigid frame
" - constructed of tubular stainless steel. and anodized aluminum plate.
The infrared ' scanning system first delivered in 1965 was only capable of making an in-
-flight direct recording of the scanner video signal on moving photographic film. It required greatskill, much experience, and some luck to record good imagery on a crucial flight mission. In1967, the M1A1 underwent its first renovation; the single . most important addition was the in- 3stallationof a tape recording system. With this addition, the mission success or failure no
longer depended upon the proper operation of the image- recording. unit. However, the low.lre- -
quency output (which is of prime importance to earth resource investigators) of the scanner ')
was not recorded, in order to simplify operation.
A second renovation o the M1A1 scanner system commenced in the latter part of 1969 and
was completed. in the early summer of 1970. The major changes made to the equipment were;j
(1) elimination cf an alternate two of the four scanning mirror surfaces so that.the detector reg-stered an internaLview of the scanner between external line scans and :only one mirror surface
at a time provided a radiation input to `the detector; (2) provision of low frequency coupling andDC restoration of'the video signal (with reference to the constant. radiation from the internal
':126
. ^:
.. _ ,

i
i,^. _ ._ _ _._ a _ . _, _.
^'',^
,, RIM.^.
It ^ FORMERLY WILLOW RUN LMORATORIEB, THE UNIVERSITY OF MICNIGAN ^
k`}ti^jtr'^.
^,^
^f,i;
{ ^^ ,^ ; i
r^ a
^^ '
^,
Detector
f^ ! Preamplifier^
i, Video3^^,
',
20 V do
i; ^.-
,
' Liquid Nitrogen Cooled
;; '. In Sh Detector Motor 28 V do _i - Roll. Rubber _ t
` Idler , Trigger i
tiGyroscope
Light Slit Amplifier:_ Roll- ^ ^
Scanner Stabilized ;>.
i ! Folding Mirror Mirror Synchronization
zo ^ ac
;' ' Rolf _ PhotodtodesServo
— — — — -
. , - ^Trigger t
.Amplifier
'' Fixed
' — Synchronizat[onLight Slit
i; ,, Parabolic 20 V do
j ` Mirror
F.:,t
z' ,
^^A
(; _ ;;,
Radiation
I '',from '
., Ground.- ;
t
^;
I , ,
,;; ,
3 ; '.
^ ' '.;,
_": i FIGURE 35. SCANNER UNIT
^,,,
,,,
a ,:^;,
c
ai!.
F i:j
^.,.:
^I.
' C,
±.:'
.ra{::,
i
i
^` 127
.--, _,.,x , ^.
' fi
! E `

_
.
_|.
!
!
^
i|
J !/
^

RIMFORMERLY WILLOW RUN LA80RATORIES,THE UNIVERSITY OF MICHIGAN
The original ERIM radar system operated at only X-band frequency with only one returnsignal recorded. In September 1969, a provision was made for simultaneously recording both
parallel and orthogonal polarization of the return. signal:. In may 1971, provisions - were made
for operating the system at either X- or L-band frequencies. Dual polarized returns were-recorded for either frequency. In March 1973, the capability to operate simultaneously at X-
and L -band frequencies was achieved. Two polarizations were recorded for each frequency..
The resulting four data channels can be machine processed using multispectral processingtechniques developed for the optical scanners. --
The major limitation in SLAR data for earth resource applications is that the data lack
references which .could make them quantitative or at least repeatable.. The radar imagerymerely displays contrasts in a scene.
The characteristics of the . ERIM multiband SLAR system are summarized in Table 13.
y
4.5 BORESIGHT CAMERAS FOR AIRBORNE SYSTEMS -The boresight aerial cameras used by ERIM in conjunction with MSS and SLAR airborne
mapping systems were the military type K17, KB8, P220 and P2. The K17 uses 9.5-inch film,
i_ the other cameras 70mm film. The cameras were designed for daylight photographic re- rconnaissance. The K17 is a simple, relatively reliable. camera with limited performance. The '.other cameras are complicated and unreliable,' with performance exceeding the boresight re-quirements. The basic requirement for the boresight cameras was, to record the visual viewof the: instruments under development to aid in the manual. interpretation of the scene imagery.
' These cameras tended to function as remote ground :observation . devices......- {i
.The. performance characteristics" of these cameras are listed in Table 14, .All cameraswere mounted directly on the airframe; inflight leveling or alignment was. through manual adjust-
ments. No stabilization, image motion compensation, or automatic exposure control was avail=
able for .any. of the cameras. The camera operator had inflighk access to the cameras for-magazne changes and exposure adjustments.
None of the cameras had acolor -corrected lens; nonetheless, all produced apparentlyacceptable color fidelity. The. use of color film in the K17 was not recommended because ofthe slow lens; however, under bright illumination conditions, acceptable color work was pro-
,'duced with this . camera.
A variety of film and filters -were available for these cameras. The following film-filter
` combinations were most often used:
^, _
{ k i,1;is^j;i ... _
4 129^1,,
r
^ ??E ^^
I:

i I
.: za..
RIMi ,,^ - FORMERLY WILLOW RUN LABORATORIES, THE UNIVERSITY OF MICHIGAN
6
l
TABLE 13. CHARACTERISTICS OF X- AND L -BAND SLAR
C46 Flying Laboratory ^ 9X-band side -looking imaging radar -dual channel, parallel and orthogonal. polarization ^
i'
L-band side -looking. imaging radar - dual channel, parallel and orthogonal polarization 4
Simultaneous operation of X- and L-band radar is normal operating mode
X-Band Radar , )9.3 GHz center frequency ^ ^Resolution variable from. classified levels to unclassified by-DOD declassification direc-
- five (30' x.30')Range < 10 nautical milesSwath width 3nm variable from 1 to 10 nautical miles with modifications
9
Depression angle variable from near zero to 60° with modifications. ^
L-Band Radar.
{ aY
^, 1.165 GHz center frequency kResolution. variable. from classified levels to unclassified. by DOD declassification. direc- s
tive (30' x.30')
', Range .< 5 nautical. miles _9
Swath width .3 nm variable. from 1 to 10'nautical miles. with modifications
^ ` Depression. angle variable from near zero to 60° with modifications
^ Camera70mm P-2 with 3" or 6".focal length lens
45° center depression angle
NavigationLitton - LTN-51 Inertial _Navigation System
Data Processing
` O tical data rocessin s stem - stri ma .out t ima er and/or rantsp p g Yp __ _p
pu g Y pImage digitizingsystem - imagery in digital form; nine channel digital tape - 8 bit
^ quantization linear or log output
,Data Analysis
Statistical recognitionDeterministic algorithm
130 - _ .:
w w ,r t_ _ _
^- ---- _.

t ii^
l E
+ ,
:.f:
I
I^t
ir!
RIM_ _.
- ^ -..: .Ir
ti
-
.FORMERLY WILLOW RUN LABORATORIES, THE UNIVERSITY OF MICHIGAN.
j?
^ (^
yyl
,^^-: ^
t l ^ 1
^jj
i _
}^
i' ,..
^
i
^^- TABLE 14. PERFORMANCE CHARACTERISTICS1
OF AERIAL CAMERAS ^
_ K17D* KB8A*/P220 P2* ^.
Magazine type A5A LA97A LA97A'' Film capacity 9.5 in. x 200 ft 70mm x 50 ft 70mm x 50 ft
No, of exposures 250 230 230j
^
Max.. cycling rate 1/3 cycle/sec 5 cycles/sec 5 cycles/sec`' Shutter speeds 1/50-1/400sec 1/500-1/2000 sec 1/500-1/2000 sec
Mas, AWAR D 25 lines/mm 42 lines/mm 30 lines/mm 1'
,: Focal length 6 in. 38 mm 3 in.;' Max. aperture f/6.3 f/4.5 f/2.8
Angle of .view 73°44' 73°44' 41°O6'
;" *Military type.
Area-Weighted. Average Resolution _ `j
R,
t,
_^
,.::
_.- - ,,
`':fn.;^:I
{i^
_
'9a;^ 3
'a
tff
r^
E :;.^ ^.^
f ' i
Ip.p
^ Y'.
d
-r .;;
Jh
.^
)'^sr
`^
^
,_,
131
,t
^1^^_ __ . ___. _ ----- -_ _._.__ --^._-^
...,
____ __ __--

}
G

- 5
!^ - DATA RETRIEVAL
^:^
Potential users of ERIM ' s remote sensing data who are not familiar with the formats avail- ^ ,able will find it helpful to first review the various functions involved in airborne sensor data
^ 41 recording. and reproduction.* The=remainder of this section will be devoted to describing the
^^ inflight data. recording systems, postflight imagery reproductior. on film, and postflight datareproduction on magnetic tape, Also, a procedure for obtaining ERIM data is described. '^
i
^: ,;
`, 5.1 INFLIGHT DATA RECORDING ^ {
^ i
.All of the remote sensing data collected rx ERIM's airborne sensors over the past nine. ^ 1years have been recorded during flight. on magnetic tape for the optical scanners or film for
the .imaging radar and cameras. The recording and playback equipment. employed with: the H
^<
p gr
Y Y p p^various scanners have ro essed over the ears from relativel sim le to a machines with ^
limited capabilities to more sophisticated equipment providing a wider electronic bandwidth.
' ! The basic analog format of the scanner recording systems remained unchanged, howtwer, makingretrieval and analysis of the data from past. years relatively straightforward using common
. ..', equipment. __
r ,r
Each of the three basic sensors (MSS, SLAR and. cameras) used by ERIM ' s flight facility to:k.
collect remote sensing data has its own unique method. for recording the data from the ground._r
Two of the sensors, MSS. and SLAB, are scanning devices, i .e., they receive signals continu- ^? '^ ;
^ - ously while the sensor IFOV moves . over the flight path scanning the terrain. _ Hsnce, there- ^ ^^.
cording system for these sensors must be capable of recording long uninterrupted streams of
data in multiple bands. Magnetic tape is used on the MSS system partially to preserve the , signal
xin electrical format for machine processing and partially to record the great dynamic range of 3
' signals. The SLAR system, on the other hand, uses roll photographic film to record the signalsreceived in holographic form, which preserves the wide dynamic range.. The data. rate of the
SLAR system is so large that magnetic tape could not be used. ` The important 'thing to note is
.that neither of these systems provides visual imagery on film asits raw output. =Both. MSS and ^ ^;, i
SLAR require some form of postflight processing or data reproduction before an image of the
? terrain is obtained.
} The aerial camera, on the other hand, does provide usable images of the ground on film 1
as raw data. In most instances; the photos are used as flight line verification for the other sen-
^ stirs. A brief description of each of these recording systems follows.
," . K
*User representatives will also find it constructive to discuss possible processing work '^, with ERIM data processing and analysis personnel who, from wide experience, can offer many
^,, helpful suggestions.^ ;
a^i ', 133;E
^`
t'
' .i

RIM - - -FORMERLY WILLOW RUN LABORATORIES, THE UNIVERSITY OF MICHIGAN
5.1.1 ANALOG MAGNETIC TAPE FOR SCANNERSAll of the multispectral (MS) data-collected by ERIM's scanners since 1966 has beenxe-
corded on 10-inch analog tape reels. Prior to the summer of 1971, two tape recorders wereemployed simultaneously, each usually recording different spectral bands. Combinations'oftwo one-inch, fourteen-track machines, or one one-inch and one half-inch, seven-track. ma-chine, were used at various times depending on the availability of tape recorders. More thanone .machine .was necessary because the M5 system had more spectral channels available for:recording than could be accommodated on a single o>ze-inch, fourteen-track machine.
After July 1971, when the double scanner M5 system was replaced. with the single M7scanner, only a lone fourteen-track tape machine was employed. The basic operation of therecorders remained the same, however.
All MS data have been recorded at 60 inches per second (IPS) which, for aten-inch tapereel and an aircraft speed of 120 knots,. provides up to 28 statute miles of uninterruped data..
Usually, the data line lengths vary greatly over a single mission and several lines may berecorded on a single tape. Of course, for the two recorder Getup, two, tapes would exist forthe. same lines. If the total mission involved more than 28 statute miles of data, then severaltapes migY.tt be required.. The flight logs generated for each mission provide documentationof these reels and flight lines.
IThe tape recorders, when operated in the standard FM mode, have an electrical bandwidth ':
rof DC #0 20 or 40 kHz depending . on the FM center frequency. With appropriate selection of aamplifier gains and special electronic filtering in .the tape playback,' a bandwidth of DC to 40 tor 80 kHz was achieved. The FM electronics were set for f30%Q deviation about the center 'frequency (either 108 kHz or 216 kHz) to reco_rc^ an input . signal of 0 to 3 volts. In record mode,the tape machine electronics were set up to.operate in an abnormal manner. For zero. signal ':.
g
input, the carrier frequency was set at the high frequency {+30% deviatiom) instead of at thenormal center frequency. For osp itive signal input (no negative signals present), the carrierfrequency was shifted downward to a' =30% deviation from the center frequency. Zero voltsrepresents dark or cold targets.,.
The separate detector outputs were displayed on oscilloscopes to the airborne operators,
..who selected the appropriate amplifier gain to match each signal level to the dynamic range of
the <tape recorder. All video signals were recorded FM while the. synchronization. signal was "^^recorded either direct or FM, depending. on the year in which the data was obtained. Thecarrier frequency of the FM signal was either 108 kHz or 216 kHz, again depending on when thedata was obtained._,However, since _1971 all-synchronization and ,video signals. have. been re-corded FM at 216 kHz. While here has been no permanent assignment of a particular scannerspectral band to;a particular. tape channel, .the usual practice has been to record the
134
^^^^:}

r .. _
' _-.__
I^ !.,
^^^i
f^^,,^if ri^It^4
it
RIMFORMERLY WILLOW RUN.LABORATORIES,THE UNIVERSITY OF MICHIGAN
scan-synchronizing reference and line count. on .tape track 7. Since the tape machine hasstaggered heads, the six spectral bands most likely. to be machine processed were assignedto odd tracks along with the sync in order to '.minimize misregistration of .the multispectraldata because of kape transport characEeristics (skew, stretch, .etc,).. When optimized registra-lion of the imagery in all nape channels is desired, analog delay lines are used in tape duplica-lion on ,the processing tape machine to bring common objects in the imagery into exact registra-Lion.
It should be noted here that time-registered .data is limited to that data recorded on a single-tape machine, Hence, any processing requiring multispectral coverage of a common area on
the ground must be done with those signals recorded on a single tape.
','` 5:1.2 FILM FOR RADAR _ _ ,^
j
°, The ERIM. dual frequency radar-does not produce visible radar imagery in flight. Instead,' radar data are recorded in the aircraft on film in a holographic format for subsequent process-
's ing on the ground to produce visual radar images of the scanned terrain. 'Each of he four avail-'' able channels utilizes different radar echo signals. One channel produces an image from the
X-band;parallel polarized signals,. a second uses the X-band cross-polarized signals, a third• uses the L-band parallel signals, and a fourth uses the L-band cross-polarized signals,
The four channels of stored radar data are recorded on parallel strips of photographic film, ,,
with X-band data on one 70mm film strip .and L-band . on another. The various radar signalsare synchronously detected in .order to preserve both phase and amplitude information, and are
' routed through the CRT. displays and onto their accompanying cameras .where the films are f!`
exposed.. These films are on 100-ft reels which. have the capacity to record. for e about 450 klom- 'Ieters of flight .line length per reel. The reels can be changed in the air..
5.1,3 FILM FOR BORESIGHT CAMERAS' The aerial cameras used with the- MSS and SLAR. systems provide the higher 'spatial reso-
lotion required for shape identification of some terrain features and. conditions, Areal camera. icoverage-was. secondary to the MSS and SLAR cove-rage. The-ERIM' cameras provided. adequate
` boresight data. for visual . analysis of the site. .!
''
The boresight cameras were operated during daylight with whatever film/filter combinations ',were requested by the PI. Often lighting conditions were _unsuitable for good photography'but thecameras were operated. anyway to record the visual view of the MSS and SLAR..: This boresight
photography was developed by ERIM and supplied to the PI without screening or evaluation,
I( - 135
k^ `
},.

ka. FORMERLY WILL
5.2 POSTFLIGHT IMAGERY REPRODUCTION ON FILMThe purpose of this section is to describe the functions required to convert .the SLAR and
MSS inflight data .recordings into film imagery.
5.2.1 MS SCANNER IMAGERYAlthough he original recording of all MS scanner data is on analog magnetic tape. in the '
aircraft, the data, users usually require that at least some of the spectral bands be printed onfilm for visual. analysis. This is accomplished in the laboratory after a'flight and is one of the
'^ most basic forms of reproduction. Primary uses of this scanner film data are to document
'; flight line coverage and for manual editing of the imagery to select specific areas o be machine '^ processed. Indexing of the selected areas for processing is accomplished either by reference
to the scan line count in the sync signal or to a visual display of the imagery.
The filmstrips of scanner imagery are reproduced at real-time rates, one; track. at a time,from. the original analog magnetic tapes. The laboratory tape machine has associated elec-tronics which provide operator selection of playback electronic bandwidths of from 10 kHz to100 kHz. The reproduction bandwidth . is selected to match the optimal information bandwidth.of the various-size detectors used in the scanner. For instance, the large spatial resolutionof the layered thermal detectors.showsthe best signal-to-noise at the lower bandwidth limit, jand the small spatial resolution of the spectrometer in 'the visible region requires. he upperbandwidth limit. Other electronics in the filmstrip: reproduction facility provide clamping ofthe do level of the signal to radiation references for do restoration,. and the registration of ',
{ radiation reference quantities through sample gates. These reference quantities can be storedtemporarily and, if :desired, retrieved for reformatting of the data in analog form.. A :data "slate"for film labeling through .direct exposure is also available.
The filmstrip of scanner data. is made by photographing an . intensity-modulated line scan.on the- face of a cathode ray tube (CRT). The intensity modulation is a direct function of voltagevariation in .the particular radiation detector output recorded on magnetic tape. Normally the0- to 3-volt variation of the tape signal is transferred to the film as the total variation in gray-scale.'. However, this transfer relationship is controlled by the operator.. Other relationshilis
', may be-selected, -such as remaining in the linear portion of film sensitivity. Between runs, anequal.=voltage-increment. gray scale is printed on the film to establish the voltage-to-film tone
calibration..
The filmstrip camera drives 70mm film acrosstheCRT face, perpendiculartotheline scan, '^
at rates proportional ` to the aircraft ground speed and absolute altitude. ; The camera film speed
range includes absolute flight altitudes of from 1000 0 10,.000 ft at a ground speed of . 120 knotsto provide an imagery. scaling on film . of the :absolute .flight altitude per inch of film. At the .higher
'. .. K,
136 '.a k
i-
t'
x^_..
}
^..._ _ _.

I I I _ 11
ERfM
altitudes, several line scans are integrated in the film display because of overlap at the constantscan rate., At the lower altitudes, the imagery may not be contiguous (no overlap) for the small
detector spatial resolution.
Filmstrip displays of scanner imagery are not restricted to the mere printing of a partic-
ular tape channel on film. The electrical signals from the separate tape channels can be com-biped or processed in various ways before printing. The methods often. used. are level slicing 'and the mixing of spectral. bands to simulate other instruments, An example of the latter is the ^^ ^
` simulation of ERTS-A_spectral bands by controlled mixing of selected M7 scanner bands. The' spectral response of each channel of the ERTS scanner can be simulated by a weighted addition
of appropriate `M7 scanner channels.^,
` For the majority of ERIMmultispectral missions,. four spectral. bands have been repro- ^' 'duced as filmstrip imagery. The filmstrip . negative .and one print are sent to the PrincipalInvestigator (PI) directly or, in the case of NASA missions, to. NASA where duplicate prints and ^: '.
. negatives are made for transmittal to the PI. At least one print copy of all filmstrip imagery x•y
delivered to PI's is retained at ERIM in an imagery vault. No imagery negatives are stored in,
:,the vault at ERIM except for those missions flown for ERIM PI's.•
'
5.2.2 RADAR IMAGERY_,
l3,.
^^
SL;AR'radar imagery,.-stored. on film at ERIM,is, in general, viewable . imagery, The ori-ginal data film, which, is also available, requires further processing before an image of the
F ground is obtained. This imagery is produced by inserting . one channel of recorded. data into an `^ ^;optcal,pr.ocessor where two dimensional pulse compression is performed. A visible image is_ t
displayed at the output plane. of the .optical data processor.
' This output imagery can be observed in the processor, but it is at small scale. Close ex- ^ 'amination of the imagery is facilitated. by use . of a microscope.. The. processor output image isin the form of'; a real opticalimagewithan extremely large dynamic range of ntensity..corre-sponging to the large reflectivity variation of objects illuminated by radar wavelengths. Some'image components may be 40 or 50 db brighter than the background level of the image. These
:bright. spots are prominently visible to an observer,.. and are usually found to be due to specularreflection. from man.-made objects. ^:
" ^ !E
Four separate output :films can be made of each channel's imagery. These have the same-' ^ smah scale as the imagery in the processor. They can be examined on alight table with the aid'of a ,
microscope, or they can beprojected for e observation at larger scale, The output films cannot' '' 1^ adequately display. the large .dynamic range of the radar image formed in fhe optical. processor
^ ,.^ ; because of the limited dynamic range of the photographic emulsion; hese films are usually ex-
posed and developed to present small amplitude, signals visibly. These small signals are they.
^( '` image components that comprise most of the terrain image, and are referred to as "ground-137
^ `^
1
^ 1'F ' I.;

T
painting" signals. The brighter. components: of the radar -image .are then greatly over exposedand appear with photographic blooming of their main lobes, visible side lobes,. often. with somemodulation side bands, and occasionally with photographic haloes.. These effects can. be helpful.in detecting the highly reflecting objects if they are properly interpreted. Of course, the bloomedimages infringe upon their neighbors and may obscure some dimmer image components.
5.2.3 BORESIGHT CAMERA IMAGERY -Black-and-white film obtained with ERIM ' s aerial cameras is developed at: ERIM while the
..color film is sent to a commercial developing laboratory. ,ERIM retains, m the' imagery vault,one filmstrip print of all black-and-white photography. The black -and-white negative and aprint are sent to the PI either directly or'thrpugh NASA who provides duplicates to the PL
The color photography obtained is always in the form of positive transparencies. No printsare made and. the PI is sent the original (or a NASA duplicate as :the case may be). Only forthose missions flown for ERIM PI 's will aerial photography transparencies be available from
ERIM ' s.vault.
5.3 POST -FLIGHT DATA REPRODUCTION ON MAGNETIC TAPEThe use of multispectral data has produced a variety: of analysis and recognition tech-
piques. These techniques have :included the. use of digital computers in the analysis of targets...and backgrounds as objects or distributions in. multspectral space and for .the development andtesting of recognition techniques.
Frequently,. users who have access to data processing facilities request dither duplicate r
analog tapes of data or digitized data - for their own. analysis: Properties. of these two data.formats are discussed below.
t
5.3.1 DUPLICATE ANALOG TAPES
i
,: a
The:. duplicate analog tape is simply a copy of the original data -tape. All channels are
commonly transferred from 'the original ko the duplicate. A special analog tape duplicating rsetup transcribes the FM signals to the second tape, normally without going through the de-modulation and remodulation process..
z^
-_
The video and synchronizing data are recorded in IRIG * standard FM with t30QJo deviation. `:
The synchronizing signal consists of two pulses of opposite polarity and close proximity, the °, -
^3
*Inter'-range instrumentation group.....138
,.
,,,
:_ ^

._ _ __
E^. FORMERLY WILLOW RUN LABORATORIES, TN!
first pulse being the non-roll - corrected sync, while the second is the roll-corrected sync.
Since all tapes are supplied wound fully forward, they must be completely rewound before play-
ing. Unless specifically noted ., all channels on the duplicate correspond to the same channels
on the original.
Faults existing in the original tapes can often be corrected or relieved in the duplicatedtapes. Examples are polarity reversals. in a particular track, or .minor misregistration of theimagery between tracks. Because the correction of such faults usually requires demodulationand remodulation of the FM signals, some signal = to-noise is then sacrificed in the duplicating
process. Duplicates, however,. are not normally available off the shelf for any of ERIM ' s data. jThey are generated only when requested. ^
5.3.2 DIGITAL TAPES 1
Although digital processing of ERIM data has been used quite extensively in remote sensing
applications, computer compatible tapes (CCT's) are generally not immediately available forthe majority of the data stored at ERIM. Most new applications needing digital processing
would require completely new A/D conversion. The facilities maintained by ERIM can supplydigital data tapes, suitable for computer processing, in one of several formats. All data are
digitized to 9 bit accuracy (8 bits plus sign). Flexible control of the A/D conversion processallows sampling of the data once every resolution element, once every other . resolution element,and so on. Also, scan lines of data may be skipped. Unusual sampling formats may also beaccommodated. Normal formats are as follows: sample each resolution element twice; sampleeach resolution element once;: sample every other or every fourth resolution element. .Anynumber. of lines up to nine may be skipped.
Consultation. with data -processing personnel at ERIM is recommended before specifyingwhich format is to be used. This will assure format compatibility with a particular machine. '
Areas to be digitized can be specified by marking data locations on a print of scanner imagery.. ^'
Facilities will soon be available to put scan line numbering information on the film -strip so that
a precise specification of areas to be digitized (in terms of starting and stopping line number);
will be possible, Data normally digitized . include calibration and dark level information, which.will be supplied in bipolar form unless otherwise specified.' A graymap printout of video dataalone will also be supplied.. Line and point numbers on the map correspond to line and point
.numbers on the tape.
-For radar applications, a digital. tape is generated by scanning and recording the film out- sput image intensities on magnetic tape. Computer analysis of the four channel radar imageryis then possible, although signal-to -noise is limited by the dynamic range of the original . film, ,y
139
t
i ?
' ^,.
t
^_

1.^
j
7
iF
/.J
RIM •FORMERLY WILLOW RUN LAHORA70RIE5. THE UNIVERSITY O p MICHIGAN
x
5.4 PROCEDURE FOR OBTAINING ERIM DATAERIM has maintained several data storage vaults through the years as MSS and SLAR data
have accumulated.. Since most of the data has been collected at government expense, it shouldbe u3^d whenever possible in helping to solve earth resource problems. Any Lfiited Statescitizen. or agency who might make use of some of the remote sensing data stored at ERIM is
encouraged to do so. In the. remainder of this section, a procedure for obtaining both unpro-cessed and processed ERIM airborne -data is discussed..
5.4.1 UNPROCESSED AIRBORNE SENSOR IMAGERYAny potential. user of ERIM airborne sensor data requiring either duplicate raw data. or
^ ,reformatted data onto tape or film should contact Mr. Philip Hasell (for .MSS) or Mr. RichardLarson (for SLAR) at ERIM for details on formats and estimated costs of retrievah Authoriza-
` lion for ERIM's release of copies of the unprocessed data must be obtained (by the user) fromthe agency who originally contracted for the data collection before any duplication. or reformat-ling can actually proceed. The contracting agencies are given after each mission in the tables
of Section 3. Further _ information on details such as site description, ground observation,
p purpose of the .original_ data collection,. and what has been . done with the raw data must be ob-
',•
twined .from the missian PI.
5.4.2 PROCESSED/ANALYZED AIRBORNE DATA.General information. on the application of ERIM. airborne sensor imagery to particular
x ^° earth resources problems and its approximate cost can be obtained from Mr. Donald Lowe1 (MSS), Mr. Fred Thomson (MSS), or Dr. Philip Jackson (SLAR) at ERIM.- Data processed or
analyzed by ERIM is released in a report which. acknowledges the original sponsor for the:data collection as the source of the sensor data. Any release authorization necessary for-the
processing and/or analysis of, airborne data would be obtained by ERIM...
Specific_details on what can be done digitally in the . areas of statistical. analysis.. and. objectclassification of MSS. airborne data and their estimated cost is available from Dr. Jon Erickson
^'I 4 - or Mr. Richard Nalepka. Either Mr Philip Hasell (MSS) or Mr. Richard Larson (SLAR) can^_I help. determine the costs of wimple analog processing'such as level slicing and ratioing of
i
^bands•
f
;
e 5.4,.3 SUMMARY OF DATA REQUEST PROCEDUREA. -Unprocessed Airborne Sensor Imagery
r ^ 1. Contact Philip Hasell (MSS) or Richard Larson (SLAR) at-ERIM for more` information on formats and costs.
140
^ ^ _ -0
^;
r$_
i

A... ..._..- — _.
^
- ^
,.o .^.,.
ii
;^ ',
4'
[^,^
f'
p dEr
I
FORMERLY THE UNIVERSITY.OF MICHIGAN

THE
Appendix A
A; t LIST OF PUBLISHED DOCUMENTS WHICH USE. AIRBORNE11 SENSOR DATA COLLECTED BY ERIMI^ ? This appendix is a listing of published technical .reports and papers which made use of the
;I
'' airborne sensor data collected by ERIM. It was originally intended that each data set ref-F^
erence documents using that particular data set, but this turned out to be an overwhelming
^ task.. When principal investigators responded to our queries regarding the use they had made'of a particular data set, they responded by wending lists of references citing all documents
^ using ERIM data. The additional effort and time required to identify a particular data set
seemed unwarranted.
Therefore, the references are grouped by airborne sensor type and the major users ofdata from that sensor. Since most of the references to multispectral scanner data included
t
machine processing of that data for analysis, and since ERIM and LARS .(Purdue University)accomplished most of the processing of this type of data for investigators during the period
!' covered, it follows that most of the published documents originate from these organizationseven though the principal investigator may have been in some other organization.
^ The referenced documents are grouped as follows:^,
f
" ` A.1 MULTISPECTRAL SCANNER DATA (M5 and M7 Systems)j^i ! A.1.1 ERIMi ^ ,
A.1.2 LARSA.1.3 Government AgenciesA.1.4 Miscellaneous
A.2 THERMAL SCANNER DATA (M1A1 System)Y
S
r . A.3 ;SIDE LOOKING.AIRBORNI•;.RADARDATA (X- and.L--Band Systems)_ _ _
,:
^,, '
:;.
nn
,;^
^. ,.,
1 ^ -I ^^
i143

THE UN1KE p51TV OF MIGF
A.1 MULTISPECTRAL SCANNER DATA (M5 and M7 Systems)
^ A.1.1 ERIM
Rebel, D.L., SKYLAB Final Report on Project 102101, being written, 1975.
i Wagner, T.W. and D.L. Rebel, ERTS-1 Investigation for Lake Ontario and Its Basin (MMC114), Report No. 193300-62-F, Environmental Research Institute of Michigan, Ann. Arbor,
^^Michigan, July .1975.
4, ! Wezernak, C.T., D.R.. Lyzenga and F.C. Polcyn, Remote Sensing Studies in the New YorkBight, Report No. 109300-5-F, Environmental Research Institute of Michigan, Ann Arbor,Michigan, July 1975.
Wezernak, C.T., .Inland Lakes Water Quality and Watershed Planning:. Remote Sensing -fiechnology Applications, Report No. 193500-6-Fi,Environmental . Research. Institute ofMichigan; Ann.Arbor, Michigan, June 1975..:
! Work, E.A., S.:Gilmer and A.J. Klett, Utilization of ERTS-1 for Appraising Changes inContinental Migratory Bird Habitat, Final Report ERTS:-1 Investigation SR-255, in press,1975..
Malila, W.A., R.H. Hieber and R.C: Cicone, Studies of Recognition with MultitemperalRemote Sensor Data, Report No. 109600-19-F, Environmental Research Institute of Michi- ;gan, Ann Arbor, Michigan, May 1975.
WEnViron ent 1 Research Institute ofoMichUan Q n
ArboraMichipant No. 193300-55-F,Y g g
g , , g ,March 1975s
Wezernak, C.T.. and D.R. Lyzenga, "Analysis of Gladophora Distribution in Lake Ontariot
Using Remote Sensing," Remote Sensing of Environment, Vol. 4, No. 1, January 1975. 3
' Wezernak, C.T., D.R. Lyzenga and F.C. Polcyn, Gladophora Distribution in Lake Ontario(IFYGL), Report No. 102600-1-F, Environmental Research Institute of Michigan, Ann Arbor,Michigan, December 1974.
Malila, W.A., J.E.. Sarno, T.W. Wagner, J.T, Lewis and J.D. Erickson, The Use of ERT5Data for a Multidisciplinary Analysis of Michigan Resources, Report No. 197500-28-F/197600-27-F, Environmental Research Institute of Michigan, Ann Arbor., :Michigan,September 1974..
` -Thomson, F.J., J.D. Erickson, R.F. Nalepka and J.D. Weber, Multispectral Scanner Bata
j Applications Evaluation, .Report No. 102800-40-F, Environmental Research Institute of iMichigan, Ann_Arbor, Michigan, December 1974. 1
Malila,: W.A., R.H. Hieber and J.E. Sarno, Analysis of Multispectral Signatures and Investi- i
gations of Multi-Aspect Remote Sensing Techniques, Report No. NASA CR-ERIM 190100-27-T, ;,! Environmental Research Institute. of Michigan,.. Ann.Arbor, Michigan, July' 1974.. ''-":.
Nalepka, R.F, and J.D. Erickson, Investigations Related o Multspectral Imaging Systems,:Report No: 190100-46-F; Environmental Research Institute . of Michigan, Ann Arbor,, Michi-gan, September 1974. -
Vincent, R.K., G.S. Thomas and R.F. Nalepka, Signature Extension Studies, Report No.190100-26-T, Environmental Research Institute of Michigan, Ann Arbor, Michigan, July 1974.
144^;.
^I_
ii
__ ,....1_.
^JJJJ.
i

}"
f ,
` l^^°'`.^.__.€.. ^s^..^_,r^;.>_£ -- .,:.— .— :: •. _._u _ ._.—.— --- — ^ __ ^ .__, _ ._ 'rte_I ..
• .
i ,
^
'^ 'I^ ,
ERIMFORMERLY WILLOW RUN LABORATORIES, THE UNIVEp51TY OF MICHIGAN ^;^
r,i
^-i
A.1 MULTISPECTRAL SCANNER DATA (M5 and. M7 Systems) (Continued)
.. _. _ ;f^ ^
A.1,1 ERIM (Continued) t^,
Thomson, F.J., J.D. Erickson, R.F. Nalepka and J.D. Weber, EOS System Study Executive ^,Summary: Study of Requirements for and Feasibility of an Orbital Multispectral Scanner,Report No. 102800-41-X, Environmental Research Institute of Michigan, Ann Arbor, Michi-gan, July 1974, ^, ^
Sellman, A.N., LJ. Sattinger, L.B. Istvan, W.R. Enslin. W,L. 1VIe}^ers and M.C. Sullivan,Remote Sensor in Michi n for Land Resource Mana ement: Waterfowl H Managementat Pointe Mouillee Re ort No, 193400-1-T Environmental Research Iaisti'abitat
=,.p Lute of Michigan,
Ann Arbor, Michigan, April 1974,
^i
Wezernak, C.T., The Use of Remote Sensing in Limnological Studies, in Proceedings. of the- 1Ninth International Symposium on Remote Sensing of Environment, Environmental Research,Institute of Michigan, Ann Arbor, Michigan, April 1974, pp, 963-980,
Wezernak, C.T., J.R, McKimmy and F,C. Polcyn, Power Plant Discharges and Thermal ^Anomalies in Southern Michigan, Report No. 290100-1-F, Environmental Research Insti-tute of Michigan, Ann Arbor, Michigan, March 1974.
Zuk, D. and G. Suits, Report of Optical Ground Truth Measurements for 5 August 1973, TestSite No, 5485:32, in support. of SK^'LAB Multispectral Scanner; Report No. 101700-10-X,Environmental Research Institute of Michigan, Ann Arbor, Michigan, January 1974.
K
Work, E.A., Application of the Earth Resources Technology Satellite for Monitoring theBreeding Habitat of Migratory Waterfowl in the Glaciated Prairies, MS Thesis, The Univer-city of Michigan, University Microfilms, Thesis Abstract No. M-6698, Ann Arbor, Michigan,1974, 107 pp.
F , Work, E.A, and F.J. Thomson, A Study of Waterfowl. Habitat in North D<<kota Using Remote'r Sensing Techniques: Phase II, Report No. 101000-12-T, Environm.e.ntal Research Institute
of Michigan, Ann Arbor, Michigan, 1974, 96 pp.
Work, E.A,, D.S.. Gilmer and A.T. HIett, Utility of ERTS for Monitoring the Breeding Habitatof Migratory Waterfowl, in Proceedings of the Third Earth Resources Technology Satellite 1Symposium, Washington, D.C., 1973, Vol. I, pp i6?1-1685, Vol. II, pp. 1D2-113, 1974. ;
Malila, W.A., Information Extraction and Multi-Aspect Techniques in Remote Sensing, Ph.0. ;Dissertation, The University of Michigan, University Microfilms, Thesis Abstract No. 75-748,:Ann Arbor, Michigan, 1974-.. °,
Vincent, R.K,, T.W. Wagner, B. Drake and P. Jackson, Geologic Reconnaissance and Litho- ,:I - logic Identification by Remote Sensing, Report No. 191700-8-F, Environmental Research y
. Institute of Michigan, Ann Arbor, Michigan, December 1973.
E Malila, W.A. and R.F. Nalepka, Advanced Processing and Information Extraction Techniques'; Applied. to ERTS-1 MSS Data, in Proceedings of the Third ERTS Symposium, Washington,
D.C., Vol. I, Sec. B, NASA SP-351., December 1973, pp. 1743-1772.t'
- L Crane, R.B.,, W. Richardson, R.H.. Hieber and W.A.: Malila, A Study of Techniques for Pro-j ^ cessng Multispectral Scanner Data, Report No. NASA CR -ERIM 31650 -155-T, Environ-E ; mental Research Institute of'Michigan, Ann :Arbor, Michigan, September_ 1973.
t
j 145
z,,
^.,^
_^
- , ,
^,-

RIMFORMERLY WILLOW RUN LABORATORIES,THE UNIVERSITY OFMIGHIGAN
A.1 MULTISPECTRAL SCANNER DATA (M5 and M7 Systems) (Continued)
A.L1 ERIM (Continued)
Nalepka, ft.F. and P.D. Hyde, Estimating Crop Acreage from Space-Simulated MultspectralScanner Data, Report No. 31650-148-T, Environmental Research Institute of Michigan,. AnnArbor, Michigan, August 1973.
Polcyn, F.C., et al., Multispectral Sensing of Water Parameters, presented. at the. International •'^ Symposium on the Remote Sensing of Water Resources,. Canada Centre for Inland Waters,
Burlington, Ontario, June 1973.t,_
,
Nalepka, R.F. and J.P. Morganstern, Signature Extension: An Approach to OperationalMultispe,ctral Surveys,. Report No. 31650-152-T, Environmental-Research Institute of Michi.- ':gan, Ann Arbor, Michigan,. March 1973. • i. ;
Wezernak, C.T. and N. Roper, Monitoring Ocean Dumping with ERTS-1 Data, in Proceedingsof the Symposium on Significant Results Obtained.. from the Earth Resources Technology ,Satellite-1 Goddard S ace Fli ht Center Greenbelt Mar land March 1973 635-641.
^, p g ^ y ^ , pP•
Work, E.A., D.S. Gilmer and A.T. Klett, Preliminary Evaluation of ERTS-1 for DeterminingNumbers and Distribution of Prairie Ponds- and Lakes, in Proceedings of the Symposiumon Significant Results Obtained .from the Earth Resources . Technology . Satellite-1, GoddardSpace Flight Center,. ;Greenbelt, Maryland, March 1973, pp. 801-808.
Malila, W.A., R. Crane and W. Richardson, Discrimination Techniques Employing both Re-flective and Thermal' Multispectral Signals, Report No. 31650-75-T, Willow Run Laboratories,The University. of Michigan, Ann. Arbor, Michigan (now ERIM), January 1973. ,
Wezernak, C.T. and F,J. Thomson, ':'Monitoring of Dumping by Means of Satellite RemoteSensing," AMBIO, A Journal of the Human Environment, Royal Swedish Academy of Sciences,Vol. II, No, 3, 1973, pp. 84-86.
Sattinger, LJ., et al., Remote Sensing in Michigan for Land Resource Management: HighwayImpact Assessment, Report No. 190800-1-T, Willow Run Laboratories, The University ofMichigan, Ann Arbor, Michigan (now ERIM), December .1972..
i
Sattinger, LJ., et al., Remote Sensing in Michigan for Land Resource Management, ReportNo. 190800-2-F, Willow Run Laboratories, The University of Michigan,. Ann Arbor, Michi-
^' gan- (now ERIM), December 1972.d
Wagner, T.W., Progress and :Plans for. a Remote Sensing Program for the International Field )Year for-the Great Lakes (IFYGL), Report No. 11229-14-L, Environmental Research Insti-tute of Michigan,: Anri Arbor,. Michigan, December 1972.. ^
j; Wezernak, C.T. and F.C. Polcyn, Technological Assessment of Remote Sensing Systems for^ Water. Pollution Qontrol, Report No:`10011-3-F, Willow Run Laboratories, The University
of Michigan, Ann Arbor, Michigan (now ERIM), December 1972:a
Ahl, J.G., M.G. Boylan, D.L. Makma, W.L.-Meyers, S W.. Schar, R.D. Vlasin and LJ. Sattinger, 9t^ Investigation of Land Resource Use in Southeast Michigan, in Proceedings of the Eighth
Symposium on Remote Sensing of Environment, Environmental Research . Institute of Michi- '^gan, Ann Arbor, Michigan,: October 1972.
:^ ,...
146M -
1,
.^:^., ^
1
.
9 M
.:^
t
{I ^ _ _ _

ERIMFORMERLY WILLOW RUN LA80RATORIES,THE UNIVERSITY OF MICHIGAN
A.1 MULTISPECTRAL SCANNER DATA (M5 and M7 Systems) (Continued)
A.i.l ERIM (Continued)
Driscoll, R.S. and M.M. Spencer, Multispectral Scanner-Imagery for Plant. Community Classi-fication, in Proceedings of the Eighth Symposium on Remote Sensing of Environment,Environmental Research Institute of Michigan, Ann Arbor, Michigan, Vol. II, October . 1972..pp. 1259 -1278.
Nalepka, R.F. and J.P. Morgenstern, Signature Extension Techniques Applied to Multispec-tral Scanner Data. presented at the Eighth Symposium- on Remote Sensing of Environment,.Environmental Research Institute of Michigan, Ann Arbor, Michigan, October 1972.
Nalepka, R.F. and P.D. Hyde, Classifying Unresolved Objects from Simulated Space Data,presented at the Eighth International Symposium on'Remote Sensing of Envfronment,Environmental Research Institute of Michigan, Ann Arbor, Michigan, October 1972.
Poliyn, F.C., Multispectral Survey of Power Plant Thermal Effluents in Lake Michigan, ,4
presented at the Eighth International Symposium on 'Remote Sensing of Environment,.Environmental. Research Institute of Michigan, Ann Arbor,. Michigan... October 1972.
Wezernak, C.T.. and F.C. Polcyn, Eutrophication Assessment Using Remote Sensing Techni- _ques, in the Proceedings of the Eighth International Symposium on Remote Sensing of Envi-
_
ronment, Environmental Research Institute of Michigan, Ann Arbor, Michigan,-0ctober 1972.
Malila, W.A. and T.W. Wagner, Multispectral Remote Sensing of Elements of Water and Radi-ation Balances, in the Proceedings of the Eighth International Symposium. on Remote Sensingof Environment, Environmental Research Institute of Michigan, Ann Arbor, Michigan,October 1972.
^'
Dillman, Rand h.J. Thomson, Weslaco Soils Report, 27 February 1971, Report No.31si50-143-L, Willow Run Laboratories, The University of Michigan, ,Ann Arbor, Michigan,,(now ER?M), September 1972.. - ^
Vincent., k^,.l{., Rock Type Discrimination from Ratio Images of Pisgah:.Crater, California; ^ ,{E.eport 1`^0. 31650-77-T, Willow _Run Laboratories,. Thee University of Michigan, Ann. Arbor, 'Michigan, (tiow ERIIVI), June 1972,`
Poliyn, F.C., Modern Approach to Coastal Zone Survey, Tools for . Coastal Zone ManagementConference, Marine Technology Society, Washington, D.C., February 1972.
Polcyn, F.C. and F.P. Webex•, Remote Sensing. with Optical Mechanical Line Scanners to ^' 'Detect Stress in Forests, presented at the ASP/CS1VI 1971 Convention, Washington, D.C., -March 1972, pLtblished in Photogrammetric Engineering, February 1972,. pp. 163-175..
`;;Wezernak, C.T., Water .Quality in the Role of Remote S^Sn:^xr.^; in Public Planning and Policy !-.^
Formation, Report Tyo. 10408-2-P, Willow Run Laboratories, Th;r 'Qniv^rsity of Michigan, jAnn Arbor, Michigan, (now ERIM), February 1972.
Nalepka, R.F., H.M. Horwitz, P.D. Hyde and J.P. Morgenstern, Classification of Spatially .-_ Unresolved Objects, presented at the Fourth Annual Earth Resources Program I^,eview,
NASA/MSC, Houston, Texas,' published in the Proceedings,:. January 1972: ,-;
.:,:147
_.. ;.:) •:,
G

^.ii
! _..._,,, r .. __ ,^,,^.,_ ^_ -. __. _, .. ,
`II Y ^LL a w.^_ ,. ..... _
i 4f
^ y
^i
'I RIMFORMERLY WILLOW RUN tA80RATORIES, THE UNIVERSITY OF MICHIGAN1
^F^ x
_iA.1 MULTISPECTRAL SCANNER DATA (M5 and M7 Systems) (Continued)
A.1.1 ERIM (Continued)
Nalepka, R.F., J.P. Morgenstern and W.L. Brown, Detailed Interpretation and Analysis ofSelected Corn. Blight Watch Data Set, presented at the Fourth Annual. Earth ResourcesProgram Review, NASA/MSC, Houston, Texas, published in the Proceedings, January 1972.
Nalepka, R.F., H.M. Horwitz. and P.D.-Hyde, Estimating Proportions of Objects from Multi-
!^ spectral Data, Report No. 31650-73-T, Willow Run Laboratories, The University of Michigan,
;^ Ann Arbor, Michigan, (now ERIM), 1972.
Vincent,. R.K., F.J. Thomson and K. Watson, "Recognition of Exposed Quartz Sand and Sand-stone by Two-Channel Infrared Imagery," Journal of Geophysics. Research, Vol, 77, No. 14,
I 1972, PP. 2473-247`!.
Wezernak, C.T. and F.J. Thomson, Barge Dumping of Wastes in the New York Bight, in theProceedings of the Symposium. on Earth Resources Technology Satellite-1, Goddard SpaceFlight Center, Greenbelt, Maryland, September 1972, pp. 142-145.
Malila,. W.A., R.B. Crane and R.E. Turner, Information Extraction Techniques for Multi-slectral Scanner Data, Report No, 31650-74-T, Willow Run Laboratories, The University.. ofMichigan, Ann Arbor, Michigan, (,now ERIM), June 1972.
y
I Erickson, J.D. and F.J. Thomson, Investigations Related to Multispectral Imaging Systems ,,for Earth Resources Surveys, Report No. 31650-17-P, Willow Run Laboratories, The Uni-versty of Michigan, Ann Arbor, Michigan, (now ERIM), September 1971.
Polcyn, F.C., .Water-Depth Measurements by Wave Refraction and Multispectral Techniques,Report No. 31650-31-T, Willow Run Laboratoriesy The University of Michigan, Ann Arbor,Michigan, (now ERIM), August 1971.: •.
Horwitz, H.M., et al., Estimating the Proportions of Objects within a Single ResolutionElement of a Multispectral. Scanner, Report No. 31650-52-Sa, in the Proceedings of the 3
^ Seventh International Symposium on Remote Sensing of Environment, Willow Run Laboratories,The University of Michigan, Ann Arbor, Michigan, June. 1971.
i Nalepka, R.F., H.M. Horwitz and N.S. Thomson, Investigations of Multispectral Sensing ofCrops,. Report,l^To. 31650-30-T, Willow Run Laboratories, The University of Michigan,. Ann
^ Arbor, Michigan, (now' ERIM), May 1971.
^ Polcyn, F.C. and R.S. Stewart, Power Plant Survey Report, Report No. 31347, Willow RunLaboratories, The University of Michigan, Ann Arbor, Michigan, (now ERIM), January 197:1.
Work, E.A., T.W. 'Wagner and W.A.'Malila, Remote Senor Imagery of The University ofMichigan Biological Station, Pellston, Michigan, July 1970, Report No. 123520-1-X, Willow -'-•;:.Run Laboratories, The . University,of Michigan, Ann Arbor, Michigan, (now ERIM), 1971.
Polcyn, F.C., et al., Techniques for Measuring Light Absorption, Scattering,: and Particle", Concentrations-in Water, Willow Run Laboratories, The University of Michigan, Ann Arbor,
Michigan: (now ERIM), 1971.
.148
r .,
_^_._.
,^ .. 3yzz y ,^,

I I I I I_ _-I I ^-^'
;,t"
RUN LABORATORIES, THE U
A.1 MULTISFECTRAL SCANNER DATA (M5 and M7 Systems} {Continued)
A,1.1 ERIM (Continued)
x
Wezernak, C.T, and F.C. Polcyn, "Pollution Surveillance and Data Acquisition Using Multi-i ^ spectral Remote Sensing," Water Resources Bulletin, American Water Resources Associ-
ation, Vol. 6, No. 6, December 1970, pp. 920-934,
^ ^ Polcyn, F.C. and S.R. Stewart, Application of Multispectral Scanning to the Study of Thermal^ Effluents in Lake Michigan, Report No. 33003, Willow Run .Laboratories,: The University of Michi-
Egan, Ann. Arbor, Michigan, (now ERIM), December 1970.
^;
Stewart, S,R„ R. Spellicy and F.C. Polcyn, Analysis of Multispectral Data of the Santa Bar-bara Oil Slick,. Report.No. 3340-4 - F, Willow Run Laboratories, The University of Michigan,Ann Arbor, Michigan, (now ERIM), October 1970,
Wezernak, C.T, and F.C. Polcyn, Multispectral Remote Sensing Study of Industrial Discharges, ^ ,in the Proceedings of the Twenty -Fifth Annual Purdue Industrial Waste Conference, May 1970,Pp. 708-720.
i;
Nalepka, R.F., Investigation of Multispectral Discrimination Techniques, Report No.2264-12-F, Willow Run Laboratories, The University of Michigan, Ann Arbor, Michigan,
', (now ERIM.), January 1970.
Burge, W.G. and W.L. Brown, A Study of Waterfowl Habitat in North Dakota Using RemoteSensing Techniques, Report No', 2771 -7-F, Willow Run Laboratories, The University ofMichigan, Ann. Arbor,. Michigan, (now. ERIM), 1970, 61 pp, { - {
Nelson, H.K., A.T. Klett, and W.R. Burge, Monitoring Migratory Bird Habitat by :Remote {Sensing Methods, in Transactions, N. American Wildlife .and Natural Resources Conference
,I.
35:23-84, 1970.
^4
f Kriegler, F.J.', W.A. Malila, R.F. Nalepka and W: Richardson, Preprocessing Transformations+ and Their Effects on Multispectral Recognition, in the Proceedings of the Sixth :International
Symposium. on Remote Sensing. of Environment, Willow Run Laboratories,. The University of,, Michigan, Ann Arbor, Michigan, (now ERIM), October 1969,
^ Multispectral Program Staff, Investigations of Spectrum -Matching Techniques for Remote`v, Sensing in Agriculture, Report No. 1674-10 - F, Willow Run Laboratories,: The University of^, Michigan, Ann Arbor, Michigan, (now ERIM), September 1968.
;Multispectral Program Staff, Investigations of Spectrum Matching Techniques for RemoteSensing in Agriculture, Interim Report, March 1967 -December 1967, Vol. I, Willow RunLaboratories, The University of Michigan, Ann Arbor, Michigan, (now ERIM), July 1968.
+: Spencer, M.M,, W. Malila, R. Nalepka. and J. Penquite, Investigation of Spectrum MatchingSensing in Agriculture, Vol. II, Appendices and Vol. I, Report No. 6590-9-F(II), Willow RunLaboratories, The University of Michigan, Ann Arbor, Michigan, (now ERIM}, November 1967.'
^.,-
„^-^ ,
^:
^ xf
=r ^^' ^
.
149,. ^I
t_.
}

^ I I I I__ 1 ! _ -^ i__
THE UNIVERSITY OF
A.1 MULTISPECTRAL SCANNER DATA (M5 and M7 Systems) (Continued)
A.1.2 LARS
Hoffer, R,M. and L. Bartolacci, Fishing for Catfish from 5,000 Feet;. or The Utilization ':.of Calibrated Thermal Infrared Scanner Systems for Studying the Impact of ThermalEffluents from Power Plants on Fish. Populations, presented'. at the Fall Convention of theAmerican Society of Photo;rammetry, Washington, D.C., September 1974.
rCorn Blight Watch Experiment, Summary Report, Report No. NASA SP-353,. 1974.
` Woodring, S.M. and T.P. West, Engineering Soils Mapping from Multispectral Remote SensingData Using Computer Assisted Analysis, LARS Information Note 022774, presented at theAnnual Meeting: of the Society of Mining Engineers, Dallas, Texas, February 1974, 24 pp.
McGillem, C.D. and T.E. Riemer, Moire Patterns and Tyro-Dimensional Aliasing in Line ^"Scanner Data. Acquisition Systems, LARS Information Note 1:11772,. in IEEE Transactions onGeoscience i^alectronics, Vol., GE-12, No. 1, January 1974, pp. I-8.
Biehl, L.L. and. L.F. Silva, A Multilevel Multispectrai Data. Set Analysis in the Visible andInfrared Wavelength Regions, LARS Information Note, 082174, Laboratory for Applicationsof Remote Sensing, Purdue University, West Lafayette, Indiana,: 1974, 12 pp.
Landgrebe, D.A,, Machine Processing for Remotely Acquired Data, LARS Information Note031573, Laboratory for Applications of Remote .Sensing, Purdue University, West Lafayette,Indiana, 1974.. (A slightly revised version of this paper will. be published as a chapter inRemote Sensing of .Environment, Addison-Wesley Publishing Co., Reading Massachusetts.)
Lindenlaub, J. and J. Russel, An Introduction to Quantitative Remote Sensing, LARS Informs-tion'Note 110474, Laboratory for Applications. of Remote Sensing, Purdue University,. West aLayfayette, Indiana, 1974, 63.pp.
Stohr, C.J. and. T.R. West, Delineation of Sinkholes Using. Thermal Infrared Imagery, inthe Proceedings of the Third Annual Remote Sensing of Earth Resources Conference, UTSI, ^.1974. _
Kumar, R. and L. Silva, Emission and Reflection from Healthy and Stressed Natural Targetswith Computer Analysis of Spectroradiometric and-Multispectral Scanner Data, LARS In-formation: Note .072473, Laboratory. for .Application of Remote Sensing, Purdue University,West Lafayette, Indiana. Also available as Ph'.D. Thesis and as Technical Report TR-EE73-37, both from the School of Electrical Engineering, December 1973, 427 pp.
Gupta, J.N., R`.L. Kettig,- D.A. Landgrebe and P.A. Wintz, Machine Boundary .Finding and 'Sample Classification-of Remotely Sensed'Data,.LARS Information Note,102073, inProceedings: of the Conference on Machine Processing of Remotely Sensed Data, Purdue`University, West. Lafayette, Indiana; IEEE Catalog No-: 73` CHO 834-2 GE, October 1973, `pp. 4B-25-4B-35.
i Emmert, R.A. and G.D. McGillem, Multitemporal Geometric Distortion Correction Utilizing . -the Affine Transformation, LARS Information Note 101473, in Proceedings of the Conferenceon 'Machine. Processing of Remotely Sensed Data,. Purdue University, West Lafayette,, Indiana;IEEE Catalog No. 73 CHO 834-2 GE, October 1973, pp. iB-24-iB-32.
I _ s,;;,;
150
{ a
A.1 MULTISPECTRAL SCANNER DATA (M5 and M7 . Systems) (Continued)
A.12 LABS (Continued)
.Robertson, T.V., Extraction and Classification of Objects in Multispectral Images.; LABSInformation Note 101873, in Proceedings of the Conference on Machine Processing of Re-motely Sensed Data. Purdue University, West Lafayette, Indiana; IEEE Catalog No.73 CHO 834-2 GE, October 1973, pp. 3B-27-3B-34.
Bartolucci, L.A., R.M. Hoffer and T,R: West, Automatic Data. Processing of RemotelySensed Data for Temperature Mapping of . Surface Water, LARS'Information Note 042373,M,S, Thesis, Purdue University, West. Lafayette. Indiana, August 1973, 143 pp,
Mausel, P. W, and C.J. Johansen, "An Application of Remotely Sensed Data to AgriculturalLand Use Distribution Analysis." LARS Information Note 072673, The Professional. Geo-grapher, Vol. XXV, No. 3, August 1973, pp. 242-247.
Robertson, T.V. and K.S, Fu, Multispectral Image Partitioning, LARS Information Note071373, 96 pp; .also available as a Ph , D. Thesis and Technical Report TR -EE 73-26,Purdue University, West Lafayette, Indiana, August 1973._
Coggeshall, M., R.M. Hoffer and-J. Berkebile, A Comparison :Between Digitized Color InfraredPhotography and Multispectral Scanner Data, Using ADP Techniques, LARS Information Note033174; in Proceedings of the Fourth Biennial Workshop on the Use . of Color IR Photographyin the Plant Sciences, Orono, 'Maine, July 1973, 13 pp,__
Landgrebe, D.A., Analysis. Research for Earth Resource Information. Systems,. Where Do WeStand, LARS Information Note 062273; presented at the Nineteenth Annual . Meeting . of the aAmerican Astronautical Society; Dallas, Texas, June 1973, 27 pp.
LARSXS Users Manual, Vols. I=III, June 1973.
Mikhail, E.M, and J.R. Baker, Geometric Aspects and Digital Analysis of Multispectral(MSS) Data Arrays, LARS Information Note 042473, presented at the American Society ofPhotogrammetry, Spring Convention, Washington, D.C.; March,1973.
:Coggeshall, M.E, and R.M. Hoffer, Basic Forest Cover Mapping Using Digitized RemoteSensor Data and ADP Techniques, LABS Information Note 030573, Laboratory for Applica-tions of Remote Sensing, Purdue University, West Lafayette; Indiana, 1973, 131 pp: ; _
Gupta, J.N. and P.A. Wintz, Closed Boundary Finding Feature. Selection and Classification `'Approach to 1Vlulti-Image Modeling, LARS_Information Note 062773, Laboratory .for Applica-Lions of Remote Sensing, Purdue University, West Lafayette, Indiana, 1973, 31 pp. -',.;
Kettig, R.L. and D.A. Landgrebe, Automatic: Boundary Finding and Sample .. Classification of aRemotely Sensed Multispectral Data, LARS Information N^te 041773, Laboratoryppr Appli-cations of Remote Sensin Purdue Unversit West Lafa ette Indiana 1973 36
Kristof, B.J,, M.F. Baumgardner and C.J, Johansen, Spectral Mapping of Soil Organic Matter,- LARS Information Note 030773, Laboratory- . for Applications of Remote Sensing,_Purdue,
University,. West Lafayette, Indiana, 1973, 15 pp,a
j
l ; ^ 151
^a
t.^ _ v__:

A.1 MULTISPECTRAL SCANNER DATA. (M5 and M7 Systems) (Continued)
A.1.2 LARS (Continued)
Mathews, H.L., R.L. Cunningham, J.E. Cipra and T.R. West, Application of MultispectralRemote Sensing to Soil Survey Research in Southeastern Pennsylvania,. LARS InformationNote 042873; in Proceedings of Soil Science Society of America, 1973.
Sharpies, J.A., The Corn Blight Watch Experiment Economic Implications for Use of RemoteSensing for Collecting Data on Major Crops, LARS Information Dote 110173, Laboratory forApplications of Remote .Sensing, Purdue University, West Lafayette, Indiana, 1973, 11 pp.
Todd, W.J., T.W. Mausel and M.J. Baumgardner, Land Use Monitoring from Computer-Implemented Processing of Airborne Multispectral_Sensor Data, LARS Information Note061873, Laboratory for Applications of Remote Sensing, Purdue University, West Lafayette,.Indiana, 1973, 21 pp.
Anuta, P.E., T.L. Phillips and D.A. Landgrebe, Data Handling and Analysis for the 1971 Corn ,
Blight Watch Experiment, LARS Information Note 080172, presented. at the National Tele-communications Conference, Houston, Texas, December 1972, 16 pp.
MacDonald, R.B., M.E. Bauer ., R.D. Alien, J.W. Clifton and J.D. Erickson, Results of the 1971 'Corn Blight Watch Experiment, LARS Information Note 100272, presented at the EighthInternational. Symposium. on Remote Sensing of Environment, Ann Arbor, Michigan, October1972, 33 Pp. ',
Cipra, J.E., P:H. Swain, J.H. Gill, M.F. Baumgardner and S.J. Khristof, Definition of SpectrallySeparable Classes for Soil Survey Research, LARS Information Note 100372 ; presented atthe Eighth International Symposium. on Remote Sensing of Environment, Ann Arbor, Michigan, 3October 1972, 5 PP•
Jurica, G.M. and W.L. Murray, Influence of Haze Layers Upon Remotely Sensed Surface.. Prop-ertes, LARS Information Note. 060272, presented at the Conference on Atmospheric Radi-ation, -Fort Collins, Colorado, August 1972,. 3 pp.
Hoffer, R.M., ADP of Multispectral Scanner .Data for Land Use Mapping, LARS Information.Note 080372, presented at the Second UNESCO/International Geographic. Union. Symposiumnon Geographical Information Systems, Ottawa, Canada, August 1972, 25 pp.
Stoner, E.R, and M.F. Baumgardner, Multispectral Determination of Vegetative Cover in CornCrop Canopies, LARS Information Note 1110?2, Laboratory :for Applications of RemoteSensing, Purdue University, West Lafayette, Indiana; June 1972, 115 pp. Also available asM.S: Thesis.
Wacker, A.G. and D.A. Landgrebe, Minimum :Distance Classification in Remote Sensing,:.LARS Information Note 030772, presented at the First Symposium for Remote Sensing,Ottawa, Canada, February 1972, 25 pp.
Swain,: P.H. and Staff, Data Processing I Advancements in Machine Analysis of MuitispectralData, LARS Information Note 012472, presented at the Fourth Annual Earth Resources Pro-gram Review, NASA/MSC,-Houston, Texas,. January 1972,;13 pp.
-152
.,i

^ ^. _ .. - ^
RUN
A.1 MULTISPECTRAL SCANNER DATA (M5 and M7 Systems) (Continued)..
A.1.2 LARS (Continued)
West, T, R., Engineering Soils Mapping from Multispectral Imagery Using Automatic Classifi-cation Techniques, LARS Information Note 010772, presented at the Fifty-First AnnualMeeting of the Highway Research Board, Washington, D.C., January 1972.
Anuta, P.E., Analysis of Aircraft Scanner Data Preprocessing Transformations, LARS.Information Note 031752 T-7, Laboratory for Applications of Remote Sensing, Purdue Uni-versity, West Lafayette, Indiana. 1972, 33 pp.
Baumgardner, M.F, and Staff, Differentiating Elements of the Soil-Vegetation Complex,LARS Information Note 012672, Laboratory for Applications of Remote Sensing, PardueUniversity, West Lafayette, Indiana, 1972, 24 pp.
Eisgruber, L.M., The Effect of Subsampling Ratios on Precision of Estimates from RemoteSensing, LARS. Information Note 021072, Laboratory for Applications of Remote Sensing,Purdue University, West Lafayette, Indiana, :197.2, 27 pp.
Emmert; R,A. and C.D. McGillem, Conjugate Point Determinatiha for Multi-Temporal DataOverlay, TARS Information Note 111872.,.. Laboratory for Applications of Remote Sensing,;Purdue University, West Lafayette, Indiana, 1972, 191 pp. Also available as a Ph.D. Thesisand as Technical Report TR-EE 73-5, both from the School of Electrical Engineering.
Hoffer, R.M. and Staff, Land Utilization and Water Resource Inventories over Extended TestSites, LARS Information Note 012772, in the Proceedings of the Fourth Annual_Earth Re-sources Program Review, NASA/MSC, Houston,_Texas, January 1972. 39 pp.
Kristof, S.J. and M.F. Baumgardner, Changes of Multispectral Soils Patterns with Increasing 4
Crop Canopy, .LARS Information Note 102372, Laboratory , for Applications of Remote Sensing,Purdue University West Lafayette Indiana 1972 30 pp.
.;
Landgrebe, D.A., Data Processing II, Advancements in Large-Scale Data ,Processing Systems.-for Remote Sensing, LARS Information Note 012572, Laboratory for Applications of RemoteSensing, Purdue University, West Lafayette, Indiana, 1972; . 30 pp.
Leblanc, P.H.,C.J. Johansen and J.E. Yanner, Land Use Classification Utilizing. Remote rMultispectral Scanner Data and Computer Analysis Techniques, LARS Information Note111672, Laboratory for Applications'of Remote Sensing, Purdue University, West Lafayette, ^.Indiana 1972, 98 pp. Also available as a M.S. Thesis.
a
Silva, L.F. and Staff, Measurements. Program in Remote Sensing at Purdue University,. LARSInformation Note 012872, Laboratory for: Applications of .:Remote. Sensing,. Purdue University, - ^'West Lafayette, Indiana, 1972, 34 pp. __
'Stoner, E.R., M.F.'Baumgardner, P.E. Anuta and J.E. Cipra, Determining Density of Maize ^Canopy III, Temporal Considerations, LARS Information Note 111372, .Laboratory forAppli- ^-:__^. _.___ _w ^_____^_ n -.____ ^__.. ^___ ^.__..___ _..._- .^._ . - r._ ice. ^ •• :. ..w.. n... .. 9

-^-- ! ^ I I I i I-IUNIV ERSITV OF
A.1 MULTISPECTRAL SCANNER DATA (M5 and M7 Systems) (Continued)
A,1.2 LARS (Continued)
Stoner, E.R., M.F, Baumgardner and. J.E. Cipra, Determining Density of Maize Canopy II,Airborne Multispectral Scanner Data, LARS Information Note 111272, Laboratory for Appli-cations. of Remote Sensing, Purdue University, West Lafayete, Indiana, 1972, 16 pp.
Zachary, A.L., J.E. Cipra, R.I. Diderickson, S.J. Kristof and M .F. Baumgardner, SurveyResearch in Indiana, LARS Information Note 110972, presented at the ASA Meeting, .Tucson,Arizona, 1972, 11 pp.
Baumgardner, M.F., Agricultural Applications of Remote Sensing, LARS Information Note100671, Laboratory for Applications of Remote Sensing, Purdue University, West Lafayette,Indiana, 1971, 25 pp. -
Hoffer, R.M., Remote Sensing Potentials for Resource Management, in the Proceedings of theThird International Seminar for Hydrology Professors, Purdue University, West Lafayette,Indiana, July 1971, pp. 211-227. -
Roth, C, and M.F. Baumgardner, Correlation Study with Ground Truth and Multispectral DataEffect of Size of Training Field,. LARS Information. Note 061871, presented at the SeventhInternational Symposium on Remote Sensing of Environment, Ann Arbor, Michigan, May 1971,lO pp.
Ready, P., P.'Wintz, S. Whitsitt and D .A. Landgrebe, Effects. of Compression .and RandomNoise on Multispectral Data, LARS Information Note 061771, presented at the Seventh Inter-national Symposium on Remote Sensing of Environment, Ann. Arbor, Michigan, May 1971,23 pp.
Stoner, E.R. and E. Horvath, The. Effect of Cultural Practice on Multispectral Response fromSurface Soil, LARS Information Note 061671, presented at the Seventh Interational Symposiumon Remote Sensing of Environment, Ann Arbor, .Michigan, May 1971, 5 pp. ,-
jj
Hoffer, R.M., and F,E. Goodrek, Variables in. Automatic Classification over Extended Remote .3Sensing Test Sites, LARS. Information Note. 61571, in the Proceedings of the Seventh Inter-national Symposium on Remote- Sensing; Ann Arbor, Michigan, May 1971,pp. 1967-1981.
_ Kristof, S.J.. and A.L. Zachary, Mapping Soil Types from Multi-Band Scanner Data, LARSInformation Note 061471, presented at the Seventh International Symposium. on Remote -Sens-ing of Environment, Ann Arbor, Michigan,- May 1971, 14 pp.
Bauer,. M.E„ P.E. Anuta, P.H. Swain, R.B. MacDonald and R.P.. MroczynSki, .Detection ofSouthern. Gorn Leaf Blight by Remote Sensing, LARS Information Note 051371,. presented atthe Seventh International Symposium on Remote Sensing of Environment, Ann Arbor, Michi-gan,_May 1971, 20 Pp•'
Lindenlaub, J. and J. Keat, Use of Scan Overlap :Redundancy: to Enhance Multispectral. -AircraftScanner Data, LARS Information Note 120271, Laboratory for Applications of Remote Sensing,Purdue University,. West Lafayette, Indiana, 1971, 24 pp.
154
_a
^^ w ^.^-_. _ . _^ .--_ .A __ 1.^^.

I
._.^.
'^
-t^3
``
RIM ^._
F^ <f
FORMERLY WILLOW RUN LABORATORIES,THE UNIVERSITY OF MICHIGAN
f
f
{' '
A.1 MULTISPECTRAL SCANNER DATA (M5 and M7 Systems) (Continued)
A.1.2 LARS (Continued)
Hoffer, R.M. and L.A. Bartolucci, Remote Sensing Techniques for Measurement of WaterTemperatures, LABS Information Note 111671, in the Proceedings of Indiana Academy ofScience for 1971.
West, T.R., Engineering Soils Mapping in Indiana. by Computer from. Remote Sensing Data,LARS Information Note 111771, in the Proceedings of Indiana Academy of Science for 1971,pp. 210-216.
Lindenlaub, J., Remote Sensing Analysis: A Basic Preparation, LARS Information Note 110471.,Laboratory for Applications of Remote Sensing, Purdue University, West Lafayette, Indiana,1971, 90 pp.
A1-Abbas, H., P. Swain and F.M. Baumgardner,. Remote Sensing Multispectral Radiance Re-sponse Versus Organic Matter and Clay Content of Soils, LARS Information Note 102771,Laboratory for Applications of Remote Sensing, Purdue University, West Lafayette, Indiana,1971., 24 pp.
Ready, P., P. Wintz and D.A. Landgrebe, A Linear Transformation for Data Compression andFeature Selection in Multispectral Imagery, LARS Information Note 0?2071., Laboratory forApplications of Remote Sensing, Purdue. University, West Lafayette, Indiana, 1971, 48 pp.
Landgrebe, D.A., Description and Results of the LARS/GE Data Compression Study, LARSInformation Note 021171, Laboratory for Applications of Remote Sensing, Purdue, Univer-sity, West Lafayette, Indiana, 1971, 32 pp. -
Hoffer, R;M. and F. Goodrick, Geographic. Considerations in Automatic Cover Type Identifica-tion, LARS Information Note 012971, in the Proceedings of Indiana Academy of Science for1970,. Vol. 80, 1971,• 15 pp.
Horvath, E,, O. Montgomery and B. Van Zile, The Effect of Altitude on the MultispectralMapping of Soil Organic Matters, LABS Information Note 012771, in .the Proceedings ofIndiana Academy of Science for 1970, Vol. 80, 1971, 7 pp.
k Atwell, B.H., R.B. MacDonald and L.A. Bartolucci, Thermal Mapping of Streams from AirborneI
Radiometric .Scanning, LARS Information Note 041771, in the Journal of the American WaterResources Association, Vol, 7, No. 2, 1971, pp. 228-242.
Whitsitt, S., Random. Noise in Multispectral Classification, LARS Information Note 102670,Laboratory for Applications of Remote Sensing, Purdue University, West Lafayette Indiana, i.
f
i1970, 31 pp.
MRemote Sen ^' A Look Ahead, LARS Information Note 100570, Laboratory for Applications of ^
^ sing, Purdue University, West Lafayette, Indiana, 1970, 50 pp. `^,;
Anuta, P.E., Spatial Registration of Multispectral: and Multi.-Temporal. Digital Imagery UsingFast Fourier Transform Techniques,. LARS Information Note 052270, in IEEE Transactions 'on Geoscience Electronics, Vol. GE-8(4), 1970, pp. 353-368.
;,Il -
'.t
,
155
7 ^:.

ii
ERIMUNIVERSITY
A.1 MULTISPECTRAL SCANNER DATA (M5 and M7 Systems) (Continued)
A.1.2 LARS (Continued)
Kristof, S.J., .Preliminary Multispectral Studies of Soils, LARS Information Note 043070., inthe Journal of Soil and Water Conservation, Vol. 26, No. 1, 1970, pp. 15-18.
Baumgardner, M.F., S.J. Kristof, ^ ,Johansen and A. Z^cnhary, Effects of Organic Matter onk , Multispectral Properties of Soils, LARS Information Note 030570, in the Proceedings of ''^ Indiana Academy of Science for 1969, Vol. 79, 1970, pp. 41.3-422.'^',` ' Tanguay, M.C., R.M. Hoffer and R.D. Miles, Multispectral Imagery and Automatic Classifica-
tion of Spectral Response for Detailed Engineering Soils Mapping, Joint Highway ResearchProject . Report No. 4, Purdue University and Indiana State Highway Commission, 197.0, 47 pp.
LARS Staff, Remote Multispectral Sensing in Agriculture, (Annual Report), Research BulletinNo. 873, Agricultural Experiment Station and Engineering Experiment Station, Purdue Uni-versity, West Lafayette,. Indiana, Vol. 4, 1970,. 113 pp.
Smedes, H.W., K.L. Pierce, M.C.. Tanguay and R.M. Hoffer, Digital Computer Terrain Map-' ' ping from Multispectral Data, in the Journal of Spacecraft and Rockets, Vol. 7, 1970,
pp. 1025-1031. ,.
Tanguay, M.C. and. R. Miles, Multispectral Data Interpretation for Engineering: Soils Mapping,in the Highway Research Record, No. 319, 1970, pp. 58-77.
Rib, H.T. and R.D.. Miles, Multisensor Analysis for .Soils Mapping, .Special Report 102, inRemote Sensing and. Applications to Highway Engineering,. 1969, pp. 22-37.
Phillips, T.L., Calibration of Scanner Data for Operation Processing Programs at LARS,LARS Information Note 071069, Laboratory for Applications: of Remote Sensing, PurdueUniversity, West Lafayette, Indiana,. 1969, 7 pp.
Wacker, A., A Cluster Approach to Finding Spatial . Boundaries in Multispectral Imagery,LARS Information Note 122969, Laboratory for Applications of Remote Sensing, PurdueUniversity, West Lafayette, Indiana; 1969, 25 pp.
__
j; Tanguay, M.C., Aerial Photography and Multispectral Remote Sensing for Engineering Soils..Mapping, June 1969, 308 pp.
Rib, H.T, and R.D. Miles, Investigations into Automatic Interpretation of Terrain Features,in Photogrammetric Engineering,. Vol. XXXV, No. 2, February 1969, pp. 153-164. '^
Tanguay, M.C., R.M. Hoffer and R.D. Miles, Multispectral Imagery in .the Earth Sciences,__
' 1969,_
Hoffer,. R; M., Biophysical Research at LARS-Purdue, in the Proceedings of Earttf Resources'-.; Aircraft Program Status Review,.NASA/MSC, Houston, Texas, 1968, pp._31-1 to 31: 28 '
i
Hoffer, R.M. and C.J. Johansen, Ecological. Potentials in Spectral Signature Analysis; RemoteSensing. in Ecology, LARS Information Note 011069, Laboratory for Applications of RemoteSensing, Purdue University, West Lafayette, Indiana, 1968, pp. 1-16.
{
" 156.- 4
...
x ^ryry
i
w
.:

ERIMFORMERLY WILLOW RUN LABORATORIES,THE UNIVERSITY OF MICH
i
Swain, P. and D. Germann, On the Application of Man-Machine Computing Systems to Prob-lems of Remote Sensing, LARS Information Note 051368, Laboratory for Applications ofRemote Sensing, Purdue University, West Lafayette, Indiana, 1968, 10 pp.
Hoffer R.M. and D.A.. Landgrebe, Automatic Processing of Multispectral Scanner - Data,presented at the Thirty-Fourth Annual Meeting of the American Society of Photogrammetry,
F,'Washington, D.C., 1968.
^ Baumgardner, M.F., R.M. Hoffer, C.J. Johansen. and C.H. Kozin, Contributions of AutomaticCrop Surveys to Agricultural Development, in Proceedings. of the Fourth Annual Meeting of
,, the American Institute of Aeronautics and Astronautics, AIAA Paper 67-766, 1967, 10 pp. '
'i ,Hoffer, R,M„ Remote Sensing for Agricultural Purposes, 1967. ,
LARS Staff, Remote Multispectral Sensing in Agriculture, (Annual Report), Research Bulletin^, No. 844, Laboratory for Applications of Remote Sensing, Purdue University, West Lafayette,
Indiana, Vol. 3, 1968, 1?6 pp.
LARS Staff, Remote Multispectral Sensing in Agriculture, ( Annual Report),. Research BulletinNo. 832, Laboratory for Applications of Remote Sensing, Purdue. University, West Lafayette,Indiana, Vol. 2, 1967, 75 pp.
^^ ^ Hoffer, R.M., Interpretation of Remote Multispectral Imagery of Agricultural Crops, (Annual -- ^ j
Report), Research Bulletin No. 831, Laboratory for Applications of Remote Sensing, PurdueUniversity, West Lafayette, Indiana, Vol. 1, 1967, 36 pp.
Hoffer, R.M, C.J. Johansen and M.F. Baumgardner, Agricultural Applications of Remote` Multispectral Sensing,. LARS Information Note 010167,. in the Proceedings. of the Indiana.
Academy of Science for 1966, Vol, 76, 1967, 10 pp...:.
i
Hoffer, R.M., R.A. Holmes and J.R. Shay, Vegetative Soil, and Photographic. Factors Affecting ^Tone in Agricultural Remote Multispectral Sensing, in the Proceedings of the Fourth Sym- ,posium on Remote Sensing of Environment, Ann. Arbor, Michigan, 19F6, pp. 115-134.
aHolmes, R.A. and R.M. Hoffer, Remote Multispectral Sensing in Agriculture, Semi-AnnualProgress Report, 1966, 51 pp.
Bartholomew, R.M. and R.M. Hoffer, Investigating the Feasibility of Censusing Deer byRemote Sensing of Thermal Infrared. Radiation, Midwest Wildlife Conference, Chicago,Illinois, 1966, 4 pp.
Rib,, H.T., An Optimum Multisensor Approach for Detailed Engineering Soils Mapping, Ph.D.r Thesis,. Purdue University,. West Lafayette, Indiana, December 1966, 406 pp. ^' j. ,
Hoffer, R.M. and L .D Miller, Potential Applications. of Remote. Multispectral Sensing inAgriculture, presented at the Thirtieth Semi -Annual Convention of the American Society* ref
^^ Photogrammetry, Dayton, Ohio,. 1965, l0 pp._^
;.
^.
157.. ! ?':!
.._ 3
i ^`^`
^ i
A,1 MULTISPECTRAL SCANNER DATA ( M5 and M7 Systems) (Continued)
A.1.2 LARS ( Continued)

J i -- ;f_._ I I I __^
RIMFORMERLY WILL6W RUN LABORATORIES, THE UNIVERSITY OF MICHIGAN
A.1 MULTISPECTRAL SCANNER DATA (M5 and M7 Systems) (Continued)
A.1.3 GOVERNMENT AGENCIES
Overbey, W.K,, et al., Investigation of the Relationships of Lineaments from Remote SensingImagery to Oil and Gas Accumulations in Parts of Greenwood and Butler Counties, Kansas,(tentative title), U.S. Bureau of Mines, West Virginia, in preparation.
Overbey, W.K., et al., Application of Airborne Remote Sensing in Site Selection,Planning andMonitoring of an Underground Coal Gasification Experiment, (tentative title), U.S. Bureau ofMines, West Virginia, in preparation.
Rowan, L.C., Application of Satellites to Geologic Exploration, to appear in future issue of theAmerican Scientist, USDI, Denver, Colorado.
Smedes, H.W., ERTS Images Aid in Land-Use Planning in Yellowstone National Park, Wyoming,Montana and Idaho, to appear in future issue of ERTS-1, A New Window on our Planet, U,S.Geological Survey Prof. Paper 929,-USDI, Denver, Colorado, 400:pp,
Watson, K., Geophysical Aspects of Remote Sensing, in the Proceedings of the InternationalWorkshop on Earth Resources Survey Systems, USDI, Denver, Colorado; Vol. II, 1975,pp. 409--428.
Pohn, H.A, Near-Infrared Reflection Anomalies of Andesite and Basalt in Southern Californiaand Nevada, in Geology, USDY, Denver, Colorado, 1975, pp. 547-550.
a
Watson, K., Geologic Application of Thermal Infrared Images,. in the Proceedings of IEEE,USDI, Denver, Colorado, January 1975, pp. 128-137.
Root, R.R., H.W. Smedes, N.E.: Roller and D. Despain, Color Terrain Map of YellowstoneNational Park, Computer-Derived from. ERTS MSS Data, in the Proceedings of the Ninth.International Symposium on Remote Sensing of Environment, Ann Arbor, Michigan, [USDA,Denver, Colorado] Vol. 2, 1974, pp. 1369-1398.
Weber, F.P., R.C. Aldrich, F.G. Sadowski and F.J.. Thomson, Land.. Use Classification in theSoutheastern Forest Region, in the Proceedings of the Eighth International Symposium onRemote Sensing of Environment, Ann Arbor, Michigan, [USDA, Berkeley,. Calfornia] ,,1973...`
Higer, A.L., A.E. Coker and E.J. Cordes, Some Aspects of Automatic Data ProcessingImagery of-Central and Southern Florida, presented at the First Pan American Symposiumon Remote Sensing, Panama City, Florida, [ USGS, Miami, Florida], 1973.
- Ham, H.H., Remote Sensing of Wet Lands in Irrigated Areas, in the , Proceedings of the.FourthAnnual Earth Resources Program Review, Vol. III, [USDA, Fort Collins, Colorado], 1972.
Driscoll, R.S., Pattern Recognition of Native Plant Communities - Manitou, Colorado Test .Site,in the Proceedings of the Fourth Annual Earth Resources Program Review, Vol,. V, [USDA,:For*.Collins, Colorado], 1972.
Staff of the Remote Sensing Research Work Unit, Monitoring Forest Land from High Altitudeand_from Space, Final,Report for Earth Resources Survey .Program, OSSA/NASA, by the
.Pacific Southwest Forest and Range Experiment Station,.. USDA,._ Berkeley, £alifornia,' 1972,19 2 pp. ,
i'158
_+ _ fi

^', 1
r_----
I
._._.._-,,,-. _^.-... ----.---.---^^
,
1
{ ^
,,..v ..^„z k,-:. ^ r^.^e!^=-_ _.:'e_s^:>3sreas nee... _,^.z^xe...- .,,•^ .x .x.^.a : ^,:., ,..,.... :, . _ _ _ .., _ _.._. - .. _.....^^^;:_ .. ^ ...... . sr._._^
.<...y, "I.._
}}
E^.
-^
RIM,a'
fi
^ ,,
'.
FORMERLY WILLOW RUN LABORATORIES, THE.UNIVERSITYOF MICHIGAN ^ '
;b,;y:^q,
^' A.1 MULTISPECTRAL SCANNER DATA (M5 and M7 Systems) (Continued) ^E
I ^'i; A.1.3 GOVERNMENT AGENCIES (Continued) "^
w NASA^MSC, Earth Observations Aircraft Program, Mission Report, Mission 51M, Test Site^ 175, Houston Area Test. Site, Report No. MSC-07017, Houston, Texas, 1972. (This document.i,
' was produced as a hand paste-up in twelve copies; no copies are available from JSC. Re-G, questor would have to make arrangements to borrow .and. copy the material needed.)
Dorr, J.V.N., et al., The Application of Geochemical, Botanical, Geophysical and Remote
ISensing Mineral Prospecting Techniques to Trophical Areas -State of the Art and NeededResearch, USGS Open .File Report, USES, :Denver, Colorado, 197.1.. ':
Smedes, H.W., Automatic Computer Mapping of Terrain, in the Proceedings of the InternationalWorkshop on .Earth Resources Survey Systems; Vol. 2, [USGS, Denver, .Colorado] .1971, ^°xpp. 345-407.
Driscoll, R.S., Multistage, Multiband, and Sequential Imagery to Identify and QuantifyNonforest Vegetation, Fourth Annual Progress Report, STAR No. N72-28327, USDA, FortCollins, Colorado, 1971, 75 pp.
Watson, R.D, and L.C. Rowan, Automated Geological Mapping Using Rock Reflectances, in theProceedings of the Seventh International Symposium on Remote Sensing of Environment,Environmental Research Institute of Michigan, Ann Arbor, Michigan, [USGS, Denver, .Colorado), •1971, pp. 2043-2052.
1
Nelson, H.K. , et al., Application of Remote Sensing Techniques for Appraising ChangesanWildlife Habitat, in the Proceedings of the International Workshop on Earth Resources Survey:Systems, Vol. III, USDI, North Dakota, 1971.
i:, Heller, R.C. and F.P. Weber, Application of a Multispectral Scanner to Detect .Smog. Injury toForest Vegetation, Final Report for the Environmental-r^rotection Agency, Raleigh, North vCarolina, [.USDA, Berkeley, California] , 1971, 40 pp.
.Heller, R.C., Detection. and Characterization of Stress Symptons in Forest Vegetation, in thet''roceedings of the International Workshop on Earth Resources Survey Systems, Vol. II, tUSDA, Berkeley, California, 1971, pp, 109-150,
L.X
_^
Crosby, O.A., Thermal Study of the Missouri River in North Dakota Using Infrared Imagery, ':f
r°
^^USGS Open File Report, USGS, North Dakota, 1971,
Higer, A.L., N.S. Thomson,;F.J. Thomson and M.C. Kolipinski, Applications of MultispectralRemote Sensing Techniques to Hydrobiological Investigations in Everglades National Park,USGS, Miami,. Florida, 1970.
Kolipinski, M.C, and A.L. Higer, Detection and Identification of Benthic Communities andShoreline Features in Biscayne Bay Using Multiband Imagery, in the. Proceedings of theThird Annual Earth. Resources Review, Vol. III, USGS, Miami, Florida, 1970.
i
Heller,. R.G., R.C. Aldrich, W.F. McCambridge and F.P, ti%^ber, The Use of MultispectralSensing Techniques to Detect Ponderosa Pine. Trees Under Suess from Insects or Diseases,Annual Progress Report for Earth Resources Survey.Program, USDA, Berkeley,-California,.1970, 50 pp. _ -
% .-i
159
r
1^^ ^
_ _
:.^ _
}t^
^ '' _ .._
..

^ _ i _ _ n^
L -FORMERLY. WILLOW RUN LABORATORIES, THE UNIVERSITY OF MICHI
A.1 MULTISPECTRAL SCANNER DATA (M5 and M7 Systems) (Continued).
A.1.3 GOVERNMENT AGENCIES. (Continued)iI
Weber, F.P. and J.F. Wear, The Development of Spectro-Signature Indicators of RootDisease Impacts on Forest. Stands,, Annual Progress Report for Earth Resources SurveyProgram, USDA, Berkeley, California, 1970, 46 pp.
^^ Heller, R.C., Remote Detection of Insect Epidemics in Conifers, in the Proceedings of the^;
Third Annual Earth. Resources Program Review, Vol. II, USDA Berkeley, California,. 1970,pp, 34-36.
^? Smedes, H. W., K.L. Pierce, M.G. Tanguay and R.M. Hoffer, Digital Computer TerrainMapping from Multispectral Data, and Evaluation of Proposed ERTS Data Channel, Yellow-stone National Park, USGS Open File Report, USGS, Denver, Colorado, 1970, 43 pp.
White, D.E., Calibration of Geothermal Infrared Anomalies of Low Intensity in Terms ofHeat Flow, Yellowstone National Park, presented at the Spring Meeting 1969,. Washington,D.C., [USGS, Berkeley, California] , 1969.
Weber, F.P., Remote Sensing T3nplications of Water Deficit and Energy Relationships forPonderosa Pine Attacked by Bark Beetles and Associated Disease Organisms, Ph.D. Thesis,University of Michigan, Ann Arbor, :Michigan, [USDA, Berkeley,. California] , 1969, 143 pp.
Weber, F.P., Multispectral Imagery for Species Identification, Annual Progress Report for.Natural .Resources Program, USDA, Berkeley, California, 1966, 37 pp. y }
i_i
,,
i
1160
r >`:
Y

_ l- 1
f RIM_ FORMERLY WILLOW FUN LABORATORIES, THE UNIY ERSITY OF MICHIGAN
S
.
A.1 MULTISPECTRAL SCANNER DATA (M5 and M7 Systems) (Continued),.k
;
A.1.4 MISCELLANEOUS_i
Lewis, J., S. Outcalt and R. Pease, Urban Terrain Climatology and Remote Sensing, a CoupledModeling-Experimental Analysis, Annals of the Association of American .Geographers, inpreparation. [University of California, Riverside, California.] . x
Lewis, J., S. Outcalt and R. Pease, Urban Surface Thermal Response Associated with Land Use,Science or Journal of Applied Meteorology, in preparation. [University of California, River-side, California]. a
Pease, R. and D. Nlchois, Net Radiation and Other Energy-Related .Maps from Remotely SensedImagery, in Procedings of the American. Society of Phbtogrammetry, .Forty-First Annual ^'
' Meeting, Washington, D.C., pp. 322-333, 1975. [University of California, - Riverside,
iCalifornia ] . i
,pease, ft, and D. Nichols, Net Radiation and Other Synoptic Energy-Related Maps from Re- ^
motely Sensed Imagery, in Yearbook of the Association of Pacific Coast. Geographers, 1974.
Pearcy, W.G. and D.F. Keene, Remote Sensing of Water Color and_ Sea: Surface TemperatureOff the Ore on Coast Limnolo and Oceano rah Vol. 19 573-583 1974. Ore ong gY g p _ Y, , pp • ^ [ gState University, Corvallis, Oregon]. a
1Enslin, W.R., et al, The Use of Color Infrared Photography for Wetlands Mapping, with Special ^^..Reference to Shoreline and Waterfowl Habitat Assessment, Michigan State University, East
Lansing, Michigan, 1973.Pearcy, W.G., Remote Sensing and the Pelagic Fisheries Environment: of Oregon, in Proceed-
ings, Remote Sensing in Marine Biology and Fisheries Resources, Texas A & M, pp. 158-1?1,1971 [Oregon State University, .Corvallis, Oregon).
Pearcy, W.G. and J.L. Mueller, Upwelling, Columbia River Plume and Albacore Tuna, inProceedings, Sixth International Remote Sensing Environment Symposium, pp. 1.101-11.13,
,, ; Oregon State University, .Corvallis, Oregon, 1970. '..r
t
;. -.
a
3
i..
' ^'
'",
-.
:.._^
3
.^ q
7
c ^.
:3.
_ ':--
F
^.
^' ti
^{ fii
.\
.^ \
l i ; ;k4
E .161^;
t t{>_^.
S,'. ^,
^k
ft

J _I I___ I I I . I I I
RIMFORMERLY WILLOW RUN LABORATORIES, THE UNIVERSITY OF MICHIGAN
A,2 THERMAL SCANNER DATA (M1A1 System)
Williams, R.S.., Jr,, et al., Environmental Studies of Iceland with ERTS-1 Imagery, in theProceedings of the Ninth InkernationaL Symposium on Remote Sensing of Environment,Environmental Research Institute of Michigan, Ann .Arbor, Michigan, April 1974.
Williams, R.S„ Jr., and S. Thorarinsson, ERTS-1 Image of _the Vatnajokull Area: GeneralComments, in Jukull, Vol, 23, 1973, pp. 1-6.
Williams, R.S., Jr., S.Thorarinsson and K. Saemundsson, ERTS-1 Image of Vatnajokull;.Analysis of Glaciological, Structural and Volcanic Features, in_Jokull, Vol. 23, 1973,. pp, 7-17.
Williams, R. S,, Jr., A. Bodvarsson, S, Fridriksson, G. Palmason, S: Rist, H. Sigtryggsson,S. Thorarinsson and I. Thorsteinsson, Satellite Geological and Geophysical Remote Sensing -of Iceland: Preliminary .Results from Analysis of MSS Imagery, in the Proceedings of theSymposium on Sigificant Results Obtained from the Earth Resources Technology Satellite-1,Vol. I: Technical Presentations Section A, NASA No. SP-327, USGS, Washington, D, C,,March 1973.
Williams,. R.S.,Jr., Coastal and Submarine Features on MSS Imagery of Southeastern Massachu-setts: Comparison with Conventional Maps, in the Proceedings of the Symposium on SignificantResults Obtained from the: Earth Resources Technology Satehite-1, Vol L Technical Pre-sentations Section B, NASA No. SP-327., USGS, Washington, I).C., Mar.ch 1973.
Friedman, J.D.; R.S. Williams, Jr., S, Thorarinsson and G. Palmason, Infrared Emissionfrom Kverkfjoll Subglacial Volcanic and Geothermal Area, Iceland, in Jokull, Vol. 22, 1972,pp. 27-43.
Williams, R.S.,Jr., Terrestrial Remote .Sensing: Applications. of Thermal Infraxed Scannersto the Geological Sciences, in Part 3, ISA Transducer. Compendium, Instrument Society ofAmerica, Pittsburgh, Pennsylvania, 197;2, pp: 219-236._
Del. Bono, !G.L., R.S. Williams, Jr. .and J,F, Cronin, Photogeologic and Thermal InfraredImagery Geologic Surveys in Italy in 1966, in Bollettino del Servizio Geologico D'Italia,Vol, XCI (1970), 1971, pp. 3-44,
Friedmann J.D,, C,E, Johansen, N: Oskarsson, H. Svensson, S. Thorarinsson and R.S.Williams, Jr., Observations on Icelandic Polygon Surfaces. and Palsa Areas, Photo Inter-pretation and Field Studies; in Geografiska Annaler, Vol, 53, Ser. A(3-4), `1971, pp, 115-145.
Palmason, G., J.D. Friedman, R.S. Williams, Jr., J. Jonsson and K. Saemundsson, AerialInfrared.-Surveys of Reykjanes and Torfajokull Thermal Areas, `Iceland, with a .Section onCost of Exploration Surveys, in Geothermics (1970), Special Issue 2, U.N. Symposium on
..the Development . and Utilization of Geothermal Resources, Pisa 1970, :Vol.. 2, Pt. 1, 1971, -pp. 399-412. _ ^,q
Cronin, J.F., R.S. Williams, Jr, and J.B. Adams, Geologic Sensor Studies in the West Indies(abs.), inTrans. Fifth Caribbean Geol. Conf. (1968), Geol, Bulletin No. 5, Queens CollegePxess, New York, 1971, p. 251.
Williams;;R.$,,Jr., Thermographic Mosaic of Yellowstone National Park (abs.), in -Photogrammetric Engineering, Vol.: 37, No. 5,.1971, p, 498. -
'' William, R,S., Jr., and. d,D. Friedman, Satellite Observation of Effusive Volcanism, British', Interplanetary Society Journal, Vol. 23, No, 6, 1970, pp,-441-450.
162.

RIMFORMERLY WILLOW RUN-LABORATORIES,7HE LNIV ERSITYOF MICHIGAN
Friedman, J.S. and R.S. Williams,. Jr., Comparison. of 1968 and 1966 Infrared Imagery of Surtseyin Surtsey Research Progress Report, The Surtsey Research Society Reykjavik, Iceland,Vol ,. . V, 1970, pp. 88-92.
Friedman, J.S. and R.S. Williams, Jr., Changing Patterns of Thermal Emission from Surtsey,' Iceland, Between 1966 and 1969, in Geological Survey Research 1970, U,S. Geological Survey
Prof. Paper 700D, USGS, Washington, D.C., 19 %`0, pp. D116-D124
Stringham, J.A. and R.S. Williams,. Jr., Applications of Reconnaissance Concepts to MappingProblems, in Proc. of the Geodetic and Research apd Development Symposium, SeventhDOD Geodetic-Cartographic-Target Materials Conference, Cameron Station, Virginia, 197:0,PP . 37-105.
Friedman, J.D., R.S. Williams, Jr,, and S. Thorarinsson, Thermal Emission from HeklaVolcano, Iceland, Before Eruption of 5 May 1970 (abs.), in Geological Society of America 3Abstracts with Programs, 1970 Annual Meetings, Milwaukee, Wisconsin, 1970,. p, 555. ^
Friedman, J.D., R.S. Williams, Jr,, and D.C. Parker, Infrared Emission from Hekla Volcano '
Iin Abstracts 50th Annual Meeting, American Geophys, Union, Trans. Amer. Geophys. Union,Voll 50, No. 4, ].969, p. 340, ,^
Friedman, J,D., R.S. Williams, Jr., and G. Palmason, Infrared. Emission from Kverkfjoll Sub-glacial Volcano, Iceland, in Volume of Abstracts, Symposium on Volcanoes and Their Roots,International Association of Volcanology and .Chemistry of the Earth's Interior,. Oxford,
(` England (addendum, 1 p,), 1969.
!^ Friedman, J.D., R.S. Williams, Jr., G• and C.D. lyIill r' Infrared Surveys in Iceland
m 1966 m Geolo cal Surve ResearcPalmasoni h 1969'- U.S. Geol, Surve, ' gi y y Prof, Paper 650=C, USGS,5
-
aWashington, D.C., 1969, pP. C89-C105..
Merifield, P.M., J.F. Cronin, L.L. Foshee, S.J, Gawarecki, J.T. Neal, R.E. Stevenson, R.O.Stone and R.S. Williams, Jr., Satellite Imagery of the Earth, Photogrammetric Engineering,Vol. 35, No. 7, 1969, pp. 654.-688.
IWilliams, R.S., Jr., Degradation of .Infrared Caused by Condensation, in Photogrammetric ^ ' ^
t
Engineering, Vol. 35, No. 1, pp, 72-78, 1969., ef Friedman, J.D. and R.S. Williams,. Jr,, Remot of Active Geologic Processes {abs.),
m Summaries. of Fifth S m osium'of Remote Sens nng
y p g of Environment, The University ofMichigan, Ann Arbor, Michigan, 1968,. pp. 82-84. ',
,; Friedman, J.D.. and R.S. Williams, Jr. Infrared Sensing'of Active Geologic Processes, in' Proceedings of Fifth Symposium on Remote Sensing of Environment, The University of ^ '
Michigan, Ann Arbor, Michigan, 1968,. pp. 787-820,Williams, R.S., Jr,, Geology; Earth Sciences Profile, .Series No. 5; Earth Sciences Tech-
._nologies dissociation, 1968, 8 p. _ . __
`` Williams, 3:x.5., Jr•, J.D.. Friedman, S. Thorarrisson, Th. Sgurgersson and G. Palmason,Analysis of 1966 Infrared Survey of Surtsey, Iceland, in Surtsey Research Progress Report,The Surtsey Research Society, Reykjavik, Iceland, Vol, IV, 1968, pp. 177-192._
i ' Williams, R.S., Jr,, and R.W. Fenn, Degradation of Imagery from Optical-Mechanical $canners;', Moisture Condensation on Optics, AFCRL Env. Res. Paper No 269, AFCRL-6?-0398, AFCRL,
Bedford Massachusetts,. 1967, 18 p. t.,^,i Williams,. R.S., Jr., J.D.. Friedman, S. Thorarnsson, Th. Sigurgiersson and G. Palmason, ;.
'. Analysis of 1966 Infrared Imagery of Surtsey, Iceland. (abs.) ,in Program and Abstracts ofPapers, Vol. VIII, Intl. Assoc. of Volcanology, XIVth Gen. Assembly of Intl. Union of Geodesy
^' -and Geophysics, .Zurich,: Switzerland, 1967, p. 6Lr'',:
r
F ? ^
^
163
^
t.
^^
t1 Ji
I4
._

........
^.^
,-
ERIM€. ^---- FOFMERLY WILLQN
A.2 THERMAL SCANNER DATA (M1A1 System)
Friedman, J.D., R.S. Williams, C.D. Miller and G. Palmason, Infrared Surveys in Iceland in1966 (abs.), in Program of 48th Annual Meeting, .American Geophys.-Union Trans. Amer.Geophys. Union, Vol. 48, No. 1, pp. 238-229, and'in Surtsey Research Progress Report, TheSurtsey Research Society, Reykjavik, Iceland,. Vol. III, 1967, pp. 99-103.
Williams, R.S., Jr., Conventional Photography (with J.T. Neal ,) and Thermal Infrared Imagery,.in Remote Sensing: of the Geological Environment, Terrestrial Sciences Lab.. Special Report,

_L__I i I __1 I I^I
AEI
A.3 'SIDE LOOKING AIRBORNE RADAR DATA (X- and L-Band System)
Bryan,. M.L., The Interpretation of an Urban Scene Using Multi-Channel Radar Imagery,Remote Sensing of Environment, in press.
Bryan, M.L. and R .W. Larson, The Study of Fresh Water Lake Ice Using Multiplexed ImagingRadar, Journal of Glaciology, in press. Presented at International Glaciological Society,
^ Symposium on Remote Sensing in Glaciology, Cambridge,. England, September 1974.
^, Shuchman, R.A., R.F. Rawson and B. Drake, A Dual Frequency and Dual Polarization :SyntheticAperture Radar System and Experiments in Agricultural Assessment, presented. at NAECON?5 Radar Conference at Dayton, Ohio, June 1975.
Bryan, M,L. and R .W: Larson, Classification of Fresh Water Ice Using Multispectral RadarImages, in Proceedings, IEEE International Radar Conference, Alexandria, Virginia, April '1975.
Bryan, M,L., A Needed Form of Geographical Analysis for Remotely Sensed Data, presentedat Association of American Geographers 1975 Convention at Milwaukee, Wisconsin, April1975.
'` Shuchman, R.A., C. Davis and P. Jackson, SAR Detection and Identification of Strip Mines, Fpresented at IEEE International Radar Conference, Washington, U.C:, April 1975. ^;
Bryan, M.L., Application of ERTS 1 and Multiplexed SLAR, Imagery for- the Study of FloodedShorelines, in Proceedings, Fourth Remote Sensing of Earth Resources Conference, University :^;of Tennessee Space Institute, Tullahoma, Tennessee, March 1975.
JRe ort No. 08500 14 ^F Environment l ucRhman and C. Davis, Remote Sensing of .Strip Mines,
p , search Institute of Michigan, Ann Arbor, Michi-gan, 1975. F
Bryan, M,L., A Comparison of ERTS 1 and SLAR Data for the Study of Surface Water . Resources,Report No. 193300-59 -F, Environmental Research Institute of Michigan, Ann .Arbor, Michigan, ;:.January 1975. ,^ 3
Shuchman, R.A., C. Davis and P. Jackson, Contour Scrip Mine Detection and Identification With.Imaging Radar, presented at Annual Meeting of the Association of Engineering Geologists,Denver, Colorado, October 1974. _ - ^^
Liskow, C,, et al, Simultaneous Dual Band Radar Development, Repart No. 195100 - 1-F, En-vironmental Research Institute of Michigan, Arin Arbor,. Michigan, September 1974.
DAk
li ation of Airborne ma . 'nr Radars •L & X Band L. Liskow and R.A. Rendleman, The s
pp gig ( } to Earth Resources ' .Problems, ReportNo. 104000 - 1-F, Environmental Research .Institute of'Michigan, Ann. Arbor, Michigan,May 1974.
^ Drake, B, and R. Shuchman, Feasibility of Using Multiplex , SLAR Imagery For Water ResourceManagement and Mapping Vegetation Communities, in', Proceedings, Ninth. International Sym-possum. on Remote Sensing of Environment, :Environmental Research Institute of Michigan, AnneArbor, Michigan, April .1974 and presented at Tri -Service Radar Symposium, West Point,New York, July 1974. _ ,;
.Bryan, M.L. and R.W. Larson, Interpretation of .SLAR Imagery of Ice in Whitefish Bay,. Michi- f;gan, presented at 17th Annual Conference on Great Lakes Research, Hamilton, Ontario,.
.....August 1974. ..^ t:.
_Bryan, M,L., Extraction. of Urban -Land Use Data - From Multiple . Synthetic _ Aperture Radar ^^n.Imagery., in Proceedings, Ninth International Symposium on Remote Sensing of Environment,Environmental .Research Institute of Michigan, Ann Arbor,. Michigan, April 1974,
:,
^;165.
,;
Y^
..
x
^]^^...
i:.^_..
. j .

RIMFORMERLY WILLOW RUN LABORATORIES, THE UNIVERSITY OF MICHIGAN
A.3 SIDE LOOKING AIRBORNE RADAR DATA (X- and L-Band Systems) (Continued)
Rendleman, R., E.B. Champagne, J,E. Ferris, C.L. Liskow, J.M. Marks and R.J. SalmerMultifrequency Fine Resolution Imaging Radar Instrumentation and Data Acquisition, ReportNo. 198200-1-F, Environmental Research Institute of Michigan, Ann Arbor, Michigan,February 1974.
a
Bryan, M.L.; 'Radar Remote Sensing for Geosciences; An Annotated and Tutorial Bibliography,. 'Report No. 193500-1-B, ,Environmental Research Institute of Michigan, Ann Arbor, Michigan,December 1973.
Raney, R.K., et al, The Application of Remote Sensing. Technology to Local Environmental 9
Michi n Ann Arbor Mi h^i an October 1973.^ Environmental Research Institute ofPlannigaa and Public Polic
g e 'ort No. 193500-3-P
^; Bryan, M.L., Multifrequency Simultaneous Radar Imagery, Report. No. 193300-26-X, Environ-mental Research Institute of Michigan, Ann Arbor, Michigan, September: 1973.
7
Bryan, M.L., Fresh Water Ice. Interpretation from ERTS 1 Imagery,. Report No. 193300-24-L,Environmental Research Institute of Michigan, Ann Arbor, Michigan, 1973.
Wagner, T., R. Vincent, B. Drake, R. Mitchel and P. Jackson, Tunnel-Site Selection by RemoteSensing Techniques, Report No. 10,018-13-F, Willow Run Laboratories, The University of
I Michigan, Ann Arbor, Michigan (now ERIM), August 1972. -
t Larrowe, B.T., R.B. Innes, R.A. Rendleman and L.J. 'Porcello, Fine Resolution Radar Investi-i
gation of Great Lakes Ice Cover.,. Report No. 1900-1-F, Willow Run Laboratories, The Univer-sity of Michigan, Ann Arbor,:,: Michigan (now ERIM), Sepkember 1970.
Rendleman, R., Radar Data Collection Mission, Addendum to Final. Report, Report No. 3261-1-F,Willow Run Laboratories, The University of Michigan, Ann Arbor, Michigan (now ERIM),June 1970.
Rendleman, R., Radar Data Collection Mission, Final Report, Report No: 3261-1-F, Willow RunLaboratories, The University of Michigan, Ann .Arbor, Michigan (now ERIM), December 1969.-
,,
ii
`166.
s
.'^

. _ ,
...a.. _.-:._ .
}
s
/ `n'm aLLL^^^^^ FORMERLY WILLOW RUN lA80RATORIES, THEUNIVERSITY OF MICHIGAN
^]Sx^
Appendix Bs P
GEOGRAPHIC REFERENCE SYSTEM. `^
The DMS geographic reference system, which indicates the general geographic. zone inwhich data were collected, is similar to the World Geographic Reference System (GEOREF)described in Air Force Manual 51-40, Vol. I, Air Navigation, pages 3-34 through 3-38 and. theNASA Earth Resources Research Data Facility World Geographic Reference system describedin their Index, MSC-02576, July 1970, pages viii through xxvii,
The GEOREF is based on the normal geographic longitude and latitude projection lines of
any specific chart, and defines a unit of geographic area in which a specific point lies. Thea'
i GEOREF divides the earth's surface into 15°quadrangles of longitude and latitude with the..
j point of origin at the 180th meridian and the South Pole (see Earth Zone Map, Figure B-1).' The divisions extend eastward 360° from the 180th meridian, with each component zone of
these divisions identified by a letter from A through Z, omitting l and O; and northward 180°
from the South Pole with the zones lettered A through M, omitting I, This combination divides
j the earth ' s surface into 288 basic 15° quadrangles, each having two letters identifying the zone^ _ of longitude and latitude. '
Each such 15° quadrangle (see GEOREF 15°- square sample quadrangle, Figure -B-2) isfurther divided into 15 lettered 1° units eastward and 15 lettered 1° units northward,. These1° quadrangles are lettered from A through Q, omitting I and 0. Quadrangles covering areas
within. the United States are shown in the United States Zone Map (Figure B-3),
The initial letter indicates the approximate. longitude and. the second letter indicates. theapproximate latitude. For example,. the zone designated "GJ" indicates that the ,general geo-graphic area for a given data type is located in the eastern half of the United States. If morethan'one zone is overflown, each. zone is listed.
As an example, within a 1°-square quadrangle,. the geographical location of Site 002(Pisgah. Crater, California), the coordinates of which are 116°16' to 116°34' W. longitude and34°35' to 34°50' N, latitude is completely described by the four letters EJDE, and can be lo-cated as follows:
(1) On the Earth. Zone Map, locate the 15° quadrangle "EJ" by reading right to "E" andup to „J.,,
(2) On,the GEOREF 15° .Square Sample Quadrangle , locate the 1° quadrangle "DE" with- the sample "EJ" 15° quadrange by reading right . to "D" and up to "E,"
^''Site numbers have been arbitrarily assigned by NASA for areas which have been overflown
and are: indicated by ,a three-digit code, For the convenience of users, numbers covering, test
167

^...... _,I FORMERLY "W ILLOW^RUN LAB0RATOpIES, THE UNIVERSITY OF MICHIGAN^^ ..^i '.
'i',; _ ^.
sites located within the United States are shown. on a United States Test Site Map (Figure-B-4 ).Where appropriate these test site numbers are attached to the four letter geographic referencecode. For example, Pisgah Crater, California would be located as EJDE002. A list of site

^^---
—
r
i
1
r
'
^iiiOi0 091
^^
^._
1---
----
-^ --
--
—..-
-s+
--
._
-^^
—^
----
---
—
-
- I
^t
_____—
-
MQ0OZYa^Q^+Wz
zNx
^^
M.
W..ntWo
wVmaax3
RIMFO
RM
EI•LV WILLO
W IIU
N IAfO
RATO
RiE S. TM
[ UN
ty Ewf Ar O
F MtC
NtG
AN
W
^
.^
j
-^I
p^►
W
O
V
cG
6^30PlO00O•0H3O0NW^
8^
^X69
OP

BRIMF ORMERIT WI^IOW RUN LIMBO R^TORIE S. THE UN1^^ 4 ♦f ITY OF MICHIGAN
105° ^
45
P
N
^1
L
K
J
x J
G
F
DE
E
D
L
f3
30°
A 30°A B C D E F G H J K L M N P Q
120° 105°
E
FIGURE B-2. GEOREF 15° SQUARE SAMPLE EJ QUADRANGLE
° 120 °
4^ r
170 '

l r''^ J^_^3
^.
J
J
H
n ^ F ^ ^ G ^ HF ^ ^
'or n yw
\\
T 1 V
~ r\ / ' ^ , `rO^rw O^^Or ♦w^
O r 'rrrrM fO ♦ ^ ^ y\rO^yO ^ ^ rr
lO^rw O^^Or• 0'f ^'r^\\^O t
_ I 1 •'.^
b.. wr\.(^"'••o. i1 o.a 7'
'. wry, _ __ _ •roa ^ •ro••r^ f^/' 1!0 ^1r
^/^ .a 1/ 7(^ y .YI• \ (Or O\ DO 1 ^^ w 1Y^G^M\I
•^w ^ f / V^41r•^
\ _ _^ _ _ ^w(w^• ^
f__f
(
^ ^ y
..,ro,,. I o.,.wor. ^ ^\T 1— ^ ^
,\\moo(
1
r(.., ^ '^- --
r(O\'O^l
Y-
• ^ r•Y• _r
w t ^ t r'
kr O -_'_li
^ ^
^ (^+ V ^ ww. rYYO\ ^ ... w
^t-- A _ -^—_ ^ ^_
FIGURE B-3. U.S. ZONE MAP
• ^ ^ . (.^_ ,

^^'
I
x
V
b
^M `
C=7
vN
r rr rrrrrrrrrrr ..•r r•r.rrrr ^r rrw• rr rwr r.•n•n• rn• .rrr
r r r m• m- m• m• m rrr r• - + r - 1^,,^/_^-^
IS6 ` ^ ^ QONgM^
^^4 1^7^ _. \16 l.f ^ `
^ , - ,
^ - eaairaea^ ^ ♦2 ^I ^-^ ^^,^`
i ^ f a `^ ^ ^ .. ^ _ ^ souTe o.am. ^^ ♦, 2 ^,2• =29^ aMS' was - !^ .^•s6 - SS!t .^s,
'^2^5`_ ,2^♦ 2
^ ^ ^ 2^^ f 11S ^ ^
^ ^^ 10 ./' ^^ - ^, — ---J ^ -tea- 4 2S0 _ ^!. _ - io^^
6 ♦y ^ ;_^^_ 1-_ 1 IIJf• - - • - L '- - - 20a• ;♦^ ^ o,«e _ '-\f 1 ^ w•
-l. - Al fM. w^
9 _ _ T ^N '- ^' -"2 7 7 -^ ^ es . ^'^
`• f J I. 73 ^ S ^ `O1-^lli• ____ _ _._, 07- 27 "". J ^ w.. _1• 76 - 2522. 227 1^^ ^ ^ ^ r
j I 247 ^ i - ^ - - _ n«.uca.1
r{I 251 ^?6^= ^l 1 71 2^ ^ ^ _ ^ ^ 2M ._ ^«y, w•►l^ ^'S, s,
ro^ ^ 7i ^- ^ N ^^ ^B'
' ^ ?^s 20^ ` 0 ^s+aaKO - - •._ - 1^ ♦i' -_' ^I • a.«ia '- 20^asou ^' - '•
/. = 10 ZS ?16b ^ -22 - ' 100 ^ 0 ^O o.o^ ^ •^ ~
- 241 Z7ar^^ +- ( ^ _*ter ' w'
• ^1^. CIS 11^ j.- 28
,^S^^ ^^ ^ 1 .t -
7 6^ Y 1 262^Z1^ 1^ •I a~ 2^7
^ -20 2 • cr" 165 • 10 OS ^
- w.
`•m•rrw}
- 1 2121---i-- 2f '1'J i -
^^^ ^
mf7 2 9 I i9{ `^ yC t^r m- r
f ^` - 1.... -^ '^.._ ....,. 2•
1i2 ,
_ tf7 _ ^^
^^1^ 1 ^. ^ 10 10♦ _ - JIw- 1 2S7 0 _ - -• 1 S ^ ^ 1
- ^ _j ^ •: ..^1- I - -- '-17 _ ^^f
_ ♦ 101-`'1-+ .-
,^ .. ^fti. _ ^9`t r © -----T--, i0^ 16S •217 ^,
,.
' ^ . 1 {'-F ^r _..+.^L.^-.^M ^f °• r r r r r r v'..+—! ` •, , 1. ^ r
rrr r • w r r r r r tr - _ _ _-^-''"F
- r r m• r• «.. r .► r r r r r r r 1.11 n•
FIGURE B-4. USA TEST. SITES
,^

_:^a
° ^''
.^i:.b
. _..
..._
___..
_
^ _ _
-
_ -
^..
_ .
..rte
.
ef^: .e .
_ ee.,see.eesOeee
_ _ ____ __ __
e.o .
O^!
r. J
^ r
^. -
O O
a r
s J
^ r
^. -
o ^
O s
r p
V 1 u rr - O r D r N V
► ^/ w- O r > r a V> u«^ O K a -^ N M D u w - o• ^ r o J
♦ u w
- O
< s
r s
J^ u
«-
^eee^^« « a^^^^^eePe^c^^ece^el"Peeeeeee ;^^ ^ ^ e z^^^^^^e^^eece Pi sec a ejee ^P CL^^__^^CP.i ^
m n n mr
n: Koh<c^^3 Nz^ooN^2>$.nzs •nangnNONlon!!-.°tNN$Nn-y^7mm^r.
RmN-^r NsaKnNN
>r^n .n ^
^^ >sR.sa^a^^^^^R,^Z_ >
^°-
> , z- ,^ > > _>^^_^^R-
>n >7
T DSO-^->o!_b_ ^:^.os
N a_
o^h^a
zv.N°^^^^^s^tox mr e^^ >lsz<z7->$-n^JTn ^n zw^
Tz >nssv^r^6zra<zs.
Z Z3 15ZRCTrr-
rxr>T^ zC>rs^
2 a
,^!
c v6 2
0-N
J!
^ -
-r>
rfex210 T
- K
r n2»S
n^^..D
DT
ZnO
^^
N"
s^
_^ t
iOC
t^R
C T
2H
-Z^-<
K^^N
-iN
-^I^
!90N
'^^^
°F
Rdn +
7^
>-m
AN
>$7
n1.1
1('I
P72
10-)
tJ!1
-CC
TN
.r<
^^>
-1m
-119 =
y^^-^
Z?1^O
Z^O
°rD
R
J1A
^2N
_^ r
(^r+
>bo
Tz
♦ 7
c p
)^S
->
"^Z
-zC
mn >
i D
=^
N-N
ND
-S^-
>P
I-R
. ..
n>
- T
C J
y-r
C1 Z
-C'L
°N
T^Z
>2 h
1 >
N^^>
m+
1C
Z7is
zY
^>
VnZ
^zzfx
r^-
^ z
^x--
T r
7S
^<
7 N
6nZ
-^
m r
-- >
^ s
z
,'^'>
^^>
y^
xF
N y a
-s 7
rr.
.=^
>v^ 1
07
b7 n
gin• -
n6 N
^H
riz
fo
K:n
w»
n
^n - mi
7 s^n°n6m
r -
zz7 j
szN-'
7[>
°' `-
-^ s
-,+
^y-
^2
°-I
C<
=-^
C n
_pp-l
nz
=sx
-[ -
►^
C>>
r'f1
^i r^
vu^2
D^rf
Ona^u^ir
nC
z^xs
ncn
u Niran^aO
r K
AI
^ ^ F
«<
i)asR
^^a
c>iiw
r 3in
>>
O^w
Z2
S^_O
^A Q j
.~i^
Y^iO
N^^c'i ls'^
0 '!-
^
r^_ n
- m
a-ni
z-
Nr
s-
ia?n
y n- ^-
`^ >
'=oN
°-'
^r=
^°-
►r =
ia ^
^ ^
°y=
^i^
TH
S^^C
>=
oi=
rC
U^in
^+n i
>5a^c.Z
^-
as4sz:'^nz!^
^-
ti^^+-x<O-z^ a_/NN^o^+sn zs rz^R^.- ^C n=
T zz^ s _
->o N>b x-^^r
z >-zraKT D- y$ tiio^$1 n
^y1- ^f^zr>
7 n
>-
z m
7rD
Z R
._
Dz^N
1->
- rz
_.
.
-zozz^n- a_-> -z N-r <
r^
r-^ozs
zz$zs
^ow> n3^ra
r^^ ^^^a
r-^^+ on>nz
n'^-
>^>
-r^•
ozztz
7- _
^>
z ^
z^s '^->
Or
N z
N
zo n
^>
o=
^-
T
7an o
KN
-n >
r>>
r> o n-Dn > 6 o
mom^
-an
z->n- Nr z x r--
za^-z
> q
ab z^^°b^Hr-rN
A ^
r ^
^^> ii
nzi ^^^;^>^ >O^i ga 7no
$^ s
N^?4 ^^ ^> ^i:
, nni1 cT^^z^Or $ O^ ri ^x^ ?
^s^a$^
yyyy=
p))
^ _
pppp
^6»r_
_
-z_v
s^s o
o!
t^ 7
7Z
° O
T -
f^>
> ; Im
p
> >
31^
i^ n
^ R
O 7
^N ^ -->
2-rT
! »
D>
ie 7
[ S
Z N
T^.
r=pw
>C
iz^Z
C^
>^
=
n
^ o
$
z
B
TS'O ^ tr y
ro
^Q {
Z
>
z
$a D
z
> s sC
d=
s n ^
r> f
'^ s_ bn^ o
_zi-
>D
>e
`l
> O
^ T
Z
O
$g i ^
>
i.^ M
p u ^
_^N
1 U
b ii
>^ a
^>
Z ^
^^ ^
^p __ ^
^$
-i^
r
O
z>
>
z
m ^
H..a O
^
D>
x n 2>
r
X05
Zz
zrZ
^ N
^>
Z n
ie^
n ^
12$ i^ is
i^
Ts'>
Z 1
x z
^
s^
^-
--
--------- -
----------- ---------- ------ ----------- ------- ---- ---
e.
wu..
_o..
r.J
_
u.._O
.,ra
J.r
.._
o^_
r.N
.,.w
e..r.
N ._..:o
:»e^:
^»-o
.^r
aJ.r
.._
o.. r
aJ.-
w_o..rv
J.r
,._ 3
°^a;e^c^^ c
e^^e^e=^=^^ eecc^eaeee^c^=e^e e^^=z^^ceec eee^^^= ^^^z e^^z^ ^e^e¢^;^x^^a^ezee
mm
7T
z z fn
1m
^°m
om
>n! ^O
(n -`mN
nS
ZZ
N2T
N 2
^-
CC
7<
zR
, m
2 itl^^1 lnN
nnw
nnl Cn°N
N ^
!_=
^O
_19ZZ y
ysm
2p>
>->
^^A^n^^^°^^
>O CSnrI^'1=^;.Z^^(^'91>ti.n^<^OnI^^N Of^^Z^^s?^z,nDFiNH^a^>7:A0>i ^1^1alZ^O^N1YbCA^C0^9w^°3^^^3
> -
1d?r
°T
Ynr-
Qy/O
+1•
CS
SN
_ ^
rC 0
2=
-N
O -
1 S
l!R
-^Z
)[S
+• S
n
y°R
w z
>^ 8
RnZ
7Kf((
O'1
1f7R
-A' R
TmA
^<
zn z H
T>
>D
N~
^V
^r^
^7f2
^O
na y
T 'O
R1
rHf f° ^
>>
>^7N
OH
^-r
Ypp Z
I'`^
^S
jS=
>~
^^7lO
f^n9N
p'JC 1
vN
^y
C'
A^
p°
<(N -R
^ <
7
T-1
1 ^
tiH
im
TO
<°01 ^
1!2
^ Z
1N
r Z
nm
° ^
^e °
- y
r2 i00
>7c T
4 g
y m-+
- _^^.
SN
tff
°- ^
- ff
g±
<oa-'
m-
.^;
_:d
cG
. >
N.
. s -
r6E
w>
:-^an n
7<
»T
-^
^ N
^7_. ^s
N>
$ R
NN
7 ^
. ^
. G
CC
z-
_^-
°N
>
=^(1-e
7Hl
c c•
rwoo
z-+
zC
- ^<
2-
Dz A
A
z>s
>T
^7
^`^a^-[[' '-
^[[' '
N^Z
- ^ 2
HT
l--
^ Z
^N
+1f7
j> C
Hes
O A t-
i q K
NN
-2R
K°^ Z
7001
+-'_
7-
-SN
^ )
n°af 8 -
Nti>
^IL
> T
N<
>m
ZO
N
a•
8--- --- >1111i1 -
_N
rinn
z^, o
°^
n-
^ ^
i-..T
AN
- -
-E^
`^b
'^-
- : xzz
o o
- S
°z_>
- n >
-+^
^ r
a-^
>a-
7
°^O
^m>zK =^^es
-^e!'o^in'n°ic imzN Z-t sii
Ci sa
ys
^^^' s_
msa ams=^
MN ^ 6S^FN7 ^^^t^ ^`^:r^^N>^ >
_a1-1
- te
nT
---
z 7
zz-7N
^>
-s- w
r»N
- -
>n- ^
F^^K
r^-
^Z ^
6a;.
,^_ Ns^ n
^ii s
N>
o<
s ^'
^^S
e ^
$^
^[>
n^
O^O
K n
0--
- .
_>
> ->
r^1
(A
^ (
y -
HA
D_2
b _
>N
<K
» ^
- P
D00^-
-0>
r•^1
^'.^
=Z
Or>
^T
T
2H
_ n
ZO
r7
p
>>
'^a
y 1
Y
NT
t^ r
fi_ D
Z>
_ Z
^->.. xm-
asx sr
-
n7^;nz=S2- n^^ ,,
v-v -N
:o - : -_
:n
Nrs
z zz
nxc N6N zN
r ^ > c ^ 1i
z ^ ^8
Ne ^:r> ^n
^^ ^
8Q
K^
T^>
0>
> D
1 ^
< >
2^^ S
^R
^N
Jr>
N ^
SZ
TN
mPl
OT
A
N^
= ^
_;
> ^
^,
Y
:r
>_^
^_
9
-1
> I
C >
^ 3-
f_ >
_ ^
[ ^
la
1 r''^
J
^3
i^
I
..:.
..!ts'
..

iZauU>
g
`¢^
t
n
SZ
` O
W^
N'L
^C
S,
Y N
N
(Y^y VZ
<
<^^
^iUI
.^ n^ O
Z <
^^
O^ <
CZ^ N
N¢^ 8
0 Z
° 4^i^
a
.AW
N
^ F
^^ 5>-
¢ - Z
<O
« ¢
^ ^
i'7W
_ z
<z< ¢ ^ WzN ^9 x<rdpr< a^b' ^gr° < z 3 ^
t°ni9" >^o ^
zi z^°^^a
C)L I- Z
- OZ
N-\ p
-W
U Z C
SN
r¢U
^ °
^^^•+
p J O
_'q ti
KN
G,
Z
Z N
ta. J
< Y
¢p¢ F
Q N¢ W
<q
^faW
a _p ^QJB 8¢{yy 4^7 - {<{yy .. <>
O<
> <
Z( (<
^U p¢. 7^
N ¢
X p¢^
F I
.^S+
pZ
^Oh
^
r>
<^
¢<
i Z --p
Y°F
OB
q
^(
41U<X
--
<^G
CN
S<
J ^
i7 N
}Z2N
0 Y
.p p.1¢ 9
7`7
N(^ W ..] ¢ <
_g<
F'^
-U<
- -_N
«.] 4
. -<- <
,nC
-z2 ¢
Y a az7 7 -
¢Z
UW
Fa¢,p¢7
ZO <
^«
^C
J¢
6pp
No
Wg
¢N
¢>
p 4
. - NJ
^FQB
WZ I+1W
WU
-Y03^ ^
pJU
.r7 ¢6 O
q«
U
iFil f- G2F
> N
^Z
U^d
OL
W2
>
OU
=NN
F<p<Z^1^
-0¢N
a.m
<F
F-S
SZ
.JY
r C,F
< O
<S
a S
U Z
"L Q Y
z-
-.^j=
4^Y
W2(t.^
NN
W¢-p
Sq¢<
4. N
Z q
N<
U- 8
.. m
_ N
^2m
<>
Np L
<z. 1^Q
FN
- O {(^^a U
<
NL
'-iaW
-I.7
}^°¢Y
> y
yF
-°--'-->
, Fp ¢
f^0
0 <
ziW
O -Q-
-i ZF
^' p[
J N
< .-7
7..°S
p y
..7 SCC(-^.^¢
NON
W >
<!<il?
N<
'y1 - G
,,7 N
>L<
.<>
••Z Id
W^-
tf.J -q
7oW
Z^-U
r <N
L -^
y72 }II
¢^:i -N
p047
t^ YZ
yi i8
`
^j$
} N
Si... F
U-J -
FC
4;y^Y
< ..1 p
F^S
O¢
i` 6S
^ G
<mU
299^N
sZ
NaZ
'."i F^F
qd>3o
p mFFF
¢it^i
s ^^
^YL
q •¢-O
FWV
7 ^. v:0N2U
JOIC
\(7... .^
¢ F
-^+7
Z^J2
NC
ZW
BY
< <
m a
d F
UO
47
^Y
.'Li JN
4F
- ¢< ¢¢
<j N
U y.7C
mW
Ke^2<
Uym
N¢2 Q
2<
CS°j
W<
¢<
>FJ 1
'¢«
a3p
^Q ^q N
t<iIXV< 7
<^^
S2N
^>^O
(~^ - 2tf.<
C; J
>U
^l.¢< -N
W Z
N«
F¢S
•N 7<J
UU
- J
Z 2
^p
ppF Fppppp p
z N
s^8o^y5
\8ur
poac5<
^4:}
pN
¢<
•Fyl W
c75Y
8•
¢^_ :_
" oN
3. i:=
^SJ
, a7 <N
r^a.
44• ,, 'd>
~-2
8<
\s 8
-pp
o
sto
^Nfi <
S>
i^ J tnU
W6" F
^-W
N
• Y rt^
:N ^
Ci:J
C ^
F.,F 7Z F
T<
W^.-1
i1;^(t^O
^OZ
n<
OQ
p> -N
T4-]iW
O N
UY
- W(i
)-}^ 4i 0
7a7^F
S<
>^ ¢p W
NW
-Y¢U
rm 2
UW
<t/7
-NrW
aF
^
li¢Y
{O^ 24
0i0
^U
Q QN
mom
' ¢^IX
aN
Z<
>•^4
: 4; 4
¢>
2-3
WY
V.' Y
iJ
aX
¢S
NY
3U
- N4+
1 v
tQ Y
Q Y t/:24
YZ
US
LZ
'LJL¢¢¢i N
^i
^<
^ic
imi^
^^
$4>7oc<i7^9
^,<
.nic¢iiv
s^vvitn^sir <
t.io^im
5a7z^
d'>a^-°ozi°^
ia^ii^
^m
o^zf'so
ig.m
igmi
^i^c^ii^8^ia^m3
^ aa:a:^,z^^^€ma^a^ ^^^aa ^^^^ ^^4^aaa aaa^^^^^aaa aoa^aa^aaaaa^^aaa ^^^^^a^aaaa
a o^a^a^a^^
'W
^ N
nIrt7
0 t•-O
OO
..Nn IN
et O
e0-N
WIN
O e
P0-N
n Ie
eti e
^-N
A• N
er e
wp N
n ltlf e
^-<
PO
^N
IHO
^-e
eO
-Mn
♦ h
ef O
ltO-N
A^
^_ • e e 0 e e e e e O P P P P O O P P P 0 0 0 0 0 0 0 0 0 0--- =-== == - N N N N NM N N Nn n n nn n n n n 1 1 1 f 1 1^ f 1 1 e e e e
to e m N e O e e e e
• •eoeoe00000 0
00000 0
0--- ^-..^ -..-..-r-
^...^^ ..-
.<
-^
Z
^
^
S'o
^ n
^
^ ^ s <
` Z
g 5
^ 6 ^
^
m
5
5Gn <^-'^ G
g= ^ ^^ 7C i<
Z=
F J N o
W
<
z ^^
<_ ^
pp ^<
^r 7.^ tri.'S
US
yrj Y¢ F
N
^ r Q
Z F
a
¢p,^
^<
^ p
Zp ¢
Z 4
°47 7 8O
Z <
< ^
ZOR.^
^
^
ZG
O c
¢pZ
U Z
YZa
Z U
O<W
7... O<
N
ZF
¢ Y¢ o d.W
^<
ip< i^J.]¢
<
N N
Y 8
p •m
yU <f
J<
i7 <
^ ^
m<
4 ( X7 7 <_<
op
Gp2 ^
(r S
'p¢
i0U
p <
N O
«Z
- <
yJ<
6
` ^N
0{. 7 Z
- '<W
O< Y
2-G
i hl 2
-.(•.2
I .i<
1^
a
^ f^ ¢ W\ - Y J
k Y
¢ Z W> F< U U Q Z^ ^^ < W
r N ^ = N W
- ¢> ¢ S<-
<¢ 2¢ U O S U O W <<
ig` =7urig^
_r¢-6'i
O'p"< 5
° d <
^Z
fl=^^ 4 N i
" ^
p¢e i^
tW- vi ^c = i^
^
ig
o s
^O d
9F
-t>.7 z y n
7a^^p
QZ
rNZ
^i: o
t '^<
d ^
i<
^7<-
Nr0
U¢
¢ ¢ ^- ¢
-F
q<P.V
Z^ N
z_G
N
^ <
-{^z
Y
<
¢ Z
i2z0 N
<v
.< ti
p ze<
u°
We-Y
_ r
4^
Q N ^
.5^-
0 2
^0-
<7g 4
i -
8i^
z
z<
.so^-
J,7
$E
7 ^
_ >
.r=7^N
z-
t.,-p ¢ y^ ^
zap^Z
^(, 7 c
i V '-V
- f10v°
fyQ O
t fS-7 Z
LX
^ ^
}U
QZ
Np <
4.Z
Q0 a
o C TO
CQ Y
Ny<
< -O
=q
< z
t 2Z
2 ¢
N412U
I - W
Z.] <
LZ
{ <, 7QW 0{ p1 V=iN
iln f^ <
C
p¢ >Y
- Jf
-Z-<
pZ
f^ U
W^j V
U<
2 <
J <4.SSU4: t76-7<>^N
N S0^1
2 <
-pp N
ppN
p-<
Q¢ U
F<
ta7<Z
<JN
-F4
.W (^^1-^
}
3^..
Opp pCU
><
ZF U<Q U
(--
X-p7 C 2Y
:N d
WO
, -O
LSW
^i -0
Y N
U 4
1 y
- <
U¢
iW i^
-{[... ¢
U-2
¢ Z
F¢
b W -3F
W Z
41^fO
^Y
F ¢¢
ttW--^W
¢ir<Y
O o<
i07.'.<
i ..76 t<
ali¢
O¢p F
^iY
`.>.7
wU
^ Z
« =
>W
t< .7 p¢Qa N
t 0.7L4W7 m2 9
G;..^iF
U U
O v
S^¢2
4:.'.Niv f6<
1 ^>
OY
4^
i.l< ^
Y<
CZ
UN
\^U
O^_C
;O td
^2^ - F
^^6 N
-Q a< - N
2<ZZ CZZ
Jm.7U
6W< ¢ W
U«YS
¢, 01
. ZY
=^^N
-7UY<22V 6Q ¢O< <
pppp < 3 N 3X\XOo^F<^..<N
pG Z<
<pp -J m F ^U N C>}
(o-'-
.]SS,,V
ti ttS
Z25 Z
¢SO
Wm
<L
7- N
<Y
4iIQ
2^2
N6
T.Q
-i^tJ
-F
w O
<^" L ^
' <U
t .7• A^W
< -fl' <
N
^N
-N 4
:-.¢<
$p F
Q<
ZU
m O
Z-Z
J <-
's -
y
F-^.^00 <ii1 C
V7 .7 F
-NS
£
^1<
J 1
0..2
0 <
t+:^
--. 7F
¢ <
mi-<
^U
>JLN
IJO
O-W
<-4
12W
Uv.W
¢r<
N L
L'm
-<
pt^Wp473
►O
CQ
¢W r, n
N.]f-r>
-(-Z-1
-^2j:C
pp Y[^>•O
OF
--rt /: +
:Nr.]O
U"Z
< <
frUZ
«Z
U Z
:Jr Z
O<
2Y
J<
J - C
Y-
YN
-O Z
FO
pC^>
WggN
2 J
<^Z
4J L
<JX
^-J
_.Z
'J W
2 {- Z
s<
2>
¢J2S
it Jtn
«V
< 2W
^v
LV,
FU
- <^Q
Z>
Ztn
^<
iJm
XW
Z
6N
d^12 ¢
FO
b^FoG^i,`78
h^`,ur4^^75^3^^m
d^i.°
^mg
^=^h
o^^`,
:^^=
^0'
0:^
0, ^8r17^^a:^
5-zu
gS
'`<•^i,`^^8^^^' ,^^^^i>
^o
t^Z
U^t^
^^t^
Q^4
8^m
$c`^^u^m
r a^°c
a a3a3aaaaaaa as aa^a a aaa as aaaaaaaa^^^:^a a^t^ ^ ^^ aaaaaaaaa^^aaa^aaaaaaa^^^^^a aa3aa^aaaa
1 -N
n •H
ere
aor N
n I,n
ew
a e
or N
n IN
en o
we-N
n fe
rn e
w o
.N n
1o:^
-etw
o-N
n1eo'-o
ae rN
n ltn
is ^
-ew
e ..N
n 1
ee^-s
wo
000000000.-
- -
- -
--- -
rN
N N
NN
NN
Nnnnnnn n
n n
^ ^
f1 IIIe
NN
NN
NN
N,9
Nee e
eeeeeee
^- rrr
l^PP
^-t 1-i
^ •e00000000• eo 000o a o00 oo e000eooe000000 e • • •• oeie00000000000000000000000e eeeeeeeeee
r♦
^.a^0
^O
JJ^. ^^"P
^^.
^r
^^
^_..mow..

C I
^^
"'
r
<`-
^
^_^"
<<
^
g
`
Y
^ z <
u W
f
^^ ':
3W
^8
89 8
^^
^
+w
^ W
iv
, c5e
^78^8 ii'a
'r <
Z <FJ .^
^^^ ^
'^^^ <
^^^. ^
^ $^ a
a^ g `
n ^
^
.g 38 ^
iNi ► W-n
c ► .z ► •. ^F
. <
- ^: m
c^J-O
Q .'^.-^
p • Z
{.)U O -p
`- •^ ^«<
-- N
m<W
Z
-<
^ t
C
^ J
-¢ N
Y
F-r+
J2rizOSZO -Hio
y' Frci^^i-i^z_Y
{ p p
c 8 $-
p]<
^^ ^Jc
O`8
<S
t^^Q
r,3 ^(Y
JNyU
3N
0 i3
aQ Qe-O
¢6^ooa^+
^ -^
-y-^
atV
V--Y
.-vc^O
Oo C
=39 -O J¢- 0 8
^ >
^ fO
C^N<J^
3^ Z
^ m
< W
2 r -W
V O
•^r^ = j^
0ui3
► ai^n tg rHs
Ws
^- i^
.W
w c
r. ^<
fig. 6
^^u
=c^oao im
o^^^3 ^
i•i
izi^ _
^^r'^
p^-$F< '^
"r z
•^O
S^U
V ¢
t Y^i¢
J <
V <
•WJ z
>aJ- a
p.7
0W
^
Q a
Vof <
_ 3
W
Y O
w^W
v<
-[<
c«
^z O
y. . ^
^<
^c. z
z.<
^ tr
m ^
^LJW
OO
z <
'1 Q
i cF
m-SIZ--<<Q
^ 1 -Z Uz <_n
z--rvi^ g< C H - UQ i^Y U C F<YiZ^Y
W^41- z -,> rtu-Wx^-zrm Wr ry -rz:
-z-o ri
^o3-^ s « ^- s<^ o<W^
►o-W
>:rO
l.f^ Z
pJ<
a^Y
rU2<
[ 35gN
J -
k^'.
.J6V
<-
s[J< 5<.<W- « rW
Wa mc- -<oLC<5J pp
< o<
►o-<-c--JZ-<
m►•Z2i <rVJN>73 V:r aV Ot
VV rr^ ^OV ^WO^OW^^F ^ ^
^^a
^ Vvl V-OCV^OVrW<OV
tp .:a^^^aaaa^a^€Wa^:^:aa^^aaaaa^az^ra^ a^^z3o^^ ^ ^ ^^ :^>;YYr^U^^UW^^V
r -
I^f^
^P
O-i=
^nf••<
NO
--
-..^
ti»^
_..
.,.,.......
..<..^
..^^.- ..,..^
0000 0
0 0
0 o
a 0
000^ro
a-a
Paa
r.
<
a^z
W<
Y<
r
F<
rO
`v.
<-
Y`^^
^^
^^
`8
^z
^ .j
,^<
^^
-4
<r
O
^8
< m
z
zu
g^,<^<
o e
^<
<
ii
^^ >
Z
Of
i-t^ G
< Y
<O
W 1
/1 O
^ G
<.1
zW
<N C
Y O
< J
^ <
JJJ
c
cW
pp¢r 4
¢OK
ZI V <U+ r z
^
z<^ rt l Ytif_a Z
Q •3
rQ
V<
JW Y
JO L
W L
:<
G-
NZ
N-
-Z i` >`
W Q
V- ZJp
W J "3^ =V^V
rf00 zt =e i
^y o
-o -1
pT
^ ^ o
-.
v z
u<
p ^
.^^ ^
<z
'< =
ZZZ<
y
-N^
r{ySzz Z
00-
z.S
Z^ Y
W W
-za m
N 7
r-C<
^-rv
:-3 z
:pQ
JY
<-
Q u•S
))u t
< -u W
<5=
off
^ r
39 ^
1 «
1yy
<s^o:o
v. -<
,-<>
W^rZ
FY -W
L Y
i0^<
f.^<
WY
-i<
-^
O -
3O
•^• ^
v, J
pa[W
a V:O
¢ -<
L-^
[
p o<
>M
<
Xaa
p p>
WZ
` 0<
VI U
^Z
3 -F
-R
-^F p v.
^r .J O
+I>
- L
a• O^-+
^ -
F^^yrYC^3¢^^~ ^WWSZ Ca
=ZZ^G^ Y
W ¢pp^NS^O<^- oo_ ^V yOyV<C a'^ ,<rJ22o¢VSiU<r<zCZ^
^ F p
-[<I =
NZ
OM
Z^ H
<^N
<^ C
ZIi2
^<
•L MiN
F
7W
t 3 ►
«<
^C
f^N
,<1
►¢
z-^
^¢
CIY
:O W
< >
pO C
NU
<t-<
^m
IN 2
Orm
^^m
C- W
N N
8S
'J Y
-=
=^ C
<R
^=
rtO ;!• P
OY
v.
ELF
(•^ W
W F
^1¢ v1
Y2Y
Y <
<
WY
OL-
1^ SSS
Z<CSWSaW
-<W9N
:JJL9^cu<mQ
^i8>CC..N "i' c_ :^-uo^ r
Y.
<ggo.I^^5^^
^^ 3^WY
rSW
O{^ J
p 7 p •Z
JV
V.m-Z
N ltz
v.6
LO
<-v
l J ^
Vy ^
<2^ ¢
¢< < ,Y
ZC
p^ [
itf O<
p Cp r:J2I
`_'3►5,^
<,>
OiZ
zr2308sSV$VQ
zY
<im
WG
CU
Vi O
+W CZ
^O
mm
^^ i^
<jn^$
V9'^
<m
mfiY
m»
rA _ €a^aa{^Fzza= ^a^^W:=^^W^^ ^aa,o^ YY^ ^ :aF-,.,,
ae a^ ^a^^^^:a,-^YF
^ uu
^^;, .. ,,.o
^.
^.u
ss
-ra
io
- _
-
-
-
^--------
^'r.a

RIMFORMERLY WILLOW RUN l•lORA^ORIES. THE UNIVERfITY Of MIC IIIGAN
Appendix C
LIST OF ORGANIZATIONAL ADDRESSES
Air Force Cambridge Research Laboratories National Aeronautics :,L.id Space AdministrationLaurence G. Hanscom Field Wallops Flight CenterBedford, Massachusetts 01730 Wallops Island, Virginia 23337
American Electric Power Service CorporationTwo BroadwayNew York, New York 10004
Argonne National Laboratory9700 South CassArgonne, Illinois 60439
Bureau of ReclamationDenver Federal CenterDenver, Colorado 80225
U. S. Army Corps of EngineersDetroit, Michigan 48222
East Tennessee State UniversityState University SubstationJohnson City, Tennessee 37601
Environmental Research Institute of MichiganP. O. Box 618Ann Arbor, Michigan 48107
Federal Highway AdministrationUnited States Department of TransportationWashington, D. C. 20591
Highway Research CouncilBox 3817, University StationCharlottesville, Virginia 22903
Michigan State UniversityEast Lansing, Michigan 48823
National Aeronautics and Space AdministrationGoddard Space Flight CenterGreenbelt, Maryland 20771
National Aeronautics and Space AdministrationLyndon B. Johnson Space CenterHouston, Texas 77058
National Aeronautics and Space AdministrationJohn F. Kennedy Space CenterKennedy Space Center, Florida 32899
National Aeronautics and Space AdministrationLewis Research Center21000 Brookpark RoadCleveland, Ohio 44135
National Park ServiceWest Regional Office450 Golden Gate AvenueP. O. Box 36063San Francisco, California 94102
North American Rockwell12214 Lakewood BoulevardDowney, California 90241
NOAA/N ESS3737 Branch AvenueWashington, D. C. 20031
Oregon State UniversityDepartment of OceanographyCorvallis, Oregon 97331
Purdue UniversityLaboratory for Applications of Remote
SensingPurdue Industrial Research Park1220 Potter DriveWest Lafayette, Indiana 47906
South Dakota State UniversityBrookings, South Dakota 57006
State Highway AdministrationBureau of Public Roads1717 H StreetWashington, D. C. 20591
Tennessee Valley AuthorityNorris, Tennessee 37828
United States Department of AgricultureForestry ServicePacific Southwest Forest and Range
Experiment Station1960 Addison Street, P. O. Box 245Berkeley, California 94701
United States Department of AgricultureForestry ServiceRocky Mountain Forest and Range
Experiment Station240 West Prospect StreetFort Collins, Colorado 80521
175

^RiM - -^ORMERIr WIILOW RUN IAfORATOR1Ef. THE UNIVERi1tY Oi YIC NIGAN
United States Department of AgricultureAgricultural Research ServiceP. O. Box 267Weslaco, Texas 78596
United States Department of the InteriorFish and Wildlife ServiceNorthern Prairie Wildlife Research CenterJamestown, North Dakota 58401
United States Energy Research and Develop-ment Administration
Morgantown Energy Research CenterP. O. Box 880Collins Ferry RoadMorgantown, West Virginia 26505
United States Department of the InteriorGeological SurveyDenver Federal CenterDenver, Colorado 80225
United States Geological SurveyWater Resources Division901 South Miami AvenueMiami, Florida 33130
United States Geological SurveyDepartment of the Interior ^Water Resources Division500 Zack StreetTampa, Florida 33602
Unfted States Geological Survey2221 Jefferson Davis HighwayArlington, Virginia 22202
Ur! ted States Geological SurveyGSA Building, Room G-204Washington, D, C. 20242
University of CaliforniaSchool of ForestryBerkeley, California 94720
University of Califoi°nia, RiversideRiverside, California 92502
University of KansasSpace Technology CenterIrving Hill DriveLawrence, Kansas 66044
University of MichiganAnn Arbor, Michigan 48104
lib
tt.,^_ ^ _:., _. _ _ .___ ___
r

RIMFORMERLY WILLOW RUN L^^ORATORIE S. THE UNIVERSITY OF MICHIGAN
REFERENCES
1. P.G. Hasell, "Investigation of Spectrum Matching for Remote Sensing inAgriculture," Report 8725-13-P, The University of Michigan, Willow RunLaboratories, Ann Arbor, Michigan, January 1968.
2. "Remote Multispectral Sensing in Agriculture" Volume 1, No. 4,LARS, Purdue University, undated.
3. Corn Blight Watch Experiment, Final Report, Vols. I-III, NASA, JohnsonSpace Center, Houston, Texas, June 1973.
4. F.J. Thomson, et al., "Multispectral Scanner Data Applications Evaluation,"Report NASA-JSC 09241, ERIM Report No. 102800-40-F, EnvironmentalResearch Institute of Michigan, Ann Arbor, Michigan, December 1974.
5. R.E. Marshall, et al., "U^e of Multispectral Recognition Techniques forConducting Rapid, Wide-Area Wheat Surveys," in the Proceedings of theSixth Symposium on Remote Sensing of Environment, Willow Run Labora-tories, The University of Michigan, Ann Arbor, Michigan, October 1969.
6. R.F. Nalepka, J.P. Morgenstern and W.L. Brown, "Detailed Interpreta-tion and Analysis of Selected Corn Blight Watch Data Sets," presentedat the Fourth Annual Earth Resources Program Review, NASA/MSC,Houston, Texas, published in proceedings, 31650-96-5, January 17, 1972.
7. Forest Service, USDA, Timber Resources for America's Future,Forest Resource Report 14, U.S. Government Printing Office, Washington,D.C.. 1958, 713 pp.
8. R.C. Thatcher and L.S. Pickard, 'Seasonal Variations in Activity of theSouthern Pine Beetle in East Texas," J. Econ. Entomol., Vol. 57, 1964,pp. 840-842.
9. R.C. Aldrich, R.C. Heller and W.F. Bailey, "Observation Limits forAerial Sketch Mapping Southern Pine Beetle Damage in the SouthernAppalachians," J. Forestry, Vol. 56, 1958. pp. 200-202.
10. R.C. Heller, J.F. Coyne and J.L. Bean, "Airplanes Increase Effective-ness of Southern Pine Beetle Surveys," J. Forestry, Vol. 55, 1955,pp. 483-487.
11. W.M. Ciesla, J.C. Bell Jr. and J.W. Curlin, "Color Photos and theSouthern Pine Beetle," Photogramm. Engin., Vol. 33, 1967, pp. 883-888.
12. Forest Service, USDA, Evaluating Southern Pine Beetle Infestations,S&PF, Southeastern Area Division Forest Pest Control, 1970, 35 pp.
13. W.G. Rohde. Reflectance and Emittance Properties of Several TreeSpecies Subjected to Moisture Stress, M.S. Thesis, The University ofMichigan, Ann Arbor, Michigan, 1971, 199 pp.
14. C.E. Olson Jr., 'Remote Sensing of Fomes annosus in Forest Stands,"Proceedings of the Eighth Symposium on Remote Sensing of Environment,Environmental Research Institute of Michigan, Ann Arbor, Michigan. 1972,pp. 1381-1384.
177

RIM1'ORMEI^LY W^^IOW IIUN LA^CIRATORIES THE UNIVEI^f IT• Of MICHIGAN
15. Bureau of Sport f^ i yheries and Wildlife. USDI, National Survey of Fishingand Hunting, Resource Publ. No. 27:13, Washington, D.C., 1965.
16. A.D. Geis, "Role of Hunting Regulations in Migratory Bird Management,"Trans. N. Am. Wildlife Conf., Vol. 1. No. 28, 1963, pp. 164-172.
17. W.F. Crissey, "Prairie Potholes from a Continental Viewpoint," SaskatoonWetlands Seminar, Canadian Wildlife Service Report Series, Vol. 6. 1969.pp. 161-171.
18. A.D. Geis. R.K. Martinson and D.R. Anderson. "Establishing Hunting Regu-lations and Allowable Harvest of Mallards in the United States," J. WildlifeManagement, 1969, pp. 848-859.
19. W.F. Crissey, "Forecasting Waterfowl Harvests by Flyways." Trans. N.Am. Wildlife Conf., Vol. 1, No. 22, 1957, pp. 256-268.
20. Bureau of Sport Fisheries and Wildlife, USDI, Standard Procedures forWaterfowl Population and Habitat Surveys -The Prairies, Division ofManagemen! and Enforcement, Washington, D.C., 1969.
21. W.G. Burge and W.L. Brown, "A Study of Waterfowl Habitat in NorthDakota Using Remote Sensing Techniques," Report No. 2771-7-F,Willow Run Laboratories. The University of Michigan, Ann Arbor,Michigan, July 1970.
22. E.A. Work and F.J. Thomson, "A Study of Waterfowl Habitat in NorthDakota Using Remote Sensing Techniques: Phase Two, Report No.101000-12-T, Environmental Research Institute of Michigan, Ann Arbor.Michigan, April 1974.
23. E.A. Work, Application of the Earth Resources Technology Satellite forMonitoring the Breeding Habitat of Migratory Waterfowl in the GlaciatedPrairies, M.S. Thesis, The University of Michigan, Ann Arbor, Michigan,1974, 107 pp.
24, P. Trego, "Taking the Earth's Pulse," Nevada Highways and Parks, Depart-ment of Highways, Carson City, Nevada, Vol. 25, No. 4, 1965, pp. 10-15,
25. H.A. Pohn, "Near-Infrared Reflectance Anomalies of Andesite and Basaltin Southern California and Nevada," Geology, November 1974, pp. 547-550.
26. T.W. Dibblee, Jr., Geologic Map of Lavic Quadrangle, San Bernardino Co.,California, U.S.G.S. Misc. Geol. Inv. Map I-472.
27. R.K. Vincent, "Rock-Type Discrimination from Ratio Images of PisgahCrater, California," Report No. 31650-77-T, Environmental ResearchInstitute of Michigan, Ann Arbor, Michigan, 1962.
28. R.J.P. Lyon, "Evaluation of Infrared Spectrophotometry for CompositionalAnalysis of Lunar and Planetary Soils," Stanford Research Institute, MenloPark, California, 1964.
29. C.F. Lee, Eutrophication, Occasional Paper No. 2, Water Resources CenterEutrophication Information Program, The University of Wisconsin, Madison,Wisconsin, 1970, pp. 39.
30. E.E. Shannon, Eutrophication-Trophic State Relationships in North andCentral Florida Lakes, Ph,D. Thesis, University of Florida, Gainesville,Florida, 1970.
178

..^^6sc. '^i
RIMFORMERLY WILLOW RUN LASORA TORIES. ♦ NE UNIV[RSITY Of MIC NK3AN
31. T. Borton, C.T. Wezernak, R.K. Raney, et al., "Inland Lakes Water Qualityand Watershed Planning," Report No. 193500-8-F1,Environmental ResearchInstitute of Michigan, Ann Arbor, Michigan, 1975.
32. C.T. Wezernak, '"The Use of Remote Sensing in Limnological Studies,"Proceedings of the Ninth International Symposium on Remote Sensing of theEnvironment, Environmental Research Institute of Michigan, Ann Arbor.Michigan, 1974, pp. 963-979.
33. C.T. Wezernak, D.R. Lyzenga and F.C. Polcyn, "Cladophora Distribution onLake Ontario (IFYGL)," EPA-860/3-74-028, National Environmental ResearchCenter, U.S. Environmental Protection Agency, Corvallis, Oregon, 1974.
34. J.H. Neil, "Cladophora in the Great Lakes," Limnos Ltd., Toronto, Ontario,Canada, 1974.
35. C.T. Wezernak, J.R. McKimmy and F. C. Polcyn, "Power Plant Dischargeand Thermal Anomalies in Southern Michigan -Program Summary," ReportNo. 290100-1-F, Environmental Research Institute of Michigan, Ann Arbor,Michigan, 1974.
36. S.R. Stewart, W.L. Brown and F.C. Polcyn, "Multispectral Survey of PowerPlant Thermal Effluents in Lake Michigan," Annual Report, Willow RunLaboratories, The University of Michigan, Ann Arbor, Michigan, 1972.
37. National Marine Fisheries Service, The Effects of Waste Disposal in theNew York Bight, Summary Final Report, Sandy Hook Laboratory, Highlands,New Jersey, April 19.72.
38. C.T. Wezernak, D.R. Lyzenga and F.C. Polcyn, "Remote Sensing Studies inthe New York Bight," Report No. 109300-5-F, Environmental Research Insti-tute of Michigan, Ann Arbor, Michigan, 1975.
39. S.P. Shaw and C.G. Fredine, Wetlands of the United States: Their Extentand Their Value to Waterfowl and Other Wildlife, USDI Fish and WildlifeService Circular No. 39, Washington, D.C., 1971, 67 pp.
40. A.A. Curtes, Wetland Protection Measures New Direction in Land UseReguation, Great Lakes Basin Commission Communicator, Ann Arbor,Michigan, February 1975.
41. M.E. McDonald, The Edge of the Pointe Mouillee Marsh, Michigan, withSpecial Reference to the Biology of Cattail (Typha), The University ofMichigan Doctoral Dissertation Series, Publication rto. 2421, Ann Arbor,Michigan, 1951.
42. C. Cottam, Food Habits of North American Diving Ducks, U.S. Depart-ment of Agriculture Technical Bulletin No. 643, Washington, D.C., 1939.
43. A. Sellman, I.J. Sattinger, L.B. Istvan, W.S. Enslin, W.L. Meyers andM.C. Sullivan, "Remote Sensing in Michigan for Land Resource Manage-ment: Waterfowl Habitat Management at Pointe Mouillee," Report No.193400-1-T, Environrental Research Institute of bichigan, Ann Arbor,Michigan, 1974.
179

L-ZZ
^ERIM"iRME RLY WILLOW AUN l/ISOFI.'. .. ^.I UNIVEAS^^ ^ w.. ^.^i.AN r
44. P.C. Hasell Jr., et al., "Michigan Experimental Multispectral MappingSystem: A Description of the M7 Airborne Sensor and its Performance,"Rep^, rt No. 190900 - 10-T, Environmental Research Institute of Michigan, AnnArbor, Michigan, January 1974.
45. P.G. Hasell Jr. and L.M. Larsen, "Calibration of an Airborne MultispectralOptical Sensor," Report No. 6400-137-T (ECOM-00013-137), Willow RunLaboratories, The University of Michigan, Ann Arbor, Michigan, September1968.
Copyright © 2022 FDOKUMEN