gender, trade and green growth
124
October 2014 GENDER DIMENSIONS OF REGIONAL COOPERATION AND INTEGRATION IN SOUTH ASIA GENDER, TRADE AND GREEN GROWTH VOLUME I
-
Upload
khangminh22 -
Category
Documents
-
view
0 -
download
0
Transcript of gender, trade and green growth

October 2014
GENDER DIMENSIONS OF REGIONAL COOPERATION AND INTEGRATION IN SOUTH ASIA
GENDER, TRADE AND GREEN GROWTH VOLUME I
PRF2a - (Vol. I) UN Women Cover - Single.indd 1 10/2/2015 4:16:26 PM


GENDER DIMENSIONS OF REGIONAL COOPERATION AND INTEGRATION IN SOUTH ASIA
GENDER, TRADE AND GREEN GROWTH VOLUME I
October 2014
Proof 3a IP chk - (Vol. I) UN Women - Gender Dimensions.indd i 10/7/2015 4:36:48 PM

REPORT TEAM
Lead Author: Shreyasi JhaAuthors: Ritu Dewan, Amee Misra, Saloni Singh, Navanita Sinha, Maheen Sultan and Sonam TobgayTechnical Advisory Group: Maria Floro, Muthukumara Mani and Yumiko YamamotoResearch Assistants: Shrijna Dixon and Kunal RanjanPhoto credits: Vidura Jang Bahadur
DISCLAIMER
This technical report does not imply the expression of any opinion whatsoever on the part of the UN Women with regard to the legal status of any country, territory, city or area or of its authorities, or with regard to delimitation of its frontiers or boundaries. Moreover, the views expressed do not necessarily represent the decision or the stated policy of the UN Women, nor does citing of trade names or commercial processes constitute endorsement.
Proof 3a IP chk - (Vol. I) UN Women - Gender Dimensions.indd ii 10/7/2015 4:37:08 PM

Foreword
Since the Earth Summit twenty two years ago, the international community has made historic achievements in advancing human development, including gender equality. However countries around the world continue to face considerable social, economic and environ-
mental challenges and progress continues to be threatened by persisting gender inequalities.
At the 2012 United Nations Conference on Sustainable Development (Rio+20), it was acknowledged that sustainable development requires pursuing economic, social and envi-ronmental objectives as interconnected development goals. Rio +20 also provided a new dimension to the ongoing debates on the linkages between Gender Equality, Economic Development and Environmental Sustainability — with its emphasis on green economy as one of the important tools available for achieving sustainable development and positing trade as one of key instruments for transitioning to greener economies.
Advocates of green growth have since foregrounded the need for social policies and instru-ments that protect and safeguard the interests of people who depend on sectors like land, water or fi sheries. Arguably, these are also sectors which engage both directly and indirectly large numbers of women, and therefore are likely to have a greater impact on this sub-set of the population. Furthermore it is critical to focus on two dimensions of the gender and green economy debate: women’s participation in inclusive, sustainable green growth and the impact of ‘greening the economy’ on women – as consumers, workers and producers.
This report, ‘Gender, Trade and Green Growth’, explores the interconnections between gender equality, regional trade and sustainable development. The study builds on the premise that green growth frameworks devoid of ‘gender’ as one of the key imperatives fail to achieve the objective of inclusive and sustainable development. It provides evidence from select sectors across four countries in the South Asian region on how women’s equal access to and control over resources is not only critical for improving the lives of individuals, families and nations, but equally to ensure the sustainability of the environment
The report makes detailed recommendations for policy makers and practitioners to ensure that policies and programmes eff ectively integrate gender equality and that women partici-pate fully and meaningfully. The report calls upon decision makers to ensure that regional trade promotion takes into account the specifi c nature of women’s participation and also focuses on promoting green growth sectors in the countries’ economies. By acting on these recommendations and working collectively across sectors, we will not only strive towards the future we want, but will also provide the foundations for present and future generations of women and men, to thrive and prosper.
Proof 3a IP chk - (Vol. I) UN Women - Gender Dimensions.indd iii 10/7/2015 4:37:08 PM

Proof 3a IP chk - (Vol. I) UN Women - Gender Dimensions.indd iv 10/7/2015 4:37:08 PM
Contents
Foreword iii
Executive Summary ix
Abbreviations xi
CHAPTER 1. INTRODUCTION 1
Objective 2
Scope of the Study 3
Structure of the Report 3
CHAPTER 2: TRADE LIBERALISATION, GREEN GROWTH AND GENDER INEQUALITY – CONCEPTUAL AND METHODOLOGICAL FRAMEWORK 5
Defi nitions 5
Trade Liberalisation, Green Growth and Gender Inequality – In General 6
Underlying Assumptions 10
Methodology and Data 10
CHAPTER 3. IDENTIFYING GREEN INDUSTRIES AND THE PATTERN OF TRADE FROM GREEN INDUSTRIES IN SOUTH ASIA 13
Industry/Sector Case Studies 14
Women in the Agro-processing Sector in Bangladesh and Bhutan 15
Organic Horticulture in India 16
Women’s Participation in Ecotourism in Nepal 17
CHAPTER 4. PATTERN OF TRADE IN GREEN INDUSTRIES 19
Trade Trends and Policy Overview in South Asia 19
Bangladesh 21
Bhutan 23
India 25
Nepal 27
Intra-regional Trade 28
Trends of Trade from Agriculture, Renewable Energy and Ecotourism 28
Proof 3a IP chk - (Vol. I) UN Women - Gender Dimensions.indd v 10/7/2015 4:37:08 PM

vi Gender, Trade and Green Growth Vol. I
CHAPTER 5. GENDER ANALYSIS OF INTERNATIONAL AND INTRA-REGIONAL TRADE IN GREEN INDUSTRIES 35
Female Participation in Green Industries 38
Women’s Participation in Agriculture, Ecotourism and Renewable Energy 40
Female Intensity of Total Exports and Green Exports 44
Intra-regional Trade 49
CHAPTER 6. GENDER SUPPLY CHAIN ANALYSIS OF AGRO-PROCESSING, RENEWABLE ENERGY AND ECOTOURISM 53
Women’s Participation in Agro-processing and Horticulture 54
Women’s Participation in Renewable Energy Sector 60
Women’s Participation in Ecotourism 61
Factors Determining Women’s Participation in the Green Sectors 64
CHAPTER 7. PROPOSED ENTRY POINTS TO ADDRESS GENDER IN REGIONAL TRADE AND INTEGRATION, ESPECIALLY IN THE GREEN INDUSTRIES 67
Trends in Trade and Employment in Green Industries 68
Women’s Participation in the Green Industries 68
Impact of Trade on Women’s Jobs and Quality of Life 70
Ways Forward 71
BIBLIOGRAPHY 73
ANNEXES 80
ANNEX 1. Project Timeline 80
ANNEX 2. Project Team 81
ANNEX 3. List of People Interviewed/Consulted 83
ANNEX 4. Research Matrix 88
ANNEX 5A. Indicator wise Secondary Data Sources and Coverage 90
ANNEX 5B. Note on Treatment of Missing Data and Outliers 91
ANNEX 5C. Mapping of Secondary Data at Diff erent Industrial Classifi cation Levels 93
ANNEX 6. Number of Industries Classifi ed as Green and Non-Green 95
ANNEX 7. Industry Case Studies – Rationale for Selection and Data Sources 96
ANNEX 8. Bilateral Trade Trends between Bangladesh, Bhutan, India and Nepal 98
ANNEX 9. Female Intensity of Bilateral Trade between Bangladesh, Bhutan, India and Nepal 106
Proof 3a IP chk - (Vol. I) UN Women - Gender Dimensions.indd vi 10/7/2015 4:37:08 PM

vii
TABLESTable 1. World Trade Organization (WTO) Membership of South Asian Countries 20
Table 2. Trend in Trade, 2005–2012 20
Table 3. India’s Top 10 Exporting Partners (total value in USD million) 25
Table 4. Female Labour Force Participation, 2009–2012 36
Table 5. Sectoral Distribution of the Labour Force in Bangladesh, Bhutan, India and Nepal 37
Table 6. Barriers, Opportunities and Potential Interventions to Promote Gender Responsive Trade in the Agricultural Sector 59
Table 7. Barriers, Opportunities and Potential Interventions to Promote Gender Responsive Renewable Energy 61
Table 8. Barriers, Opportunities and Potential Interventions to Promote Gender Responsive Ecotourism 64
FIGURESFigure 1. Green Economy and Green Industries 5
Figure 2. Gender, Trade and Green Growth 9
Figure 3. Research Design 11
Figure 4. Average Tariff Rates - Bangladesh, 1989–2012 21
Figure 5. Total Exports and Green Exports - Bangladesh, 1993–2012 (1990 constant USD) 21
Figure 6. Total Green Exports - Bangladesh, 1989–2012 (1990 constant USD) 22
Figure 7. Total Exports and Green Exports - Bhutan, 1993–2012 (1990 constant USD) 24
Figure 8. Average Tariff Rates - India, 1989–2012 25
Figure 9. Total Exports and Green Exports - India, 1989–2012 (1990 constant USD) 26
Figure 10. Total Exports and Green Exports - Nepal, 1989–2012 (1990 constant USD) 27
Figure 11. Total Exports in Industries of Interest - Bangladesh, 1989–2012 (1990 constant USD) 29
Figure 12. Total Exports in Industries of Interest - Bhutan, 1993–2012(1990 constant USD) 30
Figure 13. Total Exports in Industries of Interest - India, 1989–2012 (1990 constant USD) 31
Figure 14. Horticulture Exports from India, 2000–2012 32
Figure 15. Total Exports in Industries of Interest - Nepal, 1989–2012 (1990 constant USD) 32
Figure 16. Average Female Participation in Green Sectors - Bhutan, 1993–2012 38
Contents
Proof 3a IP chk - (Vol. I) UN Women - Gender Dimensions.indd vii 10/7/2015 4:37:08 PM

viii Gender, Trade and Green Growth Vol. I
Figure 17. Average Female Participation Rate in Green Industries - Bangladesh, 1989–2012 38
Figure 18. Average Female Participation in Green Industries - India, 1989–2012 39
Figure 19. Male and Female Wages - India, 1989–2012 (1990 constant USD) 39
Figure 20. Average Female Participation Rate Across Sectors - Bangladesh, 1989–2012 40
Figure 21. Average Female Participation Rate Across Sectors - Bhutan, 1993–2012 42
Figure 22. Average Female Participation in Agriculture and Agro-Processing Sector - India, 1989–2012 43
Figure 23. Female Intensity of Exports - Bangladesh, 1989–2012 (1990 constant USD) 46
Figure 24. Female Intensity of Exports - India, 1989–2012 (1990 constant USD) 46
Figure 25. Female Intensity of Green Exports - India, 1989–2012 (1990 constant USD) 47
Figure 26. Female Intensity of Green Exports - Bangladesh, 1989–2012 (1990 constant USD) 47
Figure 27. Female Intensity of Green Exports - Bhutan, 1993–2012 (1990 constant USD) 47
Figure 28. Total Agriculture and Agro-Processing Sector Exports and its Female Intensity of Exports - Bangladesh, 1989–2012(1990 constant USD) 48
Figure 29. Total Renewable Energy Sector Exports and its Female Intensity of Exports - Bangladesh, 1989–2012 (1990 constant USD) 48
Figure 30. Female Intensity of Bangladesh’s Green Export to India, Nepal and Bhutan, 1989–2012 49
Figure 31. Female Intensity of Bhutan’s Green Exports to Bangladesh, India and Nepal, 1993–2012 50
Figure 32. Female Intensity of India’s Green Exports to Bangladesh, Bhutan and Nepal, 1989–2012 50
Figure 33. Example of the Sea Buckthorn Supply Chain in Ladakh, India 54
Figure 34. Example of the Agro-Processing Supply Chain in Bangladesh 56
BOXESBox 1. Measuring Women’s Unpaid Work 36
Box 2. Measuring the Female Intensity of Exports: A New Metric to Quantify Women’s Share of Export 45
Box 3. Women in Sea Buckthorn Sector in Ladakh: A Transformative Industry 55
Box 4. Making Cheese in Bumthang, Bhutan 58
Box 5. Backyard Biogas in Bangladesh 60
Box 6. Ecotourism and Empowerment in Nepal 62
Proof 3a IP chk - (Vol. I) UN Women - Gender Dimensions.indd viii 10/7/2015 4:37:08 PM

Executive Summary
This study examines how trade liberalization impacts women, especially women engaged in the green industries, of four South Asian economies - Bangladesh, Bhutan, India and Nepal. The primary question being asked in this study is when
South Asian economies increase trade with each other in the “green sectors”, how does it aff ect women, their participation in the labour force and their overall well-being.
Historically, the South Asian economies have had the bulk of their trade with countries outside the region, with only a minor share of their total trade being with each other. Extra-regional trade accounts for 93.7 per cent of the region’s total exports and 96.1 per cent of its total imports, while intra-regional trade is less than 5 per cent of the total trade in South Asia. In fact, studies indicate that over 55 per cent of South Asia’s intra-regional trade potential remains untapped.
While standard economic theory tells us that trade liberalisation would automatically lead to increased opportunities, enhanced production capabilities and overall poverty reduction, it is a well-known fact that historically this has not been so. The Heckscher-Ohlin model predicts that when diff erent economies open to trade, unskilled wages should increase in less skilled labour abundant economies but decrease in skilled labour abundant economies. Trade liberalization policies are expected to reduce wage inequality in developing countries and negatively aff ect the wage structure of the developed countries. However, numerous studies have presented results that are contrary to this conventional wisdom and there exists a large body of literature that demonstrates that the last few decades of increased trade liberalisation has in fact widened the wage gap in both developed and developing countries.
The impact of opening up of trade opportunities has always been diff erent for diff erent groups of people, often exacerbating inequalities in the absence of counteractive measures and barriers. While inequalities exist in many forms – across the rich and the poor, the skilled and unskilled, the urban and the rural –the focus of this research is on the inequality between women and men.
When we add to this mix of trade and gender, the aspect of sustainability in development or “green growth”, some new issues are seen to emerge. The UN Conference on Sustain-able Development held in Brazil in 2012 (Rio +20) solidifi ed the international community’s commitment to building a “green economy”. It also identifi ed trade as one of the key drivers towards this greening of the economies. This renewed focus on sustainable development and the “green sectors” provides the third dimension to this study. This report looks at trade expansion in the “green sectors” in four South Asian economies and how this impacts women.
Using Organisation for Economic Co-operation and Development’s classifi cation of green industries and United Nations Commodity Trade Statistics Database data on exports, the report examines the trends of green exports and the pattern of women’s participation in
Proof 3a IP chk - (Vol. I) UN Women - Gender Dimensions.indd ix 10/7/2015 4:37:09 PM

x Gender, Trade and Green Growth Vol. I
the green industries. The aggregate secondary data analysis is complemented by detailed fi eld based primary data from specifi c industry level studies in the four countries. Specifi -cally, sectoral / industry level case studies were conducted of the agro-processing sector in Bangladesh and Bhutan, ecotourism in Nepal and organic horticulture in India.
Through a rigorous analysis of industry level trade data, the report concludes that green exports form a very small (sometimes even insignifi cant) proportion of total exports for all the countries under consideration. The only exception is Nepal where green exports, comprising largely of agricultural exports, have shown increasing trends over the past decade. However, even though the overall share of green exports from the other three countries has been small, green exports have been on a slow but rising trend since 1989 in all the four countries. In Bangladesh and Bhutan, the share of renewable energy has been increasing over the last ten years. Given the national and international policy push in the green sectors in the years to come, it is expected that the green industries sector will grow further.
Agriculture and agro-processing related exports form the bulk of the four countries’ export basket. This is not surprising given the fundamental nature of these countries – developing economies with a large primary sector. In terms of bilateral trade, India remains the most dominant trade partner for all three countries.
Data on female labour force participation shows that women are engaged in green indus-tries to more or less the same extent as they are in the economy as a whole. This assess-ment is not always borne out by the detailed sectoral case studies which report much higher rates of female participation in green industries. More often than the men, it is the women who are the marginalised farmers, the small horticulturist, the owner of a tiny pickle and jam making home-based enterprise as well as the factory fl oor level worker. This may be because, as has been documented time and again across studies, female participation in conventional labour force surveys is often underreported.
South Asian regional trade in green industries has had both positive and negative eff ects for the women involved in these sectors. On the positive side, increased trade in green indus-tries has allowed women to increase their income, investments and saving and given them a voice in family decision making. However, they continue to be engaged in mostly menial, low-end tasks, earn lower salaries than men and have little or no prospects for growth into better roles.
Going forward, as trade expands in the green sectors, which way the scales may lean in the future could depend signifi cantly on the ability of these country governments to put in place policies that allow women to build on their existing advantages. At the same time, there is need to create safety nets to prevent / mitigate some of the challenges that are arise from the transition to a green economy and with trade expansion.
The report identifi ed some common interventions to ensure that women’s advantages are strengthened and potential challenges mitigated as there is greater trade expansion in the region. These include, but are not limited to, improvement in infrastructure, greater market integration of women producers, their improved access to fi nance, ensuring training and skill enhancement for all female labour and encouraging entrepreneurship among women.
Proof 3a IP chk - (Vol. I) UN Women - Gender Dimensions.indd x 10/7/2015 4:37:09 PM

Abbreviations
ACAP Annapurna Conservation Area ProjectADB Asian Development Bank BAFRA Bhutan Agriculture Food and Regulatory AuthorityBAPA Bangladesh Poribesh Andolon (forum of citizens and organizations)EGS environmental goods and services EU European Union FDI foreign direct investment FGD focus group discussionFLFP female labour force participationGATS General Agreement on Trade in Services GDP gross domestic productGTIA Gender Trade Impact Assessment GW gigawatt ICIMOD International Centre for Integrated Mountain DevelopmentICTSD International Centre for Trade and Sustainable DevelopmentIDS Institute of Development StudiesILO International Labour OrganizationISIC International Standard Industrial Classifi cation (of All Economic
Activities)ISO International Organization for StandardizationKEEP Kathmandu Environment Education Project KII key informant interviewsLDC least developed countryLEDeG Ladakh Ecological Development GroupLFP labour force participationMCCC Mother’s Club Central Committee MFN Most Favoured NationMSMEs micro, small and medium enterprises NATHAM Nepal Academy of Tourism and Hospitality ManagementNIC National Industrial Classifi cationNTB Nepal Tourism Board NTC National Trust for Nature Conservation
Proof 3a IP chk - (Vol. I) UN Women - Gender Dimensions.indd xi 10/7/2015 4:37:09 PM

xii Gender, Trade and Green Growth Vol. I
OECD Organisation for Economic Co-operation and DevelopmentRCI Regional Cooperation and Integration RTA regional trade agreements SAARC South Asian Association for Regional CooperationSAFTA South Asian Free Trade Area SCDP Second Crop Diversifi cation ProjectSHGs Self Help Group SPS Sanitary and Phytosanitary TRPAP Tourism for Rural Poverty Alleviation Program TUS Time Use Survey UAE United Arab Emirates UK United KingdomUN COMTRADE United Nations Commodity Trade Statistics DatabaseUNEP United Nations Environment ProgrammeUNCTAD United Nations Conference on Trade and DevelopmentUNDP United Nations Development ProgrammeUNIDO United Nations Industrial Development OrganizationDCED Donor Committee for Enterprise DevelopmentUSA United States of AmericaWEAN Women Entrepreneurs Association of Nepal WTO World Trade Organization
Proof 3a IP chk - (Vol. I) UN Women - Gender Dimensions.indd xii 10/7/2015 4:37:09 PM

Introduction
The current international and regional trading system is based on the premise that trade policies – like all other macroeconomic policies are gender neutral. The assumption is that free trade, with policies aimed at liberalisation and deregulation of
investments, fi nancial markets and private sector would facilitate the process of sustained economic growth and the development of productive capacities. In turn, higher levels of growth and productivity would expand employment opportunities and sustain livelihoods for all, men and women, giving them the same chances of benefi ting from macro-economic policies. Therefore trade policy, along with other macro-economic policies, was perceived as being “gender neutral”. In recent years, the underlying assumption of gender neutrality of trade policies and trade liberalisation, has been questioned – theoretically and empirically. Research and empirical evidence shows that the eff ect of trade policy on economic and social activities tend to be diff erent between men and women as they have diff erent economic and social roles and diff erent access to and control over resources, due to socio-cultural, political and economic factors.1 Pre-existing diff erences between women and men, girls and boys at the micro, meso and macro levels determine the gender diff erential impacts of trade liberalisation. Such diff erences in impact can be analysed at diff erent levels of analysis: (a) sectoral level - in which trade can increase (or reduce) employment and income opportunities for women, depending on whether the sectors where women work, expand or contract as a result of trade liberalisation and import competition; (b) policy level – whether availability of tariff revenues alters public expenditure in sectors that benefi ts women, such as health, sanita-tion, education, household infrastructure and so on; and (c) household level - where indi-viduals and families may change their consumption patterns depending on the availability of consumer goods and changes in prices.
This report examines the impact of international and regional trade expansion on women at the sectoral level, specifi cally women employed in the green sectors. There are several reasons to focus on women’s participation in green sectors to examine the gender impact of trade liberalisation. The post Rio+20 development discourse emphasizes “green economy as one of the important tools available for achieving sustainable development,”�2 and identi-fi es trade as one of key instruments for transitioning to greener economies.3 As countries around the world and in South Asia build mechanisms to adopt and implement the Rio+20 agenda, there is likely to be a spurt in green sectors and green jobs. However, prevailing gender diff erences in education and fi elds of study are a major obstacle to women’s mean-ingful and equal participation in the green sectors. In most countries, the skills and profes-
1 See for instance, IANWGE, 2011.2 Rio +20 Outcome Document, 20123 It stresses the importance of several factors, including: Achieving progress on trade-distorting subsidies and
trade in environmental goods and services (UN 2012, paragraph 281); and Establishing enabling environments for the development, adaptation, dissemination, and transfer of environmentally-sound technologies, while noting the role of foreign direct investment, international trade and international cooperation in the transfer of environmentally sound technologies (UN 2012, paragraph 271);
CHAPTER
1
Proof 3a IP chk - (Vol. I) UN Women - Gender Dimensions.indd 13 10/7/2015 4:37:09 PM
2 Gender, Trade and Green Growth Vol. I
sions identifi ed as particularly relevant for the green economy tend to be male-dominated.4 In order for women to take advantage of the opportunities of the expansion in demand from green industries and regional trade openness, structural and economic changes are needed and no single blueprint approach will fi t each context and set of national priorities.
This study examines the impact of international and regional trade liberalisation on women in the green sectors in Bangladesh, Bhutan, India and Nepal. Using industry level second-ary data and fi eld based primary data from three green sectors – agriculture, renewable energy and ecotourism – the study fi nds that green exports form a very small (sometimes even insignifi cant) proportion of total exports for all the countries under consideration. The only exception is Nepal where green exports, comprising largely of agricultural exports have shown increasing trends over the past decade. However, even though their share has been small, green exports have been on a slow but rising trend since 1989 in all the four countries. In Bangladesh and Bhutan, the share of renewable energy has been increasing in the last ten years. Given the national and international policy push in the sector in the years to come, it is expected that the green industries sector will grow further.
Agriculture and agro-processing related exports form the bulk of the four countries’ export basket. This is not surprising given the fundamental nature of these countries – developing economies with a large primary sector. In terms of bilateral trade, India remains the most dominant trade partner for all three countries.
Data on female labour force participation (FLFP) shows that women are engaged in green industries to more or less the same extent as they are in the economy as a whole. South Asian regional trade in green industries has had both positive and negative eff ects for the women involved in these sectors. On the positive side, increased trade in green industries has allowed women to increase their income, investments and saving and given them a voice in family decision making. However, they continue to be engaged in mostly menial, low-end tasks, earn lower salaries than men and have little or no prospects for growth into better roles. The report provides some suggestions for ways forwards for multilateral devel-opment agencies, national governments and women’s groups to integrate gender concerns in trade policy and the increase in exports from the green industries.
ObjectiveThe main objective of this study conducted by UN Women, is to develop a knowledge base on gender, trade, and green industries. The overarching objective of this study is to gener-ate evidence on the impact of regional trade integration, especially an expansion of trade in green sectors, on women and to identify ways to address gender concerns in regional trade agreements. As there is a growing interest in green industries as a key driver of economic development, the focus is on the gender aspects of trade from green industries, with the objective of identifying women’s potential niches and increasing their participation in the production, marketing, and trade of green products and services.
The specifi c objectives of the research study, as mentioned in the Terms of Reference, are:
• To identify “green industries”, including their potential markets for trade of both goods and services, as well as their potential for job and livelihood creation for the
4 UN IANWGE, 2011.
Proof 3a IP chk - (Vol. I) UN Women - Gender Dimensions.indd 14 10/7/2015 4:37:09 PM

3Introduction
poor, especially women, which can increase intra-regional trade, in three sectors, namely, organic agricultural produce, renewable energy (e.g., solar, including solar-based hybrid systems and biomass), and ecotourism;
• To conduct a gender analysis of South Asia regional trade, which will identify gender issues and recommend actions at the sub-regional level designed to miti-gate possible negative impacts of trade policy and trade liberalisation on women’s products; and facilitate their participation in intra-regional trade, especially as far as the green industries are involved; and
• To locate entry points for sector and gender specialists to mainstream Gender Equality and Social Inclusion (GESI) in regional trade and cooperation-related projects.
Scope of the StudyThe geographical focus of this study includes the economies of Bangladesh, Bhutan, India and Nepal. The three green sectors that have been identifi ed for detailed analysis are organic agriculture, renewable energy and ecotourism. These sectors were selected from amongst six sectors identifi ed by the UNEP Green Growth and Trade study.5
Structure of the ReportThe consolidated fi ndings from the four countries and the sectoral case studies are presented in two volumes of the report. Volume I presents the synthesis fi ndings across all countries and sectors. Volume II includes sector specifi c reports from the four countries.
The contents of Volume I are organized as follows. Chapter II provides a conceptual overview of the relationship between the three drivers of sustainable development - international trade, green growth and gender; and the proposed methodology and data sources used to analyse tri-directional relationship in the report. The section ends by laying out the key questions examined throughout this research. Chapter III provides a defi nition of green industries used in the report; Chapter IV assesses the patterns of overall trade and trade in green industries using total and bilateral trade data from offi cial sources. Chapter V presents the fi ndings to address the second objective of the research, i.e. a gender analysis of the trade in industries. Chapter VI discusses the factors that determine women’s participation in green industries, specifi cally in the agriculture, renewable energy and ecotourism sectors, through a supply chain analysis of the relevant sectors. It also captures the positive and negative impact of expanding trade in these sectors from a gender lens, and identifi es possi-ble barriers and opportunities to women’s role in these sectors. Finally, Chapter VII summa-rizes the key fi ndings related to the main research questions, and presents ways forward directed at national governments and policy makers, and development practitioners.
Volume II presents the sector specifi c case studies from the four countries. The four sectoral case studies are as follows: agro-processing in Bangladesh and Bhutan; organic horticulture and renewable energy in India; and ecotourism in Nepal. Each sectoral study is a stand-alone report that examines the relevant policies pertaining to that sector, uses primary and second-ary data in the analysis and provides detailed sector specifi c recommendations for integrat-ing gender concerns in the context of expanding exports from the respective sector.
5 UNEP, 2013.
Proof 3a IP chk - (Vol. I) UN Women - Gender Dimensions.indd 15 10/7/2015 4:37:09 PM

Proof 3a IP chk - (Vol. I) UN Women - Gender Dimensions.indd 16 10/7/2015 4:37:10 PM

Trade Liberalisation, Green Growth and Gender Inequality – conceptual and methodological framework
Defi nitionsThe focus of the study is on women’s participation in the green sectors, and green industries (within those sectors). The term green industry was coined by UNIDO (United Nations Industries Development Organization) to describe industrial production that does not come at the expense of natural systems or lead to adverse human health outcomes.6 A green sector is one where most of the industries included within that sector are regarded as “green”. A green economy is an economy that results in improved human well-being and social equity, while signifi cantly reducing environmental risks and ecological scarcities. Green growth is defi ned by the OECD as fostering economic growth and development, while ensuring that natural assets continue to provide the resources and environmental services on which our well-being relies.7 Expansion of green industries and green sectors is a require-ment for green economy and green growth.8
Green industry is therefore an important pathway to achieving sustainable industrial devel-opment. It involves a two-pronged strategy to create an industrial system that does not require the ever-growing use of natural resources and pollution for growth and expansion.9 This study adopts the defi nition of green industries put forward by OECD (1999) and elab-orated by the UNIDO (2011). Based on this defi nition, green industries includes “…goods and services to measure, prevent, limit, minimise or correct environmental damage to water, air and soil, as well as problems related to waste, noise and eco-systems.” The study discusses the defi nition and the related data classifi cation in Chapter III.
6 UNIDO Green Industry Initiative, 2011.7 OECD, 2011.8 Ibid.9 UNIDO, 2011.
Green IndustriesGreen Economy
Figure 1. Green Economy and Green Industries
CHAPTER
2
Proof 3a IP chk - (Vol. I) UN Women - Gender Dimensions.indd 17 10/7/2015 4:37:17 PM

6 Gender, Trade and Green Growth Vol. I
Trade Liberalisation, Green Growth and Gender Inequality – In GeneralExamining the impact of trade liberalisation on gender inequality in the context of green growth poses new issues. In the post Rio+20 scenario, trade liberalisation is seen as a driver of green growth. Previous research cautions that an export-led growth strategy will not automatically provide incentives to developing countries towards a green growth trajectory.10 The impacts on sustainable development of the export-led spur in economic activity will depend on various factors, such as: how the benefi ts from the additional economic activity are distributed; how the additional production impacted the use and quality of natural resources; and how these impacts were or are managed. If the increase in exports is generating economic or social confl icts from the use of natural resources with current users or local communities, the contribution to sustainable development is questionable. Therefore, in order for trade to steer the economy towards a green economy, there needs to be a signifi cant amount of technical and fi nancial investment to support the economies through the transition.11 In this context, there is a need to promote private and public sector investments and South–South cooperation.
The evidence on the impact of trade liberalisation on gender inequality seems less unequiv-ocal. Contrary to the theoretical predictions of the neo classical trade theory, the wage gaps in both developed and developing countries have increased with expanding international trade.12 Extending these fi ndings on trade and worsening inequality to explain the impact of trade on gender inequality, one possible hypothesis is that trade expansion may worsen gender inequality because women are at a diff erent starting point, relative to men, and therefore not in a position to take advantage of the expanding economic opportunities that comes with trade expansion. While trade liberalisation, by itself, may not worsen gender inequality, women may become worse off because of their inability or the lack of opportu-nity to participate fully in the post-liberalisation economic growth process.
Important factors that explain the diff erent starting point for women are “due to diff erent gender roles, the relationship between women and men in society, and women’s unequal access to economic resources (such as land, credit and technology), macroeconomic policy will have diff erent impacts on women and men.”13
The World Bank (2004) notes that an expansion in trade typically leads to increases in labour-intensive exports from developing countries; and that the production of many goods requires “manual dexterity and stamina but not great physical strength.” Employ-ers often prefer to hire women – seen as less demanding and willing to work longer hours. The growth of exports such as garments, shoes, jewellery, and electronics have almost always been accompanied by a signifi cant increase in female wage employment in the formal sector. While it is true that trade tends to increase the availability of wage labour for women, particularly in export sectors, there remain certain factors that severely impede the ability of women to benefi t from this expansion. These include, but are not limited to,
10 UNCTAD, 2010; de Melo, 201211 UNCTAD, 2010.12 Please refer to Aguayo-Ellez 2011, Robbins (1996), Wood (1997), Behrman et. al. (2000), Cragg and Eppelbaum
(1996), Revenga (1997), Hanson and Harrison (1999), Melendez (2001), Feliciano (1994), Airola and Juhn (2008), Currie and Harrison (1997), Pavcnik (2003), Attanasio et al (2004); among others.
13 IDS, 2006.
Proof 3a IP chk - (Vol. I) UN Women - Gender Dimensions.indd 18 10/7/2015 4:37:18 PM
7Trade Liberalisation, Green Growth and Gender Inequality – conceptual and methodological framework
discrimination, lower skills, and gender inequalities in access to resources, wage, credit and savings.
In fact, increased trade often rewards skills, and given that in most countries men possess greater skills than women, the wage gap between skilled and unskilled labour may further exacerbate the gender wage gap.14 However, within an occupation, where skills may be relatively homogenised, an expansion in trade may lead to a narrowing of the gender wage gap. “It is generally agreed that women’s education and skill accumulation are the most important factors determining the impact of trade on women’s employment and the gender wage gap. As long as women remain less qualifi ed than men, they are likely to remain in lower paying and less secure jobs, even if better-paying jobs become available through trade expansion.”15 Therefore, key variables that determine the impact of trade on women are often education, skills and access to various resources.
It is also true that women employed in export-oriented manufacturing earn higher wages than they would have in other manufacturing, increasing access to, not just cash in hand but also their status and bargaining power in the household.16 Evidence from the fruit sector in Chile in the 1980s and early 1990s demonstrates that an expansion of the sector on the back of trade expansion off ered women not only opportunities for employment, income and personal fulfi lment that were previously lacking,17 but also allowed them to achieve greater independence and voice within their households and to signifi cantly improve their household’s standard of living.
Garcia et al (2006) note that trade expansion in the agricultural sector often increases women’s “double burden” – the responsibility to earn an income as well as to fulfi l their role as food providers for their household. The role of the food provider is often not possible to meet through the income generated, given the very low wages they receive for their unskilled labour. Government incentive for export promotion, that encourages the use of land and labour for export crop production, often dislocates the small landholding women farmers from the land they tend, for household food production. More importantly, the increased female labour participation in agricultural exports is not associated with greater access to or control of agricultural resources. In Uganda, for instance, a large proportion of women engaged in the export sector are not directly involved in the marketing and do not necessarily benefi t from exports and the household income is often controlled by men in the household.18
Inequalities in access to resources and assets play a critical role in the inequalities in gains from trade. “An important institutional determinant of women’s gains from trade, particu-larly in agriculture, is the extent of their control over land, labour, and the additional income generated by a switch to export crops.”19 Garcia et al (2006) have demonstrated this in their case studies from women’s participation in agriculture in Uganda, Ghana, the Carib-bean and the Philippines.
Interestingly, Carr (2004) suggests that regional trading arrangements are likely to off er opportunities best suited to women (often small-scale producers and traders). They do
14 Oostendorp, 2004.15 World Bank, 2004.16 Ibid; Jarvis, Vera-Toscano, 200417 Rodriguez and Venegas, 1989; Venegas, 1992.18 Garcia et al., 2006.19 World Bank, op. cit.
Proof 3a IP chk - (Vol. I) UN Women - Gender Dimensions.indd 19 10/7/2015 4:37:18 PM

8 Gender, Trade and Green Growth Vol. I
not always need large export markets and may fi nd neighbouring markets more familiar and easier to access. This is particularly relevant in the case of regions where many women have been historically involved in informal cross-border trade. Focusing on inter-regional/sub-regional markets is also a possible response to the overarching issue of global competitive-ness that confronts many small exporters.20
Summarising the arguments, UNCTAD (2010) reviews a number of empirical studies to present the common themes in the impact of trade liberalisation on women:
(a) Increased trade fl ows usually bring about increased employment opportunities for women in export-oriented manufacturing sectors;
(b) Female employment is less stable than male employment - rapid turnover of employees in response to business gains and losses; more part-time and temporary employment of women; more relocations of women employees;
(c) The eff ect of trade liberalisation on the gender wage gap varies with the competi-tiveness of the industry and between countries; and
(d) Increased competition in accessing resources, especially land, often threatens the livelihood of women entrepreneurs in societies that are opening to foreign trade.
Thus, while trade policy may by itself be gender neutral, the impact of trade policy on underlying gender relations is signifi cant. Therefore, there is need for a much more in-depth examination of the gender impact of trade policy to ensure that all sections of the society – rich and poor, men and women - may be in a position to benefi t from trade expansion.
Both green growth and trade liberalisation hold important potential for gender equality– especially small entrepreneurs, producers and farmers, which account for a large per cent of women’s employment in particular in developing countries.21 Together green growth and trade liberalisation can play a major role as they form the foundation for national econo-mies and social development at the grassroots. While widely acknowledged that green growth can move countries towards more a sustainable development path, it is important to manage the social impact of the transition to a greener economy to ensure that all sections of the society benefi t from the change and short run negative impact can be minimised.
The barriers in access and opportunities that keep women away from benefi tting complete-ly from trade liberalisation also aff ect their participation in the green economy. It has been found that gender imbalances in opportunities and access that are valid in the conventional “brown” economy remain equally valid for the green economy.22 A DCED study identifi es fi ve key imbalances that prevent women from fully engaging in and reaping the benefi ts of a green economy.
• Time burden: Women’s “triple burden” of paid work, care and housework severely thwarts their economic opportunities and often leads to them being perceived as less career-oriented than their male counterparts.
• Education: Though the gender gap may be closing in primary education in many countries, women still end up being less qualifi ed for many green economy jobs, often needing technical skills. These include technical roles in alternative energy generation and distribution, managerial and engineering roles in ecotourism and
20 UNCTAD, 2004.IDS (2004).21 UNIDO, 2011.22 DCED, 2008.
Proof 3a IP chk - (Vol. I) UN Women - Gender Dimensions.indd 20 10/7/2015 4:37:18 PM
9Trade Liberalisation, Green Growth and Gender Inequality – conceptual and methodological framework
access to organic certifi cation as agro-entrepreneurs. The skills and professions that have been identifi ed to be particularly relevant for the green economy tend to be male-dominated.
• Labour Market: Women are often found concentrated in low-productivity jobs – working in smallholder farms, micro or small businesses and are overrepresented in the informal sector. This can limit their ability to transition to new technologies and jobs created by the greening of the economy.
• Access to Productive Inputs: They often have very limited access to productive inputs such as the technical know-how, land, fi nances, technology and equipment. Not only the resources but also comprehensive, relevant and timely information on markets, price developments and consumer preferences, which are essential to the running of their business are often found defi cient with women. These obstacles are rooted in market and institutional failures, such as bureaucratic hurdles and discriminatory legal frameworks, property rights or credit provisions.
• Comprehensive Participation of Women: Finally, increased economic participa-tion of women does not automatically lead to gender equality. Access to economic resources does not automatically imply control over them. There exist very funda-mental socio-economic factors and power relations that determine eventually who benefi ts from the larger economic change. In most cases, decisions at household and community level are still taken by men and the deconstruction of gender roles in the economy can lead to increased tensions or even violence in families and communities.
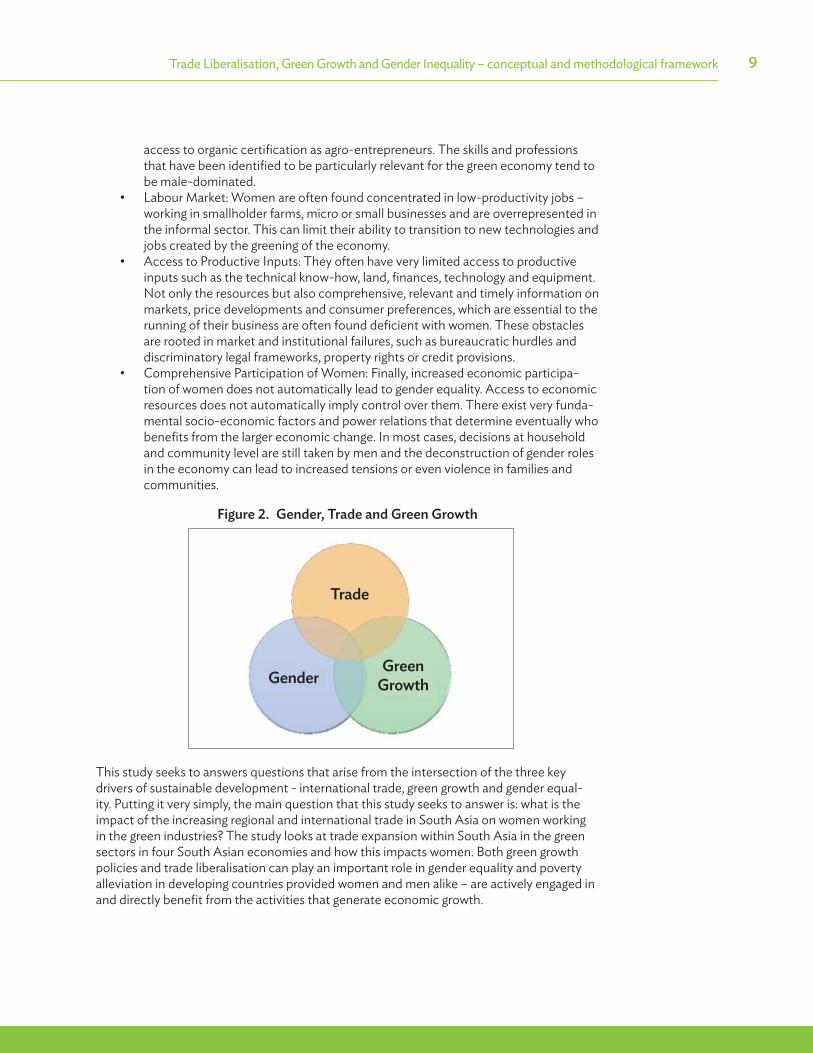
This study seeks to answers questions that arise from the intersection of the three key drivers of sustainable development - international trade, green growth and gender equal-ity. Putting it very simply, the main question that this study seeks to answer is: what is the impact of the increasing regional and international trade in South Asia on women working in the green industries? The study looks at trade expansion within South Asia in the green sectors in four South Asian economies and how this impacts women. Both green growth policies and trade liberalisation can play an important role in gender equality and poverty alleviation in developing countries provided women and men alike – are actively engaged in and directly benefi t from the activities that generate economic growth.
Figure 2. Gender, Trade and Green Growth
Trade
GenderGreen
Growth
Proof 3a IP chk - (Vol. I) UN Women - Gender Dimensions.indd 21 10/7/2015 4:37:18 PM

10 Gender, Trade and Green Growth Vol. I
Underlying AssumptionsBefore proceeding, it is important to clearly state the underlying assumptions and caveats for this research. One, during the course of the research a number of sectors may be identi-fi ed as green sectors. However, due to limited time and resources, a detailed sectoral analy-sis was only performed for the three green sectors that have been identifi ed in the terms of reference. Similarly, during the analysis of inter and intra-regional trade non-green sectors emerged as being better for promoting women’s participation. However, since the focus of this study is on promoting women’s participation in the green sectors, the study limits itself to the green sectors. Third, the policy focus on “greening the economy” is assumed to be exogenous. The starting point of this study is not whether a country should put in place policies that promote green growth. Instead, this study examines the implication of such a policy on women’s participation, particularly during a period of rapid trade expansion.
Methodology and DataThe main research questions to emerge from the scope of the study are as follows:
1. What are the green industries within the three sectors identifi ed in this study – organic agricultural produce, renewable energy and ecotourism sectors?23
2. What are the trends in trade and employment in the green industries?3. What is the pattern of women participation and employment in the green industries?4. What is the impact on women of increasing trade in the green industries? What are
the factors that aff ect women’s participation and employment in expanding trade in the green sectors?
Based on an analysis of these four question, the report identifi es the channels and mecha-nisms through which an expansion in trade in the green industries impacts women; what can be done to encourage (or mitigate) these impacts. Since the report encompasses four countries while simultaneously synthesising lessons and fi ndings across all sectors and for the region, the analysis takes places at two levels – cross-industry macro level and industry level within one country. As expected, the sources of data for the two levels of analysis vary. Macro analysis relies on secondary data on select indicators from a list of internationally recognised data sources. While a rigorous quantitative analysis of macro level secondary data gives us an excellent overview of the key issues and allows us to make some signifi cant policy conclusions; a more nuanced analysis is required to understand issues that are specifi c to each of green industries in the four countries. For this purpose, the secondary data analysis is complemented by primarily qualitative studies at sector or industry level in the four countries. These studies aim to tease out stories and insights that may be other-wise hidden by big datasets. The industry or sectoral level analysis relies on a mix of sector/industry level secondary data and primary data (using interviews and group discussions with key stakeholders) located in a sector within one of the four South Asian countries.
Annex 4 presents the detailed research matrix outlining the list of primary questions, sub-questions, type of analysis and data sources. Figure 3 depicts the research design for this project, identifying the unit of analysis and the source of data at each level. Industry specifi c
23 A distinction is noted at this point between a sector and an industry. A sector includes a set of industries; while industry is a set of fi rms.
Proof 3a IP chk - (Vol. I) UN Women - Gender Dimensions.indd 22 10/7/2015 4:37:19 PM

11Trade Liberalisation, Green Growth and Gender Inequality – conceptual and methodological framework
case studies answer the set of research questions identifi ed above in the context of the specifi c industry. In synthesising across sectors and countries, eff orts have been made to integrate evidence from the sectoral studies with the macro level data. Barriers and oppor-tunities to women’s participation are identifi ed in green industries and analysed using the supply chain analysis approach of select sectors.
The key indicators for which industry level secondary data was obtained include: exports (total and bilateral); imports (total and bilateral); total production or output; fi xed capital; wages; and labour force participation. To the extent possible, sex-disaggregated data on wage and labour force participation was collected. Annex 5A shows the list of secondary data sources and annual coverage for each variable of interest. Trade data is obtained from UN COMTRADE database, except when looking at country-level aggregate trade fi gures. For this purpose UNCTAD trade data was used. COMTRADE data provides the most comprehensive coverage across all four countries. Industry level data on quantity of imports, exports and tariff is avail-able from 1989–2012 for all four countries at the 6-digit Harmonized System (HS) 1992.24
Data on industry level variables such as employment, female employment, production output, value added and wages at the ISIC (Rev. 3) at the 1-, 2-, 3- and / or 4-digit was obtained for Bangladesh, Bhutan, India and Nepal. Wherever possible, this data was also obtained from national sources. The most micro level and widest data coverage is available for India – industry level data on all key variables is available at the 3-and 4-digit NIC (national indus-trial classifi cation) code from the Annual Survey of Industries. In Bangladesh, Bhutan and Nepal, this data was obtained from the national labour force surveys.
This study computes a female intensity of exports metric to measure the monetary value of women’s share of exports and traces the changes in female contribution towards total exports and exports from the green sectors.25
24 The Harmonized Commodity Description and Coding System generally referred to as “Harmonized System” or simply “HS” is a multipurpose international product nomenclature developed by the World Customs Orga-nization (WCO). It comprises about 5,000 commodity groups; each identifi ed by a six digit code, arranged in a legal and logical structure and is supported by well-defi ned rules to achieve uniform classifi cation. The system is used by more than 200 countries and economies as a basis for their Customs tariff s and for the collection of international trade statistics. Over 98 % of the merchandise in international trade is classifi ed in terms of the HS. (World Customs Organization http://www.wcoomd.org)
25 (Details provided in Box 1, chapter 5)
Figure 3. Research Design
Proof 3a IP chk - (Vol. I) UN Women - Gender Dimensions.indd 23 10/7/2015 4:37:19 PM

12 Gender, Trade and Green Growth Vol. I
In cases where the data was missing, we imputed missing values to get a continuous time series. Further, if there appeared to be signifi cant outlier, these were also removed using standard statistical methods. Details on treatment of missing values and outliers is present-ed in Annex 5B. Annex 5A shows the number of observations (N) at the industry level where imputation for missing values was undertaken.
To enable industry level analysis, trade data from the UN COMTRADE at the 6-digit level was merged with the industry level data at ISIC 4 digit. A note on the steps in mapping trade data with industry level data on other variables of interest is presented in Annex 5C.
Data from UN COMTRADE was classifi ed into green industries at the 6-digit HS classifi ca-tion. This was matched to the 4-digit ISIC data on output, number of workers and labour force participation (LFP). In cases where data was used from national sources (for instance Annual Survey of Industries in India), the data from the national industrial classifi cation was matched to the relevant 2-digit or 4-digit ISIC. This allowed us to obtain time series data on export, imports, output, and key labour participation variables. Details on the identifi cation and classifi cation of industries in green and non-green is discussed in the next chapter.
Proof 3a IP chk - (Vol. I) UN Women - Gender Dimensions.indd 24 10/7/2015 4:37:19 PM

Identifying Green Industries and the Pattern of Trade from Green Industries in South Asia
The fi rst key question to be addressed by this study is the identifi cation of green industries. The study uses as its starting point, the defi nition of green industries as suggested by the OECD/Eurostat Informal Working Group on the Environment
Industry (OECD 1999) in their defi nition of environmental goods and services (EGS). OECD (1999) defi nes ESG as “The environmental goods and services industry consists of activities which produce goods and services to measure, prevent, limit, minimise or correct environmental damage to water, air and soil, as well as problems related to waste, noise and eco-systems. This includes cleaner technologies, products and services that reduce envi-ronmental risk and minimise pollution and resource use.” The OECD manual represents one of the fi rst attempts to defi ne and classify the green industries at the international level.
Specifi c goods and services within these categories have been identifi ed at the 6-digit HS commodity classifi cation level. It is worth pointing the international debate around the adoption of OECD EGS defi nitions and classifi cations for trade purposes tends to converge on the idea that the OECD proposals do not present a “one size fi ts all” solution. One argu-ment central to this idea is that most of the EGS included in these lists are support goods and services, either for pollution control or for natural resource management, as opposed to products and services derived from sustainable activities. Another argument is that most of the EGS from the OECD lists rely on capital-intensive technological solutions to environmental problems, and present a comparative advantage to developed countries in the international trade context. Moreover, some of the categories and sub-categories from these classifi cations are not suffi ciently disaggregated in areas in which developing coun-tries could obtain the largest gains from trade liberalisation (such as agriculture).
As a result, the process of matching the OECD EGS classifi cation to the national database from South Asia was not straightforward. The defi nition and the type of industries vary from country-to-country according to their particular circumstances. For instance, there is no separate category for ecotourism or organic agriculture in Nepal and Bhutan. Therefore, following ICTSD (2005), this study broadened the defi nition of green industries to include industries that can be considered “close to green”.26
Since the OECD list was originally developed for analytical purposes, the classifi cation of green industries is indicative (not exhaustive) and gives room to incorporate a broader defi nition of green products and services depending on the country scenario. Therefore, in
26 ‘Close to Green Goods’: Following Hausmann and Klinger (2007) and Dutz (2012), the proximity between a pair of goods is defi ned as the conditional probability of exporting one given that the other is exported. For instance, the proximity of Good A to Good B is 0.5 if as observed in international trade data, the conditional probability that a country exports Good A given that it exports Good B is 0.5. For every green 6-digit HS category, we measure its proximity to all other 6-digit HS categories using COMTRADE data on international trade, averaged over 2005–2008. We classify a product as being ‘close to’ green if there is some green product with a proximity of 0.9 or higher to it. Thus, the probability that a country exports at least one green product given that it already exports a close-to-green product is 90 percent or higher. We then measure the volume of trade in close to green products using COMTRADE.
CHAPTER3
Proof 3a IP chk - (Vol. I) UN Women - Gender Dimensions.indd 25 10/7/2015 4:37:19 PM

14 Gender, Trade and Green Growth Vol. I
addition to the close to green goods, ICTSD suggested a broader defi nition of EGS under the OECD resource management category to include goods and services grown, extracted, manufactured and provided following sustainable criteria at all or some stages of their life cycle (ICTSD, 2005). Certain goods that include environmental quality support goods and services (such as water waste management, air pollution control services), and envi-ronmental consumer goods (such as sustainable tourism and forestry products) are thus included in the defi nition of green industries.
Overall, the analysis included in this report uses (1) green industries relevant to three sectors, i.e. renewable energy, organic agriculture and ecotourism; and (2) industries covered by OECD’s defi nition of green and close to green industries. This resulted in the identifi cation of subset of industries as “green” at the country level. Using this list, we classifi ed the 6-digit UN COMTRADE database into green industries. This method led to the identifi cation of 1043 industries (at 6 digit HS level) as green out of the total 3247 industries in Bhutan; 5236 indus-tries in Bangladesh; 5560 total industries in India; and 4994 total industries in Nepal. Annex 6 shows the total number of industries that are classifi ed as green using the OECD classifi cation.
Subsets of the list of green industries were covered in greater depth by the four industry sectoral studies. The industry or sector level case study fi ndings have been integrated with the cross industry analysis using the methodology discussed above. The industries identi-fi ed by each country study are as follows.
It is important here to note that owing to defi nitional issues arising from strict rules regard-ing their certifi cation, farming and related businesses in many developing countries (includ-ing those studied for the purpose of this report) can often not be labelled as “green or organic” as such even though they are on carried out in the most sustainable ways possible e.g. with little or no chemical intervention, using only indigenous seed varieties and utilising practices that are clearly environmentally friendly, such as the use of solar power to run the entire enterprise. It was thus impossible to even fi nd industry classifi cation in many of these countries that pertained specifi cally to organic agriculture. All agriculture has thus been included in the segment. The same problem arises with eco-tourism and thus when studied at the country level, all tourism has been included in the segment.
Industry/Sector Case StudiesAnnex 7 presents a comprehensive description of the sectoral case studies, the rational for selection and their data sources. The selection of the industry or sector was based on the criteria that it brought together the three elements of gender, trade and green growth. All sectors and industries chosen for the purpose of these studies are signifi cant employers of women, demonstrate strong export potential and fall under one of the three green sectors identifi ed for detailed analysis in this study. Based on the above criteria, the following detailed sectoral case studies have been conducted of the following industries:
• Ecotourism industry in Nepal• Agro-processing industry in Bhutan and Bangladesh • Renewable energy and organic horticulture in the Ladakh region of India.
Each sector case study presents an extensive literature review, placing in context its fi ndings and the concerns of its chosen industries. Primary data has been collected by visiting facto-ries, farms, relevant government offi ces and other sites of activity, conducting focus group
Proof 3a IP chk - (Vol. I) UN Women - Gender Dimensions.indd 26 10/7/2015 4:37:19 PM

15Identifying Green Industries and the Pattern of Trade from Green Industries in South Asia
discussion (FGDs) and individual interviews – all with the purpose of gathering both quan-titative as well as qualitative information on the gender, trade and environmental aspects of their chosen sector. Data has been gathered from reliable country-specifi c data sources at the level of the country, the sector as well as the specifi c industry. Detailed discussion of the case studies is presented in Volume II of the report.
Women in the Agro-processing Sector in Bangladesh and BhutanThe industry case study in Bangladesh focuses on agro-processing. In Bangladesh, agri-culture is an important economic sector - domestic demand and the potential for exports, of both agricultural products as well as of processed goods, is high. Within agriculture, horticulture and agro-processing have been identifi ed by Government and other enterprise development programmes as a strong growth sector. The primary destination of horticul-ture exports from Bangladesh are the United States and Europe; although in recent years there has been an increase South Asian regional demand. Agro-processing is part of manu-facturing which accounted for 17.9 per cent of national GDP. Agro-processing accounted for 4.7 per cent of GDP, with only leather, textile and clothing accounting for more (7.9 per cent). In terms of contribution to employment manufacturing accounts for 11.1 per cent of total employment of which agro-processing accounts for 1.1 per cent.27 Only a small portion of the agro-processing is destined for exports (about 3 per cent of GDP).28 Women are involved at various stages of the value chain – from primary producers, to workers in the processing plants, and also as entrepreneurs. However, most women are found in the lower end jobs and number of women entrepreneurs is limited. The main reason for the selection of this sector is because there is a strong potential for direct and indirect employment creation as well as the scope to build the capacity of the skills of the worker.
The Bangladesh case study uses both quantitative and qualitative data (including both one-on-one interviews as well as FGDs with all key stakeholders – including women producers and entrepreneurs, government agencies as well development partners ) to elaborate the fi ndings according to the main research questions. Key policy documents along with minis-try circulars and guidelines were analysed to see how far they address the needs of women, small producers/exporter and regional trade. National statistics have been analysed to bring out trends in production, export and employment. Secondary documents were reviewed to synthesize various agencies and programme experiences on promotion of agri-business and agro-processing, women’s involvement and exports. Finally, this was compared and contrasted with the fi ndings of fi eld visits and interviews. The study identifi es the following as challenges in the process - incomplete and inconsistent data, scattered information, multiple agencies to deal with and making the linkages between micro and macro levels.
The agro-processing subsector in Bhutan encapsulates the parameters of gender, environ-ment as well green displays potential for intra-regional trade in South Asia. In the context of the study in Bhutan, agro-processing industries refer to those activities that transform agricultural and livestock commodities into diff erent forms that add value to the product. These industries, including, but not limited to, fruit juice, pickle, cheese, wine, milk, rice mill-ing and spirit brewery dominate the commercial sector of Bhutan and are mainly operated
27 BBS 2005/6 data28 Ibid.
Proof 3a IP chk - (Vol. I) UN Women - Gender Dimensions.indd 27 10/7/2015 4:37:19 PM
16 Gender, Trade and Green Growth Vol. I
as family businesses, farmer cooperatives and commercial undertakings, both under public and private arrangements.
Bhutan’s agro-processing industries are essentially micro, small and medium scale enterprises spread across the country. They include both primary and secondary processes. Primary processing operations involve activities such as crop cleaning, peeling, drying, milling, grading and packaging. These activities are mainly carried out by farmer cooperatives and transported to the factories as semi-fi nished products. At present, the small-scale farm-ers are not organised and do not have the scale to large scale raw materials needed by the agro-processing companies. Still they serve as critical suppliers to the processing plants. For example, mango cubes, orange pulp, fresh vegetables and rice paddy are sold by the farmers to established secondary industries. Secondary processing operations entail increasing nutritional or market value of the commodity and the physical form or appearance of the commodity by sending it through factory assembly processing and sealing into labelled airtight containers. Examples of secondary processing are rice milling, orange squash, toma-to paste, vegetable seeds packing, pressing juice out of fruits and cheese making.
The agro-processing practices are characterised by manual and batch-type labour- intensive processes with minimal mechanisation. These backyard enterprises produce mainly for the local markets, while few products are also exported. Equipment is usually fabricated using local raw materials and the overall result is rather low productivity and effi ciency. A few export-oriented agro-processing industries are located in the southern belts of the country, capitalizing on cheap imported labour and easy access to raw materials. As women in rural Bhutan are mainly engaged as agricultural workers, home-makers and caregivers, they play a crucial role in this sector and the potential for greening the supply chain in this sector. The overall potential of agro-processing is signifi cant as it can not only increase the value of crops and livestock products of farmers and thus yield higher economic returns; but also create employment and skilled labour, particularly for the women employed in the sector.
The agro-processing case study in Bhutan collected primary information through fi eld visits to agro-processing establishments in Samtse, Bumthang, Paro, Chukha, Sarpang and Thimphu. One-to-one interviews were held with proprietors, offi cials of the enterprise and factory fl oor workers through the use of semi-structured interviews. In addition, focus group discussions (FGDs) were held with offi ce bearers, employees and suppliers. Trian-gulation of information across various sources (secondary information, FGDs, key infor-mant interviews (KIIs), and direct observation) was done to check consistency. The main objective of studying gender and green trade in the select agro-processing industries is to explore factors facilitating women to perform their roles in a cost eff ective methods that will conserve the environment, accelerate sustainable development and consequently lead to the improvement in people’s quality of life.
Organic Horticulture in IndiaA sectoral and industry level analysis was carried out of the organic horticulture sector in India. Within the organic horticulture, the study focused on the cultivation of sea buckthorn in the Leh-Ladakh region of Jammu and Kashmir. The study notes that organic cultivation in India demonstrates tremendous potential for growth because even though the country ranks amongst the top 30 countries in the world in total global area under organic cultiva-tion, it’s only in the top 90 in terms of ratio of agricultural land under organic cultivation to total farming area. On the other hand, India accounts for a signifi cant and increasing share
Proof 3a IP chk - (Vol. I) UN Women - Gender Dimensions.indd 28 10/7/2015 4:37:20 PM

17Identifying Green Industries and the Pattern of Trade from Green Industries in South Asia
of the world’s retail sale of organic foods particularly to the European Union and USA. The area under certifi ed organic management in India has increased nearly 26 times between 2003–2004 and 2009–2010 and nearly a third of its total production is exported. At the same time, most of the farmers in organic farming remain small and marginal farmers – repre-senting the most common type of woman farmer in India. The top three commodities in terms of share of cropped area under organic farming in India are Cotton, Oilseeds, and Fruits and Vegetables, while in terms of production Fruits and Vegetables rank the highest, followed by Cotton (Raw Seed), and Oilseeds including soya. The two states that rank the highest in production of fruits and also vegetables are Himachal Pradesh and Jammu and Kashmir.
The study focuses particularly on the cultivation of sea buckthorn in the Leh-Ladakh region of Jammu and Kashmir. Growing primarily on forest and ‘uncultivable’ land, Sea buckthorn thrives in waste and ‘degraded’ land conditions; being a common property resource chemi-cal fertilisers and pesticides are not applied, therefore the fruit is organic. The organic horticulture case study from India notes that women are engaged extensively at all levels in the cultivation and processing (particularly as women-only Self Help Groups [SHGs]) of this crop and it generates substantial income for them in the region.
The study uses primary and available secondary data sources to assess the current status of women’s involvement in the relevant sectors. Such an approach provides insights into the status of women and whether they have a role in production and household related deci-sion-making, and also helps examine the two way impact between greening and the status of women. Field work, FGDs and interviews form the basis for identifying various hitherto uncaptured components of women’s contribution to economic activities and also potential opportunities both at the national and international levels.
Women’s Participation in Ecotourism in NepalIn Nepal, ecotourism is regarded as a high-growth sector. For a number of years, Nepal has been a popular destination among trekkers and mountaineers. The number of tourists coming into the country has grown exponentially in recent decades. Sustainable tourism appears to be the best way to promote economic development while addressing socio-political discriminations; and simultaneously preserving natural environment, community culture and heritage. However, the tourism available in Nepal are not used optimally for the benefi t of tourists or tourism operators. There is an opportunity for tourism operators, and local and national benefi ciaries to develop new and innovative models of tourism to deliver more equitably distributed benefi ts. One of the objectives of Nepal’s tourism policy is to develop and expand the tourism industry by promoting the natural, cultural and human environments of the country. Although there is no specifi c mention of ecotourism in the policy, it does contain a policy for sustainable development of the tourism sector, which can be interpreted as the recognition of the importance of ecology and the overall equitable socioeconomic environment while promoting tourism.
Ecotourism in the country manifests as ‘green-based’, i.e., culturally and environmentally sound; and women’s participation in ecotourism is higher compared to other trade initia-tives. As the sector expands, it needs to be studied, investigated, and rigorously analysed to document its impact on women’s economic empowerment.
Tourism is considered as an export industry to the extent that foreign tourists who travel abroad purchase services with money from their home countries. Tourism markets are
Proof 3a IP chk - (Vol. I) UN Women - Gender Dimensions.indd 29 10/7/2015 4:37:20 PM

18 Gender, Trade and Green Growth Vol. I
governed by national regulations. Liberalisation of trade in tourism and travel-related services can also take place through the General Agreement on Trade in Services (GATS) of the World Trade Organization (WTO), at the multilateral level, as well as through regional trade agreements (RTAs) covering trade in services at the regional level. Regulatory commitments under such agreements can play a signifi cant role in promoting tourism, including intra-regional tourism among developing countries. (UNCTAD 2010).
Using individual level survey data; in-depth interviews with tour operators, hotel owners and government agencies; and secondary data on tourism trends; the ecotourism study employs a mix method approach to examine women’s participation in the tourism sector in Nepal.
Proof 3a IP chk - (Vol. I) UN Women - Gender Dimensions.indd 30 10/7/2015 4:37:20 PM

Pattern of Trade in Green Industries
Trade Trends and Policy Overview in South AsiaThe South Asia region has steadily demonstrated robust growth even in the early years of the global fi nancial crisis, with a gross domestic product growth rate ranging from 7.5 per cent in 2009 to 6.6 per cent in 2012. However, South Asia’s positive economic outlook is threat-ened by changes in external markets, including the sovereign debt crisis in the euro-zone which could weaken global demand and aff ect global value chains. This can be mitigated by strengthening intra-regional trade and increasing domestic demand.
While regional economic cooperation is seen as one route towards economic growth, data shows that, of the region’s total trade volume of USD 517.5 billion in 2007, only 4 per cent was in intra-regional trade. The region continues to be regarded as the least integrated region of the world, accounting for 2 per cent of world exports and 1.7 per cent of global foreign direct investment (FDI) as of 2008.29 Just 5.4 per cent of its trade is intra-regional, compared with 26.4 per cent in Southeast Asia and 51 per cent in East Asia. Intra-regional trade accounts for an average of just 2 per cent of gross domestic product, compared with 20 per cent in East Asia.
The countries in the region have restrictive policies toward each other that amount to non-tariff barriers to trade. These take the form of ineffi cient customs clearing procedures and delays, transit restrictions, or disallowing each other’s vehicles from traveling within their borders. In addition, services and a large number of agricultural products are excluded from bilateral trade agreements. There are several potential sectors that can be harnessed for boosting regional trade. For instance, power sector has the potential to be pushed in regional trade agreements, since Bhutan and Nepal have hydropower resources far in excess of their requirements, while other countries in the region suff er power shortages.30
However, the region is unable to realise its full potential for trade due to inadequate infra-structure for power generation and cross-border transmission, which calls for substantial fi nancial investment and greater regional cooperation. Sensitive geopolitical and security issues also lead to limited cooperation in the region.
It is increasingly recognised that regional cooperation can play a signifi cant role in achieving long-term development objectives of South Asian countries. By deepening regional coopera-tion, the region can exploit the economies of scale and cost advantages resulting from the large regional market, sustained economic growth rates and continued reduction in poverty.
29 ADB, 2011.30 See for instance a concept note on Hydropower in Bhutan. Available at http://www.un.org/esa/sustdev/sdissues/
energy/op/hydro_tsheringbhutan.pdf
CHAPTER4
Proof 3a IP chk - (Vol. I) UN Women - Gender Dimensions.indd 31 10/7/2015 4:37:20 PM
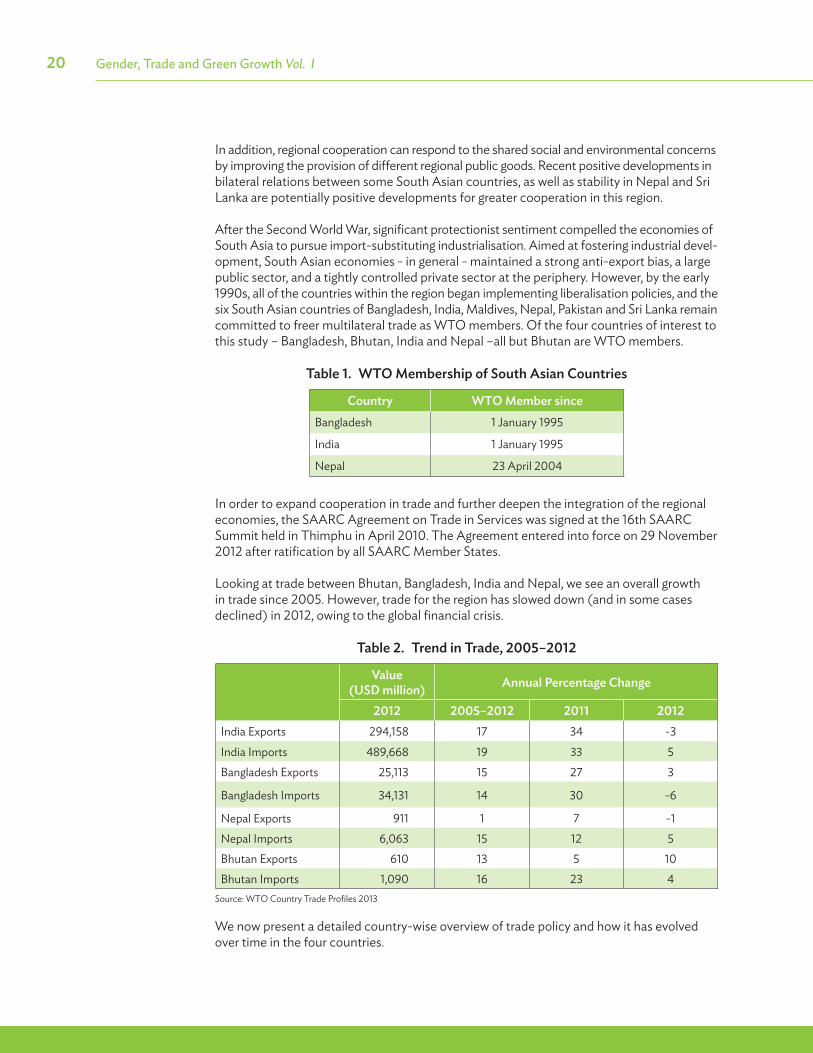
20 Gender, Trade and Green Growth Vol. I
In addition, regional cooperation can respond to the shared social and environmental concerns by improving the provision of diff erent regional public goods. Recent positive developments in bilateral relations between some South Asian countries, as well as stability in Nepal and Sri Lanka are potentially positive developments for greater cooperation in this region.
After the Second World War, signifi cant protectionist sentiment compelled the economies of South Asia to pursue import-substituting industrialisation. Aimed at fostering industrial devel-opment, South Asian economies - in general - maintained a strong anti-export bias, a large public sector, and a tightly controlled private sector at the periphery. However, by the early 1990s, all of the countries within the region began implementing liberalisation policies, and the six South Asian countries of Bangladesh, India, Maldives, Nepal, Pakistan and Sri Lanka remain committed to freer multilateral trade as WTO members. Of the four countries of interest to this study – Bangladesh, Bhutan, India and Nepal –all but Bhutan are WTO members.
Table 1. WTO Membership of South Asian Countries
Country WTO Member sinceBangladesh 1 January 1995
India 1 January 1995
Nepal 23 April 2004
In order to expand cooperation in trade and further deepen the integration of the regional economies, the SAARC Agreement on Trade in Services was signed at the 16th SAARC Summit held in Thimphu in April 2010. The Agreement entered into force on 29 November 2012 after ratifi cation by all SAARC Member States.
Looking at trade between Bhutan, Bangladesh, India and Nepal, we see an overall growth in trade since 2005. However, trade for the region has slowed down (and in some cases declined) in 2012, owing to the global fi nancial crisis.
Table 2. Trend in Trade, 2005–2012
Value(USD million) Annual Percentage Change
2012 2005–2012 2011 2012India Exports 294,158 17 34 -3
India Imports 489,668 19 33 5Bangladesh Exports 25,113 15 27 3
Bangladesh Imports 34,131 14 30 -6
Nepal Exports 911 1 7 -1Nepal Imports 6,063 15 12 5Bhutan Exports 610 13 5 10Bhutan Imports 1,090 16 23 4
Source: WTO Country Trade Profi les 2013
We now present a detailed country-wise overview of trade policy and how it has evolved over time in the four countries.
Proof 3a IP chk - (Vol. I) UN Women - Gender Dimensions.indd 32 10/7/2015 4:37:20 PM

21Pattern of Trade in Green Industries
BangladeshSince 1992 Bangladesh has continued to make eff orts to simplify and rationalise its trade regime; and the customs tariff emerged as its main trade policy instrument.31 Post 2000, Bangladesh pursued prudent structural reforms in priority areas and trade liberalisation with positive results on growth and foreign direct investment infl ows.32 Nevertheless, development constraints persisted such as infrastructure bottlenecks, and institutional and other policy limitations.
By and large there has been a consistent decline in average tariff rate in Bangladesh since the mid-1990. The average customs duty on agricultural products (19.6 per cent by WTO defi nition) consistently exceeded that for industrial goods (14.7 per cent) for all three
31 WTO Bangladesh Trade Policy Review, 2000.32 WTO Trade Policy Review, 2006.
Figure 5. Total Exports and Green Exports - Bangladesh, 1993–2012 (1990 constant USD)
Figure 4. Average Tariff Rates - Bangladesh, 1989–2012
Proof 3a IP chk - (Vol. I) UN Women - Gender Dimensions.indd 33 10/7/2015 4:37:20 PM

22 Gender, Trade and Green Growth Vol. I
review periods. In the past 12 years, ready-made garments have dominated the country’s exports and the US and EU have been their main market.
Bangladesh’s country’s exports have steadily risen between 1989 and 2012, albeit with a stagnant last two years. Over 75 per cent of Bangladesh’s exports went to developed nations in 2012 (United States of America and European Union), with exports being dominated by manufactured items. In 2003, manufacturing accounted for 92 per cent of total merchan-dise exports, up from 77 per cent in 1990. This is vastly diff erent from the situation prevail-ing in the early 1980s when jute and jute products were the principal export items. Among exports of manufactures, Bangladesh has an exceptionally high concentration in textiles and clothing (ready-made garments and knitwear). Ready-made garments comprise mainly low value items and given their predominance in Bangladesh’s exports, any signifi cant change in external market conditions would aff ect this sector.
Figure 6 shows the trend in exports from green industries in Bangladesh. Taken in absolute terms, exports from green sectors33 have increased at a slow rate from 1989 to 2011. However, as a per cent of exports, the share is very small (Figure 5) and has remained more or less constant through the period. The World Bank Enterprise Survey of 2013 identi-fi ed some of the key challenges facing fi rms that seek to expand. These include political instability, inadequate electricity, diffi culties in access to fi nance, corruption, inadequately educated workforce; access to land, tax rates, etc. Political instability not only aff ects fi rms and big businesses, its impact is also felt by small producers and traders, whose goods will rot or the prices will fall. The barriers to trade in the South Asian context include, but are
33 The primary green exports from Bangladesh include rice, high-value crops, including traditional fruits and vegetables, food processing and dried fruit cultivation.
Figure 6. Total Green Exports - Bangladesh, 1989-2012 (1990 constant USD)
Proof 3a IP chk - (Vol. I) UN Women - Gender Dimensions.indd 34 10/7/2015 4:37:21 PM
23Pattern of Trade in Green Industries
not limited to, limited air transportation, a lack of information about the export markets in the region, inadequate facilities for washing, grading, storing, electronic, and weighing, qual-ity testing and international standard packaging. In addition to these there are infrastruc-ture related bottlenecks, inadequate customs and port facilities and cumbersome export process.
BhutanBhutan has moved from a virtually closed economy in 1960 to an economy characterised by a fair degree of openness and a concentration of exports and imports on a single market - India. At the multilateral level, Bhutan is negotiating on its accession to WTO. The Royal Government of Bhutan submitted its application on 6 October 1999, which was accepted by the WTO General Council. Bilateral market access negotiations are ongoing on the basis of revised off ers in goods and services.
At the bilateral level, Bhutan has a free trade agreement with India and preferential trade with Bangladesh. Trade with Bhutan’s largest partners – India and, to a lesser extent, Bangla-desh – is thus conducted within the framework of preferential arrangements; for India, they take the form of free trade agreements. This is important as context because multilaterally agreed tariff s would only apply to trade with non-preferential countries. In 2009, countries other than India and Bangladesh accounted for only 3.3 per cent of Bhutan’s exports and 21.7 per cent of imports. This non-preferential share is even lower if preferential trade with other South Asian countries within the framework of the South Asian Free Trade Area (SAFTA) is taken into account.
Hence, despite relatively high non-preferential Most Favoured Nation [MFN] tariff rates, in practice there is very little or no protection of the domestic economy in the form of import tariff s, since virtually all of Bhutan’s trade is either with India, with which Bhutan has a free trade agreement, or with preferential countries. At present, Bhutan’s customs duties on merchandise imports tend to be relatively high, compared with those prevailing in the region. The simple average of import duties (applied MFN rates) was 21.9 per cent in 2007. Of this, the average for agricultural goods was 41.4 per cent, while rates applied to non-agricultural products were signifi cantly lower (an average 18.9 per cent).
WTO accession would not add much in terms of enhanced market access to developed market economies. Bhutan, as an LDC (least developed country) and irrespective of its WTO status, currently enjoys duty-free access to large export markets. These include the European Union (EU) and Canada. For Bhutan, market access barriers to these export markets are essentially framed in terms of non-tariff barriers, as discussed below.
Given the vulnerabilities that arise from a non-diversifi ed export base and market, a major challenge for Bhutan is to expand its non-hydro exports and diversify its export markets. In Bhutan, some key supply-side constraints to export diversifi cation and competitiveness in agriculture are inherently related to climatic and soil diff erences, including limited availabil-ity of arable land, rough terrain and poor soil quality. Others are related to infrastructural or institutional defi ciencies, particularly with respect to inadequate rural facilities, low-yielding seedlings, the low adoption level of modern technologies, insuffi cient support services, limited access to fi nance and poor farmer linkages. More generally, the weak transport and communication infrastructure is a critical constraint to export diversifi cation. Bhutan also suff ers from high transaction costs associated with customs clearance.
Proof 3a IP chk - (Vol. I) UN Women - Gender Dimensions.indd 35 10/7/2015 4:37:21 PM

24 Gender, Trade and Green Growth Vol. I
A fi nal major constraint and challenge is the low level of technological base and weak education or schooling record, particularly among women. These supply-side constraints are to be assessed in interplay with, and against the background of increasingly stringent requirements in target export markets. These include both technical barriers to trade and sanitary and phyto-sanitary measures, as well as private- sector standards.
Bhutan’s total exports have more or less increased over the period, with a signifi cant jump after 2005–2006. The trade share of GDP (exports plus imports as a percentage of GDP) has remained at about 101 per cent between 2004 and 2008, refl ecting a signifi cant degree of openness. Trade has increased signifi cantly since 2001. The ratio of exports to GDP grew from 0.22 in 2001 to 0.42 in 2008, primarily on account of the sustained increase in the value of hydropower and mineral-based industrial exports to India. During this period, exports from green have gone up marginally from USD 9 million in 1989 to USD 21 million in 1993 to USD 21 million in 1993 (peaking at USD 38 million in 2009). However, as a share of overall export, the percentage of exports from green industries are declined from 12 per cent to 4 per cent in 2012.
A number of factors are noted in the sectoral study on Bhutan’s agro-processing sector presented in Volume II such as inadequate physical infrastructure lowers economy-wide productivity and raises trade costs, and as a result, constrains the country from benefi ting from opportunities off ered by both regional and foreign trade. This becomes particularly relevant for agricultural and related trade as an ageing transport systems separates many people particularly those living in rural Bhutan from urban and outside the country markets. Cold storage and transportation, and other specialised infrastructure required for exporting high value agricultural and good products in many places do not exist.
Figure 7. Total Exports and Green Exports - Bhutan, 1993–2012 (1990 constant USD)
Proof 3a IP chk - (Vol. I) UN Women - Gender Dimensions.indd 36 10/7/2015 4:37:21 PM

25Pattern of Trade in Green Industries
IndiaOf the four economies under consideration, India is the largest economy and the biggest player in international trade, by far. Nearly 80 per cent of the region’s GDP originates in India, with Pakistan and Bangladesh accounting for 10 per cent and 7 per cent respectively. Of the total commodity exports from the four countries, over 90 per cent originates in India. Similarly, of the total imports, over 90 per cent are into India -nearly 70 per cent of Nepal and Bhutan’s total exports are to the Indian market. The other three nations however, play a very small role in India’s total trade.
Table 3. India’s Top 10 Exporting Partners (total value in USD million)
Country 2012–2013(Apr–Sep) % Share
China 28,025.57 11.92UAE 19,622.81 8.35Saudi Arabia 16,094.83 6.85USA 12,208.05 5.19Switzerland 10,779.45 4.59Iraq 9,803.79 4.17Qatar 8,144.45 3.47Kuwait 8,134.73 3.46Germany 7,154.41 3.04Indonesia 6,944.86 2.95
Until the early 1990s, India was a closed economy, with average tariff s exceeding 200 percent, extensive quantitative restrictions on imports, and stringent restrictions on foreign investment.34 The Indian Government initiated a major programme of economic reform and liberalisation in 1991. Reforms in the manufacturing sector were widespread, includ-
34 Available at http://go.worldbank.org/RJEB2JGTC0
Figure 8. Average Tariff Rates - India, 1989–2012
Proof 3a IP chk - (Vol. I) UN Women - Gender Dimensions.indd 37 10/7/2015 4:37:22 PM

26 Gender, Trade and Green Growth Vol. I
ing reductions in average tariff rates, import licensing restrictions for industrial inputs and capital goods and compulsory industrial licensing. However, the agricultural sector and consumer goods trade had remained relatively untouched by government reform eff orts. By 2002, the government had further simplifi ed the tariff , eliminated quantitative restric-tions on imports, and reduced export restrictions. However, the level of protection through the tariff remained relatively high and the anti-export bias inherent in imports and other constraints still remained. To help counteract this anti-export bias, export promotion measures gained in importance. By 2002, all import restrictions maintained for balance-of-payments reasons had been removed and customs tariff had become the main form of border protection.35 Since then, India has continued to streamline customs procedures and implement trade facilitation measures.
Despite the implementation of these measures, India’s import regime remains complex, especially its licensing and permit system, and its tariff structure, which has multiple exemptions, with rates varying according to product, user or specifi c export promotion programme. The average for WTO non agricultural products (8.9 per cent in 2011) has remained considerably lower than the average for WTO agricultural products (33.3 per cent in 2011).
Total exports and exports from green industries have risen dramatically over the past decade in India. Total exports went up from USD 21 billion in 1989 to USD 253 billion in 2012. During the same period, exports from green industries went from USD 370 million to USD 1500 million in 2012. However, the share of green exports are fallen from 2 per cent in 1989 to under 1 per cent in 2012.
It is interesting to note that even though green exports are a mostly insignifi cant and near constant share of India’s total exports, purely from the standpoint of the size of the Indian economy and its export sector, in terms of absolute numbers, India’s green exports far exceed those from the other countries. The organic horticulture case study from India in Volume II notes that the country ranks among the top 30 countries in the world in total global area under organic cultivation and accounts for a signifi cant and increasing share of the world’s retail sale of organic foods particularly to the European Union and USA. India’s
35 WTO Trade Policy Review, 2002.
Figure 9. Total Exports and Green Exports India, 1989–2012 (1990 constant USD)
Proof 3a IP chk - (Vol. I) UN Women - Gender Dimensions.indd 38 10/7/2015 4:37:22 PM

27Pattern of Trade in Green Industries
organic farmers constitute more than 80 per cent of organic farmers in Asia. Currently, India is the second largest producer of fruits and vegetables in the world, its share in world production of fruits and vegetables being 12 per cent and 10 per cent respectively. India also has a huge potential to expand organic cultivation in its Northern and North-eastern regions where farming is mostly done with a very minimal use of chemical inputs and also where farming is already naturally organic.
NepalNepal has the lowest per capita income, highest dependence of population on agriculture and second highest poverty rate among all countries in South Asia.36 At the same time, Nepal has the lowest average tariff s in South Asia. Nepal started to liberalise its trade and investment regime in 1992 and became the fi rst LDC to join the WTO through the full accession process in April 2004. Trade accounts for about 40 per cent of the GDP in Nepal. Nepal has a narrow export basket, and its export market is concentrated in a few countries, led by India. Between 2003 and 2010, the share of merchandise exports in GDP declined from 10 per cent to 5 per cent, while imports more than tripled, pushed by increased consumption due to higher remittances. Lack of diversity of its exports and heavy reliance on remittances from abroad (over 20 per cent of GDP) make the economy very vulnerable to external economic shocks.
Nepal attracts very limited FDI infl ows, largely due to the high cost of doing business and limited investment opportunities. In addition, certain economic activities are reserved for national investors (e.g. fi sheries, cottage (traditional) industries, travel agencies and consul-tancy services).Being a land locked country, trading costs are particularly high in Nepal. The transit of goods through India (mainly the port of Kolkata) to international markets imposes signifi cant shipping costs and delays on Nepalese exporters.
As a proportion of total exports, green exports comprise the largest and growing share of total exports from Nepal. Figure 10 shows that share of exports from green industries varies from 42 per cent in 1989 to 44 per cent in 2012. While in percentage terms the exports
36 Thapa and Roy, 2005
Figure 10. Total Exports and Green Exports - Nepal, 1989–2012 (1990 constant USD)
Proof 3a IP chk - (Vol. I) UN Women - Gender Dimensions.indd 39 10/7/2015 4:37:22 PM

28 Gender, Trade and Green Growth Vol. I
from green sectors are high, the volume of exports in absolute terms is still relatively small – in 1989 the value of exports from green exports was worth USD 161 million and rose to USD 1 billion in 2012. The large share of green exports can mostly be explained by Nepal’s high agricultural and agro-processing exports. Nepalese exporters fi nd it diffi cult to compete in global markets due to weak standardization and conformity assessment infrastructure. Nepal lacks an accreditation system and suffi cient testing facilities. Its traditional agricul-ture exports (such as honey) have been subject to restrictions in the international market.
Intra-regional TradeBilateral trade among the four nations has been dominated by India, and expectedly so. There have been small increases in trade between other neighbours (such as between Bangladesh and Bhutan; and between Bhutan and Nepal) however these are small increas-es. At the same time, of the three trade partners, Bangladesh has consistently been India’s most signifi cant trading partner. The trend carries through all industries except when it comes to green industry imports where imports from Nepal have been greater (except in the last two years) than those from the other two countries. A large part of this may be attributed to India’s high renewable energy imports from Nepal. Detailed charts exploring these relationships are presented in Annex 8.
Interestingly, Bangladesh’s renewable exports to India have been rising in the recent years – albeit forming a very small portion of its total green exports. Even for Bhutan, India is the most important trading partner with Bangladesh and Nepal not even coming close. The relationship appears to be only strengthening over time.
An overview of green exports by the four countries allows us to make the following observa-tions. Green exports form a very small (sometimes even insignifi cant) proportion of total exports for all the countries under consideration, except Nepal. Nepal’s green exports have grown in importance over the years and stood at over 40 per cent of its total exports in 2012. While their share has been small, green exports have been on a slow but rising trend since 1989 in all the four countries. However, while growing; green trade does not form an important share of total trade for all countries, and the rise in exports from green industries has not kept pace with the rise in exports from the other sectors. Given the national and international policy push in the sector in the years to come, it is expected that the sector will grow further. As it stands right now, green exports form a small (and in some cases insig-nifi cant) proportion of the 4 countries’ total exports.
Trends of Trade from Agriculture, Renewable Energy and EcotourismWhen we consider the green industries in greater detail to look at exports from the three industries of interest – agriculture, renewable energy and tourism – the following picture emerges.
Of the three industries of interest, agriculture and agro-processing related exports form the bulk of the four countries’ export basket. This is not surprising given the fundamental nature of these countries – developing economies with a large primary sector.
Proof 3a IP chk - (Vol. I) UN Women - Gender Dimensions.indd 40 10/7/2015 4:37:23 PM
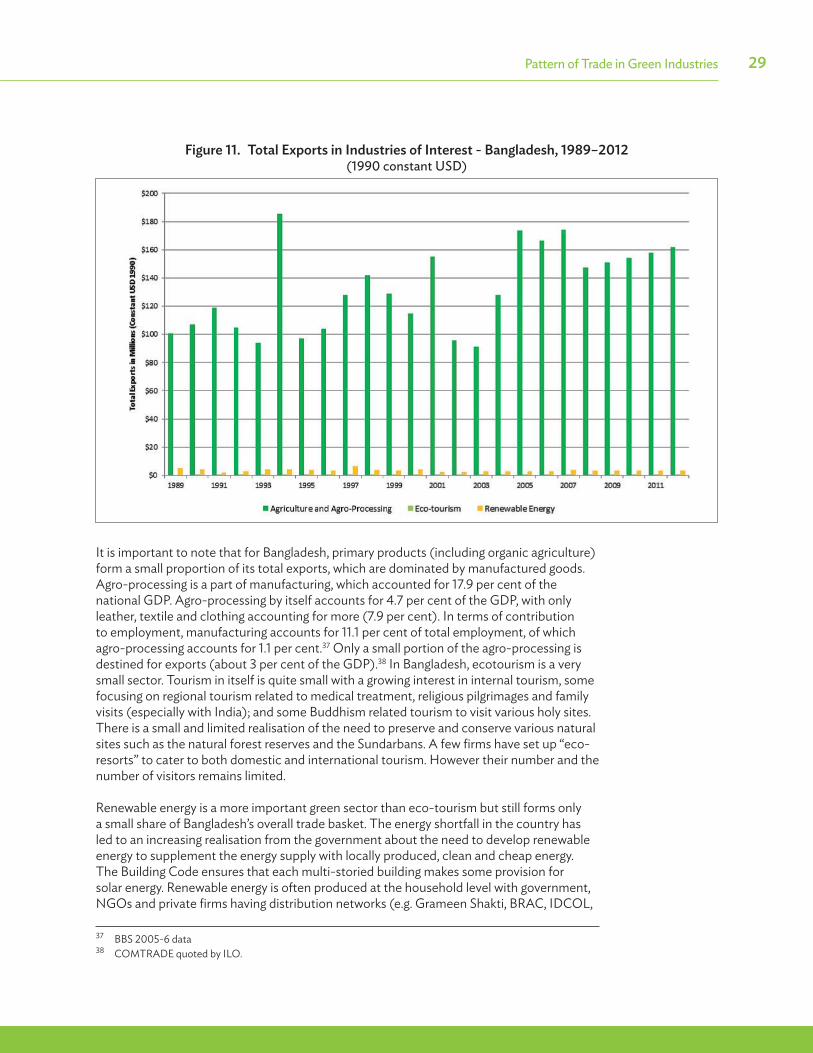
29Pattern of Trade in Green Industries
It is important to note that for Bangladesh, primary products (including organic agriculture) form a small proportion of its total exports, which are dominated by manufactured goods. Agro-processing is a part of manufacturing, which accounted for 17.9 per cent of the national GDP. Agro-processing by itself accounts for 4.7 per cent of the GDP, with only leather, textile and clothing accounting for more (7.9 per cent). In terms of contribution to employment, manufacturing accounts for 11.1 per cent of total employment, of which agro-processing accounts for 1.1 per cent.37 Only a small portion of the agro-processing is destined for exports (about 3 per cent of the GDP).38 In Bangladesh, ecotourism is a very small sector. Tourism in itself is quite small with a growing interest in internal tourism, some focusing on regional tourism related to medical treatment, religious pilgrimages and family visits (especially with India); and some Buddhism related tourism to visit various holy sites. There is a small and limited realisation of the need to preserve and conserve various natural sites such as the natural forest reserves and the Sundarbans. A few fi rms have set up “eco-resorts” to cater to both domestic and international tourism. However their number and the number of visitors remains limited.
Renewable energy is a more important green sector than eco-tourism but still forms only a small share of Bangladesh’s overall trade basket. The energy shortfall in the country has led to an increasing realisation from the government about the need to develop renewable energy to supplement the energy supply with locally produced, clean and cheap energy. The Building Code ensures that each multi-storied building makes some provision for solar energy. Renewable energy is often produced at the household level with government, NGOs and private fi rms having distribution networks (e.g. Grameen Shakti, BRAC, IDCOL,
37 BBS 2005-6 data38 COMTRADE quoted by ILO.
Figure 11. Total Exports in Industries of Interest - Bangladesh, 1989–2012 (1990 constant USD)
Proof 3a IP chk - (Vol. I) UN Women - Gender Dimensions.indd 41 10/7/2015 4:37:23 PM

30 Gender, Trade and Green Growth Vol. I
etc.). However the technology is mainly imported and the hardware is produced abroad. This trade is also not necessarily regional; although SAARC countries are buying electricity from each other – India and Bangladesh from Nepal and Bhutan.
Bhutan’s green exports surged in 2008–2009 largely on account of agriculture and agro-processing and have stayed more or less true to trend since. Figure 12 shows the total exports from the three sectors in Bhutan. Please note that exports of agriculture are shown in millions, ecotourism in USD hundreds and renewable energy in USD thousands in Figure 12. Exports from agriculture average approx. USD 18 million from 1993 to 2012. During the same time period, the share of ecotourism and renewable energy sectors are relatively small – averaging at around USD 1 million.
The case study of agro-processing in Bhutan notes that the government is working towards improving the standard of Bhutanese agricultural products by ensuring that adequate infrastructure for grading, standardization and quality certifi cation is in place through the Bhutan Agriculture Food and Regulatory Authority (BAFRA). While quality control has become an important element of competitiveness in international trade, Bhutan has yet to establish a comprehensive food safety regime. In Bhutan, few industries have attained ISO 9000 certifi cation, which limits its ability to gain access to developed country markets, such as potential markets in the USA, Japan and the EU. Therefore, adequate infrastructure and mechanisms to assess quality and a certifi cation system for exported products are challeng-ing but essential components for Bhutan to increase exports.
Bhutan is also taking steps to strengthen capacity to deliver quality food products by updat-ing food laws and regulations in accordance with Sanitary and Phytosanitary (SPS) require-ments, with a focus on proactive and preventative food quality and safety assurance measures.
Figure 12. Total Exports in Industries of Interest - Bhutan, 1993–2012 (1990 constant USD)
Proof 3a IP chk - (Vol. I) UN Women - Gender Dimensions.indd 42 10/7/2015 4:37:24 PM

31Pattern of Trade in Green Industries
However, increasing investment in strengthening human resources and institutional capacity remain two important challenges to expanding trade in this sector, the national study observes.
Trade logistics are another important barrier to export development in the country. Customs and administrative procedures, organisation and management of shipment operations, tracking and tracing, and the quality of transport and information technology infrastructures are critical to good business environment. A landlocked country encounters particular challenges when it comes to logistics – for example, it takes six hours to drive a distance of 174 kilometres from Thimphu to Phuentsholing. The lack of a sea port makes transport even more expensive.
Bhutan is well endowed with mountains that feed its four main rivers with a potential hydroelectric power generation capacity of 30,000 megawatts, of which 26,000 mega-watts are commercially viable. Bhutan and India signed a series of agreements in 2009 that include agreements on energy trade.
Figure 13 shows that India’s exports in the renewable energy sector have, as a proportion of overall trade, remained small. Energy consumption in Indian households is a mix of non-commercial (fuel wood, dung etc.), commercial (bio- and fossil) fuels and other energy sources based largely on the geographical location, disposable income and local availability. However, the rising price of coal has led to an increasing demand for alternate sources of energy in the form of renewable energy which contributed to 12.2 per cent of the power generation in India in 2011. Jammu and Kashmir, the northern most State of India, has a tremendous potential for the production of renewable energy; its production of renewable energy is 7 per cent, which is signifi cant from the national perspective. Ladakh in particular, can provide a feasible option for renewable energy systems viz. solar, hydro and wind. India was the fi rst country in the world to set up a Ministry of Non-Conventional Energy Resources, in early 1980s. India’s cumulative grid interactive or grid tied renewable energy capacity (excluding large hydro) has reached 29.9 gigawatt (GW),of which approximately 70 per cent comes from wind, while solar power contributed nearly 5 per cent of the renew-able energy installed capacity in India.
Figure 13. Total Exports in Industries of Interest - India, 1989–2012 (1990 constant USD)
Proof 3a IP chk - (Vol. I) UN Women - Gender Dimensions.indd 43 10/7/2015 4:37:24 PM

32 Gender, Trade and Green Growth Vol. I
A detailed analysis of India’s horticulture exports is presented in Volume II. The study shows that eff ort under the National Horticulture Mission resulted in a substantial rise in horticultural production and also in an increase in horticulture exports (Figure 14). Horti-culture exports rose quite dramatically by 110.4 times from USD 1.08 billion in 2006–2007 to USD 119.8 billion in 2007–2008, and increased by 1.5 times from USD 119.8 billion in 2007–2008 to USD 185.5 billion in 2011–2012. The major export partners are Bangladesh, Nepal and UAE for fruits; and Bangladesh, Nepal, UAE, UK and Malaysia for vegetables. Other export partners are Saudi Arabia, Netherlands, France and Singapore.
Figure 14. Horticulture Exports from India, 2000–2012
Figure 15. Total Exports in Industries of Interest - Nepal, 1989–2012 (1990 constant USD)
Proof 3a IP chk - (Vol. I) UN Women - Gender Dimensions.indd 44 10/7/2015 4:37:25 PM

33Pattern of Trade in Green Industries
Exports from the agriculture sector dominates the exports from all other sectors in Nepal. Exports from agriculture ranges from USD 21 million in 1989 to approx. USD 450 million in 2012. Earning from ecotourism shows an increasing upward trend during this period – from USD 2 million to nearly USD 80 million in 2012. Relatively, renewable energy remains a very insignifi cant export sector in Nepal.
To conclude our analysis in this section, we fi nd that green trade is small but growing in the region. In all countries, among the green sectors, agriculture still remains the largest green or “potential to be green” sector. Keeping in mind that the defi nition of agriculture in this study includes agro-processing, this sector presents substantial opportunities for the creation of green jobs in the four countries. Other sectors that have shown promising trends from an export-orientation perspective are ecotourism in Bhutan and Nepal, and organic horticul-ture and renewable energy in Bangladesh and India. Given the policy push in these sector, we expect this growth to accelerate in the coming years.
Proof 3a IP chk - (Vol. I) UN Women - Gender Dimensions.indd 45 10/7/2015 4:37:26 PM

Proof 3a IP chk - (Vol. I) UN Women - Gender Dimensions.indd 46 10/7/2015 4:37:26 PM

Gender Analysis of International and Intra-regional Trade in Green Industries
Trade liberalisation holds potential for inclusive green growth in South Asia, including the equal participation of women through facilitation of access to markets and infor-mation, support for innovation and business adaptation. Whether this potential is
fully achieved depends on a number of factors, which are discussed in the next chapter.
For the purpose of this study, we examine the trends and patterns in women’s participa-tion and employment in the overall trade and trade from green industries in the four South Asian countries. In terms of women’s role in the green sector, data on FLFP39 shows rates that are mostly consistent with economy-wide FLFP rates. In other words, women are engaged to more or less the same extent in green industries as they are in the economy as a whole. This assessment is supplemented by results from the fi eld given in the four country studies – all of which report very high LFP rates for women. Admittedly, this could well be a tautology as the sectors chosen by the country studies are those that have a high participa-tion by women. However, at the same time it remains true that women are engaged widely and in deeply entrenched ways in primary sectors across all developing economies. More often than men, women are the marginalised farmers, the small horticulturist, the owner of a tiny pickle and jam making home-based enterprise as well as the factory fl oor level worker. However, as has been documented time and again their participation in conventional labour force surveys is often underreported.
The rest of this chapter examines women’s participation – both number of workers and labour force participation rates – in the overall trade and trade in green sectors. The metric that is used for assessing women’s participation is the FLFP rate, wage rate and number of women workers. In addition, the report uses a metric to measure women’s share/contribution to the total export as well as exports from green industries called a female intensity of export (Box 2). A more detailed explanation for this is provided in the methodology section of this report. This was calculated for the total exports as well as for the exports from the green industries.
The bulk of the four countries’ exports are from the manufacturing sector. At the same time, barring India, manufacturing continues to be the largest contributor to their imports as well. In this context, we now look at the female labour force participation rate in the four countries, fi rst for the economy as a whole and then in the green industries.
It appears that the female labour force participation in these countries has remained more or less constant over the four years. Within the countries however, we see signifi cant varia-tion. While India demonstrates the least female labour force participation for the economy as a whole, Bangladesh, Bhutan, and Nepal are all signifi cantly ahead with Nepal emerging as the most inclusive (at 54 percent FLFP rate).
39 Female Labour force participation rate is the proportion of the female population ages 15 and older that is economically active: all females who supply labour for the production of goods and services during a specifi ed period.
CHAPTER5
Proof 3a IP chk - (Vol. I) UN Women - Gender Dimensions.indd 47 10/7/2015 4:37:34 PM

36 Gender, Trade and Green Growth Vol. I
Table 4. Female Labour Force Participation, 2009–2012
Country 2009 2010 2011 2012
India 30 29 29 29
Bangladesh 57 57 57 57
Bhutan 66 66 66 66Nepal 58 57 55 54
Source: (http://data.worldbank.org/indicator/SL.TLF.CACT.FE.ZS)
Box 1. Measuring Women’s Unpaid Work
While LFP rates are used to analyse women’s participation in the workforce, it is important to understand the limitations of this approach. It is widely recognised that a large part of women’s work is of an unpaid, informal nature – confi ned to the home and often in the form of domestic care work. Therefore, FLFP rate will be an underestimation of the actual contribution that women make to the economy. Given the emerging fi ndings from this research, it seems clear that in spite of the fact that they operate in diff erently geo-political circumstances, in varied sectors and capacities, the situation of women in Nepal, Bhutan, India and Bangladesh engaged in the green economy is not dissimilar. This work includes, but is not limited to, housework; providing care at home for children, the sick and disabled, the elderly ; community based volunteering, subsistence farming; fi shing and hunting; irregular, very short-term, and sporadic types of employment. Feminist economists have long argued that “the macroeconomic dimension of economies cannot be fully understood without brining unpaid work into the picture” (Floro, Grown, & Elson, October 2011). It is understood that a well-designed time use survey (TUS) would allow us to cover work in the activities that standard labour force indicators do not ad-equately capture.
Of the four countries in this report, limited time-use data is available from India, Nepal and Bangladesh. The Nepal and Bangladesh time-use data is fairly comprehensive, whereas the time-use data from India is not current and not representative of the whole economy. In case of Bhutan, time use surveys have not been administered by a government or public entity at a large scale. However, few studies by individual researchers have focused on capturing the phenom-enon of ‘time use’ ( Galay, n.d.).
However, there are several challenges in the practical use of TUS data in a study of this scale. Budlender (2007) points out that existing time use data have inconsistent defi nition of work and are time consuming. Further, data from two countries are not necessarily comparable, making it diffi cult to use this data for cross country analysis. Finally, as Hirway (n.d.) observes, the concepts and methods of conducting these surveys are internationally or even nationally uniform, limiting their respectability in mainstream statistics and policy making.
Proof 3a IP chk - (Vol. I) UN Women - Gender Dimensions.indd 48 10/7/2015 4:37:42 PM

37Gender Analysis of International and Intra-regional Trade in Green Industries
Table 5. Sectoral Distribution of the Labour Force in Bangladesh, Bhutan, India and Nepal
1990 2011
Female Male Female MaleINDIA�Agriculture 72 56 65 46�Industry 12 17 18 24�Services 15 27 17 30BANGLADESH�Agriculture 85 54 – –�Industry 9 16 – –�Services 2 25 – –BHUTAN�Agriculture – – 68 53�Industry – – 9 10�Services – – 24 37NEPAL�Agriculture 91 75 – –�Industry 1 4 – –�Services 8 20 – –
Source: World Bank, The Little Data Book of Gender 2013
It is evident from the above table that in all four countries, women are mostly employed in agriculture and are signifi cantly underrepresented in the industrial sector. (2011 data is not available for Bangladesh and Bhutan but looking at India and Nepal, it seems unlikely that a large shift in the pattern will emerge.) These fi ndings complement the fi ndings of previous studies that show that while women are entering the workforce in increasing numbers, their labour force participation rate remains stagnant or falls in some cases40. Researchers have repeatedly noted the “feminization of the workforce” in South Asia.41 However most of the increase in female participation is concentrated in the informal sector. In Bangladesh, from the mid-eighties to the nineties the labour force increased 1.6 times and the female labour force from 2.54 million to 10.02 million. This is a tremendous increase even after account-ing fora risk of under-representation.42 Also the proportion of new female entrants engaged in paid employment has increased from 55 per cent in the period between 1983–1984 and 1995–1996 to 65 per cent in the later period between 1995–1996 and 1999–2000.43
A common trend observed in other countries is that the expansion of the export oriented manufacturing section creates opportunities for wage employment for women. While it may be undesirable, and not a view endorsed by the report, employers often regard women’s ‘comparative advantage’ as a docile and less skilled labour force, willing to work
40 See for instance, Mahmud, 2003.41 Mahmud and Kabeer, 200442 Mahmud, 2003.43 Ibid.
Proof 3a IP chk - (Vol. I) UN Women - Gender Dimensions.indd 49 10/7/2015 4:37:42 PM

38 Gender, Trade and Green Growth Vol. I
under fl exible labour conditions in export-oriented manufacturing is well documented.44 Feminization of the labour force has been linked to liberalised trade regimes by these studies. It is argued that to keep costs down employers hire women instead of men. In the inter-national context the increased entry of women into the workforce is also seen as a sign of worsening incomes forcing women to earn an income.
Thus even while export competitiveness of these countries lies signifi cantly in their manu-facturing sector, low representation of women here means that we cannot automatically assume that an expansion in trade will enhance opportunities, incomes and the quality of life for women.
Female Participation in Green IndustriesLooking at the average FLFP rate across Bangladesh, Bhutan and India, we fi nd that the highest FLFP rate in the green industries are in Bangladesh (averaging over 40 per cent between 1993–2012); followed by Bhutan (averaging approximately 25 per cent between 1989–2012) and the lowest FLFP rate is in India (averaging around 10 per cent between
44 Ibid.
Figure 16. Average Female Participation in Green Sectors - Bhutan, 1993–2012
Figure 17. Average Female Participation Rate in Green Industries - Bangladesh, 1989–2012
Proof 3a IP chk - (Vol. I) UN Women - Gender Dimensions.indd 50 10/7/2015 4:37:42 PM

39Gender Analysis of International and Intra-regional Trade in Green Industries
1989–2012). As mentioned in our discussion on women’s unpaid work and time use data, the statistics are probably undercounting women’s work. The primary data collected on women in the horticulture corroborates this – the case study of the seabuckthron cultiva-tion and harvesting in India showed that the work is exclusively performed by women in this industries. (Discussed in details in the next chapter.)
Of the total workers employed in green industries, Bhutan employs the largest proportion of women. In 2012, 62 per cent of the total employees in Bhutan’s green industries were women, as opposed to 32 per cent in Bangladesh and a mere 19 per cent in India. This share has increased signifi cantly since 1989 for all three countries. In the absence of Nepal LFS data, we cannot carry out this analysis for Nepal.
Figure 18. Average Female Participation in Green Industries - India, 1989–2012
Figure 19. Male and Female Wages - India, 1989–2012(1990 constant USD)
Proof 3a IP chk - (Vol. I) UN Women - Gender Dimensions.indd 51 10/7/2015 4:37:43 PM

40 Gender, Trade and Green Growth Vol. I
Not surprisingly, female wages in general are lower than male wages. Figure 19 shows that in India, the average female wage (per hour) is USD 1.02 in 1989 compared to male wage of USD 2 (per hour). However, while data shows that the average male wages have increased to USD 3 between 1989 to 2012, during the same period the rate of increase in female wages was higher (from USD 1 in 1989 to USD 2.31 in 2012). When we compare average female wages across all employed women with women working in the green industries, we fi nd that average female wage in the green industries is higher than average female wages (USD 1.5 in 1989 compared to USD 1 average female wages). We also note that female wages in the green sectors have increased signifi cantly faster than average female wages (from USD 1.5 in 1989 to USD 3 in 2012) – and is almost equal to the average male wages – thereby closing the wage gap between male and female wages at least for the green sectors.
This is a somewhat startling result and would be worth exploring further in future research by further micro analysis of the green sector that are leading the closing of the wage gap. A possible explanation for the narrowing of the male-female wage gap in green sectors in India could potentially be higher wages and more skilled employment in the green sectors. Further research on the male-female wage gap in green sectors, compared to non-green sectors would provide evidence on this fi nding. Since time series data on wages is not avail-able for the other three countries we were unable to do a similar comparison for Bangla-desh, Bhutan and Nepal.
Women’s Participation in Agriculture, Ecotourism and Renewable EnergyTurning our attention to women’s participation in agriculture, ecotourism and renew-able energy, we fi nd that FLPR within the three industries remain in line with the overall economy-wide FLPR. An exception is seen in Bhutan with strikingly high FLPRs, particularly between 2006 and 2011.
Figure 20. Average Female Participation Rate Across Sectors - Bangladesh, 1989–2012
Proof 3a IP chk - (Vol. I) UN Women - Gender Dimensions.indd 52 10/7/2015 4:37:44 PM

41Gender Analysis of International and Intra-regional Trade in Green Industries
The average female participation rate in agriculture and agro-processing industries has increased in Bangladesh over the years, standing at 31 per cent in 2012. The FLPRs for both the industries is more or less in line with the overall country FLPR for 2012 (30 per cent).
It would seem that the chances of being employed in agriculture in Bangladesh and Bhutan is relatively high and has expanded to a much greater extent compared to other sectors. Other studies have shown that this continued in the period up to 2003 with an annual growth rate of 15.6 per cent in the period 1999 to 2003.45 Survey fi ndings suggest that access to modern technology has increased the demand for female labour in the agricultural sector. The adoption of high yielding varieties of crop production has increased workload not only in the fi elds but also in crop processing activities. It is mainly the women from landless of near landless households who work as wage labour.46 Men are also moving out of agriculture, either migrating to urban areas or taking up non-agriculture related activities, with increas-ing productivity and returns from involvement in non-agricultural sectors. Women are then cheaper to hire and also work on their own land as unpaid agricultural labour.47
Over the same time period, the renewable energy sector appears to have emerged as a fast growing employer for women. Even so, while it may be a fast growing sector – in terms of the sheer numbers of jobs generated, it remains a small proportion of the green industries. Tourism comprises a very small and insignifi cant sector in Bangladesh, and women’s partici-pation in this sector is even smaller.
As the agriculture and agro-processing sector is expanding in Bangladesh, the study notes a shift towards more intensive methods of farming. This is accompanied by men moving out of agriculture and women moving in to the sector. The Bangladesh country study notes that women farmers and producers are fully involved in the family farm activities and in some cases they are the principal actors and decision-makers. This increases the opportunity for paid work for women, although the wage rates are still lower than for men.48 At the same time, this increases their workload and contributes to their time-poverty.
With regard to the aggregate quality of employment, we see that in 1999–2000 “one-third of women workers had employment of the lowest quality, namely unpaid family work.49 However, about one-quarter of women workers were also likely to be self-employed/employer followed by employee and hired worker categories. Over time self-employed/employer category has also increased, the employee category has decreased and the unpaid family worker category has also increased.”50 The increase in self-employment/employer category may be related to the availability of micro-credit from both NGO and Government sources, especially targeting women. There would seem to be a lower opportunity cost for self-employment compared to wage employment, given the greater involvement of women in household maintenance and expenditure saving activities. This leads to a pattern of married women preferring self-employment.51
45 Amin, 2006.46 Hamid and Mahmud, 2004.47 As documented in the DFID supported study on “Hands Not Land” edited by Towfi que and Turton (2002).48 A study in 2009 by Rokeya Khatun found that employment generation was not as much as expected.
(2009:6)49 This fi gure increased to 48 per cent in 2003 (Amin, 2006: 5)50 Mahmud, 2003.51 Mahmud, 2001.
Proof 3a IP chk - (Vol. I) UN Women - Gender Dimensions.indd 53 10/7/2015 4:37:44 PM

42 Gender, Trade and Green Growth Vol. I
Female labour participation is high in Bhutan, most notably and perhaps unexpectedly in the renewable energy sector. The analysis of women’s participation in green industries in Bhutan shows somewhat diff erent picture. In Bhutan, we fi nd that of the three green sectors, organic agriculture employs far more people in Bhutan than the other two – and is steadily growing in this role. However, when we view renewable energy and eco-tourism in a separate chart (when they are no longer dwarfed by organic agriculture and their LFP trends are more visible) we see that while these may be signifi cantly smaller as employers, both these sectors have steadily been employing more and more people in the recent years. While organic agriculture always employed a signifi cant share of women, it is interesting that women’s share in the workforce employed in eco-tourism and renewable energy has seen such a surge in the last few years.
However, high female labour force participation rate does not necessarily translate into higher wages, decent working condition and gender equality. The agro-processing case study for Bhutan notes that women’s participation is concentrated mainly on the factory fl oor attending to manual labour activities such as peeling, cutting, washing, packaging and labelling. Certain production lines such as pickling have been traditionally operated exclusively by women. On the other hand, men are traditionally engaged in the areas of loading and unloading consignments requiring physical strength. Although the production operations adhere to the Bhutanese labour laws regarding maternity leave and benefi ts, there is, nonetheless, a tendency of labour turnover every season. Since a majority of the female labour comprises predominantly of seasonal and production line workers, who are often illiterate and unskilled, there is the limitation of promotion opportunities for female employees.
Immigrant female labour plays a crucial role behind some of the agro-processing industries as noticed in processing factories of Druk Fruit Products Limited, Chharu Tshogdrel and
Figure 21. Average Female Participation Rate Across Sectors - Bhutan, 1993–2012
Proof 3a IP chk - (Vol. I) UN Women - Gender Dimensions.indd 54 10/7/2015 4:37:44 PM
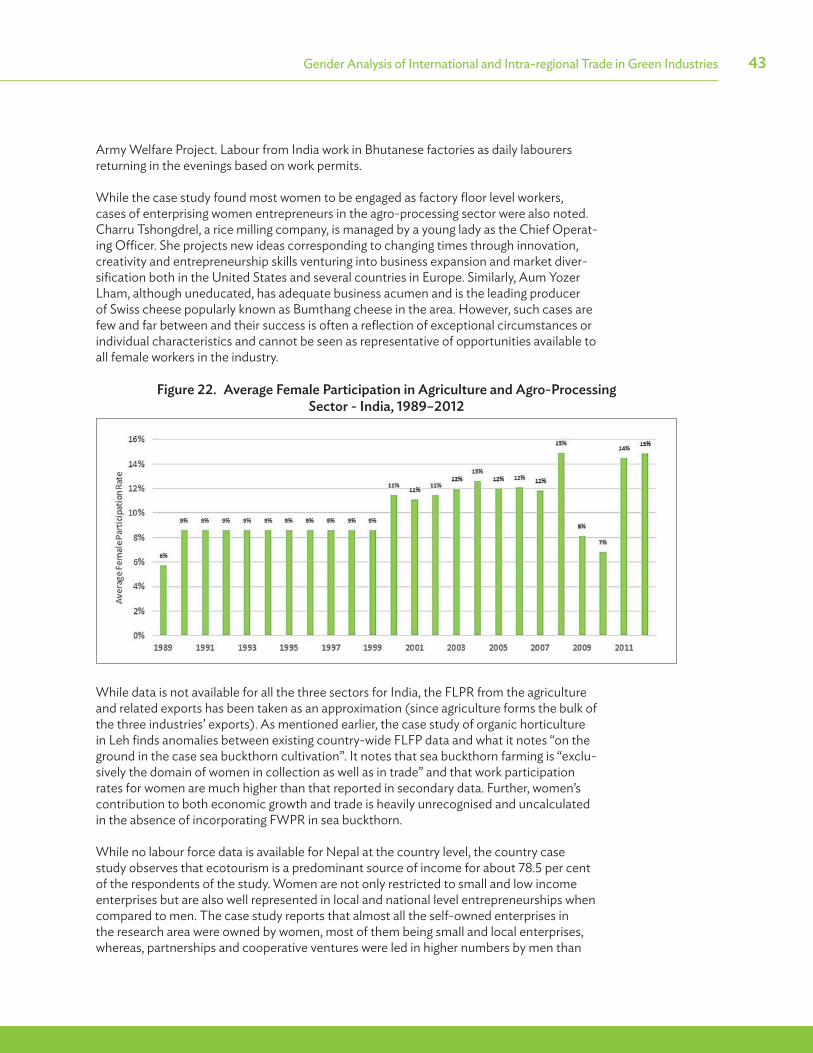
43Gender Analysis of International and Intra-regional Trade in Green Industries
Army Welfare Project. Labour from India work in Bhutanese factories as daily labourers returning in the evenings based on work permits.
While the case study found most women to be engaged as factory fl oor level workers, cases of enterprising women entrepreneurs in the agro-processing sector were also noted. Charru Tshongdrel, a rice milling company, is managed by a young lady as the Chief Operat-ing Offi cer. She projects new ideas corresponding to changing times through innovation, creativity and entrepreneurship skills venturing into business expansion and market diver-sifi cation both in the United States and several countries in Europe. Similarly, Aum Yozer Lham, although uneducated, has adequate business acumen and is the leading producer of Swiss cheese popularly known as Bumthang cheese in the area. However, such cases are few and far between and their success is often a refl ection of exceptional circumstances or individual characteristics and cannot be seen as representative of opportunities available to all female workers in the industry.
While data is not available for all the three sectors for India, the FLPR from the agriculture and related exports has been taken as an approximation (since agriculture forms the bulk of the three industries’ exports). As mentioned earlier, the case study of organic horticulture in Leh fi nds anomalies between existing country-wide FLFP data and what it notes “on the ground in the case sea buckthorn cultivation”. It notes that sea buckthorn farming is “exclu-sively the domain of women in collection as well as in trade” and that work participation rates for women are much higher than that reported in secondary data. Further, women’s contribution to both economic growth and trade is heavily unrecognised and uncalculated in the absence of incorporating FWPR in sea buckthorn.
While no labour force data is available for Nepal at the country level, the country case study observes that ecotourism is a predominant source of income for about 78.5 per cent of the respondents of the study. Women are not only restricted to small and low income enterprises but are also well represented in local and national level entrepreneurships when compared to men. The case study reports that almost all the self-owned enterprises in the research area were owned by women, most of them being small and local enterprises, whereas, partnerships and cooperative ventures were led in higher numbers by men than
Figure 22. Average Female Participation in Agriculture and Agro-Processing Sector - India, 1989–2012
Proof 3a IP chk - (Vol. I) UN Women - Gender Dimensions.indd 55 10/7/2015 4:37:45 PM

44 Gender, Trade and Green Growth Vol. I
women. Women are found in all categories of employment in the value chain such as family worker, wage labour, salaried employee as well as the employer.
However, Nepalese women in tourism sector were found to have low socio-economic status, education and literacy levels. For many women, the business of attending to tourists add up considerably to their daily household duties, especially when husbands and sons are away for extended periods working as foreign labour, trekking porters and guides.
It is no surprise then that Nepalese women in the eco-tourism sector were found to be typically trapped in low income roles. The survey notes that while only women were found to be earning INR 5000 per month (the lowest income category in the study), more than two-thirds of those earning INR 35,000 or more were men. Moreover, nearly 40 per cent of the female respondents reported low awareness on government initiatives to promote ecotourism, as opposed to 29 per cent of the male respondents – indicating lower aware-ness and integration into the mainstream by the women. Women’s roles in ecotourism in Nepal are primarily concentrated around home-stay facilities and guest caretaker respon-sibilities. Women entrepreneurs operate lodges and tea shops along the major trekking routes. Whatever time they have to sit down is spent knitting woollen caps, mittens, and socks, weaving bags, or making handicrafts to sell to tourists. Some mountain women work as porters or pack animal drivers for trekking or mountaineering groups, and few women have even been honoured to the ranks of trekking guides and even mountaineers.
A number of organizations like the National Trust for Nature Conservation (NTC) and the International Centre for Integrated Mountain Development (ICIMOD) are found to be involved in enhancing women’s participation in mountain tourism. They work on creating awareness about local women’s potentials in tourism, empowering them by off ering training and capacity building activities and helping to increase their involvements in mountain tourism.
Female Intensity of Total Exports and Green ExportsWhile three are a number of studies that have examined the impact of trade liberalisation on gender inequality, very few studies focus on measuring the female contribution to trade. In order to conduct an evidence based analysis of the impact of a change in trade policy on women’s role and participation, the starting point needs to include a measure of female contribution to trade and its linkage with trade policy changes. To overcome this challenge in measurement, this study uses a metric on female intensity of exports and traces the changes in female contribution towards total exports and exports from the green sectors (Box 2).
Industry wise analysis of women’s participation based on a measure of female intensity in the green industry reveals some broad fi ndings about women’s participation in these sectors in the four countries. Women’s contribution to the exports of all four countries is very low, particularly considering their overall contribution to the workforce. For the most recent year for which data is available, India is at the lowest end of the scale, with less than 15 per cent of its total exports that can be attributed to female labour. Of the four countries, female labour in Nepal contributed the most to its exports at 26 per cent. However, even this is signifi cantly low considering that the overall female labour force participation rate in Nepal was 49 per cent in 2012. (UNCTAD).
Proof 3a IP chk - (Vol. I) UN Women - Gender Dimensions.indd 56 10/7/2015 4:37:45 PM

45Gender Analysis of International and Intra-regional Trade in Green Industries
At the same time, this female intensity of exports has risen for nearly all countries (except Nepal where it has remained more or less constant) between 1989 and 2012. This trend in female contribution is consistent with the trend in their total exports.
Figure 23 and 24 show the measure of female contribution to exports in Nepal and Bhutan. The blue shaded area is the value of total export in USD millions. The average contribution of women’s work in Nepal is 25 per cent and in Bhutan is 21 per cent. Compared to Bhutan and Nepal, the contribution of women in total exports – at the aggregate levels – in Bangla-desh and India appears to be even lower (Figure 25 and 26). Given the overall low level of FLFP rates, this is not surprising. Besides undercounting women’s work, another reason for the low levels of female share of exports is the increasing informalisation of labour in devel-oping countries.
Box 2. Female Intensity of Exports: A New Metric to Quantify Women’s Share of Export
In this study a metric is constructed to measure women’s share of the total exports in a country. In its simplest form, the basic trade equation is as follows:
X = f (K, L)
Where X = exports; K = capital intensity of exports; and L = labour intensity of exports; i = industry
Assuming that the labour intensity can be further classifi ed into male and female intensity, we achieve the following,
X = f (K, ML, FL)
To empirically measure the above equation, we can use the following regression specifi cation:
Xi = + 1 Ki + 2 MLi + 3 FLi + i
Where Xi = value of total export for industry i
Ki = value of capital investment for industry i
MLi = value of men’s wages or value of male share of export at industry i
FLi = value of female wages or value of female share of export for industry
= error term
The male / female share share of export is obtained by:
�FLi = FLFP rates for industry i * total monetary value of the labour share of export from industry i
Using the above, we can obtain the value of female / male intensity of exports to provide an estimate of the female share of the total value of exports. We call this term the female intensity of export. Like all other variables in this report, ISIC 4 digit FLFP data was used and the FIE was calculated for all industrial categories. For industries where the FLFP was missing either imputed the missing value using mean based interpolation or regression based extrapolation.
A caveat regarding this metric is that the female intensity of exports measure is based on the assumption that female labour force participation is the same across sectors and can be directly applied to get the monetary equivalent of the female labour involved. While we accept that the measure of female intensity may not be exact, the purpose of computing this measure is to show the proportionate share of female labour compared to their male counterparts.
Proof 3a IP chk - (Vol. I) UN Women - Gender Dimensions.indd 57 10/7/2015 4:37:45 PM

46 Gender, Trade and Green Growth Vol. I
As the sectoral studies have pointed out greater trade liberalisation further pushes towards an informalisation of workforce – especially women workers. Trade liberalisation often disrupts existing economic sectors and markets where women are active, depriving them of employment opportunities and pushing them towards the informal sector.
While women’s contribution to total exports low, their contribution to green exports is even lower. Figure 27 and 28 show that for both Bangladesh and India, the female intensity of green exports is even lower than the female intensity of total exports for the most recent years averaging under 5 per cent in India and 14 per cent in Bangladesh between 1989–2012. Compared to India and Bangladesh, the female share of green exports from Bhutan is relatively high at approximately 25 per cent over this period (Figure 29). Once again, this is not surprising given that there is undercounting of the overall share of women’s work in the economy, and also because a move towards green growth usually implies greater export and market opportunities but also implies the need to grow and upgrade technologically, which
Figure 23. Female Intensity of Exports - Bangladesh, 1989–2012 (1990 constant USD)
Figure 24. Female Intensity of Exports - India, 1989–2012 (1990 constant USD)
Proof 3a IP chk - (Vol. I) UN Women - Gender Dimensions.indd 58 10/7/2015 4:37:45 PM

47Gender Analysis of International and Intra-regional Trade in Green Industries
Figure 25. Female Intensity of Green Exports - India, 1989–2012(1990 constant USD)
Figure 26. Female Intensity of Green Exports - Bangladesh, 1989–2012 (1990 constant USD)
Figure 27. Female Intensity of Green Exports - Bhutan, 1993–2012 (1990 constant USD)
Proof 3a IP chk - (Vol. I) UN Women - Gender Dimensions.indd 59 10/7/2015 4:37:46 PM

48 Gender, Trade and Green Growth Vol. I
may be particularly challenging for women employees and women run enterprises with limited access to marketing networks, credit and technical knowledge.
Looking at the aggregate industry level data from Bangladesh, we observe similar trends in both agriculture and agro-processing as well as in the renewable energy sectors.
Figure 28. Total Agriculture and Agro-Processing Sector Exports and its Female Intensity of Exports - Bangladesh, 1989–2012
(1990 constant USD)
Figure 29. Total Renewable Energy Sector Exports and its Female Intensity of Exports - Bangladesh, 1989–2012
(1990 constant USD)
Proof 3a IP chk - (Vol. I) UN Women - Gender Dimensions.indd 60 10/7/2015 4:37:48 PM

49Gender Analysis of International and Intra-regional Trade in Green Industries
At the same time, this female intensity in green exports is mostly stagnant and even declin-ing and abysmally low for the largest of the four countries, India. In 2012, less than 5 per cent of total green exports came from women labour – even as the total FLPR in India was 18 per cent. In 2012, only Bhutan has a greater contribution from women in green exports (28 per cent) than the contribution in total exports (22 per cent). This appears to be largely driven by agriculture and agro-processing exports where more than 25 per cent of the exports are a result of women’s eff orts. Since annual labour force participation data is not available for Nepal, we were unable to compare the fi gure for Nepal.
It must be noted that in the wake of the push given by both national and international eff orts going forward, as green exports will expand, women’s share in these exports may not automatically rise – and more specifi c and targeted measures may be needed to ensure that women are able to participate in this future expansion.
Intra-regional TradeInteresting patterns of women’s contribution are replicated in bilateral trade between the four countries. Looking at India’s trade to Nepal, Bhutan and Bangladesh, we fi nd that while female share of green exports are low, the share of female contribution to total exports to Bangladesh, Bhutan and Nepal is relatively high (close to 15 percent across all countries). Annex 9 presents the graphs on female intensity of bilateral exports between India, Bhutan, Bangladesh and Nepal.
Looking at bilateral trade data more closely we observe that women’s contribution to the bilateral green trade in the four countries is mostly in line with their contribution to the respective country’s overall green exports. Bangladesh and India continue to display lower female intensity in their green exports than they do in their total exports, with India performing particularly poorly. This indicates that there may be no special features to the bilateral trade relationships among the four countries as far as women’s participation is considered. This could well be taken as a signifi cant entry point into drafting future bilateral and regional trade initiatives.
Figure 30. Female Intensity of Bangladesh’s Green Export to India, Nepal and Bhutan, 1989–2012
Proof 3a IP chk - (Vol. I) UN Women - Gender Dimensions.indd 61 10/7/2015 4:37:49 PM

50 Gender, Trade and Green Growth Vol. I
Looking at bilateral trade between Bangladesh and the other three countries, we observe more or less similar trends with notable diff erences across trade partners only post 2005. Female intensity in bilateral green trade also remains lower than female intensity in overall bilateral trade. Of the , Bangladesh’s green exports to Bhutan have shown the most stable trend as far their ability to include women in their growth is concerned. Interestingly, even though the female intensity of green exports from Bangladesh suddenly dipped in 2011, exports to the three partners were not as poorly aff ected.
Like Bangladesh, the female-intensiveness in Bhutan’s bilateral green exports is mostly in line with that of its overall green exports. Therefore, when compared to bilateral trade in all goods, particularly post 2005, Bhutan’s exports to all three countries were much higher for green industries than the overall export average to these countries. Bhutan’s green exports to Nepal appear particularly high across nearly the entire period. However, this has been on a decline since 2010 and may be worth investigating further.
Figure 32. Female Intensity of India’s Green Exports to Bangladesh, Bhutan and Nepal, 1989–2012
Figure 31. Female Intensity of Bhutan’s Green Exports to Bangladesh, India and Nepal, 1993–2012
Proof 3a IP chk - (Vol. I) UN Women - Gender Dimensions.indd 62 10/7/2015 4:37:49 PM

51Gender Analysis of International and Intra-regional Trade in Green Industries
India’s female intensity of green exports to the three countries in South Asia is signifi cantly lower than the female intensity of its total exports to these countries. That is, India’s green exports to Nepal, Bangladesh or Bhutan display no special strength in their ability to include women and their female intensity remains abysmally low when compared to that of its overall exports. India’s green exports to Bhutan appear to be the most female intensive in the recent years.
While the absence of necessary data does not allow us to carry out a similar analysis for Nepal’s bilateral green trade, its bilateral trade overall does not show numbers any diff erent from its trade with the rest of the world.
A few observations and caveats about the analysis in this section. The estimation of female intensity of exports is based on the assumption that female labour force participation is the same across sectors and can be directly applied to get the monetary equivalent of the female labour involved. While we accept that the measure of female intensity may not be exact, the purpose of computing this measure is to show the proportionate share of female labour compared to their male counterparts. Not surprisingly, we fi nd that female share of exports across all three countries is small.
However, not only is women’s contribution to total exports low, their contribution to green exports is even lower. For both Bangladesh and India, the female intensity of green exports is lower than the female intensity of total exports for the most recent years. Finally, it is noted that in the wake of the push given by both national and international eff orts going forward, as green exports expand women’s share in these exports may not automatically rise. Therefore, more specifi c and targeted measures may be needed to ensure that women are able to participate in this future expansion.
Proof 3a IP chk - (Vol. I) UN Women - Gender Dimensions.indd 63 10/7/2015 4:37:51 PM

Proof 3a IP chk - (Vol. I) UN Women - Gender Dimensions.indd 64 10/7/2015 4:37:51 PM

Gender Supply Chain Analysis of Agro-Processing, Renewable Energy and Ecotourism
An important objective of this study is to examine the impact of trade policy on women’s participation in the green industries. So far, the study has found that based on offi cial statistics women’s share of and participation in international and
intra-regional trade is very limited. However, fi eld based studies and studies of the informal sector, show an increasing feminisation of the workforce, especially in the green sectors. It is important, therefore, to examine how trade aff ects the overall quality of work being done by women, their time burden and overall well-being. In this chapter we move from the macro level to the micro level, focusing on the challenges and opportunities for promot-ing women’s employment and participation in the green industries and in international trade. Looking at the supply chain for sea buckthorn in India and agro-processing sector in Bangladesh, we examine the nature of women’s participation at each step of production and export, the positive and negative eff ects of trade liberalisation on women employed in these sectors and the barriers and opportunities to their participation. This chapter fi nds that the gender disparities that exist in the economy in general also limit women’s participation in international trade, demonstrably at least, in trade from the green industries. Among the limiting factors that have been identifi ed are:
• Gender patterns in access and participation in the labour market• Limited access for women to productive inputs• Gender diff erences in time use• Gender patterns in education and skill development
These obstacles are rooted in market and institutional failures, e.g. bureaucratic hurdles and discriminatory legal frameworks, such as unequal right to property or credit provisions.
The World Development Report 2012 entitled Gender Equality and Development identi-fi es three main factors which foster gender segregation in access to economic opportuni-ties: gender diff erences in time use; gender diff erences in access to productive inputs; and gender diff erences stemming from market and institutional failures. Gender segregation in access to economic opportunities, such as productive inputs, in turn reinforces gender diff erences in time use and in access to inputs, and perpetuates market and institutional failures. The interaction of these three factors forces women into low-paying jobs and low-productivity businesses. These factors therefore must be addressed in order to increase women’s participation in the green economy.
We further examine the nature of women’s participation through sectoral evidence from export-intensive or potential export-intensive green industries.
CHAPTER
6
Proof 3a IP chk - (Vol. I) UN Women - Gender Dimensions.indd 65 10/7/2015 4:37:54 PM

54 Gender, Trade and Green Growth Vol. I
Women’s Participation in Agro-processing and HorticultureFigure 32 shows the steps involved in the production, marketing and sale of sea buckthorn from Ladakh, India. Growing primarily on forest and ‘uncultivable’ land, Sea buckthorn thrives in waste and ‘degraded’ land conditions; as chemical fertilisers and pesticides are obviously not applied in what is essentially a common property resource, the fruit is truly organic. The plant lasts for at least 15 years, after which its productivity begins to decline. The spread of the tree is aff ected by deforestation, as pollination takes place via the Chunka bird which feeds on the berries and spits out the seeds.
There are numerous benefi ts from the unprocessed sea buckthorn: as tea leaf, animal feed and fodder; the stem and root for fi rewood, charcoal, and wood for handles of agricultural implements; the berry for herbal medicines, nutritional supplements and oil for household lighting; twigs and branches for shed-roofs, tree guards and fencing of fi elds. The plant also plays an extremely crucial role as a protection against water and soil erosion, a major issue in cold desert conditions. However, the main value from sea buckthorn comes from processing the raw fruit pulp into juice, jams and beauty products.
As sea buckthorn cannot be consumed fresh due to the highly acidic taste, processing is funda-mental to its usage. The main value added product currently produced in Ladakh is juice which can be stored up to a year and does not freeze even in minus 22 degrees. Moreover it requires no added colouring or fl avouring agent. A range of other products are also made albeit in limited
Figure 33. Example of the Sea Buckthorn Supply Chain in Ladakh, India
Proof 3a IP chk - (Vol. I) UN Women - Gender Dimensions.indd 66 10/7/2015 4:37:56 PM
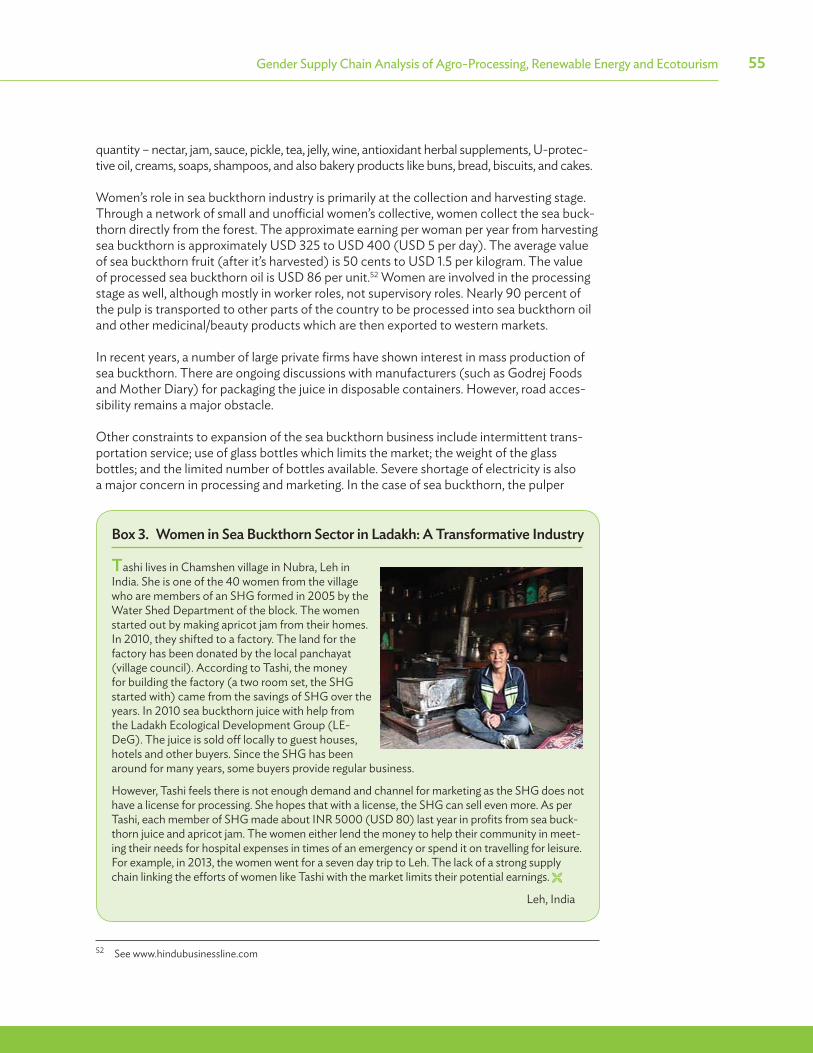
55Gender Supply Chain Analysis of Agro-Processing, Renewable Energy and Ecotourism
quantity – nectar, jam, sauce, pickle, tea, jelly, wine, antioxidant herbal supplements, U-protec-tive oil, creams, soaps, shampoos, and also bakery products like buns, bread, biscuits, and cakes.
Women’s role in sea buckthorn industry is primarily at the collection and harvesting stage. Through a network of small and unoffi cial women’s collective, women collect the sea buck-thorn directly from the forest. The approximate earning per woman per year from harvesting sea buckthorn is approximately USD 325 to USD 400 (USD 5 per day). The average value of sea buckthorn fruit (after it’s harvested) is 50 cents to USD 1.5 per kilogram. The value of processed sea buckthorn oil is USD 86 per unit.52 Women are involved in the processing stage as well, although mostly in worker roles, not supervisory roles. Nearly 90 percent of the pulp is transported to other parts of the country to be processed into sea buckthorn oil and other medicinal/beauty products which are then exported to western markets.
In recent years, a number of large private fi rms have shown interest in mass production of sea buckthorn. There are ongoing discussions with manufacturers (such as Godrej Foods and Mother Diary) for packaging the juice in disposable containers. However, road acces-sibility remains a major obstacle.
Other constraints to expansion of the sea buckthorn business include intermittent trans-portation service; use of glass bottles which limits the market; the weight of the glass bottles; and the limited number of bottles available. Severe shortage of electricity is also a major concern in processing and marketing. In the case of sea buckthorn, the pulper
52 See www.hindubusinessline.com
Box 3. Women in Sea Buckthorn Sector in Ladakh: A Transformative Industry
Tashi lives in Chamshen village in Nubra, Leh in India. She is one of the 40 women from the village who are members of an SHG formed in 2005 by the Water Shed Department of the block. The women started out by making apricot jam from their homes. In 2010, they shifted to a factory. The land for the factory has been donated by the local panchayat (village council). According to Tashi, the money for building the factory (a two room set, the SHG started with) came from the savings of SHG over the years. In 2010 sea buckthorn juice with help from the Ladakh Ecological Development Group (LE-DeG). The juice is sold off locally to guest houses, hotels and other buyers. Since the SHG has been around for many years, some buyers provide regular business.
However, Tashi feels there is not enough demand and channel for marketing as the SHG does not have a license for processing. She hopes that with a license, the SHG can sell even more. As per Tashi, each member of SHG made about INR 5000 (USD 80) last year in profi ts from sea buck-thorn juice and apricot jam. The women either lend the money to help their community in meet-ing their needs for hospital expenses in times of an emergency or spend it on travelling for leisure. For example, in 2013, the women went for a seven day trip to Leh. The lack of a strong supply chain linking the eff orts of women like Tashi with the market limits their potential earnings.
Leh, India
Proof 3a IP chk - (Vol. I) UN Women - Gender Dimensions.indd 67 10/7/2015 4:37:57 PM

56 Gender, Trade and Green Growth Vol. I
is operated by electricity but often runs on diesel because of frequent power outages in Ladakh. This also aff ects the possibility of harvesting sea buckthorn in the evenings after sunset, thus dramatically reducing its huge production potential.
Evidence collected from the sectoral analysis of women involved in horticulture, organic farming and agro-processing in Bangladesh and Bhutan, with a particular focus on cash crops and high value crops, note that women are involved at various stages of the value chain – from primary producers, to workers in the processing plants, as well as entrepre-neurs. However of the seven fi rms surveyed in Bhutan, only 16 per cent fi rms have female participation in ownership and only 1 per cent fi rms have women as top managers. Women from landless or nearly landless households work as wage labour. Government policies are, in principle, positive about women’s involvement in agricultural enterprise and increased exports. The sector overall is also witnessing an enhanced open-ness to innovation and use of technology, such as use of information technology to check prices, pesticide dosages, TV shows on new agricultural techniques etc.
The example of agro-processing supply chain from Bangladesh shows that women are involved at the lower end of the value chain. Primary data53 collected in rural area of
53 Details of the survey and data are provided in Volume II, case study of agro processing in Bangladesh.
Figure 34. Example of the Agro-processing Supply Chain in Bangladesh
Proof 3a IP chk - (Vol. I) UN Women - Gender Dimensions.indd 68 10/7/2015 4:37:57 PM

57Gender Supply Chain Analysis of Agro-Processing, Renewable Energy and Ecotourism
Bangladesh found that among women, as high as 56.2 per cent were unpaid family worker followed by self-employed in agriculture (15.7 per cent) followed by workers (23.1 per cent) and self-employed in non-agriculture (17 per cent). According some estimates, unpaid female family worker increased at a signifi cant rate (237 per cent) compared to male (35 per cent) in the last decade.54 Within farming, women are involved at all stages - pre, post and during cultivation.
Importantly, while women engaged extensively in cultivation, fewer women were found to be involved in the marketing of the produce. The reluctance to be involved in marketing was explained by the lack of security, the fact that it is a mainly male domain and also that it needs travel away from home.
The agro-processing companies have been able to set up large factories with a workforce where women are the majority at the fl oor level. In the case of the successful fi rms such as PRAN and SQUARE the workers are able to benefi t from steady jobs and a regular income. They have various benefi ts such a health care, food, clothes, bonuses and are able to work in clean, safe and secure environments. There is scope for workers to graduate up from the fl oor level to supervisor and quality control levels. Women in management have yearly increments, yearly evaluations, every 2–3 years they may have a designation change, there is a regular programme of capacity development of staff and they have a group deposit pension scheme, etc. The larger fi rms are able to maintain a good working environment and labour standards.
The main challenges encountered by women farmers (at the cultivation and harvesting stage) relate to the increased work load, information on new technology and direct access to markets. The Bangladesh case study found that with improved roads and transport facilities traders were able to come closer to the villages and fi elds to be able to collect the produce from nearer the homes, thereby improving farmer’s access to markets. One of several positive impact of commercialization of farming is that farmers – both men and women – have increased access to cash incomes. While they also have greater expenditures on seeds, irrigation and transportation, there has been an increase in savings.
Women entrepreneurs and exports face somewhat diff erent set of challenges. Case studies of women entrepreneurs in Bangladesh and Bhutan show that developing and maintaining export linkages is challenging. There are few trade fairs in the country and there is a lack of organisations that are promoting small women entrepreneurs. Women entrepreneurs often rely on family or husband’s contacts to establish business connections and locate overseas buyers. In Bangladesh, two case studies of women entrepreneurs showed that in one case (Entrepreneur B) used the export connections she and her husband had developed earlier for their cosmetics exports, to build on and fi nd new importers and agents. She is exporting to North-East India through the land ports. She used the BAPA membership list to explore who was exporting what products where and followed up with her own contacts. In another case (Entrepreneur A) participated in a few trade fairs with her husband but later her family discouraged her from going and she sent staff .
Primary data collected from the agro-processing sector, including women employed in rice-milling, dairy products, fruit pulp processing and pickling, cheese and wine in Bhutan shows that the sector is dominated by micro, small and medium scale enterprises – owned by government, private corporations, families as well as farmer groups and cooperatives.
54 Unnayan Onneshan, 2013.
Proof 3a IP chk - (Vol. I) UN Women - Gender Dimensions.indd 69 10/7/2015 4:37:58 PM

58 Gender, Trade and Green Growth Vol. I
The study found that women dominated the sector, working mostly as imported labour in low-skill and education jobs requiring manual execution. The sector has contributed to the enhancements of their livelihoods and rural income generation and thus poverty alleviation. However, most are only paid the minimum wage.
Box 4. Making Cheese in Bumthang, Bhutan
A lack of opportunities to market fi nished produce beyond the local shops in Bumthang, Bhutan discouraged Aum Yoser Lhamo’s entrepreneurial aspirations. Youser and her husband set up a small cheese factory with support from Helvetica in 1980s. After Youser’s husband died in 2011, she took over the factory. Her son and daughter, who are now grown up, help Youser with the admin-istration and fi nance of the factory. Today the family makes emmentaler, gouda and the popular soft cheese that is bought by the locals. Youser procures fresh milk from local diaries in the area. She found her early years into the factory quite challenging as she had to work in the factory as well as cook, clean the house and look after her small children. However, today the work has become a part of Youser’s life. The factory sells mainly to local hotels and restaurants but also receive orders from the locals and tourists who visit the shop and buy directly. Lamenting the limited channels for selling cheese, Youser is keen to expand and change with the times.
Bumthang, Bhutan
Proof 3a IP chk - (Vol. I) UN Women - Gender Dimensions.indd 70 10/7/2015 4:37:58 PM

59Gender Supply Chain Analysis of Agro-Processing, Renewable Energy and Ecotourism
Table 6. Barriers, Opportunities and Potential Interventions to Promote Gender Responsive Trade in the Agricultural Sectors
Barriers/Challenges Opportunities
Possible Entry Points for Women’s Integration
in Trade and Green Agriculture
• Women are employed at the lower end of the value chain
• Increasing numbers of unpaid women labourers
• Increasing drudgery and time poverty
• Lower wage rates than men
• Existing gaps in policy framework
• Limited involvement of women in marketing
• Diffi culties in developing and sustaining enterprises
• Unfriendly credit and repayment policies
• Challenges in developing and maintaining export linkages/low involvement of women in exports
• Prevalence of stereotypes around women/men’s role in agriculture
• Poor quality of infrastruc-ture and storage facility
• Invisibility/undervalu-ation of women’s work in organic agriculture in national statistics
• Limited opportunities for training available for women entrepreneurs
• Great opportunity for regional trade because of the perishable nature of goods and the preva-lence of preferential trade agreements among countries
• Access to information and new techniques
• Decent work conditions and job security for women in large fi rms
• Women’s involvement in agriculture increasingly recognised and visibilised
• Eff orts to develop a Gender Responsive Policy Framework on Agriculture and Green Growth
• Support for women’s entrepreneurship devel-opment
• Support for women producers and contact farmers through credit and training facilities
• Increasing opportunities for paid work
• Increasing number of women in agriculture
• Enhanced marketing opportunities as a result on infrastructure improve -ments especially roads
• Access to cash incomes
• Consider the conduct of a Gender Inclusive Fair Trade(GIFT) certifi cation centre / association in the region that can develop guidelines, provide train-ing and certifi cation for small entrepreneurs and producers based on gender responsive and environmentally sustain-able production processes
• The GIFT association can also act to organize GIFT fairs where women and other producers can network and connect with buyers
• Provide fi nancial incen-tives to “go green”
• Create opportunities for border/local markets which are accessible by roads so women can participate in these markets
• Importance of balancing production with marketing
• Greater role of producers’ and exporter association to explore potentials for regional trade and support women exporters to engage in regional trade through mentoring and counselling
Source: Based on primary analysis from the national/sectoral studies in Vol. II
Proof 3a IP chk - (Vol. I) UN Women - Gender Dimensions.indd 71 10/7/2015 4:37:59 PM
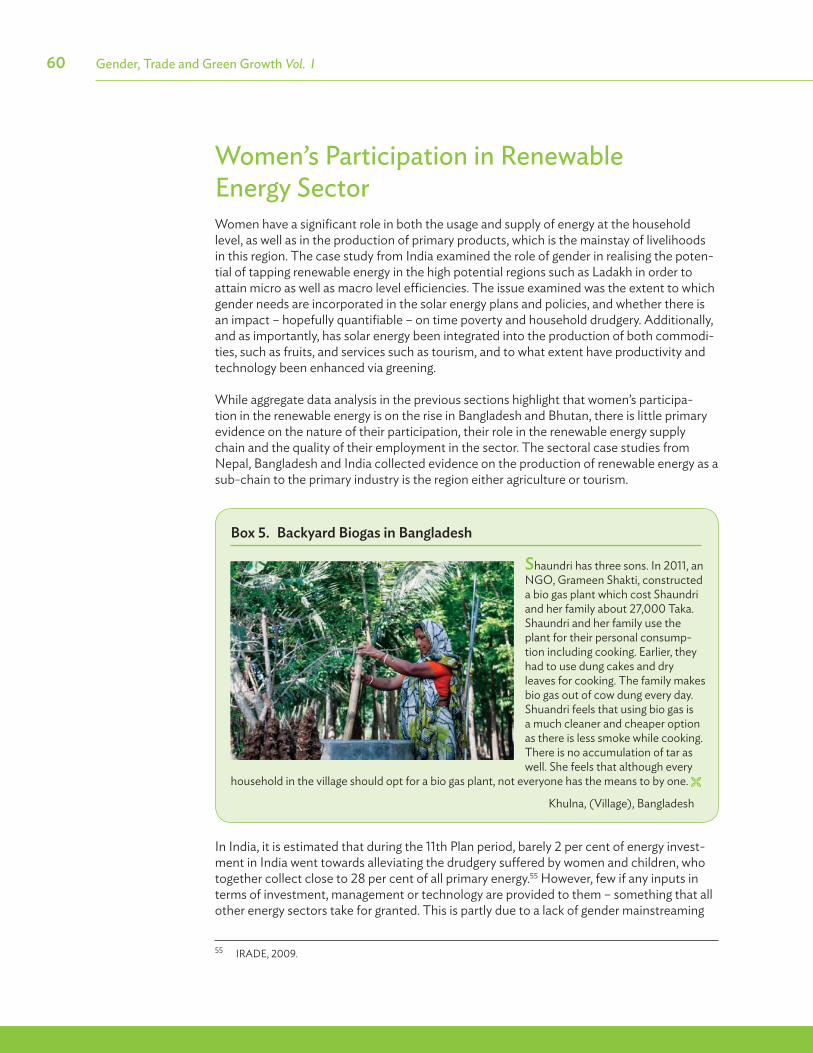
60 Gender, Trade and Green Growth Vol. I
Women’s Participation in Renewable Energy SectorWomen have a signifi cant role in both the usage and supply of energy at the household level, as well as in the production of primary products, which is the mainstay of livelihoods in this region. The case study from India examined the role of gender in realising the poten-tial of tapping renewable energy in the high potential regions such as Ladakh in order to attain micro as well as macro level effi ciencies. The issue examined was the extent to which gender needs are incorporated in the solar energy plans and policies, and whether there is an impact – hopefully quantifi able – on time poverty and household drudgery. Additionally, and as importantly, has solar energy been integrated into the production of both commodi-ties, such as fruits, and services such as tourism, and to what extent have productivity and technology been enhanced via greening.
While aggregate data analysis in the previous sections highlight that women’s participa-tion in the renewable energy is on the rise in Bangladesh and Bhutan, there is little primary evidence on the nature of their participation, their role in the renewable energy supply chain and the quality of their employment in the sector. The sectoral case studies from Nepal, Bangladesh and India collected evidence on the production of renewable energy as a sub-chain to the primary industry is the region either agriculture or tourism.
In India, it is estimated that during the 11th Plan period, barely 2 per cent of energy invest-ment in India went towards alleviating the drudgery suff ered by women and children, who together collect close to 28 per cent of all primary energy.55 However, few if any inputs in terms of investment, management or technology are provided to them – something that all other energy sectors take for granted. This is partly due to a lack of gender mainstreaming
55 IRADE, 2009.
Box 5. Backyard Biogas in Bangladesh
Shaundri has three sons. In 2011, an NGO, Grameen Shakti, constructed a bio gas plant which cost Shaundri and her family about 27,000 Taka. Shaundri and her family use the plant for their personal consump-tion including cooking. Earlier, they had to use dung cakes and dry leaves for cooking. The family makes bio gas out of cow dung every day. Shuandri feels that using bio gas is a much cleaner and cheaper option as there is less smoke while cooking. There is no accumulation of tar as well. She feels that although every
household in the village should opt for a bio gas plant, not everyone has the means to by one.
Khulna, (Village), Bangladesh
Proof 3a IP chk - (Vol. I) UN Women - Gender Dimensions.indd 72 10/7/2015 4:37:59 PM

61Gender Supply Chain Analysis of Agro-Processing, Renewable Energy and Ecotourism
as well as the exclusion of gender concerns in a sector that is perceived as being primarily technology-driven. However, as is known, women play key roles in energy use and supply, so energy projects will not be eff ective unless gender diff erentials are addressed. Energy projects can contribute to gender equality and women’s empowerment by involving them throughout the value chain, including in decision-making roles from which they have tradi-tionally been excluded.
Table 7. Barriers, Opportunities and Potential Interventions to Promote Gender Responsive Renewable Energy
Barriers/Challenges Opportunities
Possible Entry Points for Women’s Integration
in Trade and Green Agriculture
• Lack of inputs in terms of investment, skills, management or tech nology
• Signifi cant role of women in both the usage and supply of energy at the household level, as well as in the production of primary products which is the mainstay of livelihood
• Use of renewable energy technology can reduce the long hours spent on collecting fuel wood.
• Renewable energy is healthier option because of less exposure of indoor air pollution
• Increased investment and commitment from the government
• Training women in renewable energy production, maintenance and usage
• Link renewable energy usage with promotion of small business and entre-preneurs
• Make technology easily accessible
• Strengthen export policies to promote renewable energy sector
Source: Based on primary analysis from the national/sectoral studies in Vol. II
Women’s Participation in EcotourismWomen’s roles in ecotourism in Nepal are primarily concerned with home-stay facilities and guest caretaker responsibilities. Women operate lodges and tea shops along the major trekking routes, sometimes with their husbands or fathers, but often alone. As cooks and primary servers, they have the greatest contact with tourists and their trekking guides and porters. They are ever working, producing or serving others. Whatever time they have to sit down is spent knitting woollen caps, mittens, and socks, weaving bags, or making handi-crafts to sell to tourists. Some mountain women work as porters or pack animal drivers for trekking or mountaineering groups; a handful have been able to attain the rank of trekking guides and even mountaineers.
A number of organisations like the National Trust for Nature Conservation (NTC), Inter-national Centre for Integrated Mountain Development (ICIMOD), Tourism for Rural
Proof 3a IP chk - (Vol. I) UN Women - Gender Dimensions.indd 73 10/7/2015 4:38:00 PM

62 Gender, Trade and Green Growth Vol. I
Poverty Alleviation Program (TRPAP), Nepal Tourism Board (NTB), Kathmandu Environ-ment Education Project (KEEP), Annapurna Conservation Area Project (ACAP), Mother’s Club Central Committee (MCCC), Women Entrepreneurs Association of Nepal (WEAN), United Nations Development Programme (UNDP), International Labour Organization (ILO), Nepal Academy of Tourism and Hospitality Management (NATHAM) and 3 Sisters Adventure Trekking (P) Ltd. etc. are found to be involved in enhancing women’s participa-tion in mountain tourism. These organisations through their continuous eff orts in the past and present periods have been creating awareness about local women’s potential in tour-ism, empowering them by off ering training and capacity building activities and helping to increase their involvement in mountain tourism.
The study notes that gender stereotyped roles are typical of the sector in Nepal. While men have the one big “job” with responsibility and power, women have numerous small jobs which often go unaccounted for. Even so, women are burdened with heavy workloads.
Even though there may be the same salary for both men and women for the same kind of work, there exists informal gender division of labour where “Men’s Work” is valued high and “Women’s Work” is undervalued. Moreover, since men hold the money in most cases, women are often dependent on their husbands for money with little fi nancial discretion, access or spending ability. There also exists a strong community/village based network works very closely with women to not only provide employment opportunities but also put
Box 6. Ecotourism and Empowerment in Nepal
Kamala Lalchan is one of the many women in Nepal leading the business of a homestay facility for local and international tourists. Kamala has been running Neeru’s Guesthouse, named after her sister, in Marpha, Nepal in the Annapurna Circuit since last six years. Her parents ran the guesthouse before her and trained her on the job. Kamala completely took over the running of the guesthouse after her father’s death.
Of the profi ts she manages to earn, Kamala pays a rent of USD 4050 per year to her mother. Although Kamala has employed two full-time working staff at the guest house, her daughter often chips in as a helping hand when required. The guesthouse is well known for its Thakali Thali, a traditional Nepalese serving, and western cuisine that Kamala serves to her guests with ease. She learned some bits of western cuisine from the guests who were willing to share recipes in return for a class by Kamala on Nepalese cooking. However, now Kamala simply looks up the internet for new recipes and tries them out. She even has her guesthouse page on Facebook besides its mention on the Trip Advisor. With the coming of the road in the area, the trek on the Annapurna circuit has been reduced considerably. As a result, Kamala and other guest house owners are experiencing competition with hotel owners off ering rooms at a low rate. Kamala believes things have changed overtime and that guesthouse owners like her have to look at new ways to attract tourists in to the area.
Marpha, Nepal
Proof 3a IP chk - (Vol. I) UN Women - Gender Dimensions.indd 74 10/7/2015 4:38:00 PM

63Gender Supply Chain Analysis of Agro-Processing, Renewable Energy and Ecotourism
in place social policies and rules and ensures enforcement.56 Such networks directly benefi t women who are often the biggest victims or alcoholism and abuse.
An analysis of women’s role in ecotourism in the Ladakh region of India shows that women are generally invisible in the tourism industry. The nature of impact of tourism on women depends on other prevailing factors, such as the level of penetration of globalisation, level of development of the external economic/market relations, confl ict situation, distance from cities/towns, etc. The Ladakh region, being one of the highest lands in the world, has a distinct climate which attracts tourists in all seasons, its unique climatic conditions having made it famous for ecotourism. The Buddhist culture is a pre-dominant attraction, and tourism related to it is an integral part of the development of the regional economy of Ladakh.
Tourism is a major job creator and an important source of livelihood for the residents of the Leh-Kargil region. The socio-economic impacts of tourism have been positive as well as a negative. On a positive note, the rise in tourism has resulted in a substantial increase in income at least for some sections of the population, one of the major causes for this being the home-stay services, whereby the local residents rent out abode alternatives to tourists. The key advantage of this option is the direct transaction between the local residents and tourists without the interference of agents, guides etc. Moreover, if properly and sensitively enhanced, it has the potential to play a vital role in empowering women.
Women in the Ladakh region have benefi tted from homestays as the direct access to income often gives them control over money and decision making. Tourism has enabled women become independent functionaries and provided them access to improved liveli-hood opportunities. The negative eff ect of rising tourism can be seen in the form of increas-ing dependency as each individual becomes a part of the long chain of producers and suppliers. This has in turn led to a common dependency on the same resources such as energy etc. pushing forth the artifi cial scarcity of common property resources.
56 Gambling and playing cards is prohibited in these areas. People are not allowed to drink in public/ drunken misbehaving is prohibited
Proof 3a IP chk - (Vol. I) UN Women - Gender Dimensions.indd 75 10/7/2015 4:38:00 PM

64 Gender, Trade and Green Growth Vol. I
Table 8. Barriers, Opportunities and Potential Interventions to Promote Gender Responsive Ecotourism
Barriers/Challenges Opportunities
Possible Entry Points for Women’s Integration
in Trade and Green Agriculture
• Women mostly work at the low end of the value chain; play informal roles
• Lack of training for women entering into and running business of ecotourism
• Limited investment in the sector
• Poor accessibility and technological links leads to tough working condi-tions
• Harsh geographic terrain limiting trade opportuni-ties with neighbouring and border countries
• Lack of burgeoning strategies in tourism
• Ecotourism is a volatile sector susceptible to changes in global demand
• Gender disparity in ownership of enterprises
• High exodus of men due to migration places heavy burden on women
• Can lead to potential increase in sex-tourism
• Ecotourism presents a win-win opportunity for women’s employment, environmentally sustain-able tourism and revers-ing migration
• Ecotourism is one of the booming sectors contrib-uting in high numbers to the nation’s GDP
• Design of holistic sustain-able and pro-poor and community-oriented inclusive tourism systems will positively aff ect the high number of women working in tourism (services).
• Presence of several network of organisations working with women in ecotourism
• Trade friendly policies initiated by the govern-ment
• Provision of better credit opportunities for women business owners
• Generate employment opportunities in ecotour-ism by streamlining the sector
• Training women for liveli-hood opportunities in ecotourism
• Encourage the establish-ment of formal associa-tions that promote local handicrafts and culture for tourism and provide employment opportuni-ties for women – this can also promote local manu-facturing in signifi cant ways
• Establish targets for women tourist owners and operators in the national tourism policies
Source: Based on primary analysis from the national/sectoral studies in Vol. II
Factors Determining Women’s Participation in the Green SectorsAn examination of the various nodes of the value chain in agriculture, renewable energy and ecotourism leads to some overall observations and identifi cation of ways forward. Before moving on the recommendations, a quick summary of the factors that determine the qual-ity of women’s participation in the green sectors. What is evident is that gender equality and greening can benefi t each other. For example, greening can be driven by consumer prefer-
Proof 3a IP chk - (Vol. I) UN Women - Gender Dimensions.indd 76 10/7/2015 4:38:00 PM

65Gender Supply Chain Analysis of Agro-Processing, Renewable Energy and Ecotourism
ence towards healthier products and processes. At the same time, working with (poor) women can minimise negative environmental impacts through harmful practices, e.g. in the use of fuel and water. In turn, greening off ers women opportunities for (economic) partici-pation, increased income and health benefi ts. In the context of expanding regional trade, the impetus for green products can either be created through targeted trade policies and through health motivated consumer preferences.
Starting with the positives, this research has shown that there are a number existing devel-opments that promote women’s participation in green industries that have the potential to be traded. As greening becomes a more competitive factor for producers, an increase in international and intra-regional trade will lead to an expansion in green industries. In many cases, we found that moving to green methods of production (using less chemicals, fertilizers) actually reduces to the barriers to entry in that sector for women’s participation – that may exist in traditional sectors. Similarly, we fi nd that access to modern technol-ogy in many cases reduces reliance on middle-men and gives small business owners direct market access. There exist a number of women’s groups, producer networks and MSMEs (Micro, Small and Medium Enterprises) that present important opportunities for women’s economic participation in the green industries. For instance certain Fairtrade institutions set up requirements for women’s participation.
However, in order to realise the full potential off ered by intra-regional and international trade, women’s participation in green industries must address a number of bottlenecks. The chal-lenges are diff erent for women who are employed as workers and women business owners. Some of the structural challenges more relevant to women labourers include women’s work loads and access to resources and incomes. Increased participation in trade could increase women’s work load in the absence of necessary support mechanisms such as childcare, shared housework, etc., are not simultaneously considered and put in place. Thus it may not be enough for women to earn higher incomes if there is no simultaneous enhancement in their empowerment and the ability to access household support mechanisms.
Increasing production and greening requirements in most cases places an increased burden on women. Accompanied by lack of control income earned, any increase in green require-ments may act as disincentive for women. Increased and independent income for women allows for greater independence in decision-making on spending at intra-household level. However, the income generated through women’s participation is still often received and controlled by men. Income control is very much related to intra-household dynamics and existing power relations. Women’s participation in the green economy does not therefore automatically lead to gains in gender equality at household level. At the same time, we recognise that over time an increase in women’s contribution to household income could bring about increased bargaining power for women at the household level, where they can have a stronger say in how household budgets are allocated. An important impact of increasing trade is the increase in reliance on contractual workers. While new employment opportunities are generated due to increasing trade, the working conditions are often harsh. Our research shows that women are more likely to be found in informal employment are benefi ting to a lesser degree than men from the job opportunities created by international trade in agricultural products. Because of the poor working condition of the workers, espe-cially women workers in the green industries, the green growth paradigm must consider decent work as one of its key dimensions.
Challenges for women business owners that restricts their participation in green indus-tries and trade include limited access to credit, inputs and market access. Increasing trade
Proof 3a IP chk - (Vol. I) UN Women - Gender Dimensions.indd 77 10/7/2015 4:38:00 PM

66 Gender, Trade and Green Growth Vol. I
creates opportunities but it also increases competition from cheaper imports. Since women entrepreneurs and land owners face more obstacles than their male counterparts in access-ing credit (for new investment and upgradation) and accessing technology, women produc-ers and business owners are more likely to be aff ected by international competition.
Finally, when analysing underlying gender patterns limiting women’s economic participation, it must be emphasised that increased economic participation of women does not automati-cally lead to de facto realisation of gender equality. Access to economic resources does not automatically imply control over them. Economic benefi ts, specifi cally control over income, are dependent on socio-cultural factors, as are all gender power relations. These are context-specifi c, cannot be generalised and require donors, governments and any others to conduct thorough analyses in order to prevent unintended impacts. It is not enough there-fore merely to foster women’s economic participation: comprehensive programmes, which include both women and men, should accompany the transformation of gender roles.
Proof 3a IP chk - (Vol. I) UN Women - Gender Dimensions.indd 78 10/7/2015 4:38:01 PM

Proposed Entry Points to Address Gender in Regional Trade and Integration, especially in the Green Industries
The key fi ndings regarding the impact of trade on women’s quality of life and employ-ment in the green sectors, organized around the four main research questions, are provided below.
The study uses as its starting point the defi nition of “green industries” – provided by the OECD/Eurostat Informal Working Group on the Environment Industry (OECD 1999). However, owing to issues of defi nition and classifi cation, the process of matching the OECD EGS classifi cation to the national database from South Asia was not straightforward and the defi nition and the type of industries vary from country-to-country according to their particular circumstances. This study therefore goes on to expand this defi nition and follows ICTSD (2005), to broaden the defi nition of green industries to include industries that can be considered “close to green”57 as well as a broader defi nition of EGS under the OECD resource management category to include goods and services grown, extracted, manufactured and provided following sustainable criteria at all or some stages of their life cycle (ICTSD, 2005).
Following this defi nition, specifi c goods and services have been identifi ed at the 6-digit HS commodity classifi cation level. The OECD defi nition of green industries is used to classify trade data from the UN COMTRADE database (at the 6-digit HS level) to measure the volume of trade from green industries. This method led to the identifi cation of approximately 5000 industries as green industries.
In addition to the above, the terms of reference of this report pre-selected three green industries for detailed analysis. These are: renewable energy, organic agriculture and ecotourism. It is important to note that owing to defi nitional issues arising from strict rules regarding their certifi cation, farming and related businesses in many developing countries, (including those studied for the purpose of this report), can often not be labelled as “green or organic” as such even though they are carried out in the most sustainable ways possible, (e.g. with little or no chemical intervention), using only indigenous seed varieties and utilis-ing practices that are clearly environmentally friendly, such as the use of solar power to run the entire enterprise. It was thus impossible to even fi nd industry classifi cation in many of these countries that pertained specifi cally to organic agriculture. All agriculture has thus been included in the segment. The same problem arises with eco-tourism. Consequently, when studied at the country level, all tourism has been included in the segment.
57 ‘Close to Green Goods’: Following Hausmann and Klinger (2007) and Dutz (2012), the proximity between a pair of goods is defi ned as the conditional probability of exporting one given that the other is exported. For instance, the proximity of Good A to Good B is 0.5 if as observed in international trade data, the conditional probability that a country exports Good A given that it exports Good B is 0.5. For every green 6-digit HS category, we measure its proximity to all other 6-digit HS categories using COMTRADE data on international trade, averaged over 2005–2008. We classify a product as being ‘close to’ green if there is some green product with a proximity of 0.9 or higher to it. Thus, the probability that a country exports at least one green product given that it already exports a close-to-green product is 90 percent or higher. We then measure the volume of trade in close to green products using COMTRADE.
CHAPTER7
Proof 3a IP chk - (Vol. I) UN Women - Gender Dimensions.indd 79 10/7/2015 4:38:01 PM

68 Gender, Trade and Green Growth Vol. I
However, we have attempted to tackle this issue on a more micro level through country specifi c case studies and all industries covered by them have attempted to stay as true to the defi nitions of eco-tourism and organic agriculture as possible. Therefore specifi c indus-tries were covered in greater depth by the four national studies, aimed not only at dealing with issues of defi nitions and classifi cation detailed above, but also to tease out a more nuanced understanding of the issues that may otherwise be hidden in big datasets. The list of these industries is given in the table below:
Country Industry case studyBangladesh Horticulture and Agro-processingBhutan Agro-processingIndia Organic AgricultureNepal Eco-tourism
Trends in Trade in Green IndustriesGreen exports form a very small (sometimes even insignifi cant) proportion of total exports for all the countries under consideration, except Nepal. Nepal’s green exports have grown in importance over the years and stood at over 40 per cent of its total exports in 2012. It is interesting to note that even though in relative terms green exports are a mostly insignifi -cant and near constant share of India’s total exports, in terms of absolute numbers, India’s green exports far exceed those from the other countries in this study.
At the same time, even though their share has been small, exports from green industries – specifi cally renewable energy – have been on a slow but rising trend since 1989 in all the four countries. Given the national and international policy push in the sector in the years to come, it is expected that the sector will grow further. Of the three industries selected for detailed industry level analysis, agriculture and agro-processing related exports form the bulk of the countries’ export basket. This is not surpris-ing given the fundamental nature of these countries – developing economies with a large primary sector. In terms of bilateral trade, India remains the most dominant trade partner for all 3 countries – Bangladesh, Bhutan and Nepal and this trend continues for trade in the green industries as well. Of the three trade partners, Bangladesh has consistently been India’s most signifi cant trading partner.
Women’s Participation in the Green IndustriesIn terms of women’s role in the green sector, overall FLFP data shows rates that are mostly consistent with economy-wide FLFP rates. In other words, women are engaged to more or less the same extent in green industries as they are in the economy as a whole. This assessment is supplemented by results from the fi eld (presented in the four case studies in Volume II) – all of which report very high LFP rates for women. Admittedly, this could well be because the sectors that were chosen for the case studies, are those that have a high participation by women. However, at the same time it remains true that women are engaged widely and in deeply entrenched ways in primary sectors across all developing economies, and there is a vast under reporting of women’s work in the economy in general.
Proof 3a IP chk - (Vol. I) UN Women - Gender Dimensions.indd 80 10/7/2015 4:38:01 PM

Proposed Entry Points to Address Gender in Regional Trade and Integration, especially in the Green Industries 69
In all four countries, women are mostly employed in agriculture and are signifi cantly under-represented in the industrial sector. More often than the men, women are the marginalised farmers, small horticulturists, the owner of a tiny pickle and jam making home-based enter-prise as well as the factory fl oor level worker. However, as has been documented time and again, their participation in conventional labour force surveys is often undocumented. For instance, the India case study fi nds anomalies between existing country-wide FLP data and what it notes on the ground in the case sea buckthorn cultivation. It notes that sea buckthorn farming is “exclusively the domain of women in collection as well as in trade” and work participation rates for women are much higher than that reported in secondary data and their contribution to both economic growth and trade is heavily unrecognised and uncalculated in the absence of incorporation of harvesting of sea buckthorn.
Of the total workers employed in green industries, Bhutan employs the largest proportion of women. In 2012, 62 per cent of the total employees in Bhutan’s green industries were women, as opposed to 32 per cent in Bangladesh and a mere 19 per cent in India. This share has increased signifi cantly since 1989 for all the three countries. Because of the unavailabili-ty of industry level data on FLFP rate in Nepal, the report could not conduct a similar analy-sis for Nepal. An interesting phenomena in India is the convergence of male and female wages in the green sectors. While overall, there is a signifi cant gender wage gap, analysis of secondary data shows that the average wage gap between male and female has almost disappeared in the green sectors. This fi nding corroborates the premise that wages are – in general – higher in the green industries and that once adequate skills have been acquired, the wage gaps can be reduced in these high skill sectors.
The nature and quality of women’s participation in the green industries is revealed particu-larly well through the four case studies. The case study of women in agro-processing in Bangladesh and Bhutan notes that women farmers and producers are fully involved in the family farm activities and in some cases they are the principal actors and decision-makers. However, their wages are still lower than for men and the work contributes signifi cantly to their time-poverty. Importantly, while women engaged extensively in cultivation, fewer women were found to be involved in the marketing of the produce – thus limiting their integration into the wider economy and thwarting their ability to gain from an expansion in trade or production.
In Bhutan, the factories of the agro-processing companies had women as the majority at the fl oor level. Their participation is concentrated mainly on the factory fl oor attending to manual labour activities such as peeling, cutting, washing, packaging and labelling. While opportunities may exist of promotion and moving up to managerial roles in theory, the fact that most women workers are often illiterate and unskilled creates many barriers in practice.
The Nepal country case study observes while women were well represented in local and national level entrepreneurships in the eco-tourism sector, they are also often found to be of lower socio-economic status, education and literacy levels when compared to their male counterparts. For many women, the business of attending to tourists add up considerably to their daily household duties, especially when husbands and sons are away for extended periods working as foreign labour, trekking porters and guides.
Proof 3a IP chk - (Vol. I) UN Women - Gender Dimensions.indd 81 10/7/2015 4:38:01 PM

70 Gender, Trade and Green Growth Vol. I
Impact of Trade on Women’s Jobs and Quality of LifeSouth Asian regional trade in green industries has had both positive and negative eff ects for the women involved in these sectors. The ability of the national governments of these countries to build on the opportunities depends signifi cantly on their ability to put in place policies that allow women to strengthen their advantages as well as create safety nets where such may be necessary safeguards from exploitation.
In Bangladesh, with greater trade expansion in agriculture, women are seen to be more conscious of the demands of the market, local and international, in terms of quality control, packaging and processing and to be more open to innovation and use of technology. They have more cash to spend, invest and save and are increasingly recognised as economic actors and contributors to family income. The study observes however that while this enhances their ability to earn an income and generate savings, it also increases workloads and their time-poverty. Traditionally defi ned roles also mean that they are reluctant to move into the more commercial aspects such as marketing the produce –reducing market interface and limiting their ability to benefi t from an expansion in trade. The study notes that over time, in Bangladesh, men have moved out of agriculture and into more profi table ventures, while more and more women are moving into the agricultural sector. This raises serious questions about the future prospect of women’s involvement in the sector if it were to become more profi table over time through trade. Unless something is done to specifi -cally address this issue, wouldn’t women be squeezed out as opportunities increase?
In a similar vein, the Nepal case study observes that while involvement with eco-tourism has generated higher incomes than, say agriculture, women are often assigned many, small but tedious jobs, resulting in heavy workloads. Moreover, the burden of keeping the ‘eco’ in eco-tourism often falls upon the women alone. Often women perform their traditionally defi ned roles of running organic kitchen gardens, using improved cook stoves or alternative cooking fuel, ensuring eco-friendly disposal of waste and even creating an environment refl ecting tradition and culture to ensure that the eco-tourists get an ‘authentic’ and ‘natural’ experience! In spite of this, men continue to control the bulk of the earnings and hold decision making powers.
The Nepal study also reports rising incidents of violence against women as tourism opens their villages and homes to strangers with no commensurate rise in security provisions. An expansion in tourism has also reportedly led to a growth in incidents of ‘sex tourism’ as well the generation of vast amounts of garbage, the management of which remains the sole responsibility of women.
The organic horticulture case study presents a more positive picture. It observes that women in the study area in Leh-Ladakh dominate all aspects of sea buckthorn cultivation, harvest and processing and identifi ed it as an assured and respectful source of livelihood. With the majority of the men being employed as tourist and army guides and porters especially in the Siachin Glacier for at least nine months of the year, most households are virtually female-headed who have to often fend for themselves. Their engagement with sea buckthorn cultivation and processing generates for them enough ready cash for daily consumption needs, as well as for the urgent purchase of seeds and to pay for their children’s education. The women often functioned as part of Self Help Groups (SHGs) and are well informed about the market and prices for their product.
Proof 3a IP chk - (Vol. I) UN Women - Gender Dimensions.indd 82 10/7/2015 4:38:01 PM

Proposed Entry Points to Address Gender in Regional Trade and Integration, especially in the Green Industries 71
We argue that as trade expands, strong patriarchal mindsets and women’s lack of access and control over resources could worsen the existing gender inequalities. Both economic theory and empirical evidence tell us that an expansion in trade will result in greater oppor-tunities and increased incomes in the green industries. In the face of such rising opportuni-ties and in the absence of proactive measures pushing women to partake in these increased benefi ts, we anticipate that women will get increasingly marginalised and pushed out of the sector. Even if women are able to participate in the growth of this sector, in the absence of support measures at the household level, it will place even greater burden on their time, pulling them in multiple directions.
Ways ForwardThe fi ndings from the macro and micro analysis allows us to identify some common themes across all green industries to encourage the positive and mitigate the negative impacts of trade on women. There are several sector specifi c recommendations that have been discussed in the previous which can be taken up at the sectoral level. There are also a number of suggestions for ways forward at the national and international level – such as better data and measurement of women’s work – which have resonance outside the green sectors as well. However, given the need to provide specifi c entry points for international development institutions and national governments, the report focuses on suggestions that are more broadly applicable to the region and the sector, as a whole.
Involving women informal traders in trade facilitation: It is important to engage women’s producers and traders, and their respective associations in the formulation of trade facilita-tion policies and measures. Since most of the trade where women are engaged is primarily informal in nature, formalization of trade channels often “crowds out” women traders. It is important to engage informal women traders (through discussions and consultations) to understand how increasing cross border trade in South Asia impacts them and reduce the negative impacts on their livelihood as a result increasing trade openness. Improved infrastructural facilities: These include external infrastructure such as roads connecting the enterprise to the market, storage and processing facilities, power generation capabilities both mainstream as well as alternative and more sustainable sources such as solar power. This also includes the infrastructure available to women within their workplace such as toilets and crèches to take care of their babies – often critical determinants of their ability to work.
Improved access to fi nance: Access to adequate and timely credit and fi nance may be key to women becoming and staying entrepreneurs. In this regard, the Bangladesh case study identifi es some areas which may be seen to be applicable across countries and sectors being studied here - banking services, credit guarantee schemes, loans at preferential rates, pre- and post-investment counselling, simplifi ed lending procedures, tax holidays and maintaining gender based data on credit disbursement and dissemination information on credit opportunities.
Training and skill enhancement: Low skill levels are a common feature of women engaged in green sectors of the 4 economies. Interventions as basic as adult literacy programmes aimed at basic numeracy, reading and writing could go a long way. In addition to this, more intensive skill-building programmes in processing, packaging, communication, use of computers, sales and marketing- are all vital to creating a female workforce able to partici-pate in a growing economy. The Nepal case study points out the importance of training
Proof 3a IP chk - (Vol. I) UN Women - Gender Dimensions.indd 83 10/7/2015 4:38:01 PM
72 Gender, Trade and Green Growth Vol. I
women in “non-stereotypical” vocations too, allowing them to break out of their pre-deter-mined gendered roles.
Encouraging entrepreneurship: Entrepreneurship is an important route to bring about an improvement of the socio-economic status of women engaged in these sectors. It is impor-tant to recognize the role of women in enterprise development in the modern economy and reduce the regulatory barriers they are often confronted with when establishing and operat-ing a new enterprise. Credit programs may also be linked with entrepreneurship develop-ment training programs.
Support mechanisms for households: Given the potential impact of income generation on women’s work-load, it is important to institute interventions that will mitigate these eff ects. These could include community day care centres, cooperative housework where women take turns helping each other in housework while some are engaged in productive work, or strong campaigns for husbands/ men in the family to take on more share of the household tasks.
Gender Inclusive Fair Trade (GIFT): Finally, a suggestion that emerged from the research and its validation at various national validation workshop, was the creation of a South Asia level Gender Inclusive Fair Trade (GIFT) forum that would focus on providing greater market integration for small women entrepreneurs, farmers and factory owners. Women entrepreneurs need to be trained and assisted to be able to create better market linkages, identify buyers and obtain “green” or “fair trade” certifi cation. It is also important to ensure that pricing and marketing information is made available in a structured manner at the local level. Branding and certifi cation issues also need to be dealt with. SHGs may be particularly helpful here, creating collective bargaining power. GIFT, if planned correctly, could poten-tially become a one-stop shop for women working in the green industries and enable them to integrate with international and intra-regional trade opportunities as they arise.
This study concludes that promotion of regional trade in South Asia needs to fully acknowl-edge and integrate gender diff erentials in work force participation and employment into trade policies, in order to ensure that trade expansion addresses the specifi c needs of women. There are several entry points and tools, discussed in both volumes of the report, at the national and regional levels through which women’s concerns can be included in regional economic policies. Finally, the study would also like to add with a note of caution against naively assuming that providing economic participation and increasing incomes will lead to the de facto attainment of gender equality. Instead, we focus on how to make macroeconomic policies – whether its green growth or trade expansion policies - more gender responsive. In order for either growth strategy to address gender inequality, more comprehensive programmes, addressing underlying power roles are needed.
Proof 3a IP chk - (Vol. I) UN Women - Gender Dimensions.indd 84 10/7/2015 4:38:01 PM

Bibliography
Agricultural Census (2001): Jammu and Kashmir State http://agcensus.nic.in/district 1table2.aspx.
Amin, Sajeda, (2006) “Women’s Empowerment and the Labour Market”, draft paper prepared for CPD, Dhaka
Amiti, Mary and Donald Davis (2008). Trade, Firms, and Wages: Theory and Evidence.” NBER Working Paper #14106 (June).
Asian Development Bank, (2010) Overview of Gender Equality and Social Inclusion in Nepal. Mandaluyong City, Philippines: Asian Development Bank
Asian Development Bank, (2010) Country Gender Assessment: Bangladesh. Mandaluyong City, Philippines: Asian Development Bank.
Asian Development Bank, (2013) India: Gender Equality Diagnostic of Selected Sectors. Mandaluyong City, Philippines: Asian Development Bank.
Bangladesh Bureau of Statistics, Statistics Division, Ministry of Planning, (2011) “Labour Force Survey 2010”
Berik, Gunseli; Rodgers, Yana van der Meulen; Zveglich, Joseph E., Jr. (2004), “International Trade and Gender Wage Discrimination: Evidence from East Asia”, Review of Development
Economics, May 2004, v. 8, issue 2, pp. 237–254
Bhattacharya, Devapriya, Daily Star, 21.12.13
Bhalla, Surjit, 2002, Imagine There’s No Country: Poverty, Inequality and Growth in the Era of Globalization (Institute for International Economics, Washington DC, 2002)
Bisht, R. (2008): Agriculture in Ladakh: Continuity and Change, A status Report, TATA-LAHDC Development Programme, Jamsetji Tata Trust, Mumbai.
Bordia Das, Maitreyi and Sanalde Desai, (2003), “Why are Educated Women Likely to be less Employed in India? Testing Competing Hypotheses.” Social Protection Discus-sion Paper Series # 0313.
Bustos, Paula (2007). The Impact of Trade on Technology and Skill Upgrading Evidence from Argentina.” Working Paper, December.
Carr, M., (ed) 2004, Chains of Fortune. Linking Women Producers and Workers with Global Markets , London: Commonwealth Secretariat
Proof 3a IP chk - (Vol. I) UN Women - Gender Dimensions.indd 85 10/7/2015 4:38:02 PM

74 Gender, Trade and Green Growth Vol. I
Choudhuri Zohir, Salma, (2001) “Social Impact of the Growth of Garment Industry in Bangladesh” in The Bangladesh Development Studies Journal, Volume XXVII, No. 4.
de Melo, Jaime, (2012), “Trade in a ‘Green Growth’ Development Strategy: Global Scale Issues and Challenges, Policy Research Working Paper 6236, The World Bank, Washington D.C.: USA
Dewan, R. (2001): Ethics of Employment and Exports: Women in Export Processing Units in India, International Labour Organisation, New Delhi, India (mimeo).
Dewan, R. and B. Manzar (2000): Demystifying Kashmir: Developmental Potential of Horticulture and Tourism, Kashmir Foundation for Peace and Developmental Studies, Srinagar.
Dewan, R. and M. Chawla (1999): Of Development Amidst Fragility: A Societal and Envi-ronmental Perspective on Vadhavan Port, Popular Prakashan, Mumbai.
Dewan, R. and S. Mhatre (1997): Runways across Villages, Himalaya Publishing House, Mumbai.
Dollar, David and Aart Kraay, 2002a, “Growth is Good for the Poor”, Journal of Economic Growth, 7(3): 195-225.
-------------------- (2003), Trade, Growth, And Poverty, The Economic Journal, 114 (February), F22–F49. MA: USA
Donor Committee for Enterprise Development, 2008, Women’s participation in green growth – a potential fully realised?, A scoping study for the Green Growth Working Group (GGWG) of the DCED.
Dutz, Mark A. and Siddharth Sharma. (2012) Green Growth, Technology and Innovation. Policy Research Working Paper No. 5932. The World Bank. Washington D.C.
Elbeshbishi, Amal Nagah , 2009 “A Bird Cannot Fly With Just One Wing: Towards a Gender-Balanced Trading System” Paper Presented at the United Nations Conference on Trade and Development (UNCTAD) Intergovernmental Expert Meeting on Main-streaming Gender in Trade Policy, Geneva- Switzerland 10–11 March 2009
Feenstra, Robert C. and Gordon H. Hanson (1996). Foreign Investment, Outsourcing and Relative Wages.” In R.C. Feenstra, G.M. Grossman and D.A. Irwin, eds., The Political 47 Economy of Trade Policy: Papers in Honor of Jagdish Bhagwati, Cambridge, MA: MIT Press, pp. 89–127.
Feenstra, Robert C., and Hanson, Gordon H. (1999).The Impact of Outsourcing andHigh-Technology Capital on Wages: Estimates for the U.S., 1979–1990.” Quarterly Journal
of Economics, 114:3 (August), pp. 907–940.
Floro, M. S., Grown, C., and Elson, D. (October 2011). Guest Editor’s Note. Feminist Economics, 17 (1-4).
Proof 3a IP chk - (Vol. I) UN Women - Gender Dimensions.indd 86 10/7/2015 4:38:02 PM

75Bibliography
Fontana, M., Joekes, S. and Masika, R., 1998, ‘Global Trade Expansion and Liberalisation: Gender Issues and Impacts’, BRIDGE Development - Gender, Report No. 42, Brighton: Institute of Development Studies
Fontana, M. 2003. “The Gender Eff ects of Trade Liberalisation in Developing Countries: A Review of the Literature”, Discussion Paper in Economics No. 101, University of Sussex, Brighton.
Galay, K. (n.d.). Time Use and Happiness. In Time Use and Balance (pp. 166–203). Retrieved from http://www.bhutanstudies.org.bt/publicationFiles/ConferenceProceedings/4thGNH/4.4thGNH.pdf
Galbraith, James K., 2002, “Is Inequality Decreasing?” Foreign Aff airs, 81(4): 178.
Government of India (2004): Directory of Wholesale Agricultural Produce Assembling Markets in India, MRPC-39, Ministry of Agriculture.
Government of India (2013): Agricultural and Processed Food Products Export Development Authority, Ministry of Commerce and Industry, www.apeda.gov.in.
Government of Jammu and Kashmir (2008): Formulates Plan for Massive Apricot Cultiva-tion, http:// www.ladakhstudies.org/resources/Resources/LS16.pdf.
Government of Jammu and Kashmir: Horticulture, Chapter 17, www.jandkplanning.com
Government of Jammu and Kashmir: Achievements of the Agriculture Production During 2009-11, Agriculture Production Department, http://jkapd.nic.in/highlights.htm.
Government of Jammu and Kashmir: Handbook of Kargil District, 2010-11.
Government of Jammu and Kashmir: Handbook of Leh District, 2010-11.
Government of Jammu and Kashmir: Report of Chief Horticulture Offi cer, Kargil, http://kargil.gov.in/department/horticulture.htm
Government of Jammu and Kashmir: State of Agriculture in Kargil, Chief Agriculture Offi cer, Kargil, http://kargil.nic.in/department/agriculture.htm.
Government of Nepal, (2012) Trade Policy Reviews [Online] Available from: http://www.mocs.gov.np/uploads/Press per cent20Release/TPR per cent20Nepal_Government per cent20Report.pdf
Haji Gh. Amir: From the desk of Executive Councillor, Agriculture and Revenue, LAHDC Kargil, Ladakh Autonomous Hill Development Council Kargil.
Harrison, Ann, McLaren, John, and McMillan, Margaret. 2010. Recent Findings on Trade And Inequality. NBER Working Paper Series #16425.
Hirway, I. (n.d). Using Time Use Data for Estimating Informal Sector in Developing Countries: Conceptual and Methodological Issues with Reference to South Asia.
Proof 3a IP chk - (Vol. I) UN Women - Gender Dimensions.indd 87 10/7/2015 4:38:02 PM

76 Gender, Trade and Green Growth Vol. I
Hudry, C., (2012) Sustainable Tourism: NGO’s Tool for Community Development [Online] Available from: http://www.netif-nepal.org/Kathmandu per cent20Valley per cent20Report per cent20cecile.pdf
IISD. (2010) Beyond Barriers: The Gender Implications of Trade Liberalisation in South Africa
ILO STED: Initial Findings on the Agro-Processing Sector. Tripartite Workshop on Skills for Trade and Economic Diversifi cation in Bangladesh. Dhaka, September 8, 2011. Presentation by Erik von Uexkull, ILO Trade and Employment Programme and Con Gregg, ILO Skills Department
Integrated Research and Action for Development and Energia. 2009. Gender Analysis of Renewable Energy in India : Present Status, Issues, Approaches and New Initiatives, 2009.
Jarvis, Lovell S. and Esperanza Vera-Toscano, (2004) “The Impact of Chilean Fruit Sector Development on Female Employment and Household Income”, Working Paper No. 04-002.
Jina, P.S. (1994): Tourism in Ladakh Himalaya, Indus Publishing New Delhi, pp. 35–37.
Kabeer, Naila and Mahmud, Simeen (2004) Globalization, gender and poverty: Bangladeshi women workers in export and local markets. Journal of International Development, 16 (1). pp. 93–109. ISSN 0954-1748
Kabeer, N., Mahmud, S. and S. Tasneem, (2011), “Does Paid Work Provide a Pathway to Women’s Empowerment? Empirical Findings from Bangladesh”, IDS Working Paper 375, Brighton: IDS
Korinek, J. (2005), “Trade and Gender: Issues and Interactions”, OECD Trade Policy Papers, No. 24, OECD Publishing.
Lama, M., (2013) Community Homestay Programmes as a Form of Sustainable Tourism Development in Nepal
Lendo, Enrique (2005). Defi ning Environmental Goods and Services: A Case Study of Mexico. Issue Paper 1. ICTSD. Geneva.
Mahmud, Simeen and Shamim Hamid, (1990), “Women and Employment in Bangladesh”, BIDS Research Report no 127, BIDS Dhaka.
Mahmud, Simeen, (2003), “Is Bangladesh Experiencing a Feminisation of the Labour Force” in The Bangladesh Development Studies Journal, Volume XXIX, No.1&2.
Mainlay, J., and Tan, S, F., (2012) Mainstreaming Gender and Climate Change in Nepal [Online] Available from: http://wocan.org/sites/drupal.wocan.org/fi les/Mainstreaming per cent20Gender per cent20and per cent20CC per cent20in per cent20Nepal.pdf
Proof 3a IP chk - (Vol. I) UN Women - Gender Dimensions.indd 88 10/7/2015 4:38:02 PM

77Bibliography
Majumdar, Paul, Pratima and Begum, Anwara (2000), “The Gender Imbalances in the Export Oriented Garment Industry in Bangladesh”, Policy Research Report on Gender and Development, Working Paper Series no 12, The World Bank Development Research
Manandhar, L,K., and Bhattachan, K,B., (n.d.) Gender and Democracy in Nepal [Online] Available from: http://www.fesnepal.org/publications/Gender_Democracy.pdf
Meltzer, J. xxxx. Green Growth and International Trade. Global Economy and Development Program. Brookings Institutions. Washington D.C.
Menezes-Filho, Naercio, and Muendler, Marc-Andreas (2007). Labour Reallocation inResponse to Trade Reform.” CESifo Working Papers #1936 (March).
Moinuddin, Mustafa, (2013), “Fulfi lling the Promises of South Asian Integration: A Gravity Estimation”, ADBI Working Paper Series.
OECD (1999) “The Environmental Goods and Services Industry: MANUAL FOR DATA COLLECTION AND ANALYSIS” OECD, Paris.
OECD, (2009) Gender Mainstreaming: A New Challenge for the Federal Government and the Administrations.
OECD (2011), “Towards Green Growth: Monitoring Progress - OECD Indicators”, OECD, Paris.
OECD, (2011) Towards Green Growth [Online] Available from: http://www.oecd.org/ greengrowth/48012345.pdf
Oostendorp, R. H. 2004. “Globalization and the Gender Wage Gap.” Policy Research Work-ing Paper 3256. World Bank, Washington, D.C.
Organic Farming: Ladakh’s Way to Go http://www.reachladakh.com/archive_details.php?pID=1287#sthash.kzZNgJja.dpuf Reach Ladakh, November 10, 2012.
Pandey, Hemprabha and Pradyumna Raj Pandey, “Socio-economic Development through Agro-tourism: A Case Study of Bhaktapur, Nepal”, The Journal of Agriculture and Environment Vol:12, Jun.2011).
PREM Notes, Gender, May 2004, Number 86, The World Bank
Randriamaro, Z. (2006) ‘Gender and Trade’ Cutting Edge Pack, Brighton, BRIDGE, Institute of Development Studies, http://www.bridge.ids.ac.uk/reports_gend_CEP
Ravallion, Martin, (2003), The Debate on Globalization, Poverty and Inequality: Why Measurement Matters. World Bank Policy Research Working Paper 3038, World Bank, Washington DC.
Proof 3a IP chk - (Vol. I) UN Women - Gender Dimensions.indd 89 10/7/2015 4:38:02 PM

78 Gender, Trade and Green Growth Vol. I
Rodríguez, D. and Venegas, S. (1989). De praderas a parronales. Grupo de Estudios, Agro-regionales de la Universidad Academia de Humanismo Cristiano (GEA), Santiago, Chile. Agriculture, trade negotiations and Gender, Zoraida Garcia, Jennifer Nyberg and Shayma Owaise Saadat) , FAO 2006
Schultz, T. Paul, (2006), “Does the Liberalisation of Trade Advance Gender Equality in Schooling and Health?” Economic Growth Center, Yale University.
-------------------------------- (May 2006), “Does the Liberalisation of Trade Advance Gender Equality in Schooling and Health?”.
Sony, K.C. (2012). Roles and Challenges of Women in Tourism Sector of Western Nepal: A Micro- Ethnographic Study. Nepal Tourism and Development Review. 2. pp. 32–59. Kathmandu: Nepal.
Srinivasan, G. (2007): Leh and Kargil have great trade and employment potential, The Hindu.
SWATEE (2012) Overview of Trading System in Nepal [Online] Available from: http://www.sawtee.org/presentations/TradingSystem_Purushottam.pdf
SWATEE (2013) Trade Negotiation Strategy for Nepal [Online] Available from: http://www.sawtee.org/publications/Research-Brief-4.pdf
SWATEE (2013) A Review of Trade and Industrial Policy in Nepal [Online] Available from: http://www.sawtee.org/publications/Research-Brief-3.pdf
Thapa, S,B., (n.d.) Trade Flows: Evidence from Gravity Model [Online] Available from: http://www.nrb.org.np/ecorev/pdffi les/vol24-1_art2.pdf
The World Bank, (2006) Gender Equality and Smart Economics: A World Bank Group Gender Action Plan [Online] Available from: http://siteresources.worldbank.org/INTGEN-DER/Resources/GAPNov2.pdf
The World Bank, (2012) Inclusive Green Growth: The Pathway to Sustainable Development
Toufi que, Kazi and Turton, Cate, Editors, Hands not Land: How Livelihoods are Changing in Rural Bangladesh, Bangladesh Institute of Development Studies, 2002
United Nations Environment Programme, (2002) Ecotourism: Principles, Practices and Policies for Sustainability [Online] Available from: http://www.pnuma.org/efi cienciarecursos/documentos/Ecotourism1.pdf
UNCTAD, (2010), The Green Economy: Trade And Sustainable Development Implications. Background note prepared by the UNCTAD secretariat for the Ad Hoc Expert Meet-ing on the Green Economy. Geneva: Switzerland.
UNEP, (2013), Green Economy and Trade – Trends, Challenges and Opportunities
Proof 3a IP chk - (Vol. I) UN Women - Gender Dimensions.indd 90 10/7/2015 4:38:02 PM

79Bibliography
Venegas, S. (1992). Una gota al día…un chorro al año: el impacto social de la expansión frutícola. Santiago, Grupo de Estudios Agro-regionales de la Universidad Academia de Humanismo Cristiano (GEA).
Winker, T., (2012) Ecotourism as Community Development Tool: Development of an Evaluation Framework. Available from: http://www.netif-nepal.org/Winkler_MasterThesis_FINAL per cent20VERSION[1].pdf
World Bank, (2012), Inclusive Green Growth: The Pathway to Sustainable Development, 2012, World Bank, Washington, DC.
Yadav, A. K., Organic Agriculture: Concept, Scenario, Principals and Practices, National Centre for Organic Farming, Ministry of Agriculture, Ghaziabad, Uttar Pradesh.
Yogi, H,N., (2010) Eco-tourism and Sustainability – Opportunities and Challenges in the Case of Nepal.
Proof 3a IP chk - (Vol. I) UN Women - Gender Dimensions.indd 91 10/7/2015 4:38:02 PM

80 Gender, Trade and Green Growth Vol. I
AnnexesANNEX 1. Project Timeline
Activities2013 2014
10 11 12 1 2 3 4 5 6 7 8 9 10 11Recruitment of project staff and consultants; Setting up advisory committeesSigning of Cost Sharing Agreement between ADB and UN WomenPlanning meeting with PMU and ADBLiterature review and methodology fi nalizationPreparation of Inception ReportFirst Broad Reference Group Meeting (presentation of Inception Report)Data CollectionDe-brief meeting post-data collectionData analysis and preparation of draft reportSecond Meeting of Broad Reference Group (presentation of draft interim report)Revision of Interim Study ReportNational Validation Workshops in Nepal and BangladeshSharing of Draft reportRegional Validation WorkshopRevision and fi nalization of Study ReportSubmission of Final Report
Proof 3a IP chk - (Vol. I) UN Women - Gender Dimensions.indd 92 10/7/2015 4:38:03 PM

81
ANNEX 2. Project TeamThe project was implemented by UN Women, with a small core team of UN Women staff working on this project. These included
Project Management Team
• Shreyasi Jha, Lead Research Manager• Navanita Sinha, Program Coordinator• Amee Misra, Research Analyst• Shrijna Dixon, Program Assistant
National Researchers
In addition, four national researchers conducted country specifi c industry studies in each of the four South Asian countries
• Maheen Sultan, Bangladesh• Sonam Tobgay, Bhutan• Ritu Dewan, India• Saloni Singh, Nepal
Consultative Bodies
The management structure of the research also comprised of two consultative bodies.
Description Members
Technical Advisory Group (TAG)
Comprised four three technical experts on international trade and feminist economics. The TAG provided technical inputs, including:
• Defi ne objectives and delimiting the scope of the overall report and country/sectoral case studies
• Provide input on the research docu-ments – Inception Report and Draft Report
• Monitor the quality of the analysis and recommendations that will stem from the research (Inception Report, Preliminary fi ndings and Final Report), in terms of economic and theoretical soundness
• Disseminate the report, especially among the organizations and entities within their interest group
• Dr. Chandra Bhadra, Nepal• Ms. Yumiko Yamammoto,
UNDP, Bangkok• Dr. S. M. Mani, World
Bank, Washington DC• Prof. Maria Floro,
American University, Washington DC
Annex 2. Project Team
Proof 3a IP chk - (Vol. I) UN Women - Gender Dimensions.indd 93 10/7/2015 4:38:03 PM

82 Gender, Trade and Green Growth Vol. I
Description Members
Broad Reference Group(BRG)
Consultative body
The BRG comprised of select government partners from the four countries where the study was conducted e as well as senior representatives from UN Women and ADB.
• Provide oversight and safeguard independence over the course of the project.
• Provide guidance on key deliverables (Inception Report and Draft and Final MTR Report) submitted by the project team.
• Support dissemination of the fi ndings and recommendations.
• Dr. H.A.C. Prasad, Senior Economic Advisor, Department of Economic Aff airs, Ministry of Finance, Government of India
• Ms. Phintso Choeden, Director General, National Commission for Women and Children, Royal Government of Bhutan
• Mr. Purna Chandra Bhattarai, Joint Secretary, Ministry of Culture, Tourism and Civil Aviation, Government of Nepal
• Mr. Ziad Sheikh, Country Representative, UN Women, Nepal
• Ms. Christine Hunter, Country Representative, UN Women, Bangladesh
• Ms. Rinzi Pen, National Coordinator, UN Women, Bhutan
• Dr. Rebecca Reichmann Tavares, Country Repre-sentative, UN Women India MCO
• Ms. Yamini Mishra, GRB Specialist (Asia Pacifi c), UN Women
• Mr. Francesco Tornieri, Principal Social Develop-ment Specialist (GAD), SAOD
• Ms. Mary Alice Rosero, Gender Consultant, SAOD
Proof 3a IP chk - (Vol. I) UN Women - Gender Dimensions.indd 94 10/7/2015 4:38:03 PM

83
ANNEX 3. List of People Interviewed/ Consulted
No. Name Organization Designation
BANGLADESH
1. Ahsan Khan Chowdhury PRAN Deputy Managing Director
2. Anirban Bhowmik DFID-B Private Sector Development Advisor
3. Anjan Choudhury Bangladesh Agro-processors’ Association (BAPA)
President
4. Arun Kumar Saha ADB (retired) Focal Point , Agriculture and Natural Resources
5. Azmal Huda Kranti Associates/SCDP Deputy Team Leader6. Dr Nurul Quadir Ministry of Environment and
ForestsJoint Secretary
7. Eleash Mridha PRAN Director8. Farida DAE/SCDP Programme Participant9. Farida Akhtar UBINIG, Noya Krishi
AndolonFounder
10. Fatama Amin Amin Food Processing Indus-tries Ltd.
Managing Director
11. Firoza Begum PRAN Agro Hub, Nator Sub-lead Farmer12. G.A. Rayhan FBCCI /Chittagong Women
Chamber of Commerce and Industry
Business Development Consultant
13. G.B. Banjara KATALYST Division Manager, Knowledge and Capitalisa-tion Management
14. Golesa Khatun DAE/SCDP Programme Participant15. Hamidur Rahman DAE, Second Crop Diversifi ca-
tion Project (SCDP)Project Director
16. Jebunnessa Lily Kranti Associates/SCDP Gender and Social Devel-opment Specialist
17. Josthna Begum PRAN Agro Hub, Nator Sub-lead Farmer18. Kamruzzaman PRAN M (CF), PABL, Natore19. Khondaker Morshed Millat Green Banking and CST
Department, Bangladesh Bank
Deputy General Manager
20. Khurshid Ahmad Square Consumers’ Products Limited
Asst. General Manager Export
21. Mabia Begum DAE/SCDP Programme Participant22. Md Mahatab Uddin PRAN Chief Operating Offi cer
23. Md Mohasin Kabir KATALYST Manager , LAN, Capitalisa-tion, Innovation Funds
Annex 3. List of People Interviewed/Consulted
Proof 3a IP chk - (Vol. I) UN Women - Gender Dimensions.indd 95 10/7/2015 4:38:03 PM
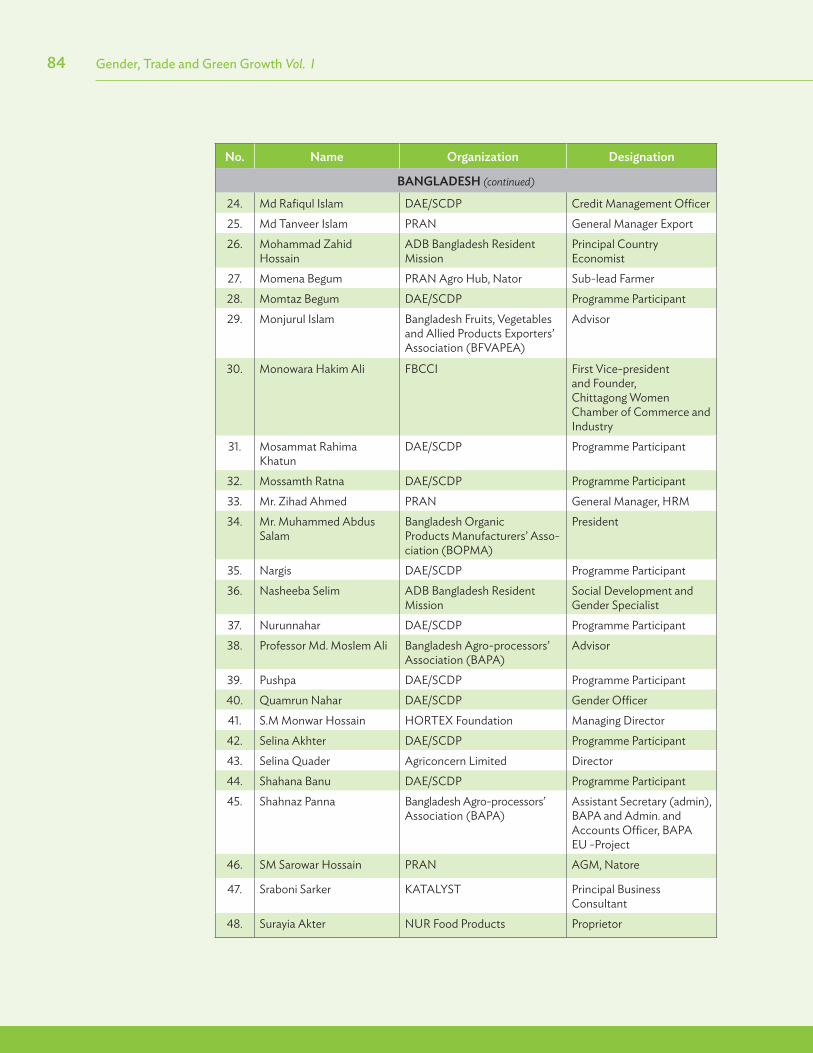
84 Gender, Trade and Green Growth Vol. I
No. Name Organization Designation
BANGLADESH (continued)
24. Md Rafi qul Islam DAE/SCDP Credit Management Offi cer25. Md Tanveer Islam PRAN General Manager Export26. Mohammad Zahid
HossainADB Bangladesh Resident Mission
Principal Country Economist
27. Momena Begum PRAN Agro Hub, Nator Sub-lead Farmer28. Momtaz Begum DAE/SCDP Programme Participant29. Monjurul Islam Bangladesh Fruits, Vegetables
and Allied Products Exporters’ Association (BFVAPEA)
Advisor
30. Monowara Hakim Ali FBCCI First Vice-presidentand Founder,Chittagong Women Chamber of Commerce and Industry
31. Mosammat Rahima Khatun
DAE/SCDP Programme Participant
32. Mossamth Ratna DAE/SCDP Programme Participant33. Mr. Zihad Ahmed PRAN General Manager, HRM34. Mr. Muhammed Abdus
SalamBangladesh Organic Products Manufacturers’ Asso-ciation (BOPMA)
President
35. Nargis DAE/SCDP Programme Participant36. Nasheeba Selim ADB Bangladesh Resident
MissionSocial Development and Gender Specialist
37. Nurunnahar DAE/SCDP Programme Participant38. Professor Md. Moslem Ali Bangladesh Agro-processors’
Association (BAPA)Advisor
39. Pushpa DAE/SCDP Programme Participant40. Quamrun Nahar DAE/SCDP Gender Offi cer41. S.M Monwar Hossain HORTEX Foundation Managing Director42. Selina Akhter DAE/SCDP Programme Participant43. Selina Quader Agriconcern Limited Director44. Shahana Banu DAE/SCDP Programme Participant45. Shahnaz Panna Bangladesh Agro-processors’
Association (BAPA)Assistant Secretary (admin), BAPA and Admin. and Accounts Offi cer, BAPA EU -Project
46. SM Sarowar Hossain PRAN AGM, Natore
47. Sraboni Sarker KATALYST Principal Business Consultant
48. Surayia Akter NUR Food Products Proprietor
Proof 3a IP chk - (Vol. I) UN Women - Gender Dimensions.indd 96 10/7/2015 4:38:03 PM

85
No. Name Organization Designation
BANGLADESH (continued)
49. Uzma Chowdhury PRAN-RFL Director, CS-Corp Fin –Director
50. Zahidul Alam DAE Upazila Agricultural Offi cer51. Zakia Sultana DAE Upazila Agricultural Offi cer
BHUTAN
52. Aum Yozer Lham Bumthang Cheese Proprietor53. Mr. Deo Kumar BEKAP Treasurer54. Mr. Dhan Raj Gurung BEKAP Internal Auditor55. Mr. Jurmi Dorji Daga Tshingdre Tshogpa Chairperson56. Mr. Jyoti Subbha, BFPPL Laboratory Assistant57. Mr. K.B Gurung Daga Tshingdre Tshogpa Secretary58. Mr. Namgay BEKAP Board Member59. Mr. Panphe Devi Daga Tshingdre Tshogpa Board Member60. Mr. Sangay BEKAP Board Member 61. Mr. Sonam Rinchen BEKAP Board Member62. Mr. Tashi Wangdi BAIL Marketing Manager63. Mr. Thinley Tharchen BFPPL Adminstration Offi cer64. Mr. Tul Bahadur Chhetri BEKAP Chairperson65. Mr. Ugyen Rinzin AWP General Manager66. Ms. Dechen Chharu Tshogdrel Proprietor67. Ms. Rita Gurung BFPPL Plant Manager,68. Ms. Tandin Zangmo BFPPL Laboratory Assistant
INDIA
69. Dr. PVSM Gouri Agricultural and Processed Food Product Export Develop-ment Authority (APEDA)
Advisor NAB(Organic Products)
70. 9 respondents (4 males and fi ve females)
SHG SHG member
71. 18 respondents (3 males and 15 females)
SHG SHG member
72. 20 respondents (5 males and 15 females)
SHG SHG member
73. 18 respondents (8 males and 10 females)
SHG SHG member
74. 29 respondents (5 males and 24 females)
SHG SHG member
75. 30 respondents (8 males and 22 females)
SHG SHG member
76. 18 respondents (4 males and 14 females)
SHG SHG member
Annex 3. List of People Interviewed/Consulted
Proof 3a IP chk - (Vol. I) UN Women - Gender Dimensions.indd 97 10/7/2015 4:38:03 PM

86 Gender, Trade and Green Growth Vol. I
No. Name Organization Designation
INDIA (continued)
77. 20 respondents (4 males and 16 females)
SHG SHG member
78. 16 respondents (4 males and 12 females)
SHG SHG member
79. 22 respondents (3 males and 19 females)
SHG SHG member
80. 3 male respondents Local entrepreneurs and government staff at district and village level
81. 3 respondents (2 males and 1 female)
Local entrepreneurs and government staff at district and village level
82. 4 respondents (2 males and 2 females)
Local entrepreneurs and government staff at district and village level
83. 2 male respondents Local entrepreneurs and government staff at district and village level
84. 3 respondents (2 males and 1 female)
Local entrepreneurs and government staff at district and village level
85. I male respondent Local entrepreneurs and government staff at district and village level
86. I male respondent Local entrepreneurs and government staff at district and village level
87. 4 respondents (2 males and 2 females)
Local entrepreneurs and government staff at district and village level
88. 4 respondents (1 male and 3 females)
Local entrepreneurs and government staff at district and village level
89. 3 respondents (1 male and 2 females)
Local entrepreneurs and government staff at district and village level
90. 16 respondents (4 males and 12 females)
Local villagers
91. 16 respondents (1 male and 15 females)
Local villagers
92. 5 respondents (2 males and 3 females)
Local villagers
93. 8 respondents (2 males and 6 females)
Local villagers
Proof 3a IP chk - (Vol. I) UN Women - Gender Dimensions.indd 98 10/7/2015 4:38:03 PM
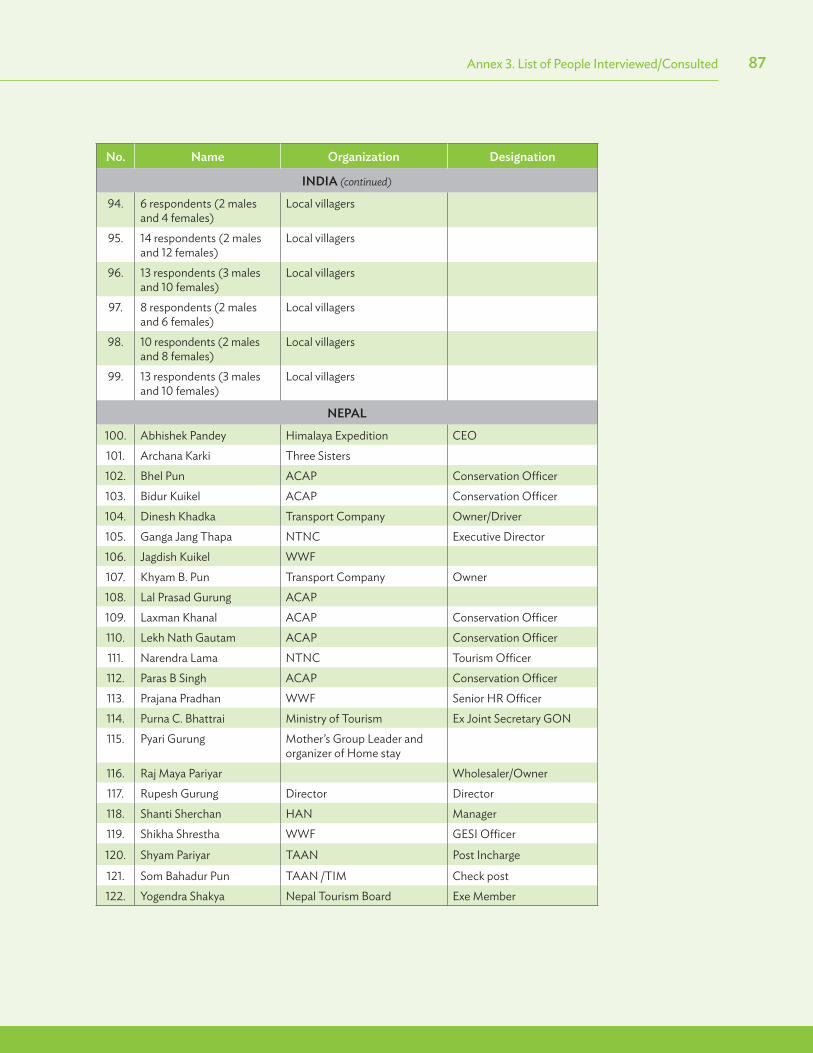
87
No. Name Organization Designation
INDIA (continued)
94. 6 respondents (2 males and 4 females)
Local villagers
95. 14 respondents (2 males and 12 females)
Local villagers
96. 13 respondents (3 males and 10 females)
Local villagers
97. 8 respondents (2 males and 6 females)
Local villagers
98. 10 respondents (2 males and 8 females)
Local villagers
99. 13 respondents (3 males and 10 females)
Local villagers
NEPAL
100. Abhishek Pandey Himalaya Expedition CEO101. Archana Karki Three Sisters102. Bhel Pun ACAP Conservation Offi cer103. Bidur Kuikel ACAP Conservation Offi cer104. Dinesh Khadka Transport Company Owner/Driver105. Ganga Jang Thapa NTNC Executive Director106. Jagdish Kuikel WWF107. Khyam B. Pun Transport Company Owner108. Lal Prasad Gurung ACAP109. Laxman Khanal ACAP Conservation Offi cer110. Lekh Nath Gautam ACAP Conservation Offi cer111. Narendra Lama NTNC Tourism Offi cer112. Paras B Singh ACAP Conservation Offi cer113. Prajana Pradhan WWF Senior HR Offi cer114. Purna C. Bhattrai Ministry of Tourism Ex Joint Secretary GON115. Pyari Gurung Mother’s Group Leader and
organizer of Home stay 116. Raj Maya Pariyar Wholesaler/Owner117. Rupesh Gurung Director Director118. Shanti Sherchan HAN Manager119. Shikha Shrestha WWF GESI Offi cer
120. Shyam Pariyar TAAN Post Incharge
121. Som Bahadur Pun TAAN /TIM Check post122. Yogendra Shakya Nepal Tourism Board Exe Member
Annex 3. List of People Interviewed/Consulted
Proof 3a IP chk - (Vol. I) UN Women - Gender Dimensions.indd 99 10/7/2015 4:38:04 PM

88 Gender, Trade and Green Growth Vol. I
ANNEX 4. Research Matrix
Research Objective
Primary Question Sub-questions Type of
analysis Data Sources
Objective 1:
To identify “green industries”, including their potential markets for trade of both goods and services, as well as their potential for job and livelihood creation for the poor, especially women, which can increase intra-regional trade, in three sectors, namely organic agricultural produce, renewable energy (e.g., solar, including solar-based hybrid systems and biomass), and ecotourism.
1. What are the green industries (within the three sectors identifi ed in this study – organic agricul-tural produce, renewable energy, and ecotourism sectors)?
What are the green industries within these sectors in the four countries?
Literature review; UN Stats Environment Manual for Data Collection
Match 6-digit HS and NAICS code to 4-digit ISIC data
UN COMTRADE; OECD
2. What are the trends in trade and employment from green industries, i.e. both imports, exports, and services – within and outside the region?
Are the green industries currently engaged in interna-tional trade? Which countries do they trade with? How much? What is the nature of the trade (i.e. imports, exports, services)? How has it changed over time?
Descriptive statistics
Exports, imports (2 or 3 digit ISIC levels); Tariff data
UN COMTRADE
3. What is the pattern of women partici-pation and employment in the green industries?
How many people are emplyed in these industries? How many women? How much do they earn relative to other industries (nation-al averages)? How much do women earn in these industries relative to the other industries in that country? how is the male-female wage diff erential diff erent in these industries from other industries in the country?
Quantitative; Descriptive statistcs; Simple regression dependant variable; gender inequality in the diff erent green industries and sectors, relative to South Asian averages, relative to country-specifi c averages
Wages (female and male); employment (female and male); labour force partici-pation rates; exports; imports;
UN COMTRADE; National data-base (where available); Labour statistics
Identify factors that impact gender inequality in these industries. What factors explain why some green industries have less gender inequality than others?
Based on sectoral case studies, identify factors that impact women’s participation in the green sectors
Wages (female and male); employment (female and male); labour force partici-pation rates; exports; imports; primary data and interviews
UN COMTRADE; National data-base (where available); Labour statistics; Primary data from green industries
Proof 3a IP chk - (Vol. I) UN Women - Gender Dimensions.indd 100 10/7/2015 4:38:04 PM

89
Research Objective
Primary Question Sub-questions Type of
analysis Data Sources
Objective 2:
To conduct a gender analysis of South Asia regional trade, which will identify gender issues and recommend actions at the sub-regional level that will mitigate possible negative impacts of trade policy and trade liberalization on women’s products and facili-tate their participa-tion in intra-regional trade, especially as far as the green industries are involved.
4. What is the impact of increasing trade in the green industries on women partici-pation and employment? Is international trade a signifi -cant factor in determining women’s par ticipation and employ-ment in the green sectors?
How have employment and gender inequality changed over time in green industries? What factors explain how employment and gender inequality have changed over time (is international trade a factor)?
Industry-wise, panel data regression model to measure the impact of trade on women’s participation in the green indus-tries? How has it changed over time?; sector specifi c case studies
Wages (female and male); employment (female and male); labour force partici-pation rates; exports; imports; primary data and inter-views; supply chain analysis of the green sectors
UN COMTRADE; National data-base (where available); Labour statistics; Primary data from green industries
Objective 3:
To locate entry points for sector and gender specialists to mainstream Gender Inequality and Social Inclusion (GESI) in regional trade and cooperation-related projects.
5. Identify the channels and mechanism through which an expansion in trade in the green indus-tries impacts women; what can be done to encourage/mitigate these impacts?
Can an increase in South Asian trade impact women negatively? How i.e. through what chan-nels/mechanisms? What can be done to mitigate this? Focus on green industries.
Case studies to identify industry specifi c mecha-nism for positive and negative impact
Wages (female and male); employment (female and male); labour force partici-pation rates; exports; imports; primary data and inter-views; supply chain analysis of the green sectors
UN COMTRADE; National data-base (where available); Labour statistics; Primary data from green industries
Annex 4. Research Matrix
Proof 3a IP chk - (Vol. I) UN Women - Gender Dimensions.indd 101 10/7/2015 4:38:04 PM
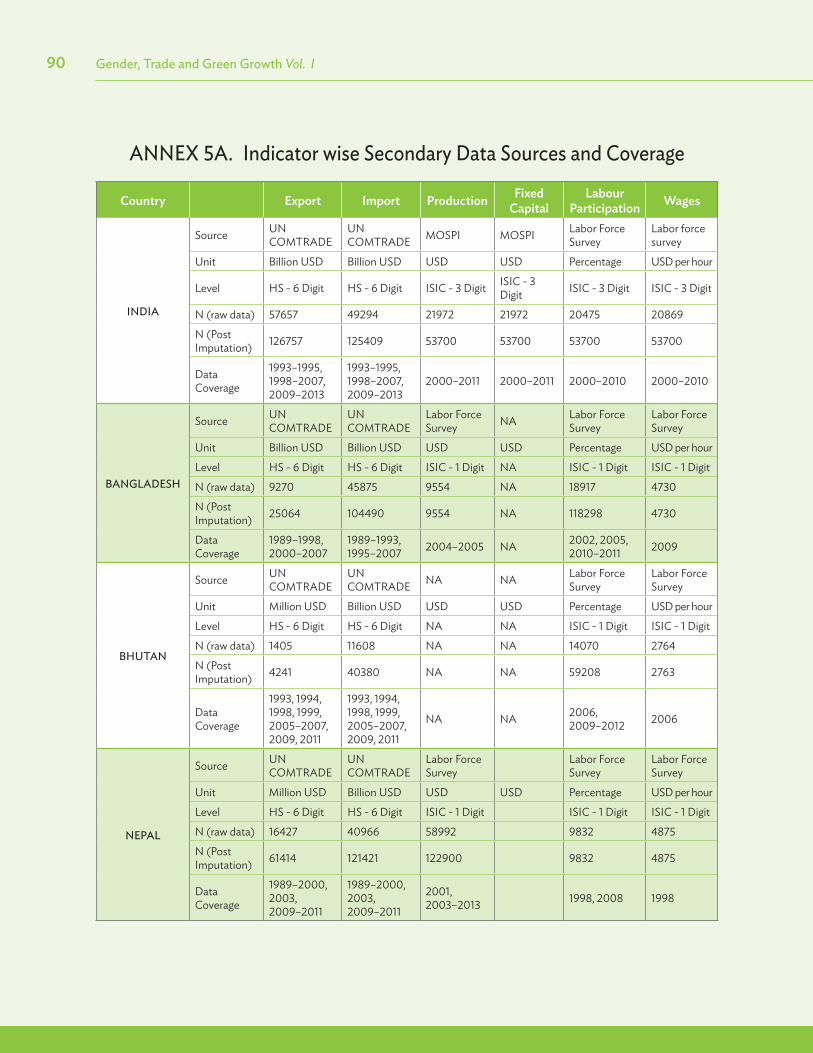
90 Gender, Trade and Green Growth Vol. I
ANNEX 5A. Indicator wise Secondary Data Sources and Coverage
Country Export Import Production Fixed Capital
Labour Participation Wages
INDIA
Source UN COMTRADE
UN COMTRADE MOSPI MOSPI Labor Force
SurveyLabor force survey
Unit Billion USD Billion USD USD USD Percentage USD per hour
Level HS - 6 Digit HS - 6 Digit ISIC - 3 Digit ISIC - 3 Digit ISIC - 3 Digit ISIC - 3 Digit
N (raw data) 57657 49294 21972 21972 20475 20869
N (Post Imputation) 126757 125409 53700 53700 53700 53700
Data Coverage
1993–1995, 1998–2007, 2009–2013
1993–1995, 1998–2007, 2009–2013
2000–2011 2000–2011 2000–2010 2000–2010
BANGLADESH
Source UN COMTRADE
UN COMTRADE
Labor Force Survey NA Labor Force
SurveyLabor Force Survey
Unit Billion USD Billion USD USD USD Percentage USD per hour
Level HS - 6 Digit HS - 6 Digit ISIC - 1 Digit NA ISIC - 1 Digit ISIC - 1 Digit
N (raw data) 9270 45875 9554 NA 18917 4730
N (Post Imputation) 25064 104490 9554 NA 118298 4730
Data Coverage
1989–1998, 2000–2007
1989–1993, 1995–2007 2004–2005 NA 2002, 2005,
2010–2011 2009
BHUTAN
Source UN COMTRADE
UN COMTRADE NA NA Labor Force
SurveyLabor Force Survey
Unit Million USD Billion USD USD USD Percentage USD per hour
Level HS - 6 Digit HS - 6 Digit NA NA ISIC - 1 Digit ISIC - 1 Digit
N (raw data) 1405 11608 NA NA 14070 2764
N (Post Imputation) 4241 40380 NA NA 59208 2763
Data Coverage
1993, 1994, 1998, 1999, 2005–2007, 2009, 2011
1993, 1994, 1998, 1999, 2005–2007, 2009, 2011
NA NA 2006, 2009–2012 2006
NEPAL
Source UN COMTRADE
UN COMTRADE
Labor Force Survey
Labor Force Survey
Labor Force Survey
Unit Million USD Billion USD USD USD Percentage USD per hour
Level HS - 6 Digit HS - 6 Digit ISIC - 1 Digit ISIC - 1 Digit ISIC - 1 Digit
N (raw data) 16427 40966 58992 9832 4875
N (Post Imputation) 61414 121421 122900 9832 4875
Data Coverage
1989–2000, 2003, 2009–2011
1989–2000, 2003, 2009–2011
2001, 2003–2013 1998, 2008 1998
Proof 3a IP chk - (Vol. I) UN Women - Gender Dimensions.indd 102 10/7/2015 4:38:04 PM

91
ANNEX 5B. Note on Treatment of Missing Data and Outliers
Treatment of missing data
Due to lack of continuous time series and good quality data, missing values were imputed using mean-based interpolation (for data points missing between available data) and regression-based extrapolation (for extending into future time periods from an available string of data). Imputation was thus carried out at two stages at an Industry level.
Mean-Based Interpolation
For this purpose, every Industry’s minimum and maximum data available year were identi-fi ed. For all values missing within this range, the average of the consecutive non-missing values were calculated and used as substitute for the missing values.
If Xi is the missing value, then it was replaced with a value that was calculated as –
Xi = (X (i-1) + X(i-1)) 2
Where X = {X1, X2, X3, Xn}
If there existed cases where 2 or more consecutive values are missing, they were replaced with the same value which would be the average of the surrounding/nearest non-missing values on both sides.
Note that only Industries that had a minimum of three non-missing values were considered for Imputation. Less than three non-missing values would mean very little information on the variable behavior and hence, imputation could go adversely wrong.
Regression – Based Extrapolation
A linear regression model was built where the non-missing values of a given variables were regressed against the years and the regression co-effi cient thus obtained was used to predict the missing values -
Yi = + (Yeari) + i
Where,Yi = Variable to be imputedYeari = Year of observation
The total number of data points imputed/extrapolated for each variable is marked in red in all the charts in the report.
Annex 5B. Note on Treatment of Missing Data and Outliers
Proof 3a IP chk - (Vol. I) UN Women - Gender Dimensions.indd 103 10/7/2015 4:38:04 PM

92 Gender, Trade and Green Growth Vol. I
Test to check for imputed data’s validity
A two sample t- test was carried out for each ISIC value to test if the interpolated data was a true representation of the original data. Considering the data before interpolation sample A and that after interpolation as sample B, and extracting the samples for each Industry, the t-test was used to determine if sample A’s mean was statistically diff erent from Sample B’s mean.
Treatment of Outliers
Data was treated for outliers to smoothen out the curves under reasonable assumptions. This was necessary because there were certain industries with sudden, very high values particularly for export and female labour participation rates – skewing the distribution. First, any values higher than the 99th percentile were replaced by the mean of the variable’s (non-missing) values lying between the values up to the 99th percentile.
Discounting to 1990 constant USD
All values were in current USD. They were converted to Constant USD 1990 using exchange rate data from US Federal Reserve Bank. The methodology employed was as –
• Convert the current currency (INR/TK/NPR/BTN) amount into current USD.• Use the USD constant Conversion Factor to convert the current USD value in
constant USD 1990.• The excel worksheet contains all Value for Constant USD 1990 Conversion Factor
and the current currency conversion rates (INR/TK/NPR/BTN) across the years for all the countries.
Example: If value of production for India is 1000000 Current INR for 2005, the Constant USD was calculated as follows:
Divide 1000000 by USD Conversion Rate for 2005 (44.011). The USD current value is 1000000/44.011 = 22721.59.
Now divide this value by Constant Factor for 2005 (1.49414525179737). The USD Constant 1990 value is 22721.59/1.49414525179737 = 15207.08 USD
Proof 3a IP chk - (Vol. I) UN Women - Gender Dimensions.indd 104 10/7/2015 4:38:04 PM

93
ANNEX 5C. Mapping of Secondary Data at Diff erent Industrial Classifi cation Levels
VARIABLE NAME (including indicators
labels)
INDUSTRIAL CLASSIFICATION TYPE
(ISIC/NIC/HS/Any Others)
LEVEL(2-DIGIT/
3-DIGIT/6-DIGIT)
CONCORDANCE UNDERTAKEN (4-DIGIT ISIC to 6-DIGIT HS
etc.)
BANGLADESHEXPORTS HS (1992) 6-DIGIT –IMPORTS HS (1992) 6-DIGIT –TARIFF HS (1996) and HS (2002) 6-DIGIT HS Revision 1992 mapped to HS
revision 1996 and HS revision 2002NUMBER OF WORKERS
ISIC 1-DIGIT ISIC 1-DIGIT TO HS 6-DIGIT
PRODUCTION ISIC 1-DIGIT ISIC 1-DIGIT TO HS 6-DIGITWAGE ISIC 1-DIGIT ISIC 1-DIGIT TO HS 6-DIGITGREEN INDUSTRIES
HS (1992) 6-DIGIT OECD Matching (for manufacturing industries); NAICS (for agriculture) and so on
AGRICULTURE NAICS (2007) 6-DIGIT HS (1992) Matching to NAICS (2007)
RENEWABLE ENERGY
NAICS (2007) 6-DIGIT
ECOTOURISM NAICS (2007) 6-DIGIT
BHUTAN
EXPORTS HS (1992) 6-DIGIT –IMPORTS HS (1992) 6-DIGIT –TARIFF NUMBER OF WORKERS
ISIC 1-DIGIT ISIC 1-DIGIT TO HS 6-DIGIT
WAGES ISIC 1-DIGIT ISIC 1-DIGIT TO HS 6-DIGITGREEN INDUSTRIES
HS (1992) 6-DIGIT OECD Matching (for manufacturing industries); NAICS (for agriculture) and so on
AGRICULTURE NAICS (2007) 6-DIGIT HS (1992) Matching to NAICS (2007)
RENEWABLE ENERGY
NAICS (2007) 6-DIGIT
ECOTOURISM NAICS (2007) 6-DIGITINDIA
EXPORTS HS (1992) 6-DIGIT –IMPORTS HS (1992) 6-DIGIT –
Annex 5C. Mapping of Secondary Data at DIff erent Industrial Classifi cation Levels
Proof 3a IP chk - (Vol. I) UN Women - Gender Dimensions.indd 105 10/7/2015 4:38:05 PM
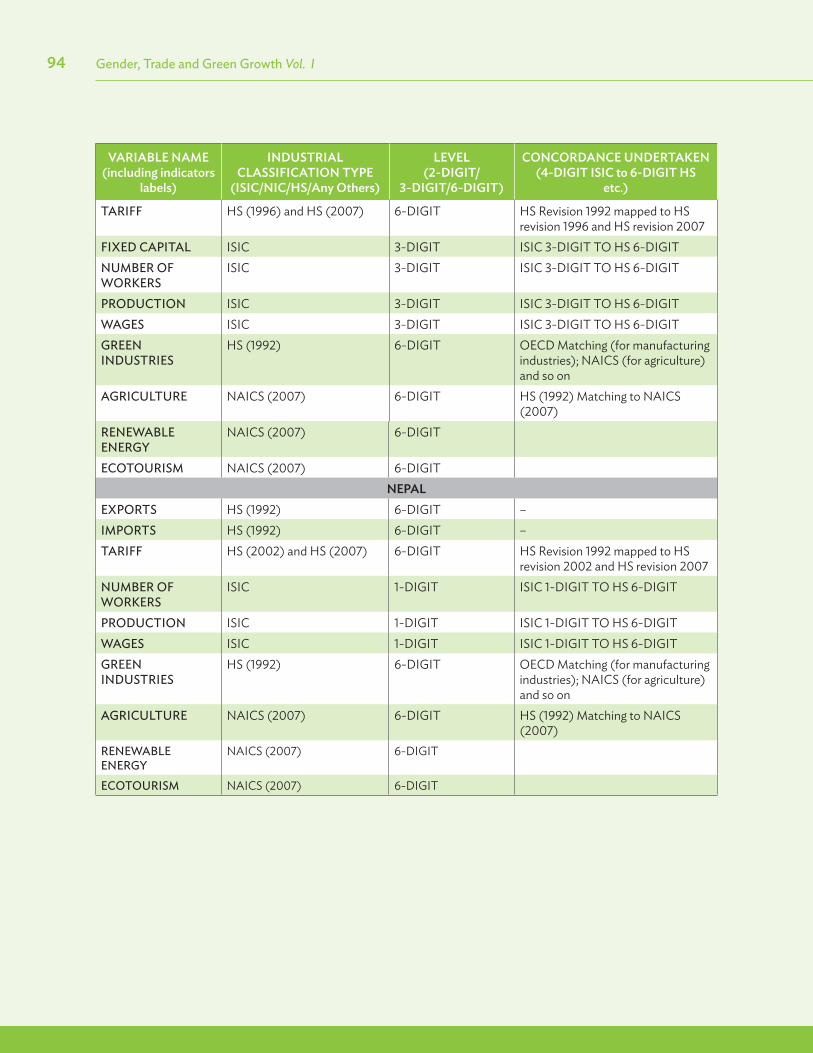
94 Gender, Trade and Green Growth Vol. I
VARIABLE NAME (including indicators
labels)
INDUSTRIAL CLASSIFICATION TYPE
(ISIC/NIC/HS/Any Others)
LEVEL(2-DIGIT/
3-DIGIT/6-DIGIT)
CONCORDANCE UNDERTAKEN (4-DIGIT ISIC to 6-DIGIT HS
etc.)
TARIFF HS (1996) and HS (2007) 6-DIGIT HS Revision 1992 mapped to HS revision 1996 and HS revision 2007
FIXED CAPITAL ISIC 3-DIGIT ISIC 3-DIGIT TO HS 6-DIGITNUMBER OF WORKERS
ISIC 3-DIGIT ISIC 3-DIGIT TO HS 6-DIGIT
PRODUCTION ISIC 3-DIGIT ISIC 3-DIGIT TO HS 6-DIGITWAGES ISIC 3-DIGIT ISIC 3-DIGIT TO HS 6-DIGITGREEN INDUSTRIES
HS (1992) 6-DIGIT OECD Matching (for manufacturing industries); NAICS (for agriculture) and so on
AGRICULTURE NAICS (2007) 6-DIGIT HS (1992) Matching to NAICS (2007)
RENEWABLE ENERGY
NAICS (2007) 6-DIGIT
ECOTOURISM NAICS (2007) 6-DIGITNEPAL
EXPORTS HS (1992) 6-DIGIT –IMPORTS HS (1992) 6-DIGIT –TARIFF HS (2002) and HS (2007) 6-DIGIT HS Revision 1992 mapped to HS
revision 2002 and HS revision 2007NUMBER OF WORKERS
ISIC 1-DIGIT ISIC 1-DIGIT TO HS 6-DIGIT
PRODUCTION ISIC 1-DIGIT ISIC 1-DIGIT TO HS 6-DIGITWAGES ISIC 1-DIGIT ISIC 1-DIGIT TO HS 6-DIGITGREEN INDUSTRIES
HS (1992) 6-DIGIT OECD Matching (for manufacturing industries); NAICS (for agriculture) and so on
AGRICULTURE NAICS (2007) 6-DIGIT HS (1992) Matching to NAICS (2007)
RENEWABLE ENERGY
NAICS (2007) 6-DIGIT
ECOTOURISM NAICS (2007) 6-DIGIT
Proof 3a IP chk - (Vol. I) UN Women - Gender Dimensions.indd 106 10/7/2015 4:38:05 PM
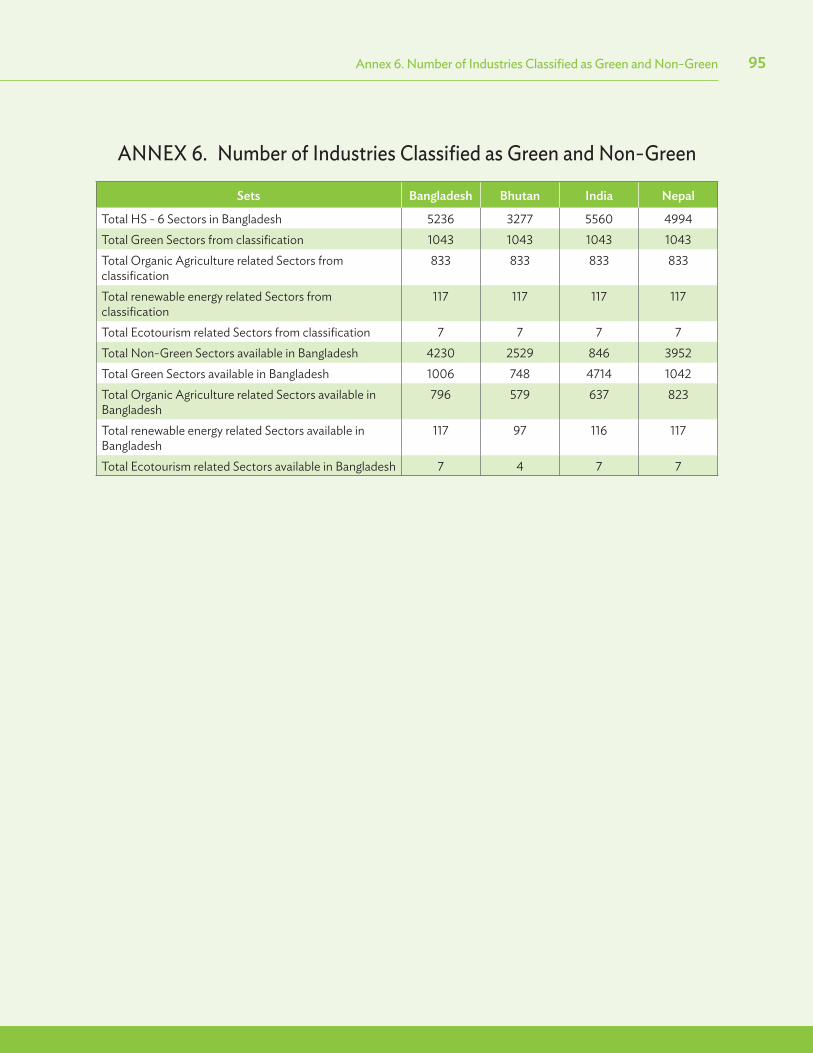
95
ANNEX 6. Number of Industries Classifi ed as Green and Non-Green
Sets Bangladesh Bhutan India Nepal
Total HS - 6 Sectors in Bangladesh 5236 3277 5560 4994Total Green Sectors from classifi cation 1043 1043 1043 1043Total Organic Agriculture related Sectors from classifi cation
833 833 833 833
Total renewable energy related Sectors from classifi cation
117 117 117 117
Total Ecotourism related Sectors from classifi cation 7 7 7 7Total Non-Green Sectors available in Bangladesh 4230 2529 846 3952Total Green Sectors available in Bangladesh 1006 748 4714 1042Total Organic Agriculture related Sectors available in Bangladesh
796 579 637 823
Total renewable energy related Sectors available in Bangladesh
117 97 116 117
Total Ecotourism related Sectors available in Bangladesh 7 4 7 7
Annex 6. Number of Industries Classifi ed as Green and Non-Green
Proof 3a IP chk - (Vol. I) UN Women - Gender Dimensions.indd 107 10/7/2015 4:38:05 PM

96 Gender, Trade and Green Growth Vol. I
ANNEX 7. Industry Case Studies – Rationale for Selection and Data Sources
Bhutan Bangladesh India Nepal
Unit of Analysis Women at the enter-prise level
Women employed in agro-processing and horticulture
Geographical unit Women engaged in the fi eld of ecotourism, mainly home-stay facilities
Sector and Rationale
Agriculture (second largest export sector; low participation of women)
Agriculture (large number of women employed, important for the economy because large domestic demand and export potential)
Organic Horticulture (lends itself to wild harvesting; export potential)
Eco-tourism (relevant for gender, trade and environment)
Industry Agro-processing (relevant for gender, trade and GG; data availability consider-ations; discussions with key stakeholders)
Horticulture and Agro-Processing
Sea buckthorn Home-stay facilities
Data Sources Site visits with Bhutan Agro-industries Limit-ed (BAIL), Bhutan Fruits Private Limited (BFPL), Bhutan Dairy and Agro-Products Limited (BDAPL) and other cottage scale food and beverage processing industries in central Bhutan.
• Review of existing literature and policy documents such as the Fifth Five Year Plans, Annual Budgets, Agricultural Policy, Export Policy, etc.
• Statistics from Ministry of Commerce, Export Promotion Bureau, Central Bank, Minis-try of Agriculture, Bangladesh Bureau of Statistics
• Primary data collec-tion through inter-views and group discussions
Primary and second-ary data such as Agricultural Census, State and district level handbooks, data from relevant govern-ment ministries such as Ministries of Horticulture, Science and Technology, Tourism, Renewable Energy, Commerce and Industries, National Sample Survey, National Census, Planning Commission, Ladakh Autonomous District Development Coun-cil, etc.
Interviews with policy makers, regional and district level offi cers of ministry of industry and commerce as well as ministry of tourism and civil avia-tion including some prominent institutions promoting ecotourism and conservation like Annapurna Conserva-tion Project (ACAP) and Nepal Trust for Nature Conservation (NTNC), etc.
Primary data collected through fi eld based survey in the Mustang region
Proof 3a IP chk - (Vol. I) UN Women - Gender Dimensions.indd 108 10/7/2015 4:38:05 PM

97
Bhutan Bangladesh India NepalTools Literature review;
Field Visits – factory visits/ on-site inter-actions; Individual consultations (using both open ended as well as structured questionnaires) and FGDs with stake-holders – including government agencies
• Lit review, FGDs,Key Informant Interviews (KII) with
• Private sector agen-cies
• Associations – sectoral and also FBCCI, MCCI, BAPA
• Government agencies such as HORTEX, and Individuals who have been innovators
• Relevant programmes and projects
• International agen-cies such as ADB, World Bank, IFIC,
• Financial institutions such as the Central Bank
Literature review, Field surveys/ inter-views/ FGDs to supplement the data; Graphical analysis, time-series analy-sis, logit and probit to understand the relationship between gender and trade
Literature review, individual interviews and FGDs
Annex 7. Industry Case Studies – Rationale for Selection and Data Sources
Proof 3a IP chk - (Vol. I) UN Women - Gender Dimensions.indd 109 10/7/2015 4:38:05 PM

98 Gender, Trade and Green Growth Vol. I
ANNEX 8. Bilateral Trade Trends between Bangladesh, Bhutan, India and Nepal
BANGLADESH
Total Exports from Bangladesh, 1989–2011(1990 constant USD)
Total Imports to Bangladesh, 1989–2012(1990 constant USD)
Proof 3a IP chk - (Vol. I) UN Women - Gender Dimensions.indd 110 10/7/2015 4:38:05 PM

99Annex 8. Bilateral Trade Trends between Bangladesh, Bhutan, India and Nepal
Total Green Exports from Bangladesh, 1989–2012(1990 constant USD)
Total Green Imports to Bangladesh, 1989–2012(1990 constant USD)
Proof 3a IP chk - (Vol. I) UN Women - Gender Dimensions.indd 111 10/7/2015 4:38:06 PM

100 Gender, Trade and Green Growth Vol. I
BHUTAN
Total Exports from Bhutan, 1989–2012(1990 constant USD)
Total Imports to Bhutan, 1989–2012(1990 constant USD)
Proof 3a IP chk - (Vol. I) UN Women - Gender Dimensions.indd 112 10/7/2015 4:38:07 PM

101Annex 8. Bilateral Trade Trends between Bangladesh, Bhutan, India and Nepal
Total Green Exports from Bhutan, 1989–2012(1990 constant USD)
Total Green Imports to Bhutan, 1989–2012(1990 constant USD)
Proof 3a IP chk - (Vol. I) UN Women - Gender Dimensions.indd 113 10/7/2015 4:38:08 PM
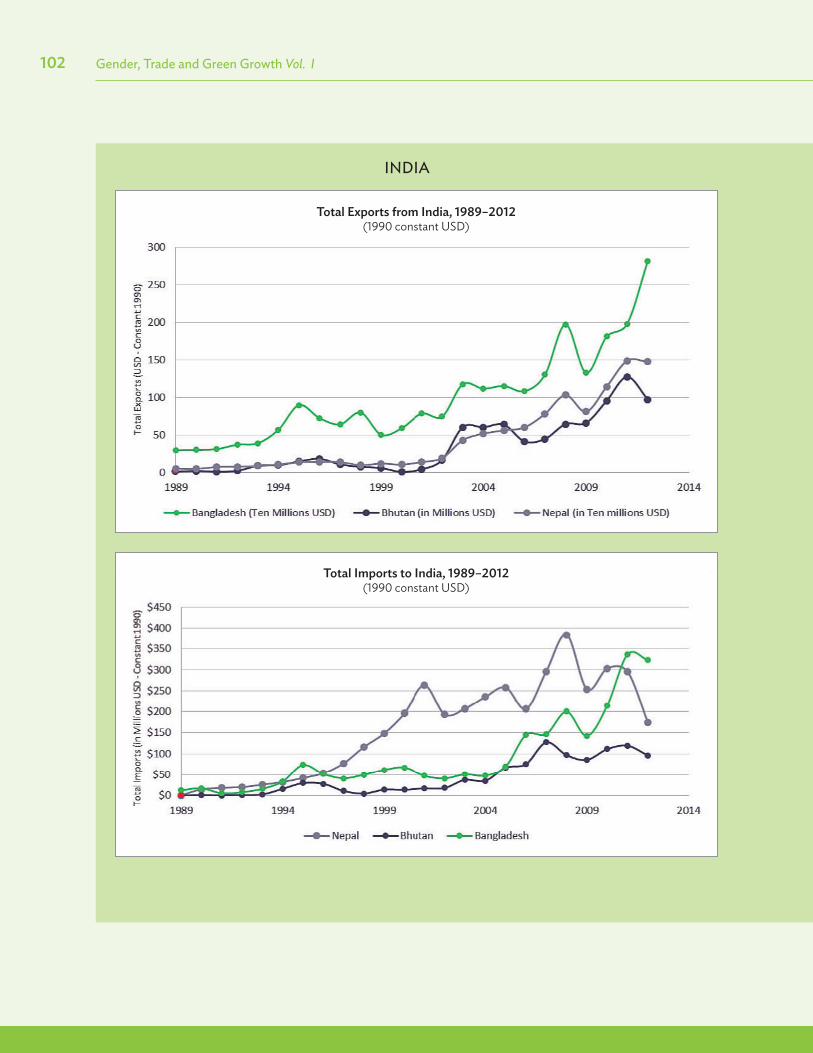
102 Gender, Trade and Green Growth Vol. I
INDIA
Total Exports from India, 1989–2012(1990 constant USD)
Total Imports to India, 1989–2012(1990 constant USD)
Proof 3a IP chk - (Vol. I) UN Women - Gender Dimensions.indd 114 10/7/2015 4:38:10 PM

103Annex 8. Bilateral Trade Trends between Bangladesh, Bhutan, India and Nepal
Total Green Exports from India, 1989–2012(1990 constant USD)
Total Green Imports to India, 1989–2012(1990 constant USD)
Proof 3a IP chk - (Vol. I) UN Women - Gender Dimensions.indd 115 10/7/2015 4:38:11 PM

104 Gender, Trade and Green Growth Vol. I
NEPAL
Total Exports from Nepal, 1989–2012(1990 constant USD)
Total Imports to Nepal, 1989–2012(1990 constant USD)
Proof 3a IP chk - (Vol. I) UN Women - Gender Dimensions.indd 116 10/7/2015 4:38:12 PM

105Annex 8. Bilateral Trade Trends between Bangladesh, Bhutan, India and Nepal
Total Green Exports from Nepal, 1989–2012(1990 constant USD)
Total Green Imports to Nepal, 1989–2012(1990 constant USD)
Proof 3a IP chk - (Vol. I) UN Women - Gender Dimensions.indd 117 10/7/2015 4:38:12 PM

106 Gender, Trade and Green Growth Vol. I
ANNEX 9. Female Intensity of Bilateral Trade between Bangladesh, Bhutan, India and Nepal
Tota
l Exp
orts
in H
undr
ed T
hous
and
(199
0 co
nsta
nt U
SD)
Female Intensity of Total Exports – India-Bhutan, 1989–2012(1990 constant USD)
Tota
l Exp
orts
in M
illio
n(1
990
cons
tant
USD
)
Female Intensity of Total Exports – India-Bangladesh, 1989–2012(1990 constant USD)
Tota
l Exp
orts
in M
illio
n(1
990
cons
tant
USD
)
Female Intensity of Total Exports – India-Nepal, 1989–2012(1990 constant USD)
Proof 3a IP chk - (Vol. I) UN Women - Gender Dimensions.indd 118 10/7/2015 4:38:13 PM
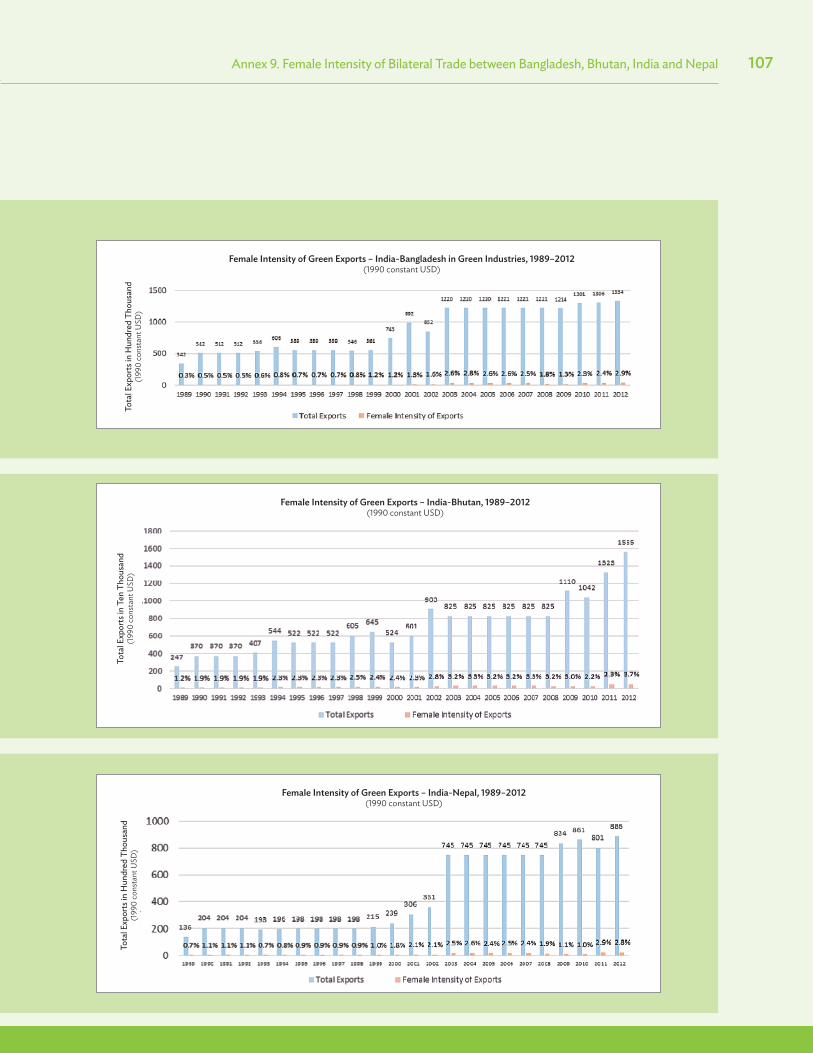
107Annex 9. Female Intensity of Bilateral Trade between Bangladesh, Bhutan, India and Nepal
Tota
l Exp
orts
in H
undr
ed T
hous
and
(199
0 co
nsta
nt U
SD)
Female Intensity of Green Exports – India-Bangladesh in Green Industries, 1989–2012(1990 constant USD)
Female Intensity of Green Exports – India-Bhutan, 1989–2012(1990 constant USD)
Tota
l Exp
orts
in T
en T
hous
and
(199
0 co
nsta
nt U
SD)
Female Intensity of Green Exports – India-Nepal, 1989–2012(1990 constant USD)
Tota
l Exp
orts
in H
undr
ed T
hous
and
(199
0 co
nsta
nt U
SD)
Proof 3a IP chk - (Vol. I) UN Women - Gender Dimensions.indd 119 10/7/2015 4:38:15 PM


PRF2a - (Vol. I) UN Women Cover - Single.indd 2 10/2/2015 4:16:48 PM