Gender Differences in Student Ethics:
28
1 Gender Differences in Student Ethics: Are Females Really More Ethical? INTRODUCTION The formalization of ethics training for accounting students has become a major concern following reports of rampant cheating at the college level and recent business scandals. Ethics education, which provides training in systematic thinking and reasoning about ethics, may be essential at the college level if personal and business ethics are to be improved (Bampton and Maclagan, 2005). Shafer, Morris and Ketchland (2001) identify the need to align personal and societal ethics as a cornerstone of efforts to improve ethical decision making. If ethics training is to accomplish the goal of aligning ethical beliefs, we need to understand the current status of student ethics as we design an ethics curriculum. It is also essential to understand how student ethics vary across subsets of students. Factors reported in the literature include student gender (Ameen, Guffey and McMillan, 1996) and student major (Jeffrey, 1993), among others. To the extent these individual student differences translate to different views about ethical issues, they may impact the design of ethics training. This study reports results of a survey measuring how acceptable students find some common forms of academic cheating. We examine student ratings in light of the societal expectation that all forms of cheating are completely unacceptable. Our results show female students find the cheating behaviors to be much less acceptable than do male students. We investigate how robust these gender differences are by considering the impacts of psychological
Transcript of Gender Differences in Student Ethics:

1
Gender Differences in Student Ethics:
Are Females Really More Ethical?
INTRODUCTION
The formalization of ethics training for accounting students has become a major concern
following reports of rampant cheating at the college level and recent business scandals. Ethics
education, which provides training in systematic thinking and reasoning about ethics, may be
essential at the college level if personal and business ethics are to be improved (Bampton and
Maclagan, 2005). Shafer, Morris and Ketchland (2001) identify the need to align personal and
societal ethics as a cornerstone of efforts to improve ethical decision making. If ethics training is
to accomplish the goal of aligning ethical beliefs, we need to understand the current status of
student ethics as we design an ethics curriculum.
It is also essential to understand how student ethics vary across subsets of students.
Factors reported in the literature include student gender (Ameen, Guffey and McMillan, 1996)
and student major (Jeffrey, 1993), among others. To the extent these individual student
differences translate to different views about ethical issues, they may impact the design of ethics
training.
This study reports results of a survey measuring how acceptable students find some
common forms of academic cheating. We examine student ratings in light of the societal
expectation that all forms of cheating are completely unacceptable. Our results show female
students find the cheating behaviors to be much less acceptable than do male students. We
investigate how robust these gender differences are by considering the impacts of psychological
2
gender, impression management, and student major on the results. Overall, biological gender
effects persist after consideration of these variables.
LITERATURE AND HYPOTHESES
Investigations of gender effects on student ethics have produced varied results. To the
extent that biological gender has been found to have an impact, females are generally shown to
be more ethical. This study looks for gender effects in a decision setting with which students are
very familiar: academic cheating. Students should understand the consequences of acting
unethically in academia. Most schools have codes of ethics that address these consequences, and
many faculty include those consequences in their course syllabi.
Females may try to avoid the negative consequences of cheating and tend toward ethical
action. This is consistent with females’ general tendency toward risk aversion. For example,
females generally prefer to avoid shame (Tibbetts, 1997) and financial risk (Jianakopolos and
Bernasek, 1998). Conversely, males may be more prone to risk-taking, focusing more on
perceived benefits of cheating and less on the consequences of being caught. These differences
may lead to gender effects in student attitudes about cheating behaviors, which is hypothesis 1 (in
null form):
H1: There will be no biological gender difference in student ratings of cheating behaviors.
A possible explanation of inconsistent results in prior research may be a concentration on
biological gender rather than on psychological gender. Regardless of biological gender, adopting
the social conditioning of one’s psychological gender may impact attitudes toward ethics.
Socialization is partly a function of conditioned behaviors, which tend to be gender-specific
3
(Terpstra et. al., 1993). Many theories about gender and ethics are based on socialization theory
(McCabe, Ingram, and Dato-on, 2006). Women may be conditioned to reject less ethical actions
to obtain desired outcomes because they have been conditioned to take actions which gain the
approval of others. Men may be conditioned to accept less ethical actions to obtain desired
outcomes because they have been conditioned to be more aggressive and competitive (McCabe,
Ingram and Dato-on, 2006).
The Personal Attributes Questionnaire (PAQ) (Spence et. al., 1975) measures
psychological gender in terms of instrumental and expressiveness strengths. The strength of
assertiveness traits (generally considered to be male characteristics) is measured by the
instrumental scale, while the strength of desirable, socially-oriented traits (generally considered
to be female characteristics) is measured by the expressiveness scale.
Rather than biological gender, it may be the strength of expressiveness conditioning that
determines ethical attitudes. This implies that students with higher expressiveness will be less
accepting of cheating behaviors. This leads to hypothesis 2 (in null form):
H2: There will be no biological gender difference in student ratings of cheating behaviors once
student expressiveness is taken into account.
Another possible reason for the inconsistent results in prior research could be the failure
to account for a social desirability bias in the data. In any study of ethics attitudes, survey
respondents may give false responses in an effort to obscure their true feelings. Ethics are an
intensely personal matter and respondents may not want anyone to know they would take
unethical actions to gain desired outcomes. There is a pervasive tendency to present oneself in
the most favorable light relative to prevailing social norms (King and Bruner, 2000). This interest
4
in answering in a socially desirable manner is known as impression management; impression
management should be controlled for in ethics research using self-reported data (Bernardi et al.,
2003). In most ethics research on gender, impression management is not measured and therefore
it may be a missing explanatory variable for some of the inconsistent results.
In a variety of settings females have been less inclined to engage in impression
management (e.g. Singh, Kumra and Vinnicombe, 2002); this may also be true in academia.
Respondents engaging in impression management in this study are more likely to rate academic
cheating as unacceptable, which could obscure gender differences. This leads to hypothesis 3 (in
null form):
H3: There will be no biological gender difference in student ratings of cheating behaviors once
impression management is taken into account.
In addition to psychological gender and impression management, student major may
impact the relationship between biological gender and ethics. In the accounting curriculum there
is substantial ethics-related content; graduates in accounting are exposed to such content. This
should reduce gender differences by improving the ethics of all accounting students. Ethics
content of curricula in other business fields may not be the same, which would allow gender
differences to persist among those students. Therefore, we investigate whether gender effects are
present for accounting majors and non-accounting business majors separately.
We hypothesize (in null form) this relationship between gender and major:
H4: There will be no biological gender difference in student ratings of cheating behaviors once
student major is taken into account.
H4a: There will be no biological gender difference in student ratings of cheating
behaviors for accounting majors.
H4b: There will be no biological gender difference in student ratings of cheating

5
behaviors for non-accounting business majors.
Additional Moderating Variables
There are possible explanations beyond psychological gender (expressiveness),
impression management and student major for the inconsistent gender results found in studies
with students. The number of hours working and the number of hours spent studying may have
an effect. This study measured both self-reported hours worked per week and hours spent
studying per week, and included these variables in the analysis.
METHOD
Undergraduate students from three AACSB-accredited universities participated in this
study. Participating schools included two from the Midwest, one public and one Jesuit school;
and one East coast Jesuit school. Institutional Review Board approval for this study was obtained
from all three schools.
Students answered a 10-minute, 4 section survey during class time. Participation was
voluntary and anonymous; no extra credit was given for participation. In the first section,
students provided demographic information. Subsequent sections contained questions measuring
attitudes toward academic behaviors, impression management, and psychological gender. Two
orders of the survey were used; all students answered the demographic questions first. Half of the
respondents answered the academic behavior questions next, followed by the gender and
impression management questions. The other half of the students answered the gender and
impression management questions next, followed by the academic behavior questions. The order
of the survey questions was not a significant variable in any of the results.
6
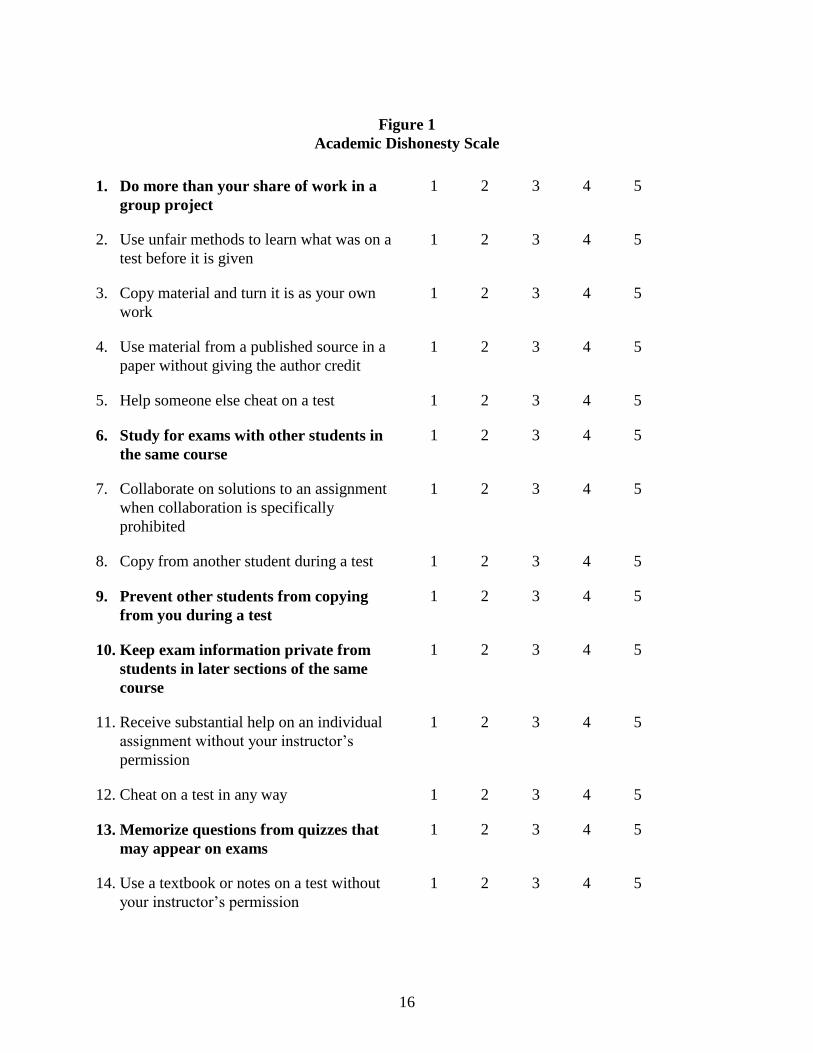
In the second section, students rated the acceptability of 14 academic behaviors (Figure
1). Nine of the items are from the Academic Dishonesty Scale of McCabe and Trevino (1997);
all nine items are considered academically dishonest. Five items (1, 6, 9, 10 and 13) were added
which are not considered to be dishonest actions (shown in bold print). A mix of items helped
ensure students had to read and consider each item individually rather than just marking replies
to each item in the same way. Responses were given on a Likert scale from 1 (completely
dishonest) to 5 (completely honest). Using this scale, Bolin (2004) showed that attitude toward
academic dishonesty was a strong predictor of a student’s level of cheating.
Insert Figure 1 Here
The Academic Dishonesty Scale has been shown to be highly reliable (Cronbach alpha of
.90). Confirmatory factor analysis showed the items in the Academic Dishonesty Scale in one
factor and the five additional (honest) items in another factor. Each student’s ratings of the nine
items in the Academic Dishonesty Scale were summed to create one variable (CHEAT). The
higher the value of CHEAT, the more accepting the student was of the cheating behaviors.
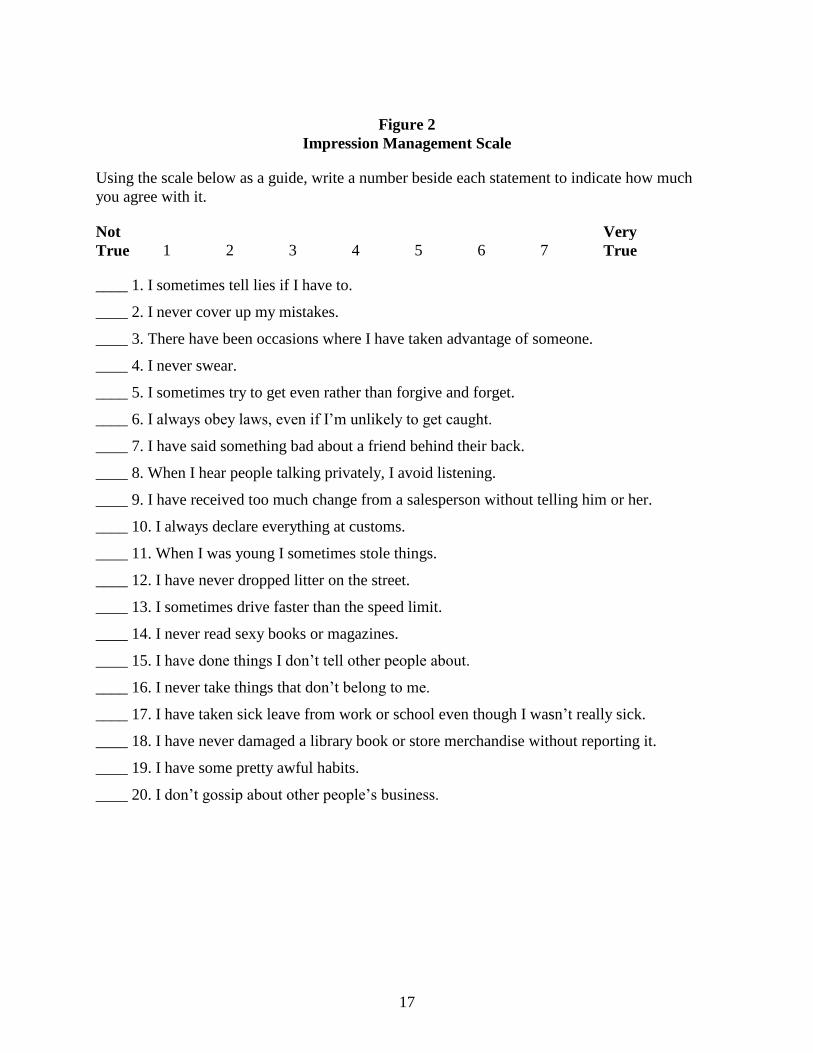
In the third section of the survey, students answered questions to measure their levels of
impression management (see Figure 2). The twenty items are from the Balanced Inventory of
Desirable Responding (BIDR), version 7 (Paulus, 1998). The major use of this scale is in
differentiating fakers from non-fakers; it helps determine if respondents are purposely enhancing
their replies when completing questionnaires (Paulus, 1998). The scale has strong reliability, with
a Cronbach Alpha of .83, and has high test-retest correlation (Robinson, Shaver and Wrightsman,
1991).
7
Insert Figure 2 Here
In determining whether a student is engaging in impression management, an impression
management rating (IMR) is obtained. Note in Figure 2 that the odd-numbered items would be
answered as 1 or 2 if a respondent was trying to make a good impression. Also note that the
even-numbered items would be answered 6 or 7 if a respondent was trying to make a good
impression. In reality, most of us would answer somewhere in the middle of the scale to nearly
all items. Scoring of the BIDR uses this knowledge to create the IMR. For the odd-numbered
items, sum the number of 1's and 2's; for the even-numbered items, sum the number of 6's and
7's. The overall sum creates one IMR for each respondent that ranges from 0-20. The higher the
IMR, the more the person has engaged in impression management.
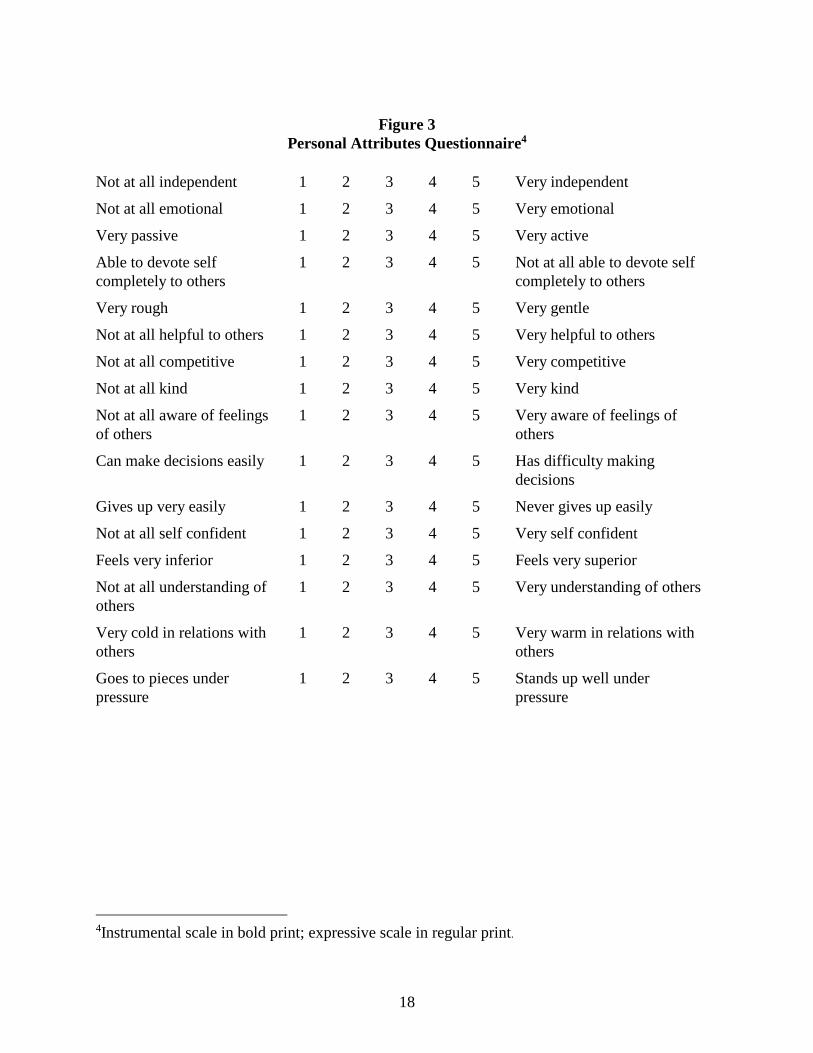
In the fourth section of the survey, students answered questions from the Personal
Attributes Questionnaire (PAQ) (Spence et. al., 1975) to measure their instrumental and
expressive traits (see Figure 3). The Scale has high reliability (Cronbach Alpha of .76). Males are
expected to have a higher rating on the instrumental scale while females are expected to have a
higher rating on the expressiveness scale.
Insert Figure 3 Here
Items shown in bold print measure instrumental traits while the remaining measure
expressive traits. Confirmatory factor analysis showed the eight instrumental items in one factor
(variable name INSTRUM) and the eight expressive items in another factor (variable name
EXPRESS). For each scale, a student’s total responses to items are used to create one rating
ranging from 8 to 40.
8
RESULTS
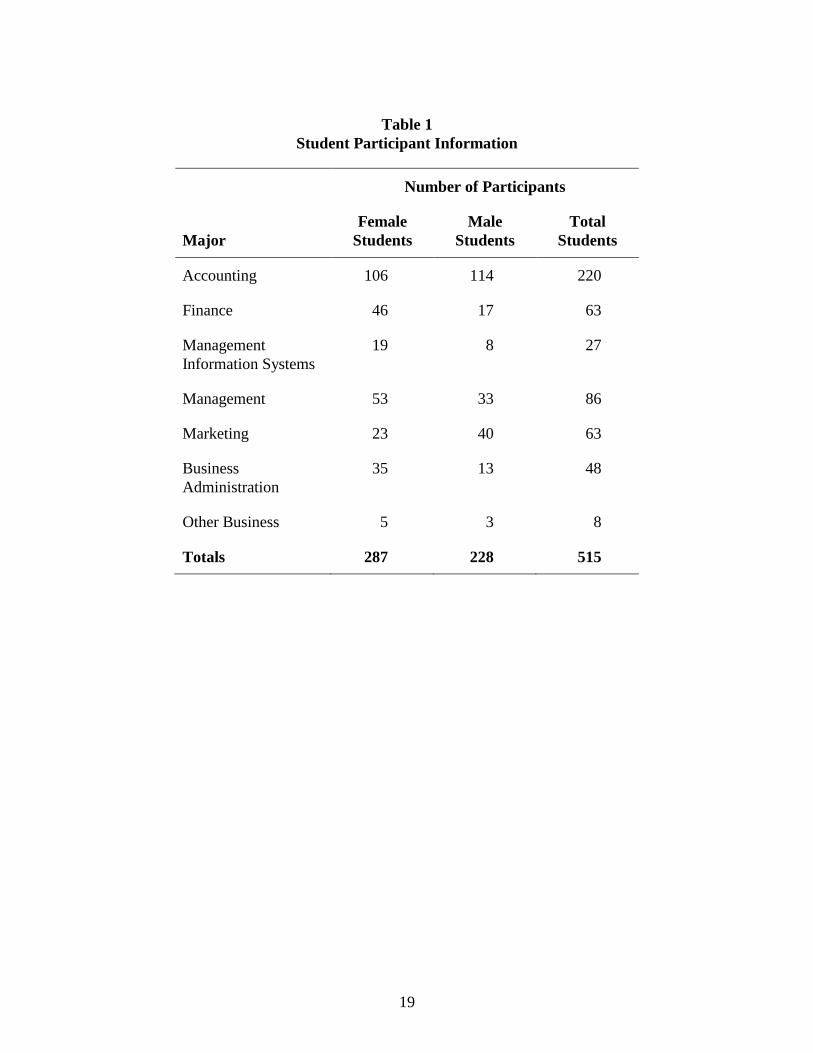
Table 1 shows the distribution of students across different majors. The 515 participants
were all business majors. 400 students attend the public university; 79 attend a Jesuit university
in the Midwest, and 36 attend a Jesuit university on the East coast. The study included 220
accounting majors and 295 non-accounting business majors.
Insert Table 1 Here
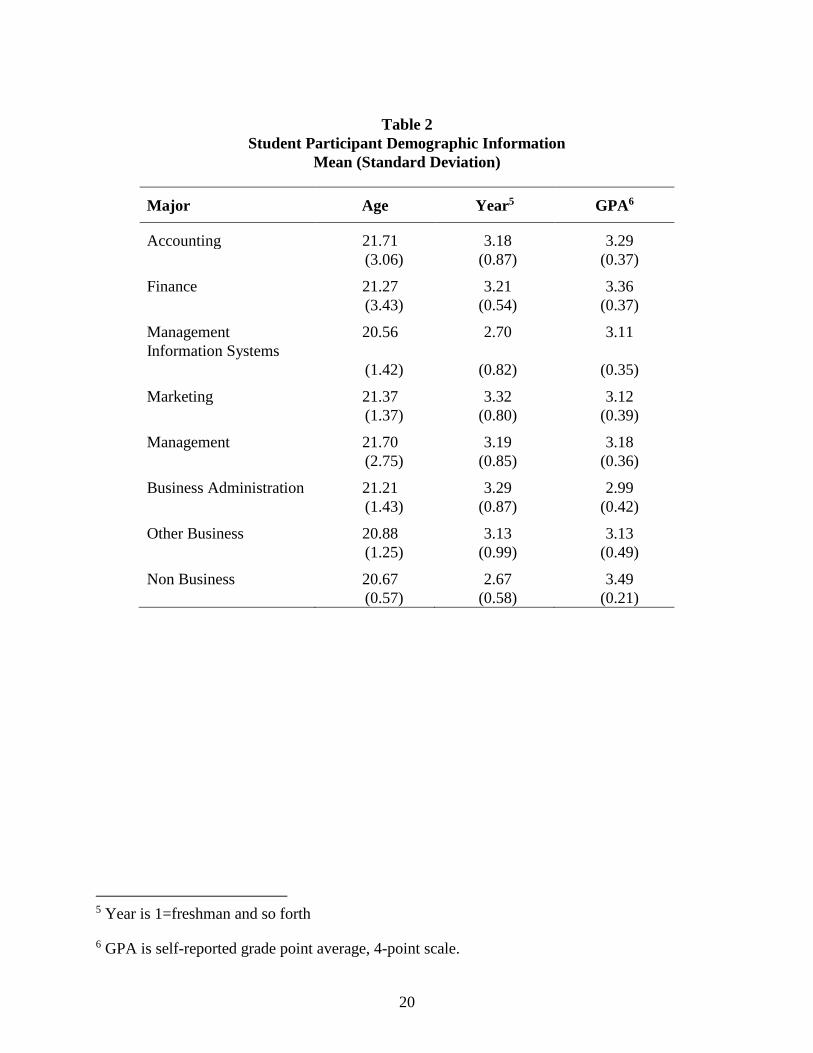
Table 2 shows demographic information including students’ age, year in school, and self
reported GPA (on a 4-points scale), separated by major. Accounting majors are similar to
students in other fields for age, year and self-reported GPA. This facilitates comparisons of
accounting majors’ versus non-accounting majors’ attitudes about ethics.
Insert Table 2 Here
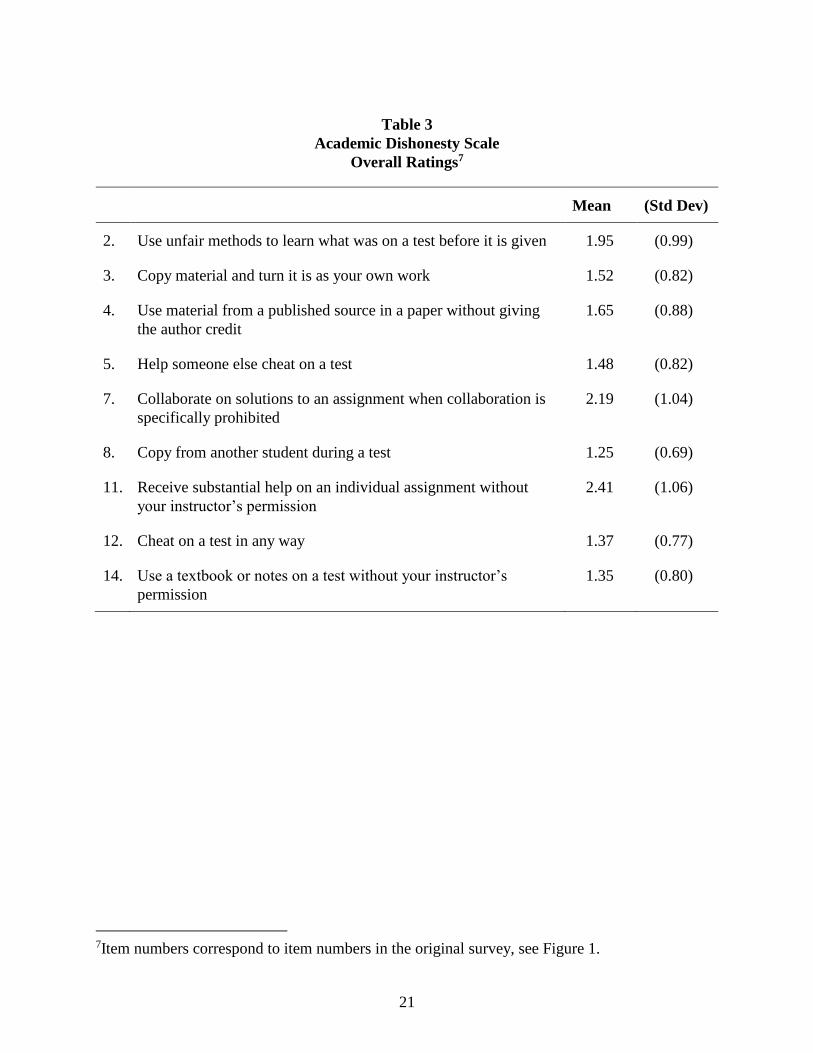
We examined the mean dishonesty ratings of the items in Figure 1. If students believed an
item reflected completely dishonest behavior, they would give it a rating of 1. Students do not
universally agree that these behaviors are completely unacceptable; there is significant variability
in the ratings for each item. However, all means except one item associated with collaboration
are statistically the same as the scale minimum rating of one. The item for which student and
faculty opinions differ marginally is item 11 (receive substantial help on an individual
assignment without your instructor’s permission). The students’ mean rating is marginally
significantly above the scale minimum (p=.08). On average, students share faculty beliefs about
the honesty or dishonesty of these actions.
Insert Table 3 Here
9
Hypothesis Testing
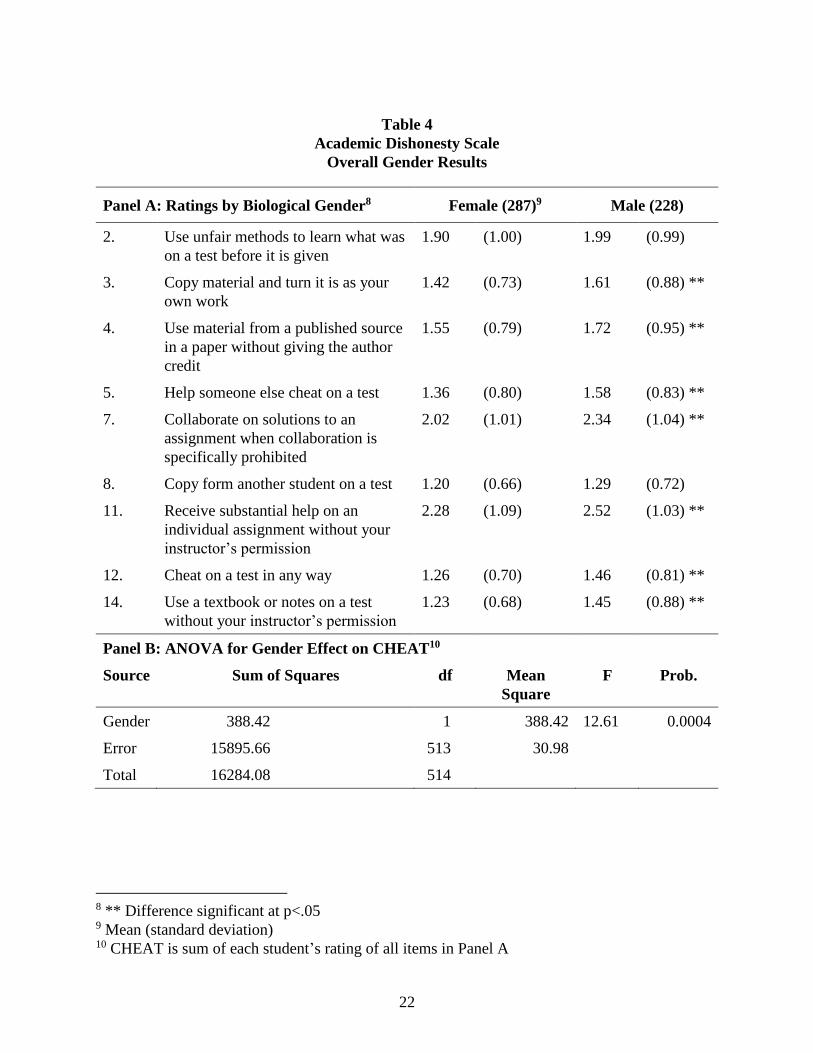
We compared the ratings of female and male students to determine if there are gender
differences in beliefs about cheating. The results are shown in Table 4. As shown in Panel A of
Table 4, there is a biological gender difference in beliefs, with female students consistently rating
the items as less acceptable than male students.1
Insert Table 4 Here
To test hypothesis 1, each student’s total cheating rating was computed as one score by
summing the student’s ratings of the nine items; the variable CHEAT is analyzed for gender
effects (see Table 4). As shown in Panel B of Table 4, biological gender is a significant
determinant of CHEAT. Based on these results, hypothesis one is rejected; there is a difference in
the ratings of cheating behaviors.
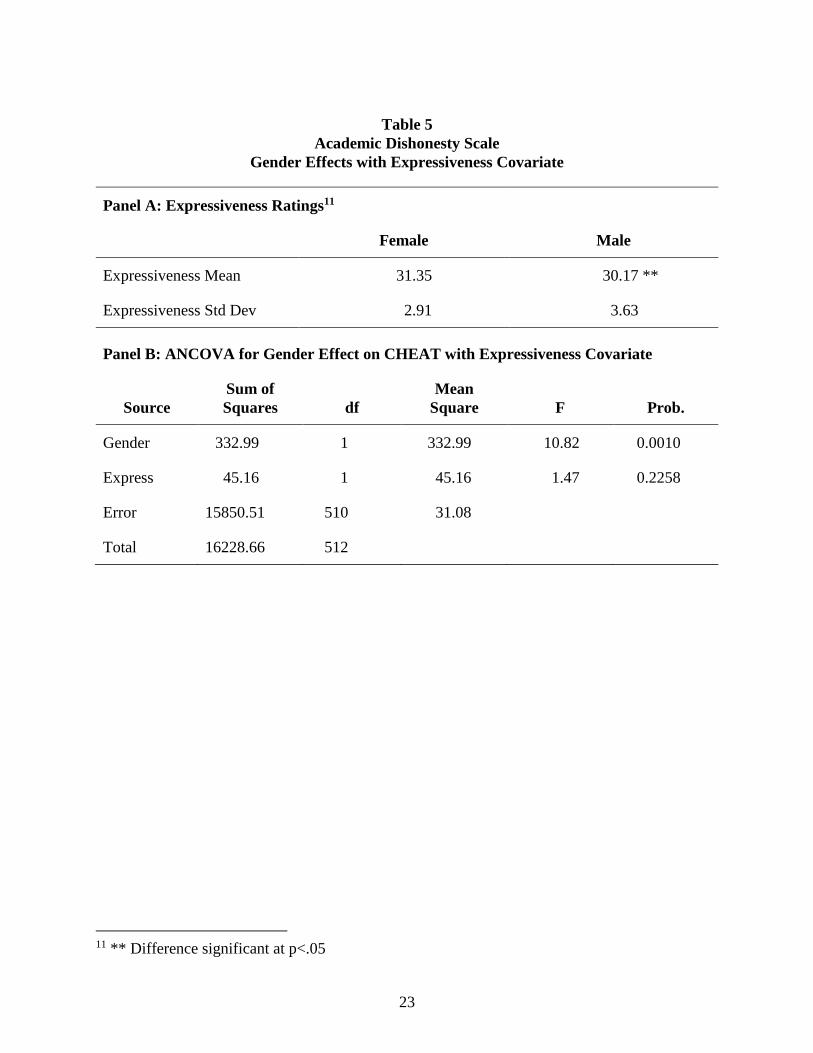
To test hypothesis 2, the variable EXPRESS was added to the analysis as a covariate (see
Table 5). EXPRESS was created by summing each student’s responses to the expressiveness
questions from the PAQ. Panel A of Table 5 shows the means for EXPRESS for each gender.
The means are significantly different, with females having a higher expressiveness rating on
average. Panel B of Table 5 shows that Gender is still significant (p<.01) but EXPRESS is not a
significant covariate in the analysis (p=.22).2 Hypothesis 2 is rejected; biological gender effects
persist after including student expressiveness in the analysis.
Insert Table 5 Here
1 When an indicator variable for school type (private or public), hereafter SCHOOL, is added to this analysis as a
covariate, biological gender is still significant (p=.03) and SCHOOL is not significant (p=.54).
2 When SCHOOL is added to the analysis as a second covariate, the results are substantially unchanged, and
10
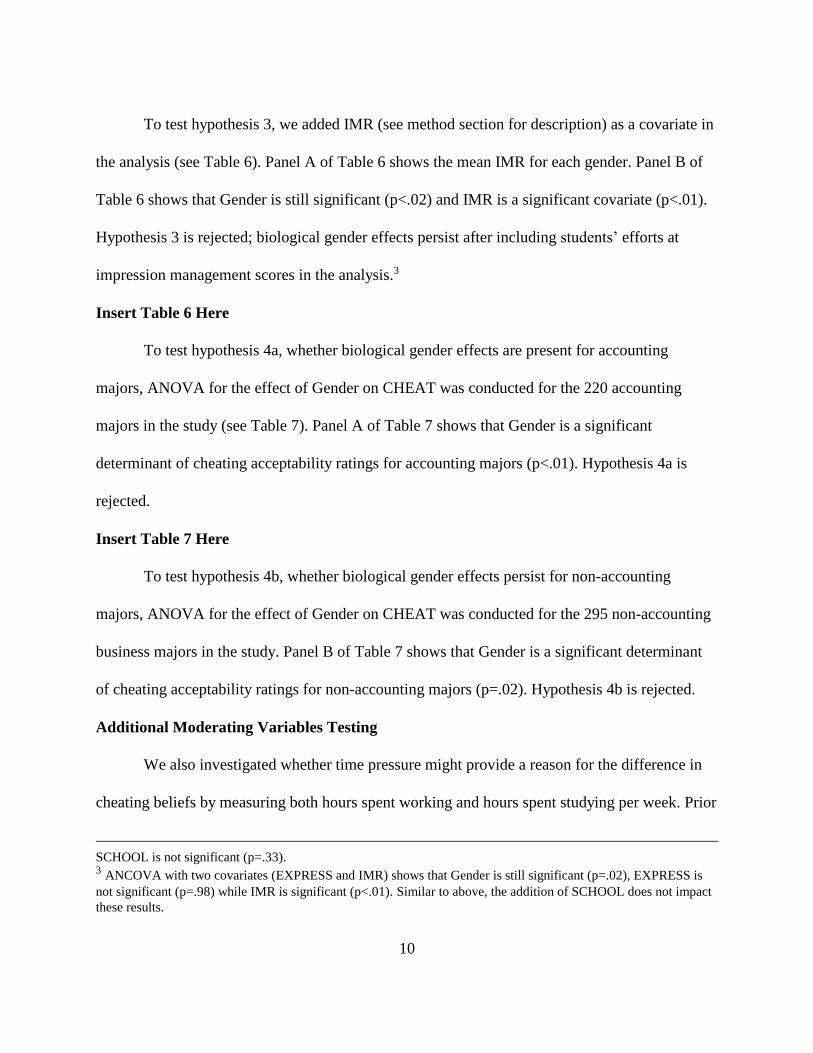
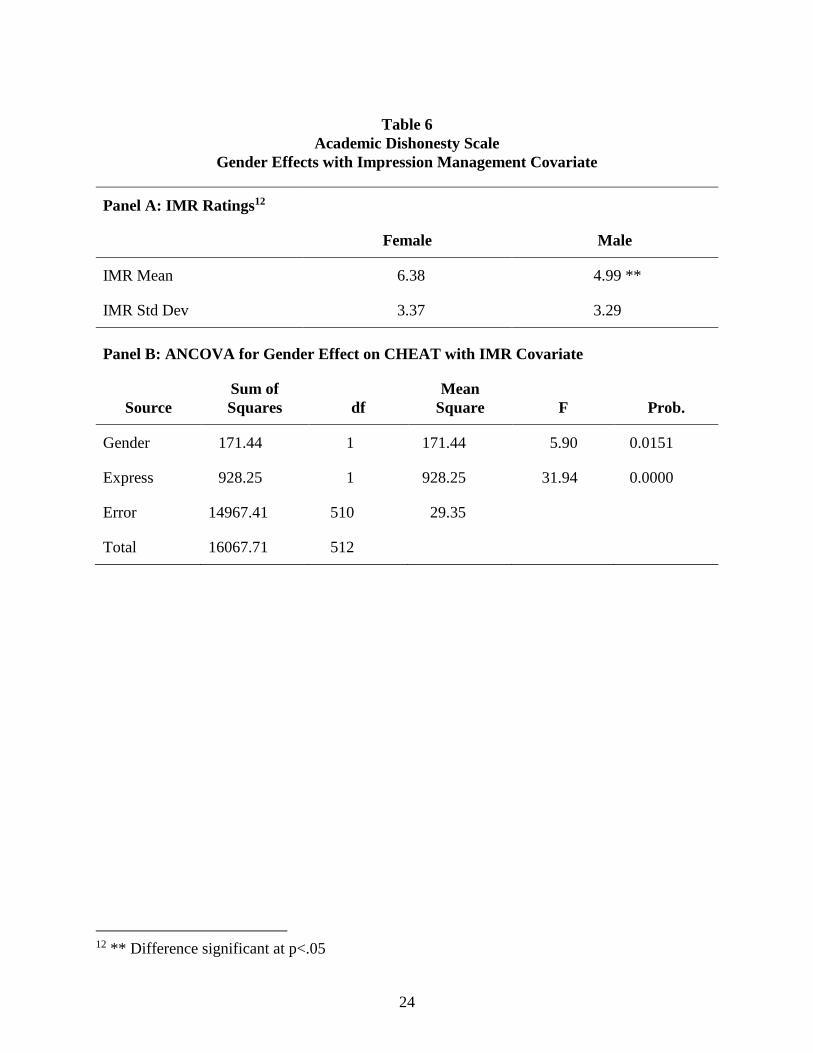
To test hypothesis 3, we added IMR (see method section for description) as a covariate in
the analysis (see Table 6). Panel A of Table 6 shows the mean IMR for each gender. Panel B of
Table 6 shows that Gender is still significant (p<.02) and IMR is a significant covariate (p<.01).
Hypothesis 3 is rejected; biological gender effects persist after including students’ efforts at
impression management scores in the analysis.3
Insert Table 6 Here
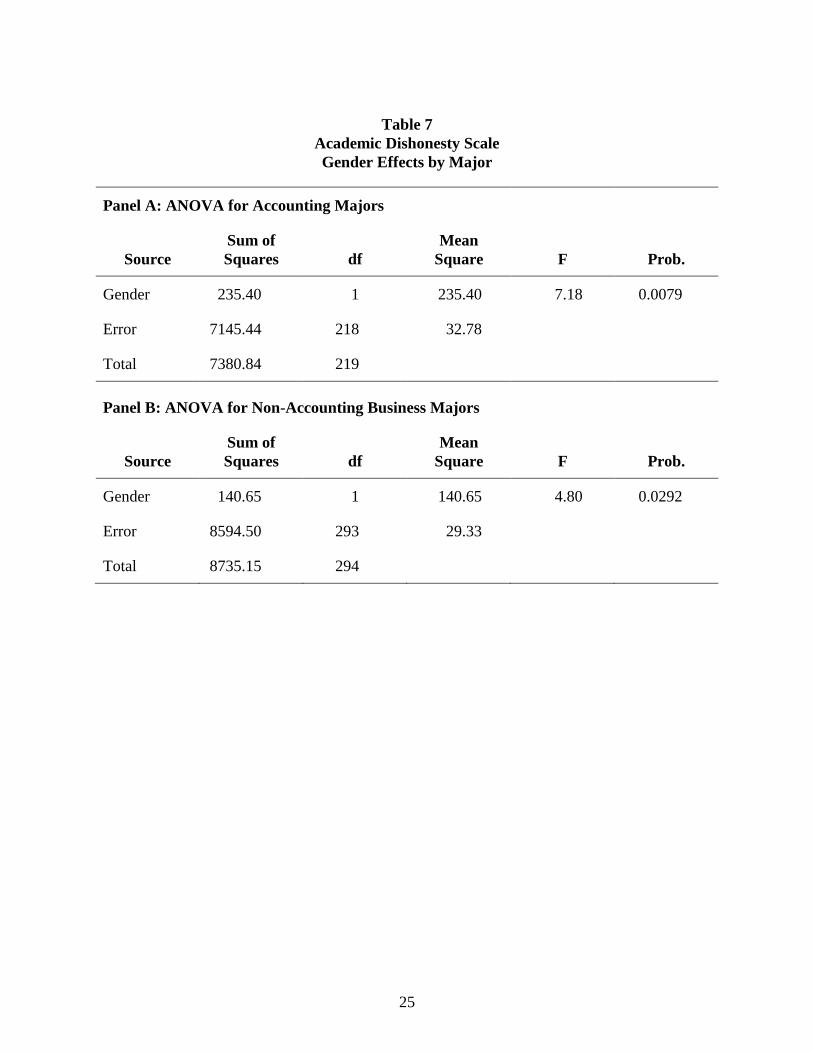
To test hypothesis 4a, whether biological gender effects are present for accounting
majors, ANOVA for the effect of Gender on CHEAT was conducted for the 220 accounting
majors in the study (see Table 7). Panel A of Table 7 shows that Gender is a significant
determinant of cheating acceptability ratings for accounting majors (p<.01). Hypothesis 4a is
rejected.
Insert Table 7 Here
To test hypothesis 4b, whether biological gender effects persist for non-accounting
majors, ANOVA for the effect of Gender on CHEAT was conducted for the 295 non-accounting
business majors in the study. Panel B of Table 7 shows that Gender is a significant determinant
of cheating acceptability ratings for non-accounting majors (p=.02). Hypothesis 4b is rejected.
Additional Moderating Variables Testing
We also investigated whether time pressure might provide a reason for the difference in
cheating beliefs by measuring both hours spent working and hours spent studying per week. Prior
SCHOOL is not significant (p=.33). 3 ANCOVA with two covariates (EXPRESS and IMR) shows that Gender is still significant (p=.02), EXPRESS is
not significant (p=.98) while IMR is significant (p<.01). Similar to above, the addition of SCHOOL does not impact
these results.
11
research has shown that time pressure can lead to student cheating because students see cheating
as a way of solving their time shortage.
The mean hours spent studying was 13.79 hours per week. Females (mean 15.76 hours)
report studying significantly more than males (mean 12.23 hours) (p=.02). When this variable is
added to the analysis, gender is still a significant determinant of cheating (p<.01). Time spent
studying does not account for the difference in cheating attitudes.
The mean hours spent working was 11.89 hours per week. Females (mean 12.33 hours)
report working about as much as males (mean 11.53 hours) (p=.25). When this variable is added
to the analysis, biological gender is still a significant determinant of cheating (p<.01). Time spent
working does not account for the difference in cheating attitudes.
DISCUSSION AND CONCLUSIONS
Many students in this study were too accepting of cheating behaviors; the ethical beliefs
of these students do not conform to faculty expectations. This is consistent with prior research
showing that many students have different beliefs about cheating than do faculty. For example,
Stevens and Stevens (1987) found students’ ratings varied significantly from those of faculty;
Newstead, Franklyn-Stokes and Armstead (1996) found that students define cheating more
narrowly (they consider fewer things cheating) than faculty.
Some unethical behaviors may result from a failure to correctly identify the behavior as
unethical: “I did not know this was cheating.” Others may result from failure to accept the
behavior as unethical: “I do not agree this is cheating.” Some behaviors may result from the
conscious decision to be unethical: “I don’t care if this is cheating.” For those students who
12
knowingly cheat, it may not be the concepts of right or wrong that prevail, but the perceived
benefits of cheating which outweigh the risks. Prior research has shown that risk taking behaviors
tend to be stronger for men than for women.
We investigated whether there were differences in the ratings of male and female
students, and found a significant effect from biological gender in the cheating ratings. We also
investigated whether the biological gender effect would disappear when psychological gender
was introduced in the analysis. Biological gender effects persisted when psychological gender
was included in the analysis.
The possibility that students were engaging in impression management with their survey
answers was also investigated. We found females engaged in significantly more impression
management than did males. This is contrary to some prior research (e.g. Singh, Kumra and
Vinnicombe, 2002), which found females were less willing to engage in impression management
than were males. We also found that biological gender effects persisted when impression
management was included in the analysis. Impression management does not appear to be the
driver behind the biological gender differences.
We also investigated whether the biological gender effect existed for accounting as well
as non-accounting majors. It is possible that curricular differences between different business
disciplines might negate biological gender effects. The results did not support that premise; there
appears to be a biological gender effect for both accounting and non-accounting business
students.

13
A limitation of the study is that the students in this study had not completed much of the
extra ethical content usually included in the accounting curriculum. The mean year in school for
the accounting majors is 3.18 (junior), making it plausible that this content had not been
completed. Future research may measure specific ethics content to help determine whether it
leads to differences in ethical views.
Each one of the above factors could theoretically cause biological gender differences in
beliefs to disappear. However, results of our study reveal significant biological gender
differences that persist when psychological gender, impression management and student major
are factored into the analysis.
Research has theorized that social conditioning may lead males toward unethical action
more often than females, especially when they feel the end justifies the means (Buckley, Wiese
and Harvey, 1998). Weber, Blais and Betz (2002) and Byrnes (1999) demonstrated that males are
more likely to take risks than are females in a variety of contexts. If risk taking is part of a
perceived social norm for males, this may be reflected in the cheating ratings by males.
Conversely, females may be more influenced by potential sanctions such as a reduction in
status (Leming, 1980), and may be more prone to obey societal rules as long as they have no
special reason or justification for acting unethically. However, females will act unethically when
they are able to make excuses for themselves about why it is acceptable to break laws or rules, or
when they fail to see the consequences of their actions as important (Ward and Beck, 1990). This
opens the door for females and males to act similarly with regard to cheating.
14
If biological gender differences are driven by socialization, curriculum content may be
able to help both personal and social ethics. If students do not hold appropriate academic ethical
beliefs, it is unlikely that ethics curricula such as learning about accounting scandals can ensure
students achieve appropriate levels of business ethics. Basic ethical beliefs provide a foundation
for understanding and utilizing business scenarios and theoretical discussions used in formal
business ethics training. Ethics curricula in business should focus more heavily on these basic
concepts.
One important basic concept is general societal ethics. Societal norms for honesty,
respect, lawfulness and other ethical elements are essential to ethical decision making (Copeland,
2005). Knowing that many students do not truly have a good understanding of what is and is not
ethical within a narrowly defined area of their own lives can help in ethics course development.
Content could directly address the importance of consequences in ethical decision
making. For example, when consequences are limited, is society implying that an unethical
action is permissible? Or, if the likelihood of getting caught doing something unethical is low,
should the unethical act be committed? Under what circumstances are unethical acts committed,
and is this a problem for society? Student cheating examples could be used in each of these
situations. Both male and female students would benefit from this type of analysis, perhaps for
different reasons. Women may become more able to correctly identify and assess consequences
of ethical actions. In each case, students may become better able to weigh consequences more
realistically and may become more aware of when (and why) they are taking ethical risks.

15
16
Figure 1
Academic Dishonesty Scale
1. Do more than your share of work in a
group project
1 2 3 4 5
2. Use unfair methods to learn what was on a
test before it is given
1 2 3 4 5
3. Copy material and turn it is as your own
work
1 2 3 4 5
4. Use material from a published source in a
paper without giving the author credit
1 2 3 4 5
5. Help someone else cheat on a test 1 2 3 4 5
6. Study for exams with other students in
the same course
1 2 3 4 5
7. Collaborate on solutions to an assignment
when collaboration is specifically
prohibited
1 2 3 4 5
8. Copy from another student during a test 1 2 3 4 5
9. Prevent other students from copying
from you during a test
1 2 3 4 5
10. Keep exam information private from
students in later sections of the same
course
1 2 3 4 5
11. Receive substantial help on an individual
assignment without your instructor’s
permission
1 2 3 4 5
12. Cheat on a test in any way 1 2 3 4 5
13. Memorize questions from quizzes that
may appear on exams
1 2 3 4 5
14. Use a textbook or notes on a test without
your instructor’s permission
1 2 3 4 5
17
Figure 2
Impression Management Scale
Using the scale below as a guide, write a number beside each statement to indicate how much
you agree with it.
Not Very
True 1 2 3 4 5 6 7 True
____ 1. I sometimes tell lies if I have to.
____ 2. I never cover up my mistakes.
____ 3. There have been occasions where I have taken advantage of someone.
____ 4. I never swear.
____ 5. I sometimes try to get even rather than forgive and forget.
____ 6. I always obey laws, even if I’m unlikely to get caught.
____ 7. I have said something bad about a friend behind their back.
____ 8. When I hear people talking privately, I avoid listening.
____ 9. I have received too much change from a salesperson without telling him or her.
____ 10. I always declare everything at customs.
____ 11. When I was young I sometimes stole things.
____ 12. I have never dropped litter on the street.
____ 13. I sometimes drive faster than the speed limit.
____ 14. I never read sexy books or magazines.
____ 15. I have done things I don’t tell other people about.
____ 16. I never take things that don’t belong to me.
____ 17. I have taken sick leave from work or school even though I wasn’t really sick.
____ 18. I have never damaged a library book or store merchandise without reporting it.
____ 19. I have some pretty awful habits.
____ 20. I don’t gossip about other people’s business.
18
Figure 3
Personal Attributes Questionnaire4
Not at all independent 1 2 3 4 5 Very independent
Not at all emotional 1 2 3 4 5 Very emotional
Very passive 1 2 3 4 5 Very active
Able to devote self
completely to others
1 2 3 4 5 Not at all able to devote self
completely to others
Very rough 1 2 3 4 5 Very gentle
Not at all helpful to others 1 2 3 4 5 Very helpful to others
Not at all competitive 1 2 3 4 5 Very competitive
Not at all kind 1 2 3 4 5 Very kind
Not at all aware of feelings
of others
1 2 3 4 5 Very aware of feelings of
others
Can make decisions easily 1 2 3 4 5 Has difficulty making
decisions
Gives up very easily 1 2 3 4 5 Never gives up easily
Not at all self confident 1 2 3 4 5 Very self confident
Feels very inferior 1 2 3 4 5 Feels very superior
Not at all understanding of
others
1 2 3 4 5 Very understanding of others
Very cold in relations with
others
1 2 3 4 5 Very warm in relations with
others
Goes to pieces under
pressure
1 2 3 4 5 Stands up well under
pressure
4Instrumental scale in bold print; expressive scale in regular print.
19
Table 1
Student Participant Information
Number of Participants
Major
Female
Students
Male
Students
Total
Students
Accounting 106 114 220
Finance 46 17 63
Management
Information Systems
19 8 27
Management 53 33 86
Marketing 23 40 63
Business
Administration
35 13 48
Other Business 5 3 8
Totals 287 228 515
20
Table 2
Student Participant Demographic Information
Mean (Standard Deviation)
Major Age Year5 GPA6
Accounting 21.71 3.18 3.29
(3.06) (0.87) (0.37)
Finance 21.27 3.21 3.36
(3.43) (0.54) (0.37)
Management
Information Systems
20.56 2.70 3.11
(1.42) (0.82) (0.35)
Marketing 21.37 3.32 3.12
(1.37) (0.80) (0.39)
Management 21.70 3.19 3.18
(2.75) (0.85) (0.36)
Business Administration 21.21 3.29 2.99
(1.43) (0.87) (0.42)
Other Business 20.88 3.13 3.13
(1.25) (0.99) (0.49)
Non Business 20.67 2.67 3.49
(0.57) (0.58) (0.21)
5 Year is 1=freshman and so forth
6 GPA is self-reported grade point average, 4-point scale.
21
Table 3
Academic Dishonesty Scale
Overall Ratings7
Mean (Std Dev)
2. Use unfair methods to learn what was on a test before it is given 1.95 (0.99)
3. Copy material and turn it is as your own work 1.52 (0.82)
4. Use material from a published source in a paper without giving
the author credit
1.65 (0.88)
5. Help someone else cheat on a test 1.48 (0.82)
7. Collaborate on solutions to an assignment when collaboration is
specifically prohibited
2.19 (1.04)
8. Copy from another student during a test 1.25 (0.69)
11. Receive substantial help on an individual assignment without
your instructor’s permission
2.41 (1.06)
12. Cheat on a test in any way 1.37 (0.77)
14. Use a textbook or notes on a test without your instructor’s
permission
1.35 (0.80)
7Item numbers correspond to item numbers in the original survey, see Figure 1.
22
Table 4
Academic Dishonesty Scale
Overall Gender Results
Panel A: Ratings by Biological Gender8 Female (287)9 Male (228)
2. Use unfair methods to learn what was
on a test before it is given
1.90 (1.00) 1.99 (0.99)
3. Copy material and turn it is as your
own work
1.42 (0.73) 1.61 (0.88) **
4. Use material from a published source
in a paper without giving the author
credit
1.55 (0.79) 1.72 (0.95) **
5. Help someone else cheat on a test 1.36 (0.80) 1.58 (0.83) **
7. Collaborate on solutions to an
assignment when collaboration is
specifically prohibited
2.02 (1.01) 2.34 (1.04) **
8. Copy form another student on a test 1.20 (0.66) 1.29 (0.72)
11. Receive substantial help on an
individual assignment without your
instructor’s permission
2.28 (1.09) 2.52 (1.03) **
12. Cheat on a test in any way 1.26 (0.70) 1.46 (0.81) **
14. Use a textbook or notes on a test
without your instructor’s permission
1.23 (0.68) 1.45 (0.88) **
Panel B: ANOVA for Gender Effect on CHEAT10
Source Sum of Squares df Mean
Square
F Prob.
Gender 388.42 1 388.42 12.61 0.0004
Error 15895.66 513 30.98
Total 16284.08 514
8 ** Difference significant at p<.05 9 Mean (standard deviation) 10 CHEAT is sum of each student’s rating of all items in Panel A
23
Table 5
Academic Dishonesty Scale
Gender Effects with Expressiveness Covariate
Panel A: Expressiveness Ratings11
Female Male
Expressiveness Mean 31.35 30.17 **
Expressiveness Std Dev 2.91 3.63
Panel B: ANCOVA for Gender Effect on CHEAT with Expressiveness Covariate
Source
Sum of
Squares df
Mean
Square F Prob.
Gender 332.99 1 332.99 10.82 0.0010
Express 45.16 1 45.16 1.47 0.2258
Error 15850.51 510 31.08
Total 16228.66 512
11 ** Difference significant at p<.05
24
Table 6
Academic Dishonesty Scale
Gender Effects with Impression Management Covariate
Panel A: IMR Ratings12
Female Male
IMR Mean 6.38 4.99 **
IMR Std Dev 3.37 3.29
Panel B: ANCOVA for Gender Effect on CHEAT with IMR Covariate
Source
Sum of
Squares df
Mean
Square F Prob.
Gender 171.44 1 171.44 5.90 0.0151
Express 928.25 1 928.25 31.94 0.0000
Error 14967.41 510 29.35
Total 16067.71 512
12 ** Difference significant at p<.05
25
Table 7
Academic Dishonesty Scale
Gender Effects by Major
Panel A: ANOVA for Accounting Majors
Source
Sum of
Squares df
Mean
Square F Prob.
Gender 235.40 1 235.40 7.18 0.0079
Error 7145.44 218 32.78
Total 7380.84 219
Panel B: ANOVA for Non-Accounting Business Majors
Source
Sum of
Squares df
Mean
Square F Prob.
Gender 140.65 1 140.65 4.80 0.0292
Error 8594.50 293 29.33
Total 8735.15 294
26
REFERENCES
Allmon, D.E., D. Page and R. Roberts. 2000. Determinants of Perceptions of Cheating:
Ethical Orientation, Personality and Demographics. Journal of Business Ethics. Feb, 23(4), pp
411-422.
Ameen, E.C., D.M. Guffey and J.J. McMillan. 1996. Gender Differences in Determining the
Ethical Sensitivity of Future Accounting Professionals. Journal of Business Ethics. 15(5), 591-
597.
Bampton, R. and P. Maclagan. 2005. Why Teach Ethics to Accounting Students? A Response to
the Skeptics. Business Ethics: A European Review. 14(3), July, 290-300.
Bernardi, R.A. and D.F. Arnold. 1997. An Examination of Moral Development with Public Accounting by
Gender, Staff Level and Firm. Contemporary Accounting Research. 14(4), 653-668.
Bernardi, R.A., E.L. Delorey, C.C. LaCross and R.A. Waite. 2003. Evidence of Social Desirability
Response Bias in Ethics Research: An International Study. The Journal of Applied Business Research.
19(3), 41-51.
Brown, B.S. and J. Abramson. 1999. The Academic Ethics of Graduate Business Students: A Survey.
Journal of Education for Business. 70(3), 151-156.
Brown, B.S. and P. Choong. 2005. A Investigation of Academic Dishonesty Among Business
Students at Public and Private United States Universities. International Journal of Management. 22(2),
201-214.
Buckley, M.R., D.S. Wiese, M.G. Harvey. 1998. An Investigation into the Dimensions of Unethical
Behavior. Journal of Education for Business. 73 (5), 284-291.
Byrnes, J.P., Miller, D.C., Schafer, W.D. 1999.Gender differences in risk taking: A meta-analysis.
Psychological Bulletin, 125(3), 367-383.
22(2), 201-214.
Coleman, N. and T. Mahaffey. 2000. Business Student Ethics: Selected Predictors of Attitudes
Toward Cheating. Teaching Business Ethics. 4(2), 121-135.
Toward Cheating. Teaching Business Ethics. 4(2), 121-135.
Copeland, J.E. 2005. Ethics as an imperative. Accounting Horizons, 19(1), 35-43.
Graham, M.A., J. Monday, K. O=Brien and S. Steffen. 1994. Cheating at Small Colleges: An Examination
of Student and Faculty Attitudes and Behaviors. Journal of College Student Development. 35 (July), 255-
260.
Jeffrey, C. 1993. Ethical Development of Accounting Students, Non-Accounting Students and
Liberal Arts Students. Issues in Accounting Education, 8, 86-96.
27
Jianakopolos, N.A. and Bernasek, A. 1998. Are Women More Risk Averse? Economic Inquiry. 36(4), 620-
630.
King, M.F. and G.C. Bruner. 2000. Social Desirability Bias: A Neglected Aspect of Validity Testing.
Psychology and Marketing. 17(2), 79-103.
Malone, F.L. 2006. The Ethical Attitudes of Accounting Students. Journal of American Academy of
Business. March, 8 (1), 142-147.
McCabe, A.C., R. Ingram and M.C. Dato-on. 2006. The Business of Ethics and Gender. Journal of
Business Ethics, 64, 101-116.
McCabe, A.C. and L.K. Trevino. 1997. Individual and Contextual Influences on Academic Dishonesty: A
Multicampus Investigation. Research in Higher Education. 38 (3), 379-397.
Merritt, J. 2002. You Mean Cheating is Wrong? Business Week, Dec. 9, 8.
Newstead, S.E., A. Franklyn-Stokes and P. Armstead. 1996. Individual Differences in Student Cheating.
Journal of Educational Psychology. 88(2), 229-241.
Paulus, D.L. 1998. Paulus Deception Scales: The Balanced Inventory of Desirable Responding Version 7.
Multi-Health Systems, Inc: North Tonawanda, NY.
Radtke, R.R. 2004. Exposing Accounting Students to Multiple Factors Affecting Ethical Decision Making.
Issues in Accounting Education. February, 10(1), 73-85.
Robinson, J.P., P.R. Shaver and L.S. Wrightsman. 1991. Measures of Personality and Social Psychological
Attitudes. Academic Press: New York.
Roxas, M.L. and J.Y. Stoneback. 2004. The Importance of Gender Across Cultures in Ethical Decision-
Making. Journal of Business Ethics. 50, 149-165.
Shafer, W.E., R.E. Morris and A.A. Ketchland. 2001. Effects of Personal Values on Auditors= Ethical
Decisions. Accounting, Auditing and Accountability Journal. 14(3), 254-278.
Singh, V., S. Kumra and S. Vinnicombe. 2002. Gender and Impression Management: Playing the
Promotion Game. Journal of Business Ethics. Dordrecht. 37 (1) part 2, 77-90.
Spence, J.T., R.L. Helmreich and J. Stapp. 1975. The Personal Attributes Questionnaire: A Measure of
Sex-Role Stereotypes and Masculinity and Femininity. Journal of Personality and Social Psychology, 32,
29-39.
Stern, E.B. and L. Havlicek. 1986. Academic Misconduct: Results of Faculty and Undergraduate Student
Surveys. Journal of Allied Health. 5, 129-142.
28
Stevens, G.E. and Stevens, F.W. 1987. Ethical Inclinations of Tomorrow=s Managers Revisited: How and
Why Students Cheat. Journal of Education for Business. 63, pp. 24-29.
Terpstra, D.E., E.J. Rozell and R.K. Robinson. 1993. The Influence of Personality and Demographic
Variables on Ethical Decisions Related to Insider Trading. The Journal of Psychology. 127(4), 375-390.
Tibbetts, S.G. 1997. Gender Differences in Students’ Rational Decisions to Cheat. Deviant Behavior. 18(4),
393-414.
von Dran, G.M., E.S. Callahan and H.V. Taylor. 2001. Can Students= Academic Integrity be Improved?
Attitudes and Behaviors Before and After Implementation of an Academic Integrity Policy. Teaching
Business Ethics. 5
Tibbetts, S.G. 1999. Differences Between Women and men Regarding Decisions to Commit Test Cheating.
Research in Higher Education. 40(3), 323-342.
Ward, D.A. and W.L. Beck. 1990. Gender and Dishonesty. Journal of Social Psychology. 130 (3), 333-339.
Weber, E.U., Blais, A., Betz, N.E. 2002. A Domain-specific Risk-attitude Scale : Measuring Risk
Perceptions and Risk Behaviors. Behavioral Decision Making. 15(4), 263-290.
West, T., S.P. Ravenscroft, and C.B. Shrader. 2004. Cheating and Moral Judgment in the College
Classroom: A Natural Experiment. Journal of Business Ethics. 54, 173-183.
Woolley, D.J. and M.M. Eining. 2006. Software Piracy Among Accounting Students: A Longitudinal
Comparison of Changes and Sensitivity. Journal of Information Systems. 20 (1), 49-64.