
Gender Difference and Marital Status in Organisational Role Stress Among Medical Doctors. Dr Pia...
117
Scottish Journal of Arts, Social Sciences and Scientific Studies - ISSN 2047-1278 http://scottishjournal.co.uk 1 SCOTTISH JOURNAL OF ARTS, SOCIAL SCIENCES AND SCIENTIFIC STUDIES VOLUME 2, ISSUE I JULY, 2012 Articles Aid Effectiveness for Belize’s National Health Insurance (NHI) Scheme’s Sustainability 3 Sharmayne Saunders 3 Effects of Emotional Learning System and Peer Mentoring on the Emotional Intelligence Skills of Senior Secondary School Students in Lagos, Nigeria. 15 I.P.Nwadinigwe, Sola Aletan and U.Azuka-Obieke 15 Essential Oil of Ocimum gratissimum; A Potent Antimicrobial and Inhibitor of Partially Purified and Characterized Extracellular Protease of Shigella flexneri 27 Adeola S. Adesegun, 27 Folorunso O. Samuel 27 Mohammed A. Gafar 27 Implications of Population Growth and Oil Production on CO 2 Emissions: Empirical Evidence from Nigeria 42 Isola, W. A 42 Ejumedia, P. E 42 Socio-Psychological factors determining workers’ negotiation pattern in selected organisations in Lagos State, Nigeria 53 Akanji Rafiu, Bankole Ph.D 53 Maroof ,Alatishe 53
Transcript of Gender Difference and Marital Status in Organisational Role Stress Among Medical Doctors. Dr Pia...

Scottish Journal of Arts, Social Sciences and Scientific Studies - ISSN 2047-1278
http://scottishjournal.co.uk
1
SCOTTISH JOURNAL OF
ARTS, SOCIAL SCIENCES AND
SCIENTIFIC STUDIES
VOLUME 2, ISSUE I
JULY, 2012
Articles Aid Effectiveness for Belize’s National Health Insurance (NHI) Scheme’s
Sustainability 3
Sharmayne Saunders 3
Effects of Emotional Learning System and Peer Mentoring on the Emotional
Intelligence Skills of Senior Secondary School Students in Lagos, Nigeria. 15
I.P.Nwadinigwe, Sola Aletan and U.Azuka-Obieke 15
Essential Oil of Ocimum gratissimum; A Potent Antimicrobial and Inhibitor of
Partially Purified and Characterized Extracellular Protease of Shigella flexneri 27
Adeola S. Adesegun, 27
Folorunso O. Samuel 27
Mohammed A. Gafar 27
Implications of Population Growth and Oil Production on CO2 Emissions: Empirical
Evidence from Nigeria 42
Isola, W. A 42
Ejumedia, P. E 42
Socio-Psychological factors determining workers’ negotiation pattern in selected
organisations in Lagos State, Nigeria 53
Akanji Rafiu, Bankole Ph.D 53
Maroof ,Alatishe 53

Scottish Journal of Arts, Social Sciences and Scientific Studies - ISSN 2047-1278
http://scottishjournal.co.uk
2
Ola Olusegun, Oyedele 53
ALIU BABATUNDE FAFUNWA’S INFLUENCE ON NURSERY EDUCATION
DEVELOPMENT IN NIGERIA: 1955-1998 65
Professor Amakievi Okien Ijeoma Gabriel 65
Species Composition, Length-Weight Relationships, Condition Factor and Sex
Distribution Pattern Of Palaemonid Prawns In The Ilaje Estuary, Nigeria. 76
Eniade, Abiodun Adeyemi* (M.Tech) 76
Prof. Bello-Olusoji, A. Oluayo (Phd) 76
Evaluation of the Performance of A - Type Stock Mutual Funds in Turkey With
Parametric and Non-Parametric Methods 86
PhD Candidate Utku Uygur 86
Assoc. Prof. Oktay Taş 86
Gender Difference and Marital Status in Organisational Role Stress Among Medical
Doctors. 100
Dr Pia Muriel Cardoso. 100
Dr R. Nirmala. MBA, PhD. 100
The Application of Podcasts and Vodcasts in English as Foreign Language (EFL)
Listening Learning 108
Murad Abdu Saeed 108
Norizan Abdul Razak 108

Scottish Journal of Arts, Social Sciences and Scientific Studies - ISSN 2047-1278
http://scottishjournal.co.uk
3
Aid Effectiveness for Belize’s National
Health Insurance (NHI) Scheme’s
Sustainability
Sharmayne Saunders
"Effective aid better health!"
Abstract
Belize is faced with the challenge of alignment of development aid with national health
development priorities; and harmonization of international strategic collaboration and partnership as it
relates to the sustainability of its National Health Insurance (NHI) Scheme. The objectives of this
paper is to examine the degree/magnitude of harmonization of international technical and financial
cooperation on the design and implementation of the National Health Insurance Scheme in Belize; and
then to make recommendations on mechanisms to enhance the harmonization of technical and
financial cooperation among international development partners and alignment with national priorities
for future NHI roll-out. The study employed a qualitative approach with a comprehensive literature
review buttressed by interviews conducted with the Ministry of Health, Social Security/NHI, and other
relevant stakeholders in order to aid data collection. The results indicate that in fact there was minimal
financial cooperation but greater technical cooperation as it relates to the National Health Insurance
Scheme. The study concluded that whilst Belize has exposure to and experience with international
cooperation, Belize‘s national health priorities have remained goal-oriented and whilst technical and
financial cooperation has been engaged, it has not allowed for priority shifts to align with these
funding.
Keywords
Aid effectiveness, technical cooperation, financial cooperation, international cooperation

Scottish Journal of Arts, Social Sciences and Scientific Studies - ISSN 2047-1278
http://scottishjournal.co.uk
4
Introduction
Belize‘s public health care system is predominantly funded by tax revenues and it encompasses
three main institutions: the Ministry of Health (MoH), the Belize Social Security Board (SSB) and
National Health Insurance (NHI). In Belize, the government is the main provider of health services.
The Ministry of Health operates a network of facilities, which includes the Karl Heusner Memorial
Hospital (KHMH) a national referral hospital in Belize City, 6 District Hospitals, roughly 40 Health
Centers, 30 Health Posts, and a mental health facility. Services provided in these facilities are
complemented by national programs for maternal and child health, public health and water safety
inspection, health education and nutrition, disease (vector) control, and STD/AIDS. The public system
also includes a nursing school, national laboratory, national equipment maintenance center, and
various other central support services.
In terms of private sector health care, there are two private hospitals with about 73 private
doctors offering general medical practice, and 38 specialists who provide outpatient services (mostly
in Belize City), private laboratories and radiology services, numerous private pharmacies, and many
midwives, traditional birth attendants, and nontraditional healers. NHI is the purchasing arm of the
MOH and is housed within the SSB. Hence, the cost of care is considered ―free‖ in most instances
and only incurs a symbolic ―price‖ in others (Health Systems Profile, 2009, pg. 21).
Belize‘s National Health Insurance Scheme is a derivative of the Belize Health Policy Reform
(BHPR) Project which began in 1996. It encompasses four major policy areas for reform: (1)
financing of the health sector; (2) allocation of health sector resources; (3) public and private sector
roles; and (4) improving quality and equity of health services. The Ministry of Health and
Government of Belize envisioned:
A national health care system which is based upon equity, affordability, accessibility,
quality and sustainability in effective partnership with all sectors of government and
the rest of society in order to develop and maintain an environment conducive to good
health (Health Policy Reform Project, 1998, p. 3)
Social Security was established in 1981 (immediately after Belize gained its independence) as
a contributory scheme. It served for a long time as the country‘s national health insurance (NHI). The
legislative framework (1999) was developed, financing strategies and mechanisms for the purchasing
of services from the public and private sector was proposed (Health & Life Sciences, p. 18). Later, as
part of Belize‘s Health reform initiative and Belize‘s social development plan, the National Health
Insurance entity was established in April 2001. The embryonic evolution of this national insurance
scheme focused on satisfying the health gap that existed in the country. The National Health
Insurance (NHI) scheme is pitched as a decentralized model.
The 1998, Belize‘s population was estimated at 236,975 with about 50% of the population
living in the two central Districts of Belize and Cayo; 31% in the two northern Districts of Coroza1
and Orange Walk; and the remaining 19% living in the two southern Districts of Stann Creek and
Toledo. Sometime in the late 2000‘s, NHI scheme was rolled out as a social initiative for the purpose
of developing a universal health insurance system which would be established as a separate branch of
the SSB (Impact Evaluation – Terms of Reference). It was piloted on the Southside of Belize as part
of a comprehensive poverty alleviation strategy. Later, the NHI was rolled-out in the Southern part of
the nation, and NHI health services are available in Stann Creek and Toledo Districts (Mid-term
Review of Belize Country Cooperation Strategy PAHO/WHO, 2010).
Breadth of package: The range of services included in the current NHI package, includes: (1)
Clinical detection and monitoring of patients with HIV/AIDS, (2) pre and post natal monitoring,
including consultations with a general practitioner (GP), (3) iron and folic acid supplementation, (4) 1
ultrasound exam, and (5) basic laboratory and blood test (including HIV and VDRL first trimester).
High risk cases are referred for management by specialist according to protocols mutually agreed to by

Scottish Journal of Arts, Social Sciences and Scientific Studies - ISSN 2047-1278
http://scottishjournal.co.uk
5
NHI and Primary Care Provider (PCP). Mental health services, dental services and health
promotion/education are not in the package of services and service protocols and contracts need
improvement.
Impressionably, the scheme was established with funding from the Social Security Board
(contributory scheme). Before 2006, all the NHI revenues were transferred from the SSB, but the
situation changed in 2006 when three sources of funds started financing the NHI (the SSB, MoH and
the Government/Ministry of Finance). From the B$10.2 million received in 2006, the participation of
the SSB dropped to 49 percent of total NHI revenues while the Government contributed with 40
percent and the MoH with 11 percent of total income. Transfers from SSB remain practically stable
since 2003 ranging from B$4.5 to B$5 million with an average growth rate of 3 percent per year. The
Belize SSB board approved disbursement of a total of B$15 million over a 3 year period to the NHI
Fund. This represents the last authorized transfer of funds from SSB to NHI (Sanigest Solutions,
2007).
NHI is the financing portion of the Health system in Belize; however, it is restricted to a
proportionate sector of the population. The service delivery model currently being adhered to is
reflective of the national health reform structure of the country. NHI is also a financing mechanism
that purchases services on behalf of the Ministry of Health and therefore has no direct relationship
with international organizations for funding or technical efforts.
The focus on sustainable development for a nation like Belize is pivotal in securing improved
quality of human life. Belize, like other untapped nations, has experienced inherent conflicts of
exploitation and even today, when commercial quantities of oil are being exported, we continue to
experience modern forms of exploitation. In the context of this paper, a comprehensive examination
of the areas covered from a health diplomacy and international cooperation perspective will be
examined as it relates to addressing the country's Primary Health Care goals, health sector reform and
for Belize, the NHI.
Hypothesis
International technical and financial cooperation has detracted from efforts to implement the
National Health Insurance Scheme in Belize due to lack of harmonization among international
agencies.
Purpose of the study
The study aims to determine if international technical and financial cooperation has detracted
from efforts to implement the National Health Insurance Scheme in Belize due to lack of
harmonization among international agencies.
Results
The study employed a qualitative methodology. A questionnaire with 12 open-ended questions
was developed. The questionnaire was piloted by a small group of prospective persons to complete
the questionnaire and then further adjusted.
In collaboration with PAHO, a list of seven (7) persons to be selected and interviewed was
identified and agreed upon. These include the following:
1. Representatives (2) from National Health Insurance
2. Representatives (3) from Ministry of Health. Persons who are knowledgeable of Health
Reform and the NHI implementation and initiative.
3. PWR from PAHO
4. Representative from an International Cooperation Agency (IADB)
Scottish Journal of Arts, Social Sciences and Scientific Studies - ISSN 2047-1278
http://scottishjournal.co.uk
6
Some or all questions from the interview questionnaire were posed to the interviewees based
on the particular areas of expertise. The persons were contacted first by email which notified them of
the study and which solicited their participation. Thereafter, a formal letter of request along with the
project‘s complete concept paper was sent to these persons. All individuals were then contacted by
phone to secure their participation.
Interviewees had two weeks to respond to the interview questionnaire. Follow-up calls were
made to ensure participation and in some cases a phone interview was completed. Some respondents
submitted response via email and phone interviews elucidated their responses.
There was a 71 percent response rate which represents five (5) out of a total seven (7) persons
(Appendix I).
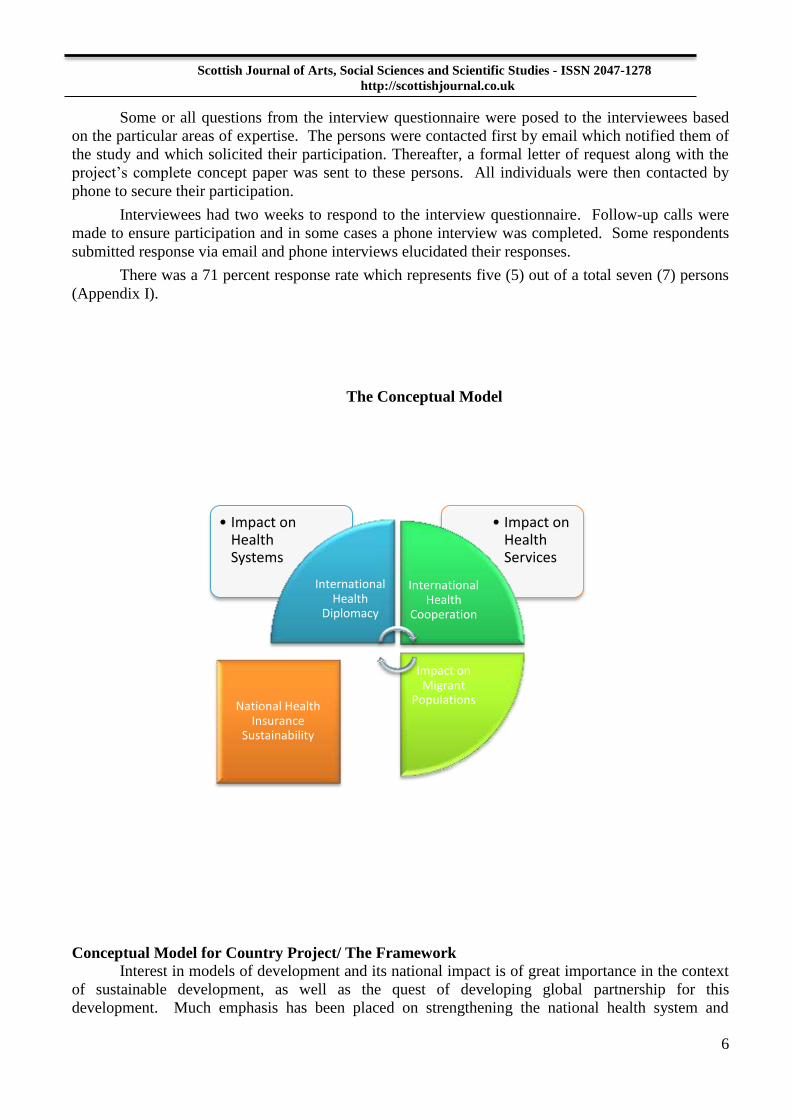
The Conceptual Model
Conceptual Model for Country Project/ The Framework
Interest in models of development and its national impact is of great importance in the context
of sustainable development, as well as the quest of developing global partnership for this
development. Much emphasis has been placed on strengthening the national health system and
• Impact on Health Services
• Impact on Health Systems
International Health
Diplomacy
International Health
Cooperation
Impact on Migrant
Populations
National Health
Insurance Sustainability

Scottish Journal of Arts, Social Sciences and Scientific Studies - ISSN 2047-1278
http://scottishjournal.co.uk
7
continued efforts have been placed on health reformation. With the use of the conceptual model
(LIHP2010), the model above was developed as it relates to this study.
This project reviews the following forces in international health:
a) International Cooperation/Health Diplomacy
b) Models of Development (inclusive / exclusive)
c) Human Rights
In reviewing the above forces, the following issues related to the National Health Insurance
will be looked at:
a) National Health Reform
b) Impact on Health Systems and Services
c) International Cooperation
d) Migrant populations
The international health cooperation dimension of the conceptual model encompasses the
management of health cooperation and the effective means of advocacy and negotiation. Through this
dimension, the technical cooperation between Belize and other countries will be reviewed, as well as
the impact of these relationships on health. One such agreement is the Declaration of Alma- Ata 1978
- Primary Health Care which outlines the ultimate goal for PHC is for better Health for All through:
reducing exclusion and social disparities in health (universal coverage reforms);
organizing health services around people's needs and expectations (service delivery reforms);
integrating health into all sectors (public policy reforms);
pursuing collaborative models of policy dialogue (leadership reforms); and
increasing stakeholder participation.
For Belize, the attainment of the Millennium Development Goals (MDGs) has resonated in the
efforts aimed at the Health Sector Reform Project (HSRP). The HRSP addresses four of the MDGs
directly related to health namely MDGs 4, 5, and 6. This includes the notion of Global Health -
improving health and achieving equity through Health for All.
Q1: Belize's International Cooperation Strategy
Participants were asked to respond to six (6) open-ended questions. Their responses were
captured by thematic areas and outlined below under various subheadings as it relates to the questions.
In response to the first two-part question of: Does Belize‘s International Cooperation Strategy
include supporting the NHI Scheme? If yes, what are the main elements/components mentioned for
strengthening/supporting? Most of the respondents indicated that a comprehensive document such as
the Belize International Cooperation Strategy did not exist. For the particular project of the NHI and
National Health Reform, a project document was developed, complete with strategies to harmonize
international cooperation for this particular deliverable of establishing the NHI scheme.
The international cooperation was done on an individual donor/country level. The technical
and financial components addressed were made possible through commitment from the government to
IADB that the budgetary responsibility to the NHI remains with the Government of Belize. In
addition, detailed specifications were drawn out that proposed strategies, contracting mechanisms and
review of package of services, more specifically for areas that were considered high risks due to
poverty (Southside Belize City and the southern region).
Table 2.1 below outlines the components that were supported through the MIF of IADB.

Scottish Journal of Arts, Social Sciences and Scientific Studies - ISSN 2047-1278
http://scottishjournal.co.uk
8
Components MIF GOB Total
Developing a regulatory framework for the private
sector
$
127,500.00
$
55,500.00
$
183,000.00
Improvement of private sector standards and market
organization, including the corporate and organizational
development of private providers as contractors
$
165,000.00
$
290,000.00
$
455,000.00
Developing and institutionalizing private sector
purchasing and contracting tools and skills
$
360,000.00
$
81,290.00
$
441,290.00
Support of the National Health Insurance Fund:
Technical Development
$
555,000.00
-
$
555,000.00
Support of the National Health Insurance Fund:
Innovation Fund
$
420,000.00 -
$
420,000.00
$
1,627,500.00
$
426,790.00
$
2,054,290.00
Source: Draft National Health Insurance Innovation Fund - Belize Pilot Project Operational Manual
Table 2.1 MIF Project Components and Funding
There was great intention in universalizing coverage (Homedes, 2009). Overall, an estimated
20 percent to 25 percent of the population in LAC (200 million people) does not have regular and
timely access to health systems (PAHO Strategic Plan 2008 -2012). For Belize, extending the
coverage of the NHI scheme seems to be an essential step towards improved coverage and access to
healthcare for the population.
Q2: International Financial and Technical Cooperation and NHI
In response to the second question: To what extent has international technical and financial
cooperation (both bilateral and multilateral) been provided in formulating the design &
implementation of the NHI? How has this cooperation evolved over time?
After 2004 and through an IMF funded consultancy, the only other identified input has been
within the scope of the last two years. This has been part of the Government‘s Policy-based loan with
IADB. Admittedly, much of the input has been technical input through the IADB loan agreements
that assessed the contractual model to evaluate the efficiency of contracting process and to assess
coverage and benefit packages.
Q3: Harmonization among the international technical cooperation partners
Question 3 asked: Are the efforts of the various international cooperation partners harmonized
in terms of their approach to NHI design and implementation? If not, what are the differences? Do
they have competing interests? If so, what are they?
The various efforts of international cooperation partners have been country-led initiatives. In
the period of early 2000 – 2004, the conceptual framework for the NHI Scheme was formulated and
was exclusively implemented, developed, financed and monitored by the country‘s key stakeholders.
Harmonization of the UN agencies/donors is evident and though most of these agencies boast
commitment to the development of Belize, much of their work done was in SILOs. One such example
is the individualize Country Cooperation Strategy of PAHO. This strategy involves the participation
of national counterparts such as community-based organizations, non-government organizations, civil
society and trade unions in an effort to strengthen national capacity but it does not include other
international funding agency and can form a part of the much needed Belize International Cooperation

Scottish Journal of Arts, Social Sciences and Scientific Studies - ISSN 2047-1278
http://scottishjournal.co.uk
9
Strategy. Whilst there remains an indigenous demand for aid and technical cooperation, this is
successfully matched by an indigenous supply of aid and technical expertise.
By the end of the 2007/2008 fiscal year, only 73,000 people, or 23 percent of the population,
were covered by the NHI (Sanigest Solutions, 2008). Historically, the National Health Insurance
project had been mostly financed with funds from the Social Security Board (SSB). Between August
2001 (when the project was launched) and 2006, NHI received B$32.3 million in total, out of which
84 percent (B$27.4 million) came from SSB. Total funds increased at an average 54 percent annual
rate, but this figure is highly biased by outlying rates in 2002 and 2006. The high rate in 2002 is the
result of comparing a full fiscal year (2002) with 8 months of revenues in 2001, given that the project
started in August.
Over the last ten years, the trend in aid for health appeared relatively fragmented and did not
focus on large projects. In 2009, Net Overseas Development Assistance for Belize per capita was
$83.61 (2009), compared to LAC: $15.9, Europe & Central Asia: $20.0, East Asia & pacific: $5.3 and
Sub-Saharan Africa: $53.0.
Year Donortype Donorcode Donor
CPA disbursement -
Current USD million
CPA disbursement -
2009 prices
2007 DAC countries 701 Japan 0.135 0.167
2007 Multilateral 963 UNICEF 0.013 0.013
2008 DAC countries 701 Japan 0.125 0.137
2008 Multilateral 963 UNICEF 0.008 0.008
2009 DAC countries 701 Japan 0.094 0.094
2009 Multilateral 963 UNICEF - -
Source: Development Co-operation Directorate (DCD-DAC) 2007-2009
Table 1.1 Donor Disbursements
Efforts of International Partners and alignment
Since the Government has prioritized its health initiatives as set out by Ministry of Health‘s
Strategic Plan, alignment of international partners‘ efforts have been relatively targeted. Health
remains a litmus test for broader aid effectiveness efforts. The health system displays great versatility
in that it tends to adopt global health trends with a sustained focus on national health priorities and
goals. In addition, MoH through its comprehensive Health Operational and Strategic Plan managed to
keep national health priorities focused and country-led. It was established, that national government
has the primary responsibility for coordinating all external assistance – both technical and financial in
nature. Strategic partners are kept abreast of all priorities by reference to this Health Operational and
Strategic Plan and can align their programmatic funding with those of Belize's national health
priorities.
Currently, the country remains dependent on short-term external funding and development aid
for the advancement of health issues. Greater ownership and leadership in this area will ensure aid
effectiveness for Belize. Critical to this is the notion that Belize has essentially made commendable
strides to move away from the vicious cycle of donor dependency to a more virtuous cycle of national
sustainability with prescriptive donor cooperation.
Q4: Contributing Factors/Obstacles to the lack of Harmonization (NHI)
The general response to Question 4: Are international cooperation efforts as they relate to the
NHI aligned with national health decisions/priorities?
1 (current US$)

Scottish Journal of Arts, Social Sciences and Scientific Studies - ISSN 2047-1278
http://scottishjournal.co.uk
10
Several obstacles and factors that have contributed to the lack of harmonization as it relates to
international cooperation and the NHI implementation were cited. These included:
Political interfacing
Institutional capacity
Lack of clear financial processes
Lack of administrative accountabilities
Rigid financial policies
Q5: Current Existing Mechanism to facilitate harmonization
Question 5 was posed as follows: What mechanisms currently exist (if any) which facilitate
harmonization among the international technical cooperation partners and alignment with national
decisions/priorities?
Belize has clearly articulated the following national health goal: To raise the health status of
the population by improving the efficiency, equity and quality of health care services and by
promoting healthier lifestyles, through a health Sector Reform Project2. In addition the specific
objectives3 outlined were:
Restructuring and strengthening the organizational and regulatory capacity of the
central and regional level of the public sector to plan, organize, produce, procure and
deliver a high standard of care on a cost efficient basis.
Rationalizing and improving the coverage and quality of services of public and private
sectors by:
a. restructuring public facilities,
b. purchasing selected services from the private sector to support the public supply,
c. providing mobile services and transport in less accessible areas,
d. training community nursing aides and other health professional; and
Achieving an equitable and sustainable system of sector financing by helping to set up a
National Health Insurance Fund and focusing public spending on the poor.
All health-related cooperation is centralized through the Ministry of Health who has the
responsibility to coordinate, mediate and support these efforts. The mechanism to purchase health
services could be better harmonized with existing regulations and policies.
Q6: Mechanism to enhance harmonization
In response to Question 6: What are some recommendations on mechanisms to enhance the
harmonization of technical and financial cooperation among international development partners and
alignment with national priorities for future NHI roll-out?
The United Nations in-country agencies have demonstrated and continue to demonstrate a firm
commitment to the provision of technical support for national health reform initiatives with a well
2 Health Sector Reform Program (BL-0014)
3 Health Sector Reform Program (BL-0014)

Scottish Journal of Arts, Social Sciences and Scientific Studies - ISSN 2047-1278
http://scottishjournal.co.uk
11
defined goal-based framework. However, these initiatives are country-led and remain the
responsibility of the Government of Belize through the Ministry of Health. It was distinctly
established that many key actors played a role in the Health Sector Reform implementation and as
such, have remained committed to the government‘s efforts and strategies to roll-out the NHI
nationally.
Discussion
In 2005, the Paris Declaration on aid effectiveness outlined five principles to improve the aid
quality and its impact on developing countries. These principles include: ownership, harmonization,
alignment, results and mutual accountability. The Paris Declaration requires that at the country-level,
national Governments have the primary responsibility for coordinating external assistance and
evaluating its contribution to national priorities; and mandated the United Nations system to promote
national ownership and capacity development, and to make system-wide progress in harmonizing
evaluation practices. The display of harmonization of international aid and effort to harmonize
different donors has been profound in Belize's health arena.
The most important and urgent requirement for seeking international cooperation is to seize the
opportunities presented by global collaboration on prioritizing health issues and harmonization of
health agenda. Essential to this, is to ensure that there is no duplication of efforts, but rather enhanced
efforts among partnering countries.
Socialist Model and the Belize Health Situation
There is much centralized planning of health care initiatives and the country's national health
reform initiative is a good example of this type of centralized planning that is captured from the
socialism theory. However, the national hospitals and polyclinics are not totally protected from
competition of similar services from the private hospitals. In fact, the country also allows for migrant
workers to obtain job positions within the hospitals and garner the same salary as locals. Ideally, a
socialist society would be reflected as a society that is an equitable society and allows for health and
environmental protection. Equity in health is an attainable goal the NHI scheme seeks to achieve.
Capitalist Model and the Belize Health Situation
The capitalist model seeks to strengthen governments particularly in developed countries.
Belize has a sizable rural population of 156,400 and an urban population of 165,7004 and is considered
to be an economy based on agricultural exportation.
There is much to be desired and the health care system is characterized as striving towards
equity, affordability and accessibility to all.
Global factors that affect the health care system includes: aligning the country's priority with
aid and partners; harmonization of the country's national agenda with global concerns, and
harmonization of international strategic collaboration and partnership that will help the country attain
equitable, accessible and affordable health care. Other factors include: well being of the nation's
population, financing, access to services, health care providers and per capita expenditure.
To date, the country has applied aspects of both the capitalist and the socialist models of
development not attaching policies of development to any one particular concept. Much of the
capitalist aspects can be viewed in the health care system where private hospitals are viewed as
enriching the investors at the health expense of the nation. Private hospitals compete with national
hospitals and polyclinics for the same services but at substantial price differences. To this type of
enrichment, the economic growth and social health and well being of the nation is stunted.
4 Health Statistics of Belize, 2009

Scottish Journal of Arts, Social Sciences and Scientific Studies - ISSN 2047-1278
http://scottishjournal.co.uk
12
Conclusion
Belize‘s national health priorities have not been guided by aid funding but in fact have been
country-led. International technical and financial cooperation has enhanced efforts to implement the
National Health Insurance Scheme in Belize due to country-led initiative, collaboration and substantial
harmonization among international agencies. Whilst Belize has exposure to and experience
international cooperation, the health priorities have not been donor-led. Priorities remained goal-
oriented and whilst technical and financial cooperation has been engaged, the country has not allowed
for priority shifts to align with these funding.
A key challenge that must be addressed includes the alignment of all intended developmental
aid with national health development priorities and harmonization of partner actions to ensure aid
effectiveness. A national development plan, Horizon 2030 exists but a comprehensive International
Cooperation Strategy has not yet been formulated. Once this is in place, it will provide a clear and
distinct road mapping of health priorities as outlined in the Health Strategic Plan which essentially
demonstrates to prospective donors and development partners the national priorities that they can align
with their programmatic funding. The Health Agenda 2007 – 2011 does this to the limited extent of
health priorities but the development of an effective aid agenda that ultimately establishes the
country‘s specific needs will be the enabling factor that fosters and cultivates collaboration and
harmonization. Belize will then be able to direct funds into the key areas that require urgent attention
and allow the Government to remain actively involved and committed to decision making as it relates
to the influx of aid for health in Belize.
Improvements in the health care system will depend on how the government continues to view
the nation's health priorities. Our nation is strategically placed in Central America and the Caribbean
with several unofficial border crossings that allow for informal trade and migrant labor. Given this
reality, it is imperative that Belize, in partnership with its regional counterparts, adopt common
measures and norms for health. This approach will no doubt contribute to related social development
in the first instance and to the nation's economic growth in the long term. This can be realized as a
nation with strong cultural and family values. The sustainability of the nation's health insurance
system is dependent on the political commitment to ensure health equity remains a priority.
Ultimately, there is a direct correlation between health equity and NHI sustainability. Equity
essentially means containing the health costs and making health care affordable and accessible to all.

Scottish Journal of Arts, Social Sciences and Scientific Studies - ISSN 2047-1278
http://scottishjournal.co.uk
13
Acknowledgment
This study was completed under the guidance and invaluable support of Mr. Emir Castaneda,
Dr. Gustavo Vargas and Dr. De Cosio, PAHO Belize. In addition, thanks to Dr. Ramon Figueroa,
Manager, National Health Insurance for information sharing and willingness to participate when called
upon.
Valuable inputs in the form of contributions, peer review, suggestions and criticisms provided
by Annella Auer, PAHO-Washington, D.C. and Coordinator for Leaders in International Health
Program 2011; Celia Poon-King (English-speaking Caribbean Mentor); Michelle Vanzie, Director of
Policy Analysis and Planning Unit, Ministry of Health; Michelle Hoare, Technical Advisor in the
Ministry of Health and LIHP 2010 Participant; Tazhmoye Crawford, LIHP 2011 Jamaica Participant;
and Dr. Vishwa Mahdeo, LIHP 2011 Guyana Participant.

Scottish Journal of Arts, Social Sciences and Scientific Studies - ISSN 2047-1278
http://scottishjournal.co.uk
14
References
Cambridge Consulting Corporation. Health Policy Reform Project – Government of Belize.
Final Report. Project No. ATN/SF-4686-BL. 1998.
Guerrero, E. Godue, C., Auer, A. ―Approaching Topics from an International Health
Perspective and the Development of a Conceptual Model for Its Understanding. PAHO.
Washington, D.C. 2010. Chapter 4.4. Models of Development
Health Statistics of Belize 2004-2008. Ministry of Health. [Cited on June 2011]. Available
from: http://www.health.gov.bz/www/index.php/publications/epidemiology-publications/88-
epidemiology/275-health-statistics-publication-2004-2008.
Health and Life Science Partnership. Government of Belize – Health Reform: Project
Documents. Belize, 1999.
Health Systems Profile Belize: Monitoring and Analyzing Health Systems Change/Reform
[cited on July 1, 2011, updated on July 2009). Available on:
http://new.paho.org/blz/index.php?option=com_docman&task=doc_download&gid=64&Itemi
d=250.
Homedes N, Ugalde A. Twenty-Five Years of Convoluted Health Reforms in Mexico.
PLoSMed 6(8): e1000124. doi:10.1371/journal.pmed.1000124. 2009.
Lakin, J. Mexico's Health System: More Comprehensive Reform Needed. PLoS Med
6(8):e1000130. doi:10.1371/journal.pmed.1000130. 2009.
Overseas Development Assistance. . [cited on November 10th, 2011]. Available from:
http://data.worldbank.org/topic/aideffectiveness
Sanigest Solutions. Inter-American Development Bank: Health Financing Options for the
National Health Insurance of Belize. 2008.
Sanigest Solutions. Belize National Health Insurance Rollout: Situational Analysis. 2007.
Sartor, A. ―Models of Development‖. Chair of Engineering and Society. Regional Faculty of
Bahía Blanca. Universidad Tecnológica Nacional. Buenos Aires, Argentina.
United Nations Children's Fund. [cited on June 10th, 2011]. Available from:
http://www.unicef.org/infobycountry/belize_statistics.html#79.
Vanzie, Michelle., Hsi, Natasha., Eichler, Reina. Pay for Performance to Strengthen Health
Prevention Activities and Improve Efficiency: The Belize Case Study. Betheseda, Maryland:
Health Systems 20/20, Abt Associates Inc. 2010.

Scottish Journal of Arts, Social Sciences and Scientific Studies - ISSN 2047-1278
http://scottishjournal.co.uk
15
Effects of Emotional Learning System
and Peer Mentoring on the Emotional
Intelligence Skills of Senior Secondary
School Students in Lagos, Nigeria.
I.P.Nwadinigwe, Sola Aletan and U.Azuka-Obieke
Department of Educational Foundations
University of Lagos, Nigeria.
Abstract
The study investigated the relative effectiveness of emotional learning system and peer
mentoring in enhancing emotional intelligence skills of senior secondary school students in Lagos,
Nigeria. A sample of 156 participants randomly selected from three senior secondary schools was
used. The schools were randomly assigned to the two treatment conditions (emotional learning system
and peer mentoring) and control group. Questionnaire was employed to generate data for the study.
Two research hypotheses were formulated to guide the study. The hypotheses were tested using
descriptive statistical method and analysis of covariance (ANCOVA). The study revealed that both
treatment techniques were efficacious in enhancing the level of emotional intelligence skills of the
students. Further evidence revealed that emotional learning system was more effective in improving
emotional intelligence skills than the peer mentoring technique.
Keywords : Emotional learning System, Peer Mentoring, Emotional Intelligence Skills.

Scottish Journal of Arts, Social Sciences and Scientific Studies - ISSN 2047-1278
http://scottishjournal.co.uk
16
Introduction
Secondary education, without doubt is supposed to be the basis and the foundation for
pursuing higher knowledge in tertiary institutions. It is an investment as well as an instrument that can
be used to accomplish a more rapid socio-economic, political, technological, scientific and cultural
development in the country. The National Policy on Education (2004) stipulated that secondary
education is an Instrument for national development. It fosters the development of the individuals for
further education, and general development of the society. The role of secondary education is to lay
the foundation for further education and if a good foundation is laid at this level, there is likely to be
no problem at subsequent levels.
The increasing population of school going adolescents in Nigeria has revealed a variety of
problems which contemporary Nigerian higher institutions are forced to put up with. Among the
observable personal problems of Nigerian adolescents, particularly in secondary schools, are
unhappiness, annoyance and anger, inability to meet needs, inability to get aspirations into fruition,
anxiety neurosis, excessive frustration, lack of knowledge and information (Adediran, 1991). What the
foregoing suggests is that there is a fundamental problem in the emotional orientation among
secondary school students and very few people care to think of the ‗student emotional factors‘ which
cannot be divorced from the complexity of factors that determine the totality of a student‘s success in
life. One such element of these complex factors is the student‘s level of emotional intelligence.
Cherniss (2004) stated the importance of emotional intelligence as necessary to improving
performance and psychological well-being in school works.
Abisamra (2000) averred that ―Intellectual Intelligence account for only 20% of total success
and the rest goes for emotional and social intelligence‖ and argued that ―it is only logical that teachers
begin to teach components of emotional intelligence to students at school‖. He then concluded that if
emotional intelligence affects students‘ achievement, then it is imperative for schools to integrate it in
their curricula and thereby raising the level of students‘ success.
The term ‗emotional intelligence‘ was coined in 1990 by Yale psychologist Salovey and
Mayer, who together developed a model of intelligence reflecting the connection of emotions to
thinking (Salovey and Mayer, 1990). Emotional Intelligence is perceived as a type of aptitude that
involves the ability to monitor one‘s feelings and that of others, to discriminate among them and to use
this information to guide one‘s feeling and thinking (Salovey and Mayer, 1990). Emotional
intelligence is the intelligent use of emotions—intentionally using them to help guide ones behaviour
and thinking in ways that enhance one‘s ability to satisfy ones basic needs and to obtain ones wants.
Impliedly, it is a learned ability requiring an intentional and active decision making.
Emotional intelligence is an all-round potential that is in some amount genetically present in
every individual but developed in the course of life events and environment which aid one to manage
oneself and relate effectively with others (Goleman, 1995). Every student already has a level of
emotional intelligence. Therefore, every member of the school management, teachers and parents have
a great role in improving and developing this potential in students.
Bar-On (1996) was of the opinion that Emotional Intelligence reflects our ability to deal
successfully with other people and with our feelings. He developed the Bar-On Emotional Quotient
Inventory (EQ-i) after seventeen years of research. And this inventory is the first scientifically
developed and validated measure of emotional intelligence that reflects one‘s ability to deal with daily
environmental challenges and helps predict one‘s success in life including professional and personal
pursuits. Bar-on examined the effect of age, gender and ethnicity on EQ-i score. With respect to
gender, they found no differences appeared between males and females with respect to overall
emotional and social competencies (Bar-On and Parker, 2000).

Scottish Journal of Arts, Social Sciences and Scientific Studies - ISSN 2047-1278
http://scottishjournal.co.uk
17
However the effects of gender on Emotional Intelligence revealed that there was not enough
evidence to say that there was an effect of the variable gender to the factors of emotional intelligence
studied ( Stottlemyer,2002; Ogunyemi, 2007).
Meanwhile, emotional intelligence where emotional competencies are closely linked, to gender
differences have also been detected in childhood, adolescents and adulthood (Petrides &
Furnham,2000; Sanchez-Nunez, Fernandez-Berrocal, Montanes & Latorie, 2008)
Goleman (1995) defines emotional intelligence as knowing what one‘s feelings are and using
that knowledge to make good decisions. It is also the ability to maintain hope and an optimistic
outlook in the face of disappointments and difficulties. He also defined emotional intelligence as
empathy, which is awareness of the feelings of others. Goleman (1998) developed the Emotional
Competence Framework model that is organized around personal and social competencies.
Finegan (1998) states that the concept of emotional intelligence is closely related to other
theories which involved emotional identification, reasoning and behavioural response to
environmental stimuli, all included in Weschler‘s definition of the nature of intelligence. Nelson and
Low (1998) developed a model (Exploring and Developing Emotional Intelligence Skills) for
assessing and developing emotional intelligence skills which organizes emotional skills into four areas
of emotional competencies. The first competency area is the interpersonal communication under
stress, which involves the importance of communication and emotion control in building and
maintaining healthy and productive relationships. This competence includes emotional skills of (a)
assertion (b) anger control and management (c) fear control and management. The second competency
area is Leadership and it involves the importance of developing responsible leadership centred on the
person and leading in positive ways when working with others. Emotional skills in this area include
(a) Comfort (b) Empathy (c) Decision making and (d) leadership. The third area is Self-management
in life and career which involves self direction and management to achieve meaningful personal and
career goals. Emotional skills include (a) Drive strength (b) Time management (c) Commitment ethics
and (d) Positive personal change. The fourth personal competency area is intrapersonal development
which involves learning and developing positive beliefs, attitudes and views of self to achieve
personal well-being and health. Emotional skills in this area include a) Self-esteem and (b) Stress
management.
An understanding of the emotional intelligence helps people successfully meet the demands
and challenges of each stage of life. The emotional intelligence provides a different, additive and
critical sources of data to improve personal and career success. In emotional intelligence, the
emotional mind works in concert with the cognitive mind to integrate and harmonize the person. It
enables people to reduce negative stress in their life, build healthy relationships, communicate
effectively, and develop emotional health.
This study was therefore designed to investigate the extent to which emotional learning system
and peer mentoring techniques would enhance students‘ emotional intelligence skills.
Peer mentoring are mentoring relationships that consist of participants who are closer in age
to one another or belong to similar peer groups (Kram, 1985). Chikering and Reisser (1993) assert that
peers are the most powerful influence on students‘ development in schools. They also suggest that
students engage each other at least twice as much as they engage with teachers and senior colleagues.
Peer relationships are easier for students to maintain and establish due to students‘ close proximity
with other students.
Emotional learning system is a model emotional and experience-based learning. It involves
five steps which are systematic and sequential. The system is designed to ensure a learner-centred
development process. The five steps are; step A- Explore, step B – Identify, step C – Understand, step
D – Learn and step E – Apply and model.

Scottish Journal of Arts, Social Sciences and Scientific Studies - ISSN 2047-1278
http://scottishjournal.co.uk
18
Statement of the problem
Many adolescents in schools have been manifesting chronically low emotional intelligence
skills in most parameters of measurement. This is observed in their academic, social and other areas of
life.
The demands of today‘s world and the challenges of coping under serious emotional strain,
coupled with uncooperative attitude of some parents who are most often engrossed with the provision
of the family needs, may trigger negative emotions in students when not handled effectively. It is also
apparent that a chronic pattern of emotional maladjustment destroys a student‘s sense of self and
personal safety which may have adverse effect on their emotional health, social skills and learning.
Many factors may account for the negative impact on emotional intelligence skill. However, it
is notable that little research and intervention to remedy the situation has been done in Nigeria, to the
knowledge of these researchers. This is why emotional learning system and peer mentoring were
isolated to determine how well they will improve the emotional intelligence skills of the students
which will help those negative emotions to be transformed into positive behaviours that will enable
them to better adjust in life.
Purpose of the Study
The primary purpose of this study was to determine the effect of emotional learning system
and peer mentoring on the emotional intelligence skills of senior secondary school students in Lagos,
Nigeria. To achieve this purpose it will:
1. Examine whether there is any difference in the post-test scores on emotional intelligence
skills among participants exposed to Emotional Learning System, Peer Mentoring and
Control Groups.
2. Establish whether there is any gender difference in post-test scores on emotional intelligence
skills due to experimental conditions of participants.
Hypotheses
1. There is no significant difference in post-test scores on emotional intelligence skills among
participants exposed to Emotional Learning System, Peer Mentoring and control group.
2. There is no significant gender difference in post-test scores on emotional intelligence skills
due to experimental conditions of participants.
Methodology Design
The research design used for this study was quasi-experimental (pre-test/post-test control
group design). It is difficult to randomly assign subjects to treatment conditions in a natural setting
because it is not possible to control the influence of extraneous variables through other techniques
hence the use of quasi-experimental design so as to ease out the influence of the treatment condition.
Sampling Procedure
Using stratified random sampling procedure, six intact classes were selected from 12 intact
classes in the three secondary schools of the two education districts. A total of 240 participants
comprising of both female and male SS3 students were selected by simple random sampling for the
baseline assessment of the study .The sample comprised of eighty participants drawn from each of the
3 selected secondary schools in the ratio of forty participants per class. Using the baseline assessment
scores, those who had below 50% on the Exploring and Developing Emotional Intelligence skills

Scottish Journal of Arts, Social Sciences and Scientific Studies - ISSN 2047-1278
http://scottishjournal.co.uk
19
questionnaire were selected to form the experimental groups with 156 participants. These 156
participants consist of 55 participants in school 1, 51 participants in school 2 and 50 participants in
school 3. Schools were randomly assigned to treatment conditions and control group.
Instrumentation
The research instrument used to obtain relevant data for this study was an adapted version of
the original version of the Exploring and Developing Emotional Intelligence Skills Questionnaire
(EDEISQ)developed by Darwin B. Nelson, Ph.D. and Gary R. Low, Ph.D in 1998 (Stottlemyer 2002).
EDEISQ was adapted for the study to make it more suitable for use in our secondary school setting.
The adapted instrument had two main sections:
Section 1: This section obtained from the respondents their personal background data such as,
class, gender, school, and identification number.
Section 2: This section was a 130-item scale that measured the respondent‘s emotional
intelligence skills in four major dimensions: interpersonal skill, leadership skill, self-management skill
and intrapersonal skill. The questionnaire was scored on a 3-point Likert scale.
A pilot study using 30 participants was carried out to determine the test-retest reliability index
of the instruments .The interval between the first and the second administration was three weeks. The
correlation between the two set of scores was determined using Pearson‘s Product Moment
Correlation method. The reliability coefficient was 0.81.
Administration of the Instruments
The intervention programme was carried out over a period of 10 weeks. One week each was
used for both the pre-test and post-test. The treatments consisted of Emotional learning system and
Peer mentoring techniques. Participants in the two treatment groups were exposed to one hour thirty
minutes of training/discussion once per week for 8 consecutive weeks. The control group did not
receive any treatment.
Treatment
Programme 1: Emotional learning System
The aim of this treatment is to use its step-by-step process to help participants become more
emotionally reflective and constructive in their thinking. Once an individual becomes emotionally
reflective and constructive, the choice of behaviour is positive. The emotional learning system helps
individuals to balance their feelings and thoughts to produce intentional behaviours that are called
emotional intelligence skills. This system also uses person-centred assessment, reflection, constructive
thinking, and skill development lessons to guide student learning. The five-step learning processes are:
Step A (Self-Assessment: Explore) which requires that one develops an intentional self-assessment
habit. Step B (Self-Awareness: Identify) which involves the process of identifying one‘s experience
and labelling the emotion. Step C (Self-Knowledge: Understand) which involves insight and
understanding of an emotion that allows one to make a choice about behaviours. Step D (Self-
Development: Learn) which involves learning various ways to improve one‘s behaviour and
experience positive outcomes. Step E (Self-Improvement: Apply and Model) which requires that one
practice emotional intelligent behaviour to achieve personal success.
Programme 2: Peer Mentoring
The objective of Peer mentoring programme is to help both mentors and mentees, develop and
advance their interpersonal, leadership, self-management and intrapersonal skills. Peer mentoring is
also aimed at increasing participants‘ self-esteem and self-efficacy. Peer mentoring relationships
involve a level of reciprocity and collaborative benefits for the both the mentor and mentee that may

Scottish Journal of Arts, Social Sciences and Scientific Studies - ISSN 2047-1278
http://scottishjournal.co.uk
20
be different than in traditional mentoring relationships (Kram, 1985b; Kram & Isabella, 1985;
Zachary, 2006). Peer mentoring relationships have the power to be more impactful on students
because of the students‘ proximity in age with one another (Astin, 1999). Research suggests that peers
have a great level of influence over other peers (Newcomb, 1962; Astin, 1999).
Procedure for data analysis
The two hypotheses were tested using descriptive statistical method and analysis of
covariance (ANCOVA).The level of significance was determined at 0.05 level.
Results
Hypothesis one :In the null form states that there is no significant difference in post test scores
on emotional intelligence skills among participants exposed to emotional learning system, peer
mentoring and control group. The data were analyzed using Analysis of Covariance statistic and the
result of the analysis is as presented in Tables 1, 2 and 3respectively.
Table 1: Descriptive data on emotional intelligence skills across experimental groups.
Pre- test Post – test
Group N X SD X SD MD
Emotional Learning
System 55 148.32 18.74 172.26 19.79 23.94
Peer Mentoring 51 150.96 16.54 161.18 17.73 10.22
Control 50 148.68 17.35 148.58 17.65 0.10
Table 1 shows the pre-test and post-test scores of participants in the three experimental groups.
It was noted that the participants exposed to emotional learning system had the highest post-test score
on emotional intelligence (X = 172.26 and SD = 19.79) followed by participants exposed to peer
mentoring (X = 161.00 and SD = 17.73) while the control group had the lowest post test score of X =
148.70 and SD = 17.65. As to whether significant difference exists in post test score in emotional
intelligence due to experimental conditions; the result of the analysis is presented in Table 2.
Table 2: Analysis of Covariance on influence of experimental conditions on emotional
intelligence skills
Sources of Variation
Sum
of
Squares
Degrees
of freedom
Mean
of Squares F-ratio
Model 45153.51 3 15051.17 107.08
Covariate 364.65 1 364.65 2.59
Exp. Conditions 17856.14 2 8928.06 63.50*
Within Group 21510.39 152 140.59
Total 66663.90 155
*P <0.05; df = 2 & 152; Critical F = 3.05
From table 2, it could be observed that a calculated F-value of 63.50 resulted as the difference
in emotional intelligence skills due to experimental conditions. Thus, calculated F-value is significant
since it is higher than the critical F-value of 3.05 given 2 and 152 degree of freedom at 0.05 level of
significance. Consequently, the null hypothesis was rejected and the alternative hypothesis which

Scottish Journal of Arts, Social Sciences and Scientific Studies - ISSN 2047-1278
http://scottishjournal.co.uk
21
states that there is a significant difference in post-test scores on emotional intelligence skills among
participants exposed to emotional learning system, peer mentoring and control group.
Further analysis of data was done using Fisher‘s Protected t-test technique wherein pair wise
comparison of the group means was done to determine whether significant difference in emotional
intelligence skills exist across the groups and the trend of the difference. The result of the analysis in
presented in Table 3.
Table 3: Fisher’s Protected t – test on difference in emotional intelligence skills across
groups
Group EmotionalLearning n = 55
PeerMentoring n
= 51
Control
n = 50
EmotionalLearning System 172.26a 4.88
c 10.20
c
Peer Mentoring 11.26b 161.00
a 5.19
c
Control 23.56b 12.30
b 148.70
a
Group means are in the diagonal; bdifference in group means is below the diagonal;
cProtected t-values are above the diagonal. P < 0.05
The result from table 3 shows that participants exposed to emotional learning system
significantly have higher emotional intelligence skills than either those exposed to peer mentoring (t
= 4.88; df = 104; critical t = 1.98; P < 0.05) or those in the control group (t = 10.20; df = 103; critical t = 1.98; P < 0.05) respectively. Similarly, participants who received peer mentoring treatment significantly have higher emotional intelligence skills than those who
are in control group (t = 5.19; df = 99; Critical t = 2.00; P < 0.05).
Hypothesis two: In the null form states that there is no significant gender difference in post-test scores on emotional intelligence skills due to experimental conditions of participants. The hypothesis was tested using analysis of covariance statistics and the results
of the analysis are as presented in Tables 4 and 5.
Table 4: Descriptive data on gender difference in the effect of experimental
conditions on emotional intelligence skills.
Pre-test Post – test
Group Gender N X SD X SD MD
Emotional Learning
System Female 27 148.95 17.99 173.8 12.6 24.85
Male 28 147.69 19.49 170.2 25.33 22.51
Total 55 148.32 18.74 172.3 19.79 23.98
Peer Mentoring Female 33 151.62 15.68 159.1 20.3 7.48
Male 18 150.3 17.40 164.4 11.38 14.08
Total 51 150.96 16.54 161 17.73 10.04
Control Female 30 147.88 16.38 152.3 17.21 4.42
Male 20 149.48 18.32 143.3 17.32 6.18
Total 50 148.68 17.35. 148.7 17.65 0.02

Scottish Journal of Arts, Social Sciences and Scientific Studies - ISSN 2047-1278
http://scottishjournal.co.uk
22
Table 4 shows that among participants exposed to emotional learning system, females had the
highest mean score of 173.82 and standard deviation of 12.60 while males had mean (X) score of
170.22 and standard deviation of 25.33. For those exposed to peer mentoring the males had higher
mean(X) score of 164.44 and standard deviation of 11.38, while the females had mean (X) score of
159.12 and standard deviation of 20.30. For the control group, females had mean (X) score of 152.30
and standard deviation of 17.21 whereas, the males had the mean (X) score of 143.30 and standard
deviation of 17.30.
To determine whether gender differences exist on emotional intelligence skills of participants, analysis of covariance was done. The result of the analysis is presented in Table
5.
Table 5: Analysis of Covariance to test gender difference in the influence of experimental
condition on emotional intelligence skills of participants.
Sources of Variation
Sum of Squares
Degrees of Freedom
Mean of Squares F – ratio
Model 16172.70 6 2695.45 8.01
Covariate 507.60 1 507.60 1.50
Exp. Conditions 14948.06 2 7474.03 22.20*
Gender 382.68 1 382.68 1.14
Exp. Cond/Gender 1235.88 2 617.94 1.84
Within Group(error) 50491.20 149 336.61
Total 6666.39 155
*P < 0.05; df = 2 & 149; Critical F = 3.05
From table 5, it could be observed that a calculated F-value of 1.14 resulted as the influence of
gender on emotional intelligence skills of participants. Thus calculated F-value is not significant since
it is less than the critical F-value of 3.05 given 2 and 149 degrees of freedom at 0.05 level of
significance. This led to the acceptance of the null hypothesis.
Discussion
The results indicated that participants in emotional learning system group had the highest
post-test scores followed by those in peer mentoring group and lastly, the control group. Further
analysis was made to determine whether significant difference existed in post-test score in emotional
intelligence skills due to experimental conditions. The result of the analysis shows a significant
difference in the post-test scores. Consequently, the null hypothesis was rejected.
Further analysis was done using Fisher’s protected t-test to determine if significant difference in emotional intelligence skills exists across the groups and the trend of the difference. The result shows that participants exposed to emotional learning system significantly had higher emotional intelligence skills than either those exposed to peer mentoring or those in the control group respectively. This suggest that this result is because emotional learning system is a better structured programme when compared with peer mentoring which has been successfully applied severally across socio-spatial and
demographic spectrum.

Scottish Journal of Arts, Social Sciences and Scientific Studies - ISSN 2047-1278
http://scottishjournal.co.uk
23
The findings supports that of other researchers who found that emotional learning system helped participants make positive change in attitudes, conceive and apply behaviours that consequently bring about improvement in emotional intelligence (Nelson, Jin and Wang ,2002 ).
Also, Nelson et al (2007) affirmed the findings in a study on emotional intelligence: a
transformative theory and applied model of positive personal change. The results revealed that
emotional learning system had a significant positive influence on emotional intelligence skills and that
there was no significant gender difference.
The results also showed that there was no significant gender difference in post-test scores on
emotional intelligence skills due to experimental conditions of participants. The plausible reason for
this outcome lies in fact that though, superficially men may differ from women emotionally; their
innate capacity to respond to treatment aimed at enhancing specific emotional intelligence skills may
be the same.
This finding of this study supports that of Ogunyemi (2007) which revealed among other
things, that there is no significant effect of gender on participants that were trained through
brainstorming and emotional mastering training to enhance emotional intelligent skills. This implies
that participants‘ emotional intelligence skills are not gender specific. On the other hand the finding
contradicts that of some other researchers which revealed that strong pattern in emotional intelligence
competencies are closely linked to gender differences ( Sanchez-Nunez, Fernandez-Berrocal,
Montanes and Latorre,2008).
Conclusion and Recommendation
On the basis of the findings of this study it is concluded that emotional learning system and
peer mentoring were efficacious in enhancing the level of emotional intelligence skills among
participants although emotional learning system was more potent. Therefore, it is hereby
recommended that:
1. Managers of education at secondary education level should consider emotional intelligence
skills as a factor in predicting student‘s success and hence the need to assess this dimension
of the student‘s overall assessment.
2. Educators at secondary level have often emphasised intellectual intelligence in preparing
their students for life success. This has often produced suboptimal result. The suggestion here
is for them to develop appropriate intervention programmes that will facilitate effective and
seamless transition of their students to all round success at tertiary level of learning.
3. It is crucial that learning environments are student-centred and capable of nourishing the
development of emotional intelligence skills that is considered the strongest predictor of
student success.

Scottish Journal of Arts, Social Sciences and Scientific Studies - ISSN 2047-1278
http://scottishjournal.co.uk
24
References
Abisamra, N. (2000). The relationship between emotional intelligence and academic
achievement in eleventh graders. Research in Education. FED 661 .
Adediran, S.A. (1991). A survey of patterns of student problems in Ondo state
secondary schools. Nigerian Journal of Educational Foundation.2,1, 47-66.
Astin, A. W. (1999). Student Involvement: A developmental theory for higher
education. Journal of College Student Development, 40, 518-529.
Bar-On, R. (1996). The Emotional Quotient Inventory (EQ-i): A test of emotional
intelligence. Toronto: Multi-Health Systems.
Bar-On, R. & Parker, J.(2000).Bar-On Emotional Quotient Inventory: Youth Version.
Technical Manual. North Tonawanda, New York: Multi-HealthSystems, Inc.
Cherniss, C. (2004). School change and the microsociety program. Sage publication.
http//www.sagepub.com/. (Retrieved 28/01/2010).
Chickering, A.W., & Reisser, L. (1993). Education and identity (2nd
edition) San
Francisco: Jossey- Bass.
Federal Republic of Nigeria (2004). National Policy on Education. (Revised Edition).
Lagos: Federal Ministry of Education.
Finegan, J.E. (1998). Measuring emotional intelligence: where we are today.
(Clearinghouse no. TM029315)_ Montgomery, AL: Auburn University at Montgomery, school
of education. (ERIC Document Reproduction Service No.ED426087).
Goleman, D. (1995). Emotional intelligence: Why it can matter more than IQ. New
York: Bantam Books.
Goleman, D. (1998). Working with emotional intelligence : New York: Bantam

Scottish Journal of Arts, Social Sciences and Scientific Studies - ISSN 2047-1278
http://scottishjournal.co.uk
25
Books.
Kram, K.E. (1985). Improving the mentoring process. Training and development
journal, 39, 40-43.
Kram, K.E., & Isabella, L.A. (1985). Mentoring alternatives: the role of peer
relationships in career development. Academy of Management Journal, 28,110-132.
Nelson, D., Jin, Y. & Wang, X. H. (2002). Reliability and validity parameters for the
chinese version of the emotional intelligence skills assessment process.
http://www.tamuk.edu/kweiooo/research/articles (retrieved 15/2/2010).
Nelson,D. & Low,G. (1998). Exploring and developing emotional Intelligence skills. Corpus
Christi, TX: EI Learning System. http://www.tamuk.edu/edu/ kwei000/research/articles
(retrieved 5/12/2009).
Nelson, D. & Low, G. (2005). Emotional intelligence: The role of transformative
learning in academic excellence .Texas Study of Secondary Education. XIV, 2, 41-44.
Nelson, D., Low, G. & Ellis R. (2007). Emotional Intelligence: A transformative theory
and applied model of positive personal change. Annals of American Psychoterapy Association.
10,4, 30-35.
Newcomb, T. M. (1962). Student peer-group influence. In N. Sanford (Ed.), The
American college: a psychological and social interpretation of the higher learning
(pp. 469-488). New York: John Wiley & Sons, Inc.
Ogunyemi, A.O. (2007). Nurturing leaders‘ emotional intelligence through
brainstorming and emotional mastery training programmes: Implications for human resources
management. Paper presented at the conference of Counselling association of Nigeria held at
Covenant University, Ota. 14th
to 17th
, August, 2007.
Petrides, K.V. & Furnham, A. (2000). Gender difference in measured and self-
estimated traits of emotional intelligence. Sex role: A Journal of Research. Error! Hyperlink reference not
valid.. (Retrieved on 12/01/2010).
Salovey , P. & Mayer, J. D. (1990). Emotional intelligence: Imagination, cognition

Scottish Journal of Arts, Social Sciences and Scientific Studies - ISSN 2047-1278
http://scottishjournal.co.uk
26
and personality. New York, Harper.
Sanchez-Nunez, M., Fernandez-Berrocal, P., Montanes J., & Latorie, M.J. (2008).
Does emotional intelligence depend on gender? The socialisation of social competence in men
and women and its implications. Electronic Journal of Research in Educational Psychology.
15,2, 455-474.
Stottlemyer, B.G. (2002). Assessment of emotional intelligence and the implications
for education. Unpublished doctoral dissertation. Texas A & M University –
Kingsville, Kingsville, TX. http://www.proquest.umi.com/pqdlink. (Retrieved
12/10/2009).
Zachary, L. (2006). Learning by design: Facilitating mentorship through mentoring.
Concepts & Connections, 14(3).

Scottish Journal of Arts, Social Sciences and Scientific Studies - ISSN 2047-1278
http://scottishjournal.co.uk
27
Essential Oil of Ocimum gratissimum; A
Potent Antimicrobial and Inhibitor of
Partially Purified and Characterized
Extracellular Protease of Shigella flexneri
Adeola S. Adesegun,
Folorunso O. Samuel
Mohammed A. Gafar
Department of Biochemistry, Faculty of Science,
Lagos State University, Ojo Lagos State, Nigeria.
Tel: +234-802-308-1364; P. O Box 0001 LASU Post Office, Ojo Lagos State;
E-mail: [email protected]/[email protected]
Abstract
Antimicrobial and inhibitory effects of the volatile oil of three different parts of Ocimum
gratissimum plant against enteric pathogenic bacterial and partially purified extracellular protease of
Shigella flexneri had been established. There was an effective bacterial growth inhibition against all
the enteric bacteria used in this work with average inhibitions of 46.94±13.0 mm and 113.97±9.7 mm
for antibiotic drug and volatile oils respectively. Bacterial growth inhibition was significantly higher
(p<0.05) in volatile oils than the antimicrobial drugs. Escherichia coli and Salmonella typhimurium
were the most sensitive pathogenic organisms whose growths were mostly inhibited by the volatile
oils with the lowest MIC and MBC.
The optimal activity of the extracellular protease of Shigella flexneri was 6.25 x 10⁻²
μmol/min
and 8.20 x 10⁻²
μmol/min at pH 8.0 and 44 o
C respectively. The volatile oil from the root (VOROG),
leaf (VOLOG) and stem (VOSOG) showed competitive, noncompetitive and noncompetitive
inhibition respectively. The Km and Vmax were: the root (Vmax of 8.33 x 10⁻²
μmol/min, Km = 0.36
mg/ml (absence of inhibitor) and K'm = 0.48 mg/ml (presence of inhibitor), leaf (Vmax of 8.33 x 10-
2μmol/min (absence of inhibitor), V'max = 8.0 x 10
-2 μmol/min (presence of inhibitor) and Km = 0.36
mg/ml, stem (Vmax of 8.33 x 10⁻²
μmol/min (absence of inhibitor), V'max = 7.46 x 10⁻²
μmol/min
(presence of inhibitor) and Km = 0.36 mg/ml. The highest purification was achieved by the use of
Sephadex G-100 size exclusion chromatography with purification fold of 23.2 and percentage yield of
92.9%. The protease activity of the purified enzyme was 67.4 μmol/min/mg protein.
Antimicrobial and inhibition of partially purified extracellular protease of Shigella flexneri was
established by the use of the volatile oils from three different parts (root, leaf, and stem) of Ocimum
gratissimum.
Keywords: volatile oil, antimicrobial, inhibition, extracellular protease,

Scottish Journal of Arts, Social Sciences and Scientific Studies - ISSN 2047-1278
http://scottishjournal.co.uk
28
Introduction
Ocimum is a genus of about 35 species of aromatic annual, perennial herbs, and shrubs in the
family Lamiaceae, mostly native to the tropical and warm temperate regions of the whole world.
Ocimum gratissimum (Labiatae), one of the species of this plant, is commonly used in folk medicine
to treat different diseases such as upper respiratory tract infections, diarrhea, headache, ophthalmic,
skin diseases, pneumonia, cough, fever, and conjunctivitis (Onajobi, 1986). Moreover, many works
have been reported to show the antimicrobial properties of this plant against some selected enteric
pathogens including fungi (Nwosu & Okafor, 2005; Nakaruma et al., 2009), but no cited literature on
its purpose as an inhibitor to the extracellular protease of Shigella flexneri.
Shigella is a genus of Gram-negative entero-invasive bacterium, non-spore forming rod-shaped
bacteria closely related to Escherichia coli and Salmonella typhimurium. It causes shigellosis in man
and dysentery in primates (Mims et al., 2005), but not in other mammals (Ryan & Ray, 2005). It is
only found naturally in humans and apes (Potter, 2006). Shigella infection is typically via ingestion
(fecal-oral contamination); depending on age and condition of the host, as few as ten bacterial cells
can be enough to cause an infection. Shigella causes dysentery that result in the destruction of the
epithelial cells of the intestinal mucosa in the caecum and rectum. Some strains produce enterotoxin
and Shiga toxin, similar to the verotoxin of Escherichia coli (Hale et al., 2006). Both Shiga toxin and
verotoxin are associated with causing hemolytic uremic syndrome. Shigella flexneri, which is one of
the strains of Shigella, is the most common cause of the endemic form of shigellosis and eventual
death. Some of these toxins have been proposed to be proteolytic in nature, which aided pathogenic
specificity, adhesion, and invasion (Lantz & Ciborowski, 1994). Epidemiologically, Shigella flexneri
is a major public health concern in developing countries (Nato et al., 2007).
Proteases are proteolytic enzymes, which play a crucial role in a numerous pathological
processes including microbial infections, arthritis, tumour invasion and metastasis, and a number of
degenerative diseases (Brown, 1994). Microbial proteases have been proposed as virulence factors in a
variety of diseases caused by pathogenic microorganisms. Some of them can also act as secretive
membrane proteins for cell recognition, communication, and cell invasion (Robert et al., 2006).
Identification and characterization of microbial proteases are pre-requisites for understanding their
role in the pathogenesis of infectious diseases as well as to improve their application in biotechnology
(Lantz & Ciborowski, 1994).
There were several works on the antimicrobial properties of volatile oil of different medicinal
plants. This work, apart from antimicrobial activity of this volatile oils against several pathogenic
enterobacteriaceae, characterized and studied the inhibitory kinetics of extracellular protease of
Shigella flexneri using the volatile oils of Ocimum gratissimum as potent inhibitors.
Materials and Methods
Plants Materials: Ocimum gratissimum plants were obtained at Ojo Local Government Area
of Lagos State, Nigeria as green foliage and were air-dried for 5 days. The leaf sample was identified
and authenticated at the Department of Botany, Faculty of Science, Lagos State University, Ojo Lagos
State, Nigeria.
Microorganisms: The microorganisms used in this work were obtained from the Nigeria
Institute of Medical Research (NIMR), Yaba, Lagos Nigeria and maintained on nutrient agar petri-
dishes at 4oC. These microbes were Staphylococcus aureus (a gram positive bacteria), while others
were gram negative bacteria: Enteroheamorrhagic Escherichia coli (EHEC), Escherichia coli,
Klebsiella pneumoniae, Pseudomonas aeruginosa, Salmonella paratyphimurium, Salmonella
typhimurium, Shigella flexneri, and Shigella dysenteriae.

Scottish Journal of Arts, Social Sciences and Scientific Studies - ISSN 2047-1278
http://scottishjournal.co.uk
29
Susceptible Antibiotic Drugs: A susceptible antimicrobial sensitivity discs was purchased
from a Pharmaceutical store in Ojo Local Government of Lagos Nigeria. The antibiotic discs were
coated with the following antibiotic drugs: Ofloxacin (Travid) - 5 µg, Erythromycin - 10µg,
Clindamycin - 5 µg, Ciprofloxacin - 5 µg, Gentamicin - 10 µg, Cephalexin - 30 µg, Cotrimoxazole -
50 µg, Ampicillin - 30 µg, Ceftriaxone - 30 µg, Augumentin - 30 µg. Ceftriaxone, a third generation
cephalosporin β-lactam base drug, was assigned as control antibiotic drug because of its wide spectral
against both grams positive and negative infectious enteric bacteria.
Extraction of Volatile Oil by Hydrodistillation Method: The volatile/essential oil of
Ocimum gratissimum was extracted by the method described by Lawrence & Reynolds, (1993).
Briefly, the five-day-air-dried Ocimum gratissimum plant was separated into leaves, stems, and roots
and each part was cut into pieces and packed into the 5 L 34/35 Quick fit round bottom flask
containing 1.5 L distilled water with fixed Clevenger. The oil was extracted at a steady temperature of
80 oC for 3 hrs and the oil was collected over 2 ml n-hexane. The oil was kept tightly in a sample
bottle and stored at 4 oC.
Antimicrobial Susceptibility Paper Disc Test for the Antibiotics and Volatile Oils: The
sensitivity test of the antibiotics and the volatile oils was carried out using a diffusion technique
method on solid agar. The nutrient agar petri dish was inoculated with each of the organism together
with the antibiotic sensitivity disc and each of the sterilized paper disc soaked with volatile oil. The
inoculates were incubated for 18-24 hrs at 37 oC. The diameter of a clear zone (inhibition) around the
paper discs was considered sensitive.
Minimum Inhibitory Concentration (MIC) and Minimum Bactericidal Concentration
(MBC): The MIC and MBC of the volatile oil of Ocimum gratissimum were carried out using
microbroth dilution method as described by Janssen et al., (1989). A colony of each organism was
added to 200 µl of susceptible test Muller Hinton broth containing two-fold serial dilution of the
volatile oil using Tween 80 (0.5%v/v) as diluent in a microtitre plate (21.5 x 17 cm2). The plates were
covered with aluminium foil and incubated at 37 oC for 18-24 hrs. Each of the microwell on the plate
was inoculated on a freshly prepared Muller Hinton agar where MIC and MBC were determined.
The MIC was the lowest concentration of the oil sample that prevented visible growth of the
microorganism in the required medium. This is also called minimum lethal concentration (MLC). The
MBC was considered as the lowest concentration of the oil that yielded no colonal growth of the
subcultured microorganisms in the required medium under favourable conditions.
Extraction of Crude Enzyme: The extracellular protease of Shigella flexneri was extracted by
the method described by Makino et al., (1981). A colony of the microbe was inoculated into the
Salmonella-Shigella broth and incubated for 24 hrs at 37 oC. The broth was centrifuged (using
Kendros PicoBiofuge, Heraeus) at 9000 rpm for 10min at room temperature. The cell-free supernatant
was stored in a sample bottle at 4 oC until it was used.
Determination of Total Protein and Protease Activity of the Crude Enzyme Extract: The
total protein of the crude enzyme extract was determined using a method described by Lowry et al.,
(1951) while the protease activity was assayed for by the method of Folin & Ciocalteu, (1927), using
casein as the substrate. Total protein was determined by adding 5.0 ml of alkaline solution containing
a mixture of 50 ml of solution A (20 g sodium trioxocarbonate IV and 4g sodium hydroxide in 1 L)
and 1 ml of solution B (5 g cupper II tetraoxosulphate VI pentahydrate and 10 g sodium-potassium
tartrate in 1 L) to 0.1 ml of crude enzyme extract and mixed. The reaction solution was allowed to
stand for 10 min at room temperature and 0.5 ml of freshly prepared Folin Ciocalteau‘s phenolic
reagent (50%v/v) was added. The solution was mixed thoroughly and the absorbance was read at 750
nm (using spectronic-21, Bausch and Lomb) after 30 min. BSA was used as standard protein (0.20
mg/ml)
Scottish Journal of Arts, Social Sciences and Scientific Studies - ISSN 2047-1278
http://scottishjournal.co.uk
30
Protease activity was carried out by adding 5.0 ml of casein solution (0.6%w/v in 0.05 M Tris
buffer at pH 8.0) to 0.1 ml of the crude enzyme extract and the mixture was incubated for 10min at 37 oC. The reaction mixture was stopped by adding 5.0 ml of a solution containing 0.11 M trichloroacetic
acid, 0.22 M NaCl and 0.33 M acetic acid mixed in ratio 1:2:3. The turbid solution was filtered and
5.0 ml of alkaline solution was added to 1.0 ml of the filtrate followed by 0.5 ml of freshly prepared
Folin Ciocalteau‘s phenolic reagent after 10 min of thorough mixing. The absorbance was read at 750
nm (using spectronic-21, Bausch and Lomb) after 30 min. L-tyrosine solution (0.20 mg/ml) was used
as standard for the protease activity. 1.0 Unit of protease activity was defined as the amount of enzyme
required to liberate 1.0 µmol of tyrosine in 10 min at 37 oC. The specific activity was expressed in
µmol/min/mg protein.
Determination of Optimum pH: The method adopted was described by Makino et al., (1981)
with little modification. Protease activity was assayed using 0.6% casein solution in 0.05 M Tris
buffer solution (pH 6.0 - 9.0) at 37 oC.
Determination of Optimum Temperature: As described by Makino et al., (1981), protease
activity was assayed under varying temperature conditions (30-70 o
C) using 0.6% casein solution in
0.05 M Tris buffer at pH 8.0.
Inhibitory Assay: The method used was described by Makino et al., (1981) with a slight
modification. Briefly, 0.1 ml of the crude protease extract and 0.1 ml of 3.5%v/v of the volatile oil (as
inhibitor) in 0.5% v/v Tween 80 solutions were added concomitantly to different concentration of
casein solution (0.2 - 1.0%w/v) in 0.05 M Tris buffer, pH 8.0 and the reaction mixture was mixed and
incubated at 37 oC for 10 min. The reaction was stopped and the protease activity was assayed with the
volatile oils of the three different parts of the plant. The procedure was repeated without an inhibitor.
Dialysis: Salting out technique was carried out on the crude enzyme extract. A 35%
(NH4)2SO4 saturated solution of the crude enzyme extract was dialyzed (using SIGMA Dialysis
Tubing Cellulose Membrane, D9402) for 48 hours and thereafter centrifuged (using Kendros
PicoBiofuge, Heraeus). Then, 50% (NH4)2SO4 saturated solution of the sediment was dialyzed for 48
hours. This was followed by the dialysis of 55% and 65% saturated solutions of the sediment for the
same number of hours. In each case both total protein and enzyme assay were carried out.
Gel Filtration: This was carried out by soaking 3.0g of Sephadex G-100 (BDH) in distilled
water for 72 hrs. The gel was poured into the chromatographic column (28.0 cm by 1.5 cm column)
and formed a bed length of 22 cm with a flow rate of 1.5 ml/min and this was used to separate 65%
(NH4)2SO4 dialysate. A total number of 50 elutions were collected. Each elution contained 3.0 ml of
eluent and in each of the eluent, both total protein and enzyme assay were carried out as earlier
discussed.
Statistical Analysis: Comparison of the antimicrobial activities of the volatile oils and
antibiotic drugs was carried out using t-test analysis and the mean difference was considered
significant at p<0.05.
Results
There was an effective bacterial growth inhibition against all the enteric bacteria used in this
work with average inhibitions of 46.94±13.0 mm and 113.97±9.7 mm for antibiotics and volatile oils
respectively, Table 1. Bacterial growth inhibition was significantly higher (p<0.05) in volatile oils
than the antimicrobial drugs. Several drug resistances were recorded especially in CLD, CX, CO, and
AP. Augumentin did not inhibit any of the pathogenic organisms. CIP has the widest antibacterial
spectrum. None of the enteric bacteria was not sensitive to the volatile oil, Table 1. Figure 1 showed
the average growth inhibition of all the antibiotics and the volatile oils used. CLD, CX, CO, AP, and
AU were statistically lower than the control (FX) (P<0.05) but there was no statistical difference
(p>0.05) between the control and OF, ERY, CIP, GN, leaf, stem, and root oils. Escherichia coli and

Scottish Journal of Arts, Social Sciences and Scientific Studies - ISSN 2047-1278
http://scottishjournal.co.uk
31
Salmonella typhimurium were the most sensitive pathogenic organisms whose growths were mostly
inhibited by the volatile oils with relatively low MIC and MBC values, Table 2.
Figures 2 and 3 showed the effects of pH and temperature on the activity of the extracellular
protease of Shigella flexneri. The enzyme showed highest activity of 6.25 x 10⁻²
μmol/min and 8.20 x
10-2
μmol/min at pH 8.0 and 44 oC respectively. The inhibitory kinetic was shown in Figure 4 (a, b,
and c) representing the effect of volatile oil from the root (VOROG), leaf (VOLOG) and stem
(VOSOG) respectively. These accordingly showed competitive (Vmax = 8.33 x 10⁻²
μmol/min, Km =
0.36 mg/ml (absence of inhibitor) and K'm = 0.48 mg/ml (presence of inhibitor)), noncompetitive (Vmax
= 8.33 x 10⁻²
μmol/min (absence of inhibitor), V'max = 8.0 x 10⁻²
μmol/min (presence of inhibitor) Km =
0.36 mg/ml) and noncompetitive (Vmax = 8.33 x 10⁻²
μmol/min (absence of inhibitor), V'max = 7.46 x
10-2
μmol/min (presence of inhibitor) Km = 0.36 mg/ml) respectively. Sephadex G-100 elution profile
of the purification of the extracellular protease of Shigella flexneri was shown in Figure 5. Each peak
represented the total protein and enzyme assay. Table 3 showed the purification profile of the crude
extract of extracellular protease of Shigella flexneri. The highest purification fold of 23.2 with
percentage yield of 92.9% compared to the crude extract was obtained with the use of Sephadex G-
100.
Discussion
The volatile oil of Ocimum gratissimum showed an effective growth inhibition against all the
enteric-pathogenic bacteria used in this work, Table 1. The average total inhibition of the bacterial was
significantly higher (p<0.05) in the volatile oils as compared to the antibiotic drugs. There was no
organism that was not inhibited by any of the volatile oils used. There was a resistance to Cephalexin,
Cotrimoxazole, and Ampicillin because they only inhibited Salmonella paratyphimurium. No response
was recorded for Augumentin. The highest bacterial inhibition, 99.0 mm, was recorded for
Ceftriaxone, a cephalosporin drug family. Stem, root and leaf oils showed a more active zone of
inhibition as compared to the antibiotic drugs with leaf and stem oils being more effective, Table 1.
The lowest zone of inhibition recorded for the antibiotics was 1.4 mm, which was Clindamycin
against Salmonella typhimurium while 2.0 mm was recorded as the lowest inhibition zone for the root
oil against Salmonella enteritis. An effective inhibition of these microbes by the volatile oils of
Ocimum gratissimum suggest that these oils may be a good substitute for synthetic antibiotic drugs.
Adams, (2005) reported that daily consumption of basil leaves could kill gram-positive Salmonella
and Shigella species and other harmful GIT bacteria. Also, it has been reported that the volatile oil of
Ocimum gratissimum contained eugenol, bisabolene, terpinene, cymene, caryophyllene, thymol and
others, and these constituents have been found to be potent antibiotics against series of both gram-
positive and gram-negative bacteria, fungi and protozoans (Adams, 2005; Van, 2005). These
compounds have been found to possess antibacterial and antiviral action as well as anticarcinogenic
and antimutagenic properties.
The MIC and MBC results was shown in Table 2. The highest sensitivity was found in
Escherichia coli and Salmonella typhimurium because they have lowest possible MIC and MBC
values in all the three sources of oil. All the MBC results lied within two-fold MIC values. There were
species similarities in the inhibition of growth by the volatile oil of Ocimum gratissimum probably
because they shared almost the same biochemical components at their cellular plasma membranes or
the same mode of pathogenesis and host invasion.
The extracellular protease of Shigella flexneri was found to have an optimum activity of 6.25 x
10-2
μmol/min at pH 8.0, Figure 2. This showed that the enzyme could withstand a slight alkaline
environment and hence classified as alkaline protease. Most extracellular proteases of bacteria have
been found to have their optimal activity in the range of pH 6-8 (Makino et al., 2005). Extreme pH has
been found to affect the enzymatic activity of enteric bacteria. Micro-acidic and micro-alkaline
environments are one of the mechanisms designed by the hosts to destroy invading bacteria. The

Scottish Journal of Arts, Social Sciences and Scientific Studies - ISSN 2047-1278
http://scottishjournal.co.uk
32
protease has activity of 8.20 x 10⁻²
μmol/min at the optimum temperature 44.0 oC. This protease was
stable between the temperature range of 50-65 o
C suggesting that the extracellular protease of Shigella
flexneri was thermostable. Optimum temperature of 55.0 o
C has been reported for protease from
alkalophilic Bacillus species KSM-K16, Streptomyces species, strain C5-A13, some Bacillus species
and Listeria monocytogenes (Kobayashi et al., 2005; Vinci et al., 2005).
The kinetics of the extracellular protease Shigella flexneri was shown in Figure 4 (a, b, and c)
with the volatile oils of the root, leaf, and stem of Ocimum gratissimum as potent inhibitor. The oil
from the root showed a competitive inhibition, while both leaf and stem oils showed a non-
competitive inhibition. The Vmax in the absence of inhibitor was 8.33 x 10⁻²
μmol/min but this value
was reduced to 8.0 x 10⁻²
μmol/min and 7.46 x 10⁻²
μmol/min in the presence of leaf and stem oils. The
Km value in the absence of inhibitor was 0.36 mg/ml, which was increased to 0.48 mg/ml in the
presence of root oil. These results showed that the addition of the oil from any of the plant parts of
Ocimum gratissimum was potentially capable of reducing the catalytic activity of the extracellular
protease of Shigella flexneri and hence altering the vital mechanisms necessary for host adhesion and
integration by the use of virulence factors. In any form of inhibition exhibited by the volatile oil of
Ocimum gratissimum, the catalytic activity of the extracellular protease of Shigella flexneri was
negatively modulated because the root oil reduced the Km thereby reducing the catalytic torn-over rate
of the proteolytic enzyme. Similarly, leaf and stem oils reduced the Vmax and this directly lowered the
reaction rate of the enzyme. Various components of the oil may have structural resemblance with the
substrate or modulator of this proteolytic enzyme and this was accounted for by different inhibition
models showed by the volatile oils. Structural competition for the active site existed when root oil was
used while leaf and stem oils may have bound to the enzyme-substrate complex or occupying some
modulatory sites in order to alter the formation of product(s) from enzyme-substrate intermediates.
Sephadex G-100 chromatogram, Figure 5, a peak each for total protein and total enzyme
activity. This showed a monomeric protein unit and this may further be resolved by using other forms
of Sephadex. The purification profile of the extracellular protease of Shigella flexneri was shown in
Table 3. The purification folds increased from 8.6 to 16.3 when salt solution increased from 35% to
65% respectively. The highest purification fold of 23.2 with percentage yield of 92.9 as compared
with corresponding purification fold of 23.2.
Conclusion
Volatile oil from any parts of the Ocimum gratissimum (Basil plants) was capable of inhibiting
the growth of pathogenic enteric bacteria and negatively altered the catalytic activity of the
extracellular protease of Shigella flexneri. It is therefore necessary to explore the unending advantages
embedded in these natural plant resources for its potential ability to militate against the thriving of
enteric and colonizing infectious pathogens.

Scottish Journal of Arts, Social Sciences and Scientific Studies - ISSN 2047-1278
http://scottishjournal.co.uk
33
Table 1: Antimicrobial sensitivity tests of the volatile oils of Ocimum gratissimum and
antibiotic drugs
Microorganisms
Inhibition Zone (mm)
Antibiotics Ocimum gratissimum Oil
*
FX
E
RY
C
LD
C
IP
G
N
C
X
C
O
A
P
O
F
A
U
L
eaf
S
tem
R
oot
Escherichia coli - - -
1
1.0 - - - -
1
1.0 -
1
0.8
1
0.1
9
.5
Enteroheamorrhagic
E. coli - - -
1
7.0 - - - -
1
4.0 -
8
.4
7
.5
9
.1
Staphylococcus
aureus - - -
1
7.0
1
7.0 - - -
1
6.0 -
1
5.0
1
6.5
2
.5
Pseudomonas
aeruginosa
1
6.0 - -
1
6.0
1
4.0 - - -
1
5.0 -
1
1.2
2
1.0
2
1.0
Salmonella
typhimurium -
1
2.5
1
.4 -
1
2.0 - - - - -
1
5.2
1
8.9
2
2.0
Salmonella
paratyphimurium
2
4.0
1
4.0 -
1
8.0
1
6.0
1
6.0
1
6.0
1
8.0
1
4.0 -
1
6.9
1
1.0
1
5.0
Shigella enteritidis
1
9.0 -
1
6.0 -
1
8.0 - - - - -
1
4.0
9
.8
2
.0
Shigella flexneri
2
3.0
1
6.0 -
1
7.0
1
7.5 - - - - -
1
4.3
1
6.0
7
.2
Shigella dysenteriae
1
7.0 - - - - - - - - -
1
3.1
1
7.0
6
.9
Total Inhibition
9
9.0
4
2.5
1
7.4
9
6.0
9
4.5
1
6.0
1
6.0
1
8.0
7
0.0
0
.0
1
18.9
1
27.8
9
5.2
*FX - Ceftriaxone (Control Drug), ERY - Erythromycin, CLD - Clindamycin, CIP -
Ciprofloxacin, GN - Gentamicin, CX - Cephalexin, CO - Cotrimoxazole, AP - Ampicillin, OF -
Ofloxacin, AU - Augumentin.

Scottish Journal of Arts, Social Sciences and Scientific Studies - ISSN 2047-1278
http://scottishjournal.co.uk
34
Fig. 1: Average growth inhibition of volatile oils of Ocimum gratissimum and antibiotics
against enteric bacteria.
Statistical difference was considered significant at P<0.05 when compared to the control*
FX (Contr
ol)O
FER
YCLD
CIP G
N CX
CO A
PAU
Leaf
Stem
Root
0
2
4
6
8
10
12
14
16
*(p<0.05)
Antibiotics
Gro
wth
Inh
ibit
ion
(m
m)

Scottish Journal of Arts, Social Sciences and Scientific Studies - ISSN 2047-1278
http://scottishjournal.co.uk
35
Table 2: The MIC and MBC of the volatile oils of Ocimum gratissimum against nine
pathogenic bacteria.
Bacteria
MIC (%v/v) MBC (%v/v)
L
eaves
S
tems
R
oots
L
eaves
S
tems
R
oots
Escherichia coli* 3
.13
1
2.50
6
.25
≥
6.25
≥
25.00
≥
12.50
Enteroheamorrhagic
Escherichia coli
3
.13
1
2.50
1
2.50
≥
6.25
≥
25.00
≥
25.00
Staphylococcus aureus† 2
5.00
2
5.00
2
5.00
>
50.00
>
50.00
>
50.00
Pseudomonas aeruginosa 2
5.00
2
5.00
2
5.00
>
50.00
>
50.00
>
50.00
Salmonella typhimurium* 3
.13
6
.25
1
2.50
≥
6.25
≥
12.50
≥
25.00
Salmonella paratyphimurium 6
.25
6
.25
1
2.50
≥
12.50
≥
12.50
≥
25.00
Shigella enteritis 6
.25
6
.25
6
.25
≥
12.50
≥
12.50
≥
12.50
Shigella flexneri 1
2.50
1
2.50
6
.25
≥
25.00
≥
25.00
≥
12.50
Shigella dysenteriae 6
.25
6
.25
6
.25
≥
12.50
≥
12.50
≥
12.50
*Most sensitive microorganisms
†Gram positive bacteria

Scottish Journal of Arts, Social Sciences and Scientific Studies - ISSN 2047-1278
http://scottishjournal.co.uk
36
Figure 2: The effect of pH on the activity of extracellular protease of Shigella flexneri
Fig. 3: The effect of temperature on the activity of extracellular protease of Shigella
flexneri

Scottish Journal of Arts, Social Sciences and Scientific Studies - ISSN 2047-1278
http://scottishjournal.co.uk
37
(a) (b)
(c)
Figure 4: Lineweaver Burke kinetic plot of volatile oil of different plant parts of Ocimum
gratissimum (VOROG - volatile oil of the root of Ocimum gratissimum; VOLOG - volatile oil of
the leaf of Ocimum gratissimum; VOSOG - volatile oil of the stem of Ocimum gratissimum)
against the activity of extracellular protease of Shigella flexneri (a) competitive inhibition (b)
and (c) noncompetitive

Scottish Journal of Arts, Social Sciences and Scientific Studies - ISSN 2047-1278
http://scottishjournal.co.uk
38
Figure 5: Elution profile of Sephadex G-100 purification of the extracellular protease of
Shigella flexneri

Scottish Journal of Arts, Social Sciences and Scientific Studies - ISSN 2047-1278
http://scottishjournal.co.uk
39
Table 3: Purification profile of the crude extract of extracellular protease of Shigella
flexneri
Purificatio
n Steps
Total
Protein (mg)
Total
Activity
(µmol/min)
Specific
Activity (µmol/min/mg
protein)
Perc
entage
Yield
Puri
fication
Fold
Crude
Cellular Extract 0.686 1.957 2.9 100 1.0
35%
(NH2)SO4
precipitation
0.077 1.908 24.8 97.5 8.6
50%
(NH2)SO4
precipitation
0.059 1.724 29.2 88.1 10.1
55%
(NH2)SO4
precipitation
0.037 1.589 42.9 81.2 14.8
65%
(NH2)SO4
precipitation
0.025 1.180 47.2 60.3 16.3
Sephadex
G-100 0.027 1.819 67.4 92.9 23.2

Scottish Journal of Arts, Social Sciences and Scientific Studies - ISSN 2047-1278
http://scottishjournal.co.uk
40
References
Adams, R. P. (2005). Identification of Essential Oil Component by Chromatography/Mass
Spectroscopy Allured Publishing Co., Carol Stream, Ilinois.
Brown, P. D. (1994). Clinical trial of low molecular weight matrix metalloproteinase inhibitors
in cancer. Inhibitors of matrix metalloproteinases. Therapeutic potential. A New York
Academic Science, 732, 217-221.
Hale, T. L. (2006). Genetic basis of virulence in Shigella species. Microbiology Review, 55,
206-224.
Janssen, A. M., Scheffer, J. J., Ntezurubanza, L., Baerheim, S. A. (1989). Antimicrobial
activities of Ocimum species grown in Rwanda. Journal of Ethnopharmacology, 26, 57-63.
Kobayashi, T., Hakamada, Y., Adachi, S., Hitomi, J., Yoshimatsu, T., Koike, K., Kawai, S. I.
S. (2005). Kinetics studies of alkalophilic bacterial, Bacillus species KSM-K16 and
Streptomyces species, strain C5-A13. Applied Microbiology and Biotechnology, 43, 472-481.
Lantz, T. Y., & Ciborowski, D. B. (1994). Microbial proteases. Annual Review of
Biochemistry, 49, 593-626.
Lawrence, B. M., & Reynolds, R. J. (1993). Progress in Essential Oils I. Perfumery Flavor, 9,
61-62.
Lowry, O. H., Rosebrough, N. J., Farr, A. L., Randall, R. J. (1951). Protein measurement with
Folin phenol reagent. Journal of Biological Chemistry, 193, 265-275.
Makino, K., Tomihiko, K., Tsutomu, N., Tomio, I., Masaomi, K. (1981). Characteristics
studies of the extracellular protease of Listeria monocytogenes. Journal Biological Chemistry,
133, 1-5.
Makino, S., Sasakawa, C., Kamata, T., Yoshikawa, M. (2005). A genetic determinant required
for continuous re-infection of adjacent cells on a large plasmid in Shigella flexneri 2a. Cell, 46,
551-555.
Mims, P., & Roitt, W. W. (2005). Medical Microbiology (1st Edition). Mosby. Page A.24.
Nakaruma, C. V., Nakaruma, T. U., Bando, E., Melo, A. F. N., Cortez, D. A. G., Diaz-Filho,
B. P. (2009). Antibacterial activity of Ocimum gratissimum L essential oil. Memorias Do
Instituto Oswaldo Cruz, 94, 675-578.
Nato, F., Phalipon, A., Nguyen, L. P., Diep, T, T., Sansonetti, P., Germani, Y. (2007).
"Dipstick for Rapid Diagnosis of Shigella flexneri 2a in Stool." Plos One Journals, 2, (4). 361-
368.
Nwosu, M. O., & Okafor, J. J. (2005). Preliminary studies of the antifungal activities of some
medicinal plants against Basidiobulus and some pathogenic fungi. Mycoses, 38, 191-195.
Onajobi, F. D. (1986). Smooth muscle contracting lipidic soluble principle in chromatographic
functions of Ocimum gratissimum. Journal of Ethnopharmacology, 18, 3-11.
Potter, J. F. (2006). "Water recreation and disease: Plausibility of associated infections: Acute
effects, sequela and mortality, by Kathy Pond, 2005. London and Seattle: IWM publishing in
association with WHO, Page 239.
Robert, M., Philippe, J., Sansonetti, P. J., Claude, P. (2006). Nonpolar mutagenesis of the ipa
genes defines ipaB, ipacC, IpaD as Effectors of Shigella flexneri Entry into Epithelial cells.
Journal of Bacteriology, 175, (18). 5899-5906.

Scottish Journal of Arts, Social Sciences and Scientific Studies - ISSN 2047-1278
http://scottishjournal.co.uk
41
Ryan, K. J., & Ray, C. G. (2005). Sherris Medical Microbiology (4th Edition). McGraw Hill.
ISBN 0-8385-8529-9.
Van, D. D. H., & Kratz, P. D. J. A. (2005). Generalization of the retention index system
including linear temperature programmed gas-liquid partition chromatography. Journal of
Chromatography, 11, 463-471.
Vinci, V. A., Aphale, J. S., Gibb, G. D., Strohl, W. R. (2005). Purification of the extracellular
protease secreted by Listeria monocytogenes. Applied Microbiology and Biotechnology, 39,
69-73.

Scottish Journal of Arts, Social Sciences and Scientific Studies - ISSN 2047-1278
http://scottishjournal.co.uk
42
Implications of Population Growth and
Oil Production on CO2 Emissions:
Empirical Evidence from Nigeria
Isola, W. A
Department of Economics, University of Lagos, Akoka, Lagos State,
E-mail: [email protected], [email protected] Mobile: +2348033973850.
Ejumedia, P. E
Department of Economics, University of Lagos, Akoka, Lagos state,
E-mail: [email protected], mobile: +2348034627787.
Abstract
This study analyzes the impact of rapid population growth, oil production on CO2 emissions in
Nigeria within the framework of the error correction model, using annual time series data from 1970 -
2010. The study reveals that C02 emission in Nigeria and its hypothesized determinant are generally I
(1) series, with two co-integration equations existing among their linear combinations. Our results
show that, the variables in the model, population, oil production and per-capita gross domestic product
are positively related to increase emissions in the country. Overall the variables account for 64% of the
variation in C02 emission and it is highly significant at 5% as shown by the F-statistic (p < 0.05). The
coefficient of the ECM behaved, having its expected negative sign and is significant at 5%. However,
the speed of adjustment is low. In order to mitigate C02 emissions, the following recommendations are
made: diversification of energy sources, proper funding of the sector, and adequate maintenance of
energy infrastructure among others.
Scottish Journal of Arts, Social Sciences and Scientific Studies - ISSN 2047-1278
http://scottishjournal.co.uk
43
Introduction
Over the years, there has been rapid world population growth due largely to net increase in
birth rate precipitated by advancement in technology, improved health facilities and better living
standards. Goujon et al (1995) asserts that increasing population has the possibility of exerting
pressure on demand for energy for transport, power, industry, deforestation, that would ultimately lead
to increase in carbon-dioxide (CO2) or greenhouse gases (GHG) emissions. Carbon-dioxide emissions
hold the sun radiation in the atmosphere and regulate the temperature of the earth/globe. Besides
emission of CO2 makes it impossible to achieve sustainable development – a situation where the needs
of the present are met, without compromising the ability of future generation to meet their own needs.
Thus, rapid population growth is likely to put more people at greater risk from climate change.
Global carbon-dioxide emissions due to human activities have grown since the industrial
revolution in the 18th
century, and have continued to increase at an excessive level into the 21st
century. Precisely, global CO2 emissions increased from 20 to 30 between 1970 and 2009. However,
much of the focus on anthropogenic CO2 emissions has been on the developed world and emerging
economies in Asia. which together account for over 80% of the cumulative CO2 emissions and growth
(Raupach et al., 2007). Available data has shown that in Nigeria Co2 emissions rose from 5,874
thousand metrics tons in 1970 to 95,756 thousand metric tons in 2008. During the same period, the
population of Nigeria grew at about 2.3 percent, while oil production increased by about 672,565.1
barrels on the average (World Bank 2009). The literature is replete with studies that examine the
impact of climate change on sustainable development in Nigeria. (Omojolaibi, 2011. Oniemola, 2011).
However, very few studies have examined the impact of rapid population growths, oil production on
carbon-dioxide (co2) emissions. Thus, this study will contribute and extend the literature in this
respect. Specifically, this study examines whether rapid population growth and oil production have a
long-run impact on C02 emissions in Nigeria. Furthermore, the historical trend of growth in
population, oil production and emission of carbon-dioxide (CO2) in Nigeria are scrutinized in the
study.
The rest of this paper is structured as follows: section 2 is on review of empirical literature,
while section 3 focuses on some stylized facts on population growth, oil production and C02 emission.
Conceptual framework and methodology are the focus of the exposition in section 4. Results and
discussion are presented in section 5 while section 6 is on the policy recommendations and conclusion.
2. Empirical Literature Review
The relationships between population growth and carbon-dioxide emission have been a subject
of discussion in the literature. Erlich and Holdren (1971) suggest a suitable framework to analyse the
determinants of environmental impact known as the equation IPAT: I=PAT where I represents
environmental impact, P is the population size, A is the affluence and T denotes the level of
environmentally damaging technology. The impact of human activity in the environment is viewed as
the product of these three factors. Initially, this formulation was purely conceptual and could not be
directly used to test hypotheses on the impact of each one of the factors on emissions mentioned
above.
The IPAT model can be expressed as an identity where A could be defined as consumption per
capita and T as pollution per unit of consumption. As stated in MacKellar et al. (1995), the IPAT
identity is a suggestive approach that shows how environmental impact is not only due to a single
factor. However, these authors outline the limitations of testing this identity in relation to the choice of
variables and the interactions between them. They compare households (H) with total population
levels, as the demographic unit used to forecast future world CO2 emissions and they show how each

Scottish Journal of Arts, Social Sciences and Scientific Studies - ISSN 2047-1278
http://scottishjournal.co.uk
44
choice lead to different predictions in all the regions of the world, always being higher the impact on
emissions for the I=HAT model, where households replaces population.
Cole and Neumayer (2004) refer to the utility of the tautological version of the IPAT model for
decomposition purposes but also highlight its limitations to estimate population elasticities. For such
estimation they use the model proposed by Dietz and Rosa (1997). Starting from the idea of Ehrlich
and Holdren (1971), Dietz and Rosa (1997) formulated a stochastic version of the IPAT equation, with
quantitative variables containing population size (P), affluence per capita (A) and the weight of the
industry in economic activity as a proxy for the level of environmentally damaging technology (T).
These authors designate their model using the term STIRPAT (Stochastic Impacts by Regression on
Population, Affluence and Technology). Their results corroborate the Malthusian thesis in the sense
that population growth has a more than proportional impact in CO2 emissions. On the other hand, the
study conducted by Cramer (1998), based on a similar model, shows a contamination-population
elasticity less than unity for the five pollutants analysed in several areas of the USA. This discrepancy
could be explained by the exclusion of carbon dioxide from among the pollutants considered by this
author.
Dietz (2003) studied the impact of population on carbon dioxide emissions and energy use
within the framework of the IPAT model. The results from these studies indicate that the elasticity of
CO2 emissions and energy use with respect to population are close to unity. The unity assumption for
the population elasticity was embedded in the original IPAT formulation of Ehrlich and Holdren
(1971) but not in the stochastic version of the IPAT (STIRPAT) formulated by Dietz and Rosa (1997).
Using panel data, Shi (2003) finds a positive relationship between population changes and carbon
dioxide emissions in 93 countries over the period 1975 to 1996. He finds that the impact of population
on emissions varies with the levels of affluence and had been more pronounced in lower-income
countries than in higher-income countries. In the same vein, Cole and Neumayer (2004) considered 86
countries during the period 1975 to 1998 and reveal a positive link between CO2 emissions and a set
of explanatory variables which include population, urbanization rate, energy intensity, and smaller
household sizes. The authors assume that the effect of population and urbanization is equal for all
income levels.
In addition, several studies have discussed and tested the existence of an Environmental
Kuznets Curve (EKC) where the relationship between pollution and income was considered to have an
inverted U-shape. These models frequently take emissions per capita for different pollutants as an
endogenous variable, assuming implicitly that the elasticity, emission population, is unitary. A few of
them considered population density as an additional explanatory variable (see, Cole et al., 1997 and
Panayotou et al., 2000). However, their tests were not based on an underlying theory, and testing
variables individually was subject to the problem of omitted-variables bias. According to Stern,
(1998) and (2004), the results obtained within this framework were far from homogeneous and their
validity had been questioned in the literature. Most of the criticisms are related to the use of non-
appropriate techniques and the presence of omitted-variables bias. As Perman and Stern (2003) admitt,
when diagnostic statistics and specification tests are taken into account and the proper techniques are
used, the results indicate that the EKC does not exist. Borghesi and Vercelli (2003) consider that the
studies based on local emissions present acceptable results, whereas those concerning global
emissions do not offer the expected outcomes. Therefore the EKC hypothesis cannot be generally
accepted.
Also decomposition methods have been applied to an increasing number of pollutants in
developed and developing countries (for an extensive discussion on this, see, Hamilton and Turton,

Scottish Journal of Arts, Social Sciences and Scientific Studies - ISSN 2047-1278
http://scottishjournal.co.uk
45
2002; Bruvoll and Medin, 2003; Lise, 2005). Emissions are typically decomposed into scale,
composition, and technique effects. Scale effects are measured with income and population variables,
composition effects refer to changes in the input or output mix, and technique effects are proxied by
energy intensity (the effect of productivity on emissions) and global technical progress. Hamilton and
Turton (2002) conclude that income per capita and population growth are the two main factors
increasing carbon emissions in OECD countries, whereas the decrease in energy intensity is the main
factor reducing them. Bruvoll and Medin (2003) cover 10 pollutants and determine that in all cases,
technique effects were dominant in offsetting the increase in scale. The authors conclude that, whereas
structural change explains the increase in energy intensity during the period from 1913 through 1970,
technical change was the main factor reducing energy intensity after 1970. Shifts in the fuel mix are
the main factor explaining carbon emissions per unit of energy used. Stern (2002) use an econometric
model to decompose sulphur emissions in 64 countries during the period 1973 to 1990 and reveals that
the contribution of input and output effects on changes in global emissions is very modest, whereas
technological change considerably reduced the increase in emissions.
3. Stylised Facts on Population Growth and C02 Emission.
It is currently acknowledged that global C02 emission has continued to increase. The United
Department of Energy‘s Carbon Dioxide Information Analysis Centre (2010) notes that global C02
emission rose from 29,888,121 in 2008 to 33,508,901 in 2010. The top 10 countries in the world
emitted 67.07% of the world total global C02. As shown in Table 1 below, as at 2010, China has the
highest C02 emission with a value of 8,240,958 thousand metrics tones, followed by United States
with 5,492,170 and India, Japan and Mexico with 2,069,958, 1688,688 and 1,138,432 thousand
metrics tones respectively. Although Africa, particularly Nigeria, is not among the top ten countries
emitting C02 in the world, available statistics has shown that C02 emission in Nigeria has continued to
rise (see fig.1 below).
Table: 1 C02 emission and population growth
Country C02 Emissions Population
China 8, 240,958 1,339,724,852
India 2,069,738 1,210,193,422
United states 5,492,170 312,793,000
Indonesia 476,557 237,424,363
Brazil 419,537 190,732,694
Russia 1,688,688 142,946,800
Japan 1,138,432 128,056,026
Mexico 466,131 112,322,757
German 762,543 81,799,600
Iran 574,667 75,330,000
France 362,556 65,821,885
United Kindom 493,158 62,262,000
Italy 407,924 60,681,514
South Africa 451,839 50,586,757
South Korea 563,126 48,875,000
Saudi Arabia 493,726 27,136,977
Nigeria 224,872 158,259,000 Source: United Department of Energy‘s Carbon Dioxide Information Analysis Centre (2010)

Scottish Journal of Arts, Social Sciences and Scientific Studies - ISSN 2047-1278
http://scottishjournal.co.uk
46
The details of carbon-dioxide emission in Nigeria for the period 1970 to 2010 are shown in
Figure 1 below. C02 in Nigeria ranged from 5,874 thousand metrics tones in 1970 to 21,593 thousand
metrics tones in 2000 and 224.872 thousand metrics tones in 2010. In the same vein, oil production
has simultaneously risen. (See Figure 2 below). A major reason for this might not be unconnected with
the gas flaring in the production of oil. Although the Nigerian government have put up the Gas Master
Plan policy to avoid gas flaring, a large amount of gas is still flared. If this is not controlled, there is
the evidence that C02 emission in Nigeria will continue to rise drastically in the years ahead.
Figure: 1 oil production, population growth and C02 emission in Nigeria.
Source; CBN (2010)
Source; CBN (2010)
0
5000
10000
15000
20000
25000
30000
35000
19
70
19
72
19
74
19
76
19
78
19
80
19
82
19
84
19
86
19
88
19
90
19
92
19
94
19
96
19
98
20
00
20
02
20
04
20
06
20
08
20
10
fig: 1 trend of C02 Emission
C02
0
100000
200000
300000
400000
500000
600000
700000
800000
900000
1000000
fig. 2 trend of oil production
OILPR

Scottish Journal of Arts, Social Sciences and Scientific Studies - ISSN 2047-1278
http://scottishjournal.co.uk
47
3. Conceptual Framework and Methodology
We may intuitively state that mankind‘s activities and oil production influence the level of CO2
emissions in the atmosphere. However, it is more difficult to determine what specific factors represent
mankind‘s activities and to what extent each of them contributes to the increase or decrease in CO2
emissions.
Following the IPAT equation: I= PAT by Erlich and Holdren (1971), and the STIRPAT model
formulated by Dietz and Rosa (1997), we specify a linear version of the STIRPAT model. In order to
test whether the factors considered in the STIRPAT model influence the level of CO2 emissions. Thus
the initial specification is given by the following equation:
I P A T e ....................................................................... (1)
Where I = carbon-dioxide emissions, P = population, A = gross domestic product per capital
expressed in 1990 constant price and T = energy production since it required more technology to
produce energy. α, δ γ β are parameters to be estimated and e is the random error. We form the
empirical model by taking logarithms of equation 1 Thus:
log log log logt t t t tI P A T ....................................... (2)
Where P, T, A remain as defined above. On apriori, we expect δ γ β > 0. Since the model is
specified in natural logarithms, the coefficients of the explanatory variables can directly be interpreted
as elasticities.
Before estimating the models, the dependent variable and independent variables are separately
subjected to stationarity tests using the unit root test, since the assumptions for the classical regression
model require that both variables be stationary and that the errors have a zero mean and constant
variance. The unit root test is evaluated using the Augmented Dickey-Fuller test, which can be
determined as:
1 1
1
m
t t t tt
Y Y Y
……………………………………...... (3)
Where represent the drift, t represent deterministic trend and m is a lag length large enough
to ensure that is a white noise process.
If the variables are integrated of order one I (1), we test for the possibility of a co-integrated
relationship using the Johansen Co-integration Technique. The study employs the error correction
model (ECM) because it is an appropriate estimation technique that captures the short run and long
run effect of the differenced variables. It connects the short run and the long-run behaviour of the
dependent and independent variables. The proposed long-run is in equation 2 above.
If the Yt and Xt are found to be co-integrated, then there must exist an associated Error
Correction Model (ECM), according to Engel and Granger (1987). The usual ECM may take the
following form:
1 1 1
1 1
m m
t t i t tt t
Y X Y
………………….......…. (4)

Scottish Journal of Arts, Social Sciences and Scientific Studies - ISSN 2047-1278
http://scottishjournal.co.uk
48
Where, ∆ denotes first difference operators, 1t is the error correction term, m is the number
of lags necessary to obtain ―white noise‖ and t is another random disturbance term. If /δ/ is
significantly different from zero, then Yt and Xt will have longer run relationship. The (ECM) error
correction term ( 1t ) depicts the extent of disequilibrium between Yt and Xt. the ECM, reveals further
that the change in Yt not only depend on lagged changes in xt but also on its own lagged changes. The
estimate of the parameters of the ECM are generally consistent and efficient (Hendry and Richard,
1983). Inference about the long run Granger causality can be drawn from the ECM model. The
presence of co integration will indicate at least, unidirectional long run causality from ∆Xt-j, If
statistically significant will indicate a short run causality from ∆Xt-j, to ∆Yt-j . The statistically
significant non-Zero co-efficient of ∆Yt-j will indicate feedbacks to ∆Yt from its own lagged values. It
may be noted that even in the absence of co-integration, the error correction model may be estimated
to detect if there is any short run granger causality.
The study used annual time-series data. The data of interest are amount of CO2 emissions in
tons, population, Gross Domestic Product (GDP) per capita expressed in 1990 constant price and oil
production. These data are sourced from the Central Bank of Nigeria (CBN) statistical Bulletin (2010).
5. Results and Discussion
As a preliminary step to analyzing the result, we carried out the unit root test using the
Augmented Dickey Fuller (ADF) test, since research has shown that regression coefficients with non-
stationary variables may lead to spurious and misleading conclusion. The results of the unit root test
are presented in Table 2 below.
Table 2: Result of ADF unit root test.
UNIT ROOT TEST FOR VARIABLES
Variables
ADF
test stat
Order of integration 1% 5
%
LOGC02
Level
-
2.22784
-
4.2092
-
3.5279
I(1)
1st diff
-
4.11647
-
4.2165
-
3.5312
PG
level
-
2.0418
-
4.2165
-
3.5312
I(1)
1st diff
-
5.5128
-
4.2242
-
3.5348
LOGPGDP
Level
-
1.7624
-
4.2165
-
3.5312
I(1)
1st diff
-
4.2350
-
4.2242
-
3.5348
LOGOILP
level
-
2.9307
-
4.2092
-
3.5279
I(1)
1st diff
-
5.7855
-
4.2165
-
3.5312

Scottish Journal of Arts, Social Sciences and Scientific Studies - ISSN 2047-1278
http://scottishjournal.co.uk
49
Source: Authors result using E-views 7
The result in Table 2 above indicates that the individual series for the variables are stationary
at first difference i.e. they are integrated of order one, I(1) Thus, we proceeded to carrying out the co-
integration test using Johansen Co-Integration test; this is presented in Table 3 below.
Table 3: Result of Co-integration test.
Hypothesized Trace 0.05
No. of CE(s) Eigenvalue Statistic Critical Value Prob.**
None * 0.733100 84.36141 47.85613 0.0000
At most 1 * 0.515885 34.16786 29.79707 0.0147
At most 2 0.154676 6.601449 15.49471 0.6244
At most 3 0.005671 0.216110 3.841466 0.6420
Source: Authors result using Eviews 7
The co-integration result is presented in Table 3 above. As shown in the table, the null
hypothesis of no co-integration is rejected as the trace test reveals that, two co-integration equation
exists among linear combinations of C02 and its hypothesized determinants for test at 5% level of
significance. The implication of the foregoing is that even though C02 emission in Nigeria and its
hypothesised determinants are generally I(1) series, some stable long-run equilibrium relationship
exists among the series, which could be given some error correction representations (Engle and
Granger, 1987). It also shows that the possibility of the estimated relationship being spurious is ruled
out.
Table 4: Estimated short –run result with ∆C02 emission as dependent variable
Regressors
Co-
efficient
Standard
error
T-stat
P- Value
C -0.007479 0.034206 -0.218640 0.8282
∆LOGPG
DP
0.495414 0.244025 2.030180 0.0502
∆LOGPG 1.018706 0.424438 2.400129 0.0214
∆LOGOIL
P
0.499518 0.237375 2.104340 0.0428
ECM(-1) -0.246429 0.119619 -2.060122 0.0471
R-squared 0.758770
0.630754
3.430990 prob(F-statistic = 0.018477)
1.868567
R-Bar-
Squared
F-stat
DW-
statistic
Source: Authors result using Eviews 7

Scottish Journal of Arts, Social Sciences and Scientific Studies - ISSN 2047-1278
http://scottishjournal.co.uk
50
The result of the short run determinant of carbon-dioxide emission is presented in Table 4
above. The results indicate that all of the variables included in the model are statistically significant
(although at different level) and conforms to their expected signs. With respect to the estimated
elasticities, the population elasticity is slightly higher than one, in line with previous research. The
implication of this is that the reduction of global emissions will become a more challenging task as
most developing countries are experiencing rapid economic growth. Rising per-capita gross domestic
product, as revealed in this study, are associated with upward trend in emissions. From the result oil
production also has a positive effect on CO2 emissions. However, estimated coefficient for oil
production indicates a slight higher effect than per-capita gross domestic product on emissions. A
reason for this might be the high amount of gas flaring during oil production in the previous years.
An examination of the F-statistic and the adjusted R2, suggest that the variables in the error
correction model significantly explain changes in carbon-dioxide emissions at p < 0.05, accounting for
63% of the short-run variation in the series. The coefficient of the ECM term captures the adjustment
towards the long-run equilibrium. The coefficient of ECM also reveals the proportion of the
disequilibrium in the differenced dependent variable in one period that is corrected subsequently
during the next period. The result indicates that the speed of adjustment is low as only 0.2464(25%) of
the error is corrected.
5. Conclusion and Policy Recommendation
In this study an error correction modelling of the determinants of carbon dioxide emissions in
Nigeria during the period 1970 to 2010 was conducted. Following the STIRPAT model by Dietz and
Rosa (1997), we specify a model which expresses carbon-dioxide emissions as a function of
population (PG), per capita gross domestic product and oil production. The results showed that the
variables in the model significantly affect the dependent variable as showed by the R2 and F-statistic.
The coefficient of the ECM is well behaved and significant; however, the speed of adjustment is low.
On the basis of apriori expectation, the entire variables have their expected signs. On the basis of the
result, the following policy recommendations are made:
Increase energy efficiency of economic production in the country. As revealed in this
study, oil production significantly contribute to C02 emission, thus, an increase in
energy efficiency will lower the amount of C02 emissions. Alternatively, the use of
clean energy should be encouraged.
Proper maintenance of and additional energy infrastructure: This involves increment in
energy infrastructure (particularly gas infrastructure). This will help drastically to
reduce emission of C02 and will increase gas production and consumption which will,
all things been equal, lead to economic growth. Also, there is the need to cultivate
maintenance culture to avoid existing energy infrastructure from damaging.
Diversification of energy sources: over the years, fossil fuels have been a major source
in the provision of energy in Nigeria. However, because of the damage it cause policy
makers and analysts everywhere in the world have shifted attention towards clean
energy. It is necessary, therefore, for the Nigerian government to begin to encourage
the use of this non-fossil fuel to drastically reduce C02 emission.
Proper funding of the sector: The energy sector is capital intensive in nature, as a result,
it requires huge amount of investments. Thus, the public and private sector could form
a partnership to tackle investment problem. Also, government needs to increase the
budgetary allocation to the sector particularly on clean energy infrastructure and make
the release of funds as fast as possible without delays.

Scottish Journal of Arts, Social Sciences and Scientific Studies - ISSN 2047-1278
http://scottishjournal.co.uk
51
Reference
Borghesi, S. and Vercelli, A. (2003) ‗Sustainable globalisation‗, Ecological Economics 44, 77-
89.
Bruvoll, A. and Medin, H. (2003) ‗Factors behind the environmental Kuznets curve : a
decomposition of the changes in air pollution‘ Environmental and resource economics 24 (1),
27-48.
Cole, M. A., Rayner, A. J. and Bates, J. M. (1997), ‗The Environmental Kuznets Curve: An
Empirical Analysis‘, Environment and Development Economics, 2(4), 401-16.
Cole, M.A. and Neumayer, E. (2004), ‗Examining the Impact of Demographic Factors on Air
Pollution‘, Population and Development Review 26 (1), 5-21.
D.A Dickey and W.A Fuller (1979) Distribution of the Estimators for Autoregressive Times
Series with a unit Root. Journal of the American Statistical Association Vol. 74.
Dietz, T. and Rosa, E. A. (1997), ‗Effects of population and affluence on CO2 emissions‘
Proceedings of the National Academy of Sciences USA 94, 175-179.
Ehrlich, P. R. and Holdren, J. P. (1971), ‗Impact of Population Growth‘ Science 171, 1212-
1217.
Gokhan Unlu (2008). The impact of population growth on Co2 emissions: an empirical
analysis.
Hamilton, C. and Turton, H. (2002), ‗Determinants of Emissions Growth in OECD countries‘
Energy Policy 30, 63-71.
Lise, W. (2005), ‗Decomposition of CO2 Emissions over 1980-2003 in Turkey‘, FEEM
Working Paper No. 24.05.
Mackella, F. Landis, W Lutz, C. Prinz and A Goujon (1995) population and households, and
Co2 emissions, population and development Review.
Omojolaibi (2011). Climate change and Sustainable development in Sub-Saharan Africa: An
Application of panel Co integration to some selected countries: in Akin Iwayemi, Wumi
Iledare and Adeola Adenikinju (eds) Proceedings of the 2010 NAEE Conference 187-197

Scottish Journal of Arts, Social Sciences and Scientific Studies - ISSN 2047-1278
http://scottishjournal.co.uk
52
Oniemola (2011). Climate change and Sustainable Development: Any way forward after
Copenhagen: in Akin Iwayemi, Wumi Iledare and Adeola Adenikinju (eds) Proceedings of the
2010 NAEE Conference 198-216
Panayotou, T., Peterson, A. and Sachs, J. (2000), ‗Is the Environmental Kuznets Curve driven
by structural change? What extended time series may imply for developing countries‘, CAER
II Discussion Paper 80.
Perman, R. and Stern, D. I. (2003) ‗Evidence from panel unit root and cointegration tests that
the environmental Kuznets curve does not exists‘, Australian Journal of Agricultural and
Resource Economics 47, 325-347.
Shi, A. (2003), ‗The impact of population pressure on global carbon dioxide emissions, 1975-
1996: evidence from pooled cross-country data‘ Ecological Economics 44, 29-42. Stern, D. I.
(1998), ‗Progress on the environmental Kuznets curve?‘, Environment and Development
Economics 3, 173-196.
Stern, D. I. (2002), ‗Explaining changes in global sulphur emissions: An econometric
decomposition approach‘, Ecological Economics 42,201-220.

Scottish Journal of Arts, Social Sciences and Scientific Studies - ISSN 2047-1278
http://scottishjournal.co.uk
53
Socio-Psychological factors determining
workers’ negotiation pattern in selected
organisations in Lagos State, Nigeria
Akanji Rafiu, Bankole Ph.D
Dept. of Industrial Relations & Personnel Management
Lagos State University.
Email: [email protected]
Maroof ,Alatishe
Dept. of Industrial Relations & Personnel Management
Lagos State University
Ola Olusegun, Oyedele
Dept. of Industrial Relations & Personnel Management
Lagos State University
Abstract
The study examined the combined and relative effects of interpersonal skill and emotional
intelligence on workers‘ negotiation patterns in some selected work organizations in Lagos State,
Nigeria. The study adopted survey research method and applied multi-stage sampling procedures. A
sample of 250 respondents was purposively selected from ten randomly selected organizations in
Lagos State, Nigeria. Three standardized scales: emotional intelligence (0.78), interpersonal skill
(r=0.86) and negotiation patterns (r=0.79) were used as the instruments. Data were analyzed using
multiple regressions at 0.05 alpha levels. The findings indicated that the two independent variables
when taken together had significant joint effect on the negotiation patterns of the respondents
(Adjusted R2= 0.116). Also, the result revealed that emotional intelligence is a more potent predictor
of workers‘ negotiation patterns with β = 0.138, t = 2.316, p< 0.05. Based on the findings, it was
recommended among other things that government and employer of labour in the organized private
sector could introduce intervention training programmes on the two skills with a view to enhancing
the negotiation patterns of workers. By so doing, it is believed that the incidence of industrial conflict
in work organisations would be reduced drastically.
Key words: Emotional intelligence, interpersonal skill, work organisation, negotiation pattern.

Scottish Journal of Arts, Social Sciences and Scientific Studies - ISSN 2047-1278
http://scottishjournal.co.uk
54
Introduction
Over the years, available records and personal experience had consistently indicated that the
incidence of industrial conflict in Nigeria is persistently on the increase despite the operation of the
existing machineries for conflict resolution (Fajana, 2000; CBN, 2005; FMLP, 2009). Apparently, this
trend has impacted negatively on the socio-economic and technological development of Nigeria as a
nation (Bankole, 2010).
However, recent studies (Hammed, 2002; Okhakhume and Durodola, 2002; Hammed and
Ayantunji, 2002; Ajala, 2003; Akanji, 2005; Ogunyemi, 2005; Bankole, 2007) had traced the trend to
the negotiation patterns of labour leaders and management representatives who seem to lack the
required skills for effective conflict management.
Hammed and Ayantunji (2002), for instance, observed that the industrial conflict as is found in
most organizations today bother on conflict-handling behaviour (negotiation patterns) of both labour
leaders either elected or/and appointed officers and the representatives of the management. In line with
the views of Hammed and Ayantunji (2002), Akanji (2005) asserts that work place conflicts are
mostly due to interpersonal squabbles between trade union leaders and the management of
organizations.
Negotiation, according to Fisher et al (2000) is a structural process of dialogue between
conflicting parties about issues in which their opinions differ. In a more concise form, Miall,
Ramsbothan and Woodhouse (1999) described negotiation as the process whereby the parties within
the conflict seek to settle or resolve their conflict.
However, the University of Peace as cited in Miller (2003) sees negotiation as communication,
usually governed by the pre-established procedures between representatives of parties involved in a
conflict or dispute. In his contribution, Best (2007) sees negotiations as a direct process of dialogue
and discussion taking place between at least two parties who are faced with a conflict situation or a
dispute. He stresses further that negotiation implies that both parties in conflict have come to the
realization that by talking to each other they can find possible solution that is acceptable to both
parties on the issues over which they apparently disagree.
Moreso, since benefits of compromised solution outweigh the losses arising from refusal to
negotiate, it goes without saying that the ultimate goal of negotiation is to reach agreement through
joint decision making between conflicting parties (Jeong, 2000). Writing on the same subject,
Hammed (2002) avers that negotiation typically contain four vital documents.
i. The two parties involved in negotiation demonstrate some degree of interdependence.
ii. Some perceived conflicts exist between the parties involved in negotiation.
iii. The two parties have the potential to participate in opportunities interaction with each
party trying to influence decision to its advantage through various negotiation actions.
iv. The possibility of agreement exists.
However, previous studies (Hammed, 2002; Best, 2007) had identified two types of
negotiation patterns namely: positional negotiation pattern and collaborative negotiation pattern. The
positional negotiation pattern is based on the aggressive pursuit of interest by conflicting parties and is
typically adversarial and competitive. Parties involved in conflict make demands that are inconsiderate
of the interest and needs of others, and this makes it difficult for the interest to be met. Also, the
positional negotiation pattern encourages conflicting parties to perceive themselves to be in
competition. Thus, it assumes a win-loss outcome instead of working towards a mutually beneficial
outcome. Positional negotiation pattern is characteristically confrontational and aggressive hence there
is always deadlock whenever it is applied (Hammed, 2002).

Scottish Journal of Arts, Social Sciences and Scientific Studies - ISSN 2047-1278
http://scottishjournal.co.uk
55
Collaborative negotiation pattern ,on the other hand, is a process where conflicting parties
attempt to enlighten each other about their needs and concerns, and both search for the best ways to
solve their differences in such a manner that the interests and fears of both are met and allayed
respectively. This pattern calls for trust and openness in expressing one‘s thought and feelings,
actively listening to others and actively exploring alternatives together. Thus, each party has empathy
and cares about the need of the other party. Unlike the positional negotiation, the collaborative
negotiation pattern assumes a win-win outcome in which mutually satisfying solutions to the
conflicting issues are found.
It is however, instructive to note that though, in principle, a collaborative negotiation pattern is
based on mutual understanding and feeling, aimed at building a sustainable relationship between
parties; in practice, the collaborative negotiations pattern may not be as simple as this model presents
it. This is so because cultural peculiarities, preparatory stage, the actual interaction phase, and the
follow up may render negotiation more complex than it is imagined (Best, 2007).
Nevertheless, research efforts in the field of behavioral sciences had identified some behaviour
modification skills such as emotional intelligence, interpersonal skill, assertiveness, communication
skill, critical thinking skill, social skill and host of others that have the capacity to stimulate general
positive behaviour in individuals. Though the aforementioned skills were truly identified not much has
been done to find out specifically the influence of such skills on negotiation pattern of workers‘ in
Nigeria instead previous studies had concentrated mostly on economic factors affecting industrial
conflict management.
Therefore, in an attempt to fill the aforementioned gap, the present study investigates the
composite and relative effects of two of the identified behaviour modification skills, precisely
interpersonal and emotional intelligence skills, on the negotiation pattern of workers in selected
organization in Lagos State, Nigeria.
Interpersonal skills have been described by Young (1996) as the ability to read and manage
emotions, motivations and behaviour of oneself and others during social interactions or in a social
interactive context. In essence, interpersonal skill is required for working peacefully with others,
conveying verbal and non-verbal messages, listening, giving and receiving feedback, communicating
with diverse others and overcoming barriers to communication.
In a more concise but technical manner, Wikipedia (2006) describes interpersonal skills as
mental and communicative algorithms applied during social communication and interaction in order to
reach certain effects or results. In his view, Hammed (1999) describes interpersonal skill as the ability
of an employee to effectively interact with the boss, co-worker or the customer to achieve
organizational goals. He explains that for any organization or individuals to survive in the face of
current complexities facing the world of work, such an organization needs people with distinctive
interpersonal skills. Thus, Hammed identifies lack of interpersonal skill as one of the major problems
militating against the effectiveness and efficiency of an average Nigerian worker including labour
leaders and management representatives.
Corroborating Hammed‘s analysis on interpersonal skill, Akinboye (1999) posits that
employees in modern organizations require lots of learning, thinking and practical day-today problem
solving, planning and more importantly interpersonal skills to function properly and effectively. In the
same manner, Ajala (2003) argues that with good interpersonal skills workers and management would
be aware of and accept each other's feelings, even if they are `negative'. Opportunities will thus be
provided for workers to give vent to their negative feeling in destructive ways while means will also
be provided for expression of good feelings that will make workers and management to develop the
ability to adapt to new problems and situations. `

Scottish Journal of Arts, Social Sciences and Scientific Studies - ISSN 2047-1278
http://scottishjournal.co.uk
56
Okurame (2000) echoes the same views on the importance of interpersonal skill as one of the
21st century generic skills when he declares that the most positive and confident employee obviously
may not accomplish much at work without interpersonal skill which he or she needs to communicate
and function co-operatively with others in a work group. In view of the fact that interpersonal skill of
people influence what they say and how they say it, it can be inferred that the development of
interpersonal values will further enhance workers with valuing process with which workers and
employers, will sort out the available information, consider alternatives and consequences and finally
make adequate choices thereby reducing the occurrence of industrial conflicts and where conflict
occurs, the resolution will be 'more peaceful than violent.
Presenting interpersonal skills as multi-purpose skills, Southam (2006) divides interpersonal
skill into three distinctive areas namely:
i. Communication skill which comprises literacy, verbal skills and listening skills.
ii. Social skills which include good eye contact, body language and ability to build rapport with
other people.
iii. Emotional intelligence which has to do with self-awareness and emotional maturity.
Reiterating the indispensability of interpersonal skills, Bellack, Hersen and Turner (1976)
affirmed that interpersonal skills deficits have been implicated in many different forms, of
psychopathology, including alcoholism, sexual deviation, heterosocial failure, explosive rage,
and hyper aggression, depression and schizophrenia. Thus, negative social transactions are
consequent upon negative aspects of interpersonal relationship skills (Finch, 1998).
Contributing to the analysis on interpersonal skills, Franzoi (2000) who queries on what makes
a person socially skilled observes that people who are judged to have interpersonal skills usually direct
more questions toward their conventional partners and make more positive personal statements about
them. Meanwhile, Aremu and Adeyoju (1998) in their empirical study on interpersonal relationship of
police offices discover that there is a significant improvement in the interpersonal relationship of
police officers exposed to interpersonal skills training.
However, some scholars have equally identified some elements of interpersonal skills that can
help to enhance the negotiation pattern of trade union leaders. These are:
i. The ability to listen and understand what others are saying
ii. The ability to contribute effectively in discussion
iii. The ability to deal with different situations successfully
iv. The ability to negotiate effectively
Emotional intelligence is one of the contemporary and topical concepts often referred to when
discussing about management and effective leadership in organizations today (Ashkagnasy and Daus,
2002). It has been acknowledged that individual and ultimately organizational performance is
influenced either positively or negatively by the emotional content of leadership behaviour (Macalcer
and Shannon, 2002). Thus, the growth in interest in emotional intelligence is associated with
increasing organizational change and organizational contextual volatility that is frequently attributed
to emotional conflict or interpretive conflict (Downing, 1997).
The genesis of the term emotional intelligence is traceable to 1920 when Thorndike (1920) at
Columbia University used the term "Social Intelligence" to describe the skill of getting along with
other people. But at a later time, Gardner (1975) began the formulation of the idea for "Multiple
Intelligence" in his work titled "The Shattered Mind"wherein he identifies eight intelligences which
includes both interpersonal and intrapersonal intelligences (Wikipedia, 2007).

Scottish Journal of Arts, Social Sciences and Scientific Studies - ISSN 2047-1278
http://scottishjournal.co.uk
57
It is germane to mention that the general belief of notable psychologists such as Gardner was
that traditional measures of intelligence (e.g. intelligence quotient) have failed to explain cognitive
ability of individuals (Smith, 2002). However, the precise term of emotional intelligence appears to
have originated with Wayne Payne (1985) but because research on the concept originated with Peter
Salovey and John `Jack' Mayer (1990), the origin of the concept, is now attributed to Salovey and
Mayer (Wikipedia, 2007: Aremu, 2007; Animasahun,.2007; Adeyemo and Ogunyemi, 2007). It is
however noteworthy that the concept was popularized by Daniel Goleman (1995) who has published
several.books and articles on the concept of emotional intelligence.
Nevertheless, a number of scholars had defined the concept in so many ways based on their
understanding of the concept. For example, the pioneer researchers of the concept, Salovey and Mayer
(1990) describe emotional intelligence as a form of social intelligence that involves the ability to
monitor one's own feelings and emotions as well as those of others; to discriminate among them and to
use this information to guide one's thinking and actions.
In line with the views of Salovey and Mayer on the concept of emotional intelligence,
Goleman (1998:317) describes the concept as "the capacity for organizing our own feelings and those
of others, for motivating ourselves and for managing emotions well in ourselves and in our
relationships". Goleman (1999) is of the view that emotional intelligence is twice as valuable as
technical skills and intelligent quotient for jobs at all levels. He emphatically asserts that a person's
success at work is 80 per cent dependent on emotional intelligence and only 20 per cent dependent on
Intelligence Quotient. Using the framework of Salovey and Mayer (1990), Goleman (1999:95)
identifies five basic components of emotional intelligence at work:
Self-Awareness (SA) - It refers to the ability to recognize and understand one's own moods,
emotions and drives, as well as their effect on others.
Self-Regulation (SR) - It refers to the ability to control or redirect one's disruptive impulses
and moods.
Motivation (MO) - It refers to a passion to work for 'reasons that go beyond money or status.
In essence, it has to do with the "gathering up" of your feelings and directing yourself towards a goal,
despite self-doubt, inertia and impulsiveness.
Empathy (EM) - It refers to the ability to understand the emotional framework of others. In
other words, it has to do with being sensitive to others' feelings and concerns and taking their
.perspectives into considerations; appropriate the differences in how people feel about things.
Social Skill (SS) – It refers to profitability in managing relationships and building networks.
Drawing inference from the analysis of Goleman, Aremu (2007) describes emotional
intelligence as the management of one's emotional in such a way that those emotions do not constitute
a nuisance to the individual and significant others in and around him. He stresses that bringing
emotional intelligence into the realm of academic acceptance has helped to dislodge the earlier
position on Intelligent Quotient (IQ) as the main determinant of life success.
In agreement with the position of Aremu (2007) on emotional intelligence, Fajana (2009)
describes emotional intelligence as the ability to accurately identify and understand one's own
emotional reactions and those of others. This, according to Fajana, includes the ability to regulate
one's emotions and to use them to make good decisions and act effectively. Thus, emotional
intelligence is seen as providing the bedrock for many competencies that are critical for effective
performance in the work place. He explains further that it is now widely acknowledged that a high
performance at workplace requires people who have a solid foundation not only in literacy skills,
computation, but also in personal qualities such as responsibility self-esteem, self-control, sociability,
self-management, integrity and honesty, all of which are predicated on emotional intelligence.

Scottish Journal of Arts, Social Sciences and Scientific Studies - ISSN 2047-1278
http://scottishjournal.co.uk
58
In their contribution, Macaleer and Shannon, (2002) view emotional intelligence as a
combination of emotional and interpersonal competencies that influence our behavior, thinking and
interaction with others. The opinion of Macalcer and Shannon (2002) finds support in the work of
Ciarrochi (2001) wherein he asserts that an objective measure of emotion management skills is
associated with a tendency to maintain an experimentally induced positive mood which has obvious
implications for enhancing conflict-handling behavior and preventing industrial conflict.
Dreyfus (1999) expresses the same view when she describes emotional intelligence as the
ability to understand oneself and others as we relate to people and adapt and cope with our
surroundings. She explains further that emotional intelligence reflects how knowledge is applied and
developed throughout life. She reiterates that a well developed emotional intelligence distinguishes
individual "Star Performer". Furthermore, in her analysis, Dreyfus considers emotional intelligence as
non-cognitive intelligence which means that it is something that exists outside our skills and
knowledge.
Considering the elements involved in emotional intelligence, Mertinez (1997) admits that
emotional intelligence is a bigger predictor of workplace success than intelligent quotient. In his
contribution, Young (2006) lists certain behaviors which he said are peculiar to people who have
emotional intelligence:
i. Awareness of and abilities to manage their own emotions, strengths, and limits during both
face-to-face and virtual interactions..
ii. Ability to manage their behavior during social interactions.
iii. Ability to align their goals to the goals of others during collaborative activities.
iv. Understanding and positive management of the emotions of others in both face-to-face and
virtual environments; empathize with others; sensitive to the needs of others and to the forces
that shape the way that others feel and behave; enhance the strengths and abilities of others.
v. Manage conflict effectively by devising win-win solutions; constructively influence the
behavior of others; use effective communication and persuasive strategies; listen well.
In addition to the itemized emotional intelligence behaviours stated above Ciarrochi, Chan, and
Caputi (2000) declare that emotional intelligence is positively correlated with such variables as
empathy, verbal intelligence, extroversion, openness to feelings, self-esteem and life satisfaction. It is
however observed that the behaviours exhibited by both labour leaders and management
representatives especially during negotiation are often contrary to the virtues of emotional intelligence
hence the need for them to benefit from emotional intelligence education.
Objective of the study
The objective of this study is to find out the joint and relative effects of interpersonal skill and
emotional intelligence on negotiation pattern of workers.
Research Hypothesis
There is no significant joint and relative effect of interpersonal skill and emotional intelligence
on negotiation pattern of workers.
Methodology
Descriptive survey research method was adopted. Multi-stage sampling procedure was
employed to select 300 respondents, majority of who are labour leaders. The sample comprised male
and female within the age bracket of 35-55 years. Three standardized scales were used. These are
Interpersonal Skill Scale (r=0.86), Emotional Intelligence Scale (r=0.78) and Negotiation Pattern
Scale (r=0.79). Out of the 300 copies of the questionnaire administered, 276 copies were retrieved but

Scottish Journal of Arts, Social Sciences and Scientific Studies - ISSN 2047-1278
http://scottishjournal.co.uk
59
only 250 copies were certified valid for analysis. Data collected were analyzed through multiple
regressions at 0.05 alpha levels. The instruments were scored on four point Likert scales of Strongly
Agree (SA), Agree (A), Disagree (D) and Strongly Disagree (SD).
Result
Hypothesis: There is no significant joint and relative effect of interpersonal skill and emotional
intelligence on negotiation pattern of workers.
Table 1: Showing regression summary of two independent variables on negotiation pattern
of workers.
R= 0.350
R2= 0.123
Adjusted R2=0.116
Std. Error of the estimate = 5.4861
Source
of variation
Sum
of squares
Df Mean
square
F Sig
Regres
sion
1038.9
72
2 519.48
6
17.260 .000
Residu
al
7433.9
28
247 30.097
Total 8472.9
00
249
Significant at F (2, 247) =17.260; P< 0.05
The above Table 1 shows that a combination of the two independent variables (interpersonal
skill and emotional intelligence) in predicting the negotiation pattern of workers yielded a multiple
regression co-efficient of R = 0.350 and a multiple regression R2 adjusted of 0.116. Also, the table 1
reveals that analysis of variance of the multiple regression data produced an F-ratio of 17.260,
significant at 0.05 alpha levels.

Scottish Journal of Arts, Social Sciences and Scientific Studies - ISSN 2047-1278
http://scottishjournal.co.uk
60
Table 2: Showing parameter of estimate of the relative contribution of each of the two
identified independent variables to negotiation pattern of workers.
Unstandardised
Co-efficient
Standard
ized co-efficient
Variable
s
B Std
Error
Beta t Sig
Interpers
onal skill
0.102 0.044 0.138 2.316 .021
Emotion
al intelligence
0.163 0.029 0.332 5.555 .000
Constant 23.658 3.573 6.622 .000
Significant at P< 0.05
Table 2 shows the regression weights, the standard error of estimate, the t-ratio and the level at
which the t- ratio is significant for each identified variable. The table shows that the Beta weight range
from 0.138 to 0.332 and that the two variables were found significant at 0.05 alpha levels.
Discussion of Findings
From the result obtained in this study, it is evident that the two independent variables, acting
together were able to predict workers‘ negotiation pattern in conflict situation. The observed F-ratio of
17.260, significant at 0.05 level supplied good evidence that the effectiveness of a combination of the
two independent variables in the prediction of negotiation pattern of workers did not occurred by
chance.
Added to this is the co-efficient of multiple regressions of 0.350 and a multiple R2 adjusted of
0.116 which indicates the magnitude of the relationship between negotiation pattern of workers and a
combination of the two independent variables.
In essence, the result shows that the independent variables accounted for 11.6 per cent of the
total variance in the criterion variable. Thus, it shows clearly that the independent variables have
influence on the negotiation pattern of workers.
The findings of this study agree with the work of Samford (1993) and Wikipedia (2006) that
interpersonal skill is the vehicle for attaining organizational goals and that with adequate interpersonal
skills, workers would be able to maintain good links with the management of their respective
organizations. Similarly, the result of this study finds support in the work of Okurame (2000) in which
he reports that the most positive and confident employee may not accomplish much at work without
interpersonal skill with which to communicate and function co-operatively with others at workplace.
Okurame stresses that lack of interpersonal skill is one of the major causes of interpersonal and social
problems at home and workplace.

Scottish Journal of Arts, Social Sciences and Scientific Studies - ISSN 2047-1278
http://scottishjournal.co.uk
61
Writing on the same subject, Ajala (2003) affirms that with good interpersonal skills, workers
and management will be aware of and accept other feelings even if they are negative. He argues
further that interpersonal skill provides opportunities for workers to give vent to their ‗negative‘
feeling while means are also provided for expression of ‗good‘ feeling that will make workers and
management to develop the ability to adapt to new problems and situations.
Regarding the relative effect of emotional intelligence on negotiation pattern of workers, the
result of this study is in line with the reports of Goleman (1998), Bar-On (2005), Ezeagulu (2005), Yu
et‘ al‘ (2006), Aremu (2007), Adeyemo and Ogunyemi (2007) and Fajana (2009) that effective use of
emotion is basic to the function of successful leadership and that a reasonable measure of emotional
intelligence enables an individual to maintain an experimentally induced positive mood which has
obvious implication for promoting good labour management relations and prevent industrial conflict
in the workplace. Also, the finding of the present study agrees with that of Animasahun (2007) which
indicated that training on emotional intelligence can correct the maladaptive behaviours noticed
among the members of National Union of Road Transport Workers (NURTW) in Ibadan metropolis.
In view of the fact that the regression analysis of the joint and relative effects of the
independent variables on negotiation pattern of workers was significant, the null hypothesis which
stated that ―there is no significant joint and relative effect of interpersonal skill and emotional
intelligence on negotiation patterns of workers‖ is hereby rejected, which implies that there is
significant relationship between the two independent variables and the negotiation pattern of workers.
Conclusion and recommendation
In view of the high frequent occurrence of industrial actions in work organizations despite the
operation of the existing internal and external machineries for conflict management, it becomes
necessary to shift research attention away from institutionalization of conflict to other alternative
approaches. Thus, in response to the various empirical evidences that implicated the negotiation
pattern of both workers and management for the incessant industrial crisis, this study examined two
behaviour modification factors with a view to establishing that the effective use of the two variables
could enhance the negotiation pattern of workers and consequently engender sustainable industrial
peace and harmony in work organizations in Lagos State in particular and Nigeria in general.
Based on the findings of the study, it was suggested that government should encourage the use
of the two factors in conflict management process by organizing training workshops on the two skills
for workers representatives (labour leaders). Employers of labour could complement government
efforts in that direction by sponsoring similar training programmes for members of their management
that represent the management during negotiation. Also, the two existing federations of trade unions
could organize either jointly or separately, training programmes on the two skills for the leaders of
their affiliated trade unions.

Scottish Journal of Arts, Social Sciences and Scientific Studies - ISSN 2047-1278
http://scottishjournal.co.uk
62
References
Adeyemo, D.A. and Ogunyemi, B. 2007. Emotional intelligence and self-efficacy as predictors
of occupational stress among academic staff in a Nigerian university, Retrieved Sept. 25, 2007,
from http://www.weleadinlearnining .org/da05.htm
Ajala, E.M. 2003A. The influence of peace education on labour- management relations in
selected industries on Oyo State, Nigeria. Ph.D Thesis. Department of Adult Education.
University of Ibadan.
Akannji. T.A. 2002. An exploration of New Approaches of conflict resolution in community
development. The African Journal Studies 5.1/2:34-42. 2005.
Perspectvies on Workplace Conflict Management and New Approaches for the Twenty- First
Century. In Albert, I.O. (ed) Perspectives on peace and conflict in African. Ibadan : John
Archers (Publishers) Ltd.
Akinboye, J.O. 1999. Interpersonal Skills at works. Ibadan: CYFO Behaviour Service Paper.
Animasahun, R.A. 2007. Measured effect of emotional intelligence education in the
remediation of aggressive behaviour among the members of the NURTW in Ibadan
metropolis. IFE PsychologIA, 15.1:128-139.
Adeyoju, C.A 1998. Improving the police officers‘ interpersonal relationships through social
skills training. Nigeria Journal of Clinical and Counseling Psychology 4.1:18-23.
Aremu, A.O. 2007. The Nigeria Police and Zero Corruption Tolerance: The function of
emotional Intelligence. IFE Psycholog1A 15.1: 193-212.
Ashkaquasy, N.M and Daus, C 2002. Emotion in the workplace: the new challenge for
managers. Academy of Management Executives 16.1:76-86.
Bankole, A 1997. An evaluation of the statutory machinery for industrial conflict resolution in
Nigeria. LASU Journal of Social Science 6.1/2:36-46.
Bankole, A. R. 2010. Psychosocial factors as determinants of conflict-handling behavior of
labour leaders and management representatives in work organizations in Lagos State, Nigeria.
Ph.d Thesis. Adult Education Department. University of Ibadan.
Bar-On, R. 2003. How important is to educate people to be emotionally and socially intelligent
, and can it be done? Perspectives in Education. 21.4:3-13.
Best, S.G. 2007. The methods of conflict resolution and transformation. In S.G. Best (Ed).
Introduction to peace and conflict studies in West Africa. Ibadan: Spectrum Books Limited.
Central Bank of Nigeria, 2005. Statistical Bulletin: Industrial Relations Statistics 16:293.
Ciarrochi, J., Chan, A and Bajgar, J. 2001. Measuring emotional intelligence in adolescents.
Personality and Individual Differences. 28:539-561.
Dreyfus, C. 1999. Non- Cognitive Intelligence. A Paper presented at a Meeting of the National
Human Resources Association of Philadelphia. Nov. 3, 1999.
Downing, S.J. 1997. Learning the plot: emotional momentum in the search of dramatic logic.
Management Learning. 28. 1:27-44
Fajana, S. 2009. People : Diversity for the benefits of mankind. An inaugural lecture delivered
at the University of Lagos, Feb, 11.pp. 35
Federal Ministry of labour and Productivity(2009) Statistical data on trade disputes in Nigeria.

Scottish Journal of Arts, Social Sciences and Scientific Studies - ISSN 2047-1278
http://scottishjournal.co.uk
63
Franzoi, S.L 2000. Social Psychology. Boston: McGraw- Hill.
Gardner, H. 1975. The shattered mind New York: Knopf.
Goleman, D. 1995. Emotional Intelligence. Boston: Harvard Business School Press.
Goleman, D. 1998. Working with Emotional Intelligence. New York: Bantam Books.
Hammed, T. A. and Falaye, A.O 1999a. Fostering interpersonal skill among selected bank
workers through assertiveness training and transaction analysis. P.h.D Thesis. Dept. of
Guidance and Counseling. University of Ibadan. XX1+241.
Hammed, T.A. 2002. Conflict management at work. In J.O. Akinboye (Ed). Psychological
principles of success in life and workplace. Ibadan: Sterling- Horden Publishers (Nig) Ltd.
Hammed , T.A and Ayantunji, O. A 2002. The Effect of Six Thinking Hats in Enhancing the
Conflicts Handling Behaviour of Selected Trade Union leaders in Lagos State. Nigerian
Journal of Applied Psychology 7.1.
Jeong, H.W. 2000. Peace and Conflict studies: An Introduction. Aldershot: Ashgate.
Macaleer, W.D and Shannon, J.B. (2002). Emotional intelligence: How does it affect
Leadership? Employment relation today: Autumn 2002: 29, 3; ABI/INFORM Global.
Miall, H. Ramshotham, O. & Woodhouse, T. 1999. Contemporary conflict resolution: The
prevention, management and transformation of deadly conflicts. Cambridge: Polity Press.
Miller, C 2003. A glossary of terms and concepts in peace and conflict studies. Geneva:
University for Peace.
Ogunyemi, B. 2005. Sex, Religion, Work experience differentials on conflicts resolution
strategies among Nigeria primary school teachers. Nigerian Journal of Applied Psychology.
8/9/213-229.
Okhakhume, A & Durodola, O. 2002. Leaders power bases and styles of handling personnel
conflicts among subordinates in ensuring organizational effectiveness. African Journal of
Cross- Cultural Psychology and Sport Facilitation. 4.1-7.
Okurame, D. E 2000. Interpersonal skills and socialiability among some commercial bank
workers: implications for work-team management. African journal for the Psychological Study
of Social Issues 5.1 & 2:13-22.
Payne, W.L. 1985. A study of emotion: developing emotional intelligence; self-integration;
relating to fear, pain and desire (theory, structure of reality, problem-solving,
contraction/expansion, tuning in/coming out/letting go). A Doctoral Dissertation, Cincinnati,
O.H: The Union for Experimenting Colleges and Universities (now the Union Institute).
Salovey, P. & Mayer, J.D 1990. Emotional intelligence. Imagination, Cognition and
Personality 9.3:85-211.
Smith, M.K. 2002. Howard Gardner, and multiple intelligence, the encyclopedia of informal
education. Retrieved Sept, 12, 2007, from http://www/infed.org/thinkers /gardner.htm.
Southam, K. 2006. Interpersonal Skill. Retrieved Sept. 19, 2006, from
http://www.careercone.com.au/job-search/get-that-job/ask-kate/pid/721.
Thorndike, R.K. 1920. Intelligence and its uses. Harper‘s magazine, 140: 227-235.
Wikipedia, 2006. interpersonal skills. Retrieved August 23, 2006, form, http: en. Wikipedia .
org \wiki\ interpersonal –skills,
Scottish Journal of Arts, Social Sciences and Scientific Studies - ISSN 2047-1278
http://scottishjournal.co.uk
64
Wikipedia 2007..Emotional intelligence. Retrieved sept 12, 2007, from,http://en. wikipedia.
org/Wiki /emotional intelligence
Young, C.1996. emotional and intelligence. Retrieved Apirl 11, 2003, from
http://trocchim.human.cornell.edu/gallery/young/emtional.htm.
Yu, C.S., Sardessair, R. M., Lu, J and Zhao, J.H. 2006. Relationship of emotional intelligence
with conflict management styles: an empirical study in China. International Journal of
Management and Enterprises Development, 3, ½, 19-29.

Scottish Journal of Arts, Social Sciences and Scientific Studies - ISSN 2047-1278
http://scottishjournal.co.uk
65
ALIU BABATUNDE FAFUNWA’S
INFLUENCE ON NURSERY
EDUCATION DEVELOPMENT IN
NIGERIA: 1955-1998
Professor Amakievi Okien Ijeoma Gabriel
INSTITUTE OF FOUNDATION STUDIES
RIVERS STATE UNIVERSITY OF SCIENCE
AND TECHNOLOGY, P. M. B. 5080,
PORT HARCOURT, RIVERS STATE,
NIGERIA
ABSTRACT
Nursery Education in Nigeria attracted much attention in the 20th
century although some Christian
missions had made attempts at providing this level of education. Fafunwa influenced the inclusion of
nursery education into the nation‘s educational system. His ideas are reflected in the curriculum,
teaching methods, instructional materials, teacher education and medium of communication in the
classroom. As a result of his influence, nursery schools have spread from major cities to slums and
suburbs of cities and to many rural areas which was not a feature of the 1950s, 1960s and 1970s.
Fafunwa influenced nursery education from his various vantage positions as Senior Lecturer,
Associate Professor, Professor, Dean, Director, Acting Vice Chancellor, member of the Joint
Consultative Committee which was an Advisory body to the Federal Government of Nigeria on
Education, member of Governing Council of some universities, Chairman, Governing Council of
College of Education among others. Through interviews on radio and television, public lectures,
seminars, workshops and conferences, Fafunwa‘s ideas on nursery education were expressed and
advocated. The inclusion of nursery education in the educational system as found in the National
Policy on Education was a landmark achievement. The same is true for the use of the pupil‘s mother
tongue as a medium for teaching and teaching of basic science at this level. Several secondary
materials, books, journal articles and personal interviews he granted were used for this study. From
1955 when Fafunwa returned from the United State of America where he studied, his interest in the
development of nursery education in Nigeria did not wane. He pioneered the training of non-graduate
teachers for nursery schools and the commencement of degree programmes in Universities and
Colleges of Education. He was passionate about nursery education and advocated an adaptation of its
content instructional materials used in Nigeria‘s nursery schools. The theory and practise of nursery
education in Nigeria reflect a lot of Fafunwa‘s ideas that make his contributions and consequently his
influence very remarkable.

Scottish Journal of Arts, Social Sciences and Scientific Studies - ISSN 2047-1278
http://scottishjournal.co.uk
66
Introduction
Nursery education in many parts of the world provides classroom education for
children between the ages of three and five years plus, before commencement of primary school
education. Consequently, it functions as a transition between the home environment where they are
primarily involved in play and family based activities, to the more structured school environment with
a larger group of peers and adults who are not their parents.
Several persons in different ways have also influenced the development of nursery
education in many countries. For example, in Scotland Robert Owen opened an infant school in New
Lanark in 1816; Samuel Wilderspin opened one school in London in 1819; Countess Theresa
Brunszvik on May 27, 1828 in Hungary established a nursery in her residence in the city of Buda;
Froebel, on June 28, 1837 established a Play and activity Institute in Thuringia, Germany but renamed
it Kindergarten in 1840. In 1851 Margarethe Ronge and her husband Johannes established the first
―England infant Garden‖ in Hampstead; Maria Montessori established a Children‘s House in a low-
income housing area of Rome‘s San Lorenzo district, Italy in 1907. Bertha Schurz opened a nursery
school in Watertown, Wisconson, USA in 1856, she taught in German but was well patronized. In
1859, Elizabeth Palmer Peabody opened the first English speaking nursery school in Boston,
Massachusetts. Kindergartens (nursery schools) from then spread throughout USA. The first
successful public kindergarten was established in 1873 by Susan Blow in the Des Peres School in St.
Louis, Missouri. (New World Encyclopedia, 2008). Essentially, they stressed the social and
emotional development of the child as well as encouraged self-understanding and development
through play activities and creative expression.
This paper therefore examines Aliu Babatunde Fafunwa‘s contribution towards the
development of nursery education in Nigeria, the aspects that have been greatly influenced and why he
was able to generate this influence.
Fafunwa: Aim of Education and Nigeria Education Policy.
Education refers to all efforts, conscious and direct, incidental and indirect, made by a
given society to accomplish certain goals that society considers desirable in terms of the individual‘s
own needs as well as the needs of the society (Fafunwa 1969). Thus, education employs all necessary
processes to develop a person‘s ability, attitudes and other forms of behaviour that are of positive
value in the society in which we live. This concept of education underscored Fafunwa‘s contributions
to various levels and facets of education in Nigeria from 1955 when he returned from the United
States of America (USA) after his doctorate degree programme.
Following Nigeria‘s independence in 1960, many educators and concerned citizens
expressed deep concern about the lack of relevance of the Nigerian educational system bequeathed to
Nigeria by her erstwhile colonial master (the British) in meeting the economic, social and cultural
needs of the nation, Nigerian children were educated to function outside their country but not to meet
the needs of their own country. Buttressing this fact, Amucheazi (1986) wrote that as Nigerian
nationalists took over some powers in the 1950‘s they took steps to correct the colonial system of
education and insisted on an educational policy which produce ―useful, self-confident and competent
Citizens‖.
According to Fafunwa (1986), the criticism of the system by many educated Nigerians
had made him hold several meetings with his staff in 1964 at the Institute of Education, University of
Nigeria Nsukka, (where he was the Director) on the Nigerian educational system. They concluded that
there was a need to review the education system and map out new directions for an independent
Nigeria. The Institute therefore mandated Fafunwa who was a member of the Joint Consultative

Scottish Journal of Arts, Social Sciences and Scientific Studies - ISSN 2047-1278
http://scottishjournal.co.uk
67
Committee (JCC) on Education, the national advisory body on education, to present to the JCC a
proposal for a review of the system of education in Nigeria then, and to state or determine the end to
which education should serve in Nigeria (Fafunwa, 1986). A proposal for a ―National Curriculum
Conference‖ was therefore presented to the JCC at its 1964 bi-annual meeting at Enugu.
This proposal met with stiff opposition at this meeting but a plea by the Chairman,
Chief S. O. Awokoya, and the Chief Federal Adviser on Education to the Federal Republic of Nigeria
made members to defer a final decision on the issue so that they would have more time to study the
proposal. At the 1966 JCC meeting at Kaduna, Chief S. O. Awokoya made a convincing case in a
ten-page document titled ‗Need for Curriculum Reform in Nigeria‘. Moreover, he had raised funds for
the conference from the Ford Foundation of America and the United Nations Education Scientific and
Cultural Organization (UNESCO). Thus, the idea about the need for curriculum change was accepted.
Undaunted by JCC‘s reaction to his proposal at her Enugu meeting, Fafunwa was
assisted by the undergraduate students of the Faculty and his colleagues in the institute to conduct an
opinion survey on the primary and secondary education systems in Nigeria. The result of this survey
was the unanimity of opinion among both literate and illiterate citizens across the nation on their
dissatisfaction with these levels of education in Nigeria (Fafunwa, 1989). This survey result partly
convinced Chief S. O. Awokoya who leveraged the acceptance of the Curriculum Conference that was
also scheduled for 1966. Chief S. O. Awokoya, a Professor of Science Education, had in 1952 been a
Minister of Education in the then Western Nigeria, and head of (Principal) of Federal Advance
Science School, Lagos, before becoming the Federal Adviser on Education in 1956. His support of
Fafunwa‘s proposal underscored his understanding and depth of experience in the field of education in
Nigeria. Indeed change was imminent.
The conference, which held from 8th
to 12th
September, 1969, was delayed by the
military coup and crisis of 1966 that eventually degenerated into the Nigeria Civil war of 1967-1970.
It was a major landmark in the history of education in Nigeria, being also the first national attempt to
change the colonial orientation of the nation‘s educational system. For authenticity and relevance to a
wide spectrum of the citizenry, representatives of trade unions, farmers, women‘s organizations,
religious bodies, teachers‘ associations, other professional organizations (medical, legal, engineering),
University teachers and administrators, Ministry officials, youth club organizers, business men and
representatives from the governments of most of the twelve states of Nigeria participated in the
conference ( Adaralegbe, 1972). Indeed the views of the masses were important in reconstructing the
structure and content of the nation‘s education system.
It was during a national seminar titled ―A National Policy on Education‖ and Organised
by the Federal Commissioner for Education, Chief A. Y. Eke in June 1973 that the recommendations
of the 1969 National Curriculum Conference (NCC) were deliberated upon. The product of this
seminar was the National Policy on Education in 1977 (first edition). A major landmark in this
publication was the inclusion of pre-primary (nursery) education as one of the levels of education
accepted and recognized by Nigerians. This gave credence to the indigenization stance of the Federal
Military Government of Nigeria after the civil war in January 1970. Post war reconciliation,
rehabilitation, and reconstruction (3R‘s) efforts had been hinged on an indigenization decree enacted
to give more control of the nation‘s economic resources to indigenes and this was predominantly
reflected in the first National Development Plan of 1970 to 1974.
Fafunwa‘s role in ensuring that pre-primary education was integrated in Nigerian‘s
educational system was influenced by his exposure in the USA where he studied for his first degree
from 1947 to 1950 (Bachelor of Science degree in Social Science and English at Bethune Cookman
College, Daytona Beach, Florida); a Master of Arts degree in English and Education at New York
University, New York in 1951 and a Doctor of Philosophy in Administration and Higher Education
from 1952 to 1955. It would be recalled that by the mid-19th
century nursery education was

Scottish Journal of Arts, Social Sciences and Scientific Studies - ISSN 2047-1278
http://scottishjournal.co.uk
68
widespread in the USA, the critical foundation of any educational system for human development.
Thus, by the mid 20th
century for Fafunwa, pre-primary education was a sine-qua-non for the
educational system of Nigeria. Its relevance, organization and implementation re-echoes Fafunwa‘s
belief that ―you cannot use yesterdays tools for today‘s work and still expect to be in business‖
(Fafunwa, 1986). Fafunwa‘s return to Nigeria in 1956, at a time when education in Nigeria was to
become decolonized and his emphasis for a more ‗holistic‘ functional educational system that
emphasizes flexibility and usefulness to the society, as well as his rapport with influential education
officers provided him a good stead to participate in educational planning and consequently influenced
educational development through his innovative ideas that were germane for the times.
Fafunwa and Nursery Education in Nigeria
Policy on Nursery Education.
In 1967 Fafunwa advised that ―All African countries south of the Sahara should
develop a system of nursery education both in the village and urban areas‖. The foresight that
informed this statement reflects a deep concern and understanding for access to nursery education not
only in Nigeria but throughout Africa. This, especially, was because of the roles she was expected to
play in the international arena given the fact that many African countries had gained political
independence. A policy statement and formulation were unarguably necessary in this respect. For
Nigeria, nursery education was referred to as pre-primary education in her National Policy on
Education (NPE), the first of which was produced in 1977. Children between the ages of three and five
plus, prior to their entering the primary school were to benefit from this level of education. The
purpose was essentially to:
(a) effect a smooth transition from the home to the school;
(b) prepare the child for the primary level of education;
(c) provide adequate care and supervision of the children while their parents are at work (on
the farms, in the markets, offices etc);
(d) inculcate social norms;
(e) inculcate in the child the spirit of enquiry and creativity through the exploration of nature,
and the local environment, playing with toys, artistic and musical activities, etc;
(f) teaching co-operation and team spirit;
(g) teaching the rudiments of numbers, letters, colours, shapes, forms, etc through play; and
(h) teaching good habits, especially good health habits.
In order to achieve these objectives, the Federal Government of Nigeria undertook to:
(1) encourage private efforts in the provision of Pre-primary education;
(2) provide Teacher Training Institutions for student teachers who wanted to specialize in
pre-primary education;
(3) ensure that the medium of instruction will be principally the mother-tongue or the
language of the immediate community; and to this end will
(a) develop the orthography for many more Nigerian languages,
and
(b) produce textbooks in Nigerian languages.
(4) ensure that the main method of teaching in the pre-primary institution will be through
play and that the curriculum of teacher Training Colleges is appropriately oriented to
achieve this;
(5) regulate and control the operation of pre-primary education as well as ensure that the staff
of pre-primary institutions are adequately trained and that essential equipment is
provided;

Scottish Journal of Arts, Social Sciences and Scientific Studies - ISSN 2047-1278
http://scottishjournal.co.uk
69
(6) review and enforce the educational laws which relate to the establishment of nursery
schools to make sure that schools are well-run and that teachers are qualified and other
academic infrastructure provided. Ministries of Education will make regular inspections
to ensure maintenance of high standards
( Federal Republic of Nigeria, 1977).
Access To Nursery Education
The provision of access to nursery education as reflected in Article (1) of how Nigerian
government intended to attain nursery education objectives was entirely for the private sector
(religious organizations, individuals and other non-governmental organizations). Hitherto, Fafunwa
had advocated that all villages should establish at least one nursery centre each. The village square,
community centre or any other meeting place would be appropriate for the purpose but the Chief‘s
compound could be used too. A variety of projects such as roads, bridges, primary and secondary
schools, social centres, among others have been built in many rural areas through communal efforts.
Consequently, Fafunwa advocated that nursery schools be also built by communities whose members
would offset part of the financial outlay by providing human labour needed for the project.
Corona women society, comprised of British, Irish and Nigerian women, established
the first nursery school in Ikoyi, Lagos, in 1955. For several years all workers served on voluntary
basis (Corona Schools Trust Council, 2011). The First nursery school in Ibadan was established by
Chief Mrs. Gladys Aduke Vaughn in October, 1962. The next in Ibadan was opened in January, 1966;
Bodija International Nursery school by Mrs. Helen Aina Eso. In 1945 United African Company
(UAC) established a nursery in Alinso Okanu, Ogba/Egbema/Ndoni Local Government for children
and its staff. In Port Harcourt, the Young Women‘s Christian Association (YWCA) opened the first
and only nursery school for more than twelve years before some attempts by others. Thus, there were
very few nursery schools in the cities from the 1950s to 1970s. There were hardly any in the rural
areas.
Fafunwa‘s thoughts on nursery education were popularized through radio, television
interviews and discussions, print media, interviews, seminars, workshops and conferences. His long
years of service in various capacities in the nation‘s educational sector made him influence
educational planning, implementation and administration at various levels of education. From January
to December, 1956 he was a senior tutor and later became Principal of the Ahmadiyyah College,
Agege, Lagos. After a brief working experience as the Public Relations Manager of Esso Oil West
Africa from 1957 to 1961, he left for the classroom again. This time at the University of Nigeria,
Nsukka (UNN) in then Eastern Region, he started as a Senior Lecturer and head of Education and later
became Associate Professor and Dean of the Faulty of Education in 1964. By 1965, he was professor,
Director of the Institute of Education and Head, Department of Education. By 1966, he was acting
Vice Chancellor of UNN but left UNN for the University of Ife (now Obafemi Awolowo University,
Ile Ife) as a result of the Nigerian civil war.
From the mid 1980‘s, nursery schools spread to urban slums, suburbs and rural areas in
many states of Nigeria particularly in the South –West, South-East and South-South. In the Northern
States they were mainly in the large cities. It was not surprising to find nursery schools in mud houses,
wooden classrooms (known as batchers), in town halls and other social centres, uncompleted buildings
among others.
The provisions of the pre-primary level of education were not tampered with following
the revision of the NPE in 1981 and 1998. For further development, the implementation Committee
set up in September 1977 had the mandate to:

Scottish Journal of Arts, Social Sciences and Scientific Studies - ISSN 2047-1278
http://scottishjournal.co.uk
70
(a) translate the policy into a workable Blueprint and develop programmes for the
implementation of the policy;
(b) co-ordinate and monitor the implantation of those programmes in the policy;
(c) advise Government on and assist in providing the infrastructural and other requirements
for policy implementation;
(d) provide a continuous review and assessment of the aims, objectives and targets of the
policy with a view to ensuring the adequacy and continued relevance of the policy (and
those programmes developed under it) to our national needs and aspirations, and to
propose modifications on any aspects as may be found necessary (implementation
Committee, 1978).
Here again, Fafunwa actively participated in producing the NPE Blueprint because the
Committee Chairman, Professor S. Onabamiro held meetings with education Commissioners and
other officials of the nineteen States of the Federation, received memoranda from prominent educators
and agencies and also from those who attended the 1969 National Conference and the 1973 national
seminar on education. Late Dr. Archibald Callaway, a UNESCO expert also worked assiduously with
the committee to produce the Blueprint.
In relation to pre-primary Education, the Guidelines for Implementation of the NPE, (a
product of some recommendations of the Implementation Committee) and approved by the National
Council on Education ( NCE) from 1977 to 1987 provided that:
(1) State Governments should Legislate on and supervise pre-primary education.
Individuals, private voluntary organizations, employers of labour and communities
should establish pre-primary schools. Large employers of labour should see it as a
social responsibility to establish pre-primary schools for the benefit of their worker‘s
families (This should be an obligation enforceable by Law).
(2) Each State Government should encourage pre-primary education by providing relevant
legislation and adequate guidelines.
(3) Pre-primary schools should be made to keep schools records as required by all other
schools.
(4) The proprietors should be required to recruit their teachers. There should be provision
for mobility of teachers from pre-primary schools into State schools and vice versa.
(5) Pre-primary school teachers should be registered by the State Ministries of Education
like all other teachers in the State school system.
(6) The Head Teacher of each pre-primary school should be a specialist in this field.
Adequate provision should be made in Teacher Training Institutions for student-
teachers who may wish to specialize in Pre-primary Education. The preparation of
teachers for this level should be such as to enable them to function effectively at the
lower level of the primary school if they wish.
(7) The medium of instruction in pre-primary schools should be the language of the
immediate community. In a multi-national school, English may be used as the medium
of instruction but the language of the immediate community should be taught in the
spoken form.
(8) The National Book Development Council and the Nigeria Educational Research
Council should encourage the production of relevant books and materials for the very
young since books with Nigerian background for pre-primary schools are not available
in sufficient quantity and variety.

Scottish Journal of Arts, Social Sciences and Scientific Studies - ISSN 2047-1278
http://scottishjournal.co.uk
71
(9) The curriculum of pre-primary schools should provide for instruction in Religion, and
Social Norms through stories and other appropriate activities.
(10) The production of teaching aids and education toys should be encouraged through the
involvement of students in craft schools, vocational and Technical Colleges.
(11) Since a number of Koranic schools are now within State educational systems it follows
that the State Ministries of Education should provide for the maintenance of standards
in these schools.
(12) Each State Government should re-examine its Education Laws and legislate as
appropriate to cover Pre-Primary Education.
(13) It should be the responsibility of each Ministry of Education to give guidance to Pre-
Primary Schools, through regular visits and inspections at least once a year, until they
are well established.
(14) The State Ministry of Education should set out the guidelines governing the
establishment, running and closure of Pre-primary schools. Under normal
circumstances boarding facilities should not be allowed in Pre-primary institutions.
(15) The guidelines, among other things, should stipulate the physical facilities to be
provided, the fees to be charged, the books, curriculum, teaching aids, teachers‘
qualifications and other minimum requirements. For a one-teacher school the teacher
must be professionally qualified.
(16) Pre-primary school children should be taught the National Pledge and the National
Anthem and such schools should fly the National flag. (Implementation Committee,
1988).
By 1967, Fafunwa had articulated and documented his thoughts on nursery and other levels of
education in his book titled, New Perspectives in African Education. His ideas are reflected in the
Policy, Implementation Guidelines and practice of nursery education in Nigeria. Part of his influence
was through his colleagues and students who occupied critical and influential positions as education
officers.
Fafunwa‘s curriculum for the nursery school included indigenous music, dances,
stories, painting and science. These however, were in addition to a knowledge of English alphabets,
numbers, and reading of simple story books at age 5, identification of colours, construction of objects,
and so on. He was concerned with activities that would develop the child‘s manipulative skills and
creativity. The child at this stage, he stated, was highly imaginative and creative. Consequently, the
child should be given a lot of opportunity for self expression as he/she matures into a new and rapidly
changing world of science and technology (Fafunwa, 1967). In order to facilitate this development, he
suggested that wooden educational toys such as motor cars, shovels, trucks, aeroplanes, counting
beads and abaci (from bamboo trunk) dolls (from wood and rags), rattles, balances and other
educational objects should be produced and used. Clay, that is abundant in Nigeria, should be
exploited and used as a substitute for plasticine. Indeed most nursery schools in the slum, suburban
and rural areas in Nigeria use these improvised educational toys. It is in the big cities and in high fee
paying schools that expensive plastic unit blocks, plasticine, swings, ladders, ready-made playhouse,
and so on as found in the western world are mostly used.
Fasokun (2000) corroborated Fafunwa‘s premium on the inclusion of science
exploration in the nursery curriculum because children have a natural inclination towards natural
science. Thus, a science corner should be created for children with the following objects found in the
natural environment: a variety of rocks, sea shells, birds‘ nests, spiders, bats, tortoises. An aquarium
constructed by using a large kerosene tin with one or two sides partially cut out and replaced by

Scottish Journal of Arts, Social Sciences and Scientific Studies - ISSN 2047-1278
http://scottishjournal.co.uk
72
transparent glass or plastic firmly held to the sides with water-resistant tape or tar (Fafunwa, 1967).
Similarly children should be acquainted with the farm, stream, rivers or lagoon, village or town
market, cattle ranch that are natural classrooms.
Fafunwa believed in adapting objects/equipment and facilities necessary for nursery
education rather than being hindered and restricted by inability to acquire such imported objects. This
was also an aspect of indigenization. Consequently, the teacher had to be eclectic and resourceful to
provide these instructional aids. Nursery schools in Nigeria have many improvised natural objects and
treated ones that are used for teaching.
The introduction of science into the curriculum at the nursery and primary school levels
was one of Fafunwa‘s innovative programmes. The idea was challenged by scientists at UNN in 1964
because they averred that lecturers and professors of education were not competent to design a
curriculum on science as well as introduce it at these very low levels of education without
sophisticated equipment (Fafunwa,1986). Through a Primary Science workshop at the Institute of
Education, UNN, in 1963 and the Nigeria Primary Science Programme (NPSP) this idea was accepted
and implemented as reflected in the nursery curriculum.
Fafunwa also influenced the official use of mother tongue in teaching nursery and
primary school pupils. English should be taught as a second language while the pupil‘s mother tongue
should be the medium of instruction. This idea is reflected in Article 7 of the guidelines for
implementation of the NPE and widely practiced in nursery schools in the rural areas, especially
Yoruba land where the populace is homogenous. For Fafunwa, a child learns best in his/her mother
tongue, which should start from early childhood for the acquisition of knowledge, social skills and
development of attitudes, manual dexterity among others. His Ife six-year Primary Project (from 1970
to 1981) with Yoruba language as the medium of instruction and English as a second language
provided empirical evidence that entrenched this idea in policy documents and practice.
In multi-lingual States of Nigeria, Fafunwa (1986c) suggested the use of any language
used by more than a third of the population in that State. However, the adoption of an indigenous
language in cosmopolitan cities nursery schools has been difficult.
Teaching Method
―Children should learn by doing‖ and through group activities, indoors and outdoors, which
help them to develop a spirit of co-operation and provide an opportunity for social development
(Fafunwa, 1967). This idea implies that children should participate in the process of learning, which
makes it meaningful and impactful rather than being passive listeners. He emphasized that a good
teacher ‗shows‘ and not ‗tells‘ the children all about a phenomenon. This is because children want to
know how things work, how to make things, what things are used for and even why they are used at
all. Children are curious, love freedom to explore their environment and develop their manipulative
ability. Thus, the teacher serves as a catalyst instead of a gadfly (Fafunwa, 1967). Fafunwa, like John
Dewey, believed in practical work, participation or learning by doing, which was not the practice in
infant schools during the colonial period (Gabriel, 1987). Rote learning was prevalent then and
is still practiced in many Nigerian nursery schools. High fee paying, nursery schools and those with
moderate number of pupils in the class with a teacher ratio of 1:15 employ this method.
For children between two and five years old, the accent should be on playing not teaching;
guiding not directing or instructing. Playing and acting are the child‘s most stimulating ways of
learning and developing at this period (Fafunwa, 1967). Philosophers of education such as Maria
Montessori and Froebel among others also stressed the play-way method. Children naturally enjoy
play and through this they can be taught or guided to acquire knowledge, skills and attitudes desired
by the society.

Scottish Journal of Arts, Social Sciences and Scientific Studies - ISSN 2047-1278
http://scottishjournal.co.uk
73
Children should be led from the concrete to the abstract, not the other way round
(Fafunwa,1967). Jean Piaget, Lev Vygotsky and others who have studied children cognitive
development have posited this fact. Children at this stage depend a lot on sensory perception, which
concrete objects facilitate. Again, through repetition of tasks and interaction with these concrete
objects, learning becomes easy and meaningful.
Nursery Teachers
The teacher is very important in the process of education, and without the services of a
well-trained teacher, the nursery school would be more of a curse than a blessing. It is indeed better
not to have a nursery school education at all than to have one governed by an incompetent, ignorant
and unimaginative teacher (Fafunwa, 1967). It would be recalled in this regard that the FGN as found
in the NPE (Article 2) accepted the responsibility of providing Teacher Training Institutions for those
who wanted to specialize in pre-primary education.
There are few Colleges of Education and Universities in Nigeria that produce specialist
nursery school teachers. Consequently, specialist teachers in this area are in high demand. UNN and
University of Ibadan during Fafunwa‘s very active years in the 1960s and 1970s trained nursery
school teachers. Following State Governments‘ legislation on nursery education and provision of
guidelines proprietors of nursery schools who were also head teachers had to specialize in nursery
education; this was one of requirements for establishing nursery schools. Many of these teachers
studied in Britain and America.
Noting that Nigeria did not have many institutions and adequate staff to train nursery
school teachers, Fafunwa (1967) strongly suggested that assistance be sought from UNESCO and
other international bodies including countries where considerable work had been done in nursery
education, such as the USA, the United Kingdom (UK), Denmark, Switzerland, Israel, the defunct
Union of Soviet Socialist Republic (USSR), Australia and Mexico. Fafunwa wanted the best for
nursery school pupils and Nigeria. Being mindful that they are at a very impressionable, inquisitive,
highly imitative and receptive stage of life, the teacher should be adequately trained in the theory and
practice of education, elementary science, mathematical processes, social science, health and physical
education, language arts (language and literature), community development and a vocational or
technical skill. The professional training should include study of the social foundations of education,
the history of education, elementary psychology, child study, curriculum and methods, audio-visual
aids, construction of instructional materials and practical teaching ( Fafunwa, 1967).
As the first Nigerian with a doctorate degree in Education and first Professor of education
with few colleagues at par, Fafunwa greatly influenced educational development. From 1967 to 1972,
he was a Senior Lecturer and later Deputy Vice Chancellor at the University of Ife. He was a member
of the University of Ibadan Governing Council from 1972 to 1975. Through these positions, he
influenced the development of teacher education for all levels of the educational spectrum. Indeed, his
suggested content for training nursery school teachers is well reflected in their curriculum, a landmark
in the history of teacher education in Nigeria.
Parent and Community Education
Co-operation between parents and nursery teachers is important and should be forged
through Parents-Teacher Association (PTA), regular visits to the school by parents and utilization of
the parents‘ services as voluntary assistants to the nursery teacher. While the P.T.A. is found in
virtually all nursery schools, parents are yet to serve as assistants in teaching nursery pupils.
Organization of Nursery Education
Fafunwa did not succeed in getting all his ideas on nursery education accepted and
implemented. For example, there are no ‗National Co-ordinating Committee on Nursery Education‘,

Scottish Journal of Arts, Social Sciences and Scientific Studies - ISSN 2047-1278
http://scottishjournal.co.uk
74
Regional, Urban and village committees for organizing and administering nursery education. A
flexible time of 8.00a.m to 11.00a.m. and 11.00a.m. to 2.00p.m or 8.00a.m. to 11,00a.m and 4.00p.m.
to 6.00p.m.was rejected. The NPE did not also reflect the teacher-pupil ratio of 1:15 or 1:25 that he
suggested.
Conclusion
Fafunwa‘s ideas influenced nursery education development at a time Nigeria was in
dire need of restructuring and transformation of her entire educational system. His career in education
was also influenced by his education in USA. However, with a good knowledge of traditional
education and the needs of Nigeria, his ideas especially on curriculum made for adaptation rather than
outright copying of the West. His success was leveraged by his vision of the type of education that
post–colonial Nigeria needed and the role Nigerians would be expected to play in the comity of
nations. Consequently, nursery education in terms of future challenges and social changes he
considered as an important starting point in the new educational process. Again, the axiom ‗the child
is Father of the Man‘ makes nursery education imperative. No wonder, he influenced the inclusion of
nursery education in the NPE and guidelines for its implementation approved and provided.
From 1955 Fafunwa returned to Nigeria as the first doctorate degree holder, his passion for
quality nursery education did not wane all through his career. From his vantage positions, as Dean,
Faculty of Education; Deputy Vice Chancellor, Acting Vice Chancellor, member of University
Governing Council, Minister of Education (1990 to 1993), among many others, he ensured that
Colleges of Education and Universities mounted teacher education programmes for producing
specialist nursery teachers. He pioneered education in the Mother tongue and the teaching of science
(however rudimentary) in nursery schools. His stint as Chairman, Governing Council of Lagos State
College of Education between 1981 and 1982 strengthened both theory and practice in teacher
education for producing non-graduate teachers for nursery schools. He was also President,
International Council on Education for Teaching (ICET) with headquarters, at Arlington, Virginia,
U.S.A from 1990-1994. He was among the pioneers of the Nigerian Academy of Education, Vice
President and later President.
Nursery education by the 1998 review of the NPE remained entrenched as part of the
structure of Nigeria‘s educational system even though government at all levels did not establish any.
The NPE Provisions and Guidelines for Implementation of nursery education also remained intact
until 1998. By 2004 NPE review, Government was forced to provide nursery education.

Scottish Journal of Arts, Social Sciences and Scientific Studies - ISSN 2047-1278
http://scottishjournal.co.uk
75
References
Adaralegbe, A. (ed) (1972) A Philosophy of Education For Nigerian Education. Ibadan,
Heinemann Educational Books.
Amucheazi, E. C. (1986) Church and Politics in Eastern Nigeria: 1945-1966. Lagos,
Macmillan Education Limited.
Babatunde, S. O. and Babatunde. A. O. (2010) Qualitative and Quantitative Development of
Nursery Education in Ibadan Metropolis, 1960-2008. A paper presented at the International
Standing Conference of the History of Education, University of Amsterdam, the Netherlands,
August 26-27, 2010.
Corona Schools Trust Council (2011) Ikoyi-Day-Nursery-School
.http://www.coronaschools.org/corona-schools.
Fafunwa, A. B. (1967) New Perspectives in African Education. London and Basingstoke,
Macmillan Education Limited.
Fafunwa, A. B. (1969) Educational Philosophy and Structure of Economic Development in
Yesufu, T. M. (ed) Manpower Problems and Economic Development in Nigeria. Ibadan,
Oxford University Press.
Fafunwa, A. B. (1986a) Innovations in Nigerian Education: Past, Present and Future.
Unpublished first Annual Lecture, Presented at the University of Ife, Ile Ife.
Fafunwa, A. B. (1986b) Oral Interview with Miss Amakievi .O. I. Gabriel, 10th
March, 1986.
Fafunwa, A. B. (1986c) Oral Interview with Miss Amakievi .O. I. Gabriel, August, 1986.
Fafunwa, A. B. (1989) National Policy on Education: A planner‘s View Point in Tamuno, T.
N. and Atanda, J. A. (eds)(1989) Nigeria Since Independence: The First Twenty-five years,
Education, Vol. III, Ibadan, Heinemann Educational Books (Nigeria) Limited.
Fasokun, T. O. (2000) Aliu Babatunde Fafunwa (1923- ) in Prospects: The Quarterly
Review of Comparative Education. Paris, UNESCO: International Bureau of Education.
Federal Republic of Nigeria (1977) National Policy on Education. Lagos, Federal Ministry of
Information, Printing Division.
Gabriel, A. O. I. (1987) The Influence of the Educational Ideas of Selected Nigerian Educators
on the Development of Education in Nigeria Unpublished Doctor of Philosophy (Ph.D) thesis,
Faculty of Education, University of Ibadan, Ibadan, Oyo State.
Implementation Committee (1978) Government Views on the implementation Committee’s
Blueprint. Lagos, Federal Ministry of Information.
Implementation Committee (1988) Guidelines for Implementation of the 6-3-3-4 Education
System based on the Recommendations of the Implementation Committee on the National
Policy on Education and approved by the National Council on Education, 1977-1987. Lagos,
Federal Ministry of Education.
New World Encyclopedia (2008) Kindergarten.
http://www.newworldencyclopedia.org/entry/kindergarten retrieved 11/10/2010.

Scottish Journal of Arts, Social Sciences and Scientific Studies - ISSN 2047-1278
http://scottishjournal.co.uk
76
Species Composition, Length-Weight
Relationships, Condition Factor and Sex
Distribution Pattern of Palaemonid Prawns
in The Ilaje Estuary, Nigeria.
Eniade, Abiodun Adeyemi* (M.Tech)
Department of Environmental Biology and Fisheries, Adekunle Ajasin University, P.M.B. 001,
Akungba-Akoko, Ondo State, Nigeria.
Prof. Bello-Olusoji, A. Oluayo (Phd)
Department of Fisheries and Aquaculture Technology, Federal University of Technology, P.M.B.
704, Akure, Ondo State, Nigeria.
[email protected] or [email protected]
+234 0706 220 2 875 or +234 0805 7322 468
Abstract
The species composition, length-weight relationships, condition factor and sex distribution
pattern of Palaemonid prawns in Ilaje Estuary were studied. The study revealed that three prawn
species (Macrobrachium macrobrachion, Nematopalaemon hastatus and Palaemon maculatus) are
important to the benthic community in this estuary. Assessments of length-weight relationship showed
that male population of Macrobrachium macrobrachion assumed isometric growth (b = 3), as female
population reflected an allometric growth (b < 3). Male and female populations of Palaemon
maculatus exhibited positive and negative allometric growth pattern, with value of b > 3 for males,
and b < 3 for females. The two sexes of Nematopalaemon hastatus maintained isometric growth (b =
3). William‘s equation showed that the condition factor(s) for the identified prawn species is sex
dependent. Condition factor values are higher in Macrobrachium macrobrachion and Palaemon
maculatus males than in females except in the case of Nematopalaemon hastatus. Macrobrachium
macrobrachion population showed significant difference (P < 0.05) in the sex distribution pattern, as
against the conventional ratio of 1male:2females, while Nematopalaemon hastatus and Palaemon
maculatus showed no significant difference (P > 0.05).
Keywords: Macrobrachium macrobrachion, Nematopalaemon hastatus, Palaemon maculatus,
isometric growth, allometric growth.

Scottish Journal of Arts, Social Sciences and Scientific Studies - ISSN 2047-1278
http://scottishjournal.co.uk
77
Introduction
Taxonomically, two subfamilies of the prawn family Palaemonidae are distinguished and they
are the Palaemoninae and the Pontoniinae (Encyclopedia of Life, 2008). The Palaemoninae are less
diverse phylogenetically, but more diverse ecologically and are mainly carnivores that eat small
invertebrates and can be found in any aquatic habitat except the deep sea. The Pontoniinae have a
higher evolutionary diversity, but almost all of them inhabit coral reefs, where they associate with
certain invertebrates such as sponges, cnidarians, mollusks and echinoderms and could be free living
forms, parasites or commensals (Encyclopedia of Life, 2008).
Some members of the sub-family Palaemoninae have been observed to have potentials for
commercial development through aquaculture (Powell, 1982). Its fishery has also been reported along
the mud coast of Niger Delta region in Nigeria with wide distribution of species across the many river
tributaries and estuaries (Marioghae, 1987). This fishery seems to account for a source of livelihood
and employment opportunity to many coastal rural women of the Ilaje community in Ondo State,
Nigeria.
Unfortunately, there is uncertainty in the stock identification of the native species of
Palaemonid prawns in Ilaje estuary, of which direct ecological effect of overfishing and environmental
pollution still pose detrimental effect on its sustainability (Moses, 2006; Adebowale et.al, 2008). Also,
scientific and management information on most fresh and brackish water fishes and prawns‘ in
Nigeria are limited (Bello-Olusoji et.al, 2004; Fafioye and Oluajo, 2005; Abohweyere, 2008).
However, since scientific and management information on Palaemonid prawns within this estuary are
scare; this study aimed to examine the prawn species compositions, length-weight relationships,
condition factor, and the sex ratio of the identified species. The study is also aimed to serve as a guide
in stock management and wild seeds selections for commercial development of fresh water prawns‘
aquaculture, which is still in its infancy in Nigeria.
Materials and Methods
Experimental materials consisted of local prawn traps, translucent fish measuring board,
sensitive weighing scale (model pl200w), hand net and a mixed population of adult and juvenile
prawn sizes for each identified species. The prawns were transported early in the morning, in plastic
containers to the Department of Fisheries and Aquaculture Technology Laboratory, Federal University
of Technology, Akure. The prawns were kept in tanks filled with eutrophicated pond water and gently
aerated throughout the period of the study.
The species identification of prawn samples were done by taxa to species level using
taxonomic keys from the Food and Agricultural Organization Identification Sheets (F.A.O, 1981) and
also Identification Sheet by Powell (1982). The weights (g) of the prawn samples were taken to 0 .01g
sensitivity and the length measurements (mm) were taken using the measuring board.
The length-to-weight relationships for each identified species were then estimated using the
equation W = a Lb
, where W = weight (g) of prawns and L = Total length (mm) of the prawns (Pauly,
1983). The value of constants (a) and (b) were computed from the natural logarithm transformed
values of length and weight. A regression relationship of the natural logarithm conversions of length
and weight values were established for each of the species using Microsoft Excel package (2007). The
condition factor was mathematically established by Williams, (2000) equation; expressed by K =
(100,000W)/L3
where K is Condition factor, W is Weight measurement in grams and L is length
measurement in millimeter. The population size ranges of the identified species were characterized in
accordance with previous works of Powell (1982) and Marioghae (1982), which classified the size
ranges of 10-30mm length as juvenile prawns and size ranges of 30-120mm length as adults. The sex

Scottish Journal of Arts, Social Sciences and Scientific Studies - ISSN 2047-1278
http://scottishjournal.co.uk
78
determination was done using morphomeric features such as head and carapace size and the presence
of eggs on the berried female.
The sex distribution pattern was mathematically derived by population ratio(s) observed from
the sampled population (Gammelsrød, 1992). Chi-square was then used to test the significance
difference from the expected ratio of 1 male : 2 females usually observed in most fishes (Abohweyere,
2008).
Study Area
The study was carried out in the Ilaje Estuary, around the Ondo State coastal community which
lies within Lat. 500 50'N - 60
0 09'N and Longitude 40
0 45'E - 50
0 05‘E and form an extension of the
gulf of Guinea that transcend to the South Eastern part of Nigeria (Figure 1). This estuary consists of
networks of rivers and streams which traverse different settlements and discharge into the coastal
ocean. The adjoining waters at the deeper mouth of the tributaries are bounded by riparian vegetation
with a proportionately higher profile of salt marshes and surface macrophytes that extend over vast
area of brackish water along which prawn samples were collected for the study.
Results
Three species of Palaemonid prawns were identified within Ilaje estuary during the course of
this study (Table 1). Findings on length- weight relationships of the three prawn species showed that
male population of Macrobrachium macrobrachion exhibited isometric (b = 3) growth pattern while
female population exhibited negative allometric growth (b < 3). Palaemon maculatus male population
also exhibited a positive allometric growth (b > 3), while females exhibited negative allometric
growth (b < 3). Both sexes of Nematopalaemon hastatus assumed isometric (b = 3) growth (Table 2).
The condition factor varies between male and female populations of the identified prawns. However,
male populations have higher condition factors except with Nematopalaemon hastatus (Table 2).
Furthermore, record on sex distribution ratio showed that Macrobrachium macrobrachion
exhibited a sex ratio of 1 male : 5 females for population count and a ratio of 1g of male : 2.7g of
female for population weight. Nematopalaemon hastatus and Palaemon maculatus exhibited sex
distribution ratio of 1 male : 2 females for population count. The population weight ratio of male-to-
female prawns for Nematopalaemon hastatus and Palaemon maculatus also stand at 1g male:1.7g
female and 1g male:1.5g female respectively. Chi-square indicated that there was significant
difference (P < 0.05) in the sex distribution pattern of Macrobrachium macrobrachion population in
this area compared to the conventional ratio of 1male:2females in most fishes. Populations of
Nematopalaemon hastatus and Palaemon maculatus in this area showed no significant difference (P >
0.05) to the ratio of 1male : 2 females distribution pattern.
Discussion
The stock identification of fisheries within the Ilaje estuary vis-a-vis rising pressure of
environmental pollution, degradation and ecological modification around this coast is a relevant and
important effort towards ensuring sustainability of its resources (FEPA, 2007; Adebowale et.al, 2008).
Palaemonid prawns‘ fishery in this location accounts for a good proportion of artisanal fisheries
landings, however, management records and statistics are scare. Records available on taxonomic
classifications of prawns along this coast were of Powell (1982) and Marioghae (1982). Subsequently,
this study showed that three of the prawn species identified by these earlier records (along the coastal
stretch of Niger Delta) inhabit this estuary. The population structure of the three identified species as
at study time were mainly juveniles and adult prawns and most female prawns sampled were
ovigerous. This may be attributed to seasonal effect on population structure within the estuary as the
samplings were done at the onset of rainy season; marking the onset of prawn breeding in the tropics
(Nwosu and Wolfi, 2006).

Scottish Journal of Arts, Social Sciences and Scientific Studies - ISSN 2047-1278
http://scottishjournal.co.uk
79
Length-weight relationship of Macrobrachium macrobrachion in this study showed variation
in the growth pattern between male and female populations, with male population having an isometric
growth pattern (b = 3), the value of exponential b = 2.92, when tested (t-test) was not significantly
different (P > 0.05) from b = 3. Female population assumed a negative allometric growth pattern (b
=2.49). It is evident from this position that a significant difference (P < 0.05) exist in male to female
growth pattern. These results conform to the findings of Deekae and Abowei (2010) on the population
of Macrobrachium macrobrachion in Luubara creek, Niger Delta, Nigeria.
The two sexes of Palaemon maculatus also exhibited an allometric pattern of growth with
corresponding value of b =3.20 for male population and b = 2.87 for female population which were
significantly different (P < 0.05) from isometric limit (b > 3 and b < 3). Male and female populations
of Nematopalaemon hastatus were both observed to exhibit isometric growth pattern with b values of
2.99 and 2.98 respectively. These were not significantly different (P > 0.05) from isometry (b = 3) and
agreed with the findings of Enin (1994) in the study of Nematopalaemon hastatus around Cross Rivers
Estuary, Nigeria. Waribugo (2005) also reported the same length-weight isometric growth pattern for
Nematopalaemon hastatus and Palaemon maculatus in the River Nun Estuary, Bayelsa State, Nigeria.
However, Wootton (1992) in his rough explanation of length-weight relationship (W = a Lb) theory in
fishes and invertebrates positioned that; the value of the exponent b is 3 when growth in weight is
isometric (without changing shape). If b value varies from 3, weight growth is said to be allometric
(fish changes shape as it grows larger). Allometric growth may be negative (b < 3) if the fish gets
relatively thinner as it grows larger, or positive (b > 3) if it gets plumber as it grows larger.
The correlation co-efficient (r) for male and female populations of Macrobrachium
macrobrachion are 0.9624 and 0.9443 while the co-efficient of determination (r2) are 0.926 and 0.891
which are respectively high. Palaemon maculatus also exhibited a high (r) value of 0.9518 and 0.9361
for male and female populations. The r2 value for male population is comparatively higher than that of
the females‘, which are 0.962 and 0.876. Nematopalaemon hastatus male population exhibited higher
values of r = 0.9682 and r2
= 0.937 than the female populations which have r = 0.8797 and r2 = 0.770.
Deekae and Abowei (2010) explained that a high correlation coefficient (r) indicates a strong
association between length and weight. He explained further that a high coefficient of determination
(r2) suggest that the model used for the analysis fits the data, confirming the fitness of the model and
pointing to a strong association between length and weight.
The mean condition factor(s) for the population of each identified species in this study was sex
dependent. Male prawns were found larger than the females for populations of Macrobrachium
macrobrachion and Palaemon maculatus. This situation was not the same with population of
Nematopalaemon hastatus because the mean condition factor for female prawns was higher than for
the males. This perhaps might have resulted from the presence of berried females among the sampled
population. Female populations out-numbered male populations for all identified species.
Macrobrachium macrobrachion population maintained the highest condition factor values throughout
the study and thus connote that it grows bigger than other two species identified within the estuary.
Sex ratio(s) in Palaemon maculatus (1:2) and Nematopalaemon hastatus (1:2) followed the
convention of 1 male to 2 females sex distribution pattern in most cases. Conversely, sex ratio (count
data) for Macrobrachium macrobrachion (1: 5) was far divergent in this estuary from the expected
ratio of 1male:2females. Records from observations of other researchers on benthic invertebrates
usually put the sex ratio of this species at 1:2. For example, Abohweyere (2008) observed sex ratio of
Macrobrachium macrobrachion in Lekki lagoon to stand at 1male:2 females which were similar to
finding of Edokpayi, (1989) for the same species in the Benin River. Howbeit, this ratio of 1:5 could
have resulted from selective fishing and overfishing of male Macrobrachium macrobrachion simply
because of her higher body size or condition factor index compared to other species. On the overall,

Scottish Journal of Arts, Social Sciences and Scientific Studies - ISSN 2047-1278
http://scottishjournal.co.uk
80
these ratio(s) could be found relevant in pairing male-to-female prawns for trial breeding in hatchery
environment.
Conclusion
This study was designed to open up further research interests on the benthic ecology of this
estuary. It also focused at bridging the knowledge gap on some domicile and economically important
benthic invertebrates in this estuary. It is hoped that information provided will be relevant for
management and development purposes including research into prawn aquaculture development in
Nigeria.

Scottish Journal of Arts, Social Sciences and Scientific Studies - ISSN 2047-1278
http://scottishjournal.co.uk
81
References
Abohwere, P.O., (2008). Length frequency distribution and sex ratio of Macrobrachium
macrobrachion in the Lagos-Lekki lagoon system, Nigeria. The Zoologist 6:16-19.
Adebowale K.O, Agunbiade F.O, Olu-Owolabi B.I, (2008). Impacts of natural and
anthropogenic multiple Sources of pollution on the environmental conditions of Ondo State coastal
water, Nigeria. Journal of Environmental, Agricultural and Food Chemistry 7(4): 2798-
2810.
Bello-Olusoji, A. Oluayo, Ariyo T. Omolayo and Arinola Aderonke, (2004). Taxonomical
studies on rocky freshwater prawns at Erin- Ijesha waterfalls. Journal of Food, Agriculture and
Environment. 2 (3&4): 280-283.
Deekae, S.N. and Abowei, J.F.N., (2010). Macrobrachium Macrobrachion (Herklots, 1851)
length-weight relationship and
Fulton‘s condition factor in Luubara creek, Ogoni Land, Niger Delta, Nigeria. International
Journal of Animal and Veterinary Advances 2(4): 155-162.
Edokpayi, C.A., (1989). Ecology of prawns (Crustacea: Decapoda: Natantia) in Benin river at
Koko, Bendel State. Ph.D Thesis. University of Benin, Nigeria.
Enin, U.I., (1994). Length - weight parameters and condition factor of two West African
Prawns. Rev. Hydrobiol. Trop., 27(2):121-127.
Encyclopedia of Life, (2008). The integrated taxonomic information system annual check list
for 2008. http://www.catalogueoflife.org/annual-checklist/2008/show_species_details.php (accessed
12th March, 2011).
FAO, (1981). Species identification sheets for Fisheries purposes on Eastern Central Atlantic;
fishing areas 34, 47. Edited (in part) by Fischer, W.,G. Blanch and W.B Scott (eds): Canada Funds-in-
Trust Ottawa, Department of Fisheries and Oceans Canada, by arrangement with the
Food and Agricultural Organization of the United Nations, Vol. 1-7.

Scottish Journal of Arts, Social Sciences and Scientific Studies - ISSN 2047-1278
http://scottishjournal.co.uk
82
FEPA, (1997). Coastal Profile of Nigeria: Federal Environmental Protection Agency Baseline
Study Report. 87pp.
Fafioye, O.O. and Oluajo, O.A., (2005). Length-weight relationships of five fish species in Epe
lagoon, Nigeria. African Journal of Biotechnology. 4(7):749-751.
Gammelsrød, T., (1992). Variation in shrimp abundance on the Sofala Bank, Mozambique, and
its relation to the Zambezi river runoff. Estuar. Coast. Shelf Sci. 35: 91–103.
Marioghae, I.E (1982). Notes on the biology and distribution of Macrobrachium vollenhovenii
and Macrobrachium macrobrachion in Lagos lagoon (Crustacea, Decapods, Palaemonidae)
Rev.Zool.Afr. 96 (3): 493-508.
Marioghae, I.E., (1987). An appraisal of the cultivability of Nigerian Palaemonid Prawns:
FAO/ARAC Working Paper/87/WP4: 3-6.
Moses B.S, (2006). Fisheries and ecotourism: A tool for national development. FISON
conference proceedings. Edited by U.I. Enim; E.I. Chuckwu; P.O. Ajah; D.A. Aina-Abasi and F.M.
Nwowu (ed). Fisheries society of Nigeria, Apapa, Lagos, Nigeria. 412 Pp.
Nwosu, F.A., and Wolfi, M., (2006). Population dynamics of the giant African river prawn;
Macrobrachium vollenhovenii Herklots 1857 (Crustacea, Palaemonidae) in the Cross river estuary,
Nigeria. West Africa Journal of Applied Ecology. 9:1- 13.
Powell, C.B., (1982). Fresh and brackish water shrimps of economic importance in the Niger
Delta. In proceedings of the second annual conference of the fisheries society of Nigeria (FISON)
Calabar, 25th
-27th
January, 1982. 254-285.
Pauly, D., (1983). Some simple methods for the assessment of tropical stocks. FAO Fish. Tech.
Pap., 234: 52 Pp.

Scottish Journal of Arts, Social Sciences and Scientific Studies - ISSN 2047-1278
http://scottishjournal.co.uk
83
WOOTTON R. J., 1992. Fish ecology: Tertiary level biology. Blackie, London, 212 Pp.
Williams, J.E., (2000). The coefficient of condition of fish. Chapter 13 in Schneider, James C.
(ed.) 2000. Manual of fisheries survey methods II. Michigan department of natural resources, fisheries
special report 25, Ann Arbor.
Waribugo, S.A., (2005). Aspects of the biology and fisheries of some palaemonid shrimps in
River Nun Estuary, Bayelsa State, Nigeria. M.Sc. Thesis, Rivers State University of Science and
Technology, Port Harcourt, Nigeria.
Figure 1: Map of the study area.

Scottish Journal of Arts, Social Sciences and Scientific Studies - ISSN 2047-1278
http://scottishjournal.co.uk
84
Table 1: Species Composition of Palaemonid Prawns in Ilaje Estuary
SPECIES
COMPOSITION
DESCRIPTIONS
SIZE
RANGE
(MM)
BODY
COLOURATIO
N
ROSTRUM
2ND
CHELIPED
Macrobrachium
macrobrachion
32.0 – 90.0
Dark
Toothed and
curved
upward at the
tip
Large with
chela fur-like
dense layer of
hair
Palaemon
maculatus
35.0 – 66.0
Transparent
Toothed and
narrowing to
tip
Slender with
chela not
bearing fur-
like hair
Nematopalaemon
hastatus
41.0 – 76.0
Reddish
Needle-like
and tip
upturned
Slender with
chela bearing
fur-like hair
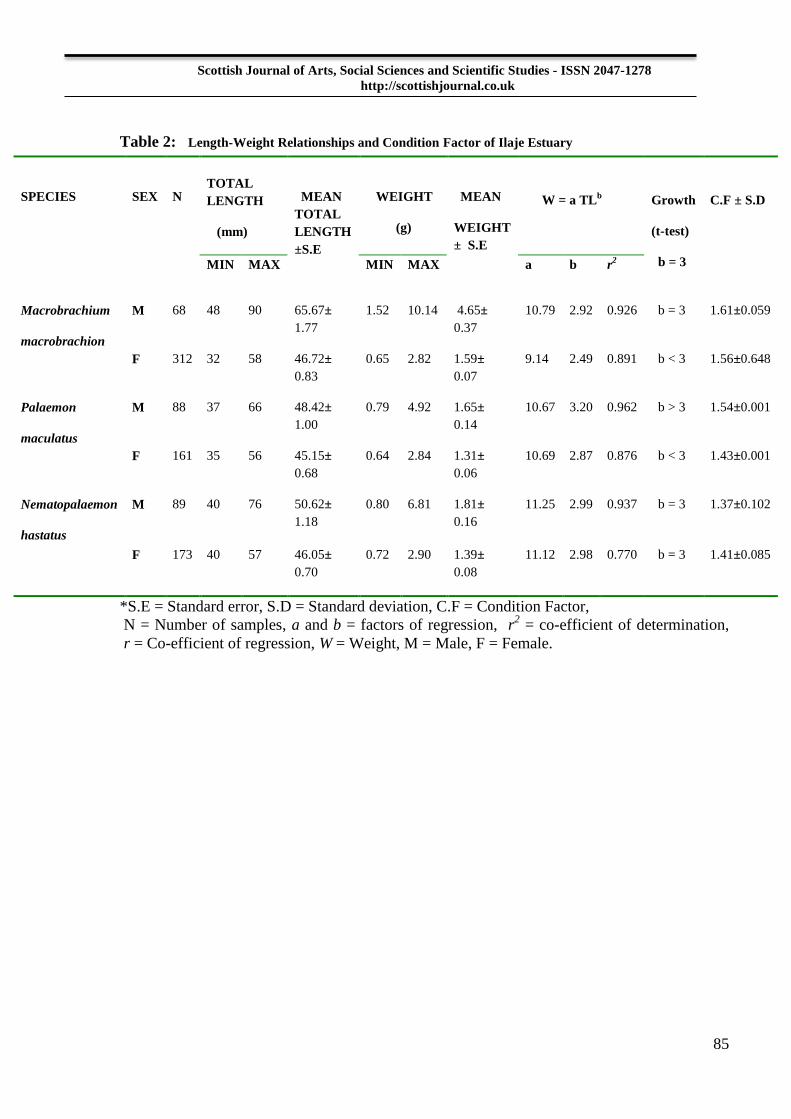
Scottish Journal of Arts, Social Sciences and Scientific Studies - ISSN 2047-1278
http://scottishjournal.co.uk
85
Table 2: Length-Weight Relationships and Condition Factor of Ilaje Estuary
SPECIES
SEX
N
TOTAL
LENGTH
(mm)
MEAN
TOTAL
LENGTH
±S.E
WEIGHT
(g)
MEAN
WEIGHT
± S.E
W = a TLb
Growth
(t-test)
b = 3
C.F ± S.D
MIN MAX MIN MAX a b r2
Macrobrachium
macrobrachion
M 68 48 90 65.67±
1.77 1.52 10.14 4.65±
0.37
10.79 2.92 0.926 b = 3 1.61±0.059
F 312 32 58 46.72±
0.83 0.65 2.82 1.59±
0.07 9.14 2.49 0.891 b < 3 1.56±0.648
Palaemon
maculatus
M 88 37 66 48.42±
1.00 0.79 4.92 1.65±
0.14 10.67 3.20 0.962 b > 3 1.54±0.001
F 161 35 56 45.15±
0.68 0.64 2.84 1.31±
0.06 10.69 2.87 0.876 b < 3 1.43±0.001
Nematopalaemon
hastatus
M 89 40 76 50.62±
1.18 0.80 6.81 1.81±
0.16 11.25 2.99 0.937 b = 3 1.37±0.102
F 173 40 57 46.05±
0.70 0.72 2.90 1.39±
0.08 11.12 2.98 0.770 b = 3 1.41±0.085
*S.E = Standard error, S.D = Standard deviation, C.F = Condition Factor,
N = Number of samples, a and b = factors of regression, r2 = co-efficient of determination,
r = Co-efficient of regression, W = Weight, M = Male, F = Female.
Scottish Journal of Arts, Social Sciences and Scientific Studies - ISSN 2047-1278
http://scottishjournal.co.uk
86
Evaluation of the Performance of A -
Type Stock Mutual Funds in Turkey With
Parametric and Non-Parametric Methods
PhD Candidate Utku Uygur
Finance PhD Programme
Istanbul Technical University
Assoc. Prof. Oktay Taş
Finance PhD Programme
Istanbul Technical University
Abstract:
Evaluation of the performance of a fund that is properly formed according to the expected
return and risk tolerance measures, and also assessment of the fund's manager provide helpful
information to investors. However, there are important points in fund performance evaluation that
must be considered other than risk factors. When a fund‘s performance is evaluated, an investor
demands to know not only the fund‘s relative performance to benchmark portfolios but also whether
that performance is due to chance or the manager‘s expertise and foresight in decision making.
In this research, the biggest 12 A - Type Stock Mutual Funds registered at the Capital Markets
Board (CMB) of Turkey have been chosen according to their asset under management (AUM) values
and their weekly data for the period May 2007 - Sep 2011 has been used to evaluate their
performances with parametric and non-parametric methods. In addition to the widely used
performance indicators in the literature, different Jensen Alphas have been calculated with a new
model based on the Fama-French 3 Factor Model. Quadratic regression method is used to evaluate the
timing capability of the fund manager and the coefficients of the squared terms in the regressions are
measured to evaluate the responses of the fund managers to sudden market moves. A non-parametric
method called Data Envelopment Analysis (DEA) is also used in fund performance evaluation in
addition to parametric methods. Unlike previous studies, commissions are also used as an input in the
DEA together with other risk indicators.
Even though there are some slight differences in ranking the funds, it is observed that the
newly calculated Jensen Alphas show similar results with the other parametric methods. DEA results
are also in line with results from the parametric methods. The results of the quadratic regression
analysis developed to assess the timing capabilities of the A Type Stock Mutual Funds‘ managers

Scottish Journal of Arts, Social Sciences and Scientific Studies - ISSN 2047-1278
http://scottishjournal.co.uk
87
showed that the fund managers are not successful in adapting to the sudden changes both in the bond
and stock markets.
Keywords: Mutual funds, fund performance, Jensen Alpha, Data Envelopment Analysis
JEL Codes: G1, G23, C1
1. Introduction
Mutual funds are among the most important investment tools in capital markets. Mutual funds
are financial institutions that collect many investors‘ savings in a pool and manage their portfolios.
With the advantages of risk diversification, professional management and liquidity presented to the
investor; mutual funds are increasing in importance in Turkey as well as other developing markets.
The basic rationale behind establishing a mutual fund (portfolio) is reducing risk at a certain rate of
return.
The first mutual fund in Turkey has been established by T.C. ĠĢ Bankası in 1987. Analyzing
the number and asset under management (AUM) values of mutual funds registered to Capital Markets
Board (CMB) of Turkey as of September 2011, the following figures are observed:
No of funds: 298
-A Type Funds: 115
-B Type Funds: 183
AUM Value: $15.3 billion
-A Type Funds: $0.9 billion
-B Type Funds: $14.4 billion
The measurement of portfolio performance is important for both investors and fund managers.
Evaluating the performance of a portfolio and its manager is required for market efficiency and
efficient capital allocation. When investors and portfolio managers are evaluating a mutual fund‘s
relative performance to other funds, benchmarks and markets, their aim is to achieve the best return.
The first indicator of a mutual fund‘s performance is its rate of return but it is also important to
determine the level of risk and variability of this return. Evaluation of the portfolio‘s performance
relative to another portfolio is not the only essential factor for the investor in performance evaluation.
The investor also desires to know whether this performance is due to good or bad luck or
management‘s accurate choices and insights.
Until the 1960s, investors were evaluating their portfolios‘ performances depending only on
the rate of return because they were not able to measure the level of risk of within their investments.
As a result, it was not possible to make decisions considering the risk or to avoid risk in portfolio
choices. As the developments in portfolio theory enabled the measurement of risk regarding the
ambiguity of the return, it became possible to measure the risk as well as the return and the
performance evaluations could be performed in the light of this new information. Performance
measurements are used for comparing the mutual fund‘s performance in different time intervals or
performance of different funds in the same time interval. According to the portfolio theory‘s
performance measurement methods, there is a functional relation between an investment‘s return and
its risk. Investors expect higher returns for bearing higher risks.
The measurement of the portfolio performance starts with the evaluation of each of the
financial instruments in the portfolio. Then, the return of the portfolio and the portfolio manager
(selectivity ability, timing ability) are calculated. These results are compared to a market index or
another example portfolio‘s returns. The risk of attaining these returns is calculated in both absolute
and relative terms so that the returns are risk-adjusted and made comparable. The next step is
Scottish Journal of Arts, Social Sciences and Scientific Studies - ISSN 2047-1278
http://scottishjournal.co.uk
88
determining the contribution of the portfolio manager to the portfolio performance. Finally, the results
are reported according to the legal regulations and announced to the saving owners.
2. Literature Review
The main method that is used in fund performance evaluation is calculating the risk adjusted
return of the evaluated portfolio and comparing this return with a reference. Treynor (1965), Sharpe
(1966), and Jensen (1968) have made the first studies related to fund performance evaluation and
comparison of returns and they have established comparison measures which are at the present day
referred to as traditional. These methods consider performance evaluation in two parts as return and
risk. There are two types of risks in these evaluation methods: market risk (systematic risk) calculated
by beta and total risk of the portfolio (non-systematic risk) calculated by standard deviation.
Fund performance evaluation methods are can be examined in four groups:
Methods based on total risk
Methods based on systematic risk
Methods based on maximum potential loss
Methods based on market timing
The traditional methods that depend on total risk are Sharpe ratio, M2 Performance Measure,
and Sortino ratio. The methods that depend on systematic risk are Treynor ratio, T2 Performance
Measure, Jensen Alpha, and Appraisal Ratio. These methods are referred to as traditional and are
employed in many studies.
Sharpe ratio is adjusted according to CF VAR when using methods depending on maximum
potential loss. This method is developed by Sharma (2006) to capture the higher moments of the
distribution. Fama measure is employed for evaluating the market timing. This method helps to
determine the fund performance depending on the timing and selecting capabilities of the fund
manager.
Sharpe performance indicator (Sharpe, 1966) shows the additional return over risk-free rate
that investors desire when compared with total risk of the portfolio. The increase in the ratio shows the
increase in the risk-adjusted return. M2 measure also depends on total risk but it provides easiness in
the comparison since it is not a ratio like Sharpe. In order to overcome the problem of having
asymmetric return distribution, downside risk is employed in the calculations instead of standard
deviation in Sortino method (Sortino & Price, 1994). On the other side, Treynor ratio is the first model
to evaluate portfolio performance and the calculations depend on systematic risk (Treynor, 1965). T2
measure is defined as the difference between portfolio return and market return and a risk adjustment
is made like in M2 measure.
Jensen Alpha measure defines the difference between the expected return of the evaluated
portfolio and the benchmark portfolio and it evaluates the fund performance with only one value
(Jensen, 1968). This measure is the constant term which is called ‗alpha‘ in the regression analysis
between the fund returns as dependent variables and the market returns as independent variables.
When the fund‘s return is over the risk adjusted average return, alpha shows the amount of return
which is due to the capabilities of the fund manager. If the alpha is positive, the fund is said to be well
managed but if the alpha is negative, the fund performance is said to be poor. Jensen Alpha measure
and Treynor ratio do not take non-systematic risk into account. Appraisal ratio also focuses on this
deficiency by dividing fund‘s alpha by non-systematic risk.
The above mentioned fund performance evaluation methods that rely on systematic and total
risk assume that picking the right stocks is the only important determinant in the fund performance
evaluation. If the fund manager follows a strategy that depends on market timing, these performance
indicators and calculated alphas and betas would all be biased. Thus, two main components are
Scottish Journal of Arts, Social Sciences and Scientific Studies - ISSN 2047-1278
http://scottishjournal.co.uk
89
thoroughly investigated in the fund performance evaluation literature when the relative performance of
mutual funds are assessed: fund manager‘s achievement in stock picking (manager‘s micro forecasting
capability) and fund manager‘s timing capability (macro forecasting) (Cesari & Panetta, 2000). The
most widely used method to assess the mutual fund manager‘s timing capability is using quadratic
regression and analyzing the squared term in the equation as the previous models of Treynor and
Mazuy (1966) and Admati et al. (1986) have suggested:
The excess returns of the market portfolio over risk-free rate are chosen as independent
variables and the excess returns of an individual stock or a portfolio over risk-free rate are chosen as
dependent variables in the regression analysis and the coefficient of the squared term is analyzed in
order to evaluate whether the fund manager‘s timing abilities are sufficient or not. If this coefficient is
positive and statistically significant, it might be concluded that the fund manager‘s market timing
capabilities are sufficient.
Meanwhile, Fama and French (1992,1993) stated that the excess return an individual stock or
the overall stock market provides over a risk-free rate is explained by three factors: (i) The excess
return of market portfolio over risk-free; (ii) The excess return of a portfolio consisting of stocks with
small market capitalization over a portfolio consisting of stocks with big market capitalization5; (iii)
The excess return of a portfolio consisting of stocks with high book-to-market ratio over a portfolio
consisting of stocks with low book-to-market ratio6.
The βiS coefficient provides the sensitivity measure for the excess returns of the fund over risk-
free rate regarding the returns of the SMB portfolio whereas the βiH coefficient provides the sensitivity
measure regarding the returns of the HML portfolio. With the aid of using different portfolios like
SMB and HML rather than using only the benchmark portfolio, different effects of different kind of
portfolios to the fund manager‘s performance can also be evaluated and ‗alphas‘ that consist of more
information can be obtained using this kind of modification in the regression analysis.
Data Envelopment Analysis (DEA) can be defined as a linear programming based method in
which the relative effectiveness of decision making points are evaluated using similar inputs to
provide the necessary output/s. The advantage of DEA over other similar methods is its compatibility
and easiness to evaluate when there are multiple inputs or outputs. The solution methods in DEA are
input-focused or output-focused. If the outputs are held constant and the changes in the inputs are
examined, the solution method can be defined as input-focused, whereas if the inputs are held constant
and the changes in the outputs are examined, the solution method can be defined as output-focused.
There are three main analysis methods that are widely used in DEA:
CCR (Charnes-Cooper-Rhodes) Method
BCC (Banker-Chaenes-Cooper) Method
Summation Methods
Basso and Funari (2001) have used the data of MIBTEL (Milan Stock Exchange) and 47
mutual funds in their performance evaluation based on DEA method and they have also used
systematic risk in addition to total risk as an input in their analysis. In another study that used DEA
analysis (Murthi et al., 1997), commissions and other fund expenses are also used as an input in the
evaluation in order to provide a better definition for an efficient fund.
5 SMB, small minus big
6 HML, high minus low

Scottish Journal of Arts, Social Sciences and Scientific Studies - ISSN 2047-1278
http://scottishjournal.co.uk
90
The type of risk calculations and the nature of the widely used fund performance indicators are
summarized below:
Table 1. Risk calculations and performance indicators of the funds
Fund Performance
Evaluation Methods Sy
stem
atic
ris
k
No
n-s
yst
emat
ic r
isk
Do
wn
sid
e ri
sk
Per
f. I
nd
icat
or
wit
h
co
mp
aris
on
Per
f. I
nd
icat
or
on
its
ow
n
Fu
nd
man
ager
per
form
ance
Sharpe X X X
M2 measure X X X
Sortino X X X X
Treynor X X X
T2 measure X X
Jensen Alpha X X X
Appraisal ratio X X X X
Fama measure X X X X
C X X X
Three Factor Alpha X X X
DEA X X X X
There are numerous empirical studies that examined the risk-return relationships and related
performance levels for mutual funds in Turkey (Erçekin, 1997; Karacabey, 1998; Karacabey, 1999;
Gürsoy and Erzurumlu, 2001; Kılıç, 2002; CanbaĢ and Kandır, 2002; Vuran, 2002; Arslan, 2005;
Yıldız, 2005; Korkmaz and Uygurtürk, 2007; Akel, 2007; Teker et al., 2008; Eken and Pehlivan,
2009).
Karatepe and Karacabey (2000) calculated the performance of nine A-type investment funds
for the period between 1997–1999 using Sharpe, Treynor, Jensen, Graham & Harvey methods. They
have concluded that there is no significant difference between the results of traditional portfolio
evaluation methods and the alternatively developed Graham & Harvey (GH1 and GH2) measures. In
addition, no single one among the nine examined funds has been found to perform better than the
market.
Gürsoy and Erzurumlu (2001) found the treasure bond as the best investment tool among all
periods and sub periods analyzed, followed by ISE 100 index, B-type and A-type funds. The funds
have been found to be performing worse than the market. Kılıç (2002) also analyzed the performance
of investment funds and concluded that generally they don‘t perform better than the market.
CanbaĢ and Kandır (2004) have studied whether the performance of the funds are sustainable
or not and concluded that in Turkey during the periods analyzed the performance of the investment
funds in Turkey were not sustained. In addition to traditional methods, there are also other new
methods used like the Quadratic Regression Analysis (Arslan and Arslan, 2010), variance analysis,
univariate and multivariate regression analyses. Data Envelopment Analysis has also been used in
various studies (Atan et al., 2008)
Arslan (2005) analyzed the performance of the managers‘ market timing performances using
45 A-type investment funds. In his analysis covering four years period (Jan 2002 – Dec 2005) using
daily returns, Arslan (2005) concluded that the resulting rankings coming from different methods used
didn‘t match each other, the β parameters measuring the risk were not stable and the fund betas didn‘t

Scottish Journal of Arts, Social Sciences and Scientific Studies - ISSN 2047-1278
http://scottishjournal.co.uk
91
approximate the market beta. Besides, as a result of the quadratic regression analysis performed to
measure the fund managers‘ timing ability, only three funds‘ C parameters turned out to be positive so
the other fund managers couldn‘t foresee the market changes. To sum up, the analyzed investment
funds‘ managers‘ selectivity and timing abilities turned out to be lower than expected.
As the univariate regression is used for calculating the selectivity ability, quadratic regression
analysis is used as a test for market timing (Arslan and Arslan, 2010). Different from the Jensen
model, there is the C parameter in quadratic regression. the C parameter measures the fund manager‘s
market timing, a positive value showing high ability versus a negative value showing lack of ability.
This model tests the nonlinear relationship between the additional return of the investment fund and
the additional return of the market.
Data Envelopment Analysis (DEA) is an optimization based technique that has the properties
of multiple concepts and/or multiple inputs, allowing the evaluation of the relative performances of
decision units. DEA has been used especially for revealing the relationships that were not discovered
with regression analyses.
DEA had first been developed for the measurement of the relative efficiencies of economic
decision units that are alike in terms of the produced products and services. This method has first been
used in the performance evaluation of the decision units like banks or insurance companies and later
been widely used to evaluate the performance of investment funds. Murthi (1997) first applied this
method onto investment funds‘ performances.
As there is single input – single output in the portfolio theory performance evaluation methods;
there is multiple input – multiple outputs in DEA. Thus, DEA can be called as a multifactorial
efficiency measurement model. When compared to the traditional two dimensional performance
evaluations, DEA performs multidimensional performance evaluation. One advantage of this method
is not needing the analyzer to determine the weights of the inputs and the outputs as opposed to the
other approaches. Another advantage is showing the reason behind the inefficiency of a fund and also
how to approximate the inefficient fund to the optimum level.
Atan et al. (2008) conducted performance evaluation using the Treynor Index and the Sharpe
Ratio, followed by a linear programming based nonparametric efficiency method (DEA) and
comparing the results with traditional methods.
Teker et al. (2008) used the logarithmic returns method as opposed to other studies for
calculating the returns and the predicated reference returns. Because many different investment tools
have been used in the comparison calculations of the analyzed funds, similar investment tools have
been grouped together in the calculation of the reference returns calculations.
Kurun et al. (2008) also calculated four additional ratios in addition to traditional methods and
compared them. Those four ratios were: Information Ratio, Calmar, Cornish Fisher VaR, Up
Percentage and Down Percentage.
Arslan and Arslan (2010) selected three funds among A-type variable funds, B--type variable
funds, A-type variable funds, A-type stock funds and A-type traded funds and calculated the risk
return ratios and relative performance levels using the data from the period of 2006-2010. In addition
to the Sharpe Ratio, M2
measure, Treynor index, Jensen index, Sortino Ratio, T2 Ratio and the
Evaluation Ratio, univariate regression and quadratic regression methods have also been used to
assess the selectivity and timing abilities. The average Domestic Government Bonds returns,
investment funds returns and ISE-100 index returns have been analyzed using MANOVA and
significant difference has been found in the average returns.
The indices or indicator portfolios that are used in the comparison of performance values
should be comparable, appropriate to the structure of the funds or portfolios, reflecting the fund‘s
investment goals and the fund manager‘s approach to risk. There have been various different

Scottish Journal of Arts, Social Sciences and Scientific Studies - ISSN 2047-1278
http://scottishjournal.co.uk
92
indicators used in different studies. Because the traded funds used in the analysis are stock dominant
investment funds, the ISE National 100 index has been used as the indicator index. As the indicator
index for B-type funds, three months Government Debt Securities‘ interest rates for the same period
have been used in some studies (Eken and Pehlivan, 2009). But, Teker et al. (2008) mention that due
to using different types of funds, different comparison measures that serve the best need to be used.
For making up comparison measures, percentage distributions of the investment tools in the funds of a
certain type have been used. Yıldız (2005) warns that using only the ISE index for fund performance
is insufficient in reflecting the real analysis results when the stocks‘ ratio is relatively less in fund
merging. Thus, he used the fund index indicator portfolio developed by the Turkish Institutional
Investment Managers‘ Association and thought to be better suiting the structure of the funds.
There have also been some differences observed in the studies calculating betas. Even though
there is no problem in calculating the betas for liquid funds, there are needs for correction in other
funds. Since bonds and bills, B-type variable and A-type variable benchmarks‘ returns are reflected on
fund prices in T+1 time period, the benchmarks‘ prices in the day of T have been compared with the
prices in the day of T+1 while calculating the betas (Teker et al., 2008).
3. Data and Methodology
In this study, A Type Stock Mutual Funds that are registered with CMB have been sorted
according to their AUMs and 12 A Type Stock Mutual Funds with the greatest AUMs have been
chosen. Weekly closing prices of the funds between May 2007 – September 2011 have been retrieved
from the official website of CMB of Turkey. ISE 100 National Index was not chosen directly as the
benchmark portfolio that is used for comparison in the performance evaluation as the market index. A
weighted market index which is more convenient for the comparison of A Type Stock Mutual Funds
has been formed for the benchmark portfolio consisting of %70 ISE 100 National Index, %25 KYD
O/N Interest rate, and %5 KYD TL Bond Index (182 days). KYD Index series have been retrieved
from the official site of Turkish Institutional Investment Managers‘ Association and ISE 100 National
Index closing prices have been obtained from Finnet Financial Data Service.
Closing market prices of the mutual funds at the end of each week have been compared with
the previous week and logarithmic function has been used to calculate the weekly returns of the funds.
The arithmetic average of these weekly returns have been used as the expected returns for these
mutual funds in the performance evaluation calculations. The weekly returns and expected return of
the benchmark portfolio has also been calculated similar to the calculations for mutual funds.
Regression analysis has been used for the calculation of the mutual fund betas. The regression
line that represents the changes of a security‘s return relative to the market portfolio‘s return is called a
security‘s characteristic line which is stated as below:
E(R) = Rf + (Rm – Rf) x β
According to this characteristic equation, the excess returns of the mutual fund and the
benchmark portfolio over the risk-free rate have been included in the regression analysis and the
related beta and alpha values have been calculated accordingly.
The overnight interest rate of Central Bank of the Republic of Turkey (CBT) has been used as
the risk-free interest rate in the calculations. The standard deviations of the weekly returns of the
mutual funds and benchmark portfolio have been used as an indicator of risk in the performance
evaluation calculations.
First, the expected returns (the average of the weekly returns) and risks (the standard deviation
of the weekly returns) have been calculated for the 12 chosen mutual funds and the benchmark
portfolio and used in the comparison methods that are widely employed in the literature. In addition to

Scottish Journal of Arts, Social Sciences and Scientific Studies - ISSN 2047-1278
http://scottishjournal.co.uk
93
comparison methods like Sharpe and M2 which are based on total risk, performance evaluation
methods that depend on systematic risk (beta) like Treynor, Jensen, Appraisal ratio and Fama have
also been employed in the study. Quadratic regression analysis has also been used in order to evaluate
the timing capabilities of the fund manager and a new alpha has been calculated in addition to Jensen
alpha based on the Fama-French 3 Factor model to test whether the manager achieved higher return
when compared with more than one factor portfolio. Moreover, other than these parametric methods, a
non parametric method as Data Envelopment Analysis is also employed and the results are reported
along comparison with other performance indicators.
4. Analysis and Results
Ticker symbols and the names of the mutual funds are listed in Table 1. The performance
indicators are presented in Table 2. The ‗*‘ notation is used to state the statistical significance of the
alphas, betas and C values which are calculated with least squares method (*: %5, **: %1). The
ranking of the 12 A Type Stock Mutual Funds are presented in Table 3.
Table 2. The ticker symbols and the names of the A Type Stock Mutual Funds in the study
S
TH
STRATEJĠ MENKUL DEĞERLER A.ġ. A TĠPĠ RĠSK YÖNETĠMĠ HĠSSE SENEDĠ
FONU
A
K3 AKBANK T.A.ġ. A TĠPĠ HĠSSE SENEDĠ FONU
T
I2 T.Ġġ BANKASI A.ġ. A TĠPĠ HĠSSE SENEDĠ FONU
G
HS T.GARANTĠ BANKASI A.ġ. A TĠPĠ HĠSSE SENEDĠ FONU
T
YH TEB INVESTMENT MENKUL DEĞERLER A.ġ. A TĠPĠ HĠSSE SENEDĠ FONU
H
VS HSBC BANK A.ġ. A TĠPĠ HĠSSE SENEDĠ FONU
F
AF FĠNANSBANK A.ġ. A TĠPĠ HĠSSE SENEDĠ FONU
Y
HS YAPI and KREDĠ BANKASI A.ġ. A TĠPĠ HĠSSE SENEDĠ FONU
E
CH ECZACIBAġI MENKUL DEĞERLER A.ġ. A TĠPĠ HĠSSE SENEDĠ FONU
I
GH ING BANK A.ġ. A TĠPĠ HĠSSE SENEDĠ MUTUAL FUND
E
FH
EFG ĠSTANBUL EQUĠTĠES MENKUL DEĞERLER A.ġ. A TĠPĠ HĠSSE SENEDĠ
F.
T
AH TEKSTĠL BANKASI A.ġ. A TĠPĠ HĠSSE SENEDĠ FONU
A
SA ALTERNATĠFBANK A.ġ. A TĠPĠ HĠSSE SENEDĠ FONU
F
AS
FORTIS INVESTMENT MENKUL DEĞERLER A.ġ. A TĠPĠ HĠSSE SENEDĠ
FONU
G
KP
GLOBAL MENKUL DEĞERLER A.ġ. A TĠPĠ KAR PAYI ODAKLI HĠSSE
SENEDĠ FONU
Table 3. The performance indicators calculated for each fund in the study
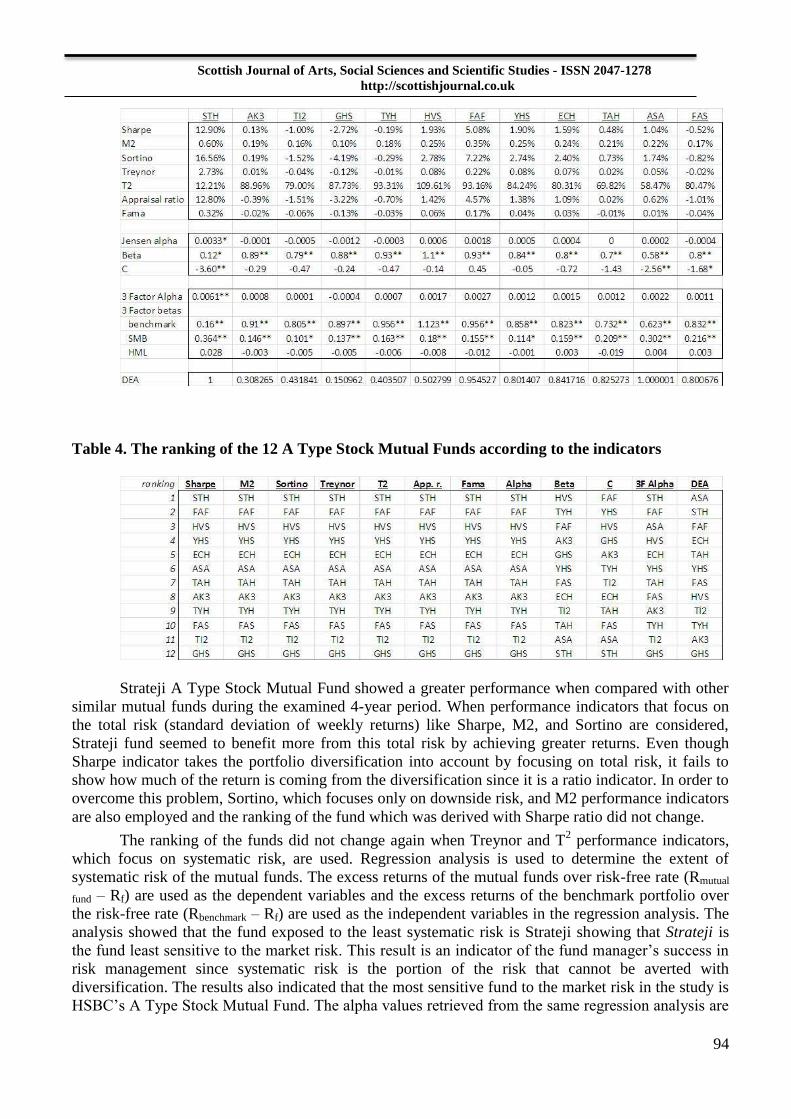
Scottish Journal of Arts, Social Sciences and Scientific Studies - ISSN 2047-1278
http://scottishjournal.co.uk
94
Table 4. The ranking of the 12 A Type Stock Mutual Funds according to the indicators
Strateji A Type Stock Mutual Fund showed a greater performance when compared with other
similar mutual funds during the examined 4-year period. When performance indicators that focus on
the total risk (standard deviation of weekly returns) like Sharpe, M2, and Sortino are considered,
Strateji fund seemed to benefit more from this total risk by achieving greater returns. Even though
Sharpe indicator takes the portfolio diversification into account by focusing on total risk, it fails to
show how much of the return is coming from the diversification since it is a ratio indicator. In order to
overcome this problem, Sortino, which focuses only on downside risk, and M2 performance indicators
are also employed and the ranking of the fund which was derived with Sharpe ratio did not change.
The ranking of the funds did not change again when Treynor and T2 performance indicators,
which focus on systematic risk, are used. Regression analysis is used to determine the extent of
systematic risk of the mutual funds. The excess returns of the mutual funds over risk-free rate (Rmutual
fund – Rf) are used as the dependent variables and the excess returns of the benchmark portfolio over
the risk-free rate (Rbenchmark – Rf) are used as the independent variables in the regression analysis. The
analysis showed that the fund exposed to the least systematic risk is Strateji showing that Strateji is
the fund least sensitive to the market risk. This result is an indicator of the fund manager‘s success in
risk management since systematic risk is the portion of the risk that cannot be averted with
diversification. The results also indicated that the most sensitive fund to the market risk in the study is
HSBC‘s A Type Stock Mutual Fund. The alpha values retrieved from the same regression analysis are
Scottish Journal of Arts, Social Sciences and Scientific Studies - ISSN 2047-1278
http://scottishjournal.co.uk
95
the indicators of whether the fund managers achieved greater returns than the expectations. When the
Jensen Alphas of the funds in the study are analyzed, it has been found out that Strateji A Type Stock
Mutual Fund is the only one that have a significant alpha both statistically and practically. Treynor
ratio and Jensen Alpha performance indicators disregard the importance of the fund manager‘s
capability of portfolio diversification since only systematic risk is used in the calculations. This
shortcoming is compensated by using Fama criterion in performance evaluation but the performance
ranking among the mutual funds in the study did not change.
The excess returns of the benchmark portfolio over risk-free rate are chosen as independent
variables and the excess returns of the fund returns over risk-free rate are chosen as dependent
variables in the quadratic regression and the ‗C‘ coefficients (coefficient of the squared term) are
calculated. For the examined period and the 12 A Type Stock Mutual Funds, only Finansbank A Type
Stock Mutual Fund has a positive C coefficient but that coefficient is not statistically significant. The
remaining funds have negative C coefficients which are also statistically not significant and these
results showed that the managers of the funds which are evaluated in the study during the regarding
period lack the ability to time their decisions against the sudden moves in both the stock and bond
market.
Similar with the previous regression analysis, the returns of the benchmark portfolio are
chosen as the market portfolio returns for the first factor in the regression analysis based on Fama-
French 3 Factor model that has been mentioned before. The SMB returns are calculated through
forming small and big portfolios by sorting the stocks in the ISE National 100 Index according to their
market capitalization and dividing them into two groups as small and big ones. Then, the difference of
the returns of these two portfolios are used as SMB returns in the regression analysis. The HML
returns are calculated similarly with SMB returns but this time the sorting of the stocks in ISE index
are carried out according to their book-to-market ratio and the difference of the returns of the two
portfolios are chosen as HML returns. All the portfolios in the SMB and HML calculations are equally
weighted portfolios similar to the previous studies. When the newly calculated alphas are examined,
all the funds except Garanti Bankası A Type Stock Mutual Fund have a positive alpha but only the
alpha of the Strateji A Type Stock Mutual Fund seems to be statistically and practically significant. It
is also observed that while all the βiS coefficients are statistically significant for all the funds, βiH
coefficients are statistically insignificant. These results indicated that a high book-to-market ratio
premium does not have a significant effect on the fund returns whereas small market capitalization has
a significant effect during the examined period.
The DEA analysis in this study uses CCR method in order to evaluate the performance of A-
Type Stock Mutual Funds in Turkey and uses CCR method and employs the funds‘ betas (systematic
risk), standard deviation of funds‘ returns (total risk) and the fund manager commissions as inputs,
whereas funds‘ expected returns are employed as outputs. The commissions are calculated based on
the total AUM of the funds and the percentage of fees and commissions that are paid to the fund
manager. After establishing each group of linear equations for each fund and determining which
variables should be maximized, the coefficients are calculated with Microsoft Excel Solver Function
and performance indicator for each fund is computed. Since a different approach which maximizes the
ratio of the inputs and outputs is used in DEA besides other parametric performance evaluation
methods, a different ranking of the funds according to their performances is observed. According to
the DEA results, Strateji and Alternatifbank A-Type Stock Mutual Fund are the two successful and
efficient funds.
These results indicated that considering the risk indicators and the commission amounts that
the funds have, two funds are managed more efficiently than the other 10 funds that are evaluated in
the study. Eken and Pehlivan (2009) also employed DEA in their study evaluating the Turkish Mutual
Fund performances and used skewness and kurtosis as inputs in addition to fund alphas, betas and

Scottish Journal of Arts, Social Sciences and Scientific Studies - ISSN 2047-1278
http://scottishjournal.co.uk
96
standard deviations but they have not included the fund expenses and commissions as inputs. The
DEA analysis they employed give the same ranking for the most and least efficient fund as parametric
performance indicators do which is similar to the results in this study.
5. Conclusion and Further Study
It is known that the trading volume of the fund and the number of shares in the circulation also
affect the returns of a mutual fund. Thus, determining a mutual fund‘s returns solely depending on the
beta or standard deviation might be inadequate for performance evaluation. Another issue that must be
considered in fund performance evaluation is survivalship bias since some funds might be in the
market for only a specific period of time. In addition to performance indicators that focus on total and
systematic risk, market timing model with quadratic regression and Fama-French 3-Factor Model are
used in this study for the comparisons among the A-Type Stock Mutual Funds. Beside these
parametric methods, a non parametric method as DEA is also employed and similar results to the
parametric methods have been found. When the rankings of the parametric and non parametric
methods have been compared by implementing a Spearman's Coefficient of Rank Correlation Test, the
results can be examined on the Table in Appendix A as the correlation is 0.706 and statistically
significant.
When monthly closing prices of A-Type Stock Mutual Funds since 2007 have been used to
form an index relative the Market Index and examined empirically, it is found that Strateji A-Type
Stock Mutual Fund achieved higher performance than not only the whole other funds but also the
weighted average index according to the funds‘ AUMs as the graph in the Appendix B indicates.
These results are in line with the results of the performance evaluation methods in this study. When
the results in this study are compared with previous studies, it is observed that they are similar. When
it is considered that Strateji A-Type Stock Mutual Fund did not exist before May 2006, it is an
expected case that Finansbank A-Type Stock Mutual Fund is the fund with the top performance in the
2005 study (Yıldız, 2005) that examined the A-Type Stock Mutual Funds in Turkey during that
period. With the aid of the new methods employed in this study, the underperformance of some of the
funds examined in the 2005 study has been indicated with the performance evaluation analysis carried
out in this study.
For further study, in addition to the performance evaluation methods used here, M2 and T
2
performance indicators can be more generalized by considering not only the market portfolio but also
other factors. GM2 and GT
2 (generalized M
2 & generalized T
2) methods can be employed and the
funds‘ performances can be evaluated with a much broader context. Additionally, Fama-French 3
Factor model can be improved in order to check whether other market anomalies have different effects
on the fund performance and whether the fund manager is benefiting from these anomalies for getting
higher returns. Other inputs which have direct effects on fund performance such as risk indicators and
commissions can be researched for DEA. The performance calculations can be carried out again with
new inputs and their effects on the fund performance can be compared with previously used inputs.
Scottish Journal of Arts, Social Sciences and Scientific Studies - ISSN 2047-1278
http://scottishjournal.co.uk
97
6. References
Admati, A. R., Bhattacharya, S., Ross, S. A., & Pfleiderer, P. (1986). On Timing and
Selectivity. The Journal of Finance, 41:3, 715-730.
Akel, V. (2007). Türkiye‘deki A Ve B Tipi Yatırım Fonları Performansının Devamlılığının
Parametrik Ve Parametrik Olmayan Yöntemlerle Değerlendirilmesi. Dokuz Eylül Üniversitesi
İktisadi ve İdari Bilimler Fakültesi Dergisi, 22:2, 147-177.
Arslan, M. & Arslan, S. (2010). Yatırım Fonu Performans Ölçütleri, Regresyon Analizleri ve
MANOVA Yöntemine Göre A, B ve Borsa Yatırım Fonlarının KarĢılaĢtırmalı Analizi. İşletme
Araştırmaları Dergisi, 2/2, 3-20.
Atan, M., Atan, S., & Özdemir, Z.A. (2008). Türkiye‘deki Bazı Yatırım Fonlarının
Performanslarının Değerlendirilmesi. Gazi Üniversitesi İktisadi ve İdari Bilimler Fakültesi
Dergisi 10 / 2, 47-67.
Basso, A., & Funari, S. (2001). A Data Envelopment Analysis Approach to Measure the
Mutual Fund Performance. European Journal of Operational Research, 135:3, 477-492.
CanbaĢ, S., & Kandır, S. K. (2002). Türkiye‘deki Yatırım Fonlarının Performans
Değerlendirmesi. İktisat İşletme ve Finans Dergisi, 17:201, 13-19.
Cesari, R., & Panetta, F. (2002). The Performance of Italian Equity Funds. Journal of Banking
& Finance, 26, 99-126
Doğanay, M. (2004). Hisse Senedi Fonlarının Cok Kriterli Karar Yaklasımıyla
Derecelendirilmesi. A.Ü. SBF Dergisi, 57(3): 35.
Eken, M. H., & Pehlivan, E. (2009). Yatırım Fonları Performansı Klasik Performans Ölçümleri
ve VZA Analizi. Maliye Finans Yazıları, 83, 85-114.
Erçekin, A. (1997). Yatırım Fonları ve Performans Değerlendirmesi. (Master‘s Thesis).
Ġstanbul Teknik Üniversitesi Sosyal Bilimler Enstitüsü, Ġstanbul.
Fama, E. F., & French, K. R. (1992). The Cross-Section of Expected Stock Returns. Journal
of Finance, 47:2, 427-465.
Fama, E. F., & French, K. R. (1993). Common Risk Factors in the Returns on Stocks and
Bonds. Journal of Financial Economico, 33:1, 3-56.
Gürman, T. (1995). Dünya‘da ve Türkiye‘de Yatırım Fonları: Teori ve Uygulama. Türkiye İş
Bankası Kültür Yayınları, Genel Yayın No:342, Ankara.
Gürsoy, C. T., & Erzurumlu, Y. Ö. (2001). Evaluation of Portfolio Performance of Turkish
Investment Funds. Doğuş Üniversitesi Dergisi, 4, 43-53.
Jensen, M. (1968). The Performance of Mutual Funds in the Period 1945-1964, Journal of
Finance, 23:2, 389 – 416
Karacabey, A. A. (1998). A Tipi Yatırım Fonları: Performanslarının Analizi ve
Değerlendirilmesi. Mulkiyeliler Birliği Vakfı Yayınları, Ankara
Karacabey, A. A. (1999). Yatırım Fonlarının Zamanlama Çabalarının Seçicilik Kabiliyetlerine
Etkisinin Değerlendirilmesi. Iktisat Isletme ve Finans, 14:164, 76-86.
Karacabey, A.A., & Kartepe, Y. (2000). A Tipi Yatırım fonları Performansının Yeni Bir
Yöntem Kullanılarak Değerlendirilmesi. Ankara, Mülkiyeliler Birliği Vakfı Yayınları: 21.

Scottish Journal of Arts, Social Sciences and Scientific Studies - ISSN 2047-1278
http://scottishjournal.co.uk
98
Kılıç, S. (2002). Türkiye‘deki Yatırım Fonlarının Performanslarının Değerlendirilmesi. İMKB
Yayınları, Ankara.
Korkmaz, T., & Uygurtürk, H. (2007). Türk Emeklilik Fonlarının Performans Ölçümünde
Regresyon Analizinin Kullanılması, ZKÜ Sosyal Bilimler Dergisi, 3:5, 37–52.
Kurun, E., Akçay, B., Dayıoğlu, A., & Yücel, S. (2008). Yatırım fonlarının Performans
Analizinde Kullanılan Risk Bazlı Bazı Ölçüm Teknikleri ve Türk Yatırım Fonları Üzerine Bir
Uygulama, http://bsy.marmara.edu.tr/Konferanslar/2008/23.pdf
Murthi, B. P. S., Choi, Y. K., & Desai, P. (1997). Efficiency of Mutual Funds and Portfolio
Performance measurement: A non-parametric Approach. European Journal of Operational
Research, 98, 408-418.
Sharpe, W. F. (1966). Mutual Fund Performance, Journal of Business, 39:1, 119-138.
Teker, S., Karakum, E., & Tav O. (2008). Yatırım Fonlarının Risk Odaklı Performans
Değerlemesi, Doğuş Üniversitesi Dergisi, 9:1
Treynor, J. L. (1965). How to Rate Management Investment Funds, Harvard Business Review,
43:1, 63-75.
Treynor, J., & Mazuy, K. (1966). Can Mutual Funds Outguess the Market. Harvard Business
Review, 44, 131-136
Vuran, B. (2002). Türkiye’de Yatırım Fonları ve Performans Değerlendirmesi ile İlgili Bir
Uygulama. (Master‘s Thesis). Ġstanbul Üniversitesi Sosyal Bilimler Enstitüsü, Ġstanbul.
Yıldız, A. (2005). A Tipi Yatırım Fonları Performanslarının Ġmkb Ve Fon Endeksi Bazında
Değerlendirilmesi. Muğla Universitesi SBE Dergisi, 14, 185- 202.
Appendix A
Spearman's Coefficient of Rank Correlation Test (Non parametric correlation)
Correlations
Para DEA
Spearman's rho Para Correlation Coefficient 1.000 .706(*)
Sig. (2-tailed) . .010
N 12 12
DEA Correlation Coefficient .706(*) 1.000
Sig. (2-tailed) .010 .
N 12 12
* Correlation is significant at the 0.05 level (2-tailed).

Scottish Journal of Arts, Social Sciences and Scientific Studies - ISSN 2047-1278
http://scottishjournal.co.uk
99
Appendix B

Scottish Journal of Arts, Social Sciences and Scientific Studies - ISSN 2047-1278
http://scottishjournal.co.uk
100
Gender Difference and Marital Status in
Organisational Role Stress Among Medical
Doctors.
Dr Pia Muriel Cardoso.
DGO, MD, FICS, FICOG.
Research Scholar, Dept of Management Studies, Goa University.
Assistant Professor, Dept of Obstetrics and Gynaecology, Goa Medical College.
Tel: (0091)9823169350.
Email: [email protected]
Dr R. Nirmala. MBA, PhD.
Assistant Professor,
Dept of Management Studies, Goa University.
Tel: (0091)09923000060.
Email: [email protected]
Abstract:
This research investigates the relationship between Gender, Marital Status and Organizational Role
stress among medical doctors in Goa. Ten types of role stress were measured using ORS scale. The
total sample of 454 was divided on the basis of Men and Women Doctors for gender analysis, and
Married and Unmarried for Marital status. Two hypotheses were tested using t- test. Results revealed
significant difference in Gender and Marital status analysis.
Keywords: Gender, Marital Status & Role Stress.

Scottish Journal of Arts, Social Sciences and Scientific Studies - ISSN 2047-1278
http://scottishjournal.co.uk
101
Introduction:
Medical doctors, as well as dentists, are known to be groups of people with high stress
occupations, along with other professionals such as pilots, police and mine workers (Cooper et al.
1989). The inclusion of responsibility for ―people‖ and the fact that every action they undertake has a
powerful impact on human life offers sufficient evidence of high stress (Caplan et al., 1975; Antoniou,
2001). Stress can be understood as the physical, emotional and mental strain resulting from a gap in
the person –environment fit. This has a three way relationship between demands on a person, the
persons feeling about those demands and their ability to use resources to cope with demands made.
(Richards C 1989). Moreover since doctors are continually evaluated by clients, patients and
colleagues, errors are highly visible with high embarrassment and mental turbulence for patients as
well as doctors (Payne and Firth- Cozens 1987).
Review of Literature
Doctors have been shown to have relatively high levels of occupational stress in comparison
with other professionals.The proportion of doctors and other health professionals showing above
threshold levels of stress has stayed at around 28%, compared to 18% in the general working
population. (Firth-Cozens,2003). Arguably, stress in medical professionals has potentially most
serious consequences for the individual and the community. The doctor‘s role in the community is
central, being the ‗gatekeeper‘ to a wide range of medical provisions and services. The stress and
strain in medical professionals is likely to affect their work performance, including the quality of
patient consultations and prescribing, as well as adversely affect their own personal and family life.
Challenges like patient overload, loss of autonomy, loss of respect, lower reimbursements, and
bureaucratic red tape create a hostile environment for medical professionals that are so intense that
three-fourths of doctors report having stress-related problems. Symptoms like fatigue, emotional
burnout, marital and family discord, and even clinical depression regularly afflict more than half of
doctors. The problems are so pervasive that 60% of doctors report having considered leaving the
medical profession (Grenmy 2006).There is a paucity of survey research on stress in the medical
profession in India. (Pestonjee, 1999). The relationship of marital status and role stress and coping has
been studied by Chaturvedi (2009) who in his study of coping behavior of female teachers found that
married teachers in the 40 to 60 years group cope better with job stress. In a study of doctors
occupying any level of the social roles i.e. unmarried, or married, they did not differ significantly from
each other in terms of experiencing role conflict. (Malhotra and Sachdeva 2005).Gabbard et al (1987)
investigating the sources of marital conflict in the traditional marriages of male physicians with female
non-physician spouses, demonstrated that the time spent away from the family was the second most
important reason for conflict.Although research has begun to identify the major stressors for health
professionals, the majority of this research has failed to differentiate between the stressors of men and
women, assuming occupational stress for each is synonymous. When gender is addressed it tends to
be as an afterthought rather than as a critical variable which is built into the research design. This
omission in research must be seen against a backdrop in which women in medicine can be found in
rapidly increasing numbers. Today, women make up over 50 per cent of those entering medical school
(Audit Commission, 1995).
Little attention has been given to the question of whether these women share the same
experience of occupational stress as their male counterparts. Hendrix et al. (1994) claimed that
working women are affected by stressors which are common to both sexes, but also others which are
unique to women. Following a review of the literature, Firth-Cozens (1990) reported that studies
which have focused specifically on female doctors have revealed increased stress arising from
prejudice, lack of role models and career conflict. Conflict between their work and personal lives
seems to have been particularly stressful for female doctors.(Chambers and Campbell 1996),(Bynoe
1994) and Rout (1996). Females experienced more stress than males from visiting during adverse

Scottish Journal of Arts, Social Sciences and Scientific Studies - ISSN 2047-1278
http://scottishjournal.co.uk
102
weather conditions, fear of assault on night visits, finding a locum, the working environment, lack of
emotional support at home, and dealing with friends or relatives as patients. A survey by Swanson et
al. (1996) found lower stress and higher job satisfaction levels in female general practitioners
compared to their male counterparts. Yet female consultants were found to experience more work-
related stress than their male colleagues. Consultants were also reported to be significantly more
stressed than GPs on sub-scales of "extrinsic stressors, concerns about management structure, working
relationships and achievement". Swanson concluded women were still experiencing difficulties with
career advancement in hospital medicine. These reports must surely have strong implications for the
future of hospital medicine. The differential pressures and motivators for women doctors across
medical specialties can no longer be neglected. This is particularly true in the light of recent studies
revealing women to be more strongly motivated to study medicine and placing a greater value on
teamwork, clinical responsibility and being valued by patients, than their male colleagues (BMA,
1992).
More recently, Parkhouse and Ellin (1988) have suggested that gender-linked stress can lead
women doctors to make important compromises between their personal lives and careers. He reported
that women are more likely than men to enter a specialty which is not their first choice . Many women
encountered a stage in which they contemplated leaving the rigid structure of hospital medicine for the
greater flexibility of general practice. (White 1997).This must surely have unfavourable implications
for the future of hospital medicine. As Godley (1990) claimed, "women have proved their intelligence,
competence and commitment. Those who have reached the top are justifiably proud of their success in
a 'man's world'. But more should be done to remove the additional barriers to women in medicine and
to make it as easy, or as difficult, as it is for men". By contrast, according to Dasgupta and S. Kumar
(2009), male doctors are more stressed than female doctors in the areas of Inter-role Distance and Role
Inadequacy. They also found that Role Overload is the most significant source of stress in hospital
doctors.In Scotland, male doctors in a sample of dual career families of doctors,perceived their work
as more stressful and less satisfying than females (Swanson and Power,1999).
Hypothesis
H1 There will be significant difference between the stress level of married and single
medical doctors in the organizational role stress.
H2 There will be significant difference between the stress level of male and female
medical doctors in the organizational role stress
Methodology
The survey research design was utilized for this study. The sample for this study consisted of
454 doctors from Goa, consisting of public sector employees from Goa Medical College, Primary
Health Centres and District Hospitals in Goa.. The questionnaire was divided into two parts; the first
part was designed to capture the demographic responses. The second part was the ORSS
(Organizational Role Stress Scale) questionnaire. Gender difference was calculated by dividing the
sample based on men and women doctors, while marital status was analyzed between married and
unmarried doctors.
Tool
Organizational Role Stress (ORS) was measured with the help of an ORS-scale (Pareek, 1983).
The scale comprises 50 items. The respondents rate each item as 0, 1, 2, 3 and 4 depending on the
item‘s applicability to their organizational role (0 for rarely/not applicable and 4 for nearly
always/very frequently applicable. The scale measures the following ten role stressors. The score for
each role stressor (in the range 0-20) is obtained by adding the scores of five pre-assigned items.
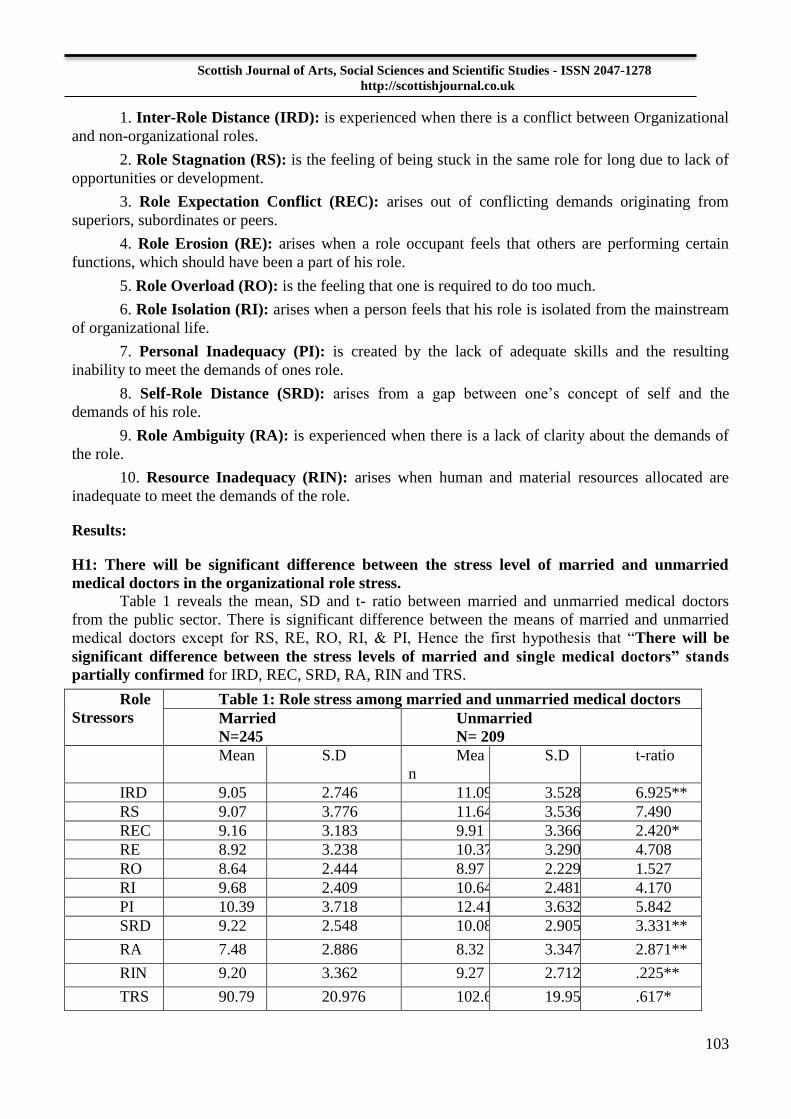
Scottish Journal of Arts, Social Sciences and Scientific Studies - ISSN 2047-1278
http://scottishjournal.co.uk
103
1. Inter-Role Distance (IRD): is experienced when there is a conflict between Organizational
and non-organizational roles.
2. Role Stagnation (RS): is the feeling of being stuck in the same role for long due to lack of
opportunities or development.
3. Role Expectation Conflict (REC): arises out of conflicting demands originating from
superiors, subordinates or peers.
4. Role Erosion (RE): arises when a role occupant feels that others are performing certain
functions, which should have been a part of his role.
5. Role Overload (RO): is the feeling that one is required to do too much.
6. Role Isolation (RI): arises when a person feels that his role is isolated from the mainstream
of organizational life.
7. Personal Inadequacy (PI): is created by the lack of adequate skills and the resulting
inability to meet the demands of ones role.
8. Self-Role Distance (SRD): arises from a gap between one‘s concept of self and the
demands of his role.
9. Role Ambiguity (RA): is experienced when there is a lack of clarity about the demands of
the role.
10. Resource Inadequacy (RIN): arises when human and material resources allocated are
inadequate to meet the demands of the role.
Results:
H1: There will be significant difference between the stress level of married and unmarried
medical doctors in the organizational role stress.
Table 1 reveals the mean, SD and t- ratio between married and unmarried medical doctors
from the public sector. There is significant difference between the means of married and unmarried
medical doctors except for RS, RE, RO, RI, & PI, Hence the first hypothesis that ―There will be
significant difference between the stress levels of married and single medical doctors” stands
partially confirmed for IRD, REC, SRD, RA, RIN and TRS.
Role
Stressors
Table 1: Role stress among married and unmarried medical doctors
Married
N=245
Unmarried
N= 209
Mean S.D Mea
n
S.D t-ratio
IRD 9.05 2.746 11.09 3.528 6.925**
RS 9.07 3.776 11.64 3.536 7.490
REC 9.16 3.183 9.91 3.366 2.420*
RE 8.92 3.238 10.37 3.290 4.708
RO 8.64 2.444 8.97 2.229 1.527
RI 9.68 2.409 10.64 2.481 4.170
PI 10.39 3.718 12.41 3.632 5.842
SRD 9.22 2.548 10.08 2.905 3.331**
RA 7.48 2.886 8.32 3.347 2.871**
RIN 9.20 3.362 9.27 2.712 .225**
TRS 90.79 20.976 102.6 19.95 .617*

Scottish Journal of Arts, Social Sciences and Scientific Studies - ISSN 2047-1278
http://scottishjournal.co.uk
104
7 4
*P<.05, **P<.01
H2 There will be significant difference between the stress level of men and women medical
doctors in the organizational role stress.
Table 2 reveals the mean, SD and t- ratio between men and women medical doctors from the
public sector. There is significant difference between the means of men and women doctors except for
RE, RI, and PI. Hence the second hypothesis that ―There will be significant difference between the
stress levels of male and female medical doctors” stands confirmed except for RE, RI and PI.
Role
Stressors
Table 2: Test of significant difference of Gender and role stress among
medical doctors
Male
N= 233
Female
N=221
Mean S.D Mea
n
S.D t- ratio
IRD 8.64 2.776 11.76 3.150 -11.175**
RS 8.58 3.532 12.44 3.144 -12.326**
REC 7.95 2.443 11.26 3.242 -12.219**
RE 8.29 2.964 11.20 3.059 -10.299
RO 7.88 2.212 9.81 2.035 -9.636**
RI 9.50 2.465 10.94 2.305 -6.426
PI 9.27 3.130 13.82 2.962 -15.899
SRD 8.16 2.077 11.29 2.501 -14.490**
RA 6.71 2.667 9.22 3.150 -9.120**
RIN 8.91 3.420 9.57 2.512 -2.352**
TRS 83.83 18.463 111.3
1
13.45
8
-18.188**
*P<.05, **P<.01
Discussion
The first hypothesis that ―There will be significant difference between the stress level of
married and unmarried medical doctors in the organizational role stress stands confirmed except for
RS, RE, RO, RI, & PI.
The Second hypothesis that ―There is a significant difference in the organizational role stress
among male and female doctors‖ stands confirmed except for RE, RI and PI .
This implies that there is a considerable difference in the level of role stress among men and
women doctors.Women doctors have a higher level of role stress.Also unmarried doctors have more
role stress as compared to married doctors. While this is consistent with earlier studies (Abrol 1990;
Olsson et al., 1990), it is noticed that men compared to women deal more patiently amidst crisis
(Thoits 1995). Women generally tend to lose concentration and reveal their feeling and usually seek
emotional and social support (Thoits, 1995) More stress among unmarried officers may be owing to
their comparative lack of security, resulting in higher self esteem, autonomy, and self actualization
needs. It may often lead to clashes and interpersonal conflicts (Sen – 1981).

Scottish Journal of Arts, Social Sciences and Scientific Studies - ISSN 2047-1278
http://scottishjournal.co.uk
105
Conclusion
The results of the above study point to the fact that stress affects all categories of doctors
irrespective of their sex or marital status. However the study reveals that there is considerable
difference in the role dimension between men and women medical doctors. It is further noticed that
women doctors experience higher role stress compared to the men doctors.Also the study reveals that
unmarried doctors have higher role stress than married doctors.With the emerging economic crisis as
more and more unmarried doctors and women doctors add to the medical workforce, it is imperative
to formulate appropriate measures to support a stress free work life.

Scottish Journal of Arts, Social Sciences and Scientific Studies - ISSN 2047-1278
http://scottishjournal.co.uk
106
References
Abrol K K (1990), ―A Study of Language Strain and Coping Behavior of Teachers‖,
Psycho-Lingua Studies, Vol. 6, No. 2, pp. 201-210
Antoniou ,A.S.(2001),‖Occupational stress: acute and chronic stress
factors‖.Eleftherotypia,Vol 100,special issue on ―Occupational stress: the secret enemy‖.
Audit Commission (1995). The Doctor‘s Tale, HMSO, London
British Medical Association (1992), Stress and the Medical Profession, BMA, London.
Bynoe G. (1994). Stress in Women Doctors. Br J Hosp Med. 51(6): 267-8.
Caplan,R.D., Cobb,S.,French, J.R.P.,Harrison R.V. and Pinneau,S.R (1975),Job Demands and
Worker Health: Main Effects and Occupational Difference, HEW PublicationsNo( NIOSH),US
Department of Health,Education and Welfare, Washington,DC,pp 75-160.
Chambers, R., & Campbell I.(1996). Anxiety and depression in general practitioners:
associations with type of practice, fundholding, gender and other personal characteristics. Fam
Pract. 13(2):170-3.
Chaturvedi M, Purushothaman T.Coping Behaviour of Female Teachers: Demographic
determinants.Industrial Psychiatry Journal 2009.Vol 18,1,36-38
Cooper, C.L, Rout, U., Faragher ,B. (1989). Mental health, job satisfaction and job stress
among general practitioners. British Medical Journal ,298:366-70.
Dasgupta, H. & Kumar, S.(2009). Role Stress among doctors working in a Government
Hospital in Shimla(India). European Journal of Social Sciences-Vol 9 Number3.
Firth-Cozens, J. (1990, "Sources of stress in women house officers", British Medical Journal,
Vol. 301, pp. 89-91.
Firth Cozens J. Doctors, their wellbeing and their stress. BMJ 2003;326:670-1.
Gabbard, G.B, Menninger M.D and Coyne L. (1987).‖Sources of conflict in the medical
marriage‖. American Journal of Psychiatry,Vol 144,pp5672-7.
Godley,F.(1990) ―Stress in women doctors‖, British medical Journal, Vol 301, p.76.
Grenmy J.‖ Speak up or Burn out‖. The Physician Executive 2006; Nov-Dec:24-28.
Haslam S A and Reicher S (2006), ―Stressing the Group: Social Identity and the Unfolding
Dynamics of Responses to Stress‖, Journal of Applied Psychology, Vol. 91, p. 1037.

Scottish Journal of Arts, Social Sciences and Scientific Studies - ISSN 2047-1278
http://scottishjournal.co.uk
107
Hendrix, W.H., Spencer, B.A. and Gibson, G.S. (1994, "Organisational and extra-
organisational factors affecting stress,employee wellbeing and absenteeism for males and
females", Journal of Business and Psychology, Vol. 9, pp. 103-28.
o, J.M
Malhotra S., and Sachdeva S (2005). Social Roles and Role Conflict:An Interprofessional
Study among Women.Journal of the Indian Academy of Applied Psychology,Jan-July
2005,Vol.31,No.1-2,37-42.
Olsson K, Kandolin I and Kauppinen K (1990), ―Stress and Coping Strategies of Three
Shift Workers‖, Le Travail Humain, Vol. 53, pp. 175-188
Pareek Udai (1983).Organizational Role Stress Scale. In L.D Goodstein and J.W Pfeiffer
(Eds.).The 1983 Annual for facilitators,trainers,and Consultants (pp 119-123).San
Diego,Calif:University Association.
Parkhouse, J. and Ellin, D. (1988, "Reasons for doctors career choice and change of choice",
British Medical Journal, Vol. 296, pp. 1651-3.
Payne R and Firth-Cozens J.(eds) 1987.Stress in health Professionals. Wiley, Chichester.
Pestonjee D M and Misra P K (1999), ―Role Stress and Job Satisfaction Amongst
Doctors‖, Journal of Health Management, Vol. 1, No. 1.pg 117-31.
Rout U. Stress among general practitioners and their spouses: a qualitative study. Br J Gen
Pract 1996;46:157-60.
Richards C. The Health of Doctors .Kings Fund London 1989.
Sen, P.C. (1981) . Personal and organizational correlates of role stress and coping
Strategies in some public sector banks. Ph.D. Thesis, Gujarat University, Ahmedabad.
Swanson, V., Power, K. and Simpson, R. (1996, "A comparison of stress and job satisfaction
in female and male general practitioners and consultants", Stress Medicine, Vol. 12, pp. 17-26.
Swanson,V.,Power,K.G.(1999) ―Stress,satisfaction and role conflict in dual-doctor
partnerships.‖ Community Work and Family,2,pp.67-88.
Thoits P A (1995), ―Stress, Coping and Social Support Process: Where are We?
What Next?‖, Journal of Health and Social Behaviour, Vol. 7, pp. 231-870.
White,B O‘Connor,D and Garrett L.(1997).Gender in Management 12.8:325-334.
Scottish Journal of Arts, Social Sciences and Scientific Studies - ISSN 2047-1278
http://scottishjournal.co.uk
108
The Application of Podcasts and
Vodcasts in English as Foreign Language
(EFL) Listening Learning
Murad Abdu Saeed
School of Language Studies and Linguistics
FSSK, Universiti Kebangsaan Malaysia, Malaysia
Norizan Abdul Razak
School of English Language Studies, Faculty of Social Sciences and Humanities
Universiti Kebangsaan Malaysia
43600 UKM Bangi, Selangor
Malaysia
Abstract
The current study is based on an experimental study in investigating the integration of podcasts
and vodcasts as supplementary materials into a traditional listening course. It aimed to investigate the
effectiveness of podcasts and vodcasts compared to the traditional listening course60 students at the
2nd level in English at Hodiedah University in Yemen. The effectiveness was measured based on the
participants‘ listening test performance and their level of acceptance or attitudes towards listening. It
also aims to identify the variables which significantly affect the experimental group participants‘
perceived ease of use and perceived usefulness of listening with podcasts and vodcasts. The results
revealed that the experimental group performed significantly better than the control group. This
provides evidence of the effectiveness of podcasts and vodcasts in supporting learners with more
exposure and more comprehensible input in listening. It was also found that the participants in the
experimental group showed more significantly positive acceptance of listening with these
supplementary materials compared to the attitudes of the control group who merely depended on the
traditional listening classroom course.
Keywords: Podcasts & Vodcasts; Listening performance; Technology acceptance model;
Attitudes; Perceived usefulness; Perceived ease of use

Scottish Journal of Arts, Social Sciences and Scientific Studies - ISSN 2047-1278
http://scottishjournal.co.uk
109
Introduction
The initial purpose of podcasting was to provide individuals with opportunities to distribute
their own radio shows, but within the increasing technology advancement, podcasting and vodcasting
have been increasingly playing a bi-sided effective role in enhancing learning and teaching in higher
education in general and that of listening skill in English in particular. Moss et al. (2010) state that a
large number of colleges and universities have increasingly adopted podcasting and vodcasting as
supplementary learning tools to enhance learning and teaching. It is added by Schmidt & Brown
(2004) that teachers address the challenge of making their teaching interactive and creative by
integrating podcasts and vodcasts into the traditional classroom. The effective role played by
podcasting and vodcasting in the area of L2 and FL listening and materials development is attributed
to the fact that these tools can meet certain criteria. According to Gruba et al.(2009) that, podcasts and
vodcasts, as effective learning tools, can meet three criteria; ―input salience (rephrasing, repeating, key
phrases are present and build the likelihood of acquisition), enhanced input (representations of
concepts are presented both visually and verbally) and authenticity (consisting of an unscripted variety
of voices, real life topics, and a range of perspectives‖ (Gruba et al. 2009: 403). Other three criteria are
their flexibility, easiness (Meng 2005) and relevance (Campbell 2005 and Chan & Lee 2005).
The integration of podcasts and vodcasts into classroom can be of great benefits for both
students and teachers as long as these tools provide effective teaching and learning opportunities and
useful outcomes (Evans 2008). However, it is indicated by Schmidt & Brown (2004) that only little
research exists on how the integration of podcasts and vodcasts can lead to successful and encouraging
learning environment by combining such technological learning tools into traditional classrooms to
enhance students‘ attitudes and motivation towards learning English as a Second Language (ESL) and
English as a Foreign Language (EFL).
However, reflecting the Yemeni context, these practices of teaching and learning listening skill
tend to neglect this skill or to make it nearly passive. As a result of this, the amount of exposure to
listening is minimized and these practices do not help learners develop listening as a communicative
language skill (Bose 2009).The materials used for learning and teaching listening skill in most of the
EFL context in general lack visual support or aids accompanying the content or text (Fang 2008 and
Wu 2010). Moreover, the input texts, in some cases, lack the organization of linguistic knowledge in
terms of structure, grammar and other aspects (Eom 2008). Therefore, based on the previously
mentioned issues encountered by the EFL Yemeni learners in listening skill, the need for carrying out
this study by which the podcasts and vodcasts are integrated into the traditional listening classroom at
Hodeida University in Yemen is stressed and justified. It is hoped that by conducting this study, these
challenges faced by the Yemeni learners of English in learning listening skill will be overcome. This
study attempts to fill the insufficient body of research in this particular interesting area. It focuses on
the effectiveness of integrating podcasts and vodcasts in enhancing English listening skill for the
Yemeni EFL learners which is based on technology as a powerful tool for EFL instruction. It aims to
achieve the following objectives:
Research Questions and Hypotheses
The current aimed to achieve the answer for the following research questions:
What is the level of difference in the listening test scores between the experimental group and
the control group by using podcasts and vodcasts as supplementary materials to the traditional
listening course?
What is the level of difference in the learners‘ attitudes towards learning listening in English
between the experimental and control groups by using podcasts and vodcasts according to the
technology acceptance model?

Scottish Journal of Arts, Social Sciences and Scientific Studies - ISSN 2047-1278
http://scottishjournal.co.uk
110
Based on the two research questions as previously stated, these two main null hypotheses were
proposed to be tested in the current study:
H01: There is no highly significant difference in the two groups‘ overall performance in the
listening comprehension test.
H02: There is no highly significant difference in the two groups‘ overall acceptance of
listening based according to the technology acceptance model (TAM).
Conceptual Framework
The three well-known theoretical models integrated in the conceptual framework are Krashen‘s
Comprehensible Input, Mayer‘s Cognitive Theory of Multimedia Learning and Davis‘s (1989) TAM.
In combining the three theatrical models, the current study employs the integration of these models to
identify the most theoretical variables generating from such theories which can be utilized for
achieving the three objectives, and consequently attempting to find out practical answers to the three
questions in the research (See Figure 1).
Figure 1: Conceptual Framework
The rationale for the combination of these three theoretical models is that they capture three
different but interrelated aspects in listening learning namely: the comprehensible input, the dual
cognitive process and the learners‘ attitudes and acceptance of integrating new technological devices
in learning. In other words, the comprehensible input as stressed by Krashen‘s model is represented by
the integration of podcasts and vodcasts as supplementary materials to the normal listening skills
taught to the Yemeni EFL learners at Hodiedah university. Since the input provided via podcasts
(audio only) and vodcasts (video along with pictures and transcripts), the theoretical perspectives that
provide evidence of the effectiveness of the cognitive dual processing of the input are needed.
Therefore, the effectiveness of the cognitive informational and learning process using dual senses
(auditory and visual) to put in the input provided to learners is comprehensively explained by Mayer‘s
Cognitive Theory of Multimedia Learning. Finally, the output as the final aspect of this conceptual
framework presented through the learners‘ effective performance in the listening tests and their
positive attitudes towards listening as a result of integrating podcasts and vodcasts in learning listening
stresses the need for theoretical perspectives to better explain learners‘ attitudes and acceptance.

Scottish Journal of Arts, Social Sciences and Scientific Studies - ISSN 2047-1278
http://scottishjournal.co.uk
111
Therefore, learners‘ attitude or acceptance of integrating new technologies in learning in general is
better explained by the TAM proposed by Davis (1989).
Previous Studies on the effectiveness of podcasts and vodcasts in English Foreign Language
Learning
In revising the literature concerning the usefulness of podcasting in language learning and
particularly, improving listening comprehension, and learning cultural aspects of the native speakers
of English, Claudia (2008) points out to several advantages of using podcasting in listening skills.
First, podcasts as a relatively new multimedia tool provide listeners the opportunity of enjoying their
favourite shows without a time or schedule limitation. Secondly, they include authentic content in
listening skills and it can be presented through audio and visual modes. Thirdly, as most of podcasts
are located in online Websites, students can access such tools at anytime and anywhere and they can
be connected to other more sources of podcasts as most of the podcast pages provide them with links
to other websites.
In presenting the ESL learners‘ reflections on their experience of online listening through
authentic podcasts spoken by native speakers, Kavaliauskiene (2008) conducted an experimental study
by implementing podcasts as a supplementary authentic approach to listening course in ESP. The
findings of the study showed that activities of listening to authentic records as the most common ways
of practicing listening comprehension were supported through the implementation of podcasts in
improving their listening skills. In addition, the participants were found to be using various techniques
and strategies as to overcome some challenges understanding the assigned podcasts. Strategies in
listening comprehension such as looking up the meaning of unknown words in a dictionary,
recognizing the words by sight from having read the available transcript of the podcasts, using a
dictionary while reading a recorded text and guessing the meaning from the context were all beneficial
strategies used by the participants for better comprehending the recorded texts in listening skills in
English.
To examine the effectiveness of using online podcasts as supplementary authentic materials in
providing exposure for Taiwanese learners of English to authentic English, thus, improving listening
skills in an EFL context, Lu (2007) conducted a case experimental study of one individual learner with
the purpose to raise the learners‘ and teachers‘ awareness of the importance of such pedagogical
online tools in enhancing EFL learners‘ listening skills. The study was conducted on the Internet via
Microsoft Network Messenger (MSN over a period of four weeks. Based on the data collected through
the participant‘s transcription of the podcasts, comments and suggestions he was assigned to post
during the case study period, it was reported that the learner or participant found such podcasts of
great benefits in providing him with repeated exposure to authentic English, thus, enhancing his
language learning and specially linguistic aspects such as vocabulary and grammar items,
pronunciation, word stress and intonation.
Miguel (2009) reviews some previous studies which have been conducted to examine the
effectiveness of integrating two interactive e-tools (podcasts and vodcasts) to in higher education and
particularly in learning and teaching English to enhance ESL learners‘ listening skills. The review
stresses the various advantages of using such tools to provide learners of English with opportunities to
have adequate input in listening. First, they provide learners with exposure to listen to English spoken
in authentic situations by native or ELS speakers because they are produced by recording authentic
radio and T.V. programs, lectures, interviews, talk shows, concerts and serials into audio and video
files which can be delivered in Webs, blogs or even emails. Secondly, as a result of this, such tools
can be easy, convenient and accessible because by directing learners to these online sites or emails,
teachers can support learners a vast window to work on their own pace, at their comfort and control
the way they learn to improve their listening skills as they can just download these files into their
computers, laptops or other devices. In addition, since these tools comprise audio, video and written

Scottish Journal of Arts, Social Sciences and Scientific Studies - ISSN 2047-1278
http://scottishjournal.co.uk
112
texts, learners can involve their various perceptible aspects to develop their cognitive skills and other
language skills and strategies such as writing down the meaning of chunks or words and taking notes
on what they listen to or watch.
Gruba et al. (2009) conducted a longitudinal and reflective action research project that
sought to blend podcasts in two different ESL contexts for one year with the purpose of assisting
college students work on their ‗extended‘ and ‗authentic‘ listening skills as part of a complimentary
set of materials as to meet the requirements of the Test of English as a Foreign Language (TOEFL) or
meet other standards. In carrying out their action research, the researchers produced various podcasts
by creating almost two dozen recordings on various topics, lectures, regular talks and other modern
areas which were spoken by highly proficient speakers of ESL. They distributed these podcasts
through learning management site. After a year, it was found that the integration of podcasts had
effectively improved the learning and teaching English programs in terms of the learning impact,
competence of the teachers, the enhanced learning styles, the integrated spaces, the practices of
evaluation, the responsibility sharing and the achievement of the overall goals of the program . As far
as learning development is concerned, it was found that blending podcasts in learning English
listening skills enhanced learning as the students learned how to use such technological devices to
improve their listening. In addition, podcasts made the participants‘ learning styles more active,
participatory and demanding.
Methodology
The current study employed only one type of these approaches known as a post-test-only
design approach which is a sub category of true experimental designs according to the classification
proposed by (Creswell, 2008).
Subjects
The targeted population in the current study included all the students joining the Diploma
Program in the 2nd level in English at the SDCEC at Hodiedah University in Yemen. It consisted of
250 students: one hundred and twenty one males and one hundred and twenty nine female students in
group A and group B. However, to select the sufficient number which represents the sample of the
study, only 60 EFL learners joining the same level were selected as the subjects to participate in this
study including twenty five males and thirty five females. The first group received a new treatment in
the form of podcasts and vodcasts as supplementary materials to their listening course whereas the
second group relied only on the normal listening course.
Development of Podcasts and Vodcasts
The materials in the form of podcasts and vodcasts developed to be integrated into the listening
classes as complimentary and supplementary materials to the normal listening course were all taken
from the following diverse four online learning Websites for podcasts and vodcasts. All the 12
podcasts and vodcasts were selected since they were related to the content of the listening course
being taught, and most importantly, they focused on different topics, grammatical aspects and lexical
items in English taught by the listening teacher during this academic semester.
Administering Listening Test
For the purpose of the current study, the test developed by the instructor aimed to test the
participants‘ listening skill in English. The length of the listening test conversations in this study was
around two minutes and forty seconds.
Administering the Technology Acceptance Survey
After the post-performance test was carried out, the survey consisting of two sections was
conducted to the participants in the experimental group and those in the control group. The 30

Scottish Journal of Arts, Social Sciences and Scientific Studies - ISSN 2047-1278
http://scottishjournal.co.uk
113
participating students in experimental group were offered the survey regarding their acceptance of
listening learning with podcasting and vodcasting section which was previously described. The data
collected from the participating students covered the information needed to identify their level of
acceptance of podcasting and vodcasting in improving listening skills in English. In parallel to this,
the 30 students in the control group were also given the normal listening course acceptance section as
previously highlighted.
Data Analysis
Statistical Package for Social Sciences (SPSS) 17.0 / 11.0 for Microsoft Windows was utilized
to provide both descriptive and statistical analyses. In determining if these differences between the two
groups in the test scores and their responses to the Likert attitude survey were significant, an
independent sample t-test was performed. Based on the previous studies by Leong (2003), Ramayah et
al.(2006) and Masrom (2007) examining the same aspects, this study tested the null-hypotheses at the
significance value of 0.5. For the current study, the seven null hypotheses as presented in the first
chapter were proved or disproved (accepted or rejected) based on the significance level of the
examined aspects (at 0.5. ) for which these hypotheses were proposed to examine.
Results and Discussion
Based on the two research questions and the two null hypotheses, this section summarizes the
results of this study obtained from the information gathered and organized in the following two sub-
sections.
Results of the Two Groups’ Listening Test Scores
Comparing the mean value of the two groups, it was observed that the M value achieved by the
experimental group (M= 88.0357) was higher than the M value of the control group (M= 81.7857). It
is evident that there is a difference in the listening test performance observed through the achievement
between the two groups. The experimental group receiving the new treatment (podcasts and vodcasts)
performed better and higher than the control group participants who only depended on the normal
listening course in the listening test. The M scores of the listening test achieved by the two groups are
also displayed in Chart 2.
Fig. 2. Distribution of the means of the experimental and control groups in post-listening
comprehension test
For this study, to determine if the level of difference in the students‘ performance on the
listening comprehension test was statistically significant and not probably due to random chance, and
instead due to use of the podcasts and vodcasts as supplementary materials to the traditional listening

Scottish Journal of Arts, Social Sciences and Scientific Studies - ISSN 2047-1278
http://scottishjournal.co.uk
114
course, an independent sample t-test was performed for this purpose and the p value of at 0.05 levels
was .016 (p < 0.05).
This is an indication that the integration of podcasts and vodcasts in EFL learning in general
and in learning listening skills in particular supports the theoretical perspectives of EFL learning,
especially the notions of comprehensible input and exposure as emphasized by Krashen‘s model.
Moreover, the findings of the current study seem to support the theoretical aspects underlying Mayer‘s
(1997, 2001) Generative and Cognitive Theoretical Model of Multimedia Learning in listening skill.
The presentation and organization of the input provided to the learner as emphasised by this model can
be achieved through providing learners with podcasts and vodcasts. Since the listening lessons offered
to the experimental group through the podcasts and vodcasts were presented in various modes of
audio, video, animation, texts and other materials, the students were assumed to obtain more access to
the input by involving their dual channels of information reception namely; auditory and imagery
channels.
Results of the Two Groups’ Overall Acceptance Level of Listening for Based on the TAM
Variables / Constructs
The results obtained from the inferential analysis of the students‘ responses to the survey
regarding their attitudes and acceptance of listening learning is displayed in Figure 3.
0
5
10
15
20
25
PEoU PU A BI
experimental
Control
Fig. 3. The M scores for the overall acceptance level of listening by both groups based on the
tam variables or constructs
Thus, the first independent t-test comparing the means of PEoU of the two groups
indicated that the p value was .000 (p< 0.05). This means that the difference in the M values of the
two groups was statistically significant. Moreover, a significant difference in the M scores of PU
between the two groups was found since the p value was .000 (p< 0.05). Regarding the difference in
the M values of A found in the two groups, the third t-test revealed the value of p was < 0.05 = .000)
which indicated that there was a significant difference between the M Scores of the two groups. As
proved by the result of the final t-test conducted to compare the means of BI obtained by the two
groups, the two M scores were significantly different because the p value observed was as.000 < 0.05.
Based on the inferential statistics verifying the level of significance in the difference between the two
groups‘ M scores in the four TAM constructs, the second null hypothesis can be rejected. It is
adequately evident that the integration of podcasts and vodcasts as complimentary materials to the
traditional listening course supports students with more opportunities of exposure to listening resulted
in positive attitudes and acceptance on the students towards listening learning at college.
Similar results were obtained in previous studies conducted by Gay et al.(2007), Chan &
Lee (2005) and Taylor & Clark (2010) who found out that podcasts can enhance the students‘

Scottish Journal of Arts, Social Sciences and Scientific Studies - ISSN 2047-1278
http://scottishjournal.co.uk
115
perception of learning when being used as learning materials in higher education. Moreover, in
emphasizing the same idea, Claudia (2008) and Gromik (2008) found that such tools assisted EFL
learners to perceive learning useful due to the authentic learning environment provided to the learners
through the integration of such learning tools.
Since learners‘ motivation is an important factor in making learning successful, the results
of the study by Janssen (2009) indicated that the use of podcasts could help the participants as EFL
learners to enhance their motivation. Similarly, in investigating the integration of podcasts and
vodcasts in Management Information Systems courses by Gribbins (2007), listening learning by
Kavaliauskiene (2008) and pronunciation by Lord (2008) and Ducate & Lomicka (2009) respectively,
it was commonly found that the use of podcasts in learning positively enhanced learners‘ attitudes
towards learning in these areas of major in higher education.
Conclusion
It is obvious that the integration of podcasts and vodcasts has been increasingly viewed and
realized as significant and useful learning tools in higher education in general and more specifically, in
some ESL/EFL contexts. In Yemen, as an EFL context, it seems that the integration of such
technological learning tools can enhance the students‘ exposure to listen to English more often than
they are exposed to it in real life situations. Therefore, to better understand the effectiveness of
podcasts and vodcasts in developing learners‘ listening skills among the Yemeni students at Hodiedah
University, the current study examined the effectiveness of such tools by carrying out an experimental
study including 60 Yemeni students at this university distributed into an experimental group (30) and
a control group (30).The results of the study as previously presented and discussed provided a
contemporary picture of how podcasts and vodcasts are proved to be effective in enhancing the
Yemeni college students‘ performance in listening skills in English and lead to positive attitudes
towards listening learning. Upon such findings, several useful conclusions and recommendations in an
attempt to improve the integration of such technological tools in the university EFL situation in
Yemen and to further conduct studies in the same area in the future are drawn up. To conclude, by
making such recommendations applicable, it is possible that this area of learning listening skills in
English with podcasts and vodcasts in such an EFL context could be significantly improved for both
research and pedagogical practices.

Scottish Journal of Arts, Social Sciences and Scientific Studies - ISSN 2047-1278
http://scottishjournal.co.uk
116
References
Bose, M. N. K. 2009. A letter to English Teachers: 68 How to Develop Listening Skills in your
Students. Yemen Times Newspaper
Article.http://www.yementimes.com/DefaultDET.aspx?i=794&p=education&a=2 [3 Sep
2010].
Campbell, G. 2005. Podcasting in education. Educause Rev November/December: 33–44.
Chan, A. & Lee, M. J. W. 2005. An MP3 a day keeps the worries away: Exploring the use of
pod. In Good Practice In Practice.
Claudia, P. 2008. Podcast & Literature. Entre Lenguas (14): 111-115.
Creswell, J. W. 2008. Educational Research: Planning, Conducting and Evaluating
Quantitative and Qualitative Research, 3rd Edition. USA: Prentice Hall.
Davis, F. D., Bagozzi, R. P. & Warshaw, P. R. 1989. User acceptance of computer technology:
a comparison of two theoretical models. Management science 35 (8): 982-1003.
Ducate, L. & Lomicka, L. 2009. Podcasting: An effective tool for honing language students‘
pronunciation. Language learning and technology 13 (3): 66–86.
Eom, M. 2008. Underlying Factors of MELAB Listening Constructs. SPAAN FELLOW 1001:
77.
Evans, C. 2008. The effectiveness of m-learning in the form of podcast revision lectures in
higher education. Computers & Education 50 (2): 491-498.
Fang, X. 2008. Listening comprehension in EFL teaching. US-China Foreign Language 52 (6):
21-29.
Gay, P. L., Bemrose-Fetter, R., Bracey, G. & Cain, F. 2007. Astronomy Cast: Evaluation of a
podcast audience‘s content needs and listening habits. Communicating Astronomy with the
Public 1 (1): 24-29.
Gribbins, M. 2007. The perceived usefulness of podcasting in higher education: A survey of
students‘ attitudes and intention to use. Proceedings of the Second Midwest United States
Association for Information Systems: 1-7.
Gromik, N. 2008. EFL learner use of podcasting resources: a pilot study. The JALT CALL
Journal 4 (2): 47-60.
Gruba, P., Clark, C., Ng, K. & Wells, M. 2009. Blending technologies in ESL courses: A
reflexive enquiry. Proceedings Ascilite Auckland 402-409.
Janssen, B. 2009. Using podcasts to teach the difference between'ser'and'estar'in a first
semester Spanish course, SOUTHERN ILLINOIS UNIVERSITY AT CARBONDALE.
Kavaliauskiene, G. 2008. Authentic audio materials in ESP. English for specific Purposes
World 7 (5): 1-14.
Leong, L. 2003. Theoretical models in IS research and the technology acceptance model
(TAM). Technologies & methodologies for evaluating information technology in business: 1-
31.
Lord, G. 2008. Podcasting Communities and Second Language Pronunciation. Foreign
Language Annals 41 (2): 364-379.
Lu, J. A. N. G. 2007. Prodcasting: A Fresh Solution for Old Problems. In Wireless Ready
Symposium E-Proceedings 83-95. .

Scottish Journal of Arts, Social Sciences and Scientific Studies - ISSN 2047-1278
http://scottishjournal.co.uk
117
Masrom, M. 2007. Technology acceptance model and E-learning. In 12th International
Conference on Education.
Meng, P. 2005. Podcasting & vodcasting: Definitions, discussions & implications. A White
paper by IAT Services at University of Missouri. Retrieved May 12: 2005.
Miguel, R. D. 2009. Using E-Tools to Enhance our Learners‘ Listening: Oxford University.
Press 1-13.
Moss, N. D., O'Connor, E. L. & White, K. M. 2010. Psychosocial predictors of the use of
enhanced podcasting in student learning. Computers in Human Behavior 26 (3): 302-309.
Ramayah, T., Yulihasri, Ibrahim, A. & ., J. N. 2006. Predicting Short Message Service (SMS)
Usage among University Students Using the Technology Acceptance Model (TAM).
Schmidt, K. & Brown, D. 2004. A model to integrate online teaching and learning tools into
the classroom. The Journal of Technology Studies 30 (2): 86-92.
Taylor, L. & Clark, S. 2010. Educational design of short, audio-only podcasts: The teacher and
student experience. Australasian Journal of Educational Technology 26 (3): 386-399.
Wu, W. 2010. The Application of Input Hypothesis to the Teaching of Listening and Speaking
of College English. Asian Social Science 6 (9): P137.