GEM Background Papers template 2020 - UNESCO.org
100
NICOLAS BUCHBINDER 2021 This paper was developed as part of the GEM Report Fellowship Programme. It has not been edited by the team. The views and opinions expressed in this paper are those of the author(s) and should not be attributed to the Global Education Monitoring Report or to UNESCO. The papers can be cited with the following reference: “Paper commissioned as part of the GEM Report Fellowship Programme in 2020”. For further information, please contact [email protected]. EDUCATION AND ICT IN LATIN AMERICA: HAVE WE BEEN SUCCESSFUL IN EXPANDING ICT AVAILABILITY AND USE THROUGH EDUCATION POLICY? Paper prepared for the Global Education Monitoring Report 2020 GEM Report Fellowship ED/GEMR/MRT/2020/F/2
-
Upload
khangminh22 -
Category
Documents
-
view
3 -
download
0
Transcript of GEM Background Papers template 2020 - UNESCO.org

NICOLAS BUCHBINDER
2021
This paper was developed as part of the GEM Report Fellowship Programme. It has not been edited by the team. The views and opinions expressed in this paper are those of the author(s) and should not be attributed to the Global Education Monitoring Report or to UNESCO. The papers can be cited with the following reference: “Paper commissioned as part of the GEM Report Fellowship Programme in 2020”. For further information, please contact [email protected].
EDUCATION AND ICT IN LATIN AMERICA: HAVE WE BEEN SUCCESSFUL IN EXPANDING ICT AVAILABILITY AND USE THROUGH EDUCATION POLICY?
Paper prepared for the Global Education Monitoring Report
2020 GEM Report Fellowship
ED/GEMR/MRT/2020/F/2

ABSTRACT
Latin America has probably been the region in which education policies regarding ICT
have been most preponderant. Many countries of the region have implemented massive
campaigns of ICT provision in schools in the last 20 years, and undertaken great efforts to
train teachers in their educational use. However, we do not have a clear assessment of
the effective access to ICT devices and Internet and its use by students in a way that
allows cross-country comparisons. In this paper, I review the landscape of education and
ICT policies implemented by different countries in Latin America. The different sections
analyze the main characteristics of their design, the evolution of device and internet
connection availability, the school capacities, the uses of ICT by students, and some
outcomes in terms of student self-perception. A specific focus has been made on
socioeconomic status and gender inequalities.
For this analysis, I rely on official documents and academic research, and I leverage data
from the student, principal and ICT familiarity questionnaires that complement the
application of the Programme of International Student Assessment (PISA) from 2000 to
2018. These data allows a solid comparison of selected countries both synchronic and
longitudinal.
All selected countries have implemented ICT and education policies, but there are many
differences concerning their design and implementation. The types of devices have
evolved from desktop computers to laptops and tablets over the years, linked to
technological improvements. Some countries have decided to deliver computers directly
to students through schools, while others have equipped schools with computers to be
used exclusively in the classrooms. The scale of the programs has also differed: some
countries have been able to reach a national scale, while others have remained in a state
or pilot level.
Countries that have implemented programs that distributed computers contemplating
student ownership have seen the percentage of computers that are available at
students’ home for schoolwork rise, while countries that opted for computer- or mobile-
labs in schools, like Colombia and Costa Rica, have seen lower levels of computer
availability at homes and higher numbers of computers per student in schools. Countries
that were less stable in their implementation of ICT and education policies show lower

levels of device availability both in homes and schools. Internet connection is still an
important weakness in most countries of the region, both in terms of availability and
bandwidth.
In most countries of the region, school and teacher capacities and support are still
stronger for students of higher socioeconomic status. A challenge in the future is to
advance this agenda to compensate the differences caused by inequalities at the
household level, which are present throughout the region, and are manifested in the
indicators that review use of ICT at homes for non-academic matters. A similar trend
exists regarding use of ICT for academic purposes. In schools, the inequalities of ICT use
are considerably smaller compared with the use at homes. These trends might explain
why interest, presence in daily conversations and self-perceived competence and
autonomy in the use of ICT are lower for more disadvantaged students in all countries of
the region.
Gender inequalities are present in a particular way in what is related to ICT and
education. There are no differences in the technological resources available for girls and
boys in schools and in households. In some countries, girls use ICT for academic purposes
in their homes even more than boys and are more interested in ICT. Nonetheless, the
frequency of use of ICT for non-academic purposes is considerably lower in girls and
boys, and so is their self-perceived competence and autonomy. This calls for specific
interventions that target gender inequalities.

TABLE OF CONTENTS
Abstract 1
Table of Contents 3
Introduction 4
Education & ICT policies in Latin America 6
Access to ICT 14
School capacities, teaching practices and student uses 29
Student outcomes 46
Conclusions 53
References 57

4
INTRODUCTION
Information and Communication Technologies (ICT) have been a key focus of education policies in the last decades
all around the world. Both developed and developing countries have intended to incorporate ICT in their education
systems with different aims and perspectives (see, for example, Trucano & Dikes, 2016).
The reasons that help explain this trend can be grouped in three types of arguments: economic, social and
educational (Jara Valdivia, 2008). The economic argument refers to the fact that ICT are increasingly influential in
the development of the world economy (Bughin & Maniyika, 2012). In this context, technological skills are
increasingly valuable in labor markets (Acemoglu & Autor, 2010), and will continue to be in the future. Equipping
students with technological skills might be crucial to foster economic growth, especially in less developed countries.
The social argument for the expansion of ICT in education focuses on a social imperative to democratize the use of
these tools in the population. In this view, the use of technology should not be left for the most advantaged sectors
of society, and the education systems have the responsibility of building digital literacy (Buckingham, 2010, 2020)
and digital citizenship (Choi, 2016). Finally, the educational argument is related to the belief that technology can be
a tool to improve pedagogical practices. In this matter, ICT has been proposed as a way both to make conventional
classroom processes more effective and to foster learning through innovations such as expanding learning
opportunities, personalization of education, interdisciplinary studies, better and more timely assessments, etc.
(Dede, 2011, 2014).
Latin America has probably been the region in which the connection between education policy and ICT has been the
most preponderant (Lugo, López & Toranzos, 2014). Intending to solve problems of low levels of learning and
unequal access to ICT, many countries of the region have implemented policies to increase ICT devices access in
schools and its use for educational purposes, especially in the first decade of the new century in which the
economies of the region grew considerably. These policies have the common objectives of both reducing the digital
gap (in access and use of ICT) and act as levers of change for improvement of educational practices in schools.
However, the progress achieved in ensuring that all students in the region have access to ICT devices and that
schools and students can use them for educational purposes in these decades is uncertain. On the one hand, the
official reports of the results of the education and technology policies are often limited to inputs (e.g., the number
of devices that were delivered) of a specific policy. On the other hand, research has mainly focused in analyzing the
design of these policies (oftentimes in a comparative framework) or in the their implementation in specific countries
in a specific time frame. Furthermore, these reports do not often analyze the effective use that students and
teachers give to the devices that are delivered. In this sense, we lack a full picture that incorporates policy design,
outcomes and implementation, and measures of use of ICT in education in a comparative framework in the region.
One notable exception to these trends in research about ICT and education is the work by Claro et al. (2011), which
advances a comparative analysis of ICT and education in the region, but uses data up to 2009, not being able to

5
capture the influence of many policies that were only beginning at that time. The study by Claro et al. (2011) inspires
the methodology employed in this study.
In this context, this paper intends to shed light on the state of ICT availability and use in education in Latin America.
This paper expands the literature in three ways. First, it entails a comparative analysis of different countries of the
region that have implemented different kinds of ICT and education policies, which allow to conceptually construct
different paths that the countries could have followed having implemented different designs. Second, it analyzes
two decades of data related to access to ICT, capturing the beginning and the expansion of ICT and education
policies in Latin America. Third, it expands the analysis on availability of resources to investigate uses of ICT in
schools and homes in the region, hence integrating different dimensions of the problem.
The paper has six sections, of which this introduction is the first. In the second section, I review education and ICT
policies implemented in different countries of the region since the end of the XXth century, using official documents
and research carried out in the last two decades. I focus on the main characteristics of the design of these policies
and summarize the knowledge of their impact. In the third section I analyze the progress of availability of digital
devices and Internet in homes and schools in the last two decades. Section 4 is dedicated to scrutinize school
capacities regarding ICT and its use teaching and learning. Section 5 reviews available information on student
outcomes related to ICT use. The final section concludes.
In section 2 I rely on official documents and academic research. In section 3 to 5, I leverage data from the student,
principal and ICT familiarity questionnaires that complement the application of the Programme of International
Student Assessment (PISA) from 2000 to 2018. Using PISA as a main source of data has several advantages. First,
PISA provides a solid comparison of the different countries, as it is part of a comparative study. Second, PISA allows
observing trends occurring in the last 20 years, as the first application of PISA was in 2000 and has been regularly
applied every 3 years ever since. Many items in the questionnaires have remained unchanged throughout the
different applications, and can be used to compare the evolution of indicators in time. Third, data collected in PISA
are meant to be representative of the 15-years-old population that attends school in each country and allow
disaggregating in dimensions like socioeconomic status, gender, management sector (public and private) and
geographical location (urban or rural). In Annex A I review the most important features of these data and its caveats
for the purposes of this paper.
One of the setbacks of using these data is that not every country in Latin America participated in PISA. We only have
data of Brazil, Chile (except 2003), Mexico, Argentina (except 2003 and 2015 ), Colombia (since 2006), Costa Rica
(since 2009), Peru (except 2003 and 2006), Uruguay (except 2000), Dominican Republic (since 2015), and Panama
(since 2015). I will restrict the analyses to the countries that participated in more than 2 rounds.

6
EDUCATION & ICT POLICIES IN LATIN AMERICA
The Ministries of Education (MoE) of the region have been developing their education and technology agenda since
the 1990s. This section summarizes some key aspects that help understand the landscape of ICT & education
policies in the region, emphasizing on a selection of the most important policies. I review the main characteristics of
their design and the results of their implementation – when program evaluations are available. I focus on initiatives
for primary and secondary schools. This summary is not a literature review, which is beyond the scope of this paper,
but a glance to some important aspects of these policies, their implementation and results, with the objective of
providing context to interpret the data is presented in the following sections (for a more detailed description of
these policies in the entire region, see Lugo & Delgado (2020)). Figure 1 shows the timeline of implementation of
most of the policies that are included in the analysis. Table 1 summarizes the characteristics of the most important
education & ICT policies in the region in this period. Annex C contains a summary of the historical development of
education and technology policies in each selected country and all the sources that were used for the analysis.
Figure 1. Education & ICT policies timeline in Latin America (selected countries and programs).
Source: own elaboration.
There are several dimensions that can be considered to analyze the decisions that the selected countries of the
region have made regarding education & ICT policies. Initially, it is possible to group these dimensions in three
areas: a) equipment and digital infrastructure (device provision, Internet connection, etc.), b) intended use for the
provided resources (resources, teacher training, etc.), and c) institutional organization and stability of the ICT and
education policies in time.
7
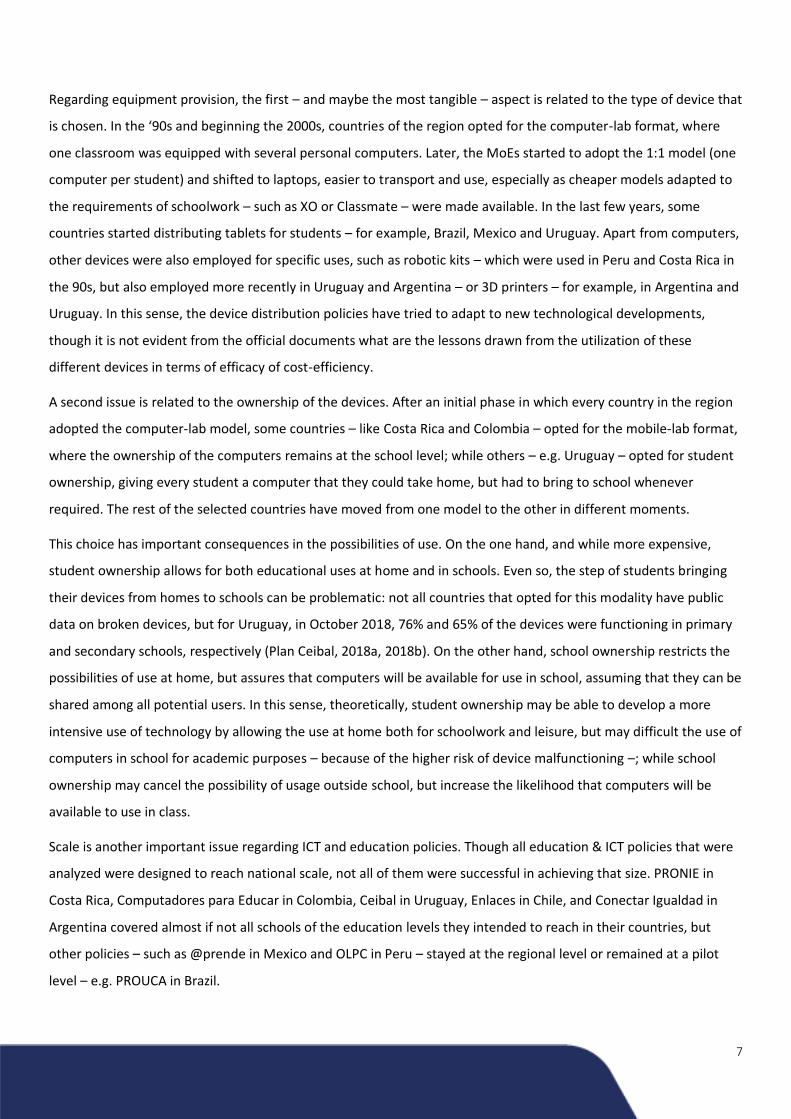
Regarding equipment provision, the first – and maybe the most tangible – aspect is related to the type of device that
is chosen. In the ‘90s and beginning the 2000s, countries of the region opted for the computer-lab format, where
one classroom was equipped with several personal computers. Later, the MoEs started to adopt the 1:1 model (one
computer per student) and shifted to laptops, easier to transport and use, especially as cheaper models adapted to
the requirements of schoolwork – such as XO or Classmate – were made available. In the last few years, some
countries started distributing tablets for students – for example, Brazil, Mexico and Uruguay. Apart from computers,
other devices were also employed for specific uses, such as robotic kits – which were used in Peru and Costa Rica in
the 90s, but also employed more recently in Uruguay and Argentina – or 3D printers – for example, in Argentina and
Uruguay. In this sense, the device distribution policies have tried to adapt to new technological developments,
though it is not evident from the official documents what are the lessons drawn from the utilization of these
different devices in terms of efficacy of cost-efficiency.
A second issue is related to the ownership of the devices. After an initial phase in which every country in the region
adopted the computer-lab model, some countries – like Costa Rica and Colombia – opted for the mobile-lab format,
where the ownership of the computers remains at the school level; while others – e.g. Uruguay – opted for student
ownership, giving every student a computer that they could take home, but had to bring to school whenever
required. The rest of the selected countries have moved from one model to the other in different moments.
This choice has important consequences in the possibilities of use. On the one hand, and while more expensive,
student ownership allows for both educational uses at home and in schools. Even so, the step of students bringing
their devices from homes to schools can be problematic: not all countries that opted for this modality have public
data on broken devices, but for Uruguay, in October 2018, 76% and 65% of the devices were functioning in primary
and secondary schools, respectively (Plan Ceibal, 2018a, 2018b). On the other hand, school ownership restricts the
possibilities of use at home, but assures that computers will be available for use in school, assuming that they can be
shared among all potential users. In this sense, theoretically, student ownership may be able to develop a more
intensive use of technology by allowing the use at home both for schoolwork and leisure, but may difficult the use of
computers in school for academic purposes – because of the higher risk of device malfunctioning –; while school
ownership may cancel the possibility of usage outside school, but increase the likelihood that computers will be
available to use in class.
Scale is another important issue regarding ICT and education policies. Though all education & ICT policies that were
analyzed were designed to reach national scale, not all of them were successful in achieving that size. PRONIE in
Costa Rica, Computadores para Educar in Colombia, Ceibal in Uruguay, Enlaces in Chile, and Conectar Igualdad in
Argentina covered almost if not all schools of the education levels they intended to reach in their countries, but
other policies – such as @prende in Mexico and OLPC in Peru – stayed at the regional level or remained at a pilot
level – e.g. PROUCA in Brazil.

8
Most of these policies were not designed to focalize on low-income students, but were thought as universal. In
practice, the target population of these policies was public school students. In most countries of the region, this
entails reaching a majority of students (see Table B-3). This decision leaves private schools out of the programs,
excluding a great number of students from higher socioeconomic backgrounds, but also a non-negligible number of
lower socioeconomic background students that attend these schools in the region. This situation is different in Chile,
as there is a large proportion of students that attend private subsidized schools – privately managed, but publicly
funded. Yo Elijo mi PC, in this context, was designed to provide with an electronic device and Internet to low-income
students that attend private subsidized schools (Fiscarelli et al., 2018). Another example of a national policy that
addresses private schools is Plan Ceibal in Uruguay, which has an option for private school to become part of the
program, but without public financing.
In this sense, there are three “models” of device provision that can be observed. The first model is the one that
distributed computers to students. In this model, some countries have achieved large scale – such as Argentina and
Uruguay – and others remained in a local level – such as Mexico and Peru in primary schools. The second model is
the delivery of computers to schools, which was implemented in Colombia and Costa Rica. The third model,
exemplified by Chile, takes components of the other two models: it delivers computers to schools in the computer
lab format – both state and subsidized private schools – and computers to students of lower socioeconomic status in
public and private schools.
Along with the provision of electronic devices, all countries of the region have pushed initiatives to increase the
number of schools connected to the Internet. It is curious to see many initiatives of a similar kind – but with
different names – in many countries. This can be interpreted a sign of the difficulties to expand internet service in
the region, which seems to be a barrier to foster better educational usage of the devices provided. While Internet
connection for school administrative work is advanced in the region, the bandwidth required to use for schoolwork
seems to be a problem that most countries have not solved. I review the data available on Internet availability in
schools and student homes in the following section.
The private sector has been a key stakeholder in the ICT & education policies in different ways. First, in many
countries private companies or donors were fundamental for their initial kickoff. For example, in Colombia, in the
first phase of Computadores para Educar it were the private companies that donated the computers that were
refurbished and distributed to schools (Galvis Panqueva, 2014); and, in Argentina, educ.ar – the public company that
was in charge of the educational technology policies – was built initially with the support of a large donation by a
private foundation (Fundación Varsavsky, 2005).
Furthermore, all countries of the region appealed to private companies to acquire the necessary devices. In
Argentina, Conectar Igualdad initially resorted to imported devices, but progressively intended to include the local
industry in the fabrication of the computers distributed by the program. During 2010 and 2013, the national
production of computers increased 400%, and 60% of this production was destined to Conectar Igualdad (Seijo et

9
al., 2020). In Brazil, after initial negotiations with the OLPC program – which included personal conversations
between Nicholas Negroponte and the president of the country in the World Economic Forum in Davos (OLPC, 2020)
– that ended without concrete results, the government opted for national companies to provide the devices for
their initiatives (Fuoco, 2008). Other examples of collaboration between private companies and the governments in
smaller projects can be found in Mexico (Díaz Barriga, 2014) and Colombia (Galvis Panqueva, 2014), as well.
The most immediate product of the implementation of edtech policies in Latin America has been an increase of
access to ICT throughout the region. Depending on the design of the programs, they have either expanded
availability of digital devices in school – see, for example, Barrera Osorio and Linden (2009) for Colombia or Zúñiga
Céspedes (2018) for Costa Rica – or at home – see for Uruguay Pittaluga and Rivoir (2012) or Benítez Langhi and
Zukerfeld (2015) for Argentina. I review the data for access to computers and the Internet in the selected countries
in the following section.
On the side of actions regarding the use of the resources provided by the education & ICT policies, teacher training
is probably the most unsolved part of the puzzle. In most cases, there is a lack of consistent documentation of
teacher training practices and their degree of success – or lessons learned. In principle, there are different ways in
which teacher training for the educational use of ICT it is implemented in the region. While a few countries have
implemented specific models, within each country a variety of strategies coexist.
Training can be directed to teachers individually – as was more frequent in Conectar Igualdad in Argentina and Plan
Ceibal in Uruguay – or to schools as a whole – as was implemented in Enlances in Chile, PRONIE in Costa Rica and
Computadores para Educar in Colombia. In the former, individual teachers can enroll themselves in different
options, and, in the latter, teachers participated in workshops that were offered to the schools as they are
incorporated to the program. Argentina and Uruguay – between 2011 and 2012 – employed the “cascade” model, in
which a few teachers per school were trained and were expected to act as mentors for the rest of the school staff.
This option proved problematic in Uruguay, which abandoned it after acknowledging a great disparity in
implementation due to different starting conditions in schools (Dussel, 2015).
Teacher training regarding ICT is implemented in the region by different agencies: a) universities, b) the education
institutions that provide continuous teacher training, or c) staff from the ICT and education programs. In Colombia
and Chile, universities took the main role in training teachers that participated in Computadores para Educar and
Enlaces, respectively, especially in the beginning of the implementation of the programs (Barrera-Osorio and Linden,
2009; Jara, 2013). In Argentina, teachers had courses available from the institutions that provided continuous
teacher training and also had training programs directly delivered by staff from Conectar Igualdad (Vacchieri, 2013).
In Uruguay and in Costa Rica, the training offer is concentrated mainly in Ceibal and PRONIE (Vaillant, 2013; Muñoz
et al., 2014). Progressively, these countries have moved from in presence training to concentrating the training
options in online distance education programs.

10
One important part of the process of incorporating ICT to teaching is related to support for teachers in situ. In
countries that provided training to schools as they were incorporated to the programs, as Chile and Colombia, a
local university developed a training program of two years with teachers in which they supported the use of ICT with
educational purposes for curriculum subjects (Barrera-Osorio & Linden, 2009; Jara, 2013). Argentina and Uruguay
incorporated a position in school staff rosters to support teachers (Vacchieri, 2013; Vaillant, 2013). In Costa Rica,
teachers received 3 visits per year on average by advisers of PRONIE, which give personal feedback for teachers that
participate in the program (Zamora, 2012).
The content focus of these initiatives is also very relevant. There are two possible approaches that have been
observed in the region, which may appear separately or combined. On the one hand, some programs have focused
on developing materials and pedagogical approaches to use ICT to enrich teaching of curriculum subjects, such as
mathematics, language or social science. This is the case of most programs in the region, as can be seen in Table 1.
On the other hand, some countries – like Costa Rica since the start of PRONIE, and, lately, Uruguay, Chile, Argentina
and Colombia – have developed a special focus in using ICT to teach computational thinking, programming and/or
robotics.
These two models have different implications for education policy. The first approach is more ambitious and hence
more difficult to implement with success, since it requires scaling teacher training and material production for
teachers of many subjects and grades. The second is only for teachers of the specific subject – Technology or
Education Informatics are names that appear throughout the region – or for teachers of a non-mandatory workshop
that some countries have implemented.
Related to the content focus of the ICT and education policies, the resources that are made available to students
and teachers are less discussed. In the countries that are oriented towards an educational use of ICT to teach
curriculum subjects it is common to see a trend to produce and make available a remarkable number of resources,
but orientation for teachers to make use of them is less present. A notable exception of this pattern is Uruguay,
where there was an explicit effort to prioritize certain contents – mainly in Mathematics, Spanish and English – and
build consistent pedagogical approaches for ICT use in the classroom related to the offer of teacher training
(Vaillant, 2013).
One final remark on the ICT and education policies in Latin America is related to their continuity and stability.
Countries like Uruguay, Costa Rica and Colombia have had a remarkable continuity in the implementation of these
policies. While Chile interrupted Enlaces in 2018, it showed a similar characteristic during 25 years. The rest of the
countries of the region have had interruptions in the implementation of ICT and education policies, mostly
coincident with changes in government. Argentina had a flagship program (Conectar Igualdad) for almost 10 years,
but also interrupted it in 2018. Brazil, Mexico and Perú have had many different programs during the last 20 years,
and few of them have endured (Bianconcini de Almeida, 2014; Díaz Barriga, 2014; Balarin, 2013).

11
The separation of the implementation of these policies and the MoE in Uruguay and Costa Rica seems to have been
effective in keeping them safe from changes in political winds (Vaillant, 2013; Muñoz, 2013). Both countries created
public companies had autonomy, both in finance and decision-making, from the MoE – even though the MoEs had a
representative in these companies’ boards. In the case of Uruguay, the leadership of Fundación Ceibal also did not
come from an education background, but was more related to the private sector. Additionally, the countries that
have managed to have continuity in their ICT and education policies were also able to integrate all initiatives under
one specific program, while the countries that show a multiplicity of sometimes coexistent policies that made
implementation more difficult show more interruptions.
Few countries in the region have developed assessments of student ICT skills. Chile is probably the country that has
fostered this agenda the most, as it implemented two national large-scale ICT skills assessments (Jara, 2013). Costa
Rica also implemented an assessment focused on problem solving, citizenship and communication and productivity.
Chile and Uruguay have also participated in the International Computer and Information Literacy Study (ICILS)
organized by the International Association for the Evaluation of Educational Achievement (IEA). Except for Argentina
and Peru, all selected countries have participated at least once in PISA’s ICT Familiarity Questionnaire, and Uruguay,
Chile and Mexico participated several times.
The evidence regarding use of ICT resources in schools is less straightforward compared to evidence regarding
access to devices and to the Internet. It has been documented that many of these programs have paid more
attention to providing devices and technological infrastructure than to its use by students and teachers (Jara, 2013;
Díaz Barriga, 2014; Balarin, 2013; Fiscarelli et al., 2018). In some cases, students and teachers perceive that the
programs are a “synonym” of the device being distributed, neglecting other actions that are part of the design
(Benítez Langhi and Zukerfeld, 2015). This is especially common in the first years of implementation (Conectar
Igualdad, 2015; Fullan et al., 2013).
Most of the literature appears to coincide in that, in spite of a general acceptance of the programs (Conectar
Igualdad, 2015; Claro et al. 2013), the level of usage of ICT in the classroom by students and teachers is still low
(Benítez Langhi and Zukerfeld, 2015; Jara, 2013), but has improved compared to not being benefited with the
programs (Barrera-Osorio and Linden, 2009; Cristia et al., 2017). Additionally, these uses have been documented to
be of low complexity, for example in drilling (Claro et al., 2013), instrumental digital skills (Cristia et al., 2017;
Fiscarelli et al., 2018) or basic ICT skills, such as searching for information in the Internet (Conectar Igualdad, 2015;
De Melo et al., 2017), even if the computers are equipped with educational applications. In Brazil, Cordeiro and
Zoghbi (2017), show that use of ICT in schools had a great increase in the first two years of PROUCA, but was quickly
reduced after the third year.
This could have been a result of implementation problems that appeared to some degree in most edtech national
programs. Some of these problems were strictly technical, such as malfunctioning of the computers, difficulties to
work with many computers at the same time and flaws in the Internet connection (Vaillant, 2013; Benítez Langhi

12
and Zukerfeld, 2015; Claro et al., 2013; Díaz Barriga, 2014). In other cases, it is argued that the pedagogical use of
ICT in incremental in time, and that the consolidation of these programs in time plus the expansion of teacher
training can generate a more intensive use of ICT in schools (Benítez Langhi and Zukerfeld, 2015; Conectar Igualdad,
2015; Rodrígue Orgales et al., 2011; Zúñiga et al. 2018). Another factor that is mentioned in the literature as key to
foster a more intensive use of ICT in the classrooms is having support staff in schools that help teachers both in
technical and pedagogical issues (Benítez Langhi and Zukerfeld, 2015; Claro et al. 2013; Fullan et al., 2013).
The impact of these programs in student and school outcomes is controversial. The evidence seems to lean towards
most of these interventions having no impact on student achievement in traditional subjects. There have been many
impact evaluations of these programs, with different types of design. Most evaluations have focused on learning
outcomes measured by standardized tests in language and mathematics. Some studies that employed quasi-
experimental methods (propensity score matching, differences-in-differences combined or not with propensity
score matching or instrumental variables) found moderate positive impacts of the programs in tests (Alderete and
Formichella, 2017; Lima et al., 2018; Rodriguez Orgales et al. 2011; Lemoine et al. 2015, Olarte Dussan et al. 2018;
Ferrando et al., 2013). Conversely, other quasi-experimental evaluations (De Melo et al., 2017; de Resende and
Zoghbi, 2017) and all randomized evaluations (Beuermann et al. 2015; Cristia et al., 2017; Barrera-Osorio and
Linden, 2009) found no statistically significant effects of these programs in learning outcomes.
Some specific initiatives within these programs were found to have positive moderate effects. For example, Perera
and Aboal (2017a) found that the Adaptive Math Platform (PAM) had a statistically significant moderate positive
effect in math tests. This effect was concentrated in lower socioeconomic status students (Perera and Aboal,
2017b). Even if this evaluation is quasi-experimental, it is in line with the evidence in favor of the effectiveness of
computer-assisted learning (Escueta et al., 2017). In the reports of Ceibal en Inglés, it appears that there is no
difference in the achievement trend of students that participate in the program and students that are enrolled in
other traditional English programs (Marconi and Peri, 2019), which implies that students that traditional in presence
instruction had similar gains compared to students that received on distance English lessons, who would have not
received this instruction otherwise.
There is less solid evidence on the impact of these programs in digital skills or school outcomes such as repetition or
dropout. Regarding the former, Zúñiga et al. (2018) document in Costa Rica that students that have been
participating in PRONIE for longer have better achievement in tests that measure digital skills compared to students
that participated more recently. Let us remember that PRONIE was one of the programs that had a special focus on
these skills. On the latter, a quasi-experimental evaluation of PROUCA in Brazil found no effect of the program in
repetition or dropout rates, but another quasi-experimental evaluation of Computadores para Educar in Colombia
found a positive impact in these indicators especially when teachers had gone through the program for more years
(Lemoine et al, 2015)
13
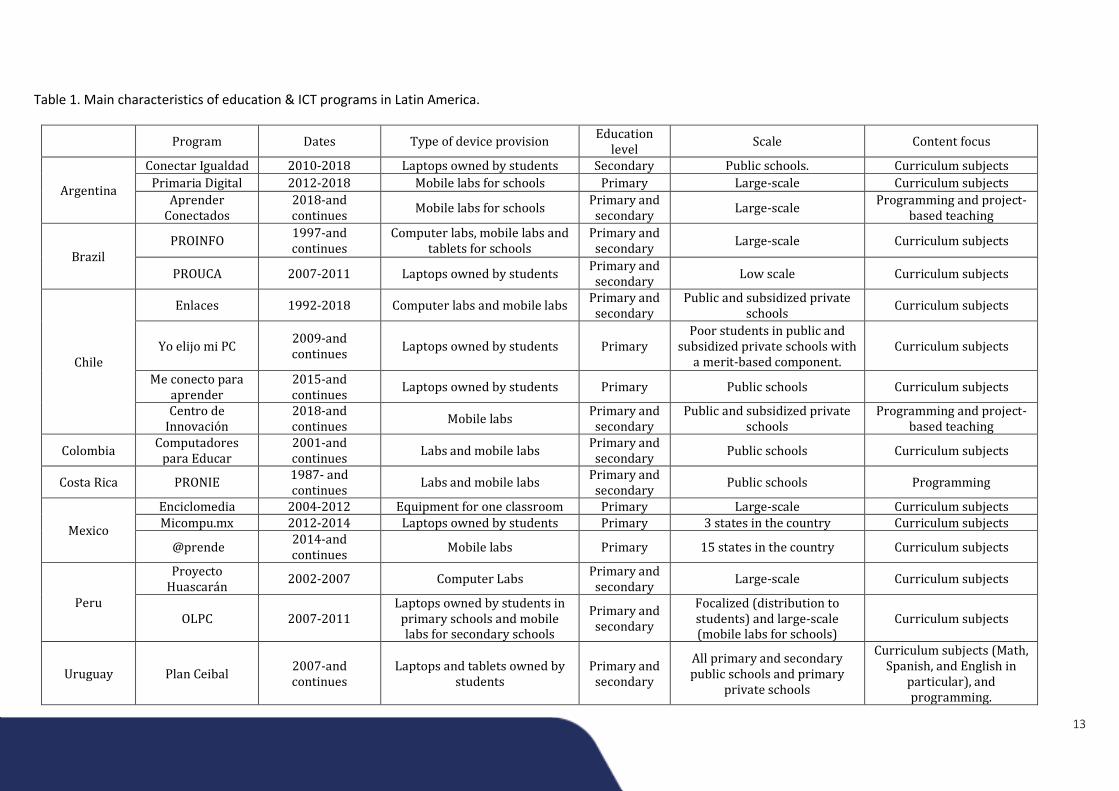
Table 1. Main characteristics of education & ICT programs in Latin America.
Program Dates Type of device provision Education
level Scale Content focus
Argentina
Conectar Igualdad 2010-2018 Laptops owned by students Secondary Public schools. Curriculum subjects
Primaria Digital 2012-2018 Mobile labs for schools Primary Large-scale Curriculum subjects
Aprender Conectados
2018-and continues
Mobile labs for schools Primary and
secondary Large-scale
Programming and project-based teaching
Brazil PROINFO
1997-and continues
Computer labs, mobile labs and tablets for schools
Primary and secondary
Large-scale Curriculum subjects
PROUCA 2007-2011 Laptops owned by students Primary and
secondary Low scale Curriculum subjects
Chile
Enlaces 1992-2018 Computer labs and mobile labs Primary and
secondary Public and subsidized private
schools Curriculum subjects
Yo elijo mi PC 2009-and continues
Laptops owned by students Primary Poor students in public and
subsidized private schools with a merit-based component.
Curriculum subjects
Me conecto para aprender
2015-and continues
Laptops owned by students Primary Public schools Curriculum subjects
Centro de Innovación
2018-and continues
Mobile labs Primary and
secondary Public and subsidized private
schools Programming and project-
based teaching
Colombia Computadores
para Educar 2001-and continues
Labs and mobile labs Primary and
secondary Public schools Curriculum subjects
Costa Rica PRONIE 1987- and continues
Labs and mobile labs Primary and
secondary Public schools Programming
Mexico
Enciclomedia 2004-2012 Equipment for one classroom Primary Large-scale Curriculum subjects Micompu.mx 2012-2014 Laptops owned by students Primary 3 states in the country Curriculum subjects
@prende 2014-and continues
Mobile labs Primary 15 states in the country Curriculum subjects
Peru
Proyecto Huascarán
2002-2007 Computer Labs Primary and
secondary Large-scale Curriculum subjects
OLPC 2007-2011 Laptops owned by students in
primary schools and mobile labs for secondary schools
Primary and secondary
Focalized (distribution to students) and large-scale (mobile labs for schools)
Curriculum subjects
Uruguay Plan Ceibal 2007-and continues
Laptops and tablets owned by students
Primary and secondary
All primary and secondary public schools and primary
private schools
Curriculum subjects (Math, Spanish, and English in
particular), and programming.

ACCESS TO ICT
Since 2000, there has been an increase in the percentage of 15-years-old students that
have access to a computer they can employ for schoolwork and the percentage of
students that have a link to the Internet at home in the selected Latin American
countries, as Figure 2 shows. The average trend for the region shows that the percentage
of students with access to a computer for schoolwork at home has risen from 25.5% in
2000 to 67.0% in 2012. After that year, this percentage has decreased to 61.0%.
Meanwhile, in OECD countries the access to computers for schoolwork at homes also
increased, but at a lower relative rate: from 76.6% in 2000 to 92.0% in 2012. In
consequence, the gap between both groups decreased from 50 percentage points in
2000 to 25 percentage points in 2012 and has remained in a similar magnitude since
then. However, this gap is still of great magnitude.
The regional trend is replicated similarly in all countries of Latin America, but at different
levels. Uruguay and Chile are the countries in which students have the highest level of
access to computers at home (around 82.0% in 2018), and their trends have been very
similar since 2000. Costa Rica and Argentina had in 2018 around 72% students that had
access to a computer at home. Argentina shows a steep increase in this indicator
between 2006 (48.6%) and 2012 (83.8%), but a sharp decline in 2018 (71.6%). Brazil,
Colombia, Mexico and Peru have maintained similar curves since 2000.
The regional trends could be explained by two facts: 1) from a macroeconomic
perspective, the region had a growth period from 2003 to 2013, but has been stagnated
since then (see Graph B-1); and 2) as was explained in the previous section, many ICT and
education policies in the region were de-scaled after 2012 – e.g. PROUCA in Brazil and
OLPC in Peru 2011, or Conectar Igualdad in Argentina in 2015. Another possible
explanation could be a possible “substitution effect” with the increase of availability of
cellphones in the region, but data from PISA and from the International
Telecommunications Union (ITU) show that in most of the selected countries the
availability of cellphones and cellphone subscriptions has not increased substantially
since 2012 (Figures D-1 and D-2).
Regarding access to the Internet, the average of the region shows a steady increase from
16.2% in 2000 to 78.7% in 2018 in the percentage of students that declare having a link

to the Internet at home. In the OECD, the average went from 50.0% to 97.2%. In this
sense, the gap between Latin American and OECD countries was reduced from around to
33 percentage points to around 20 percentage points. It is interesting to note that Brazil,
being very close to the average of the region in access to computers, is one of the
countries with the highest percentage of students with a link to the Internet at home,
together with Chile and Uruguay. The factors that might have negatively affected
computer availability in the region in the second decade of the 2000 do not seem to have
affected internet expansion.
Figure 2. Percentage of 15-years-old students that have access to a computer for
schoolwork and a link to the Internet at home in selected countries.
Source: own elaboration based on PISA 2000-2018.
Note: Average LATAM average is a weighted average of the eight selected Latin American
countries. OECD is a weighted average of the OECD countries that participated in all rounds of
PISA, excluding selected countries.

Regarding socioeconomic disparities in the access to computers, we can distinguish two
groups of countries. In the first group, the trends for the averages of both the poorest
and the richest quartiles in PISA’s International Socio-economic Index of Occupational
Status (ISEI) are similar, having a null or very small reduction in disparities in access to a
computer. Brazil, Mexico, Colombia, Peru are part of this group. The second group, on
the opposite, is comprised by countries that have reduced to some degree inequalities in
access to computers at home. Argentina, Chile, Uruguay and, in a lower degree, Costa
Rica have reduced the gap between the poorest and richest quartiles. A similar process
can be observed in the gaps regarding students that attend rural schools and schools in
cities (see Figure D-3), and between public and private schools (see Figure D-4). These
gaps are of course related, since in the region private and urban schools tend to have
higher socioeconomic status than public and rural schools. There are no gaps in access to
ICT between female and male students (see Figure D-5).
It is interesting to note that the countries that implemented massive computer
distribution programs in which the students owned the devices show a sharp increase
that coincides with the moments in which these policies started – 2007 in Uruguay and
2010 in Argentina. Chile, which started distributing computers to students in 2009
focusing on low-income students, also shows a great reduction in inequalities in access
to computers at homes. Costa Rica was able to reduce these inequalities in a smaller
magnitude without policies of similar scale.
Figure 3. Percentage of 15-years-old students that have access to a computer for
schoolwork by participating country and socioeconomic status.

Source: own elaboration based on PISA 2000-2018.
Note: Average LATAM average is a weighted average of the eight selected Latin American
countries. OECD average is a weighted average of the OECD countries that participated in all
rounds of PISA, excluding selected countries.
There are vast differences in terms of access to Internet between poor and rich students.
In 2018, 61.9% of students in the poorest quartile in PISA’s ISEI in the region had a link to
Internet at home, while this percentage was of 92.8% for the richest quartile. Even so, it
is worth highlighting that this gap increased on average in the region between 2000 and
2009, and has shortened between 2009 and 2018. When we look at the trends of each
country, we again see two groups of countries: a first group in which the gap between
the richest and poorest students stayed the same or even increased and a second group
in which the gap was reduced. The first group is comprised by Mexico, Colombia and
Peru, where 43.3%, 25.8%, and 28.4% of students in the poorest ISEI quartile,
respectively, do not have a link to the Internet at home. The second group, conformed by
Brazil, Argentina, Chile, Costa Rica and Uruguay, has considerably higher levels for more

vulnerable students. These two groups also show similar trends regarding the internet
access gap between students that attend rural and city schools (Figure D-6) and between
public and private school students (Figure D-7). As in the case of access to a computer for
schoolwork, there are no gaps between female and male student in their access to a link
to the Internet at home (see Figure D-8).
Unfortunately, it is not possible to distinguish different qualities of Internet connections,
since the questionnaire does not inquire beyond a dichotomous option, which impedes a
more nuanced analysis. This implies that even if students answer that a connection to
the Internet is available at their homes, they still might be having trouble to access
certain contents that require more bandwidth.
Figure 4. Percentage of 15-years-old students that have access to a link to the Internet at
home by participating country and socioeconomic status.
Source: own elaboration based on PISA 2000-2018.

Note: Average LATAM average is a weighted average of the eight selected Latin American
countries. OECD average is a weighted average of the OECD countries that participated in all
rounds of PISA, excluding selected countries.
It is important to note that this analysis compares the access to computers and to the
Internet of students that were eligible to participate in PISA. In this sense, they do not
necessarily represent the entire population of 15-years-old population in each country,
and the representativeness of these data in regards to this population changes within
each country between the different rounds of PISA. As can be seen in Table B-1, all
selected countries increased the percentage of the population between 13 and 17 years
old that attended school, principally between 2000 and 2012. In addition, the increase in
inclusion in schooling for this age group is considerably more important for lower
socioeconomic status students, as can be seen in Table B-2. Coincidentally, the average
ISEI score for all selected countries – with the exception of Chile – has decreased since
PISA 2000 and stabilized in 2009 or 2012, depending on the country (see Figure B-2); and
the PISA Coverage Index 3 – which measures the representativeness of the achieved
sample and the 15-years-old population in each country – has been increasing
throughout the region (see Table A-1).
As with other indicators produced by PISA – most notably, average performance in
mathematics, science or reading – the composition of the sample in the different rounds
needs to be taken into account. For our purposes, this means that the progress of each
country in these indicators should be seen in light of progressive inclusion in these
education systems. In Argentina and Chile, the reduction of inequalities in the reviewed
ICT access indicators has been achieved in a context of relatively lower increase of
inclusion in education, since both countries had in 2000 over 90% of their 13-17 years-
old population attending school. Uruguay has achieved great progress in reducing
inequalities in the ICT access indicators while also reducing inequalities in access to
education, and the same applies to Brazil, but only regarding access to the Internet.
Compared to Uruguay, Costa Rica reduced inequalities in the PISA ICT indicators in a
smaller magnitude, but has been the country that increased access to education to most
among the selected countries. The rest of the countries have not reduced inequalities in

ICT access in the PISA indicators, but have increased access to education, a phenomenon
that may be pulling ICT indicators downwards – especially when socioeconomic status
percentiles are considered.
As has been reviewed in the previous section, in this period schools have also been
equipped with technological resources, both devices and Internet connection. Regarding
available computers, we observe unstable trajectories in the last decade in the region. In
2009, the average number of computers by 15-years-old students was 0.23. This
indicator grew between 2009 and 2015, reaching its maximum registered level: 0.36
computers per student. Between 2015 and 2018, it decreased to 0.31, a similar level
compared to 2012. The regional average is considerably far from the OECD, and the gap
increased between 2015 and 2018, as in Latin America the average number of computers
available per student decreased, while in the OECD it increased. This trend could be
explained by similar reasons to the ones hypothesized for availability of computers at
students’ homes.
Colombia is the country of the region with the highest level of computers available for
students in school, having reached 0.95 computers per student in 2015. However, this
number was reduced to 0.73 in 2018, which coincides with other sources that show that
after 2015 the program delivered fewer computers and experienced an important
budget reduction (Olarte Dussan et al., 2018). On the opposite side, Brazil is the country
with the smallest levels of access to computers in school, with an average of 0.10
computers per 15-year-old student.
As can be observed in Figure 5, Argentina, Brazil, Colombia, Uruguay, and, at a lower
degree, Costa Rica, have reduced the number of available computers from 2012 to 2018.
On the contrary, Chile and Peru have steadily increased the availability of computers for
students in schools since 2009. Mexico has had a considerable stability in this regard.
It is unexpected to see Uruguay as one of the lowest computer-student ratio in the
region. This is surprising due to the fact that, as was analyzed in the previous section,
Uruguay has developed a very ambitious policy of distribution of digital devices to
students through schools and its own data show that it had covered all secondary school
students by 2013 (Rivera Vargas & Cobo Romaní, 2019). It is interesting to contrast
Argentina and Uruguay, which have distributed computers to students massively.

Between 2009 and 2012, Argentina saw its computer-student ratio increase
considerably, and Uruguay experienced a much smaller increase. This trend is not
explained by a larger presence of other devices such as tablets – that are also distributed
in Plan Ceibal – as can be seen in Figure D-10. One possible explanation for this trend is
that Uruguay has focused the device distribution efforts in primary school students,
hence secondary school principals – the ones that answered the PISA questionnaire – are
not reporting these devices as available for them to use in school. This might show a
limitation in the data collected through PISA to compute a computer-student ratio.
Figure 5. Computer-student ratio in schools by selected country.
Source: own elaboration based on PISA 2009-2018.
Note: Average LATAM average is a weighted average of the eight selected Latin American
countries. OECD average is a weighted average of the OECD countries that participated in all
rounds of PISA, excluding selected countries.

As at homes, access to computers at school is unequal for students of different
socioeconomic status. On average in the region, students of the poorest ISEI quartile
have access to 0.31 computers per student on average, while students in the richest
quartile have access to 0.36, a difference of 15.6%. It is worth noting that this gap has
decreased since 2009, when it was of 43.1%.
Beyond the regional average, the situation is not the same in each country. Brazil has had
a relatively constant gap since 2009; Mexico has increased this gap since 2009; Peru and
Costa Rica have reduced it considerable between 2009 and 2012, and Chile has
practically closed it in 2018. Argentina, Colombia and Uruguay show more irregular
trends. Argentina increased the availability of computers in schools for poorer students
between 2009 and 2012 at a point in which more vulnerable students had more access
to computers than less vulnerable students. Between 2012 and 2018, access for more
vulnerable students was reduced, but equivalent to access for less vulnerable students.
Colombia shows a similar trend, but showing considerably higher values. In 2012,
students in the lowest ISEI quartile had a similar number of computers per student than
students in the highest quartile: 0.47 and 0.49, respectively. In 2015, this indicator rose
to 1.07 in the poorest quartile and 0.83 in the richest. In 2018, it decreased for both
kinds of students to reach similar levels. Finally, Uruguay closed this gap between 2009
and 2012, but since then the access to computers at school has decreased for more
vulnerable students and remained in similar levels for less vulnerable students.
Figure 6. Computer-student ratio in schools by ISEI quartile and participating country.

Source: own elaboration based on PISA 2009-2018.
Note: Latin America average is a simple average of the eight participating countries. OECD average
is a simple average of the OECD countries that participated in all rounds of PISA, excluding
selected countries.
An even starker inequality than between the poorest and richest students is observed
between public and private schools in the region. The average number of computers per
15-year-old students in private school doubles the average for public schools in the
region. The greatest differences between sectors are in Brazil and Mexico, but are also
very relevant in Costa Rica, Peru and Uruguay, with the additional feature that gaps have
been opening in the last few years. Argentina and Colombia show smaller disparities, but
both countries were not able to maintain the difference in favor of public schools that
they generated in 2012 (Argentina) and 2015 (Colombia). It is important to note here
that the inequalities between the public and private sector are considerably higher
compared to the inequalities due to socioeconomic status, which suggests that private

schools have greater capacities to acquire computers beyond the socioeconomic status
of students.
If we perform this analysis slightly differently, focusing on schools with more than .8
computers per student (Figure D-8), we see than in most countries the differences are
attenuated, which suggests that they are not driven by schools that are especially well-
equipped. This is different for Argentina and Colombia, where differences appear to be
larger in favor of public schools, which indicates a more frequent presence of schools
that have around one computer per student.
Figure 7. Computer-student ratio in schools by management type and participating
country.
Source: own elaboration based on PISA 2009-2018.
Note: Latin America average is a simple average of the eight participating countries. OECD average
is a simple average of the OECD countries that participated in all rounds of PISA, excluding
Mexico.

Regarding internet connection of school computers, it can be observed in Figure 8 that in
most countries of the region the percentage of computers in schools that are connected
to the Internet reported by principals is considerably stable. Uruguay (95.1%), Chile
(92.4%), Brazil (90.5%), and Costa Rica (90.3%) are the countries that have the highest
percentage of connected to the Internet computers in 2018. Brazil and Chile have had
stability in this indicator since 2009, while Uruguay shows a remarkable growth between
2009 and 2012, as Costa Rica between 2015 and 2018. Mexico (73.7%), Colombia
(64.3%), Argentina (63.3%) and Peru (57.5%) have lower percentages of computers that
are connected to the internet. It is interesting to note that these four countries have
decreased their level in this indicator when 2018 is compared with 2009 (Colombia),
2012 (Argentina and Peru), or 2015 (Mexico).
Figure 8. Percentage of computers that are connected to the internet by country.
Source: own elaboration based on PISA 2009-2018.

Note: Latin America average is a simple average of the eight participating countries. OECD average
is a simple average of the OECD countries that participated in all rounds of PISA, excluding
Mexico.
Internet access at school is also positively associated with socioeconomic status.
Students in the richest ISEI quartiles attend schools where the percentage of computers
connected to the internet is larger compared to schools attended by students in the
poorest quartile. Nonetheless, Brazil, Chile, Uruguay and, to a lower extent, Costa Rica,
have managed to maintain similar levels in both types of schools in this indicator, as can
be observed in Figure 8. Similar gaps are present between city and rural schools, and
between private and public schools, as can be seen in Figures D-11 and D-12.
It is interesting to note that access to internet at home and at school seem to be
correlated: the countries that show higher levels of access of internet at home are also
the countries that show higher average percentages of computers connected to the
internet in schools – Uruguay, Chile and Brazil. This suggests that, while it is possible to
increase computer access in schools and not at homes, it might not be possible to
provide internet service in school but not at homes, due to the fact that the expansion of
internet connection requires structural components that go beyond purchasing devices.
It is to be seen whether the progress made in wireless Internet connections – 4G, 5G or
satellite-based – can change this trend.
Figure 9. Percentage of computers that are connected to the Internet in schools by ISEI
quartile and participating country.

Source: own elaboration based on PISA 2009-2018.
Note: Latin America average is a simple average of the eight participating countries. OECD average
is a simple average of the OECD countries that participated in all rounds of PISA, excluding
Mexico.
Given these data, I observe that the countries of the region have had quite different
characteristics in terms of the access to devices and internet in both homes and schools
in the last two decades: there is no pattern that can accurately describe all countries.
Two groups can be rapidly distinguished. On one side, Chile and Uruguay are the
countries with the best levels in practically all indicators. Chile is considerably over the
average in access to devices and internet in schools and homes, and shows low
inequalities in this regard compared to the rest of the countries of the region. Uruguay is
in a similar shape in all indicators except for the number of computers per student in
schools, which was discussed above.

On the other pole of the scope, Mexico and Peru have the lowest levels in most of the
reviewed indicators. The access to computers and internet at homes is both lower and
more unequal compared to the rest of the countries. In schools, Peru shows better
indicators in availability of computers in average and inequality, but low levels in internet
provision; while in Mexico, its quite the opposite: there are lower levels of computer
availability in schools, but better levels of internet provision.
Argentina, Brazil, Colombia and Costa Rica are between these two poles, but each of
them has distinct characteristics. Argentina is closer to the average in most indicators
compared to the rest of the countries of the region. Regarding access to computer and
internet at home, it is above average, but a step below Chile and Uruguay. The same
applies to availability of computers in schools – in which Argentina was a regional leader
in 2012, but not in 2018. In what Argentina fails according to these data is in internet
connection in schools, which is both lower and more unequal compared to the regional
average. Costa Rica shares most of Argentina’s characteristics, but is stronger where
Argentina is weaker: it provides considerably better internet provision in schools.
Brazil shows low average levels and concerning inequalities in all indicators related to
access to computers, both at homes and in schools. The opposite applies when Internet
provision is analyzed: it shows some of the highest levels of the region in both schools
and homes and, at the same time, smaller inequalities.
Finally, Colombia is strong in computer availability in schools, in which the country is
clearly a regional leader. However, in the rest of the indicators it shows a relatively poor
performance compared to the other countries in the region.

SCHOOL CAPACITIES, TEACHING PRACTICES AND STUDENT USES
Besides the devices and access to the Internet, PISA asks principals whether the ICT
resources in their schools are sufficient for educational practice. Figure 10 shows the
level of agreement in the sufficiency of different resources in the selected countries. It is
worth noting that in all countries of the region the average level is below “agreement” in
the sufficiency of all of the resources considered in the questionnaire. Chile is the
country of the region where principals are more satisfied with the available resources in
all categories. In a second step, Costa Rica, Uruguay and Mexico show high relative
values in all indicators. Argentina, Brazil, Colombia and Peru have similar values in most
indicators of sufficiency of resources, with a few exceptions: Colombia has a
comparatively high value of agreement with the sufficiency of the number of available
devices (which is consistent with the indicators highlighted in the previous section).
Overall, the shapes of the polygons show that in most countries bandwidth is the
resource with the lowest levels of satisfaction, with the exception of Chile. Computer
power is the second resource for which agreement of sufficiency is the lowest, with the
exception of Costa Rica.
Figure 10. Technological infrastructure in schools in selected countries (2018)
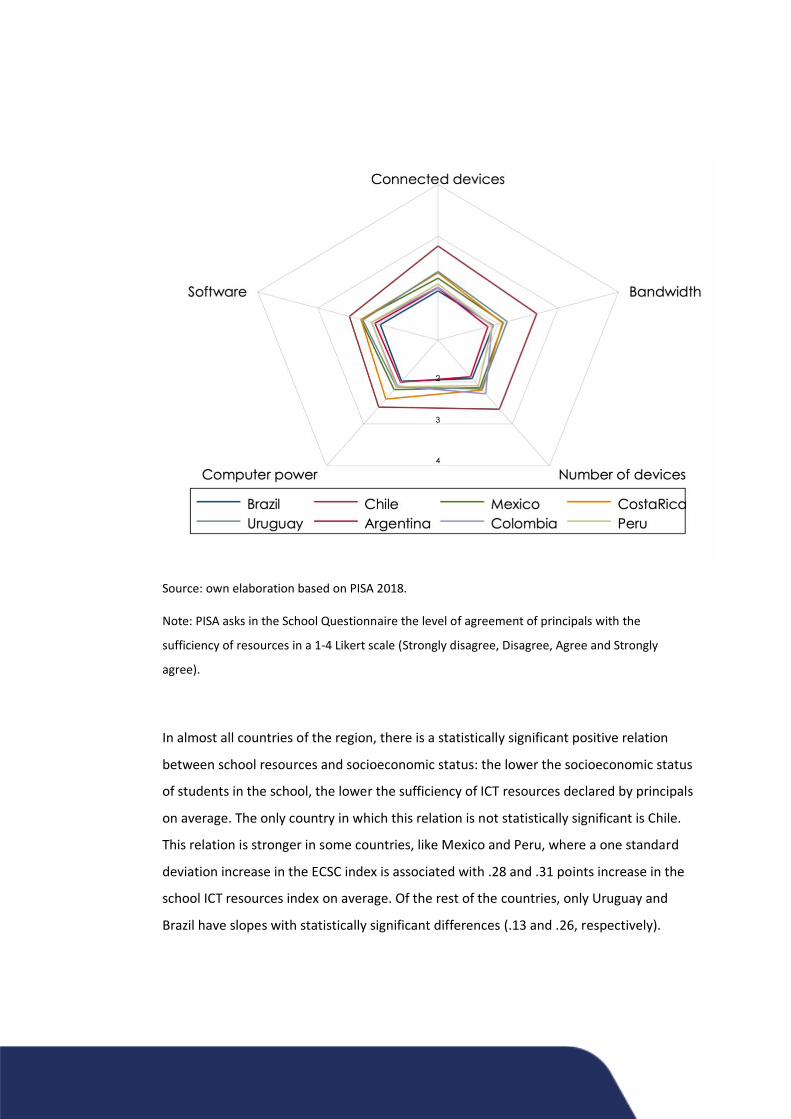
Source: own elaboration based on PISA 2018.
Note: PISA asks in the School Questionnaire the level of agreement of principals with the
sufficiency of resources in a 1-4 Likert scale (Strongly disagree, Disagree, Agree and Strongly
agree).
In almost all countries of the region, there is a statistically significant positive relation
between school resources and socioeconomic status: the lower the socioeconomic status
of students in the school, the lower the sufficiency of ICT resources declared by principals
on average. The only country in which this relation is not statistically significant is Chile.
This relation is stronger in some countries, like Mexico and Peru, where a one standard
deviation increase in the ECSC index is associated with .28 and .31 points increase in the
school ICT resources index on average. Of the rest of the countries, only Uruguay and
Brazil have slopes with statistically significant differences (.13 and .26, respectively).

Figure 11. Technological infrastructure in schools in selected countries by socioeconomic
status (2018).
Source: own elaboration based on PISA 2018.
Note: the heatplots have weighted observations and weighted simple OLS regression lines. Darker
color indicates a larger concentration of observations. The school ICT resources index was
constructed by scaling the questions related to ICT infrastructure resources using a generalized
partial credit model (see Annex A). The SES index is PISA’s index of economic, social and cultural
status (ESCS).
Principals also answer about their perception of teacher capacities to use ICT and the
resources available to support them. Similar to the case of ICT infrastructure resources,
in all indicators the average level is below “agreement” in all countries. Regarding the
relative levels of these indicators in all countries, the landscape is more diverse.
Compared to the rest of the countries, Chile ranks in the first positions in all indicators,
being particularly strong in availability of support staff, pedagogical resources available
for teachers, technical and pedagogical skills in teachers, time availability for teachers to
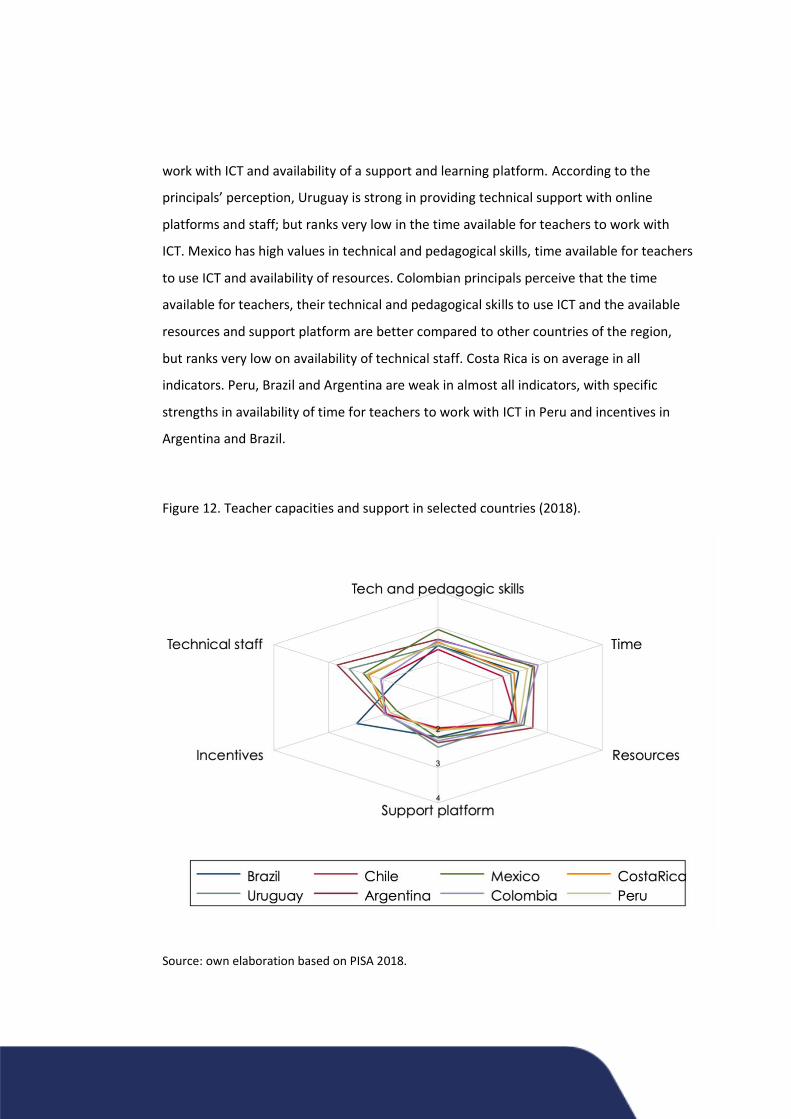
work with ICT and availability of a support and learning platform. According to the
principals’ perception, Uruguay is strong in providing technical support with online
platforms and staff; but ranks very low in the time available for teachers to work with
ICT. Mexico has high values in technical and pedagogical skills, time available for teachers
to use ICT and availability of resources. Colombian principals perceive that the time
available for teachers, their technical and pedagogical skills to use ICT and the available
resources and support platform are better compared to other countries of the region,
but ranks very low on availability of technical staff. Costa Rica is on average in all
indicators. Peru, Brazil and Argentina are weak in almost all indicators, with specific
strengths in availability of time for teachers to work with ICT in Peru and incentives in
Argentina and Brazil.
Figure 12. Teacher capacities and support in selected countries (2018).
Source: own elaboration based on PISA 2018.

Note: PISA asks in the school questionnaire the level of agreement of principals with the
sufficiency of teacher capacities and support regarding ICT use in a 1-4 Likert scale (Strongly
disagree, Disagree, Agree and Strongly agree).
In Uruguay and Chile, there is no statistically significant relation between socioeconomic
status of students and teachers’ capacities and support. In the rest of the countries, the
relation is statistically significant and positive. The slopes range from .17 in Costa Rica
and .23 in Peru, but in these countries there is no statistically significant difference in the
slopes of the regression lines.
The data show interesting patterns. In general, Chile and Uruguay are the countries that
show the best indicators in all the observed dimensions. Regarding school technological
infrastructure and teacher capacities and support, most countries of the region have not
been able to provide the same resources to all students in their education system, and
are hence contributing to increasing inequalities in terms of access and use regarding
ICT. Again, Chile and Uruguay are exceptions to this pattern. These two countries have
managed to have similar resources in schools for students of different socioeconomic
levels. While Chile and Uruguay have strong ICT and education policies that can explain
their good performance, it is surprising to see countries that have also implemented
these kinds of policies at a large scale for a long time like Argentina, Costa Rica and
Colombia in similar levels to countries that have been less consistent, like Brazil, Peru
and Mexico.
Figure 13. Teacher capacities and support in selected countries by socioeconomic status
(2018).

Source: own elaboration based on PISA 2018.
Note: the heatplots have weighted observations and weighted simple OLS regression lines. Darker
color indicates a larger concentration of observations. The Teacher ICT capacity index was
constructed by scaling the questions related to teacher capacities and support regarding ICT using
a generalized partial credit model for selected countries. The SES index is PISA’s index of
economic, social and cultural status (ESCS).
In the ICT familiarity questionnaire, students are asked about different aspects of their
use of ICT in school and at home. Figure 14 shows the declared frequency of use for non-
school activities using ICT outside of school. The shapes of the polygons of all countries
are similar, which indicates that the relative frequency of the different activities is also
similar. The activities that students in the region do more frequently are browsing the
Internet, chatting, using social networks and downloading content (music, films, games,
etc.). On the contrary, gaming, emailing and uploading content are the less frequent. In
most categories, Brazil is the country that shows the highest average values.

Figure 14. Uses by students at home for leisure (2018).
Source: own elaboration based on PISA 2018.
Note: PISA asks in the ICT familiarity questionnaire the frequency of use of digital devices for
different activities using a in a 1-5 Likert scale (Never or hardly ever, Once or twice a month, Once
or twice a week, Almost every day, and Every day). The ICT familiarity questionnaire is optional for
participating countries, and Argentina, Colombia and Peru opted out in 2018.
Consistent with the higher access to digital devices and Internet for higher
socioeconomic levels in students presented in the previous section, the use of ICT out of
school for leisure is related to the socioeconomic status of students. In all countries, this
relation is positive and statistically significant, but their magnitude differs. In Mexico and
Brazil, the association between use for leisure outside of school and socioeconomic
status is of the largest magnitude. In Mexico, a one standard deviation increase in
socioeconomic status is associated with a .25 standard deviation increase in the use of
ICT outside school index. In Brazil, the coefficient is .22, but the difference between the
two countries is not statistically significant. In Costa Rica, Chile and Uruguay, the
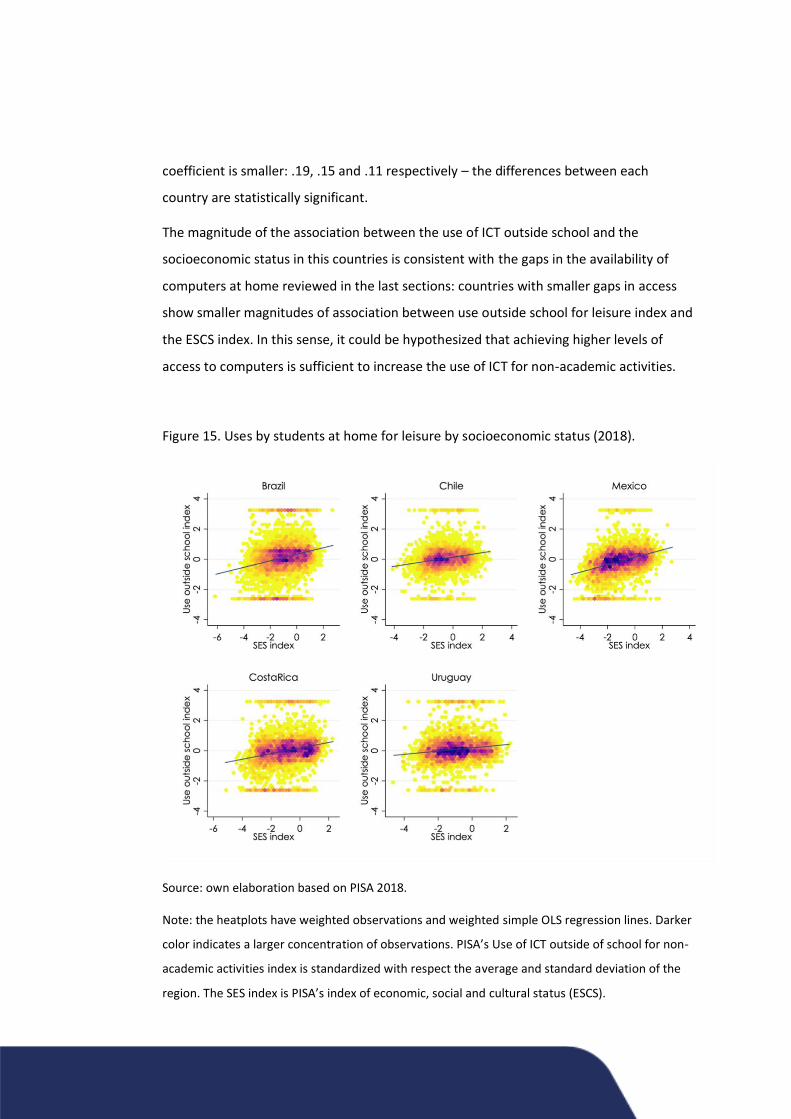
coefficient is smaller: .19, .15 and .11 respectively – the differences between each
country are statistically significant.
The magnitude of the association between the use of ICT outside school and the
socioeconomic status in this countries is consistent with the gaps in the availability of
computers at home reviewed in the last sections: countries with smaller gaps in access
show smaller magnitudes of association between use outside school for leisure index and
the ESCS index. In this sense, it could be hypothesized that achieving higher levels of
access to computers is sufficient to increase the use of ICT for non-academic activities.
Figure 15. Uses by students at home for leisure by socioeconomic status (2018).
Source: own elaboration based on PISA 2018.
Note: the heatplots have weighted observations and weighted simple OLS regression lines. Darker
color indicates a larger concentration of observations. PISA’s Use of ICT outside of school for non-
academic activities index is standardized with respect the average and standard deviation of the
region. The SES index is PISA’s index of economic, social and cultural status (ESCS).

The use of ICT for leisure at home is also associated with gender in all countries of the
region. Independently from the average level, there are statistically significant
differences that favor boys against girls, as shown in Figure 16. The only countries where
the magnitude of the differences between boys and girls has a statistically significant
difference are Chile, where the gender gap is the smallest (.19), and Costa Rica, where
the gap is the largest (.28). It is interesting to contrast this fact with the non-existent
gender gap in availability of ICT resources at homes that was documented earlier in this
paper. For the ICT gender gap, it seems that providing devices and internet connection is
not enough to promote a higher level of use in girls.
Figure 16. Uses by students at home for leisure by gender (2018).
Source: own elaboration based on PISA 2018.
Note: PISA’s Use of ICT outside of school for non-academic activities index is standardized with
respect the average and standard deviation of the region.
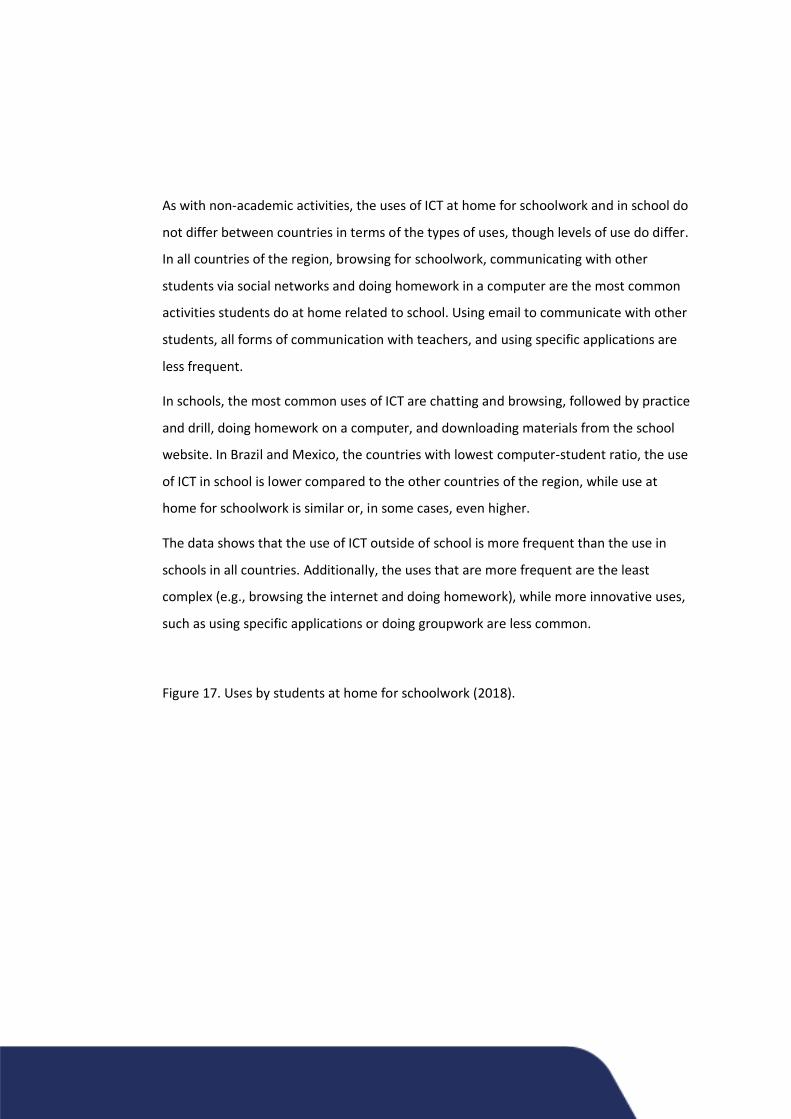
As with non-academic activities, the uses of ICT at home for schoolwork and in school do
not differ between countries in terms of the types of uses, though levels of use do differ.
In all countries of the region, browsing for schoolwork, communicating with other
students via social networks and doing homework in a computer are the most common
activities students do at home related to school. Using email to communicate with other
students, all forms of communication with teachers, and using specific applications are
less frequent.
In schools, the most common uses of ICT are chatting and browsing, followed by practice
and drill, doing homework on a computer, and downloading materials from the school
website. In Brazil and Mexico, the countries with lowest computer-student ratio, the use
of ICT in school is lower compared to the other countries of the region, while use at
home for schoolwork is similar or, in some cases, even higher.
The data shows that the use of ICT outside of school is more frequent than the use in
schools in all countries. Additionally, the uses that are more frequent are the least
complex (e.g., browsing the internet and doing homework), while more innovative uses,
such as using specific applications or doing groupwork are less common.
Figure 17. Uses by students at home for schoolwork (2018).

Source: own elaboration based on PISA 2018.
Note: PISA asks in the ICT familiarity questionnaire the frequency of different activities done
outside of school for schoolwork using a in a 1-5 Likert scale (Never or hardly ever, Once or twice
a month, Once or twice a week, Almost every day, and Every day). The ICT familiarity
questionnaire is optional for participating countries, and Argentina, Colombia and Peru opted out
in 2018.
Figure 18. Uses of ICT in school by students (2018).

Source: own elaboration based on PISA 2018.
Note: PISA asks in the ICT familiarity questionnaire the frequency of different activities done in
school using a in a 1-5 Likert scale (Never or hardly ever, Once or twice a month, Once or twice a
week, Almost every day, and Every day). The ICT familiarity questionnaire is optional for
participating countries, and Argentina, Colombia and Peru opted out in 2018.
Similarly, the frequency of uses for different subjects is higher at home than in schools,
as can be seen in Figure 19. In general, language and science are the subjects that
register more frequency of ICT use, followed by foreign language and social studies. It is
interesting to note that in Brazil the use of ICT for math is similar to the other mentioned
subjects and that in Costa Rica students declare using ICT with the most frequency in
foreign language.
Figure 19. Use by students for subjects in school and at home (2018).

Source: own elaboration based on PISA 2018.
PISA asks in the ICT familiarity questionnaire how much time the students spend using digital
devices for school subjects in a typical school week during classroom lessons and outside of
classroom lessons using a in a 1-4 Likert scale (No time, 1-30 minutes, 31-60 minutos, More than
60 minutes). The ICT familiarity questionnaire is optional for participating countries, and
Argentina, Colombia and Peru opted out in 2018.
In addition, PISA inquires about who uses ICT when it is used in the classrooms. In
general, students declare that both teachers and students use ICT more frequently than
students and teachers alone. There are two interesting exceptions to these pattern: in
Chile, it is more common that only teachers use ICT in the classrooms and, in Uruguay,
the use of ICT only by students in the classrooms is more frequent than in the rest of the
countries. This is coincidental with two countries with a high penetration of ICT, but that
have opted for different models of provision of devices.

Figure 20. Frequency of use in schools by students and teachers (2018).
Source: own elaboration based on PISA 2018.
Note: in the ICT familiarity questionnaire students are asked to state whether a digital device was
used in the last month and by whom in different subjects.
Gender differences in use of ICT in class and outside class for subjects are not
straightforward. In general, the use in class tends to be similar for boys and girls.
Nonetheless, there is a small difference that favors boys in Brazil, Mexico and Uruguay
(see Figure D-13). Outside school, I see different patterns (Figure 21). On one hand, in
Costa Rica and Mexico boys use ICT for subjects outside schools more than girls, while in
Chile, Uruguay and, at a lesser extent, Costa Rica, female students declare using ICT with
more frequency. In any case, it is interesting to compare with ICT use for leisure outside
school, were there was a stark difference in all countries that favored male students.
Regarding use for school subjects, this inequality is not observed as clearly.

Figure 21. Use by students for subjects at home by gender (2018).
Source: own elaboration based on PISA 2018.
Note: PISA’s Use of ICT outside of school for school subjects index is standardized with respect the
average and standard deviation of the region.
Use outside school for schoolwork and use in school are related to socioeconomic status,
as can be seen in Figures 22 and 23. In all countries of the region there is a statistically
positive significant relation between the use of ICT for schoolwork outside school and the
ESCS index, and between the use of ICT in school index and the ESCS index. As with
previously analyzed trends, in Uruguay and Chile the relation is of a smaller magnitude
compared to the rest of the countries. It is interesting to note that the coefficients are
smaller in the uses in school compared to the uses outside of school for schoolwork (e.g.,
.05 vs .10 in Uruguay and .14 vs .23 in Mexico). Since both variables are standardized,
this entails that the use of ICT in school is less dependent on socioeconomic status
compared to the use of ICT outside of school for schoolwork. A very similar trend can be

observed regarding use for subjects at home (Figure D-14) and in schools (Figure D-15).
This pattern may have to do with the fact that ICT use in school for academic purposes is
less frequent on average that at homes.
How much these different frequencies are caused by schools intentionally or by default is
something that future efforts for collecting data at the system level should inquire. It is
possible that schools are explicitly commanding students of higher socioeconomic status
to use ICT for academic purposes at homes more than lower socioeconomic status
students, but it is also possible that homework is not necessarily intended to be solved
using ICT, and that higher socioeconomic status students intuitively solve it using ICT,
while lower socioeconomic status students do not.
Figure 22. Uses by students at home for schoolwork by socioeconomic status (2018).
Source: own elaboration based on PISA 2018.
Note: the heatplots have weighted observations and weighted simple OLS regression lines. Darker
color indicates a larger concentration of observations. PISA’s Use of ICT outside of school for

academic activities index is standardized with respect the average and standard deviation of the
region. The SES index is PISA’s index of economic, social and cultural status (ESCS).
Figure 23. Uses of ICT in school by students (2018).
Source: own elaboration based on PISA 2018.
Note: the heatplots have weighted observations and weighted simple OLS regression lines. Darker
color indicates a larger concentration of observations. PISA’s Use of ICT outside in school for
academic activities index is standardized with respect the average and standard deviation of the
region. The SES index is PISA’s index of economic, social and cultural status (ESCS).
.

STUDENT OUTCOMES
Using questions related to students self-perception of their ICT use, PISA builds four
different indexes that can be thought as “outcomes” of the experiences of students with
ICT, in absence of a more rigorous assessment. These indexes are 1) interest in ICT, 2)
self-perceived competence using ICT, 3) self-perceived autonomy using ICT, and 4)
presence of ICT in interactions between peers. See Annex A for more details. In this
section, I analyze these indexes in relation to the variables regarding academic and non-
academic uses in school and outside school reviewed in the previous section.
The average levels of each index show some interesting contrasts. Regarding interest in
ICT, Costa Rica and Brazil show the highest levels, with .13 and .10 standard deviations
over the regional average, respectively. In contrast, Mexico and Uruguay show the
lowest levels, with -.13 and -.12 respectively. In self-perceived competence using ICT, the
spread between countries is less than in the other indexes. Costa Rica and Chile (.05
both) show the largest average values and the average values in the rest of the countries
are around the regional average and there are no statistically significant differences
between them – even though Brazil shows a greater presence of extreme values in the
index. Interestingly, students in Brazil and Chile appear to be the most autonomous in
the use of ICT on average (.10 and .07, respectively), leaving Uruguay (-.06), Costa Rica (-
.08) and Mexico (-.14) behind. Finally, Brazilian students are the ones that talk the most
about ICT with their peers (.03), and Chile the one where students talk about them the
least (-.11).
Figure 24. ICT indexes for students (2018).
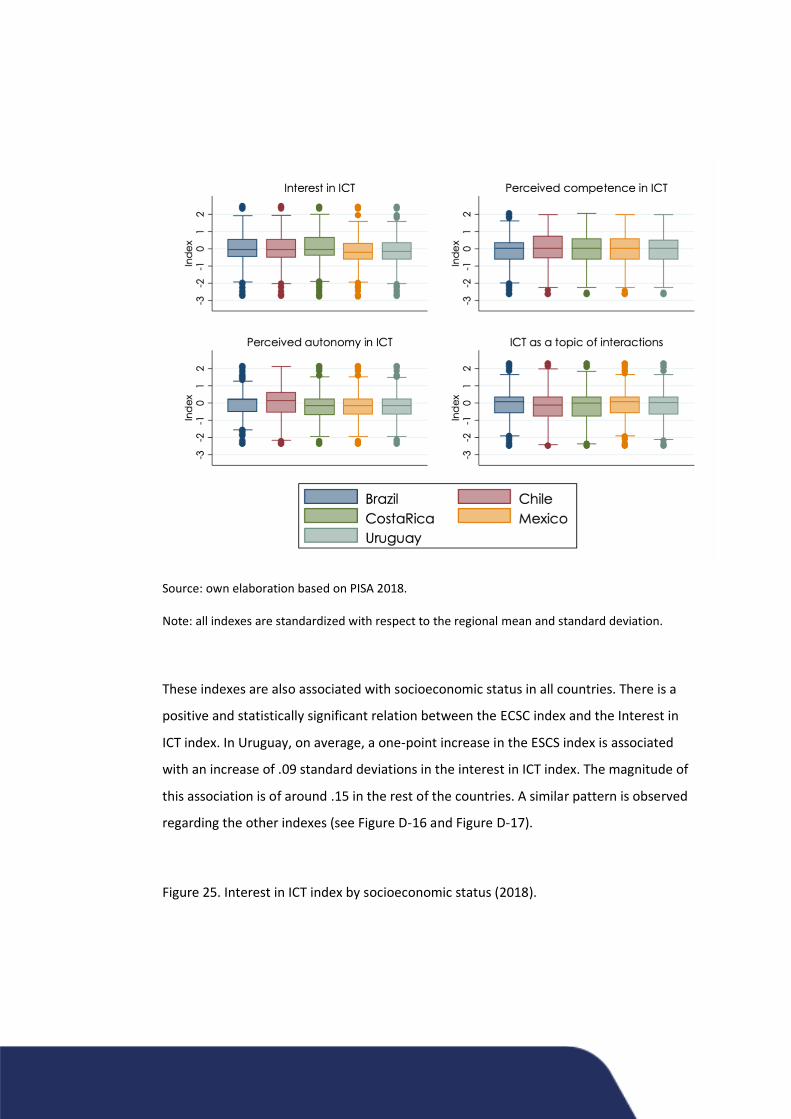
Source: own elaboration based on PISA 2018.
Note: all indexes are standardized with respect to the regional mean and standard deviation.
These indexes are also associated with socioeconomic status in all countries. There is a
positive and statistically significant relation between the ECSC index and the Interest in
ICT index. In Uruguay, on average, a one-point increase in the ESCS index is associated
with an increase of .09 standard deviations in the interest in ICT index. The magnitude of
this association is of around .15 in the rest of the countries. A similar pattern is observed
regarding the other indexes (see Figure D-16 and Figure D-17).
Figure 25. Interest in ICT index by socioeconomic status (2018).

Source: own elaboration based on PISA 2018.
Note: the heatplots have weighted observations and weighted simple OLS regression
lines. Darker color indicates a larger concentration of observations. PISA’s Interest in ICT
index is standardized with respect the average and standard deviation of the region. The
SES index is PISA’s index of economic, social and cultural status (ESCS).
Gender inequalities are particularly interesting regarding these indexes. In the interest in
ICT index (Figure 26), gender differences are not statistically significant in Chile, Uruguay
and Costa Rica; while in Mexico and Brazil, female students declare more interest in ICT
than male students on average. In contrast, regarding self-perceived competence in ICT,
the gap in favor of boys is stark, as shown in Figure 27. These figures can be contrasted
with the perception of difficulty of reading tasks (Figure D-18), which tends to favor girls.
In this sense, it would seem like the gender gap in ICT in the region is not a matter of lack
of interest or absence of ICT devices, but of finding a way of introducing them in their use
and develop their competences.

Figure 26. Interest in ICT index by gender (2018).
Source: own elaboration based on PISA 2018.
Note: PISA’s Interest in ICT index is standardized with respect the average and standard deviation
of the region.
Figure 27. Competence in ICT index by gender (2018).

Source: own elaboration based on PISA 2018.
Note: PISA’s Competence in ICT index is standardized with respect to the average and standard
deviation of the region.
Finally, there is a small magnitude relation between self-perceived competence in ICT
and school resources. In Uruguay and Chile, in fact, this relation is not statistically
significant. In Costa Rica and Brazil, a one-point increase in the school ICT resources index
is associated with a .06 and .08 increase in the competence in ICT index on average,
respectively. In Mexico, this association is larger: .12. A similar trend is observed for the
relation between other measures of school ICT resources or practices and other
outcomes (see Figure D-19 and Figure D-20).
Figure 28. Competence in ICT index by school ICT resources index (2018).

Source: own elaboration based on PISA 2018.
Note: the heatplots have weighted observations and weighted simple OLS regression lines. Darker
color indicates a larger concentration of observations. PISA’s competence in ICT index is
standardized with respect the average and standard deviation of the region. The school ICT
resources index was constructed by scaling the questions related to ICT infrastructure resources
using a generalized partial credit model.
The measures that are more related to student self-perceived outcomes regarding ICT
are the ones related to use. The one that shows the largest magnitudes of associations is
use of ICT for leisure outside of school, as shown in Figure 29. The magnitudes of the
positive association between the two variables range from 0.28 in Brazil to 0.42 in
Mexico. A similar trend, but with a smaller magnitude, can be observed with uses for
academic purposes. Consistent with the previously reviewed relations, the frequency of
use at home for academic purposes shows a stronger relation to self-perceived
competence than the frequency of use in school (Figure D-21 and Figure D-22).

These associations point to the importance of fostering independent use of ICT to
improve the ICT skills of students. This is of course a challenge for education policy, since
the range of action for schools to increase student use of ICT is limited to school tasks.
For ICT & education policies, it may indicate the importance of policies that guarantee
availability of devices at homes, since the use of ICT for leisure is possible when students
can access a device.
Figure 29. Competence in ICT index by use of ICT outside school for leisure index (2018).
Source: own elaboration based on PISA 2018.
Note: the heatplots have weighted observations and weighted simple OLS regression lines. Darker
color indicates a larger concentration of observations. PISA’s competence in ICT index is
standardized with respect the average and standard deviation of the region.
.

CONCLUSIONS
In this paper, I have reviewed the landscape of education & ICT in selected countries of
Latin America. The different sections have analyzed the main characteristics of the design
of their most important ICT & education policies, the evolution of device and Internet
connection availability, the school capacities and uses of ICT by students for academic
and non-academic purposes in schools and outside schools, and some outcomes defined
in terms of student self-perception. In all the analyses, a specific focus has been made on
socioeconomic status and gender inequalities.
All selected countries have implemented ICT and education policies, but there are many
differences concerning their design and implementation. The types of devices have
evolved from desktop computers to laptops and tablets over the years. Some countries
have decided to deliver computers directly to students through schools, while others
have equipped schools with computers to be used exclusively in classrooms. The scale of
the programs has also differed: some countries have been able to reach a national scale,
while others have remained in a state or pilot level.
Teacher training and content development are definitely points to strengthen in the
design of edtech policies in the region. While great efforts and large numbers of teachers
were reached by a large amount of training offers and pedagogical resources, it is
difficult to find in most countries a coherent framework that can orient teachers into
using evidence-based practical approaches to make the most of the use of ICT in the
classroom. Uruguay is a notable exception to this trend, which is mainly explained by the
explicit decision to focus in a few areas of intervention. I believe a more rigorous and
systematic approach is warranted, to which academic research should contribute in
determining the characteristics of the training and materials that are needed.
The continuity and stability of these policies is another aspect that needs more attention.
In this regard, Uruguay and Costa Rica are examples of consistent policy implementation
throughout the last decades, and their decision to locate the decision-making of ICT
policies in an agency with a great degree of independence has proven very effective
compared to the other countries of the region, which have seen these policies subject to
political struggles. Chile has also managed to sustain efforts through a large period of
time, even if there was a discontinuity of Enlaces in 2018.

In terms of device distribution, the data from PISA shows a great coincidence between
policy design and the actual numbers of computer availability. Countries that have
implemented programs that distributed computers contemplating student ownership
have seen the percentage of computers that are available at students’ home for
schoolwork rise, while countries that opted for computer- or mobile-labs in schools, like
Colombia and Costa Rica, have seen lower levels of computer availability at homes and
higher numbers of computers per student in schools. Countries that were less consistent
in their implementation of ICT and education policies show lower levels of device
availability both in homes and schools.
Internet connection is still an important weakness in most countries of the region, both
in terms of availability and bandwidth. Countries that show higher levels of access of
internet at home are also the countries that show higher average percentages of
computers connected to the internet in schools – Uruguay, Chile and Brazil. This suggests
that efforts to increase connectivity for educational uses should not be restricted to
school buildings.
In most countries of the region, school and teacher capacities and support are still
stronger for students of higher socioeconomic status. The exception of Chile and
Uruguay in this regard shows that even for countries with high levels of poverty and
inequality it is possible to at least provide the same opportunities inside schools. A
challenge in the future is to advance this agenda to compensate the differences caused
by inequalities at the household level, which are present throughout the region, and are
manifested in the indicators that review use of ICT at homes for non-academic matters –
in which Uruguay has been the most successful in reducing socioeconomic inequalities. A
similar trend exists regarding use of ICT for academic purposes. In schools, the
inequalities of ICT use are considerably smaller compared with the use at homes.
These trends help explain why interest, self-perceived autonomy, self-perceived
competence and presence of ICT as a topic of conversation are lower for more
disadvantaged students in all countries of the region. These outcomes does not seem to
be related to school ICT equipment, but appear to be driven by use at homes, especially
non-academic uses. This draws attention especially to countries that have not decided to
provide devices to students outside school equipment, since they seem essential to
foster ICT skills.
Gender inequalities are present in a particular way in what is related to ICT and
education. There are no differences in the technological resources available for girls and
boys in schools and in households. In some countries, girls use ICT for education in their
homes even more than boys and are more interested in ICT. Nonetheless, the frequency
of use of ICT for non-academic purposes is considerably lower for girls compared to boys,
and their self-perceived competence and autonomy is also much lower. This means that
gender gaps regarding ICT need more effort than resource provision, in which the region
has been egalitarian according to the data that was reviewed.
In the last few years, the education and ICT agenda in the region had slowed down
considerably, as many important programs were descaled or finished, but the COVID-19
pandemic in 2020 forced all countries of the region to step up with solutions to a context
where remote instruction had to be quickly implemented. This report provides a baseline
for how different countries in the region were prepared to face the challenge of remote
instruction. There was much learning that has been achieved in the last two decades, but
most countries of the region still faced lack of devices, infrastructure and low levels of
adoption of ICT in education practices. While in this moment it is difficult to
conceptualize the sudden growth that the pandemic has surely forced all countries of the
region to do, in the next few years we will be able to measure a new landscape, which
undoubtedly will be still heterogeneous.
Equipping the next generation with digital skills is probably more important now than
when this agenda was a protagonist in the region. It is necessary that ICT and education
policies evolve into a new agenda, which should go beyond inputs, and focus in building
consistent guidelines for teachers to adapt ICT in the best way to promote learning, in a
context in which new generations of teachers that have grown in a world were ICT are
omniprescent are being incorporated to the education systems. State capacities need
also to measure up, and start monitoring the processes – by building national indicators
of ICT use in schools – and the impact of the different components of their programs. In
this regard, regular measures of ability using ICT are fundamental, and countries like
Costa Rica and Chile can provide great models to be adapted to each country. I believe

that this way the region will be able to learn from what has been achieved and move
closer towards providing their students with fundamental tools for their future.
.

REFERENCES
Balarin, M., 2013. Las políticas TIC en los sistemas educativos de América Latina: caso
Perú. Las políticas TIC en los sistemas educativos de América Latina. UNICEF.
Barrera-Osorio, F., Linden, L.L., 2009. The use and misuse of computers in education:
Evidence from a randomized experiment in Colombia. World Bank Policy Research
Working Papers Impact Evaluation Series no. 29.
Benítez Langhi, S., Zukerfeld, M., 2015. Flujos de conocimientos, tecnologías digitales y
actores sociales en la educación secundaria. Un análisis socio-técnico de las capas
del Plan Conectar Igualdad., Impacto de las Nuevas Tecnologías en Educación.
Centro Interdisciplinario de Estudios de Ciencia, Tecnología e Innovación.
Beuermann, D.W., Cristia, J., Cueto, S., Malamud, O., Cruz-Aguayo, Y., 2015. One Laptop
per Child at Home: Short-Term Impacts from a Randomized Experiment in Peru.
American Economic Journal: Applied Economics 7, 53–80.
https://doi.org/10.1257/app.20130267
Bianconcini de Almeida, M.E., 2014. Las políticas TIC en los sistemas educativos de
América Latina: caso Brasil., Las políticas TIC en los sistemas educativos de América
Latina. UNICEF.
Centro de Innovación (2020a). Preguntas frecuentes. http://innovacion.mineduc.cl/wp-
content/uploads/sites/108/2018/09/Preguntas_Frecuentes_Centro_de_Innovacio
n_Mineduc.pdf
Centro de Innovación, 2020b. Iniciativas. http://innovacion.mineduc.cl/iniciativas/
Chin-Roemer, R., DeCrease, B., Gomez, R., 2011. Exploring e-learning development:
studies of ICT access and educational usage in Latin America. Information
Development 27, 280–289. https://doi.org/10.1177/0266666911424076
Claro, M., 2010. La incorporación de tecnologías digitales en educación. Modelos de
identificación de buenas prácticas., Colección Documentos de Proyecto. CEPAL.
Claro, M., Espejo, A., Jara, I., Trucco, D., 2011. Aporte del sistema educativo a la
reducción de las brechas digitales. Una mirada desde las mediciones PISA
(Documento de Proyecto). CEPAL.

Claro, M., Nussbaum, M., López, X., Díaz, A., 2013. Introducing 1 to 1 in the Classroom:
A Large-scale Experience in Chile. Educational Technology & Society 16 (3), 315–
328.
Computadores para Educar, 2020. Historia.
http://www.computadoresparaeducar.gov.co/es/historia
Cristia, J.P., Ibarrarán, P., Cueto, S., Santiago, A., Severín, E., 2012. Technology and Child
Development: Evidence from the One Laptop Per Child Program (IZA Discussion
Paper Series No. 6401).
de Melo, G., Machado, A., Miranda, A., n.d. The Impact of a One Laptop per Child
Program on Learning: Evidence from Uruguay 17.
de Resende, C.C., Zoghbi, A.C., 2017. Tecnologia e Desempenho Escolar: Uma Avaliação
de Impacto do Programa Um Computador por Aluno.
Díaz Barriga Arceo, F., 2014. Las políticas TIC en los sistemas educativos de América
Latina: caso México., Las políticas TIC en los sistemas educativos de América
Latina. UNICEF.
DiMaggio, P., Hargittai, E., Celeste, C., Shafer, S., 2004. From Unequal Access to
Differentiated Use: A Literature Review and Agenda for Research on Digital
Inequality. Russell Sage Foundation.
Draca, M., Martin, R., Sanchis-Guarner, R., 2018. The Evolving Role of ICT in the
Economy (Consulting Report). London School of Economics and Political Science.
Dughera, L., 2015. De Internet, computadoras portátiles, softwares y contenidos. Un
análisis comparativo de planes “una computadora, un alumno” en tres provincias
de la Argentina. Facultad Latinoamericana de Ciencias Sociales, Buenos Aires.
Dussel, I., 2015. La incorporación de TIC en la formación docente de los países del
MERCOSUR. Estudios comparados sobre políticas e instituciones., 1st ed. Editorial
Teseo - OEI - MERCOSUR.
Educ.ar, 2015. Conectar Igualdad llega a 5 millones de computadoras.
https://www.educ.ar/noticias/127014/educar-y-conectar-5millones

Escueta, M., Quan, V., Nickow, A.J., Oreopoulos, P., 2017. Education Technology: An
Evidence-Based Review (No. w23744). National Bureau of Economic Research,
Cambridge, MA. https://doi.org/10.3386/w23744
Fariña, P., San Martín, E., Preiss, D.D., Claro, M., Jara, I., 2015. Measuring the relation
between computer use and reading literacy in the presence of endogeneity.
Computers & Education 80, 176–186.
https://doi.org/10.1016/j.compedu.2014.08.010
Fiscarelli, A. P., Riffo, D. E., & Seguel, C. E., 2018. Evaluación Programas
Gubernamentales: Programas Yo Elijo mi PC y Me Conecto para Aprender.
MINISTERIO DE EDUCACIÓN - JUNTA NACIONAL DE AUXILIO ESCOLAR Y BECAS
(JUNAEB).
Fundación Omar Dengo, 2020. Nuestro impacto. http://sitionuevo.fod.ac.cr/nuestro-
impacto/
Fundación Varsavsky (2005, April 7). Educ.ar. Fundación Varsavsky.
https://spanish.varsavskyfoundation.org/educar/educar.html
Fuoco, T. (2008, December 9). Brasil tenta novamente comprar notebook educacional.
Reuters. https://es.reuters.com/article/internet-tech-uca-licita-
idBRSPE4B80FI20081209
Galvis Panqueva, Á.H., 2014. Las políticas TIC en los sistemas educativos de América
Latina: caso Colombia., Las políticas TIC en los sistemas educativos de América
Latina. UNICEF.
Gomes, C.A.S., 2015. Avaliaçao de Programa “Um computador por aluno” (PROUCA) sob
a óptica do modelo CIPP. Universidade Federal do Ceará, Fortaleza.
Hinostroza, J.E., 2017. TIC, educación y desarrollo social en América Latina y el Caribe,
UNESCO Policy Papers. OREALC/UNESCO, Montevideo.
Hinostroza, J.E., Matamala, C., Labbé, C., Claro, M., Cabello, T., 2015. Factors (not)
affecting what students do with computers and internet at home. Learning, Media
and Technology 40, 43–63. https://doi.org/10.1080/17439884.2014.883407

Instituto de Estadística de la UNESCO, 2013. Uso de tic en educación en américa latina y
el caribe: Análisis regional de la integración de las tic en la educación y de la
aptitud digital (e-readiness). Instituto de Estadística de la UNESCO.
https://doi.org/10.15220/978-92-9189-125-2-sp
InterAmerican Dialogue Working Group on Innovation and Technology in Education,
2019. Transforming Learning Through the Use of Educational Technology:
Challenges and Opportunities in Latin America.
International Telecommunications Union, n.d. Measuring the Information Society
Report (Volume 1). International Telecommunications Union.
Ithurburu, V., 2019. Políticas digitales en los sistemas educativos de América Latina
(2013-2018). IIPE-UNESCO. Buenos Aires
Jara, I., 2013. Las políticas TIC en los sistemas educativos de América Latina: caso Chile.,
Las políticas TIC en los sistemas educativos de América Latina. UNICEF.
Jara, I., Claro, M., Hinostroza, J.E., San Martín, E., Rodríguez, P., Cabello, T., Ibieta, A.,
Labbé, C., 2015. Understanding factors related to Chilean students’ digital skills: A
mixed methods analysis. Computers & Education 88, 387–398.
https://doi.org/10.1016/j.compedu.2015.07.016
Jara Valdivia, I., 2008. Las políticas de tecnología para escuelas en América Latina y el
mundo: visiones y lecciones (CEPAL - Colección Documentos de Proyectos). CEPAL,
Santiago, Chile.
Lavinas, L., Veiga, A., 2013. Brazil’s One Laptop per Child Program: Impact evaluation
and implementation assessment. Cadernos de Pesquisa, 543 v.43, p.542-569.
Lemoine, R., Alfonso, M.C., Bohórquez, J.C., 2015. Evaluación de impacto y de la
sostenibilidad de Computadores para Educar en la calidad de la educación en las
sedes educativas beneficiadas. Centro Nacional de Consultoría.
Lima, A.F.R., Sachsida, A., Ywata de Carvalho, A.X., 2018. Uma análise econométrica do
programa Um Computador por Aluno (No. 2363), Texto para Discussão. Instituto
Lugo, M.T., 2015. Las Políticas TIC en la educación de América Latina. Una oportunidad
para saldar deudas pendientes. Archivos de Ciencias de la Educación, DOSSIER

Tecnologías digitales en la enseñanza, inclusión y complejidades de un fenómeno
multidimensional 16.
Lugo, M.T., Ithurburu, V., 2019. Políticas digitales en América Latina. Tecnologías para
fortalecer la educación de calidad. RIEOEI 79, 11–31.
https://doi.org/10.35362/rie7913398
Lugo, M.T., López, N., Toranzos, L., 2014. Políticas TIC en los Sistemas Educativos de
América Latina, Informe sobre tendencias sociales y educativas en América Latina
2014. Sistema de Información de Tendencias Educativas en América Latina. IIPE-
UNESCO.
Lugo, M.T., Ruiz, V., Brito, A., Brawerman, J., n.d. Revisión comparativa de iniciativas
nacionales de aprendizaje móvil en América Latina: los casos de Colombia, Costa
Rica, Perú y Uruguay; 2016 157.
Martínez, S.L. (Ed.), 2015. De tecnologías digitales, educación formal y políticas públicas.
Aportes al debate. Teseo, Buenos Aires.
Ministério de Educaçao, 2017. Educaçao conectada.
http://educacaoconectada.mec.gov.br/images/pdf/portaria_1602_28122017.pdf
Ministério de Educaçao, 2020a. Plan Banda Larga nas Escolas.
http://portal.mec.gov.br/par/193-secretarias-112877938/seed-educacao-a-
distancia-96734370/15808-programa-banda-larga-nas-escolas
Ministério de Educaçao, 2020b. PROINFO-Integrado.
http://portal.mec.gov.br/acessibilidade-sp-940674614/271-programas-e-acoes-
1921564125/seed-1182001145/13156-proinfo-integrado
Ministério da Educaçao, 2020c. Recursos Educainais Digitais.
https://plataformaintegrada.mec.gov.br/sobre
Muñoz, L., Brenes, M., Bujanda, M.E., Mora, M., Núñez, O., Zúñiga, M., 2014. Las
políticas TIC en los sistemas educativos de América Latina: caso Costa Rica.
UNICEF.
OECD, 2006. Are Students Ready for a Technology-Rich World?: What PISA Studies Tell
Us, PISA. OECD. https://doi.org/10.1787/9789264036093-en

OECD, 2015. Students, Computers and Learning: Making the Connection, PISA. OECD.
https://doi.org/10.1787/9789264239555-en
Olarte Dussán, F.A., Rodríguez Alarcón, J.A., Rodríguez Jiménez, O.R., Monroy Varela,
S.E., Serrato Castillo, G., Díaz Moya, Á.P., 2018. Informe final del estudio de
medición y evaluación de impacto de CPE 2014-2018. Universidad Nacional de
Colombia.
One Laptop per Child (n.d.). OLPC Brasil. One Laptop per Child. Retrieved October 28,
2020. http://wiki.laptop.org/go/OLPC_Brazil
Patiño, J.A., Poveda, L., Martínez, A.L., 2018. Monitoreo de la Agenda Digital para
América Latina y el Caribe eLAC 2018. CEPAL y NIC.br.
Plan Ceibal, 2018a. Resultados del monitoreo del estado del parquet de equipos en
Primaria. Resumen 2018. Departamento de Monitoreo y Evaluación. Plan Ceibal.
https://www.ceibal.edu.uy/storage/app/media/evaluacion-
monitoreo/Monitoreo%20Estado%20Parque%20Resumen%20Primaria%202018.p
df
Plan Ceibal, 2018b. Resultados del monitoreo del estado del parquet de equipos en
Media. Resumen 2018. Departamento de Monitoreo y Evaluación. Plan Ceibal.
https://www.ceibal.edu.uy/storage/app/media/evaluacion-
monitoreo/Monitoreo%20Estado%20Parque%20Resumen%20Media%202018.pdf
Plan Ceibal, 2020. Plan Ceibal. https://www.ceibal.edu.uy/es/
Presidency of Argentina, 2010. Decreto 459/10. Ministerio de Justicia y Derechos
Humanos. http://servicios.infoleg.gob.ar/infolegInternet/anexos/165000-
169999/165807/norma.htm
PROINFO, 2009. Proinfo – Composiçao dos Laboratórios.
http://portal.mec.gov.br/acessibilidade-sp-940674614/152-programas-e-acoes-
1921564125/proinfo-1460344698/237-proinfo-composicao-dos-laboratorios
Rivas, A., 2018. Un sistema educativo digital para la Argentina (No. 165), Documento de
Trabajo. CIPPEC.

Rivera Vargas, P., Cobo Romaní, C., 2019. Plan Ceibal en Uruguay: una política pública
que conecta inclusión e innovación, in: Políticas Públicas para la Equidad Social.
Universidad de Santiago de Chile, p. 17.
Rivoir, A.L. (Ed.), 2012. Plan Ceibal e inclusión social: perspectivas interdisciplinarias.
Plan Ceibal : Universidad de la República, Montevideo, Uruguay.
Rodrigues de Souza da Silva, L., 2014. Implementaçao do Programa Um Computador por
Aluno: Uma revisão da literatura. Universidad Campinas.
Rodríguez Orgales, C., Sánchez Torres, F., Márquez Zúñiga, J., 2011. Impacto del
Programa “Computadores para Educar” en la deserción estudiantil, el logro escolar
y el ingreso a la educación superior. (No. 15), Documentos del Centro de Estudios
sobre Desarrollo Económico. Universidad de Los Andes. Facultad de Economía.
Román, M., Murillo, F.J., 2014. Disponibilidad y uso de TIC en escuelas latinoamericanas:
incidencia en el rendimiento escolar. Educ. Pesqui. 40, 879–895.
https://doi.org/10.1590/s1517-97022014121528
Santiago, P., Ávalos, B., Burns, T., Morduchowicz, A., Radinger, T., 2016. OECD Reviews
of School Resources: Uruguay 2016, OECD Reviews of School Resources. OECD.
https://doi.org/10.1787/9789264265530-en
Secretaría de Educación Pública, 2016. Programa @prende 2.0. Programa de Inclusión
Digital 2016-2017.
Secretaría de Educación Pública, 2020. Preguntas frecuentes sobre el programa.
https://www.gob.mx/epn/articulos/preguntas-frecuentes-sobre-el-programa-mi-
compu-mx
Sunkel, G., 2006. Las tecnologías de la información y la comunicación (TIC) en la
educación en América Latina: una exploración de indicadores, Serie Políticas
Sociales. Naciones Unidas, CEPAL, División de Desarrollo Social, Santiago.
Sunkel, G., Trucco, D., 2011. New Information and Communications Technologies for
Education in Latin America: Risks and Opportunities (CEPAL - Serie Políticas
Sociales No. 167). CEPAL.

Sunkel, G., Trucco, Daniela, Espejo, A., 2014. La Integración de las Tecnologías Digitales
en las Escuelas de América Latina y el Caribe: Una Mirada Multidimensional, Libros
de la CEPAL. UN. https://doi.org/10.18356/40600545-es
Tedesco, J.C., 2014. Tecnologías de la información y desigualdad educativa en América
Latina. EPAA. https://doi.org/10.14507/epaa.v22n48.2014
Tedesco, J.C., Steinberg, C., Tófalo, A., Programa TIC y Educación Básica (UNICEF
Argentina), UNICEF Argentina, 2015. Resultado de la Encuesta Nacional sobre
Integración de TIC de Educación Básica Argentina. Unicef Argentina : Programa TIC
y Educación Básica, Buenos Aires.
Vacchieri, A., 2014. Estado del arte sobre la gestión de las políticas de integración de
computadoras y dispositivos móviles en los sistemas educativos, Programa TIC y
Educación Básica. UNICEF.
Vacchieri, A., 2013. Las políticas TIC en los sistemas educativos de América Latina: caso
Argentina., Las políticas TIC en los sistemas educativos de América Latina. UNICEF.
Vaillant, D., 2013a. Las políticas TIC en los sistemas educativos de América Latina: caso
Uruguay., Las políticas TIC en los sistemas educativos de América Latina. UNICEF.
Vaillant, D., 2013b. Integración de TIC en los sistemas de formación docente inicial y continua para la Educación Básica en América Latina, Programa TIC y Educación Básica. UNICEF.

ANNEXES
TABLE OF CONTENTS
Table of Content 65
Annex A. Data. 66
Annex B. Context data. 70
Annex C. History and main features of education and ICT policies in Latin America. 73
Annex D. Additional figures. 83
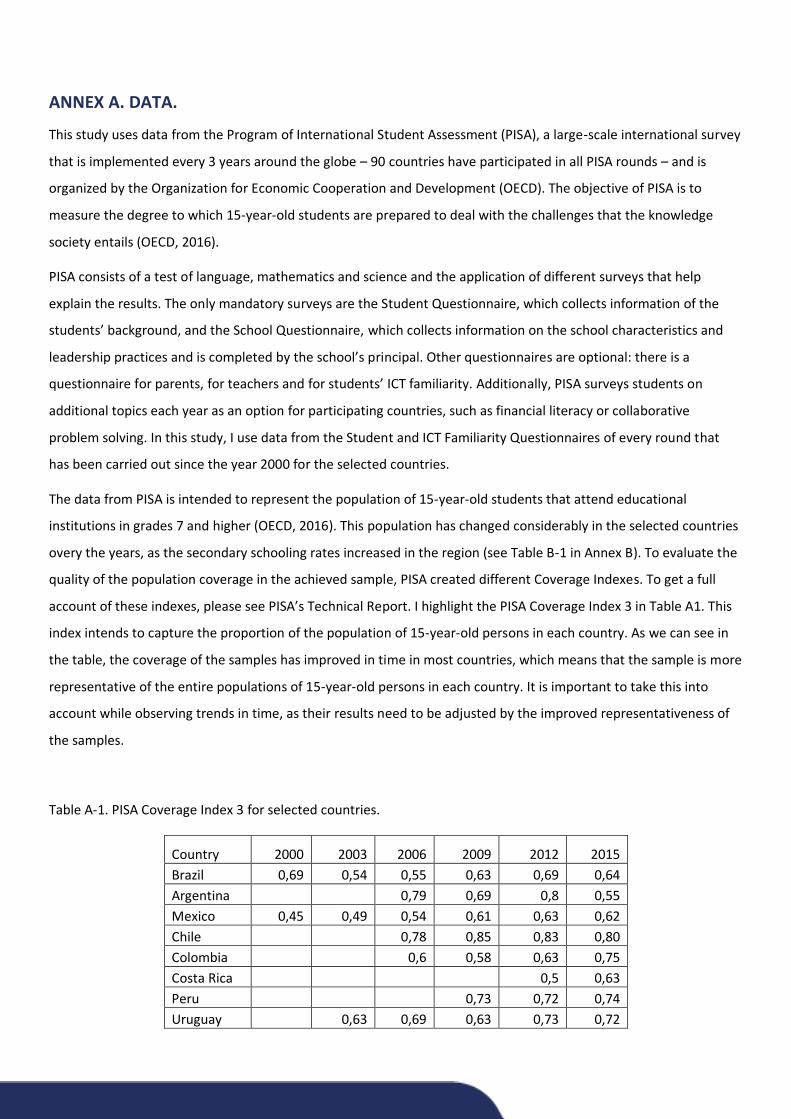
ANNEX A. DATA.
This study uses data from the Program of International Student Assessment (PISA), a large-scale international survey
that is implemented every 3 years around the globe – 90 countries have participated in all PISA rounds – and is
organized by the Organization for Economic Cooperation and Development (OECD). The objective of PISA is to
measure the degree to which 15-year-old students are prepared to deal with the challenges that the knowledge
society entails (OECD, 2016).
PISA consists of a test of language, mathematics and science and the application of different surveys that help
explain the results. The only mandatory surveys are the Student Questionnaire, which collects information of the
students’ background, and the School Questionnaire, which collects information on the school characteristics and
leadership practices and is completed by the school’s principal. Other questionnaires are optional: there is a
questionnaire for parents, for teachers and for students’ ICT familiarity. Additionally, PISA surveys students on
additional topics each year as an option for participating countries, such as financial literacy or collaborative
problem solving. In this study, I use data from the Student and ICT Familiarity Questionnaires of every round that
has been carried out since the year 2000 for the selected countries.
The data from PISA is intended to represent the population of 15-year-old students that attend educational
institutions in grades 7 and higher (OECD, 2016). This population has changed considerably in the selected countries
overy the years, as the secondary schooling rates increased in the region (see Table B-1 in Annex B). To evaluate the
quality of the population coverage in the achieved sample, PISA created different Coverage Indexes. To get a full
account of these indexes, please see PISA’s Technical Report. I highlight the PISA Coverage Index 3 in Table A1. This
index intends to capture the proportion of the population of 15-year-old persons in each country. As we can see in
the table, the coverage of the samples has improved in time in most countries, which means that the sample is more
representative of the entire populations of 15-year-old persons in each country. It is important to take this into
account while observing trends in time, as their results need to be adjusted by the improved representativeness of
the samples.
Table A-1. PISA Coverage Index 3 for selected countries.
Country 2000 2003 2006 2009 2012 2015
Brazil 0,69 0,54 0,55 0,63 0,69 0,64
Argentina 0,79 0,69 0,8 0,55
Mexico 0,45 0,49 0,54 0,61 0,63 0,62
Chile 0,78 0,85 0,83 0,80
Colombia 0,6 0,58 0,63 0,75
Costa Rica 0,5 0,63
Peru 0,73 0,72 0,74
Uruguay 0,63 0,69 0,63 0,73 0,72

Source: PISA Technical Reports 2000-2015.
Note: Coverage Index 3 for Argentina and Peru were not available in PISA 2000 Technical Report. Coverage Index for
PISA 2018 were not published at the moment of writing of this report.
The third section of the paper, in which I review access to electronic devices and to the Internet for students at
homes and in schools, relies on questions from the Student Questionnaire and the School Questionnaire. In the
former, students are asked whether they have computers that are available for them to use for schoolwork and
whether there is a connection to the Internet in their homes. These questions remained unaltered from the first
application in PISA 2000 to PISA 2018.
Regarding access to ICT in schools, the principals are asked about the number of computers available in school, the
number of computers available for 15-year-old students, and the number of computers connected to the Internet
using different wordings throughout all the PISA rounds, as can be seen in Table A-2. Additionally, PISA inquires
about the number of students in school and, since 2009, the number of students in the modal grade for 15-year-old
students.
With the available data, there are basically two ways to construct a computer-student ratio. The first option is to use
the number of 15-year-old students and the number of computers available for them for educational purposes.
While consistent in terms of correspondence between students and computers – both of them refer to 15-year-old
students – both pieces of information are only available since 2009. A second option would be to use the total
number of students in each school. This option, while it allows constructing an indicator from 2000 to 2018 –
excluding 2006 –, implies a different meaning than the first option: it would reflect the ratio of computers available
for 15-year-old students and all students in schools. This means that the indicator would be affected by different
structures of education systems: for example, if the modal grade in one country belongs to a secondary education of
6 years, the indicator would reflect a lower availability of computers compared to a country where there is a lower
and a higher secondary education of 3 years each. In this sense, while it may serve as a comparison within countries
– without changes in the schooling structure – it is difficult to use it to compare between different countries.
For this reasons, I base my analysis in the indicator constructed under the first option, which I include in the main
body of the text. For complementary purposes, I include one figure that reflects the computer-student ratio
constructed using the second option in Annex D.
Following OECD (2015), I remove from the computation schools with less than 10 15-years-old students, which
might inflate the indicator.
Table A-2. Questions regarding school size, availability of computers and access to the Internet in PISA 2000-2018.
Question 2000 2003 2006 2009 2012 2015 2018

Total number of students in school X X X X X X X
Total number of 15-year-old students X X X X
How many computers are in the school altogether?
X X X
In your school, how many computers are… available for 15-year-old students?
X X
X* X* X* X*
In your school, how many computers are… connected to the Internet/World wide web?
X X X
In your school, how many computers that are available for 15-year-old students are… connected to the internet/World Wide Web?
X X X X
Source: PISA School Questionnaires 2000-2018.
Note: * in PISA 2009-2018, this question was worded as “number of computers available for 15-year-old students for
educational purposes.”
For the following section of the paper, I use only data from PISA 2018. Information on school capacity to use ICT for
educational purposes comes from the School Questionnaire as well. In this section, principals are asked about the
sufficiency of number of computers connected to the Internet, bandwidth, number of digital devices, computing
capacity of the devices, software availability, technical and pedagogical skills of teachers, time available for teachers,
professional resources, availability of a learning platform, incentives for teachers to use ICT, and qualified technical
staff. Principals respond this questions in a Likert Scale of 4 options: Strongly disagree, disagree, agree and strongly
agree.
The rest of the data I use in the paper comes from the ICT Familiarity Student Questionnaire. The questions I use in
the paper are about a) the frequency of use of Internet in schools and in homes in weekdays and weekends, b) the
time spent using digital devices for different school subjects both at home and in school (answered using a 4-option
Likert Scale: No time, 1-30 minutes a week, 30-60 minutes a week, and more than 60 minutes a week), c) whether a
digital device was used in class for different school subjects and who used it (students, teacher or both), d) uses of
digital devices for different academic and non-academic activities (answered using a 5-option Likert Scale: Never or
hardly ever, Once or twice a month, Once of twice a week, Almost every day, Every day), e) the experience of
students regarding digital media and digital devices and their interest, autonomy, competence and presence in their
daily conversations.
For all the different sets of items in the ICT Familiarity Questionnaire identified in the previous paragraph, PISA
creates indexes that synthesize the information produced by the different items. The indexes that I employ in the
study are the following: ICT use outside of school leisure, ICT use for schoolwork, Use of ICT in school in general,
Students’ ICT interest, Students’ perceived ICT competence, Students’ Perceived Autonomy related to ICT use, and
Students’ ICT as a topic of interaction. These indexes are derived using Item Response Theory (IRT) scaling using a

generalized partial credit model (GPCM). I scaled an index for availability of resources at school from the questions
of the School Questionnaire regarding use of ICT for educational purposes using the same technique.
To analyze disparities in access and use of ICT I use different variables throughout the study. The gender variable is a
dichotomous variable for boys and girls, and the school management variable is a dichotomous variable for private
and state managed schools. For rural and city schools, I recoded the geographical location variable in PISA to group
schools that are located in villages, hamlets or rural areas and small towns as “rural schools” and the schools located
in larger agglomerations as “city schools”.
For socioeconomic status, I employ two indexes. For synchronic analysis, I use the PISA index of economic, social and
cultural status index (ESCS), which is created with a Principal Components Analysis (PCA) using three different
indexes: the highest educational occupation index (HISEI), the highest parental education index (PARED), and the
home possessions index. For more details, see PISA 2015 Technical Report (OECD, 2016). For longitudinal analysis, I
only employ the HISEI, because it is more comparable than the ESCS. While the procedure to obtain the ESCS has
changed considerably in the different rounds of PISA, the methods for obtaining HISEI have changed less. Even
though there was an adaptation of the occupational coding scheme in the process for obtaining the HISEI (from
ISCO-88 to ISCO-08) in PISA 2012, these scales are relatively similar and, for the Latin American countries, the
correlation between both scales is above .95 in all cases (see PISA 2012 Technical Report (OECD, 2014)).
Data were analyzed using the software Stata 14.2. Statistics, regression coefficients and standard errors were
obtained using the command REPEST, developed by Avvisati and Keslair from the OECD.

ANNEX B. CONTEXT DATA.
Figure B-1. GDP per capita for selected countries. PPP in constant 2020 international prices.
Source: World Bank.
Table B-1. Percentage of 13-17 years old population that attends school.
Country 2000 2003 2006 2009 2012 2015 2018 % increase 2000-2018
Brazil 86,7* 87,9 88,1 90,6 92,0 93,2 94,7 9,2%
Argentina 90,3 92,5 91,9 91,5 91,3 92,8 94,7 4,9%
Mexico 71,9 74,6* 76,8 76,3* 78,6 81,8* 82,3 14,5%
Chile 92,1 94,2 94,0 95,4 96,3* 97,4 97,8* 6,2%
Colombia 77,2* 79,5 81,5* 85,6 85,4 87,1 88,3 14,4%
Costa Rica 67,0 76,2 79,6 84,9 86,2 89,3 91,9 37,2%
Peru 83,4 86,6 88,7 90,4 92,6 94,1 96,1 15,2%
Uruguay 81,1 85,8 82,4 83,7 85,0 87,2 90,7 11,9%
Source: SEDLAC (CEDLAS and The World Bank)
*Brazil 2000 is 2001; Chile 2012 is 2011 and 2018 is 2017; Colombia 2000 is 2001 and 2006 is 2005; Mexico 2003 is 2002, 2009 is
2008, 2015 is 2014.
Table B-2. Percentage of 13-17 years old population that attends school by income quintile.

Source: SEDLAC (CEDLAS and The World Bank)
Note: Argentina 2000 and 2003 are 28 main cities; EPH C afterwards. Brazil 2000 and 2003 is New PNAD; 2006 and 2009 are
with Rural North; 2012, 2015 and 2018 are PNADC. Colombia 2000-2006 is ECH-National and GEIH-National afterwards. Costa
Rica EHPM with implicit rent 2001-2009; ENAHO afterwards. Peru 2000 ENAHO 1 - ENAHO 3 afterwards. Uruguay 2000 and
2003 is Urban, national afterwards.
Figure B-2. Average International Socio-economic index of occupational status (ISEI) in selected countries.
Source: own elaboration based on PISA 2000-2018.
Figure B-3. Share of students attending private schools (2017).
Country 2000 2006 2012 2018 % increase 2000-2018
Q1 Q5 Q1 Q5 Q1 Q5 Q1 Q5 Q1 Q5
Brazil 80,2 97,5 82,4 97,6 90,1 97,4 91,9 98,9 14,7 1,4
Argentina 84,2 98,1 87,0 98,9 87,3 96,5 91,1 98,7 8,2 0,6
Mexico 58,5 91,3 68,3 90,3 73,0 88,0 75,4 92,3 28,9 1,1
Chile 85,9 98,8 90,3 98,7 94,9 98,9 96,6 99,1 12,4 0,3
Colombia 68,7 92,4 73,2 96,9 82,7 93,6 84,6 95,9 23,1 3,8
Costa Rica 57,4 93,9 69,9 97,9 77,2 98,7 86,8 97,9 51,1 4,2
Peru 71,3 95,2 80,2 97,5 89,1 98,5 94,2 98,6 32,2 3,6
Uruguay 65,8 97,0 71,4 97,2 77,1 98,2 83,9 99,0 27,5 2,1

Source: UNESCO Institute of Statistics (UIS).
Figure B-4. Percentage of the population living under USD1.90 a day – 2011 PPP (2000-2018).
Source: World Bank.

ANNEX C. HISTORY AND MAIN FEATURES OF EDUCATION AND ICT POLICIES IN LATIN
AMERICA.
Argentina
The first milestone in Argentina’s edtech policies is probably the creation of educ.ar in 2000, a public company
under the MoE that had the objectives of distributing hardware, training teachers in the use of ICT and designing
educational materials. In its beginning, educ.ar received a donation of around USD11,000,000 for the Varsavsky
Foundation (Fundación Varsavsky, 2005). Educ.ar was in charge of the Campaña Nacional de Alfabetización Digital
(CNAD) (Digital Literacy National Campaign) initiated in 2004 (Landau, Serra & Gruschetsky, 2007). Through this
initiative, the MoE distributed approximately 110,000 PC to 12,000 schools to equip their computer laboratories,
and multimedia resources (TVs, DVD players, cameras, projectors, etc.) to 9,500 schools. In addition, 17,000 donated
and refurbished PC were delivered (Vacchieri, 2013).
In 2006, the government launched the Plan Nacional de Inclusión Digital Educativa (Digital Inclusion in Education
National Plan), which had four components: a National Program for School Connectivity (PRONACE), the Digital
Television for Rural Schools Plan, the Program for Research and Applied Development – Aula Modelo, and the One
Laptop per Student program for technical secondary schools. These programs, along with other experiences that
some Provinces in the country (San Luis, La Rioja and the City of Buenos Aires) that worked in the One Laptop per
Child umbrella (Dughera, 2015) were important predecessors of Conectar Igualdad (Connect Equality), the country’s
flagship edtech program.
Created in 2010, Conectar Igualdad aimed to provide one laptop to students and teachers of all secondary public
schools, special education schools and teacher training institutions (Presidency of Argentina, 2010). The program
was implemented by several public organizations in coordination: the Ministry of Education, the National Social
Security Administration (ANSES), the Ministry of Planning, the Chief of Cabinet, and the aforementioned educ.ar.
According to official sources, Conectar Igualdad distributed around 5,000,000 netbooks between 2010 and 2015 that
were given to students and teachers, who owned them and could take home. The netbooks were equipped with
educational software and resources. Furthermore, it installed a basic technological infrastructure in schools and
streamlined school buildings to adapt to the program. In 2014, the program declared that it had reached its
intended coverage of all secondary public school students (Conectar Igualdad, 2015).
The program contemplated teacher training in different formats and in charge of different offices, including the
National Teacher Training Institute (INFoD), Escuelas de Innovación – a teacher training initiative directly linked to
Conectar Igualdad in the ANSES that also designed resources for students and teachers – and the Iberoamerican
States Organization (OEI), which acted as a partner for teacher training. Up to December 2012, 550,000 teachers
participated in in-presence and virtual education courses, including awareness workshops, teacher training courses,
teacher training graduate courses, and Congresses (Vacchieri, 2013). Additionally, the MoE funded positions in
schools to assist in the administration of technological resources in schools. After 2014, and especially after the

change in government that occurred in 2015, Conectar Igualdad scaled-down drastically, reducing its budget and the
number of computers delivered annually (Claus y Sánchez, 2019).
In 2012, the government launched a program for primary schools called Primaria Digital. This initiative delivered
“digital mobile classrooms” (ADM) that consisted of a set of netbooks (from 5 to 30 depending on the school size)
and other devices (projectors, routers, etc.) to be used in school. During a class, students could work with the
netbooks in the 1-to-1 model, but the ADM had to be shared among the different classes within the school, and
students could not take them home.
Aprender Conectados (Learn Connected), a new government initiative led by the Ministry of Education, replaced
Conectar Igualdad and Primaria Digital in 2018. This plan shifted the priorities of the previous initiatives in different
ways. Regarding technological equipment, in lieu of the 1-to-1 model that inspired Conectar Igualdad, Aprender
Conectados delivered ADM to primary and secondary schools, in a similar fashion to Primaria Digital, tablets in pre-
K, and robotics kits to all schools. Additionally, Aprender Conectados stressed in its design on the importance of
connecting all schools to the Internet, and developed a focus on teaching robotics and programming. The program
continued its predecessors’ actions of teacher training and material production. According to official sources,
around 650,000 teachers were trained, 18,000 schools were connected to the Internet, benefiting a bit less than
5,250,000 students (SICE, 2019).
Brazil
In the end of the 1990s decade, Brazil launched its first relevant national initiative regarding education & ICT
policies: the Programa Nacional de Informática na Educaçao – Proinfo (National Program of School Informatics).
Placed in the National MoE, Proinfo funded projects designed and executed by states and schools related to the use
of ICT to support teaching and learning (MEC, 1997). The program contemplated provision of digital equipment for
schools and teacher training. Up to 2002, around 150,000 practitioners were trained – out of which 137,911 were
teachers – and around 50,0000 computers were installed. These actions benefited around 6,000,000 students. The
goals of the program regarding teacher training were exceeded, the ones regarding the number of installed
computers and of students benefited were not accomplished. After the change in government in 2003, the actions
of the Proinfo were scaled down, but the program was not shut down (Almeida, 2014).
In 2007, Proinfo was re-launched as the Programa Nacional de Tecnologia Educativa (National Program of
Educational Technology). The new version of the program defined two different device provision models: urban
schools received a computer lab with 15 computers, a server, and a printer; and rural schools, less populated,
received a computer lab with 4 computers, a server and a printer (Proinfo, 2020). These computers were equipped
with Educational Linux.
In addition, under Proinfo the government worked in initiatives to expand internet connection, content
development, and teacher training. In 2008, it launched Banda Larga nas Escolas (Broadband for Schools), a program
that had the objective of connecting all urban schools to the Internet (Ministerio da Educaçao, 2020a). In the same
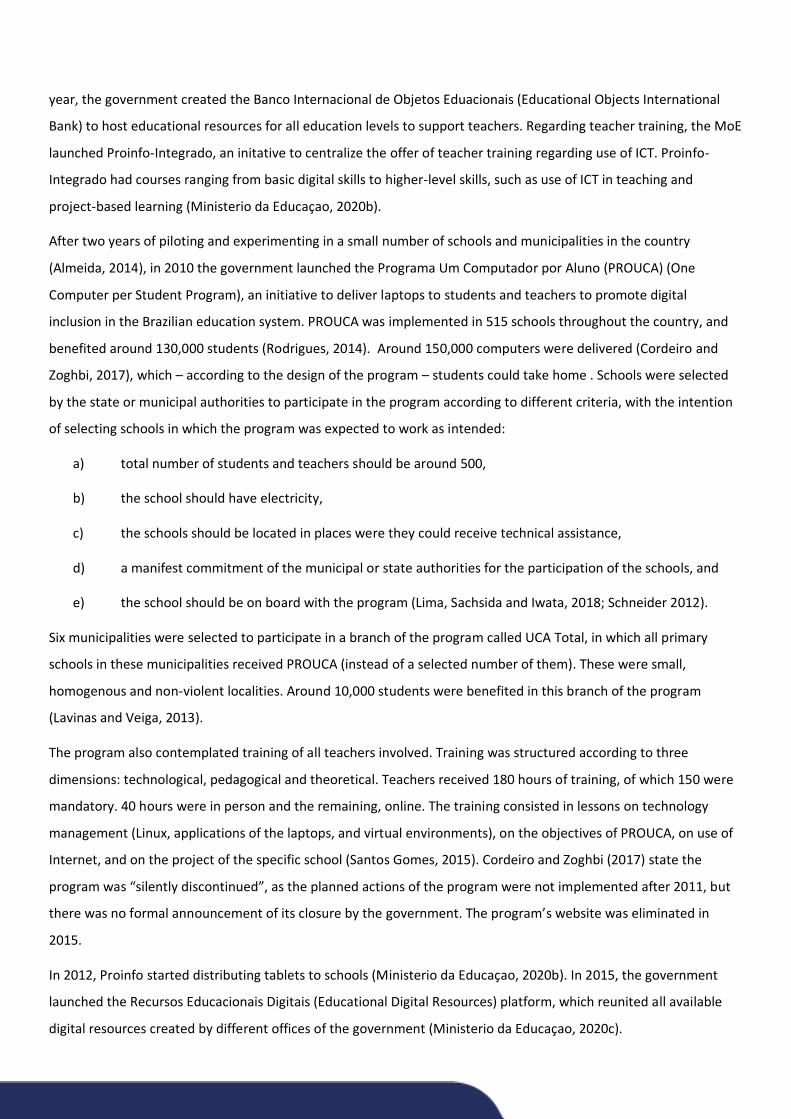
year, the government created the Banco Internacional de Objetos Eduacionais (Educational Objects International
Bank) to host educational resources for all education levels to support teachers. Regarding teacher training, the MoE
launched Proinfo-Integrado, an initative to centralize the offer of teacher training regarding use of ICT. Proinfo-
Integrado had courses ranging from basic digital skills to higher-level skills, such as use of ICT in teaching and
project-based learning (Ministerio da Educaçao, 2020b).
After two years of piloting and experimenting in a small number of schools and municipalities in the country
(Almeida, 2014), in 2010 the government launched the Programa Um Computador por Aluno (PROUCA) (One
Computer per Student Program), an initiative to deliver laptops to students and teachers to promote digital
inclusion in the Brazilian education system. PROUCA was implemented in 515 schools throughout the country, and
benefited around 130,000 students (Rodrigues, 2014). Around 150,000 computers were delivered (Cordeiro and
Zoghbi, 2017), which – according to the design of the program – students could take home . Schools were selected
by the state or municipal authorities to participate in the program according to different criteria, with the intention
of selecting schools in which the program was expected to work as intended:
a) total number of students and teachers should be around 500,
b) the school should have electricity,
c) the schools should be located in places were they could receive technical assistance,
d) a manifest commitment of the municipal or state authorities for the participation of the schools, and
e) the school should be on board with the program (Lima, Sachsida and Iwata, 2018; Schneider 2012).
Six municipalities were selected to participate in a branch of the program called UCA Total, in which all primary
schools in these municipalities received PROUCA (instead of a selected number of them). These were small,
homogenous and non-violent localities. Around 10,000 students were benefited in this branch of the program
(Lavinas and Veiga, 2013).
The program also contemplated training of all teachers involved. Training was structured according to three
dimensions: technological, pedagogical and theoretical. Teachers received 180 hours of training, of which 150 were
mandatory. 40 hours were in person and the remaining, online. The training consisted in lessons on technology
management (Linux, applications of the laptops, and virtual environments), on the objectives of PROUCA, on use of
Internet, and on the project of the specific school (Santos Gomes, 2015). Cordeiro and Zoghbi (2017) state the
program was “silently discontinued”, as the planned actions of the program were not implemented after 2011, but
there was no formal announcement of its closure by the government. The program’s website was eliminated in
2015.
In 2012, Proinfo started distributing tablets to schools (Ministerio da Educaçao, 2020b). In 2015, the government
launched the Recursos Educacionais Digitais (Educational Digital Resources) platform, which reunited all available
digital resources created by different offices of the government (Ministerio da Educaçao, 2020c).

In 2017, the MoE launched the Programa de Inovaçao Educaçao Conectada – PIEC (Connected Education Innovation
Program). PIEC has the objective of connecting all schools in the country to the Internet by 2024 (Educaçao
Conectada, 2017).
Chile
Enlaces (Links) has been Chile’s flagship edtech program since the return of democracy in 1990. The program had
the objective of incorporating technology to the education system by providing technological infrastructure,
hardware, digital resources, and training and support to teachers. It started with a pilot initially thought for 100
schools between 1992 and 1995, in which the government provided a “seed” infrastructure of a computer lab with
3, 6 or 9 computers and two computers for the teachers room, all connected through an intranet. Teachers in
schools in the pilot participated in a training process of two hours a week during two years, in charge of a local
university that assisted each school (Jara, 2013).
After 1996, Enlaces expanded to the entirety of the Chilean education system, reaching almost 90% of students that
attended state funded schools by 2005 (Jara, 2013). In this phase, the program designed a network of universities in
charge of supporting schools, which was key to assure that every school had proper assistance, but at the same time
diversified the original content and procedures; expanded to rural schools, to which the program had to adapt; and
assumed the responsibility for the digital literacy campaign, as teachers were in charge of open workshops for the
entire community.
From 2005, the program entered a consolidation phase with the creation of the Center of Education and Technology
in the Ministry of Education and the Plan de Tecnologías para una Educación de Calidad (Plan of Technologies for a
Quality Education) (Jara, 2013). This plan improved the basic school technology equipment, guaranteeing a
computer lab with 20 devices, more computers for teachers, and other resources (as projectors, printers, etc.).
Subsequently, the program incorporated Laboratorios Móviles Computacionales (Computing Mobile Labs), which
allowed working in the 1-to-1 framework in classrooms, interactive whiteboards, and, in 2009, delivery of computers
to students of low socioeconomic status in the “Yo Elijo mi PC” (“I choose my PC”) initiative, which included a merit-
based component (Jara, 2013). These initiatives were not universal, though widespread (Donoso, 2010). In 2015, the
government incorporated the “Me Conecto para Aprender” (“I connect to Learn”) initiative that gave a laptop to
every public school student in 7th grade, and modified Yo Elijo mi PC to focus on low socioeconomic status students
that attended private subsidized schools, keeping the merit-based component.
In 2018, the Chilean government created the Centro de Innovación (Innovation Center), which took the functions of
Enlaces. According to official documents, the new program develops a less “device-centered” approach – this is, an
approach that focuses on pedagogy and not so much on the use of specific devices – and is intended to also cover
pre-K and higher education (Centro de Innovación, 2020a). The Centro de Innovación currently funds and
implements actions regarding programming, learning by projects, personalized learning, connecting schools to the
internet, delivery of computers for schools, and teacher professional development, among others (Centro de
Innovación, 2020b).

Colombia
In 2001, the government of Colombia launched Computadores para Educar (CPE) (Computers for Education), its
most important edtech initiative. CPE is a public company whose board is composed by representatives of the
Presidency, the Ministry of Information Technology and Communications, the Ministry of Education, and the
National Learning Service (SENA) (Computadores para Educar, 2020). Initially, the program refurbished computers
that were discarded by the private sector to improve the technological infrastructure of schools. Today, CPE has
three main functions: computer distribution, training and environmental management (Olarte Dussan et al., 2018).
The program distributes computers to public education institutions of all levels (preschool, primary, secondary, and
higher education). In its origins, CPE had the goal of reaching an average of 20 students per computer. In 2015, this
goal was set to 2 students per computer. In addition, the program has moved from distributing desktop computers
to laptops and tablets, especially after 2010. From 2001 to 2017, CPE distributed a total number of 2,051,693
computers (Olarte Dussan et al., 2018). These devices are part of the schools patrimony, and are hence not taken
home by students.
The program was designed to be implemented in three phases. In the first one, the technological infrastructure was
installed. In the second phase, teachers are trained in a process that takes one year and is undertaken by
universities in alliance with universities from around the country. The training phase is comprised by two types of
activities: 1) theoretical and practical lessons in schools to incentivize the use of ICT, and 2) support actions, such as
project monitoring, network development, etc. The third phase is more focused on the teaching of each specific
subject (Rodríguez, Sánchez and Márquez, 2011). Up to 2013, around 313,000 teachers in 40,000 schools were
trained in this fashion.
In 2015, CPE started implemented the Estrategia de Innovación Educativa y Uso de las TIC para el Aprendizaje
(ETIC@) (Educational Innovation and Use of ICT for Learning Strategy). This strategy is comprised by four courses
and two workshops. Three of the courses are designed for teachers and one for principals. Their contents are
sequenced, covering from a novice level to a mentor level. From 2015 to 2017, around 147,000 teachers were
trained. ETIC@ also has a branch for families, in which 338,000 parents were trained in the same period.
Regarding teacher training specifically, the MoE released in 2008 the Ruta de apropiación de TIC en el Desarrollo
Profesional Docente (ICT Appropriation Route for Teacher Professional Development). The objective of the Route
was to organize existing and future teacher training courses in a framework to guide teachers in their own processes
of incorporating ICT to their professional practice. The Route defined competences to be gained by teachers at two
levels: personal appropriation (basic skills in ICT use for personal life) and professional appropriation (skills in
teaching using ICT). Several training courses were offered in line with the Route. For the personal appreciation level,
the campaign “A que te cojo ratón” (“I’ll catch you, mouse”) trained around 50,000 teachers in basic ICT skills. For
the second level, the programs Compartel (Ministry of ICT), Intel Educar (associated with Intel), Entre Pares
(associated with Microsoft), and initiatives in the scope of CPE were attended by around 170,000 teachers (Galvis
Panqueva, 2014).

Costa Rica
Efforts in Costa Rica to introduce ICT in education trace to 1987, when the Programa Nacional de Informática
Educativa (PRONIE) (National Program for Educational Informatics) was created. The PRONIE was designed as a
collaborative effort between the Ministry of Education of Costa Rica and the Omar Dengo Foundation; a non-profit
private organization whose board was presided by the Minister of Education and integrated by representatives of
the private sector, academia and the MoE. The idea behind the creation of a public-private partnership for the
introduction of ICT in Costa Rican education was to give the program a structure that could help its survival through
different administrations.
Initially, the program consisted of the installation of a computer lab in primary schools, and was aimed to develop
logical-mathematic reasoning, problem solving and teamwork through teaching of programming and project
learning. In this early phase, one teacher at each participating schools was selected to receive the training and teach
Education Informatics. In time, a specific training and position of Informatics Teacher was created (Muñoz et al.,
2014).
Progressively, the PRONIE expanded to other education levels and contexts. In 1997, the program was adapted to
work with multi-grade classrooms, with a special focus on teaching of curriculum materials. In 1998, it incorporated
robotics and learning by design. A couple of years later, in 2002, the PRONIE started working with secondary
schools.
Besides the computer labs, there were other equipment frameworks that were used in the PRONIE throughout its
history. In 2010, the 1-to-1 model was implemented in rural schools, multi-grade classrooms, schools that serve
indigenous students and children that attend schools in hospitals. Since 2012, many urban primary and secondary
schools were given a MoviLab, a set of laptops and supplementary equipment (projectors, routers, etc.) that could
be moved around the school and could even be lent to students to take home. The MoviLabs were thought to be
used in specific subjects of the curriculum: science, math and Spanish (Muñoz et al., 2014).
The PRONIE has also designed a training process for teachers that go through the program. This process combines
courses and coaching. Courses are specially adapted to the expertise of the teachers in the use of ICT, and can be in
presence or virtual. PRONIE offers a three-week in-presence course for teachers in the beginning of the academic
year, with 88 class hours and 32 fieldwork practical hours. Additionally, there is a regional workshop of 80 hours,
also with 32 fieldwork hours, held once a year. In 2014, PRONIE launched a virtual campus called “Una Puerta al
Conocimiento – UPE” (“A door to Knowledge”), which holds a vast amount of virtual teacher professional
development offers. Regarding coaching, teachers receive 3 visits per year on average by advisers of the PRONIE,
which give personal feedback for teachers that participate in the program (Zamora, 2012). Up to 2012, the training
was mainly offered to Educational Computation teachers. After that date, the program expanded its influence to
teachers of other subjects, which are now the main population target of this part of the program (Zúñiga et al.,
2018).

According to official sources, the PRONIE has reached almost 4,000 schools and around 740,000 students, which
represent 92% of the preschool to ninth year enrolled students. It has also distributed around 130,000 computers
and trained 69,000 teachers in virtual courses and registers 6,800 advising sessions each year (Fundación Omar
Dengo, 2020).
Mexico
In 2004, the Secretary of Education (SEP) launched Enciclomedia, which equipped classrooms of 5th and 6th grade
of primary schools throughout the country with a computer, a projector, a printer, and an interactive whiteboard to
be used by teachers in class. The program made emphasis on the availability of digital resources for teachers and
students. Enciclomedia 1.2., the version of the program that was more widely disseminated, had two working
environments: the Student Site and the Teacher Site. The latter contained a digitalized version of the official
textbooks, enhanced with hyperlinks to relevant resources in the Encarta Encyclopedia. The former had study plans,
teachers’ textbooks, and pedagogic guidance to use the delivered resources in the classroom. A newer version of the
program, Enciclomedia 2.0, incorporated content specifically for Spanish and Math, and developed specific lines for
teaching English and for supporting indigenous primary schools. Around 125,000 classrooms were equipped and
225,000 teachers were trained. The program ended in 2012 (SEP, 2012).
In 2009, while Enciclomedia was still operational but de-scaled, the SEP began with the implementation of
Habilidades Digitales para Todos (HDT) (Digital Skills for All). The program was a continuation of Enciclomedia for
primary schools, but introduced the 1-to-1 model in secondary schools throughout the country, equipping
classrooms with as many laptops as students could fit. Besides the provision of laptops for secondary schools, HDT
brought two new features: the addition of a digital management system for teachers and principals and a certified
training program for teachers (SEP, 2012a). In its first four years, the program could not surpass the pilot phase and
the equipment goals were not reached (Díaz Barriga, 2014). As with Enciclomedia, HDP was cancelled in 2012 (SEP,
2012b).
In 2012, the new administration launched Micompu.mx (Mylaptop.mx), a new initiative that brought the 1-to-1
model to students from grades 5 and 6 of primary schools to three states throughout the country (Colima, Sonora
and Tabasco). This project finalized in 2014 (SEP, 2013).
After phasing out micompu.mx, the SEP started the implementation of “@prende” (“Le@rn”) in 2014. The program
distributed almost 2,000,000 computers and tablets to students and teachers of 5th grade of primary school in 15
states throughout the country, and 13,000 teachers, principals and supervisors were trained for the usage of the
devices and their educational resources (SEP, 2016).
In 2016, the program upgraded to @prende 2.0. This new version of the program had the objective of promoting 9
“digital abilities”: critical thinking, creative thinking, information management, communication, collaboration, use of
ICT, digital citizenship, self-monitoring, and computational thinking. The strategy of implementation of @aprende
2.0 had six components: teacher professional development, educational digital resources, strategic initiatives

(designed for specific populations, such as indigenous students and special education), equipment with mobile-labs
of 20 tablets, internet connection, and monitoring and evaluation (SEP, 2016). Even though equipment from
@prende 2.0 was not delivered in the expected quantities, the platform is still functional and its contents available
for students and teachers.
Peru
The journey of Peru regarding edtech policies began in the midst of the 90s, with two programs: EDURED, which
connected 345 urban secondary schools to the internet and trained around 2,700 teachers in the use of technology
in the classroom, and INFOESCUELA, a program that introduced robotics in 360 primary schools using the LEGO
Dacta materials, and the programming language Logo (Salas-Pilco, 2014). In 1998, the government created the Pilot
Program for Distance Education, which installed around 100 Centers for Distance Education (CPED), to improve the
quality of education in rural areas (Trinidad, 2003).
These policies were absorbed in 2002 by the Proyecto Huascarán, which provided computer labs and internet
connection to schools of all education levels, and sought to create a national network of schools. One teacher per
school was designated to administrate the usage of the lab and was in charge of training his/her colleagues.
Huascarán oriented the use of ICT as crosscutting through all other subjects of the curriculum. Between 2002 and
2006, 14,806 computers were delivered, around 55,451 teachers were trained, and 1,650 internet connections were
made. These benefited 3,012 schools and around 2,500,000 students (Salas-Pilco, 2014).
In 2007, Peru started the implementation of the One Laptop per Child (OLPC) program. The implementation of OLPC
in Peru was the largest in the history of the program at the time. Peru implemented the program in two different
ways: selected primary schools received one computer per student, and secondary schools received a Centro de
Recursos Tecnológicos (CRT) (Technological Resource Center), consisting of a set of laptops, a server, and robotic
kits. In the first, students could take their computer home; in the second, they could not. In both cases, computers
were connected to an intranet, and were equipped with selected applications and educational software. Under the
1-to-1 framework, around 290,000 laptops were distributed in 2,300 schools; under the CRT model, around 300,000
laptops were distributed in 10,700 schools. The program was discontinued in 2011 (Cristia et al. 2017; Quintanilla et
al., 2019; Salas-Pilco, 2014).
The latest edtech initiatives promoted by the government were supplementary to other interventions. For example,
there is a component of the Extended School Day program initiated in 2015 that entailed the creation of a
coordination position in each participant secondary school, which had the role of being responsible for the
administration of the ICT resources of the school, encourage the use of ICT in teaching, and assist teachers in doing
so (Rivoir, 2016). Up to 2017, 2,000 schools were participating in this program (Jornada Escolar Completa, 2020).
Uruguay
The first articulated edtech initiative administered at a national level in Uruguay was INFED 2000. This program was
launched in 1992 and finalized in 1996. It intended to introduce computation in Uruguayan primary and secondary

schools through the installation of computer labs in charge of a teacher, trained in software management by IBM.
The program was implemented in 72 primary and 48 secondary schools throughout the country, reaching a small
proportion of schools in the country. In 2001, the government launched the Plan de Conectividad Educativa (PCE)
(Educational Connectivity Plan), whish sought to connect schools to the Internet and to train teachers in the use of
ICT in teaching (Grompone et al., 2007).
After these experiences and other smaller projects, the government created Plan Ceibal in 2007, which has been
since then the flagship edtech program in Uruguay. Plan Ceibal followed the OLPC model: one computer was
distributed to each student and teacher, who owned the devices and could take them home; and schools were
connected to the Internet.
The administration of the plan was responsibility of a special unit created under the Presidency, administratively and
financially independent from the Ministry of Education and the Administración Nacional de la Educación Pública
(ANEP), which gave the program independence of the educational administration. The leadership of the program
also came from the technology sector, and not from public education administration (Vaillant, 2013).
The program distributed the first set of laptops in 2007, and was scaled gradually to all the country until 2009,
beginning with rural areas and finalizing with schools in Montevideo – the country’s capital. In 2007, Ceibal
distributed computers to public primary schools, and incorporated private primary and public secondary schools
from 2008 (Rivera Vargas and Cobo Romaní, 2019). According to official sources, primary education was entirely
covered in terms of both devices distribution and internet connection by the program in 2009, and secondary
education, in 2013. Up to 2017, Ceibal had given almost 870,000 devices (of which 21% were tablets and 79%,
laptops) (Solari, 2017).
The first years of Ceibal were focused on the provision of devices and technological infrastructure, and on technical
trainings, leaving the inclusion of ICT in teaching practices as a second priority. This changed after 2011, when the
program entered a second phase, where teacher training for the use of ICT in teaching, and the creation of
education resources gained a more important place in the program (Fullan, Watson and Anderson, 2013).
Since 2011, Ceibal has made available a battery of online courses to train teachers in using ICT for teaching
purposes. These courses register a total 28,000 enrollments (Rivera Vargas and Cobo Romaní, 2019). Besides
courses, the government created two positions in the education system for supporting schools in their incorporation
of ICT into practice: the Ceibal Support Teacher and the Dynamizing Teacher. The latter is school-based, and the
former, at the supervising level.
Ceibal created a platform called CREA, a virtual environment that is designed to help teachers in organizing their
workload. In CREA, teachers can create virtual classrooms that host all materials relevant for students, and facilitate
planning and evaluation. The platform also allows students to upload assignments and work collaboratively with
each other; and hosts all other educational resources for students (Plan Ceibal, 2020).

In addition, Ceibal has created a number of initiatives that are specific for different subjects. In 2013, Ceibal
launched the Adaptive Mathematics Platform (PAM), a platform with more than 100,000 mathematics activities
aligned with the official curriculum. As its name suggests, the platform is adaptive: it captures information on the
student’s performance and provides them with feedback (resources and additional activities) that is adapted to the
student’s knowledge (Perera and Aboal, 2017).
After a pilot in 2012, Ceibal started scaling Ceibal in English in 2013, an initiative designed to support English
teaching in Uruguayan schools by enabling contact with a native-English speaking teacher via videoconference once
a week. This program designed an innovative pedagogic model combines remote teaching, collaborative teaching
and blended learning (Kaiser, 2017). Up to 2019, around two thirds of Uruguayan primary school students
participated in Ceibal in English.
Finally, Ceibal is offering programs for fostering programming skills in computers, such as the Laboratorios de
Tecnologías Digitales (Digital Technologies Labs), which aims to equip schools with resources like robotic kits and 3-
D printers to develop logical reasoning and problem solving in students (Plan Ceibal, 2020). Ceibal also develops
courses for people between 18 and 30 years old to develop coding skills with Jóvenes para programar (Plan Ceibal,
2020).

ANNEX D. ADDITIONAL FIGURES.
Figure D-1. Percentage of 15-year-old students that report having 3 cellphones or more at home in selected
countries.
Source: own elaboration based on PISA 2000-2018.
Figure D-2. Mobile subscriptions per 100 inhabitants in selected countries.

Source: own elaboration based on data from the ITU.
Figure D-3. Figure 2. Percentage of 15-years-old students that have access to a computer for schoolwork by
participating country and geographical location of the school.
Source: own elaboration based on PISA 2000-2018.

Note: Average LATAM average is a weighted average of the eight selected Latin American countries. OECD average is a weighted
average of the OECD countries that participated in all rounds of PISA, excluding Mexico. Rural schools are defined as schools
placed in agglomerations of less than 100,000 inhabitants.
Figure D-4. Figure 2. Percentage of 15-years-old students that have access to a computer for schoolwork by
participating country and school type of management.
Source: own elaboration based on PISA 2000-2018.
Note: Average LATAM average is a weighted average of the eight selected Latin American countries. OECD average is a weighted
average of the OECD countries that participated in all rounds of PISA, excluding Mexico.
Figure D-5. Figure 2. Percentage of 15-years-old students that have access to a computer for schoolwork by
participating country and gender.

Source: own elaboration based on PISA 2000-2018.
Note: Average LATAM average is a weighted average of the eight selected Latin American countries. OECD average is a weighted
average of the OECD countries that participated in all rounds of PISA, excluding Mexico.
Figure D-6. Percentage of 15-years-old students that have access to a link to the Internet at home by participating
country and geographic location.

Source: own elaboration based on PISA 2000-2018.
Note: Average LATAM average is a weighted average of the eight selected Latin American countries. OECD average is a weighted
average of the OECD countries that participated in all rounds of PISA, excluding Mexico. Rural schools are defined as schools
placed in agglomerations of less than 100,000 inhabitants.
Figure D-7. Percentage of 15-years-old students that have access to a link to the Internet at home by participating
country and school management type.
Source: own elaboration based on PISA 2000-2018.
Note: Average LATAM average is a weighted average of the eight selected Latin American countries. OECD average is a weighted
average of the OECD countries that participated in all rounds of PISA, excluding Mexico.
Figure D-7. Percentage of 15-years-old students that have access to a link to the Internet at home by participating
country and school gender.

Source: own elaboration based on PISA 2000-2018.
Note: Average LATAM average is a weighted average of the eight selected Latin American countries. OECD average is a weighted
average of the OECD countries that participated in all rounds of PISA, excluding Mexico.
Figure D-8. Share of students that have at least one tablet in their homes by selected country (2018).

Source: own elaboration based on PISA 2018.
Figure D-9. Computer-school size ratio in schools (2000-2018).
Source: own elaboration based on PISA 2009-2018.
Note: Average LATAM average is a weighted average of the eight selected Latin American countries. OECD average is a weighted
average of the OECD countries that participated in all rounds of PISA, excluding Mexico.

Figure D-10. Proportion of students attending schools with more than .8 computers per 15-year-old student by
management sector.
Source: own elaboration based on PISA 2009-2018.
Note: Average LATAM average is a weighted average of the eight selected Latin American countries. OECD average is
a weighted average of the OECD countries that participated in all rounds of PISA, excluding Mexico.
Figure D-11. Percentage of computers that are connected to the Internet in schools by ISEI quartile and geographic
location.

Source: own elaboration based on PISA 2009-2018.
Note: Average LATAM average is a weighted average of the eight selected Latin American countries. OECD average is a weighted
average of the OECD countries that participated in all rounds of PISA, excluding Mexico. Rural schools are defined as schools
placed in agglomerations of less than 100,000 inhabitants.
Figure D-12. Percentage of computers that are connected to the Internet in schools by ISEI quartile and school
management type.

Source: own elaboration based on PISA 2009-2018.
Note: Average LATAM average is a weighted average of the eight selected Latin American countries. OECD average is a weighted
average of the OECD countries that participated in all rounds of PISA, excluding Mexico.
Figure D-13. Use by students for subjects in school by gender (2018).
Source: own elaboration based on PISA 2009-2018.

Note: PISA’s Use of ICT in class for school subjects index is standardized with respect the average and standard deviation of the
region.
Figure D-14. Use by students for subjects in school by socioeconomic status (2018).
Source: own elaboration based on PISA 2018.
Note: the heatplots have weighted observations and weighted simple OLS regression lines. Darker color indicates a larger
concentration of observations. PISA’s use of ICT in class for school subjects index is standardized with respect the average and
standard deviation of the region.
Figure D-15. Use by students for subjects at home by socioeconomic status (2018).

Source: own elaboration based on PISA 2018.
Note: the heatplots have weighted observations and weighted simple OLS regression lines. Darker color indicates a larger
concentration of observations. PISA’s use outside classroom for school subjects index is standardized with respect the average
and standard deviation of the region.
Figure D-16. Autonomy in ICT index by socioeconomic status (2018).

Source: own elaboration based on PISA 2018.
Note: the heatplots have weighted observations and weighted simple OLS regression lines. Darker color indicates a larger
concentration of observations. PISA’s autonomy in ICT index is standardized with respect the average and standard deviation of
the region.
Figure D-17. Competence in ICT index by socioeconomic status (2018).
Source: own elaboration based on PISA 2018.
Note: the heatplots have weighted observations and weighted simple OLS regression lines. Darker color indicates a larger
concentration of observations. PISA’s competence in ICT index is standardized with respect the average and standard deviation
of the region.
Figure D-18. Perception of difficulty of reading comprehension tasks (2018).

Source: own elaboration based on PISA 2018.
Figure D-19. Interest in ICT index by school resources (2018).
Source: own elaboration based on PISA 2018.

Note: the heatplots have weighted observations and weighted simple OLS regression lines. Darker color indicates a larger
concentration of observations. PISA’s interest in ICT index is standardized with respect the average and standard deviation of
the region. The school ICT resources index was constructed by scaling the questions related to ICT infrastructure resources using
a generalized partial credit model.
Figure D-20. Autonomy using ICT index by school resources (2018).
Source: own elaboration based on PISA 2018.
Note: the heatplots have weighted observations and weighted simple OLS regression lines. Darker color indicates a larger
concentration of observations. PISA’s autonomy in ICT index is standardized with respect the average and standard deviation of
the region. The school ICT resources index was constructed by scaling the questions related to ICT infrastructure resources using
a generalized partial credit model.
Figure D-21. Competence using ICT index by use in class for academic purposes index (2018).

Source: own elaboration based on PISA 2018.
Note: the heatplots have weighted observations and weighted simple OLS regression lines. Darker color indicates a larger
concentration of observations. PISA’s competence in ICT index is standardized with respect the average and standard deviation
of the region. PISA’s use of ICT in class for school subjects index is standardized with respect the average and standard deviation
of the region.
Figure D-22. Competence using ICT index by use outside class for academic purposes index (2018).
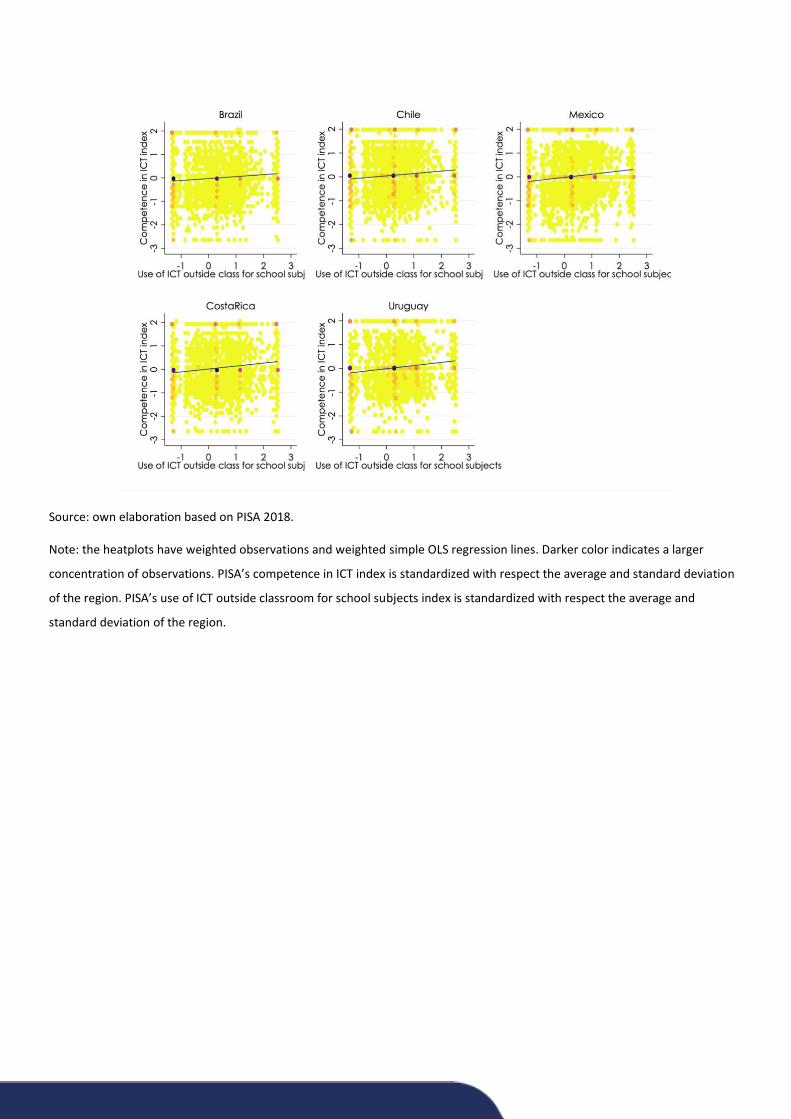
Source: own elaboration based on PISA 2018.
Note: the heatplots have weighted observations and weighted simple OLS regression lines. Darker color indicates a larger
concentration of observations. PISA’s competence in ICT index is standardized with respect the average and standard deviation
of the region. PISA’s use of ICT outside classroom for school subjects index is standardized with respect the average and
standard deviation of the region.