mm2 Asia - Gem Comm
22
Media - Integrated│Singapore│Equity research│May 9, 2016 Company Note │ Alpha series IMPORTANT DISCLOSURES, INCLUDING ANY REQUIRED RESEARCH CERTIFICATIONS, ARE PROVIDED AT THE END OF THIS REPORT. IF THIS REPORT IS DISTRIBUTED IN THE UNITED STATES IT IS DISTRIBUTED BY CIMB SECURITIES (USA), INC. AND IS CONSIDERED THIRD-PARTY AFFILIATED RESEARCH. Powered by the EFA Platform mm2 Asia The next big bang ■ mm2, a film/TV producer, is poised to ride on the rise of the film business in China. ■ Multiple acquisitions in cinema and events management complement growing core business in production, driving FY16-18 topline growth of 16-122%. ■ High-margin business that focuses on content production and distribution, with little movie financing to minimise risk of commercial success. ■ We initiate coverage with an Add recommendation and TP of S$0.70, based on a CY17 P/E of 22.0x. This is backed by a 3-year forecast EPS CAGR of 28.8%. Potential to be the next CJ E&M or Dalian Wanda mm2 is a film/TV production company in Asia offering a spectrum of movie-making services, and first expanded into North Asia in 2013 via co-productions with local partners. We believe mm2 is able to capitalise on its close ties with these established industry players (e.g. China’s Hesheng Media), to gain better traction in China. Not only is China an attractive market due to booming end-consumer demand, but also because of bigger production budgets and wider audience reach. Robust earnings momentum driven by production and acquisitions We expect a growing production pipeline (from a total budget of S$11.5m in FY15 to FY16’s S$23m and FY17’s S$44m) to be the key revenue driver for mm2. Meanwhile, its newly purchased cinemas in Malaysia will contribute to its FY16 earnings and its 51%- owned concert production business will start contributing earnings in FY17, in our view, with potential synergies for mm2 to unlock across these acquisitions. Content producer, not a speculator Unlike most production and media companies, mm2 typically does not take an equity stake in its movie productions (or not more than 10% in cases where it is unable to secure financing from other investors). This makes it less dependent on the films’ commercial success. mm2 derives income from film budgets (in the form of producer fees, script rights), as well as movie distribution. We also like its high-margin (gross ~40%, net ~20%) business model. Favourable support from local governments Most film authorities in countries where mm2 has a presence in are supportive of local content producers, be it in terms of grants and subsidies (of up to 40% of the qualifying expenditure), or protectionist measures on number of films (local vs. foreign). More notably, China’s Five-Year Plan has the cultural sector as one of the pillars, meaning more government investment in entertainment. Initiating coverage at Add with a TP of S$0.70 We initiate coverage with an Add rating and target price of S$0.70, based on a CY17 P/E of 22x, pegged to peer average but with higher EPS growth. Potential re-rating catalysts include a stronger-than-expected project pipeline and more earnings-accretive acquisitions. Any unforeseen production delay or lack of funding could pose downside risks. ▎Singapore ADD (previously NOT RATED) Current price: S$0.54 Target price: S$0.70 Previous target: S$ Up/downside: 29.9% Reuters: MM2A.SI Bloomberg: MM2 SP Market cap: US$179.7m S$244.3m Average daily turnover: US$0.76m S$1.02m Current shares o/s 451.7m Free float: 40.0% Key changes in this note Not applicable. Source: Bloomberg Price performance 1M 3M 12M Absolute (%) 6.9 50 173.4 Relative (%) 8.4 44.6 193.3 Analysts NGOH Yi Sin T (65) 6210 8604 E [email protected] William TNG, CFA T (65) 6210 8676 E [email protected] [ X ] SOURCE: COMPANY DATA, CIMB FORECASTS Financial Summary Mar-14A Mar-15A Mar-16F Mar-17F Mar-18F Revenue (S$m) 16.1 24.3 40.1 88.7 105.9 Operating EBITDA (S$m) 7.22 9.87 14.88 29.87 38.14 Net Profit (S$m) 2.74 5.08 6.92 14.81 17.32 Core EPS (S$) 0.008 0.012 0.016 0.028 0.033 Core EPS Growth 236% 58% 27% 81% 17% FD Core P/E (x) 69.24 46.65 35.96 19.10 16.32 DPS (S$) - - - - - Dividend Yield 0% 0% 0% 0% 0% EV/EBITDA (x) 26.38 22.08 15.91 8.93 7.19 P/FCFE (x) 1,049 NA NA NA NA Net Gearing 13.9% (28.4%) (8.1%) (23.7%) (15.5%) P/BV (x) 52.05 11.64 6.79 3.48 2.87 ROE 121% 45% 25% 25% 19% % Change In Core EPS Estimates CIMB/consensus EPS (x) 0.92 0.91 0.87 75 125 175 225 275 325 0.130 0.230 0.330 0.430 0.530 0.630 Price Close Relative to FSSTI (RHS) 10 20 30 40 May-15 Aug-15 Nov-15 Feb-16 Vol m
-
Upload
khangminh22 -
Category
Documents
-
view
1 -
download
0
Transcript of mm2 Asia - Gem Comm
Media - Integrated│Singapore│Equity research│May 9, 2016
Company Note │ Alpha series
IMPORTANT DISCLOSURES, INCLUDING ANY REQUIRED RESEARCH CERTIFICATIONS, ARE PROVIDED AT THE END OF THIS REPORT. IF THIS REPORT IS DISTRIBUTED IN THE UNITED STATES IT IS DISTRIBUTED BY CIMB SECURITIES (USA), INC. AND IS CONSIDERED THIRD-PARTY AFFILIATED RESEARCH.
Powered by the EFA Platform
mm2 Asia The next big bang
■ mm2, a film/TV producer, is poised to ride on the rise of the film business in China.
■ Multiple acquisitions in cinema and events management complement growing core business in production, driving FY16-18 topline growth of 16-122%.
■ High-margin business that focuses on content production and distribution, with little movie financing to minimise risk of commercial success.
■ We initiate coverage with an Add recommendation and TP of S$0.70, based on a CY17 P/E of 22.0x. This is backed by a 3-year forecast EPS CAGR of 28.8%.
Potential to be the next CJ E&M or Dalian Wanda mm2 is a film/TV production company in Asia offering a spectrum of movie-making services, and first expanded into North Asia in 2013 via co-productions with local partners. We believe mm2 is able to capitalise on its close ties with these established industry players (e.g. China’s Hesheng Media), to gain better traction in China. Not only is China an attractive market due to booming end-consumer demand, but also because of bigger production budgets and wider audience reach.
Robust earnings momentum driven by production and acquisitions We expect a growing production pipeline (from a total budget of S$11.5m in FY15 to FY16’s S$23m and FY17’s S$44m) to be the key revenue driver for mm2. Meanwhile, its newly purchased cinemas in Malaysia will contribute to its FY16 earnings and its 51%-owned concert production business will start contributing earnings in FY17, in our view, with potential synergies for mm2 to unlock across these acquisitions.
Content producer, not a speculator Unlike most production and media companies, mm2 typically does not take an equity stake in its movie productions (or not more than 10% in cases where it is unable to secure financing from other investors). This makes it less dependent on the films’ commercial success. mm2 derives income from film budgets (in the form of producer fees, script rights), as well as movie distribution. We also like its high-margin (gross ~40%, net ~20%) business model.
Favourable support from local governments Most film authorities in countries where mm2 has a presence in are supportive of local content producers, be it in terms of grants and subsidies (of up to 40% of the qualifying expenditure), or protectionist measures on number of films (local vs. foreign). More notably, China’s Five-Year Plan has the cultural sector as one of the pillars, meaning more government investment in entertainment.
Initiating coverage at Add with a TP of S$0.70 We initiate coverage with an Add rating and target price of S$0.70, based on a CY17 P/E of 22x, pegged to peer average but with higher EPS growth. Potential re-rating catalysts include a stronger-than-expected project pipeline and more earnings-accretive acquisitions. Any unforeseen production delay or lack of funding could pose downside risks.
▎Singapore
ADD (previously NOT RATED) Current price: S$0.54
Target price: S$0.70
Previous target: S$
Up/downside: 29.9% Reuters: MM2A.SI
Bloomberg: MM2 SP
Market cap: US$179.7m
S$244.3m
Average daily turnover: US$0.76m
S$1.02m
Current shares o/s 451.7m
Free float: 40.0%
Key changes in this note
Not applicable.
Source: Bloomberg
Price performance 1M 3M 12M
Absolute (%) 6.9 50 173.4
Relative (%) 8.4 44.6 193.3
Analysts
NGOH Yi Sin
T (65) 6210 8604 E [email protected]
William TNG, CFA T (65) 6210 8676 E [email protected]
[ X ]
SOURCE: COMPANY DATA, CIMB FORECASTS
Financial Summary Mar-14A Mar-15A Mar-16F Mar-17F Mar-18F
Revenue (S$m) 16.1 24.3 40.1 88.7 105.9
Operating EBITDA (S$m) 7.22 9.87 14.88 29.87 38.14
Net Profit (S$m) 2.74 5.08 6.92 14.81 17.32
Core EPS (S$) 0.008 0.012 0.016 0.028 0.033
Core EPS Growth 236% 58% 27% 81% 17%
FD Core P/E (x) 69.24 46.65 35.96 19.10 16.32
DPS (S$) - - - - -
Dividend Yield 0% 0% 0% 0% 0%
EV/EBITDA (x) 26.38 22.08 15.91 8.93 7.19
P/FCFE (x) 1,049 NA NA NA NA
Net Gearing 13.9% (28.4%) (8.1%) (23.7%) (15.5%)
P/BV (x) 52.05 11.64 6.79 3.48 2.87
ROE 121% 45% 25% 25% 19%
% Change In Core EPS Estimates
CIMB/consensus EPS (x) 0.92 0.91 0.87
75
125
175
225
275
325
0.130
0.230
0.330
0.430
0.530
0.630
Price Close Relative to FSSTI (RHS)
10
20
30
40
May-15 Aug-15 Nov-15 Feb-16
Vo
l m
Media - Integrated│Singapore│Equity research│May 9, 2016
2
The next big bang
Investment Merits
Unique business model…
mm2 is a movie/TV production company in Asia covering production, distribution, financing, and marketing, with a high-margin and asset-light business model. The bulk of its income is derived from producer fees, script rights, producer bonuses and distribution income, often as a portion of the production budget. In this way, mm2 is, we believe, less dependent on the films’ commercial success, as it limits its equity stake in a film to no more than 10%.
…with diversified revenue streams
mm2’s production and distribution revenue is rising in tandem with the increase in its production budgets. Meanwhile, its newly acquired cinemas in Malaysia will contribute to its FY16 earnings (albeit not for the full year), while its 51%-owned concert production business will start contributing earnings in FY17. mm2 is also poised to reap synergies in the following ways: 1) increasing network with international production studios and distributors through its cinemas in Malaysia, and 2) potential content creation through concert production and promotion with international celebrities.
…and established relationships with strategic partners
mm2 has long built close working relationships with various strategic partners, as its key management team has worked in roles across advertising, media, and across geographical regions. Not only can these strategic partners, which include FOX International Channel, Starhub and China’s Hesheng Media, help finance its production budgets and provide content distribution channels, they also pave the way to reach the bigger North Asian market.
Overseas expansion: bigger budget
Based on its current production pipeline, mm2 has an expanding FY16-18 budget: S$23m, S$44m, and S$55m, respectively, vs. S$11.5m in FY15. The company predominately makes movies in Singapore and Malaysia, but as it gains foothold in North Asian markets such as HK, Taiwan and China, we expect these markets to take up a greater proportion of its budget (10-20% annually). In these countries, production budgets are more substantial (3-31x its current average budget of S$1m-2m) and the audience reach wider (which means bigger box office).
Government support gives it another push
One positive trend we see is the increasing support from most film authorities that would benefit small local content producers such as mm2. The film authorities of the countries in which the company operates (for example, the Taipei Film Commission and the Media Development Authority of Singapore) promote and provide grants and subsidies of up to 40% of the qualifying expenditure. More notably, the cultural sector is one of the key pillars under China’s Five-Year Plan, and there is a ‘compulsory screening scheme’ in Malaysia to protect the local film industry.
Initiating coverage at Add with a TP of S$0.70
Apart from the expansion plans into a booming China media industry, we like mm2 for its scalable core business model and robust growth profile. We therefore initiate coverage with an Add recommendation and target price of S$0.70. This is premised on a CY17 P/E of 22.0x (peer average), and supported by FY16-18F EPS CAGR of 28.8%.
Media - Integrated│Singapore│Equity research│May 9, 2016
3
How does mm2 make money?
Business model
Established in 2008 and listed on SGX-Catalist in Dec 2014, mm2 Asia is Singapore’s leading producer of movies and TV/online content with geographic presence in Singapore, Malaysia, Hong Kong, Taiwan and China. As a producer, mm2 provides a wide spectrum of services covering the entire value chain of filmmaking, which consists of financing, production, marketing and distribution. It currently derives revenue from three principal sources – production, distribution, and sponsorship – in addition to new revenue streams from its newly-acquired cinema business (five cinemas in Malaysia) and concert production business UnUsUaL Group.
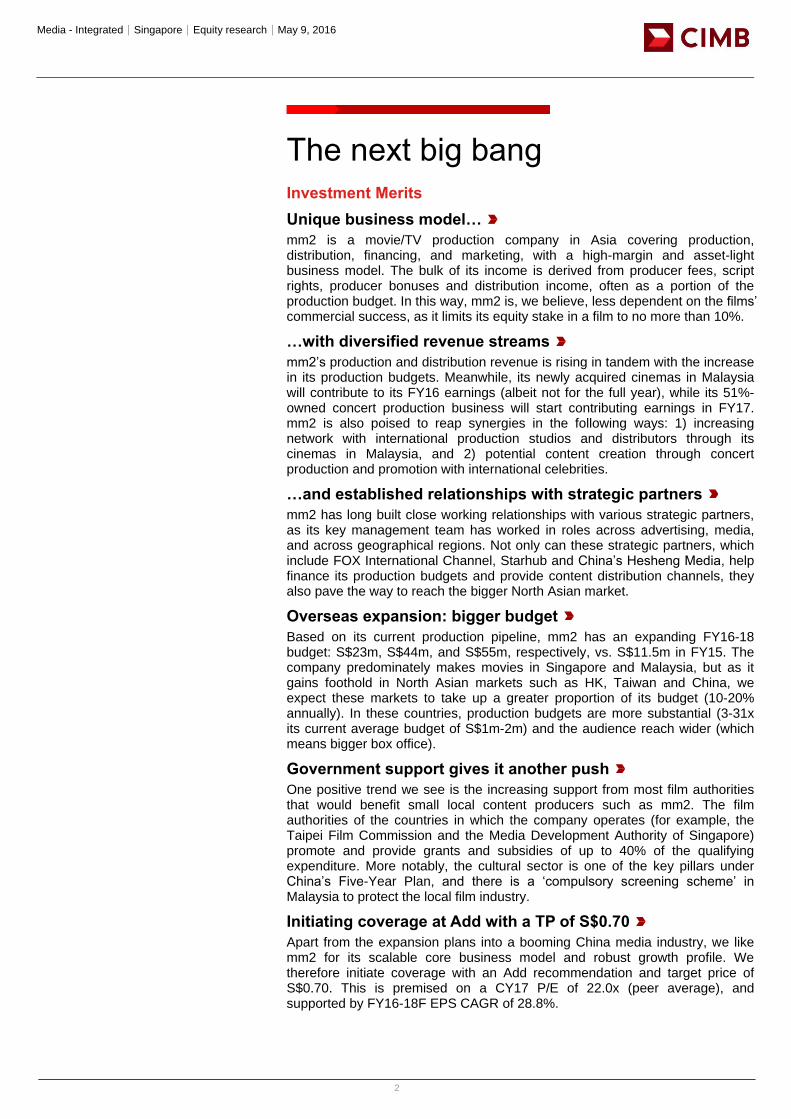
Production revenue – mm2 receives income from various stages of filmmaking. This includes producer fees (generally 10-20% of the film budget) and script rights (Figure 1), as well as producer bonus (if the film performs well). In Asia, producer bonuses generally vary from 8-10% of net profits vs. Hollywood’s 20-25%.
Distribution income – mm2 earns distribution commission (generally 7.5-10% of box office receipts) when it distributes movies produced or co-produced by itself or third parties, which can be done via various platforms – local and overseas cinemas, pay-TV, free-TV, online, DVD, airlines and others. Distribution income also comes from licensing of script rights, adaptation and sequel rights for its film library via third-party licensing arrangements.
Sponsorship income – Advertisers pay sponsorship commissions (15% of sponsorship amount, on average) to mm2 for featuring products and services in their films.
Understanding mm2: it is a content producer, not a blockbuster speculator
We believe the key difference between mm2 and other media companies lies in it being a content producer and earning utility-type fees. It is really not much of a content speculator. As a producer, mm2 draws up a film budget for production costs, script rights, and fees for the producer, director and production team etc. before any filming commences. It then derives its revenue from the production budget as mentioned above and illustrated in Figures 1-2.
Each production can be financed via various means – mm2 may approach investors that usually take up at least 10% of the budget each, apply for grants/subsidies from the local authorities (most film authorities may subsidise up to 40% of the qualifying expenditure) and solicit sponsorships from corporations. In cases where there is a shortfall in funding sources, mm2 will underwrite the remaining budget at no more than 10%, as compared to other media companies which tend to take up a larger equity stake.
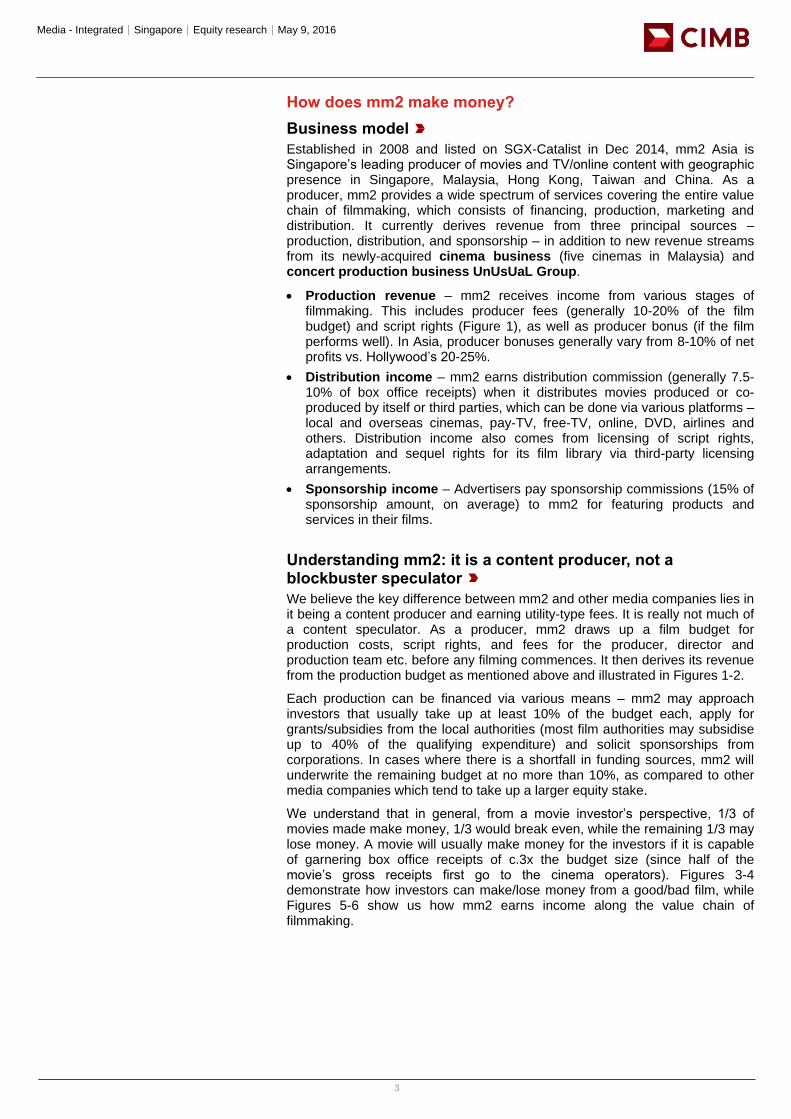
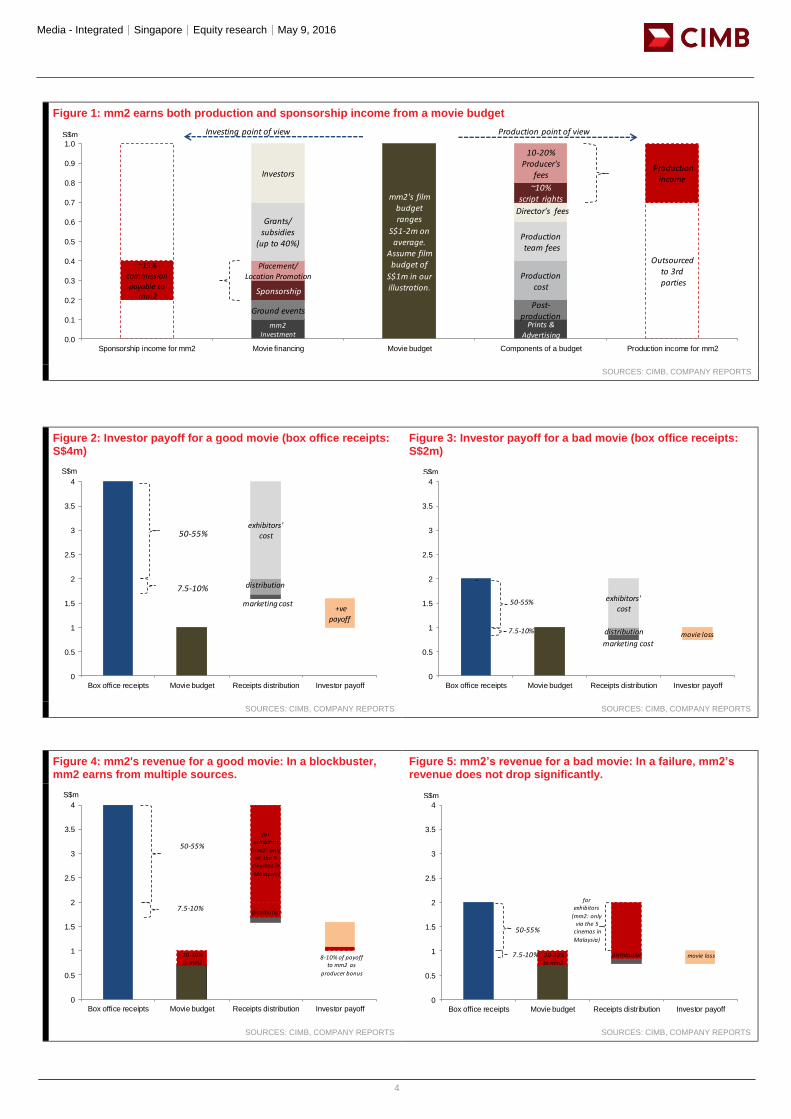
We understand that in general, from a movie investor’s perspective, 1/3 of movies made make money, 1/3 would break even, while the remaining 1/3 may lose money. A movie will usually make money for the investors if it is capable of garnering box office receipts of c.3x the budget size (since half of the movie’s gross receipts first go to the cinema operators). Figures 3-4 demonstrate how investors can make/lose money from a good/bad film, while Figures 5-6 show us how mm2 earns income along the value chain of filmmaking.
Media - Integrated│Singapore│Equity research│May 9, 2016
4
Figure 1: mm2 earns both production and sponsorship income from a movie budget
SOURCES: CIMB, COMPANY REPORTS
Figure 2: Investor payoff for a good movie (box office receipts: S$4m)
Figure 3: Investor payoff for a bad movie (box office receipts: S$2m)
SOURCES: CIMB, COMPANY REPORTS SOURCES: CIMB, COMPANY REPORTS
Figure 4: mm2's revenue for a good movie: In a blockbuster, mm2 earns from multiple sources.
Figure 5: mm2’s revenue for a bad movie: In a failure, mm2’s revenue does not drop significantly.
SOURCES: CIMB, COMPANY REPORTS SOURCES: CIMB, COMPANY REPORTS
Title:
Source:
Please fill in the values above to have them entered in your report
~15% commission payable to
mm2
Ground eventsPost-
production
Production income
mm2 Investment
mm2's film budget ranges
S$1-2m onaverage.
Assume film budget of
S$1m in ourillustration.
Prints &Advertising
Outsourcedto 3rdparties
Placement/Location Promotion
Productionteam fees
10-20% Producer's
fees
Sponsorship
Productioncost
Investors
~10%script rights
Grants/ subsidies
(up to 40%)
Director's fees
0.0
0.1
0.2
0.3
0.4
0.5
0.6
0.7
0.8
0.9
1.0
Sponsorship income for mm2 Movie financing Movie budget Components of a budget Production income for mm2
Investing point of viewS$m Production point of view
Title:
Source:
Please fill in the values above to have them entered in your reportexhibitors'
cost
distribution
marketing cost+ve
payoff
0
0.5
1
1.5
2
2.5
3
3.5
4
Box office receipts Movie budget Receipts distribution Investor payoff
S$m
50-55%
7.5-10%
Title:
Source:
Please fill in the values above to have them entered in your report
exhibitors' cost
-
distribution movie lossmarketing cost
0
0.5
1
1.5
2
2.5
3
3.5
4
Box office receipts Movie budget Receipts distribution Investor payoff
50-55%
7.5-10%
S$m
Title:
Source:
Please fill in the values above to have them entered in your report
forexhibitors
(mm2: only via the 5
cinemas in
Malaysia)
8-10% of payoff to mm2 as
producer bonus
distribution
20-30%to mm2
0
0.5
1
1.5
2
2.5
3
3.5
4
Box office receipts Movie budget Receipts distribution Investor payoff
S$m
50-55%
7.5-10%
Title:
Source:
Please fill in the values above to have them entered in your report
distribution movie loss
for exhibitors
(mm2: onlyvia the 5
cinemas in
Malaysia)
20-30% to mm2
0
0.5
1
1.5
2
2.5
3
3.5
4
Box office receipts Movie budget Receipts distribution Investor payoff
S$m
50-55%
7.5-10%
Media - Integrated│Singapore│Equity research│May 9, 2016
5
Explaining utility earnings of production
Production income a function of budget size
The average production budget for movies made by mm2 in Singapore and Malaysia is S$1m-2m. mm2 makes money from the producer’s fees and script rights, which typically make up 20-30% of a production budget, as well as from the producer’s bonus when the film fares exceptionally well. The rule of thumb for producer bonus in Asia is ~8-10% of net profits, compared with 20-25% in Hollywood. Other components of the production budget, such as director’s fees, production cost and advertising cost, are outsourced to third parties, allowing mm2 to retain its lean and asset-light business model. It also limits its risk to box office performance by keeping its equity stake of the budget to no more than 10%. It is rare for mm2 to not be able to secure financing from investors.
Stronger production pipeline and overseas expansion
mm2 produced a total of nine movies in FY15, including the popular Ah Boys to Men 3 and 1965, and targets to complete production of 18 movies/dramas in FY16. Based on the production pipeline, the estimated production budgets for FY16-18 are S$23m, S$44m and S$55m, respectively, vs. S$11.5m in FY15, providing revenue visibility. While most of its annual production budget is currently allocated for productions in Singapore and Malaysia, management expects North Asia (where the audience is wider and budgets bigger) to take up a greater portion of its production budget from FY17 onwards.
Besides movies, it also has a pipeline of television dramas, and has the potential to venture into variety shows by leveraging its strong relationships with Chinese media companies like Hesheng Media and Star China Media. We see the recent investment by Starhub into mm2 as a win-win partnership for both parties – mm2 will have an additional production budget of up to S$25m over a three-year period for local content creation, while Starhub will be able to leverage its exclusive partnership with mm2 to produce original local content in a more cost-efficient manner given the escalating costs of international content.
Value-adds in getting funding to kick start production
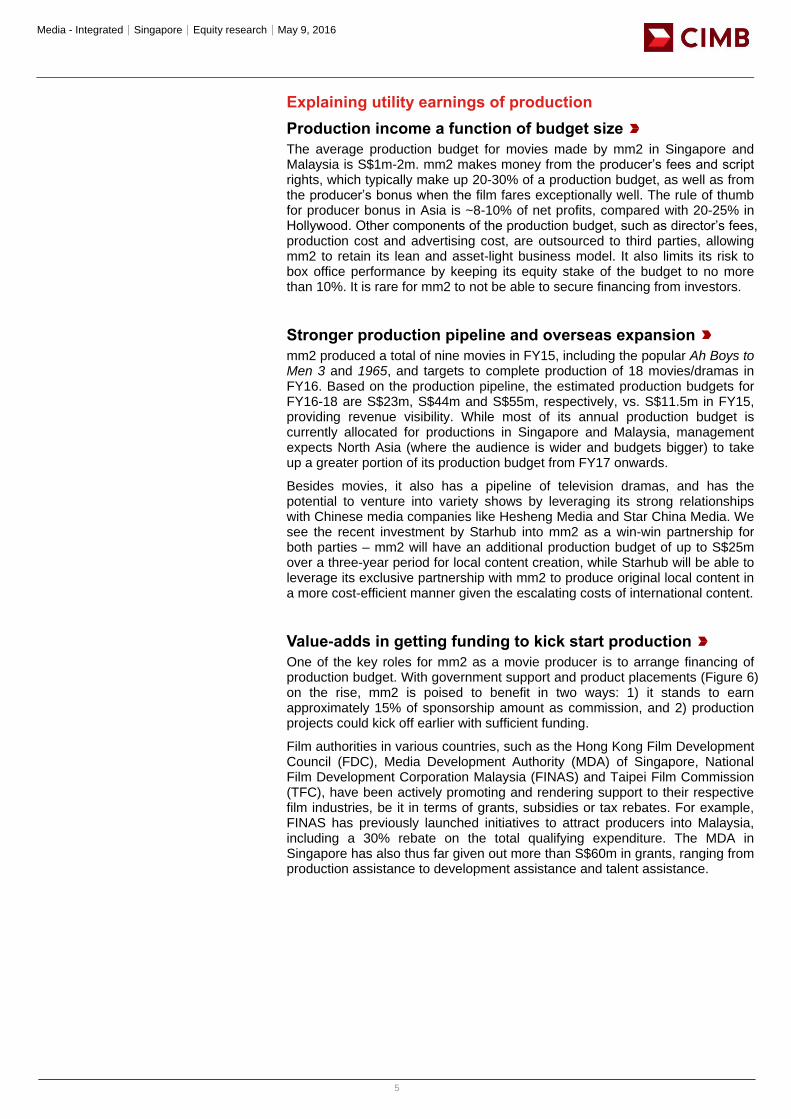
One of the key roles for mm2 as a movie producer is to arrange financing of production budget. With government support and product placements (Figure 6) on the rise, mm2 is poised to benefit in two ways: 1) it stands to earn approximately 15% of sponsorship amount as commission, and 2) production projects could kick off earlier with sufficient funding.
Film authorities in various countries, such as the Hong Kong Film Development Council (FDC), Media Development Authority (MDA) of Singapore, National Film Development Corporation Malaysia (FINAS) and Taipei Film Commission (TFC), have been actively promoting and rendering support to their respective film industries, be it in terms of grants, subsidies or tax rebates. For example, FINAS has previously launched initiatives to attract producers into Malaysia, including a 30% rebate on the total qualifying expenditure. The MDA in Singapore has also thus far given out more than S$60m in grants, ranging from production assistance to development assistance and talent assistance.
Media - Integrated│Singapore│Equity research│May 9, 2016
6
Figure 6: Successful product placements in movies
SOURCES: CNBC
Utility business #2: Cinema business
Acquired cinemas in Malaysia to contribute in FY16
Mm2 announced the acquisition of five cinemas in Malaysia in 2015, comprising three Mega cinemas (which come with a profit target of RM1.7m for two years), and two Cathay cinemas. We expect partial contribution from the five newly-acquired cinemas in FY16 (around five months for the two Cathay Cineplexes) and full-year contribution from FY17 onwards. The intangible benefits to mm2 may be in the form of building networks with international production studios for better future partnership prospects.
The cinema business is a source of recurring income, as approximately 50% of gross box office receipts are paid to cinema operators. The downside risk surfaces when cinemas pay a hefty minimum guarantee for the distribution rights of movies that subsequently do not perform well. Cinema operators have the discretion to take non-performing films offline within 2-3 days of showing.
Untapped synergies in the latest UnUsUaL Group
Working towards a holistic entertainment group
With its recent acquisition of a 51% interest in UnUsUaL Group, mm2 broadened its content offering to include concert and event management. UnUsUaL Group has not only participated in world-class events such as the Singapore F1 Grand Prix and Youth Olympic Games, but also organised concerts for well-known artistes such as Michael Buble, A-mei and Andy Lau.
We believe there are synergies in this acquisition for mm2 to unlock and complement its core business: 1) the filming and production of concerts and events could translate into differentiated content for the bigger screens; and 2) establishing close contacts with these international artistes may pave the way for future collaboration opportunities in film/TV production.
In 2015, UnUsUaL Group has organised 23 concerts/events and three special projects. Since the beginning of 2016, the company has completed four concerts (almost all sold out) with two confirmed upcoming ones. These are a testament to its expertise in sound, stage and lighting, as well as its track record. This acquisition also came with a 3-year profit target of S$5m (US$3.7m) for each year, translating to ~20% sales contribution from FY17 onwards.
Successful product placements in movies
E.T. (1982)
Hershey, maker of Reese’s Pieces, saw its profits increase by 65% during the run
of Steven Spielberg’s landmark children’s film (at the time, the largest box office
smash in history). M&M manufacturer Mars, Inc. was Spielberg’s first choice to
appear in the movie; they turned him down.
Risky Business (1983)
Tom Cruise sported Ray-Ban Wayfarers, a line once slated for cancellation by the
sunglasses manufacturer. Sales of the Wayfarers increased dramatically during the
run of the film, which catapulted both its star and his shades to pop culture
stardom. The sale of over 360,000 pairs of Wayfarers were attributed to this product
placement.
Top Gun (1986)
Once again, a partnership between Ray-Ban and a Tom Cruise flick paid off
handsomely. Sales of the company’s Aviator sunglasses rose by 40% as a result
of their use in the movie.
The Firm (1993)
Tom Cruise worked his product-placement mojo once again, driving up sales of Red
Stripe beer by 50% in the US in 30 days through a very blatant placement in the
movie.
Sideways (2004)
The Paul Giamatti comedy caused a 150% sales increase for sponsor Blackstone
Winery’s pinot noir (and a 2% drop in US sales of merlot, which Giamatti bashes in
the film).
Media - Integrated│Singapore│Equity research│May 9, 2016
7
Competitor Analysis
What mm2 has done
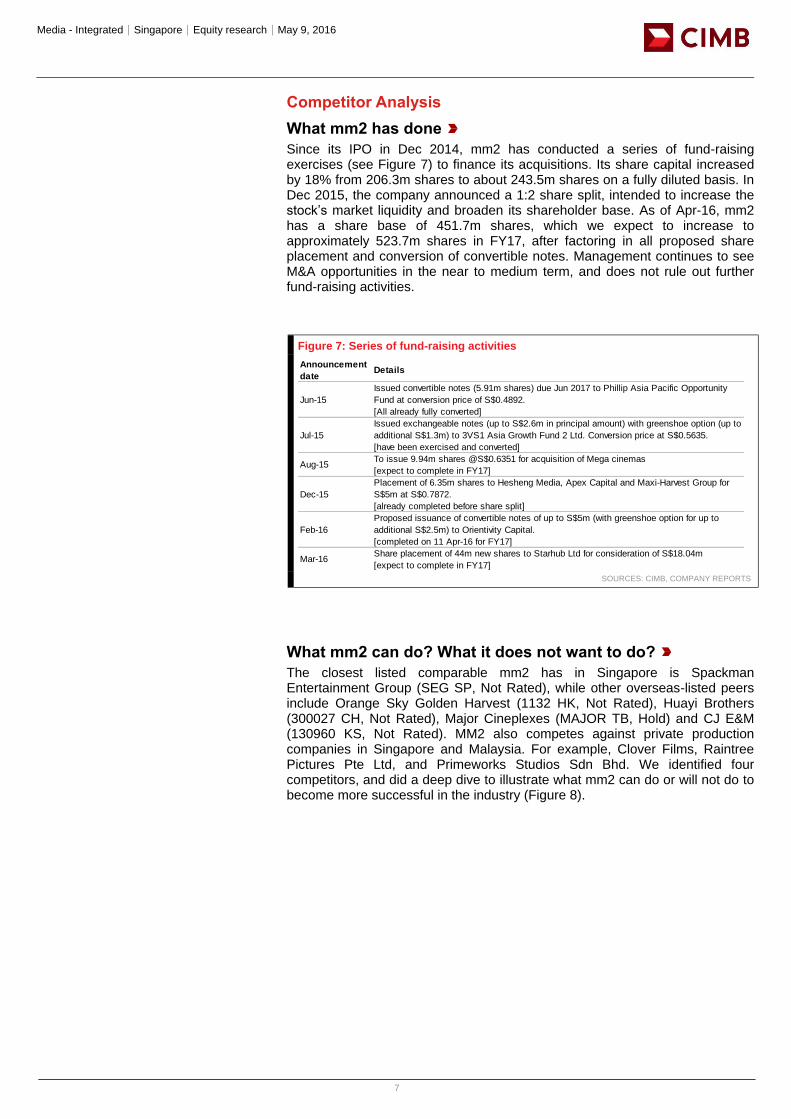
Since its IPO in Dec 2014, mm2 has conducted a series of fund-raising exercises (see Figure 7) to finance its acquisitions. Its share capital increased by 18% from 206.3m shares to about 243.5m shares on a fully diluted basis. In Dec 2015, the company announced a 1:2 share split, intended to increase the stock’s market liquidity and broaden its shareholder base. As of Apr-16, mm2 has a share base of 451.7m shares, which we expect to increase to approximately 523.7m shares in FY17, after factoring in all proposed share placement and conversion of convertible notes. Management continues to see M&A opportunities in the near to medium term, and does not rule out further fund-raising activities.
Figure 7: Series of fund-raising activities
SOURCES: CIMB, COMPANY REPORTS
What mm2 can do? What it does not want to do?
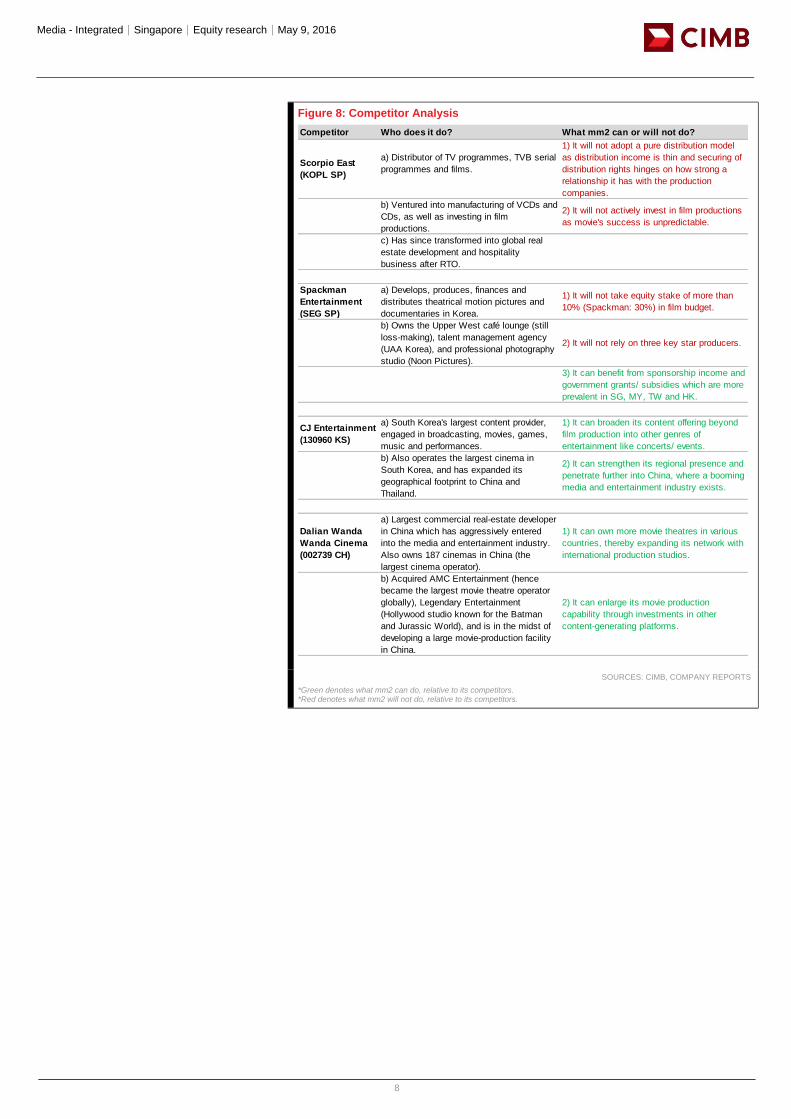
The closest listed comparable mm2 has in Singapore is Spackman Entertainment Group (SEG SP, Not Rated), while other overseas-listed peers include Orange Sky Golden Harvest (1132 HK, Not Rated), Huayi Brothers (300027 CH, Not Rated), Major Cineplexes (MAJOR TB, Hold) and CJ E&M (130960 KS, Not Rated). MM2 also competes against private production companies in Singapore and Malaysia. For example, Clover Films, Raintree Pictures Pte Ltd, and Primeworks Studios Sdn Bhd. We identified four competitors, and did a deep dive to illustrate what mm2 can do or will not do to become more successful in the industry (Figure 8).
Announcement
dateDetails
Jun-15
Issued convertible notes (5.91m shares) due Jun 2017 to Phillip Asia Pacific Opportunity
Fund at conversion price of S$0.4892.
[All already fully converted]
Jul-15
Issued exchangeable notes (up to S$2.6m in principal amount) with greenshoe option (up to
additional S$1.3m) to 3VS1 Asia Growth Fund 2 Ltd. Conversion price at S$0.5635.
[have been exercised and converted]
Aug-15To issue 9.94m shares @S$0.6351 for acquisition of Mega cinemas
[expect to complete in FY17]
Dec-15
Placement of 6.35m shares to Hesheng Media, Apex Capital and Maxi-Harvest Group for
S$5m at S$0.7872.
[already completed before share split]
Feb-16
Proposed issuance of convertible notes of up to S$5m (with greenshoe option for up to
additional S$2.5m) to Orientivity Capital.
[completed on 11 Apr-16 for FY17]
Mar-16Share placement of 44m new shares to Starhub Ltd for consideration of S$18.04m
[expect to complete in FY17]
Media - Integrated│Singapore│Equity research│May 9, 2016
8
Figure 8: Competitor Analysis
SOURCES: CIMB, COMPANY REPORTS
*Green denotes what mm2 can do, relative to its competitors. *Red denotes what mm2 will not do, relative to its competitors.
Competitor Who does it do? What mm2 can or will not do?
Scorpio East
(KOPL SP)
a) Distributor of TV programmes, TVB serial
programmes and films.
1) It will not adopt a pure distribution model
as distribution income is thin and securing of
distribution rights hinges on how strong a
relationship it has with the production
companies.
b) Ventured into manufacturing of VCDs and
CDs, as well as investing in film
productions.
2) It will not actively invest in film productions
as movie's success is unpredictable.
c) Has since transformed into global real
estate development and hospitality
business after RTO.
Spackman
Entertainment
(SEG SP)
a) Develops, produces, finances and
distributes theatrical motion pictures and
documentaries in Korea.
1) It will not take equity stake of more than
10% (Spackman: 30%) in film budget.
b) Owns the Upper West café lounge (still
loss-making), talent management agency
(UAA Korea), and professional photography
studio (Noon Pictures).
2) It will not rely on three key star producers.
3) It can benefit from sponsorship income and
government grants/ subsidies which are more
prevalent in SG, MY, TW and HK.
CJ Entertainment
(130960 KS)
a) South Korea's largest content provider,
engaged in broadcasting, movies, games,
music and performances.
1) It can broaden its content offering beyond
film production into other genres of
entertainment like concerts/ events.
b) Also operates the largest cinema in
South Korea, and has expanded its
geographical footprint to China and
Thailand.
2) It can strengthen its regional presence and
penetrate further into China, where a booming
media and entertainment industry exists.
Dalian Wanda
Wanda Cinema
(002739 CH)
a) Largest commercial real-estate developer
in China which has aggressively entered
into the media and entertainment industry.
Also owns 187 cinemas in China (the
largest cinema operator).
1) It can own more movie theatres in various
countries, thereby expanding its network with
international production studios.
b) Acquired AMC Entertainment (hence
became the largest movie theatre operator
globally), Legendary Entertainment
(Hollywood studio known for the Batman
and Jurassic World), and is in the midst of
developing a large movie-production facility
in China.
2) It can enlarge its movie production
capability through investments in other
content-generating platforms.
Media - Integrated│Singapore│Equity research│May 9, 2016
9
Financials
Robust topline growth largely driven by production
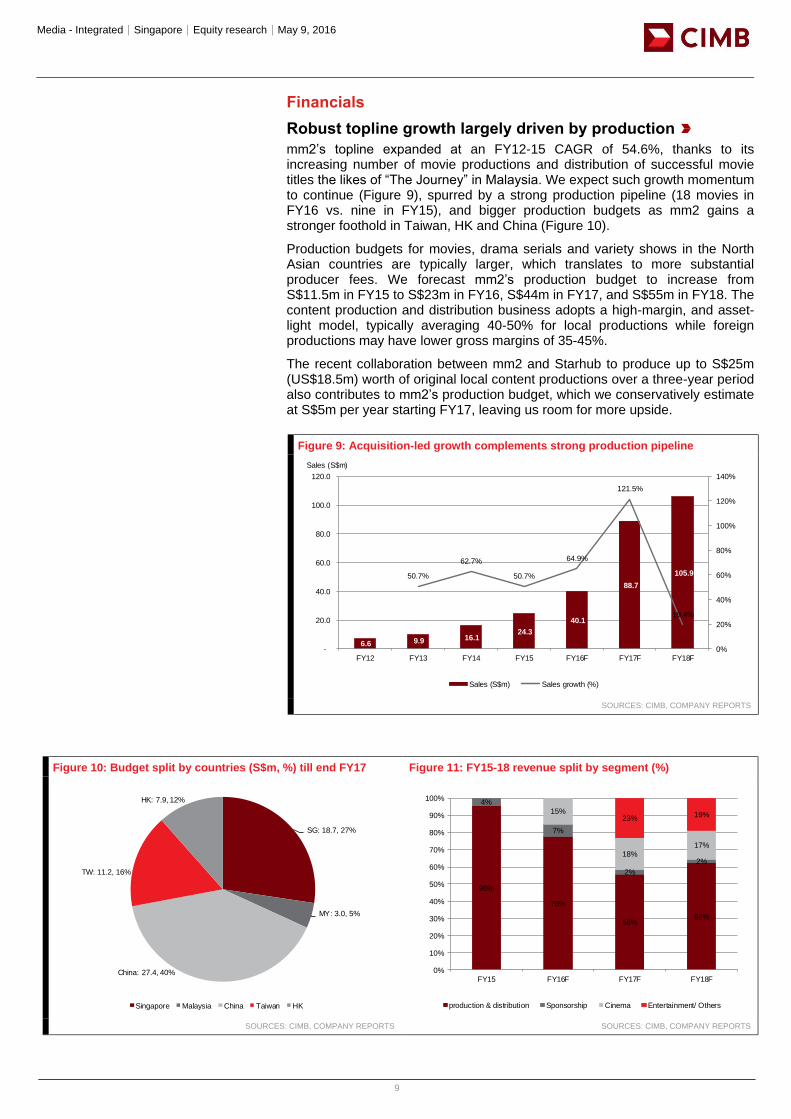
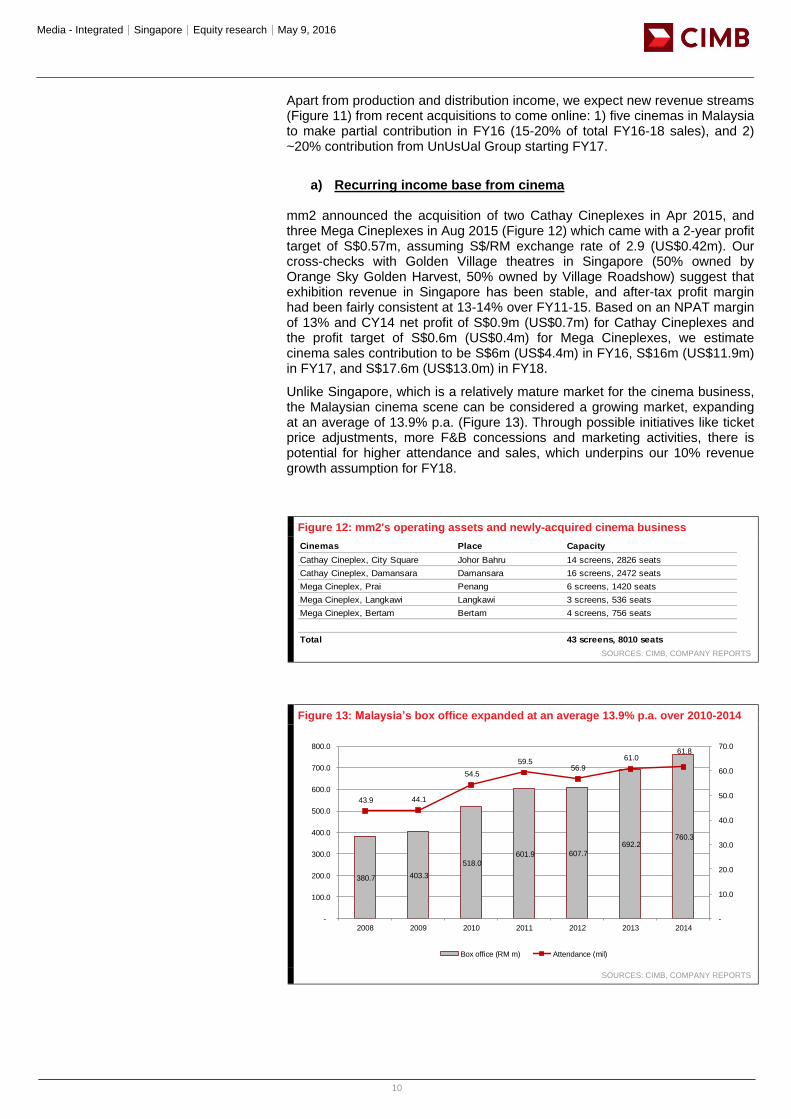
mm2’s topline expanded at an FY12-15 CAGR of 54.6%, thanks to its increasing number of movie productions and distribution of successful movie titles the likes of “The Journey” in Malaysia. We expect such growth momentum to continue (Figure 9), spurred by a strong production pipeline (18 movies in FY16 vs. nine in FY15), and bigger production budgets as mm2 gains a stronger foothold in Taiwan, HK and China (Figure 10).
Production budgets for movies, drama serials and variety shows in the North Asian countries are typically larger, which translates to more substantial producer fees. We forecast mm2’s production budget to increase from S$11.5m in FY15 to S$23m in FY16, S$44m in FY17, and S$55m in FY18. The content production and distribution business adopts a high-margin, and asset-light model, typically averaging 40-50% for local productions while foreign productions may have lower gross margins of 35-45%.
The recent collaboration between mm2 and Starhub to produce up to S$25m (US$18.5m) worth of original local content productions over a three-year period also contributes to mm2’s production budget, which we conservatively estimate at S$5m per year starting FY17, leaving us room for more upside.
Figure 9: Acquisition-led growth complements strong production pipeline
SOURCES: CIMB, COMPANY REPORTS
Figure 10: Budget split by countries (S$m, %) till end FY17 Figure 11: FY15-18 revenue split by segment (%)
SOURCES: CIMB, COMPANY REPORTS SOURCES: CIMB, COMPANY REPORTS
Title:
Source:
Please fill in the values above to have them entered in your report
6.6 9.9 16.1 24.3
40.1
88.7
105.9 50.7%
62.7%
50.7%
64.9%
121.5%
19.4%
0%
20%
40%
60%
80%
100%
120%
140%
-
20.0
40.0
60.0
80.0
100.0
120.0
FY12 FY13 FY14 FY15 FY16F FY17F FY18F
Sales (S$m) Sales growth (%)
Sales (S$m)
Title:
Source:
Please fill in the values above to have them entered in your reportSG: 18.7, 27%
MY: 3.0, 5%
China: 27.4, 40%
TW: 11.2, 16%
HK: 7.9, 12%
Singapore Malaysia China Taiwan HK
Title:
Source:
Please fill in the values above to have them entered in your report
96%
78%
56%62%
4%
7%
2%
2%
15%
18%17%
23%19%
0%
10%
20%
30%
40%
50%
60%
70%
80%
90%
100%
FY15 FY16F FY17F FY18F
production & distribution Sponsorship Cinema Entertainment/ Others
Media - Integrated│Singapore│Equity research│May 9, 2016
10
Apart from production and distribution income, we expect new revenue streams (Figure 11) from recent acquisitions to come online: 1) five cinemas in Malaysia to make partial contribution in FY16 (15-20% of total FY16-18 sales), and 2) ~20% contribution from UnUsUal Group starting FY17.
a) Recurring income base from cinema
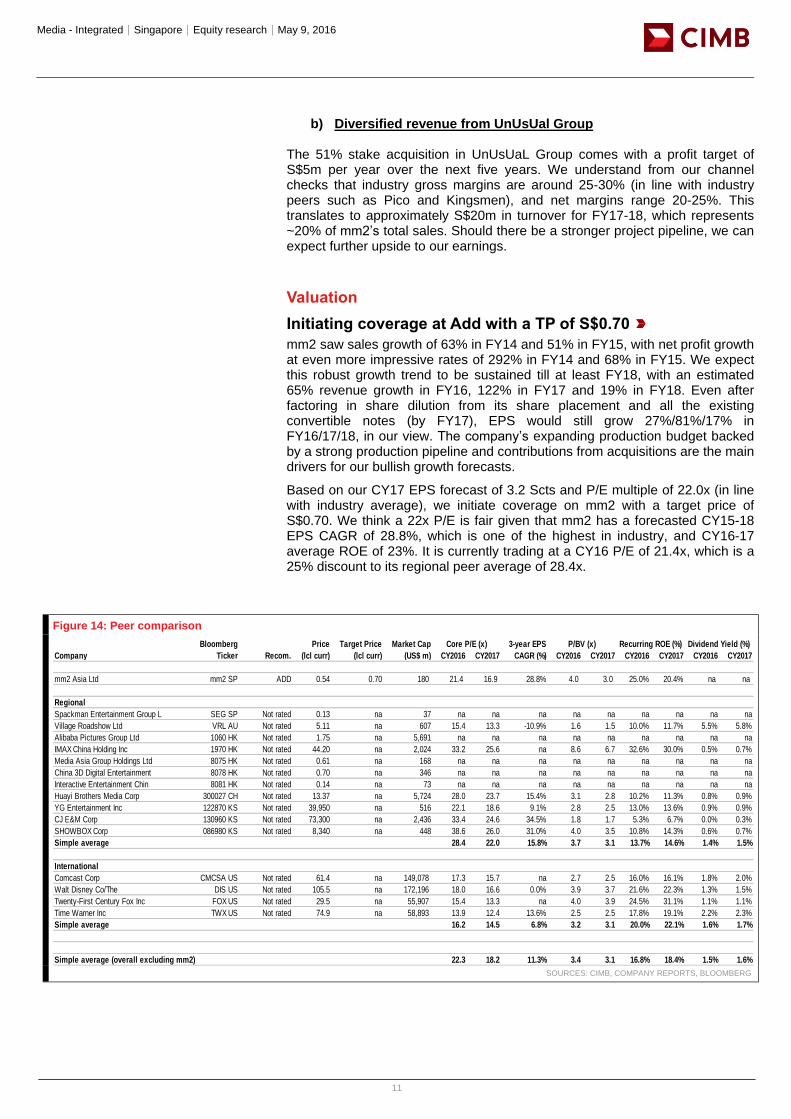
mm2 announced the acquisition of two Cathay Cineplexes in Apr 2015, and three Mega Cineplexes in Aug 2015 (Figure 12) which came with a 2-year profit target of S$0.57m, assuming S$/RM exchange rate of 2.9 (US$0.42m). Our cross-checks with Golden Village theatres in Singapore (50% owned by Orange Sky Golden Harvest, 50% owned by Village Roadshow) suggest that exhibition revenue in Singapore has been stable, and after-tax profit margin had been fairly consistent at 13-14% over FY11-15. Based on an NPAT margin of 13% and CY14 net profit of S$0.9m (US$0.7m) for Cathay Cineplexes and the profit target of S$0.6m (US$0.4m) for Mega Cineplexes, we estimate cinema sales contribution to be S$6m (US$4.4m) in FY16, S$16m (US$11.9m) in FY17, and S$17.6m (US$13.0m) in FY18.
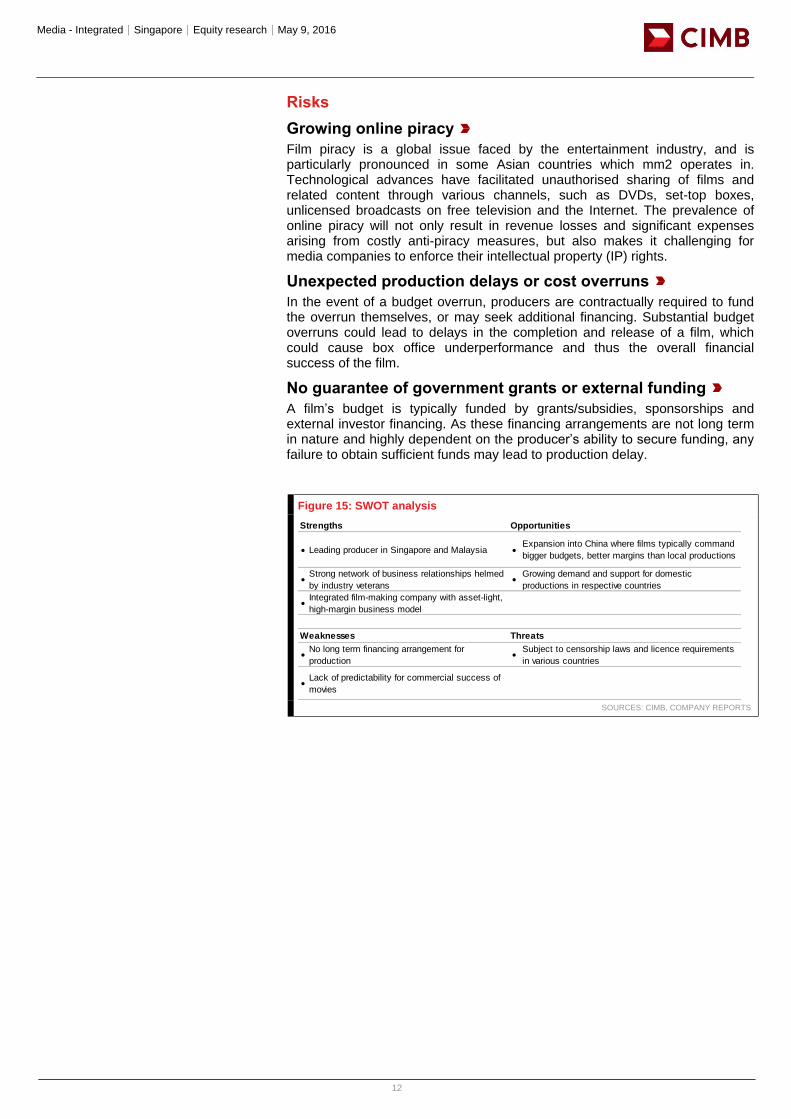
Unlike Singapore, which is a relatively mature market for the cinema business, the Malaysian cinema scene can be considered a growing market, expanding at an average of 13.9% p.a. (Figure 13). Through possible initiatives like ticket price adjustments, more F&B concessions and marketing activities, there is potential for higher attendance and sales, which underpins our 10% revenue growth assumption for FY18.
Figure 12: mm2's operating assets and newly-acquired cinema business
SOURCES: CIMB, COMPANY REPORTS
Figure 13: Malaysia’s box office expanded at an average 13.9% p.a. over 2010-2014
SOURCES: CIMB, COMPANY REPORTS
Cinemas Place Capacity
Cathay Cineplex, City Square Johor Bahru 14 screens, 2826 seats
Cathay Cineplex, Damansara Damansara 16 screens, 2472 seats
Mega Cineplex, Prai Penang 6 screens, 1420 seats
Mega Cineplex, Langkawi Langkawi 3 screens, 536 seats
Mega Cineplex, Bertam Bertam 4 screens, 756 seats
Total 43 screens, 8010 seats
Title:
Source:
Please fill in the values above to have them entered in your report
380.7 403.3
518.0
601.9 607.7
692.2 760.3
43.9 44.1
54.5
59.5 56.9
61.0 61.8
-
10.0
20.0
30.0
40.0
50.0
60.0
70.0
-
100.0
200.0
300.0
400.0
500.0
600.0
700.0
800.0
2008 2009 2010 2011 2012 2013 2014
Box office (RM m) Attendance (mil)
Media - Integrated│Singapore│Equity research│May 9, 2016
11
b) Diversified revenue from UnUsUal Group
The 51% stake acquisition in UnUsUaL Group comes with a profit target of S$5m per year over the next five years. We understand from our channel checks that industry gross margins are around 25-30% (in line with industry peers such as Pico and Kingsmen), and net margins range 20-25%. This translates to approximately S$20m in turnover for FY17-18, which represents ~20% of mm2’s total sales. Should there be a stronger project pipeline, we can expect further upside to our earnings.
Valuation
Initiating coverage at Add with a TP of S$0.70
mm2 saw sales growth of 63% in FY14 and 51% in FY15, with net profit growth at even more impressive rates of 292% in FY14 and 68% in FY15. We expect this robust growth trend to be sustained till at least FY18, with an estimated 65% revenue growth in FY16, 122% in FY17 and 19% in FY18. Even after factoring in share dilution from its share placement and all the existing convertible notes (by FY17), EPS would still grow 27%/81%/17% in FY16/17/18, in our view. The company’s expanding production budget backed by a strong production pipeline and contributions from acquisitions are the main drivers for our bullish growth forecasts.
Based on our CY17 EPS forecast of 3.2 Scts and P/E multiple of 22.0x (in line with industry average), we initiate coverage on mm2 with a target price of S$0.70. We think a 22x P/E is fair given that mm2 has a forecasted CY15-18 EPS CAGR of 28.8%, which is one of the highest in industry, and CY16-17 average ROE of 23%. It is currently trading at a CY16 P/E of 21.4x, which is a 25% discount to its regional peer average of 28.4x.
Figure 14: Peer comparison
SOURCES: CIMB, COMPANY REPORTS, BLOOMBERG
Bloomberg Price Target Price Market Cap Core P/E (x) 3-year EPS P/BV (x) Recurring ROE (%) Dividend Yield (%)
Company Ticker Recom. (lcl curr) (lcl curr) (US$ m) CY2016 CY2017 CAGR (%) CY2016 CY2017 CY2016 CY2017 CY2016 CY2017
mm2 Asia Ltd mm2 SP ADD 0.54 0.70 180 21.4 16.9 28.8% 4.0 3.0 25.0% 20.4% na na
Regional
Spackman Entertainment Group L SEG SP Not rated 0.13 na 37 na na na na na na na na na
Village Roadshow Ltd VRL AU Not rated 5.11 na 607 15.4 13.3 -10.9% 1.6 1.5 10.0% 11.7% 5.5% 5.8%
Alibaba Pictures Group Ltd 1060 HK Not rated 1.75 na 5,691 na na na na na na na na na
IMAX China Holding Inc 1970 HK Not rated 44.20 na 2,024 33.2 25.6 na 8.6 6.7 32.6% 30.0% 0.5% 0.7%
Media Asia Group Holdings Ltd 8075 HK Not rated 0.61 na 168 na na na na na na na na na
China 3D Digital Entertainment 8078 HK Not rated 0.70 na 346 na na na na na na na na na
Interactive Entertainment Chin 8081 HK Not rated 0.14 na 73 na na na na na na na na na
Huayi Brothers Media Corp 300027 CH Not rated 13.37 na 5,724 28.0 23.7 15.4% 3.1 2.8 10.2% 11.3% 0.8% 0.9%
YG Entertainment Inc 122870 KS Not rated 39,950 na 516 22.1 18.6 9.1% 2.8 2.5 13.0% 13.6% 0.9% 0.9%
CJ E&M Corp 130960 KS Not rated 73,300 na 2,436 33.4 24.6 34.5% 1.8 1.7 5.3% 6.7% 0.0% 0.3%
SHOWBOX Corp 086980 KS Not rated 8,340 na 448 38.6 26.0 31.0% 4.0 3.5 10.8% 14.3% 0.6% 0.7%
Simple average 28.4 22.0 15.8% 3.7 3.1 13.7% 14.6% 1.4% 1.5%
International
Comcast Corp CMCSA US Not rated 61.4 na 149,078 17.3 15.7 na 2.7 2.5 16.0% 16.1% 1.8% 2.0%
Walt Disney Co/The DIS US Not rated 105.5 na 172,196 18.0 16.6 0.0% 3.9 3.7 21.6% 22.3% 1.3% 1.5%
Twenty-First Century Fox Inc FOX US Not rated 29.5 na 55,907 15.4 13.3 na 4.0 3.9 24.5% 31.1% 1.1% 1.1%
Time Warner Inc TWX US Not rated 74.9 na 58,893 13.9 12.4 13.6% 2.5 2.5 17.8% 19.1% 2.2% 2.3%
Simple average 16.2 14.5 6.8% 3.2 3.1 20.0% 22.1% 1.6% 1.7%
Simple average (overall excluding mm2) 22.3 18.2 11.3% 3.4 3.1 16.8% 18.4% 1.5% 1.6%
Media - Integrated│Singapore│Equity research│May 9, 2016
12
Risks
Growing online piracy
Film piracy is a global issue faced by the entertainment industry, and is particularly pronounced in some Asian countries which mm2 operates in. Technological advances have facilitated unauthorised sharing of films and related content through various channels, such as DVDs, set-top boxes, unlicensed broadcasts on free television and the Internet. The prevalence of online piracy will not only result in revenue losses and significant expenses arising from costly anti-piracy measures, but also makes it challenging for media companies to enforce their intellectual property (IP) rights.
Unexpected production delays or cost overruns
In the event of a budget overrun, producers are contractually required to fund the overrun themselves, or may seek additional financing. Substantial budget overruns could lead to delays in the completion and release of a film, which could cause box office underperformance and thus the overall financial success of the film.
No guarantee of government grants or external funding
A film’s budget is typically funded by grants/subsidies, sponsorships and external investor financing. As these financing arrangements are not long term in nature and highly dependent on the producer’s ability to secure funding, any failure to obtain sufficient funds may lead to production delay.
Figure 15: SWOT analysis
SOURCES: CIMB, COMPANY REPORTS
Leading producer in Singapore and Malaysia Expansion into China where films typically command
bigger budgets, better margins than local productions
Strong network of business relationships helmed
by industry veterans
Growing demand and support for domestic
productions in respective countries
Integrated film-making company with asset-light,
high-margin business model
No long term financing arrangement for
production
Subject to censorship laws and licence requirements
in various countries
Lack of predictability for commercial success of
movies
Strengths Opportunities
Weaknesses Threats
Media - Integrated│Singapore│Equity research│May 9, 2016
13
Appendix
Management team
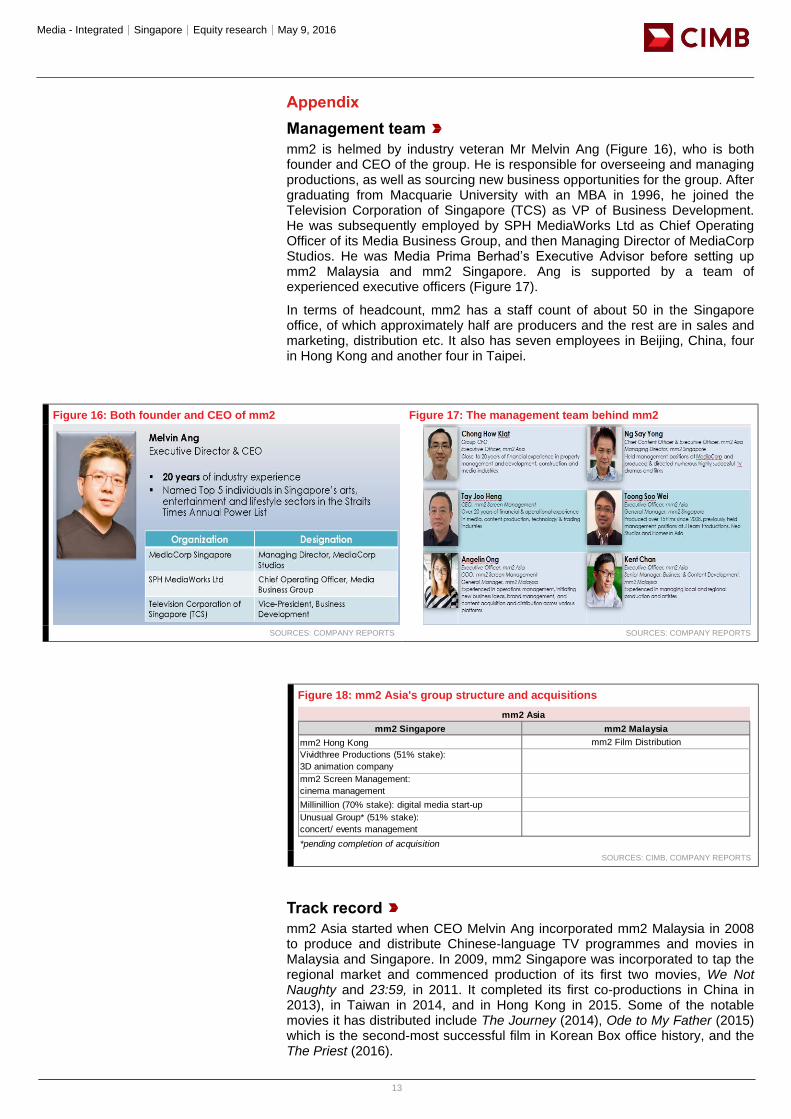
mm2 is helmed by industry veteran Mr Melvin Ang (Figure 16), who is both founder and CEO of the group. He is responsible for overseeing and managing productions, as well as sourcing new business opportunities for the group. After graduating from Macquarie University with an MBA in 1996, he joined the Television Corporation of Singapore (TCS) as VP of Business Development. He was subsequently employed by SPH MediaWorks Ltd as Chief Operating Officer of its Media Business Group, and then Managing Director of MediaCorp Studios. He was Media Prima Berhad’s Executive Advisor before setting up mm2 Malaysia and mm2 Singapore. Ang is supported by a team of experienced executive officers (Figure 17).
In terms of headcount, mm2 has a staff count of about 50 in the Singapore office, of which approximately half are producers and the rest are in sales and marketing, distribution etc. It also has seven employees in Beijing, China, four in Hong Kong and another four in Taipei.
Figure 16: Both founder and CEO of mm2 Figure 17: The management team behind mm2
SOURCES: COMPANY REPORTS SOURCES: COMPANY REPORTS
Figure 18: mm2 Asia's group structure and acquisitions
SOURCES: CIMB, COMPANY REPORTS
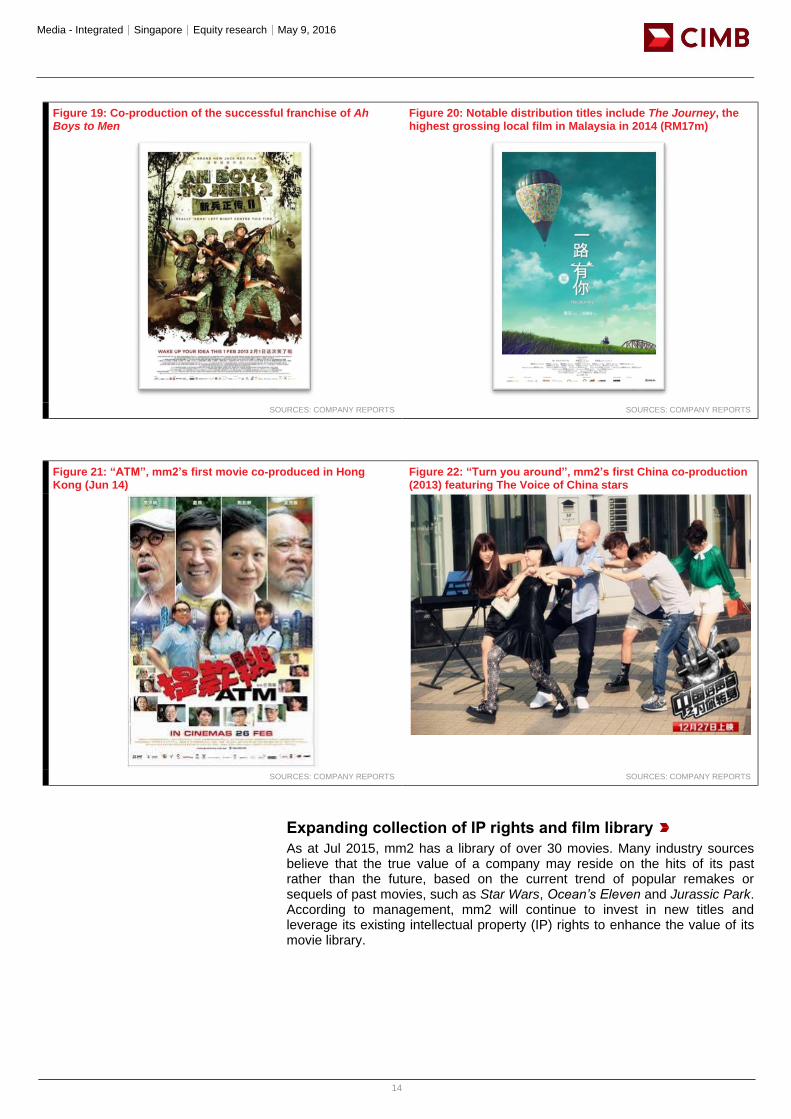
Track record
mm2 Asia started when CEO Melvin Ang incorporated mm2 Malaysia in 2008 to produce and distribute Chinese-language TV programmes and movies in Malaysia and Singapore. In 2009, mm2 Singapore was incorporated to tap the regional market and commenced production of its first two movies, We Not Naughty and 23:59, in 2011. It completed its first co-productions in China in 2013), in Taiwan in 2014, and in Hong Kong in 2015. Some of the notable movies it has distributed include The Journey (2014), Ode to My Father (2015) which is the second-most successful film in Korean Box office history, and the The Priest (2016).
mm2 Singapore mm2 Malaysia
mm2 Hong Kong mm2 Film Distribution
Vividthree Productions (51% stake):
3D animation company
mm2 Screen Management:
cinema management
Millinillion (70% stake): digital media start-up
Unusual Group* (51% stake):
concert/ events management
*pending completion of acquisition
mm2 Asia
Media - Integrated│Singapore│Equity research│May 9, 2016
14
Figure 19: Co-production of the successful franchise of Ah Boys to Men
Figure 20: Notable distribution titles include The Journey, the highest grossing local film in Malaysia in 2014 (RM17m)
SOURCES: COMPANY REPORTS SOURCES: COMPANY REPORTS
Figure 21: “ATM”, mm2’s first movie co-produced in Hong Kong (Jun 14)
Figure 22: “Turn you around”, mm2’s first China co-production (2013) featuring The Voice of China stars
SOURCES: COMPANY REPORTS SOURCES: COMPANY REPORTS
Expanding collection of IP rights and film library
As at Jul 2015, mm2 has a library of over 30 movies. Many industry sources believe that the true value of a company may reside on the hits of its past rather than the future, based on the current trend of popular remakes or sequels of past movies, such as Star Wars, Ocean’s Eleven and Jurassic Park. According to management, mm2 will continue to invest in new titles and leverage its existing intellectual property (IP) rights to enhance the value of its movie library.
Media - Integrated│Singapore│Equity research│May 9, 2016
15
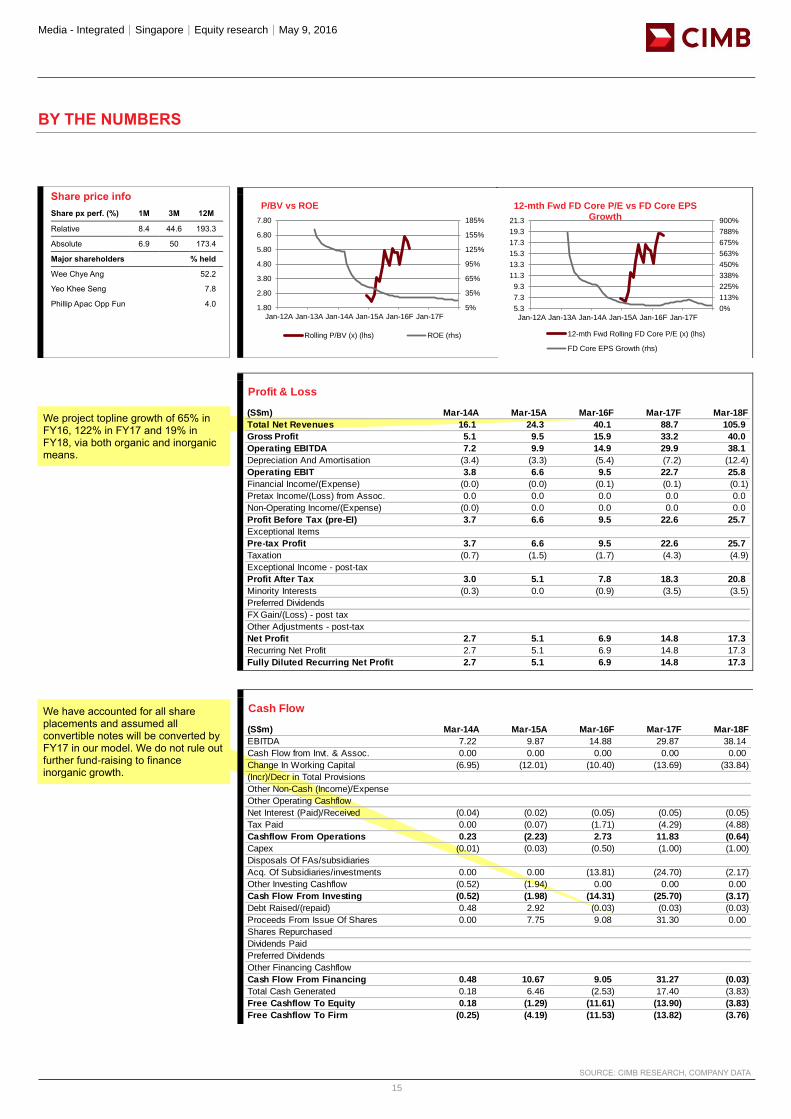
We project topline growth of 65% in FY16, 122% in FY17 and 19% in FY18, via both organic and inorganic means.
We have accounted for all share placements and assumed all convertible notes will be converted by FY17 in our model. We do not rule out further fund-raising to finance inorganic growth.
BY THE NUMBERS
Share price info
Share px perf. (%) 1M 3M 12M
Relative 8.4 44.6 193.3
Absolute 6.9 50 173.4
Major shareholders % held
Wee Chye Ang 52.2
Yeo Khee Seng 7.8
Phillip Apac Opp Fun 4.0
SOURCE: CIMB RESEARCH, COMPANY DATA
5%
35%
65%
95%
125%
155%
185%
1.80
2.80
3.80
4.80
5.80
6.80
7.80
Jan-12A Jan-13A Jan-14A Jan-15A Jan-16F Jan-17F
P/BV vs ROE
Rolling P/BV (x) (lhs) ROE (rhs)
0%
113%
225%
338%
450%
563%
675%
788%
900%
5.3
7.3
9.3
11.3
13.3
15.3
17.3
19.3
21.3
Jan-12A Jan-13A Jan-14A Jan-15A Jan-16F Jan-17F
12-mth Fwd FD Core P/E vs FD Core EPS Growth
12-mth Fwd Rolling FD Core P/E (x) (lhs)
FD Core EPS Growth (rhs)
Profit & Loss
(S$m) Mar-14A Mar-15A Mar-16F Mar-17F Mar-18F
Total Net Revenues 16.1 24.3 40.1 88.7 105.9
Gross Profit 5.1 9.5 15.9 33.2 40.0
Operating EBITDA 7.2 9.9 14.9 29.9 38.1
Depreciation And Amortisation (3.4) (3.3) (5.4) (7.2) (12.4)
Operating EBIT 3.8 6.6 9.5 22.7 25.8
Financial Income/(Expense) (0.0) (0.0) (0.1) (0.1) (0.1)
Pretax Income/(Loss) from Assoc. 0.0 0.0 0.0 0.0 0.0
Non-Operating Income/(Expense) (0.0) 0.0 0.0 0.0 0.0
Profit Before Tax (pre-EI) 3.7 6.6 9.5 22.6 25.7
Exceptional Items
Pre-tax Profit 3.7 6.6 9.5 22.6 25.7
Taxation (0.7) (1.5) (1.7) (4.3) (4.9)
Exceptional Income - post-tax
Profit After Tax 3.0 5.1 7.8 18.3 20.8
Minority Interests (0.3) 0.0 (0.9) (3.5) (3.5)
Preferred Dividends
FX Gain/(Loss) - post tax
Other Adjustments - post-tax
Net Profit 2.7 5.1 6.9 14.8 17.3
Recurring Net Profit 2.7 5.1 6.9 14.8 17.3
Fully Diluted Recurring Net Profit 2.7 5.1 6.9 14.8 17.3
Cash Flow
(S$m) Mar-14A Mar-15A Mar-16F Mar-17F Mar-18F
EBITDA 7.22 9.87 14.88 29.87 38.14
Cash Flow from Invt. & Assoc. 0.00 0.00 0.00 0.00 0.00
Change In Working Capital (6.95) (12.01) (10.40) (13.69) (33.84)
(Incr)/Decr in Total Provisions
Other Non-Cash (Income)/Expense
Other Operating Cashflow
Net Interest (Paid)/Received (0.04) (0.02) (0.05) (0.05) (0.05)
Tax Paid 0.00 (0.07) (1.71) (4.29) (4.88)
Cashflow From Operations 0.23 (2.23) 2.73 11.83 (0.64)
Capex (0.01) (0.03) (0.50) (1.00) (1.00)
Disposals Of FAs/subsidiaries
Acq. Of Subsidiaries/investments 0.00 0.00 (13.81) (24.70) (2.17)
Other Investing Cashflow (0.52) (1.94) 0.00 0.00 0.00
Cash Flow From Investing (0.52) (1.98) (14.31) (25.70) (3.17)
Debt Raised/(repaid) 0.48 2.92 (0.03) (0.03) (0.03)
Proceeds From Issue Of Shares 0.00 7.75 9.08 31.30 0.00
Shares Repurchased
Dividends Paid
Preferred Dividends
Other Financing Cashflow
Cash Flow From Financing 0.48 10.67 9.05 31.27 (0.03)
Total Cash Generated 0.18 6.46 (2.53) 17.40 (3.83)
Free Cashflow To Equity 0.18 (1.29) (11.61) (13.90) (3.83)
Free Cashflow To Firm (0.25) (4.19) (11.53) (13.82) (3.76)
Media - Integrated│Singapore│Equity research│May 9, 2016
16
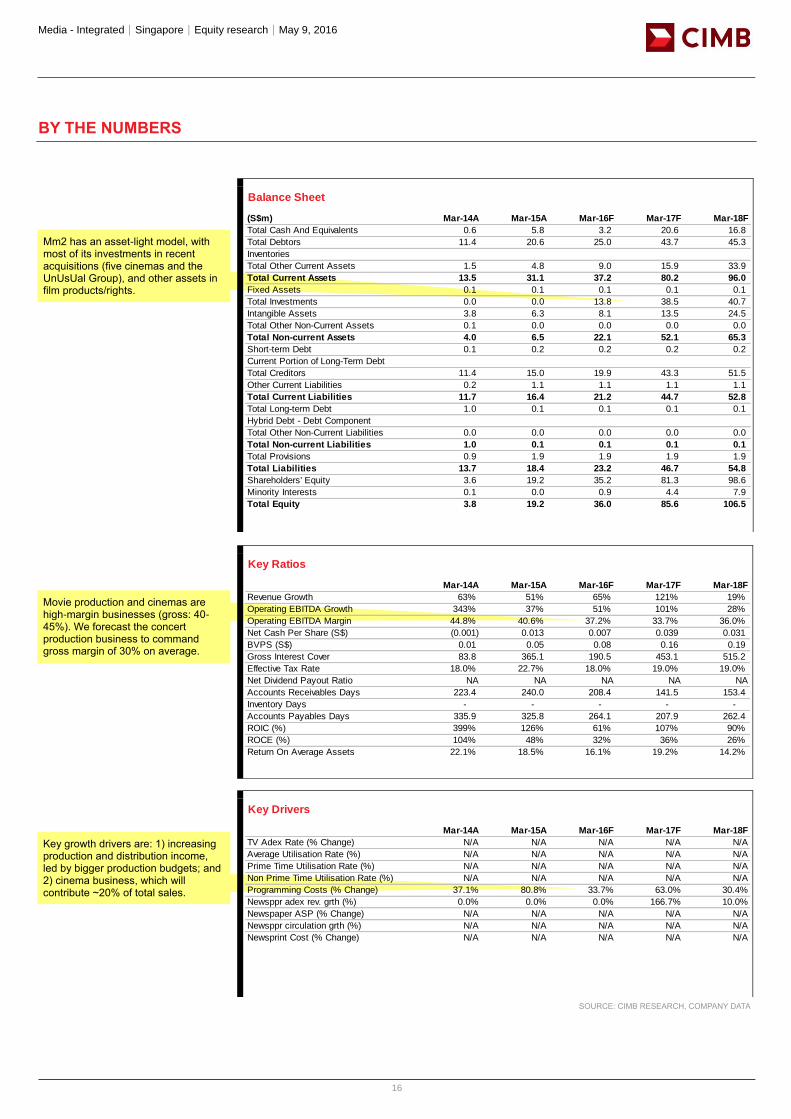
Mm2 has an asset-light model, with most of its investments in recent acquisitions (five cinemas and the UnUsUal Group), and other assets in film products/rights.
Key growth drivers are: 1) increasing production and distribution income, led by bigger production budgets; and 2) cinema business, which will contribute ~20% of total sales.
Movie production and cinemas are high-margin businesses (gross: 40-45%). We forecast the concert production business to command gross margin of 30% on average.
BY THE NUMBERS
SOURCE: CIMB RESEARCH, COMPANY DATA
Balance Sheet
(S$m) Mar-14A Mar-15A Mar-16F Mar-17F Mar-18F
Total Cash And Equivalents 0.6 5.8 3.2 20.6 16.8
Total Debtors 11.4 20.6 25.0 43.7 45.3
Inventories
Total Other Current Assets 1.5 4.8 9.0 15.9 33.9
Total Current Assets 13.5 31.1 37.2 80.2 96.0
Fixed Assets 0.1 0.1 0.1 0.1 0.1
Total Investments 0.0 0.0 13.8 38.5 40.7
Intangible Assets 3.8 6.3 8.1 13.5 24.5
Total Other Non-Current Assets 0.1 0.0 0.0 0.0 0.0
Total Non-current Assets 4.0 6.5 22.1 52.1 65.3
Short-term Debt 0.1 0.2 0.2 0.2 0.2
Current Portion of Long-Term Debt
Total Creditors 11.4 15.0 19.9 43.3 51.5
Other Current Liabilities 0.2 1.1 1.1 1.1 1.1
Total Current Liabilities 11.7 16.4 21.2 44.7 52.8
Total Long-term Debt 1.0 0.1 0.1 0.1 0.1
Hybrid Debt - Debt Component
Total Other Non-Current Liabilities 0.0 0.0 0.0 0.0 0.0
Total Non-current Liabilities 1.0 0.1 0.1 0.1 0.1
Total Provisions 0.9 1.9 1.9 1.9 1.9
Total Liabilities 13.7 18.4 23.2 46.7 54.8
Shareholders' Equity 3.6 19.2 35.2 81.3 98.6
Minority Interests 0.1 0.0 0.9 4.4 7.9
Total Equity 3.8 19.2 36.0 85.6 106.5
Key Ratios
Mar-14A Mar-15A Mar-16F Mar-17F Mar-18F
Revenue Growth 63% 51% 65% 121% 19%
Operating EBITDA Growth 343% 37% 51% 101% 28%
Operating EBITDA Margin 44.8% 40.6% 37.2% 33.7% 36.0%
Net Cash Per Share (S$) (0.001) 0.013 0.007 0.039 0.031
BVPS (S$) 0.01 0.05 0.08 0.16 0.19
Gross Interest Cover 83.8 365.1 190.5 453.1 515.2
Effective Tax Rate 18.0% 22.7% 18.0% 19.0% 19.0%
Net Dividend Payout Ratio NA NA NA NA NA
Accounts Receivables Days 223.4 240.0 208.4 141.5 153.4
Inventory Days - - - - -
Accounts Payables Days 335.9 325.8 264.1 207.9 262.4
ROIC (%) 399% 126% 61% 107% 90%
ROCE (%) 104% 48% 32% 36% 26%
Return On Average Assets 22.1% 18.5% 16.1% 19.2% 14.2%
Key Drivers
Mar-14A Mar-15A Mar-16F Mar-17F Mar-18F
TV Adex Rate (% Change) N/A N/A N/A N/A N/A
Average Utilisation Rate (%) N/A N/A N/A N/A N/A
Prime Time Utilisation Rate (%) N/A N/A N/A N/A N/A
Non Prime Time Utilisation Rate (%) N/A N/A N/A N/A N/A
Programming Costs (% Change) 37.1% 80.8% 33.7% 63.0% 30.4%
Newsppr adex rev. grth (%) 0.0% 0.0% 0.0% 166.7% 10.0%
Newspaper ASP (% Change) N/A N/A N/A N/A N/A
Newsppr circulation grth (%) N/A N/A N/A N/A N/A
Newsprint Cost (% Change) N/A N/A N/A N/A N/A
Media - Integrated│Singapore│Equity research│May 9, 2016
17
DISCLAIMER #01
The content of this report (including the views and opinions expressed therein, and the information comprised therein) has been prepared by and belongs to CIMB and is distributed by CIMB.
This report is not directed to, or intended for distribution to or use by, any person or entity who is a citizen or resident of or located in any locality, state, country or other jurisdiction where such distribution, publication, availability or use would be contrary to law or regulation.
By accepting this report, the recipient hereof represents and warrants that he is entitled to receive such report in accordance with the restrictions set forth below and agrees to be bound by the limitations contained herein (including the “Restrictions on Distributions” set out below). Any failure to comply with these limitations may constitute a violation of law. This publication is being supplied to you strictly on the basis that it will remain confidential. No part of this report may be (i) copied, photocopied, duplicated, stored or reproduced in any form by any means or (ii) redistributed or passed on, directly or indirectly, to any other person in whole or in part, for any purpose without the prior written consent of CIMB.
The information contained in this research report is prepared from data believed to be correct and reliable at the time of issue of this report. CIMB may or may not issue regular reports on the subject matter of this report at any frequency and may cease to do so or change the periodicity of reports at any time. CIMB is under no obligation to update this report in the event of a material change to the information contained in this report. CIMB has no, and will not accept any, obligation to (i) check or ensure that the contents of this report remain current, reliable or relevant, (ii) ensure that the content of this report constitutes all the information a prospective investor may require, (iii) ensure the adequacy, accuracy, completeness, reliability or fairness of any views, opinions and information, and accordingly, CIMB, or any of their respective affiliates, or its related persons (and their respective directors, associates, connected persons and/or employees) shall not be liable in any manner whatsoever for any consequences (including but not limited to any direct, indirect or consequential losses, loss of profits and damages) of any reliance thereon or usage thereof. In particular, CIMB disclaims all responsibility and liability for the views and opinions set out in this report.
Unless otherwise specified, this report is based upon sources which CIMB considers to be reasonable. Such sources will, unless otherwise specified, for market data, be market data and prices available from the main stock exchange or market where the relevant security is listed, or, where appropriate, any other market. Information on the accounts and business of company(ies) will generally be based on published statements of the company(ies), information disseminated by regulatory information services, other publicly available information and information resulting from our research.
Whilst every effort is made to ensure that statements of facts made in this report are accurate, all estimates, projections, forecasts, expressions of opinion and other subjective judgments contained in this report are based on assumptions considered to be reasonable as of the date of the document in which they are contained and must not be construed as a representation that the matters referred to therein will occur. Past performance is not a reliable indicator of future performance. The value of investments may go down as well as up and those investing may, depending on the investments in question, lose more than the initial investment. No report shall constitute an offer or an invitation by or on behalf of CIMB or its affiliates to any person to buy or sell any investments.
CIMB, its affiliates and related companies, their directors, associates, connected parties and/or employees may own or have positions in securities of the company(ies) covered in this research report or any securities related thereto and may from time to time add to or dispose of, or may be materially interested in, any such securities. Further, CIMB, its affiliates and its related companies do and seek to do business with the company(ies) covered in this research report and may from time to time act as market maker or have assumed an underwriting commitment in securities of such company(ies), may sell them to or buy them from customers on a principal basis and may also perform or seek to perform significant investment banking, advisory, underwriting or placement services for or relating to such company(ies) as well as solicit such investment, advisory or other services from any entity mentioned in this report.
CIMB or its affiliates may enter into an agreement with the company(ies) covered in this report relating to the production of research reports. CIMB may disclose the contents of this report to the company(ies) covered by it and may have amended the contents of this report following such disclosure.
The analyst responsible for the production of this report hereby certifies that the views expressed herein accurately and exclusively reflect his or her personal views and opinions about any and all of the issuers or securities analysed in this report and were prepared independently and autonomously. No part of the compensation of the analyst(s) was, is, or will be directly or indirectly related to the inclusion of specific recommendations(s) or view(s) in this report. CIMB prohibits the analyst(s) who prepared this research report from receiving any compensation, incentive or bonus based on specific investment banking transactions or for providing a specific recommendation for, or view of, a particular company. Information barriers and other arrangements may be established where necessary to prevent conflicts of interests arising. However, the analyst(s) may receive compensation that is based on his/their coverage of company(ies) in the performance of his/their duties or the performance of his/their recommendations and the research personnel involved in the preparation of this report may also participate in the solicitation of the businesses as described above. In reviewing this research report, an investor should be aware that any or all of the foregoing, among other things, may give rise to real or potential conflicts of interest. Additional information is, subject to the duties of confidentiality, available on request.
Reports relating to a specific geographical area are produced by the corresponding CIMB entity as listed in the table below. The term “CIMB” shall denote, where appropriate, the relevant entity distributing or disseminating the report in the particular jurisdiction referenced below, or, in every other case, CIMB Group Holdings Berhad ("CIMBGH") and its affiliates, subsidiaries and related companies.
Media - Integrated│Singapore│Equity research│May 9, 2016
18
Country CIMB Entity Regulated by
Hong Kong CIMB Securities Limited Securities and Futures Commission Hong Kong
India CIMB Securities (India) Private Limited Securities and Exchange Board of India (SEBI)
Indonesia PT CIMB Securities Indonesia Financial Services Authority of Indonesia
Malaysia CIMB Investment Bank Berhad Securities Commission Malaysia
Singapore CIMB Research Pte. Ltd. Monetary Authority of Singapore
South Korea CIMB Securities Limited, Korea Branch Financial Services Commission and Financial Supervisory Service
Taiwan CIMB Securities Limited, Taiwan Branch Financial Supervisory Commission
Thailand CIMB Securities (Thailand) Co. Ltd. Securities and Exchange Commission Thailand
(i) As of May 9, 2016 CIMB has a proprietary position in the securities (which may include but not limited to shares, warrants, call warrants and/or any other derivatives) in the following company or companies covered or recommended in this report:
(a) mm2 Asia
(ii) As of May 9, 2016, the analyst(s) who prepared this report, and the associate(s), has / have an interest in the securities (which may include but not limited to shares, warrants, call warrants and/or any other derivatives) in the following company or companies covered or recommended in this report:
(a) -
This report does not purport to contain all the information that a prospective investor may require. CIMB or any of its affiliates does not make any guarantee, representation or warranty, express or implied, as to the adequacy, accuracy, completeness, reliability or fairness of any such information and opinion contained in this report. Neither CIMB nor any of its affiliates nor its related persons shall be liable in any manner whatsoever for any consequences (including but not limited to any direct, indirect or consequential losses, loss of profits and damages) of any reliance thereon or usage thereof.
This report is general in nature and has been prepared for information purposes only. It is intended for circulation amongst CIMB and its affiliates’ clients generally and does not have regard to the specific investment objectives, financial situation and the particular needs of any specific person who may receive this report. The information and opinions in this report are not and should not be construed or considered as an offer, recommendation or solicitation to buy or sell the subject securities, related investments or other financial instruments or any derivative instrument, or any rights pertaining thereto.
Investors are advised to make their own independent evaluation of the information contained in this research report, consider their own individual investment objectives, financial situation and particular needs and consult their own professional and financial advisers as to the legal, business, financial, tax and other aspects before participating in any transaction in respect of the securities of company(ies) covered in this research report.
The securities of such company(ies) may not be eligible for sale in all jurisdictions or to all categories of investors.
Australia: Despite anything in this report to the contrary, this research is provided in Australia by CIMB Securities (Singapore) Pte. Ltd. and CIMB Securities Limited. This research is only available in Australia to persons who are “wholesale clients” (within the meaning of the Corporations Act 2001 (Cth) and is supplied solely for the use of such wholesale clients and shall not be distributed or passed on to any other person. You represent and warrant that if you are in Australia, you are a “wholesale client”. This research is of a general nature only and has been prepared without taking into account the objectives, financial situation or needs of the individual recipient. CIMB Securities (Singapore) Pte. Ltd. and CIMB Securities Limited do not hold, and are not required to hold an Australian financial services licence. CIMB Securities (Singapore) Pte. Ltd. and CIMB Securities Limited rely on “passporting” exemptions for entities appropriately licensed by the Monetary Authority of Singapore (under ASIC Class Order 03/1102) and the Securities and Futures Commission in Hong Kong (under ASIC Class Order 03/1103).
Canada: This research report has not been prepared in accordance with the disclosure requirements of Dealer Member Rule 3400 – Research Restrictions and Disclosure Requirements of the Investment Industry Regulatory Organization of Canada. For any research report distributed by CIBC, further disclosures related to CIBC conflicts of interest can be found at https://researchcentral.cibcwm.com .
China: For the purpose of this report, the People’s Republic of China (“PRC”) does not include the Hong Kong Special Administrative Region, the Macau Special Administrative Region or Taiwan. The distributor of this report has not been approved or licensed by the China Securities Regulatory Commission or any other relevant regulatory authority or governmental agency in the PRC. This report contains only marketing information. The distribution of this report is not an offer to buy or sell to any person within or outside PRC or a solicitation to any person within or outside of PRC to buy or sell any instruments described herein. This report is being issued outside the PRC to a limited number of institutional investors and may not be provided to any person other than the original recipient and may not be reproduced or used for any other purpose.
France: Only qualified investors within the meaning of French law shall have access to this report. This report shall not be considered as an offer to subscribe to, or used in connection with, any offer for subscription or sale or marketing or direct or indirect distribution of financial instruments and it is not intended as a solicitation for the purchase of any financial instrument.
Germany: This report is only directed at persons who are professional investors as defined in sec 31a(2) of the German Securities Trading Act (WpHG). This publication constitutes research of a non-binding nature on the market situation and the investment instruments cited here at the time of the publication of the information.
The current prices/yields in this issue are based upon closing prices from Bloomberg as of the day preceding publication. Please note that neither the German Federal Financial Supervisory Agency (BaFin), nor any other supervisory authority exercises any control over the content of this report.
Hong Kong: This report is issued and distributed in Hong Kong by CIMB Securities Limited (“CHK”) which is licensed in Hong Kong by the Securities and Futures Commission for Type 1 (dealing in securities), Type 4 (advising on securities) and Type 6 (advising on corporate finance) activities. Any investors wishing to purchase or otherwise deal in the securities covered in this report should contact the Head of Sales at CIMB Securities Limited. The views and opinions in this research report are our own as of the date hereof and are subject to change. If the Financial Services and Markets Act of the United Kingdom or the rules of the Financial Conduct Authority apply to a recipient, our obligations owed to such
Media - Integrated│Singapore│Equity research│May 9, 2016
19
recipient therein are unaffected. CHK has no obligation to update its opinion or the information in this research report.
This publication is strictly confidential and is for private circulation only to clients of CHK.
CIMB Securities Limited does not make a market on the securities mentioned in the report.
India: This report is issued and distributed in India by CIMB Securities (India) Private Limited (“CIMB India”) which is registered with the National Stock Exchange of India Limited and BSE Limited as a trading and clearing member under the Securities and Exchange Board of India (Stock Brokers and Sub-Brokers) Regulations, 1992. In accordance with the provisions of Regulation 4(g) of the Securities and Exchange Board of India (Investment Advisers) Regulations, 2013, CIMB India is not required to seek registration with the Securities and Exchange Board of India (“SEBI”) as an Investment Adviser. CIMB India is registered with SEBI as a Research Analyst pursuant to the SEBI (Research Analysts) Regulations, 2014 ("Regulations").
This report does not take into account the particular investment objectives, financial situations, or needs of the recipients. It is not intended for and does not deal with prohibitions on investment due to law/jurisdiction issues etc. which may exist for certain persons/entities. Recipients should rely on their own investigations and take their own professional advice before investment.
The report is not a “prospectus” as defined under Indian Law, including the Companies Act, 2013, and is not, and shall not be, approved by, or filed or registered with, any Indian regulator, including any Registrar of Companies in India, SEBI, any Indian stock exchange, or the Reserve Bank of India. No offer, or invitation to offer, or solicitation of subscription with respect to any such securities listed or proposed to be listed in India is being made, or intended to be made, to the public, or to any member or section of the public in India, through or pursuant to this report.
The research analysts, strategists or economists principally responsible for the preparation of this research report are segregated from the other activities of CIMB India and they have received compensation based upon various factors, including quality, accuracy and value of research, firm profitability or revenues, client feedback and competitive factors. Research analysts', strategists' or economists' compensation is not linked to investment banking or capital markets transactions performed or proposed to be performed by CIMB India or its affiliates.
Indonesia: This report is issued and distributed by PT CIMB Securities Indonesia (“CIMBI”). The views and opinions in this research report are our own as of the date hereof and are subject to change. If the Financial Services and Markets Act of the United Kingdom or the rules of the Financial Conduct Authority apply to a recipient, our obligations owed to such recipient therein are unaffected. CIMBI has no obligation to update its opinion or the information in this research report. Neither this report nor any copy hereof may be distributed in Indonesia or to any Indonesian citizens wherever they are domiciled or to Indonesian residents except in compliance with applicable Indonesian capital market laws and regulations.
This research report is not an offer of securities in Indonesia. The securities referred to in this research report have not been registered with the Financial Services Authority (Otoritas Jasa Keuangan) pursuant to relevant capital market laws and regulations, and may not be offered or sold within the territory of the Republic of Indonesia or to Indonesian citizens through a public offering or in circumstances which constitute an offer within the meaning of the Indonesian capital market law and regulations.
Ireland: CIMB is not an investment firm authorised in the Republic of Ireland and no part of this document should be construed as CIMB acting as, or otherwise claiming or representing to be, an investment firm authorised in the Republic of Ireland.
Malaysia: This report is issued and distributed by CIMB Investment Bank Berhad (“CIMB”) solely for the benefit of and for the exclusive use of our clients. If the Financial Services and Markets Act of the United Kingdom or the rules of the Financial Conduct Authority apply to a recipient, our obligations owed to such recipient therein are unaffected. CIMB has no obligation to update, revise or reaffirm its opinion or the information in this research reports after the date of this report.
New Zealand: In New Zealand, this report is for distribution only to persons who are wholesale clients pursuant to section 5C of the Financial Advisers Act 2008.
Singapore: This report is issued and distributed by CIMB Research Pte Ltd (“CIMBR”). CIMBR is a financial adviser licensed under the Financial Advisers Act, Cap 110 (“FAA”) for advising on investment products, by issuing or promulgating research analyses or research reports, whether in electronic, print or other form. Accordingly CIMBR is a subject to the applicable rules under the FAA unless it is able to avail itself to any prescribed exemptions.
Recipients of this report are to contact CIMB Research Pte Ltd, 50 Raffles Place, #19-00 Singapore Land Tower, Singapore in respect of any matters arising from, or in connection with this report. CIMBR has no obligation to update its opinion or the information in this research report. This publication is strictly confidential and is for private circulation only. If you have not been sent this report by CIMBR directly, you may not rely, use or disclose to anyone else this report or its contents.
If the recipient of this research report is not an accredited investor, expert investor or institutional investor, CIMBR accepts legal responsibility for the contents of the report without any disclaimer limiting or otherwise curtailing such legal responsibility. If the recipient is an accredited investor, expert investor or institutional investor, the recipient is deemed to acknowledge that CIMBR is exempt from certain requirements under the FAA and its attendant regulations, and as such, is exempt from complying with the following :
(a) Section 25 of the FAA (obligation to disclose product information);
(b) Section 27 (duty not to make recommendation with respect to any investment product without having a reasonable basis where you may be reasonably expected to rely on the recommendation) of the FAA;
(c) MAS Notice on Information to Clients and Product Information Disclosure [Notice No. FAA-N03];
(d) MAS Notice on Recommendation on Investment Products [Notice No. FAA-N16];
(e) Section 36 (obligation on disclosure of interest in securities), and
(f) any other laws, regulations, notices, directive, guidelines, circulars and practice notes which are relates to the above, to the extent permitted by applicable laws, as may be amended from time to time, and any other laws, regulations, notices, directive, guidelines, circulars, and practice notes as we may notify you from time to time. In addition, the recipient who is an accredited investor, expert investor or institutional investor acknowledges that a CIMBR is exempt from Section 27 of the FAA, the recipient will also not be able to file a civil claim against CIMBR for any loss or damage arising from the recipient’s reliance on any recommendation made by CIMBR which would otherwise be a right that is available to the recipient under Section 27 of the FAA, the recipient will also not be able to file a civil claim against CIMBR for any loss or damage arising
Media - Integrated│Singapore│Equity research│May 9, 2016
20
from the recipient’s reliance on any recommendation made by CIMBR which would otherwise be a right that is available to the recipient under Section 27 of the FAA.
CIMB Research Pte Ltd ("CIMBR"), its affiliates and related companies, their directors, associates, connected parties and/or employees may own or have positions in securities of the company(ies) covered in this research report or any securities related thereto and may from time to time add to or dispose of, or may be materially interested in, any such securities. Further, CIMBR, its affiliates and its related companies do and seek to do business with the company(ies) covered in this research report and may from time to time act as market maker or have assumed an underwriting commitment in securities of such company(ies), may sell them to or buy them from customers on a principal basis and may also perform or seek to perform significant investment banking, advisory, underwriting or placement services for or relating to such company(ies) as well as solicit such investment, advisory or other services from any entity mentioned in this report.
As of May 9, 2016, CIMBR does not have a proprietary position in the recommended securities in this report.
CIMB Securities Singapore Pte Ltd and/or CIMB Bank does not make a market on the securities mentioned in the report.
South Korea: This report is issued and distributed in South Korea by CIMB Securities Limited, Korea Branch (“CIMB Korea”) which is licensed as a cash equity broker, and regulated by the Financial Services Commission and Financial Supervisory Service of Korea. In South Korea, this report is for distribution only to professional investors under Article 9(5) of the Financial Investment Services and Capital Market Act of Korea (“FSCMA”).
Spain: This document is a research report and it is addressed to institutional investors only. The research report is of a general nature and not personalised and does not constitute investment advice so, as the case may be, the recipient must seek proper advice before adopting any investment decision. This document does not constitute a public offering of securities.
CIMB is not registered with the Spanish Comision Nacional del Mercado de Valores to provide investment services.
Sweden: This report contains only marketing information and has not been approved by the Swedish Financial Supervisory Authority. The distribution of this report is not an offer to sell to any person in Sweden or a solicitation to any person in Sweden to buy any instruments described herein and may not be forwarded to the public in Sweden.
Switzerland: This report has not been prepared in accordance with the recognized self-regulatory minimal standards for research reports of banks issued by the Swiss Bankers’ Association (Directives on the Independence of Financial Research).
Taiwan: This research report is not an offer or marketing of foreign securities in Taiwan. The securities as referred to in this research report have not been and will not be registered with the Financial Supervisory Commission of the Republic of China pursuant to relevant securities laws and regulations and may not be offered or sold within the Republic of China through a public offering or in circumstances which constitutes an offer or a placement within the meaning of the Securities and Exchange Law of the Republic of China that requires a registration or approval of the Financial Supervisory Commission of the Republic of China.
Thailand: This report is issued and distributed by CIMB Securities (Thailand) Company Limited (“CIMBS”) based upon sources believed to be reliable (but their accuracy, completeness or correctness is not guaranteed). The statements or expressions of opinion herein were arrived at after due and careful consideration for use as information for investment. Such opinions are subject to change without notice and CIMBS has no obligation to update its opinion or the information in this research report.
If the Financial Services and Markets Act of the United Kingdom or the rules of the Financial Conduct Authority apply to a recipient, our obligations owed to such recipient are unaffected.
CIMB Securities (Thailand) Co., Ltd. may act or acts as Market Maker, and issuer and offerer of Derivative Warrants and Structured Note which may have the following securities as its underlying securities. Investors should carefully read and study the details of the derivative warrants in the prospectus before making investment decisions.
AAV, ADVANC, AMATA, ANAN, AOT, AP, BA, BANPU, BBL, BCP, BDMS, BEAUTY, BEC, BEM, BH, BJCHI, BLA, BLAND, BTS, CBG, CENTEL, CHG, CK, CKP, CPALL, CPF, CPN, DELTA, DTAC, EARTH, EGCO, EPG, GL, GLOW, GPSC, GUNKUL, HANA, HMPRO, ICHI, INTUCH, IRPC, ITD, IVL, JAS, KBANK, KCE, KKP, KTB, KTC, LH, LHBANK, LPN, M, MAJOR, MINT, PLANB, PLAT, PS, PTG, PTT, PTTEP, PTTGC, QH, ROBINS, RS, S, SAMART, SAMTEL, SAWAD, SCB, SCC, SCCC, SCN, SGP, SIRI, SPALI, SPCG, STEC, STPI, SVI, TASCO, TCAP, THAI, THCOM, TICON, TISCO, TMB, TOP, TPIPL, TRUE, TTA, TTCL, TTW, TU, UNIQ, UV, VGI, VNG, WHA, WORK.
Corporate Governance Report:
The disclosure of the survey result of the Thai Institute of Directors Association (“IOD”) regarding corporate governance is made pursuant to the policy of the Office of the Securities and Exchange Commission. The survey of the IOD is based on the information of a company listed on the Stock Exchange of Thailand and the Market for Alternative Investment disclosed to the public and able to be accessed by a general public investor. The result, therefore, is from the perspective of a third party. It is not an evaluation of operation and is not based on inside information.
The survey result is as of the date appearing in the Corporate Governance Report of Thai Listed Companies. As a result, the survey result may be changed after that date. CIMBS does not confirm nor certify the accuracy of such survey result.
Score Range: 90 - 100 80 - 89 70 - 79 Below 70 or No Survey Result
Description: Excellent Very Good Good N/A
United Arab Emirates: The distributor of this report has not been approved or licensed by the UAE Central Bank or any other relevant licensing authorities or governmental agencies in the United Arab Emirates. This report is strictly private and confidential and has not been reviewed by, deposited or registered with UAE Central Bank or any other licensing authority or governmental agencies in the United Arab Emirates. This report is being issued outside the United Arab Emirates to a limited number of institutional investors and must not be provided to any person other than the original recipient and may not be reproduced or used for any other purpose. Further, the information contained in this report is not intended to lead to the sale of investments under any subscription agreement or the conclusion of any other contract of whatsoever nature within the territory of the United Arab Emirates.
United Kingdom: In the United Kingdom and European Economic Area, this report is being disseminated by CIMB Securities (UK) Limited (“CIMB UK”). CIMB UK is authorized and regulated by the Financial Conduct Authority and its registered office is at 27 Knightsbridge, London,
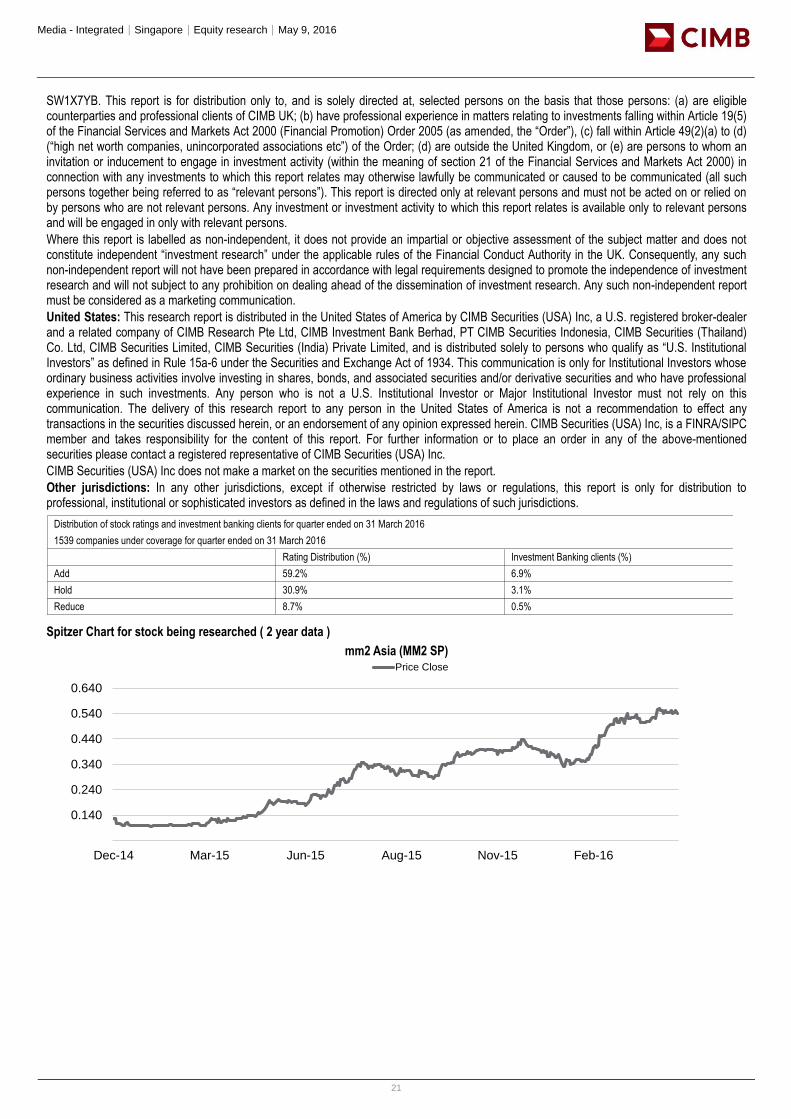
Media - Integrated│Singapore│Equity research│May 9, 2016
21
SW1X7YB. This report is for distribution only to, and is solely directed at, selected persons on the basis that those persons: (a) are eligible counterparties and professional clients of CIMB UK; (b) have professional experience in matters relating to investments falling within Article 19(5) of the Financial Services and Markets Act 2000 (Financial Promotion) Order 2005 (as amended, the “Order”), (c) fall within Article 49(2)(a) to (d) (“high net worth companies, unincorporated associations etc”) of the Order; (d) are outside the United Kingdom, or (e) are persons to whom an invitation or inducement to engage in investment activity (within the meaning of section 21 of the Financial Services and Markets Act 2000) in connection with any investments to which this report relates may otherwise lawfully be communicated or caused to be communicated (all such persons together being referred to as “relevant persons”). This report is directed only at relevant persons and must not be acted on or relied on by persons who are not relevant persons. Any investment or investment activity to which this report relates is available only to relevant persons and will be engaged in only with relevant persons.
Where this report is labelled as non-independent, it does not provide an impartial or objective assessment of the subject matter and does not constitute independent “investment research” under the applicable rules of the Financial Conduct Authority in the UK. Consequently, any such non-independent report will not have been prepared in accordance with legal requirements designed to promote the independence of investment research and will not subject to any prohibition on dealing ahead of the dissemination of investment research. Any such non-independent report must be considered as a marketing communication.
United States: This research report is distributed in the United States of America by CIMB Securities (USA) Inc, a U.S. registered broker-dealer and a related company of CIMB Research Pte Ltd, CIMB Investment Bank Berhad, PT CIMB Securities Indonesia, CIMB Securities (Thailand) Co. Ltd, CIMB Securities Limited, CIMB Securities (India) Private Limited, and is distributed solely to persons who qualify as “U.S. Institutional Investors” as defined in Rule 15a-6 under the Securities and Exchange Act of 1934. This communication is only for Institutional Investors whose ordinary business activities involve investing in shares, bonds, and associated securities and/or derivative securities and who have professional experience in such investments. Any person who is not a U.S. Institutional Investor or Major Institutional Investor must not rely on this communication. The delivery of this research report to any person in the United States of America is not a recommendation to effect any transactions in the securities discussed herein, or an endorsement of any opinion expressed herein. CIMB Securities (USA) Inc, is a FINRA/SIPC member and takes responsibility for the content of this report. For further information or to place an order in any of the above-mentioned securities please contact a registered representative of CIMB Securities (USA) Inc.
CIMB Securities (USA) Inc does not make a market on the securities mentioned in the report.
Other jurisdictions: In any other jurisdictions, except if otherwise restricted by laws or regulations, this report is only for distribution to professional, institutional or sophisticated investors as defined in the laws and regulations of such jurisdictions.
Spitzer Chart for stock being researched ( 2 year data )
mm2 Asia (MM2 SP)
Rating Distribution (%) Investment Banking clients (%)
Add 59.2% 6.9%
Hold 30.9% 3.1%
Reduce 8.7% 0.5%
Distribution of stock ratings and investment banking clients for quarter ended on 31 March 2016
1539 companies under coverage for quarter ended on 31 March 2016
0.040
0.140
0.240
0.340
0.440
0.540
0.640
Dec-14 Mar-15 Jun-15 Aug-15 Nov-15 Feb-16
Price Close
Media - Integrated│Singapore│Equity research│May 9, 2016
22
Corporate Governance Report of Thai Listed Companies (CGR). CG Rating by the Thai Institute of Directors Association (Thai IOD) in 2015, Anti-Corruption Progress Indicator 2015.
AAV – Very Good, 3B, ADVANC – Excellent, 3A, AEONTS – Good, 1, AMATA – Very Good, 2, ANAN – Very Good, 3A, AOT – Very Good, 2, AP - Good, 3A, ASK – Very Good, 3B, ASP – Very Good, 4, BANPU – Very Good, 4, BAY – Very Good, 4, BBL – Very Good, 4, BCH – not available, no progress, BCP - Excellent, 5, BDMS – Very Good, 3B, BEAUTY – Good, 2, BEC - Good, 3B, BECL – Very Good, 3B, BH - Good, 2, BIGC - Excellent, 3A, BJC – Good, 1, BLA – Very Good, 4, BMCL - Very Good, 1, BTS - Excellent, 3A, CBG – Good, 1, CCET – not available, 1, CENTEL – Very Good, 3A, CHG – Good, 3B, CK – Excellent, 3B, COL – Very Good, 3A, CPALL – Good, 3A, CPF – Very Good, 3A, CPN - Excellent, 5, DELTA - Very Good, 3A, DEMCO – Very Good, 3A, DTAC – Excellent, 3A, EA – not available, 3A, ECL – Good, 4, EGCO - Excellent, 4, EPG – not available, 3B, GFPT - Very Good, 3A, GLOBAL – Very Good, 2, GLOW - Good, 3A, GRAMMY - Excellent, 3B, GUNKUL – Very Good, 1, HANA - Excellent, 4, HEMRAJ – Very Good, 2, HMPRO - Excellent, 3A, ICHI – Very Good, 3A, INTUCH - Excellent, 4, ITD – Good, 1, IVL - Excellent, 4, JAS – not available, 3A, JASIF – not available, no progress, JUBILE – Good, 3A, KAMART – not available, no progress, KBANK - Excellent, 4, KCE - Excellent, 4, KGI – Good, 4, KKP – Excellent, 4, KSL – Very Good, 2, KTB - Excellent, 4, KTC – Very Good, 3A, LH - Very Good, 3B, LPN – Excellent, 3A, M - Good, 2, MAJOR - Good, 1, MAKRO – Good, 3A, MBKET – Good, 2, MC – Very Good, 3A, MCOT – Excellent, 3A, MEGA – Very Good, 2, MINT - Excellent, 3A, MTLS – Good, 2, NYT – Good, no progress, OISHI – Very Good, 3B, PLANB – Good, 3B, PS – Excellent, 3A, PSL - Excellent, 4, PTT - Excellent, 5, PTTEP - Excellent, 4, PTTGC - Excellent, 5, QH – Very Good, 2, RATCH – Excellent, 3A, ROBINS – Excellent, 3A, RS – Very Good, 1, SAMART - Excellent, 3B, SAPPE - Good, 3B, SAT – Excellent, 5, SAWAD – Good, 1, SC – Excellent, 3B, SCB - Excellent, 4, SCBLIF – not available, no progress, SCC – Excellent, 5, SCN – Good, 1, SCCC - Good, 3A, SIM - Excellent, 3B, SIRI - Good, 1, SPALI - Excellent, 3A, SPRC – not available, no progress, STA – Very Good, 1, STEC – Very Good, 3B, SVI – Very Good, 3A, TASCO – Very Good, 3A, TCAP – Very Good, 4, THAI – Very Good, 3A, THANI – Very Good, 5, THCOM – Excellent, 4, THRE – Very Good, 3A, THREL – Very Good, 3A, TICON – Very Good, 3A, TISCO - Excellent, 4, TK – Very Good, 3B, TMB - Excellent, 4, TPCH – Good, 3B, TOP - Excellent, 5, TRUE – Very Good, 2, TTW – Very Good, 2, TU – Very Good, 3A, VGI – Excellent, 3A, WHA – Good, 3A, WORK – not available, no progress.
Comprises level 1 to 5 as follows:
Level 1: Committed
Level 2: Declared
Level 3: Established (3A: Established by Declaration of Intent, 3B: Established by Internal Commitment and Policy)
Level 4: Certified
Level 5: Extended.
CIMB Recommendation Framework
Stock Ratings Definition:
Add The stock’s total return is expected to exceed 10% over the next 12 months.
Hold The stock’s total return is expected to be between 0% and positive 10% over the next 12 months.
Reduce The stock’s total return is expected to fall below 0% or more over the next 12 months.
The total expected return of a stock is defined as the sum of the: (i) percentage difference between the target price and the current price and (ii) the forward net dividend yields of the stock. Stock price targets have an investment horizon of 12 months.
Sector Ratings Definition:
Overweight An Overweight rating means stocks in the sector have, on a market cap-weighted basis, a positive absolute recommendation.
Neutral A Neutral rating means stocks in the sector have, on a market cap-weighted basis, a neutral absolute recommendation.
Underweight An Underweight rating means stocks in the sector have, on a market cap-weighted basis, a negative absolute recommendation.
Country Ratings Definition:
Overweight An Overweight rating means investors should be positioned with an above-market weight in this country relative to benchmark.
Neutral A Neutral rating means investors should be positioned with a neutral weight in this country relative to benchmark.
Underweight An Underweight rating means investors should be positioned with a below-market weight in this country relative to benchmark.