
Gem-A Conference 2016 - The Journal of
96
Volume 35 / No. 3 / 2016 The Gemmological Association of Great Britain The Journal of G emmology
-
Upload
khangminh22 -
Category
Documents
-
view
4 -
download
0
Transcript of Gem-A Conference 2016 - The Journal of
Volume 35 / No. 3 / 2016
The Gemmological Association of Great Britain
The Journal ofGemmology
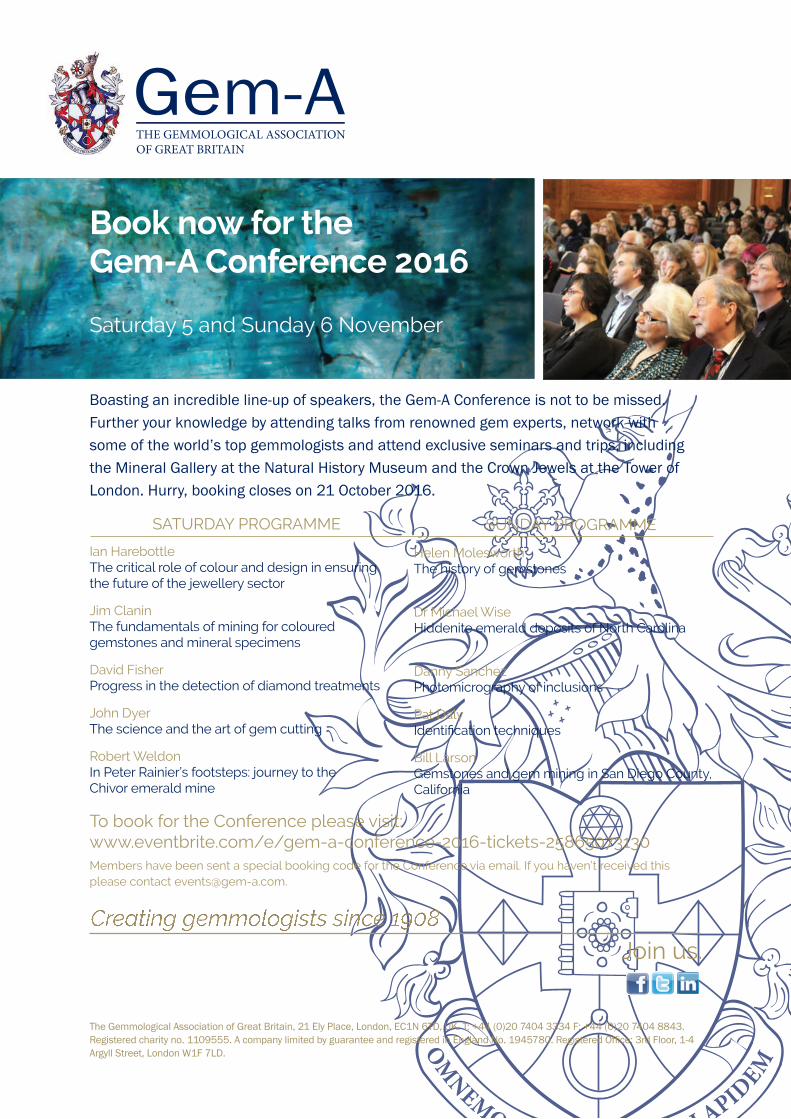
Boasting an incredible line-up of speakers, the Gem-A Conference is not to be missed. Further your knowledge by attending talks from renowned gem experts, network with some of the world’s top gemmologists and attend exclusive seminars and trips, including the Mineral Gallery at the Natural History Museum and the Crown Jewels at the Tower of London. Hurry, booking closes on 21 October 2016.
The Gemmological Association of Great Britain, 21 Ely Place, London, EC1N 6TD, UK. T: +44 (0)20 7404 3334 F: +44 (0)20 7404 8843. Registered charity no. 1109555. A company limited by guarantee and registered in England No. 1945780. Registered Office: 3rd Floor, 1-4 Argyll Street, London W1F 7LD.
Join us.
To book for the Conference please visit: www.eventbrite.com/e/gem-a-conference-2016-tickets-25865073130Members have been sent a special booking code for the Conference via email. If you haven’t received this please contact [email protected].
Saturday 5 and Sunday 6 November
Book now for the Gem-A Conference 2016
Ian HarebottleThe critical role of colour and design in ensuring the future of the jewellery sector
Jim ClaninThe fundamentals of mining for coloured gemstones and mineral specimens
David FisherProgress in the detection of diamond treatments
John Dyer The science and the art of gem cutting
Robert WeldonIn Peter Rainier’s footsteps: journey to the Chivor emerald mine
Helen MolesworthThe history of gemstones
Dr Michael WiseHiddenite emerald deposits of North Carolina
Danny SanchezPhotomicrography of inclusions
Pat DalyIdentification techniques
Bill Larson Gemstones and gem mining in San Diego County, California
SATURDAY PROGRAMME SUNDAY PROGRAMME
Conference Ad_09-2016.indd 1 20/09/2016 11:03:29
Contents
iISSN: 1355-4565, http://dx.doi.org/10.15506/JoG.2016.35.3
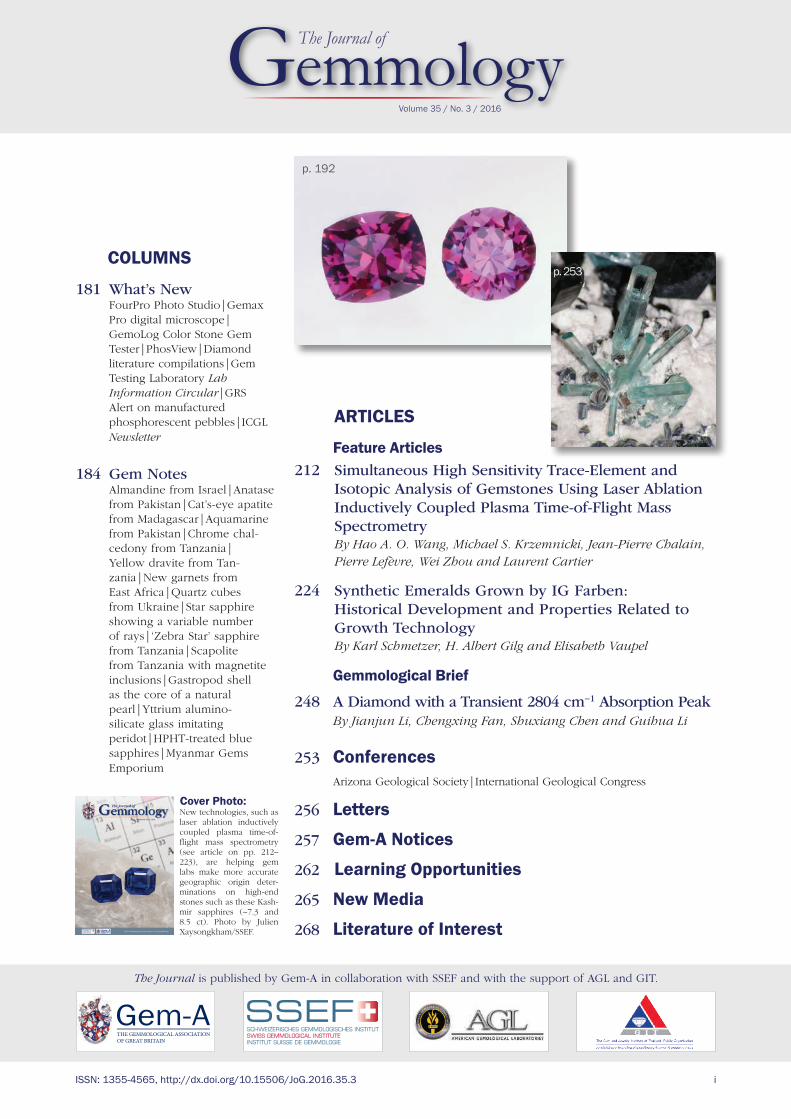
ARTICLES
Feature Articles212 Simultaneous High Sensitivity Trace-Element and
Isotopic Analysis of Gemstones Using Laser Ablation Inductively Coupled Plasma Time-of-Flight Mass Spectrometry By Hao A. O. Wang, Michael S. Krzemnicki, Jean-Pierre Chalain, Pierre Lefèvre, Wei Zhou and Laurent Cartier
224 Synthetic Emeralds Grown by IG Farben: Historical Development and Properties Related to Growth Technology By Karl Schmetzer, H. Albert Gilg and Elisabeth Vaupel
Gemmological Brief
248 A Diamond with a Transient 2804 cm−1 Absorption Peak By Jianjun Li, Chengxing Fan, Shuxiang Chen and Guihua Li
253 Conferences Arizona Geological Society|International Geological Congress
256 Letters
257 Gem-A Notices
262 Learning Opportunities
265 New Media
268 Literature of Interest
GemmologyThe Journal of
Volume 35 / No. 3 / 2016
The Journal is published by Gem-A in collaboration with SSEF and with the support of AGL and GIT.
COLUMNS
181 What’s New FourPro Photo Studio|Gemax Pro digital microscope| GemoLog Color Stone Gem Tester|PhosView|Diamond literature compilations|Gem Testing Laboratory Lab Information Circular|GRS Alert on manufactured phosphorescent pebbles|ICGL Newsletter
184 Gem Notes Almandine from Israel|Anatase from Pakistan|Cat’s-eye apatite from Madagascar|Aquamarine from Pakistan|Chrome chal-cedony from Tanzania| Yellow dravite from Tan-zania|New garnets from East Africa|Quartz cubes from Ukraine|Star sapphire showing a variable number of rays|‘Zebra Star’ sapphire from Tanzania|Scapolite from Tanzania with magnetite inclusions|Gastropod shell as the core of a natural pearl|Yttrium alumino-silicate glass imitating peridot|HPHT-treated blue sapphires|Myanmar Gems Emporium
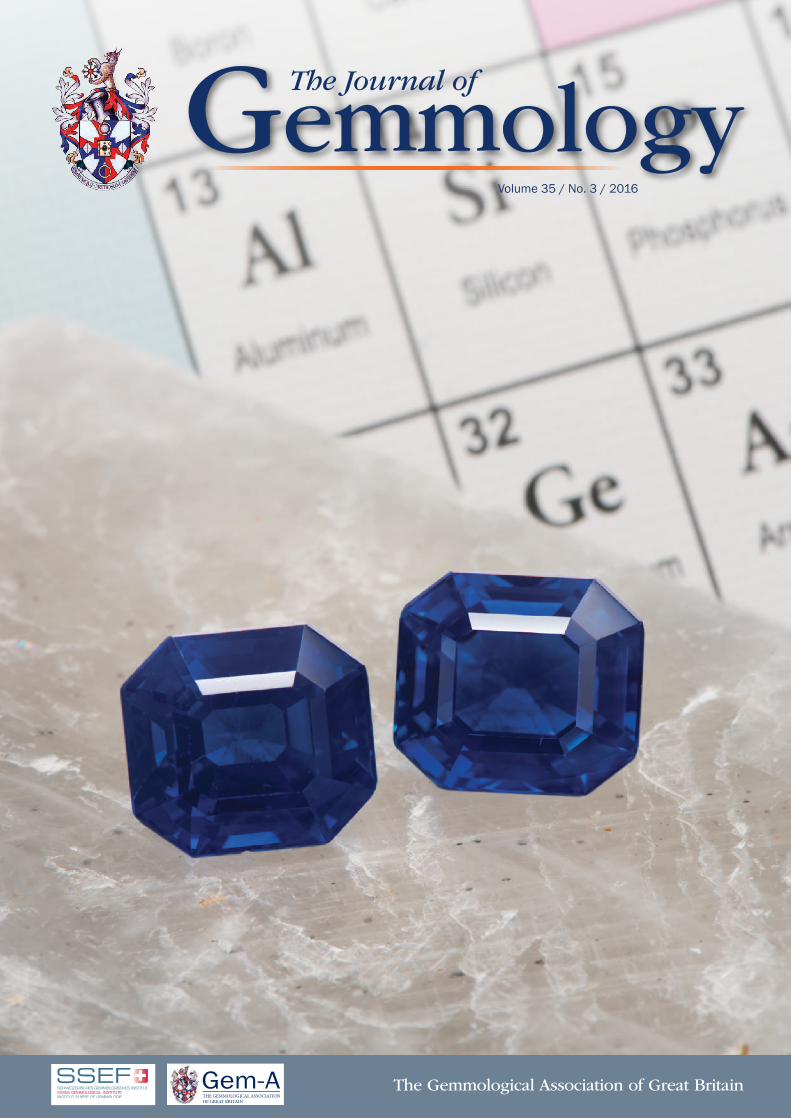
Cover Photo:
p. 253
p. 192
New technologies, such as laser ablation inductively coupled plasma time-of-flight mass spectrometry (see article on pp. 212–223), are helping gem labs make more accurate geographic origin deter-minations on high-end stones such as these Kash-mir sapphires (~7.3 and 8.5 ct). Photo by Julien Xaysongkham/SSEF.
ii The Journal of Gemmology, 35(3), 2016
21 Ely Place
London EC1N 6TD
UK
t: +44 (0)20 7404 3334
f: +44 (0)20 7404 8843 e: [email protected] w: www.gem-a.com
Registered Charity No. 1109555 Registered office: Palladium House, 1–4 Argyll Street, London W1F 7LD
President Maggie Campbell Pedersen
Vice Presidents David J. Callaghan, Alan T. Collins, Noel W. Deeks, E. Alan Jobbins, Andrew H. Rankin
Honorary Fellows Gaetano Cavalieri, Terrence S. Coldham, Emmanuel Fritsch
Honorary Diamond Member Martin Rapaport
Chief Executive Officer Alan D. Hart
Council Justine L. Carmody – Chair Kathryn L. Bonanno, Paul F. Greer, Kerry H. Gregory, J. Alan W. Hodgkinson, Nigel B. Israel, Jack M. Ogden, Richard M. Slater, Christopher P. Smith
Branch Chairmen Midlands – Georgina E. Kettle North East – Mark W. Houghton South East – Veronica Wetten South West – Richard M. Slater
Editor-in-Chief Brendan M. Laurs [email protected]
Production Editor Mary A. Burland [email protected]
Marketing Consultant Ya’akov Almor [email protected]
Content SubmissionThe Editor-in-Chief is glad to consider original articles, news items, conference/excursion reports, announcements and calendar entries on subjects of gemmological interest for publication in The Journal of Gemmology. A guide to the various sections and the preparation of manuscripts is given at www.gem-a.com/index.php/news-publications/publications/journal-of-gemmology/submissions, or contact the Production Editor.
SubscriptionsGem-A members receive The Journal as part of their membership package, full details of which are given at www.gem-a.com/membership. Laboratories, libraries, museums and similar institutions may become Direct Subscribers to The Journal.
AdvertisingEnquiries about advertising in The Journal should be directed to the Marketing Consultant. For more information, see www.gem-a.com/index.php/news-publications/publications/journal-of-gemmology/advertising.
Database CoverageThe Journal of Gemmology is covered by the following abstracting and indexing services:Australian Research Council academic journal list, British Library Document Supply Service, Chemical Abstracts (CA Plus), Copyright Clearance Center’s RightFind application, CrossRef, EBSCO (Academic Search International, Discovery Service and TOC Premier), Gale/Cengage Learning Academic OneFile, GeoRef, Mineralogical Abstracts, ProQuest, Scopus and the Thomson Reuters’ Emerging Sources Citation Index (in the Web of Science).
Copyright and Reprint PermissionFor full details of copyright and reprint permission contact the Editor.
The Journal of Gemmology is published quarterly by Gem-A, The Gemmological Association of Great Britain. Any opinions expressed in The Journal are understood to be the views of the contributors and not necessarily of the publisher.
Printed by DG3 (Europe) Ltd. © 2016 The Gemmological Association of Great Britain ISSN: 1355-4565
Associate EditorsEdward Boehm, RareSource, Chattanooga, Tennessee, USA; Alan T. Collins, King’s College London; John L. Emmett, Crystal Chemistry, Brush Prairie, Washington, USA; Emmanuel Fritsch, University of Nantes, France; Rui Galopim de Carvalho, Portugal Gemas, Lisbon, Portugal; Lee A. Groat, University of British Columbia, Vancouver, Canada; Thomas Hainschwang, GGTL Laboratories, Balzers, Liechtenstein; Henry A. Hänni, GemExpert, Basel, Switzerland; Jeff W. Harris, University of Glasgow; Alan D. Hart, Gem-A, London; Ulrich Henn, German Gemmological Association, Idar-Oberstein; Jaroslav Hyršl, Prague, Czech Republic; Brian Jackson, National Museums Scotland, Edinburgh; Stefanos Karampelas, GRS Gemresearch Swisslab, Meggen, Switzerland; Lore Kiefert, Gübelin Gem Lab Ltd., Lucerne, Switzerland; Hiroshi Kitawaki, Central Gem Laboratory, Tokyo, Japan; Michael S. Krzemnicki, Swiss Gemmological Institute SSEF, Basel; Shane F. McClure, Gemological Institute of America, Carlsbad, California; Jack M. Ogden, Striptwist Ltd., London; Federico Pezzotta, Natural History Museum of Milan, Italy; Jeffrey E. Post, Smithsonian Institution, Washington DC, USA; Andrew H. Rankin, Kingston University, Surrey; George R. Rossman, California Institute of Technology, Pasadena, USA; Karl Schmetzer, Petershausen, Germany; Dietmar Schwarz, AIGS Lab Co. Ltd., Bangkok, Thailand; Menahem Sevdermish, GemeWizard Ltd., Ramat Gan, Israel; Guanghai Shi, China University of Geosciences, Beijing; James E. Shigley, Gemological Institute of America, Carlsbad, California; Christopher P. Smith, American Gemological Laboratories Inc., New York, New York; Evelyne Stern, London; Elisabeth Strack, Gemmologisches Institut Hamburg, Germany; Tay Thye Sun, Far East Gemological Laboratory, Singapore; Pornsawat Wathanakul, Gem and Jewelry Institute of Thailand, Bangkok; Chris M. Welbourn, Reading, Berkshire; Joanna Whalley, Victoria and Albert Museum, London; Bert Willems, Leica Microsystems, Wetzlar, Germany; Bear Williams, Stone Group Laboratories LLC, Jefferson City, Missouri, USA; J.C. (Hanco) Zwaan, National Museum of Natural History ‘Naturalis’, Leiden, The Netherlands.
Cert no. TT-COC-002454 Understanding Gems™
GemmologyThe Journal of
THE GEMMOLOGICAL ASSOCIATION OF GREAT BRITAIN
Editorial Assistant Editor Emeritus Executive Editor Carol M. Stockton Roger R. Harding Alan D. Hart
What’s New 181
What’s New
INSTRUMENTS AND TECHNIQUES
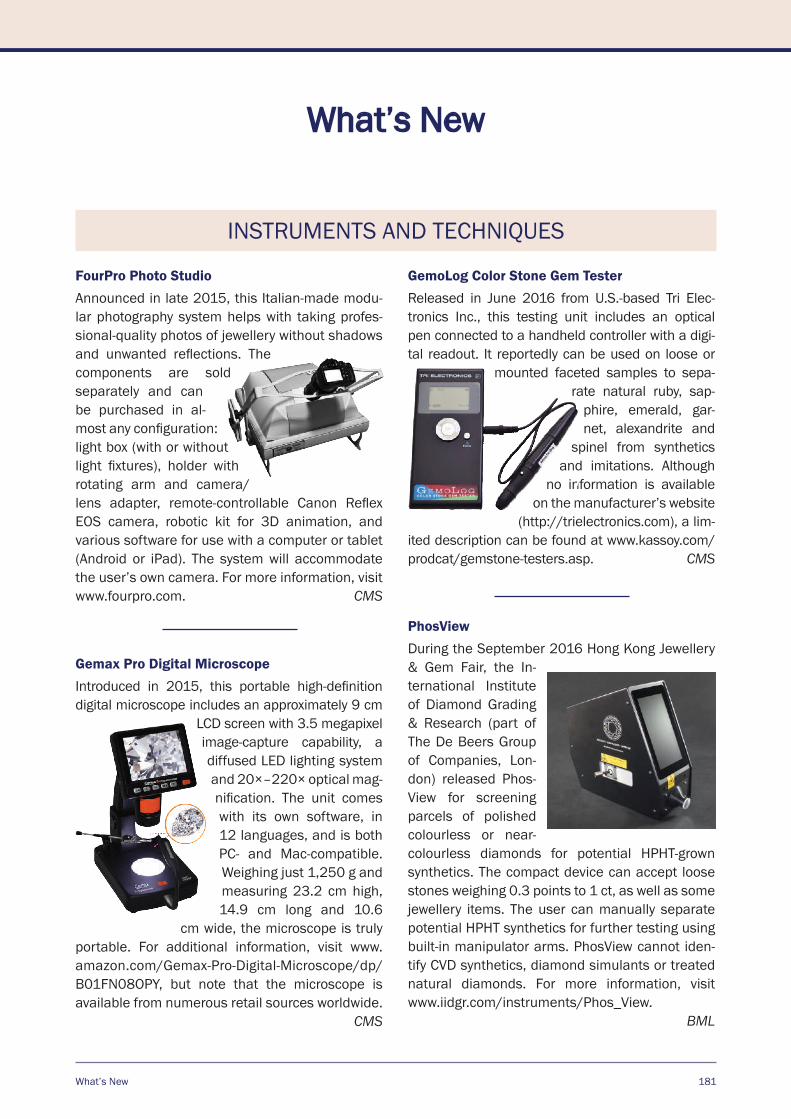
FourPro Photo StudioAnnounced in late 2015, this Italian-made modu-lar photography system helps with taking profes-sional-quality photos of jewellery without shadows and unwanted reflections. The components are sold separately and can be purchased in al-most any configuration: light box (with or without light fixtures), holder with rotating arm and camera/lens adapter, remote-controllable Canon Reflex EOS camera, robotic kit for 3D animation, and various software for use with a computer or tablet (Android or iPad). The system will accommodate the user’s own camera. For more information, visit www.fourpro.com. CMS
Gemax Pro Digital MicroscopeIntroduced in 2015, this portable high-definition digital microscope includes an approximately 9 cm
LCD screen with 3.5 megapixel image-capture capability, a diffused LED lighting system and 20×–220× optical mag-nification. The unit comes with its own software, in 12 languages, and is both PC- and Mac-compatible. Weighing just 1,250 g and measuring 23.2 cm high, 14.9 cm long and 10.6
cm wide, the microscope is truly portable. For additional information, visit www.amazon.com/Gemax-Pro-Digital-Microscope/dp/B01FN08OPY, but note that the microscope is available from numerous retail sources worldwide.
CMS
GemoLog Color Stone Gem TesterReleased in June 2016 from U.S.-based Tri Elec-tronics Inc., this testing unit includes an optical pen connected to a handheld controller with a digi-tal readout. It reportedly can be used on loose or
mounted faceted samples to sepa-rate natural ruby, sap-
phire, emerald, gar-net, alexandrite and
spinel from synthetics and imitations. Although
no information is available on the manufacturer’s website
(http://trielectronics.com), a lim-ited description can be found at www.kassoy.com/prodcat/gemstone-testers.asp. CMS
PhosView During the September 2016 Hong Kong Jewellery & Gem Fair, the In-ternational Institute of Diamond Grading & Research (part of The De Beers Group of Companies, Lon-don) released Phos-View for screening parcels of polished colourless or near-colourless diamonds for potential HPHT-grown synthetics. The compact device can accept loose stones weighing 0.3 points to 1 ct, as well as some jewellery items. The user can manually separate potential HPHT synthetics for further testing using built-in manipulator arms. PhosView cannot iden-tify CVD synthetics, diamond simulants or treated natural diamonds. For more information, visit www.iidgr.com/instruments/Phos_View.
BML
182 The Journal of Gemmology, 35(3), 2016
What’s New
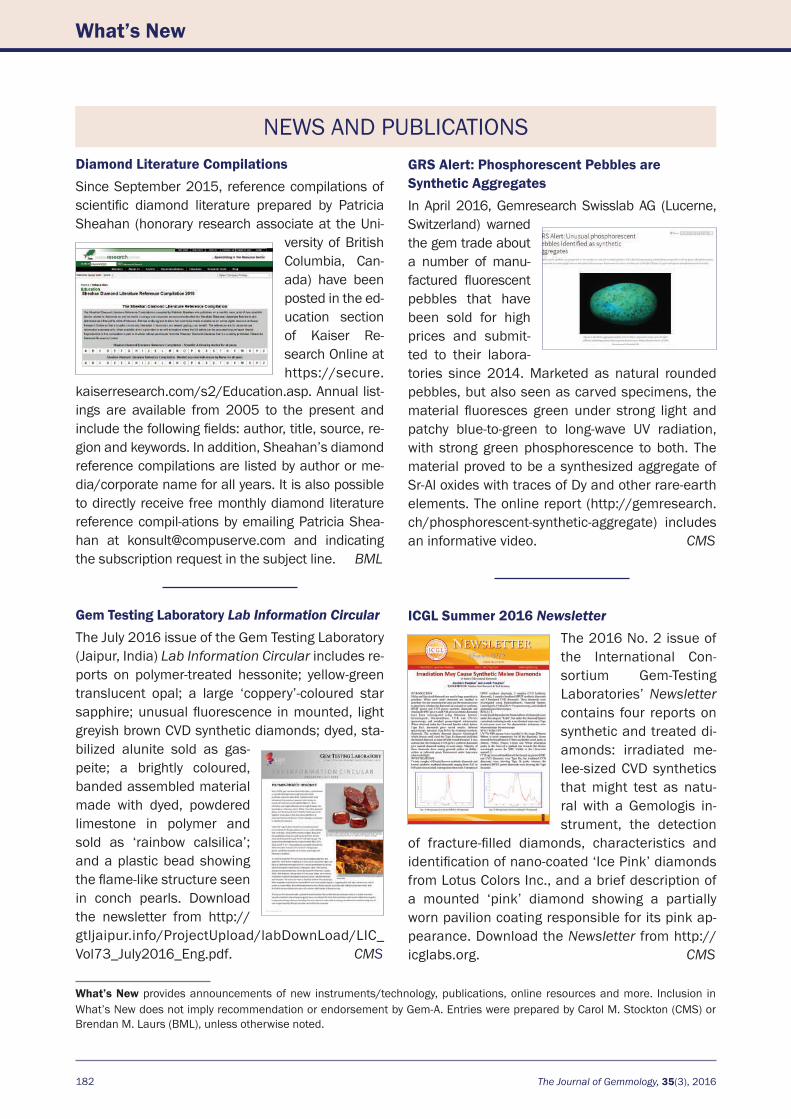
NEWS AND PUBLICATIONSDiamond Literature CompilationsSince September 2015, reference compilations of scientific diamond literature prepared by Patricia Sheahan (honorary research associate at the Uni-
versity of British Columbia, Can-ada) have been posted in the ed-ucation section of Kaiser Re-search Online at https://secure.
kaiserresearch.com/s2/Education.asp. Annual list-ings are available from 2005 to the present and include the following fields: author, title, source, re-gion and keywords. In addition, Sheahan’s diamond reference compilations are listed by author or me-dia/corporate name for all years. It is also possible to directly receive free monthly diamond literature reference compil-ations by emailing Patricia Shea-han at [email protected] and indicating the subscription request in the subject line. BML
Gem Testing Laboratory Lab Information CircularThe July 2016 issue of the Gem Testing Laboratory (Jaipur, India) Lab Information Circular includes re-ports on polymer-treated hessonite; yellow-green translucent opal; a large ‘coppery’-coloured star sapphire; unusual fluorescence in mounted, light greyish brown CVD synthetic diamonds; dyed, sta-bilized alunite sold as gas-peite; a brightly coloured, banded assembled material made with dyed, powdered limestone in polymer and sold as ‘rainbow calsilica’; and a plastic bead showing the flame-like structure seen in conch pearls. Download the newsletter from http://gtljaipur.info/ProjectUpload/labDownLoad/LIC_Vol73_July2016_Eng.pdf. CMS
What’s New provides announcements of new instruments/technology, publications, online resources and more. Inclusion in What’s New does not imply recommendation or endorsement by Gem-A. Entries were prepared by Carol M. Stockton (CMS) or Brendan M. Laurs (BML), unless otherwise noted.
GRS Alert: Phosphorescent Pebbles are Synthetic AggregatesIn April 2016, Gemresearch Swisslab AG (Lucerne, Switzerland) warned the gem trade about a number of manu-factured fluorescent pebbles that have been sold for high prices and submit-ted to their labora-tories since 2014. Marketed as natural rounded pebbles, but also seen as carved specimens, the material fluoresces green under strong light and patchy blue-to-green to long-wave UV radiation, with strong green phosphorescence to both. The material proved to be a synthesized aggregate of Sr-Al oxides with traces of Dy and other rare-earth elements. The online report (http://gemresearch.ch/phosphorescent-synthetic-aggregate) includes an informative video. CMS
ICGL Summer 2016 NewsletterThe 2016 No. 2 issue of the International Con-sortium Gem-Testing Laboratories’ Newsletter contains four reports on synthetic and treated di-amonds: irradiated me-lee-sized CVD synthetics that might test as natu-ral with a Gemologis in-strument, the detection
of fracture-filled diamonds, characteristics and identification of nano-coated ‘Ice Pink’ diamonds from Lotus Colors Inc., and a brief description of a mounted ‘pink’ diamond showing a partially worn pavilion coating responsible for its pink ap-pearance. Download the Newsletter from http://icglabs.org. CMS
184 The Journal of Gemmology, 35(3), 2016
Gem Notes
COLOURED STONES
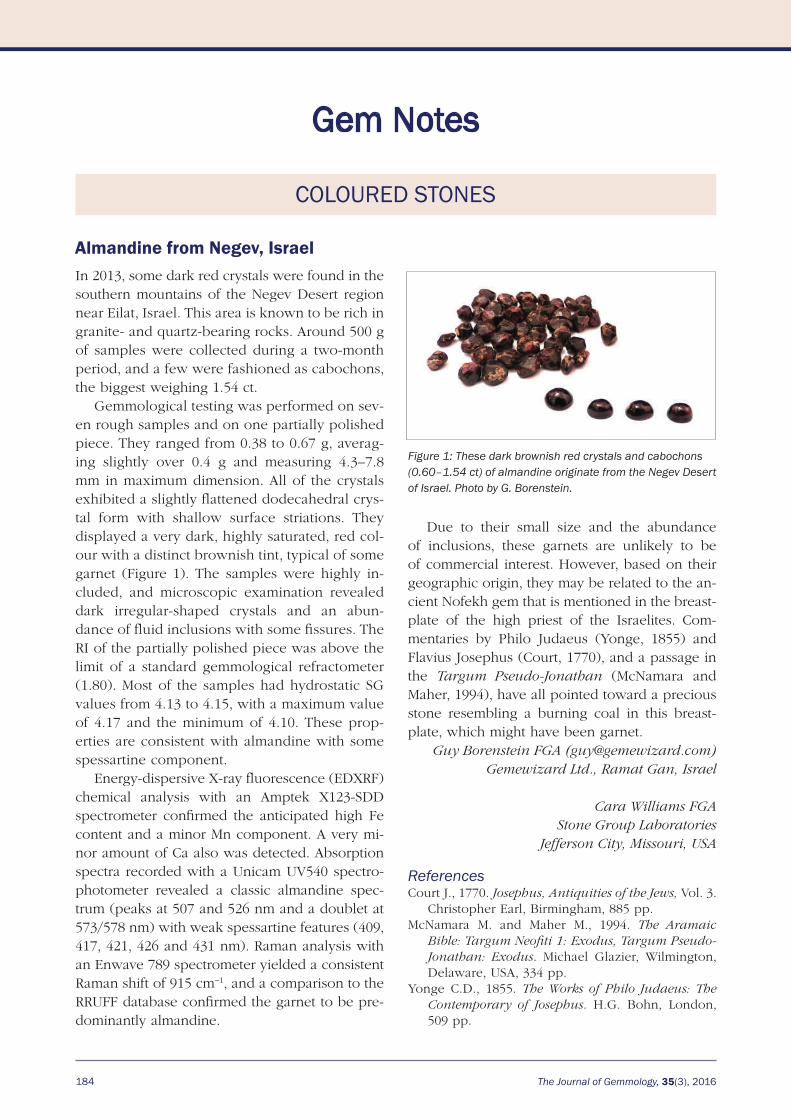
Almandine from Negev, IsraelIn 2013, some dark red crystals were found in the southern mountains of the Negev Desert region near Eilat, Israel. This area is known to be rich in granite- and quartz-bearing rocks. Around 500 g of samples were collected during a two-month period, and a few were fashioned as cabochons, the biggest weighing 1.54 ct.
Gemmological testing was performed on sev-en rough samples and on one partially polished piece. They ranged from 0.38 to 0.67 g, averag-ing slightly over 0.4 g and measuring 4.3–7.8 mm in maximum dimension. All of the crystals exhibited a slightly flattened dodecahedral crys-tal form with shallow surface striations. They displayed a very dark, highly saturated, red col-our with a distinct brownish tint, typical of some garnet (Figure 1). The samples were highly in-cluded, and microscopic examination revealed dark irregular-shaped crystals and an abun-dance of fluid inclusions with some fissures. The RI of the partially polished piece was above the limit of a standard gemmological refractometer (1.80). Most of the samples had hydrostatic SG values from 4.13 to 4.15, with a maximum value of 4.17 and the minimum of 4.10. These prop-erties are consistent with almandine with some spessartine component.
Energy-dispersive X-ray fluorescence (EDXRF) chemical analysis with an Amptek X123-SDD spectrometer confirmed the anticipated high Fe content and a minor Mn component. A very mi-nor amount of Ca also was detected. Absorption spectra recorded with a Unicam UV540 spectro-photometer revealed a classic almandine spec-trum (peaks at 507 and 526 nm and a doublet at 573/578 nm) with weak spessartine features (409, 417, 421, 426 and 431 nm). Raman analysis with an Enwave 789 spectrometer yielded a consistent Raman shift of 915 cm−1, and a comparison to the RRUFF database confirmed the garnet to be pre-dominantly almandine.
Due to their small size and the abundance of inclusions, these garnets are unlikely to be of commercial interest. However, based on their geographic origin, they may be related to the an-cient Nofekh gem that is mentioned in the breast-plate of the high priest of the Israelites. Com-mentaries by Philo Judaeus (Yonge, 1855) and Flavius Josephus (Court, 1770), and a passage in the Targum Pseudo-Jonathan (McNamara and Maher, 1994), have all pointed toward a precious stone resembling a burning coal in this breast-plate, which might have been garnet.
Guy Borenstein FGA ([email protected])Gemewizard Ltd., Ramat Gan, Israel
Cara Williams FGAStone Group Laboratories
Jefferson City, Missouri, USA
ReferencesCourt J., 1770. Josephus, Antiquities of the Jews, Vol. 3.
Christopher Earl, Birmingham, 885 pp.McNamara M. and Maher M., 1994. The Aramaic
Bible: Targum Neofiti 1: Exodus, Targum Pseudo-Jonathan: Exodus. Michael Glazier, Wilmington, Delaware, USA, 334 pp.
Yonge C.D., 1855. The Works of Philo Judaeus: The Contemporary of Josephus. H.G. Bohn, London, 509 pp.
Figure 1: These dark brownish red crystals and cabochons (0.60–1.54 ct) of almandine originate from the Negev Desert of Israel. Photo by G. Borenstein.
*
*
th
*
*
th
186 The Journal of Gemmology, 35(3), 2016
Gem Notes
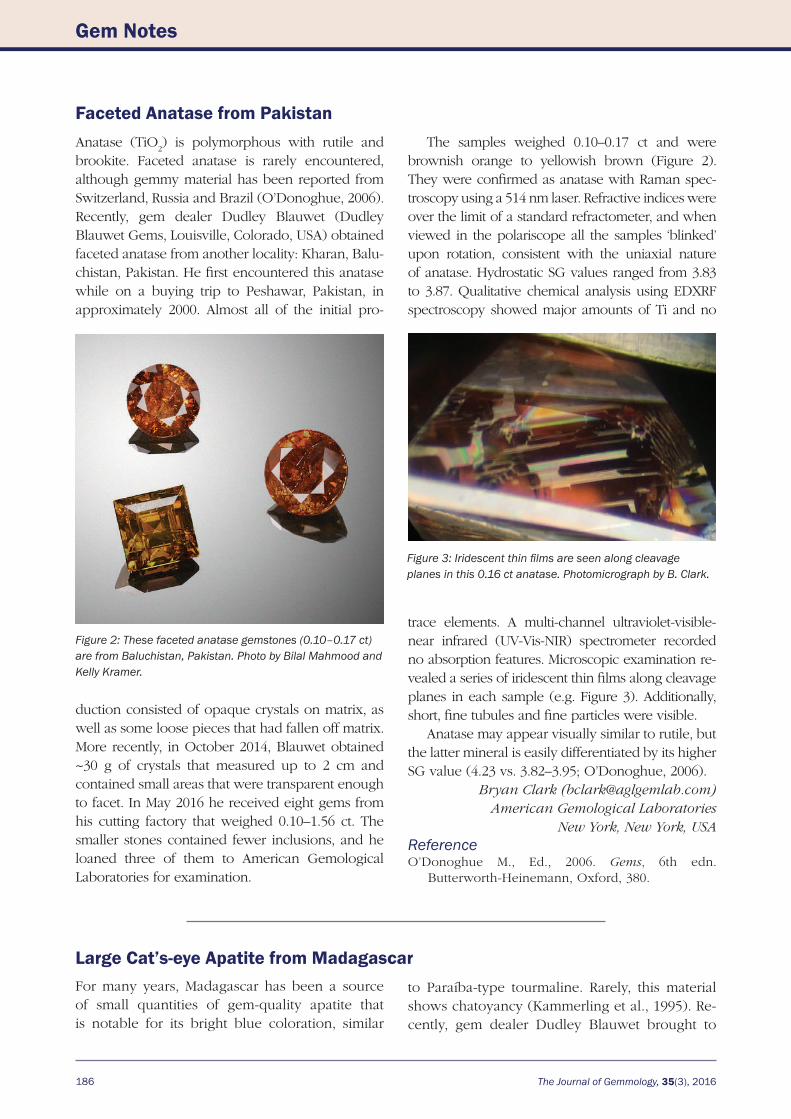
Anatase (TiO2) is polymorphous with rutile and
brookite. Faceted anatase is rarely encountered, although gemmy material has been reported from Switzerland, Russia and Brazil (O’Donoghue, 2006). Recently, gem dealer Dudley Blauwet (Dudley Blauwet Gems, Louisville, Colorado, USA) obtained faceted anatase from another locality: Kharan, Balu-chistan, Pakistan. He first encountered this anatase while on a buying trip to Peshawar, Pakistan, in approximately 2000. Almost all of the initial pro-
The samples weighed 0.10–0.17 ct and were brownish orange to yellowish brown (Figure 2). They were confirmed as anatase with Raman spec-troscopy using a 514 nm laser. Refractive indices were over the limit of a standard refractometer, and when viewed in the polariscope all the samples ‘blinked’ upon rotation, consistent with the uniaxial nature of anatase. Hydrostatic SG values ranged from 3.83 to 3.87. Qualitative chemical analysis using EDXRF spectroscopy showed major amounts of Ti and no
Faceted Anatase from Pakistan
Figure 3: Iridescent thin films are seen along cleavage planes in this 0.16 ct anatase. Photomicrograph by B. Clark.
Figure 2: These faceted anatase gemstones (0.10–0.17 ct) are from Baluchistan, Pakistan. Photo by Bilal Mahmood and Kelly Kramer.
duction consisted of opaque crystals on matrix, as well as some loose pieces that had fallen off matrix. More recently, in October 2014, Blauwet obtained ~30 g of crystals that measured up to 2 cm and contained small areas that were transparent enough to facet. In May 2016 he received eight gems from his cutting factory that weighed 0.10–1.56 ct. The smaller stones contained fewer inclusions, and he loaned three of them to American Gemological Laboratories for examination.
trace elements. A multi-channel ultraviolet-visible-near infrared (UV-Vis-NIR) spectrometer recorded no absorption features. Microscopic examination re-vealed a series of iridescent thin films along cleavage planes in each sample (e.g. Figure 3). Additionally, short, fine tubules and fine particles were visible.
Anatase may appear visually similar to rutile, but the latter mineral is easily differentiated by its higher SG value (4.23 vs. 3.82–3.95; O’Donoghue, 2006).
Bryan Clark ([email protected])American Gemological Laboratories
New York, New York, USAReferenceO’Donoghue M., Ed., 2006. Gems, 6th edn.
Butterworth-Heinemann, Oxford, 380.
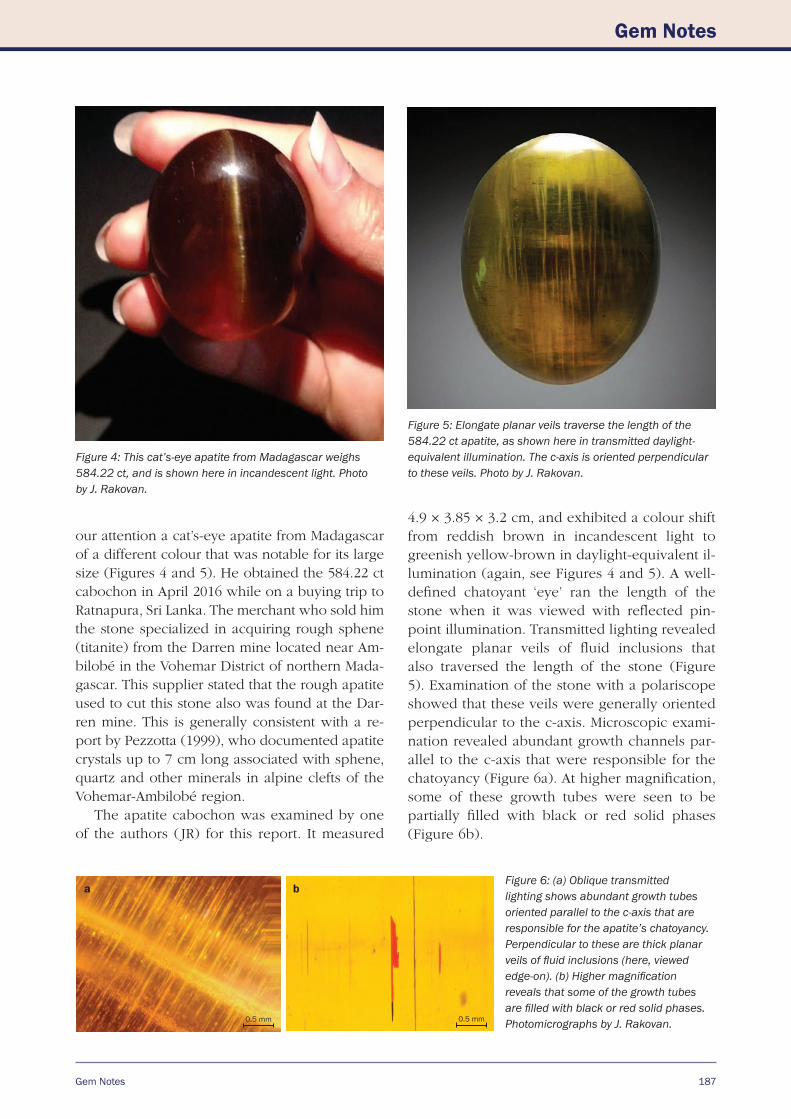
Large Cat’s-eye Apatite from MadagascarFor many years, Madagascar has been a source of small quantities of gem-quality apatite that is notable for its bright blue coloration, similar
to Paraíba-type tourmaline. Rarely, this material shows chatoyancy (Kammerling et al., 1995). Re-cently, gem dealer Dudley Blauwet brought to
Gem Notes
Gem Notes
187
our attention a cat’s-eye apatite from Madagascar of a different colour that was notable for its large size (Figures 4 and 5). He obtained the 584.22 ct cabochon in April 2016 while on a buying trip to Ratnapura, Sri Lanka. The merchant who sold him the stone specialized in acquiring rough sphene (titanite) from the Darren mine located near Am-bilobé in the Vohemar District of northern Mada-gascar. This supplier stated that the rough apatite used to cut this stone also was found at the Dar-ren mine. This is generally consistent with a re-port by Pezzotta (1999), who documented apatite crystals up to 7 cm long associated with sphene, quartz and other minerals in alpine clefts of the Vohemar-Ambilobé region.
The apatite cabochon was examined by one of the authors ( JR) for this report. It measured
4.9 × 3.85 × 3.2 cm, and exhibited a colour shift from reddish brown in incandescent light to greenish yellow-brown in daylight-equivalent il-lumination (again, see Figures 4 and 5). A well-defined chatoyant ‘eye’ ran the length of the stone when it was viewed with reflected pin-point illumination. Transmitted lighting revealed elongate planar veils of fluid inclusions that also traversed the length of the stone (Figure 5). Examination of the stone with a polariscope showed that these veils were generally oriented perpendicular to the c-axis. Microscopic exami-nation revealed abundant growth channels par-allel to the c-axis that were responsible for the chatoyancy (Figure 6a). At higher magnification, some of these growth tubes were seen to be partially filled with black or red solid phases (Figure 6b).
Figure 4: This cat’s-eye apatite from Madagascar weighs 584.22 ct, and is shown here in incandescent light. Photo by J. Rakovan.
Figure 5: Elongate planar veils traverse the length of the 584.22 ct apatite, as shown here in transmitted daylight-equivalent illumination. The c-axis is oriented perpendicular to these veils. Photo by J. Rakovan.
Figure 6: (a) Oblique transmitted lighting shows abundant growth tubes oriented parallel to the c-axis that are responsible for the apatite’s chatoyancy. Perpendicular to these are thick planar veils of fluid inclusions (here, viewed edge-on). (b) Higher magnification reveals that some of the growth tubes are filled with black or red solid phases. Photomicrographs by J. Rakovan.
a b
0.5 mm 0.5 mm
188 The Journal of Gemmology, 35(3), 2016
Gem Notes
Confocal Raman spectroscopy using a 785 nm laser with a Renishaw InVia Raman microscope confirmed that the host gem was fluorapatite, but the solid phases in the inclusions could not be identified due to a high fluorescence back-ground in the 500–200 cm−1 region and especially above 1000 cm−1. Confocal Raman analysis with a 633 nm laser also produced strong fluorescence. Based on the inclusions’ coloration and geologi-cal environment of formation, the red phase is probably hematite or lepidocrocite and the black material is likely a manganese oxide mineral.
The alpine clefts of northern Madagascar are known for producing large and fine specimens of
sphene and quartz, and these are now joined by chatoyant apatite.
Dr John Rakovan ([email protected])Miami University, Oxford, Ohio, USA
Brendan M. Laurs
ReferencesKammerling R.C., Koivula J.I., Johnson M.L. and
Fritsch E., 1995. Gem News: Cat’s-eye apatites from Madagascar. Gems & Gemology, 31(3), 205–206.
Pezzotta F., 1999. Madagascar—A Mineral and Gemstone Paradise. M.D. Jarnot, G.A. Neumeier, W.B. Simmons and G.A. Staebler, Eds., extraLapis English No. 1, Lapis International LLC. East Hampton, Connecticut, USA (see pp. 76–79).
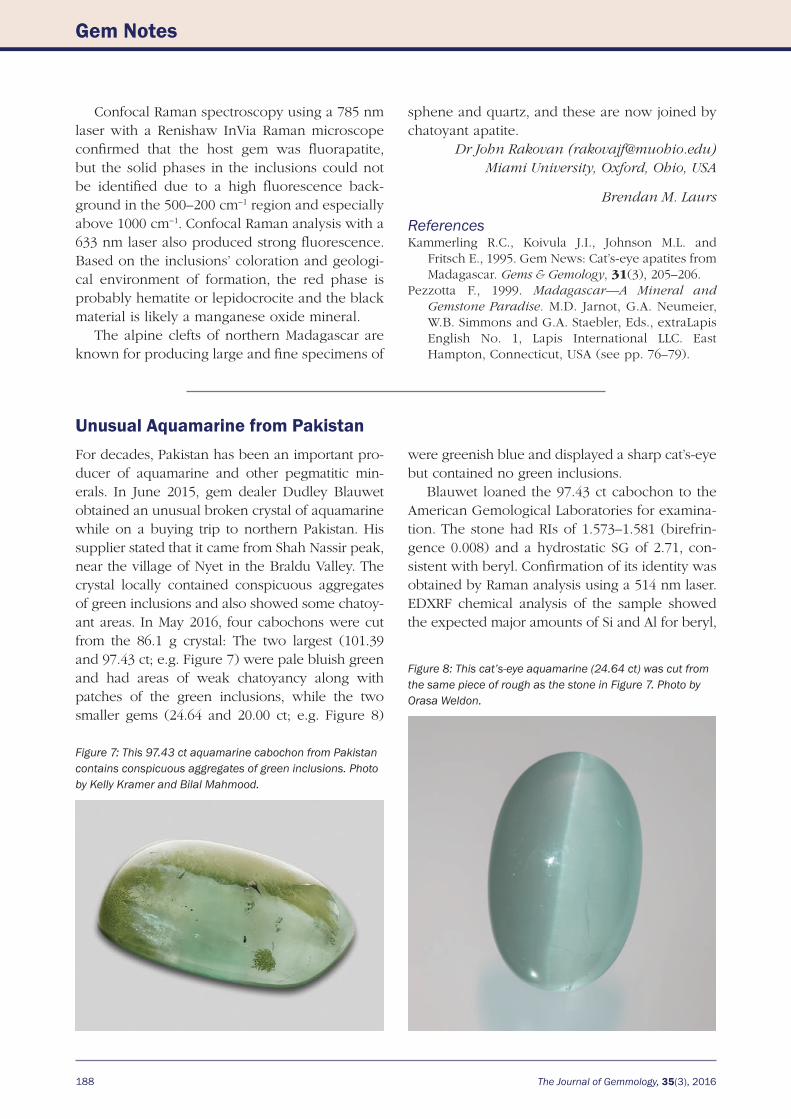
Unusual Aquamarine from PakistanFor decades, Pakistan has been an important pro-ducer of aquamarine and other pegmatitic min-erals. In June 2015, gem dealer Dudley Blauwet obtained an unusual broken crystal of aquamarine while on a buying trip to northern Pakistan. His supplier stated that it came from Shah Nassir peak, near the village of Nyet in the Braldu Valley. The crystal locally contained conspicuous aggregates of green inclusions and also showed some chatoy-ant areas. In May 2016, four cabochons were cut from the 86.1 g crystal: The two largest (101.39 and 97.43 ct; e.g. Figure 7) were pale bluish green and had areas of weak chatoyancy along with patches of the green inclusions, while the two smaller gems (24.64 and 20.00 ct; e.g. Figure 8)
were greenish blue and displayed a sharp cat’s-eye but contained no green inclusions.
Blauwet loaned the 97.43 ct cabochon to the American Gemological Laboratories for examina-tion. The stone had RIs of 1.573–1.581 (birefrin-gence 0.008) and a hydrostatic SG of 2.71, con-sistent with beryl. Confirmation of its identity was obtained by Raman analysis using a 514 nm laser. EDXRF chemical analysis of the sample showed the expected major amounts of Si and Al for beryl,
Figure 7: This 97.43 ct aquamarine cabochon from Pakistan contains conspicuous aggregates of green inclusions. Photo by Kelly Kramer and Bilal Mahmood.
Figure 8: This cat’s-eye aquamarine (24.64 ct) was cut from the same piece of rough as the stone in Figure 7. Photo by Orasa Weldon.
Gem Notes
Gem Notes
189
as well as traces of Fe, Na and Mn. UV-Vis-NIR spectra collected with a multi-channel spectrom-eter showed typical aquamarine absorption fea-tures at 370 and 427 nm.
The cabochon revealed an extremely faint ‘eye’ when viewed with a concentrated fibre-
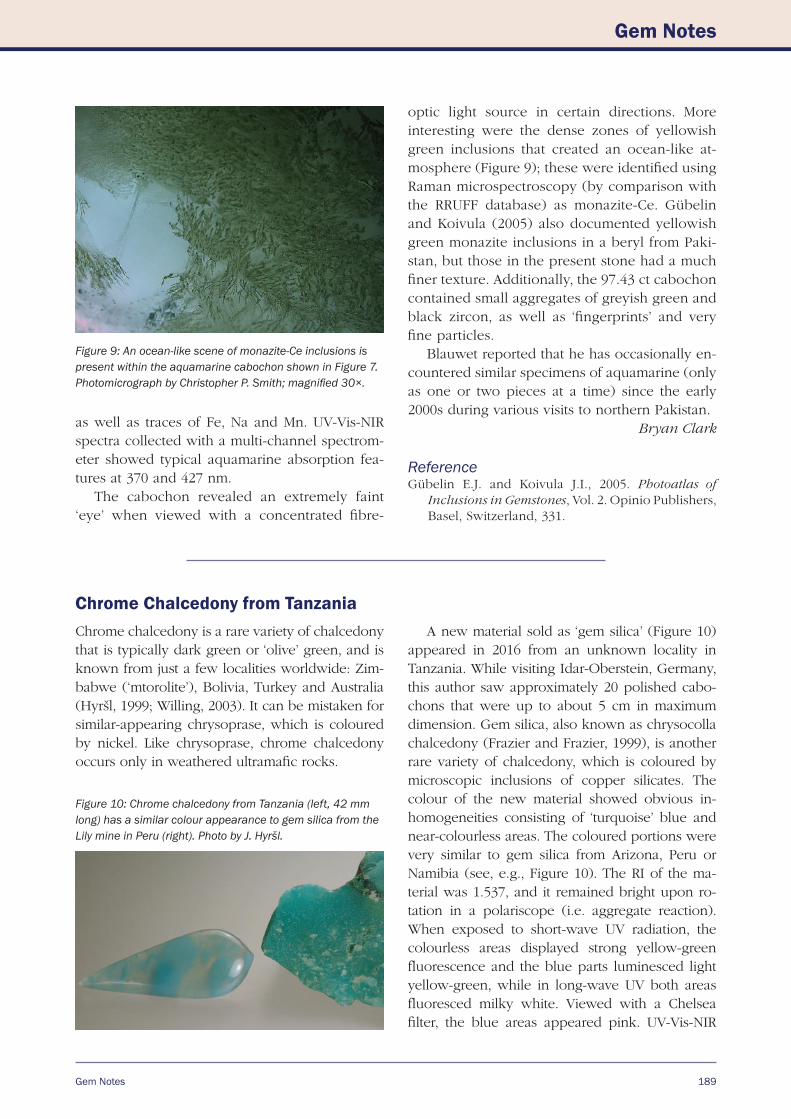
optic light source in certain directions. More interesting were the dense zones of yellowish green inclusions that created an ocean-like at-mosphere (Figure 9); these were identified using Raman microspectroscopy (by comparison with the RRUFF database) as monazite-Ce. Gübelin and Koivula (2005) also documented yellowish green monazite inclusions in a beryl from Paki-stan, but those in the present stone had a much finer texture. Additionally, the 97.43 ct cabochon contained small aggregates of greyish green and black zircon, as well as ‘fingerprints’ and very fine particles.
Blauwet reported that he has occasionally en-countered similar specimens of aquamarine (only as one or two pieces at a time) since the early 2000s during various visits to northern Pakistan.
Bryan Clark
ReferenceGübelin E.J. and Koivula J.I., 2005. Photoatlas of
Inclusions in Gemstones, Vol. 2. Opinio Publishers, Basel, Switzerland, 331.
Chrome Chalcedony from Tanzania
Figure 9: An ocean-like scene of monazite-Ce inclusions is present within the aquamarine cabochon shown in Figure 7. Photomicrograph by Christopher P. Smith; magnified 30×.
Chrome chalcedony is a rare variety of chalcedony that is typically dark green or ‘olive’ green, and is known from just a few localities worldwide: Zim-babwe (‘mtorolite’), Bolivia, Turkey and Australia (Hyršl, 1999; Willing, 2003). It can be mistaken for similar-appearing chrysoprase, which is coloured by nickel. Like chrysoprase, chrome chalcedony occurs only in weathered ultramafic rocks.
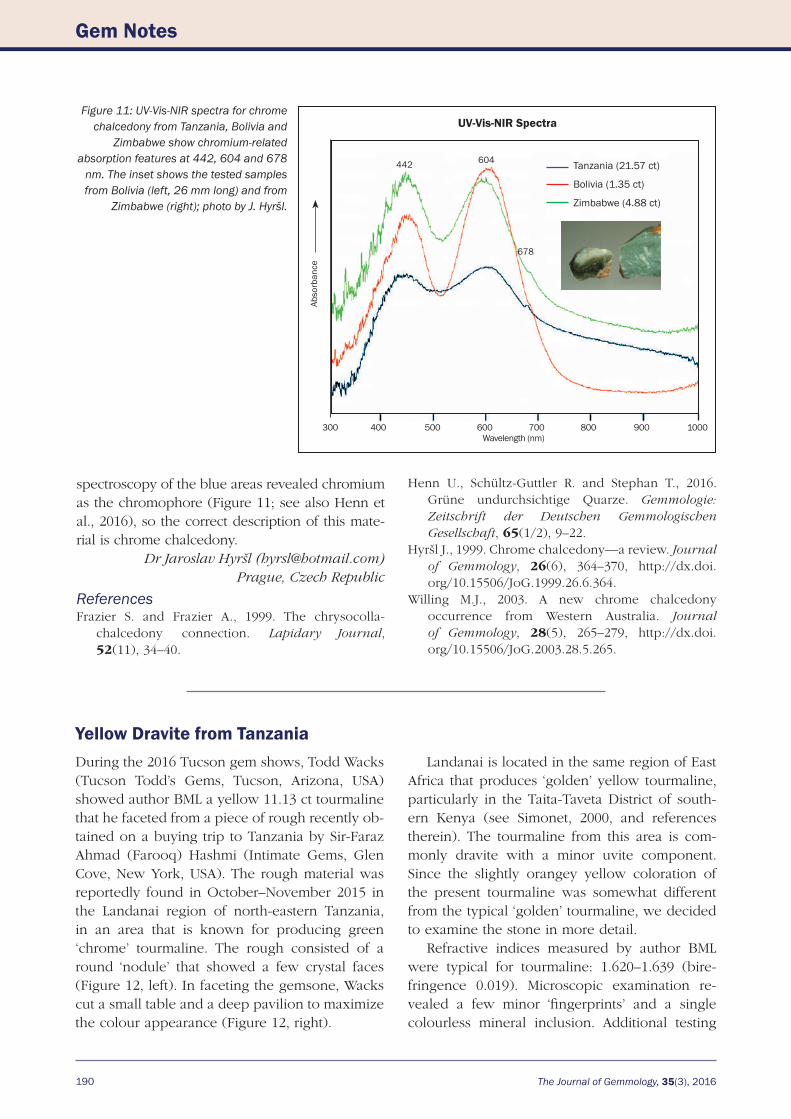
A new material sold as ‘gem silica’ (Figure 10) appeared in 2016 from an unknown locality in Tanzania. While visiting Idar-Oberstein, Germany, this author saw approximately 20 polished cabo-chons that were up to about 5 cm in maximum dimension. Gem silica, also known as chrysocolla chalcedony (Frazier and Frazier, 1999), is another rare variety of chalcedony, which is coloured by microscopic inclusions of copper silicates. The colour of the new material showed obvious in-homogeneities consisting of ‘turquoise’ blue and near-colourless areas. The coloured portions were very similar to gem silica from Arizona, Peru or Namibia (see, e.g., Figure 10). The RI of the ma-terial was 1.537, and it remained bright upon ro-tation in a polariscope (i.e. aggregate reaction). When exposed to short-wave UV radiation, the colourless areas displayed strong yellow-green fluorescence and the blue parts luminesced light yellow-green, while in long-wave UV both areas fluoresced milky white. Viewed with a Chelsea filter, the blue areas appeared pink. UV-Vis-NIR
Figure 10: Chrome chalcedony from Tanzania (left, 42 mm long) has a similar colour appearance to gem silica from the Lily mine in Peru (right). Photo by J. Hyršl.
190 The Journal of Gemmology, 35(3), 2016
Gem Notes
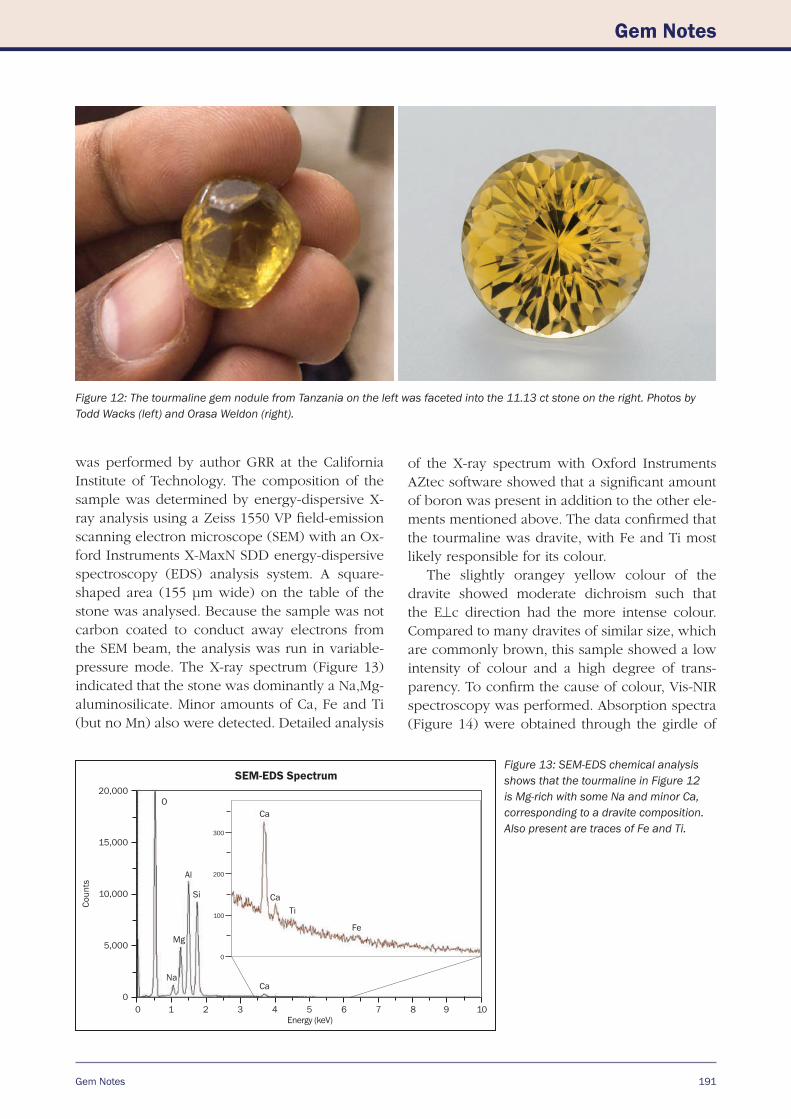
spectroscopy of the blue areas revealed chromium as the chromophore (Figure 11; see also Henn et al., 2016), so the correct description of this mate-rial is chrome chalcedony.
Dr Jaroslav Hyršl ([email protected])Prague, Czech Republic
ReferencesFrazier S. and Frazier A., 1999. The chrysocolla-
chalcedony connection. Lapidary Journal, 52(11), 34–40.
Yellow Dravite from Tanzania
Figure 11: UV-Vis-NIR spectra for chrome chalcedony from Tanzania, Bolivia and
Zimbabwe show chromium-related absorption features at 442, 604 and 678
nm. The inset shows the tested samples from Bolivia (left, 26 mm long) and from
Zimbabwe (right); photo by J. Hyršl.
Henn U., Schültz-Guttler R. and Stephan T., 2016. Grüne undurchsichtige Quarze. Gemmologie: Zeitschrift der Deutschen Gemmologischen Gesellschaft, 65(1/2), 9–22.
Hyršl J., 1999. Chrome chalcedony—a review. Journal of Gemmology, 26(6), 364–370, http://dx.doi.org/10.15506/JoG.1999.26.6.364.
Willing M.J., 2003. A new chrome chalcedony occurrence from Western Australia. Journal of Gemmology, 28(5), 265–279, http://dx.doi.org/10.15506/JoG.2003.28.5.265.
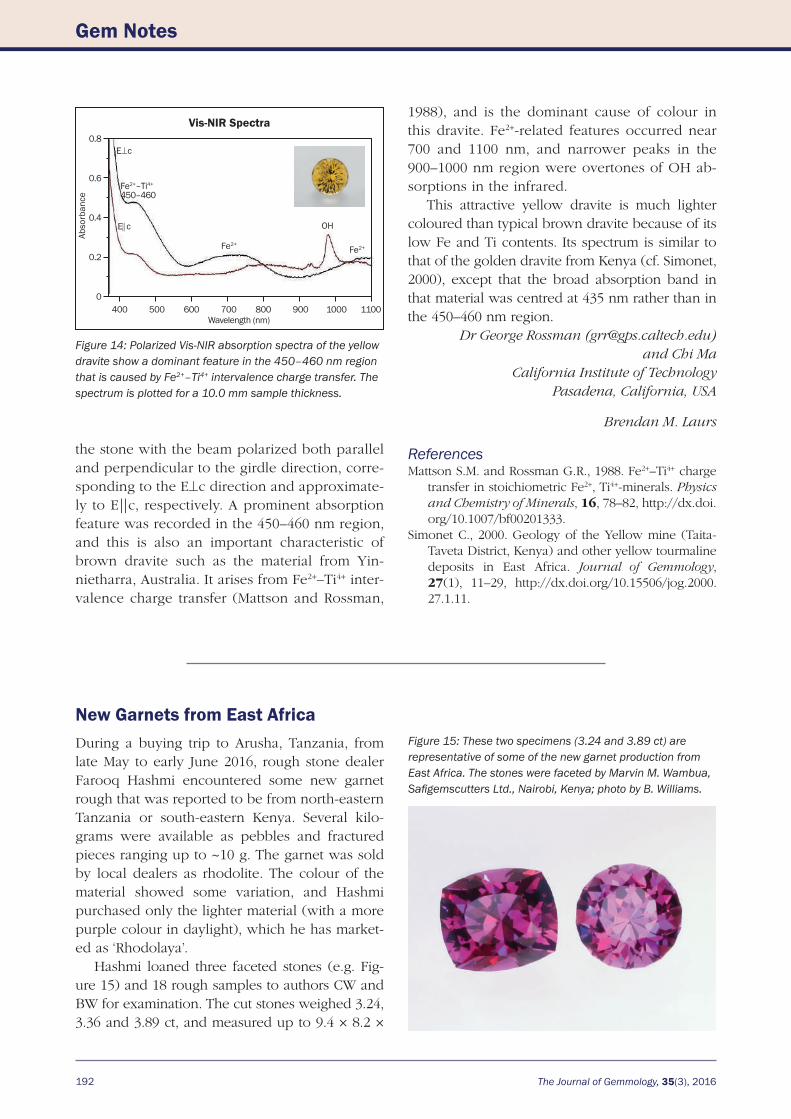
During the 2016 Tucson gem shows, Todd Wacks (Tucson Todd’s Gems, Tucson, Arizona, USA) showed author BML a yellow 11.13 ct tourmaline that he faceted from a piece of rough recently ob-tained on a buying trip to Tanzania by Sir-Faraz Ahmad (Farooq) Hashmi (Intimate Gems, Glen Cove, New York, USA). The rough material was reportedly found in October–November 2015 in the Landanai region of north-eastern Tanzania, in an area that is known for producing green ‘chrome’ tourmaline. The rough consisted of a round ‘nodule’ that showed a few crystal faces (Figure 12, left). In faceting the gemsone, Wacks cut a small table and a deep pavilion to maximize the colour appearance (Figure 12, right).
Landanai is located in the same region of East Africa that produces ‘golden’ yellow tourmaline, particularly in the Taita-Taveta District of south-ern Kenya (see Simonet, 2000, and references therein). The tourmaline from this area is com-monly dravite with a minor uvite component. Since the slightly orangey yellow coloration of the present tourmaline was somewhat different from the typical ‘golden’ tourmaline, we decided to examine the stone in more detail.
Refractive indices measured by author BML were typical for tourmaline: 1.620–1.639 (bire-fringence 0.019). Microscopic examination re-vealed a few minor ‘fingerprints’ and a single colourless mineral inclusion. Additional testing
300 400 500 600 700 800 900 1000Wavelength (nm)
UV-Vis-NIR Spectra
Abso
rban
ce
Tanzania (21.57 ct)
Bolivia (1.35 ct)
Zimbabwe (4.88 ct)
604442
678
Gem Notes
Gem Notes
191
was performed by author GRR at the California Institute of Technology. The composition of the sample was determined by energy-dispersive X-ray analysis using a Zeiss 1550 VP field-emission scanning electron microscope (SEM) with an Ox-ford Instruments X-MaxN SDD energy-dispersive spectroscopy (EDS) analysis system. A square-shaped area (155 µm wide) on the table of the stone was analysed. Because the sample was not carbon coated to conduct away electrons from the SEM beam, the analysis was run in variable-pressure mode. The X-ray spectrum (Figure 13) indicated that the stone was dominantly a Na,Mg-aluminosilicate. Minor amounts of Ca, Fe and Ti (but no Mn) also were detected. Detailed analysis
Figure 12: The tourmaline gem nodule from Tanzania on the left was faceted into the 11.13 ct stone on the right. Photos by Todd Wacks (left) and Orasa Weldon (right).
of the X-ray spectrum with Oxford Instruments AZtec software showed that a significant amount of boron was present in addition to the other ele-ments mentioned above. The data confirmed that the tourmaline was dravite, with Fe and Ti most likely responsible for its colour.
The slightly orangey yellow colour of the dravite showed moderate dichroism such that the E^c direction had the more intense colour. Compared to many dravites of similar size, which are commonly brown, this sample showed a low intensity of colour and a high degree of trans-parency. To confirm the cause of colour, Vis-NIR spectroscopy was performed. Absorption spectra (Figure 14) were obtained through the girdle of
SEM-EDS Spectrum
0 1 2 3 4 5 6 7 8 9 10Energy (keV)
20,000
15,000
10,000
5,000
0
Coun
ts
300
200
100
0
Fe
Ti
Ca
Ca
Ca
Na
Mg
Al
Si
O
Figure 13: SEM-EDS chemical analysis shows that the tourmaline in Figure 12 is Mg-rich with some Na and minor Ca, corresponding to a dravite composition. Also present are traces of Fe and Ti.
192 The Journal of Gemmology, 35(3), 2016
Gem Notes
Vis-NIR Spectra
400 500 600 700 800 900 1000 1100Wavelength (nm)
0.8
0.6
0.4
0.2
0
Abso
rban
ce
E^c
E||c
Fe2+
Fe2+–Ti4+
Fe2+
OH
450–460
the stone with the beam polarized both parallel and perpendicular to the girdle direction, corre-sponding to the E^c direction and approximate-ly to E||c, respectively. A prominent absorption feature was recorded in the 450–460 nm region, and this is also an important characteristic of brown dravite such as the material from Yin-nietharra, Australia. It arises from Fe2+–Ti4+ inter-valence charge transfer (Mattson and Rossman,
1988), and is the dominant cause of colour in this dravite. Fe2+-related features occurred near 700 and 1100 nm, and narrower peaks in the 900–1000 nm region were overtones of OH ab-sorptions in the infrared.
This attractive yellow dravite is much lighter coloured than typical brown dravite because of its low Fe and Ti contents. Its spectrum is similar to that of the golden dravite from Kenya (cf. Simonet, 2000), except that the broad absorption band in that material was centred at 435 nm rather than in the 450–460 nm region.
Dr George Rossman ([email protected]) and Chi Ma
California Institute of TechnologyPasadena, California, USA
Brendan M. Laurs
ReferencesMattson S.M. and Rossman G.R., 1988. Fe2+–Ti4+ charge
transfer in stoichiometric Fe2+, Ti4+-minerals. Physics and Chemistry of Minerals, 16, 78–82, http://dx.doi.org/10.1007/bf00201333.
Simonet C., 2000. Geology of the Yellow mine (Taita-Taveta District, Kenya) and other yellow tourmaline deposits in East Africa. Journal of Gemmology, 27(1), 11–29, http://dx.doi.org/10.15506/jog.2000. 27.1.11.
New Garnets from East Africa
Figure 14: Polarized Vis-NIR absorption spectra of the yellow dravite show a dominant feature in the 450–460 nm region that is caused by Fe2+–Ti4+ intervalence charge transfer. The spectrum is plotted for a 10.0 mm sample thickness.
During a buying trip to Arusha, Tanzania, from late May to early June 2016, rough stone dealer Farooq Hashmi encountered some new garnet rough that was reported to be from north-eastern Tanzania or south-eastern Kenya. Several kilo-grams were available as pebbles and fractured pieces ranging up to ~10 g. The garnet was sold by local dealers as rhodolite. The colour of the material showed some variation, and Hashmi purchased only the lighter material (with a more purple colour in daylight), which he has market-ed as ‘Rhodolaya’.
Hashmi loaned three faceted stones (e.g. Fig-ure 15) and 18 rough samples to authors CW and BW for examination. The cut stones weighed 3.24, 3.36 and 3.89 ct, and measured up to 9.4 × 8.2 ×
Figure 15: These two specimens (3.24 and 3.89 ct) are representative of some of the new garnet production from East Africa. The stones were faceted by Marvin M. Wambua, Safigemscutters Ltd., Nairobi, Kenya; photo by B. Williams.
Gem Notes
Gem Notes
193
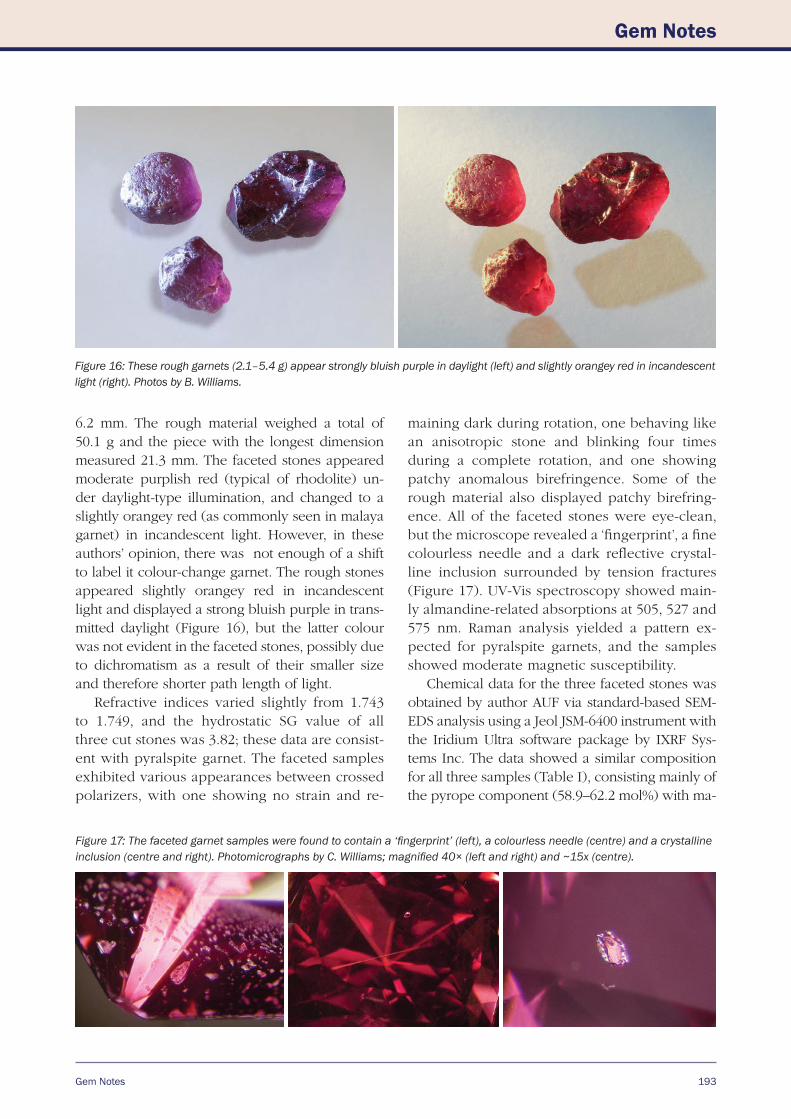
Figure 16: These rough garnets (2.1–5.4 g) appear strongly bluish purple in daylight (left) and slightly orangey red in incandescent light (right). Photos by B. Williams.
6.2 mm. The rough material weighed a total of 50.1 g and the piece with the longest dimension measured 21.3 mm. The faceted stones appeared moderate purplish red (typical of rhodolite) un-der daylight-type illumination, and changed to a slightly orangey red (as commonly seen in malaya garnet) in incandescent light. However, in these authors’ opinion, there was not enough of a shift to label it colour-change garnet. The rough stones appeared slightly orangey red in incandescent light and displayed a strong bluish purple in trans-mitted daylight (Figure 16), but the latter colour was not evident in the faceted stones, possibly due to dichromatism as a result of their smaller size and therefore shorter path length of light.
Refractive indices varied slightly from 1.743 to 1.749, and the hydrostatic SG value of all three cut stones was 3.82; these data are consist-ent with pyralspite garnet. The faceted samples exhibited various appearances between crossed polarizers, with one showing no strain and re-
maining dark during rotation, one behaving like an anisotropic stone and blinking four times during a complete rotation, and one showing patchy anomalous birefringence. Some of the rough material also displayed patchy birefring-ence. All of the faceted stones were eye-clean, but the microscope revealed a ‘fingerprint’, a fine colourless needle and a dark reflective crystal-line inclusion surrounded by tension fractures (Figure 17). UV-Vis spectroscopy showed main-ly almandine-related absorptions at 505, 527 and 575 nm. Raman analysis yielded a pattern ex-pected for pyralspite garnets, and the samples showed moderate magnetic susceptibility.
Chemical data for the three faceted stones was obtained by author AUF via standard-based SEM-EDS analysis using a Jeol JSM-6400 instrument with the Iridium Ultra software package by IXRF Sys-tems Inc. The data showed a similar composition for all three samples (Table I), consisting mainly of the pyrope component (58.9–62.2 mol%) with ma-
Figure 17: The faceted garnet samples were found to contain a ‘fingerprint’ (left), a colourless needle (centre) and a crystalline inclusion (centre and right). Photomicrographs by C. Williams; magnified 40× (left and right) and ~15x (centre).
194 The Journal of Gemmology, 35(3), 2016
Gem Notes
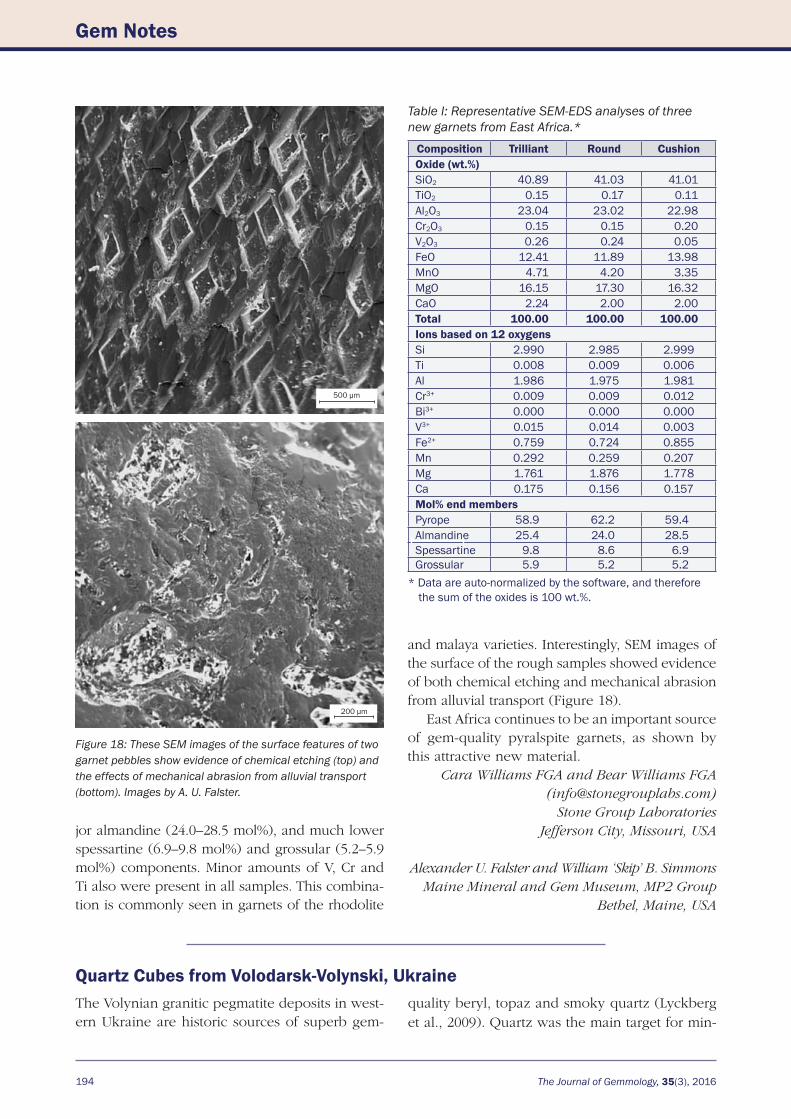
Table I: Representative SEM-EDS analyses of three new garnets from East Africa.*
Composition Trilliant Round CushionOxide (wt.%)SiO2 40.89 41.03 41.01TiO2 0.15 0.17 0.11Al2O3 23.04 23.02 22.98Cr2O3 0.15 0.15 0.20V2O3 0.26 0.24 0.05FeO 12.41 11.89 13.98MnO 4.71 4.20 3.35MgO 16.15 17.30 16.32CaO 2.24 2.00 2.00Total 100.00 100.00 100.00Ions based on 12 oxygensSi 2.990 2.985 2.999 Ti 0.008 0.009 0.006 Al 1.986 1.975 1.981 Cr3+ 0.009 0.009 0.012 Bi3+ 0.000 0.000 0.000 V3+ 0.015 0.014 0.003 Fe2+ 0.759 0.724 0.855 Mn 0.292 0.259 0.207 Mg 1.761 1.876 1.778 Ca 0.175 0.156 0.157 Mol% end membersPyrope 58.9 62.2 59.4Almandine 25.4 24.0 28.5Spessartine 9.8 8.6 6.9Grossular 5.9 5.2 5.2
* Data are auto-normalized by the software, and therefore the sum of the oxides is 100 wt.%.
jor almandine (24.0–28.5 mol%), and much lower spessartine (6.9–9.8 mol%) and grossular (5.2–5.9 mol%) components. Minor amounts of V, Cr and Ti also were present in all samples. This combina-tion is commonly seen in garnets of the rhodolite
Quartz Cubes from Volodarsk-Volynski, Ukraine
Figure 18: These SEM images of the surface features of two garnet pebbles show evidence of chemical etching (top) and the effects of mechanical abrasion from alluvial transport (bottom). Images by A. U. Falster.
and malaya varieties. Interestingly, SEM images of the surface of the rough samples showed evidence of both chemical etching and mechanical abrasion from alluvial transport (Figure 18).
East Africa continues to be an important source of gem-quality pyralspite garnets, as shown by this attractive new material.
Cara Williams FGA and Bear Williams FGA([email protected])
Stone Group LaboratoriesJefferson City, Missouri, USA
Alexander U. Falster and William ‘Skip’ B. SimmonsMaine Mineral and Gem Museum, MP2 Group
Bethel, Maine, USA
The Volynian granitic pegmatite deposits in west-ern Ukraine are historic sources of superb gem-
quality beryl, topaz and smoky quartz (Lyckberg et al., 2009). Quartz was the main target for min-
200 μm
500 μm
Gem Notes
Gem Notes
195
ing back in the Soviet era due to its piezoelectric properties. Since approximately 2012, the three major mines in the area have been under the con-trol of PJSC Kvartssamotvit (Volodarsk-Volynski, Zhitomir Oblast, Ukraine), with this author be-ing a consultant since March 2016. The company mines only one deposit at a time due to ongoing flooding by groundwater that requires pumping on a 24-hour basis. The two main levels of the mines are at approximately 60 and 120 m depth. Large quartz crystals have been found in all of the mines and at all levels. Due to the large size of the gem-bearing ‘pockets’ or cavities—typically several metres in dimension, making them some of the largest in the world—only one pocket at a time is mined by the current full-time operation.
Due to natural radiation within the pegmatite, most of the quartz is so smoky that it appears black (morion). The radiation damage can be re-
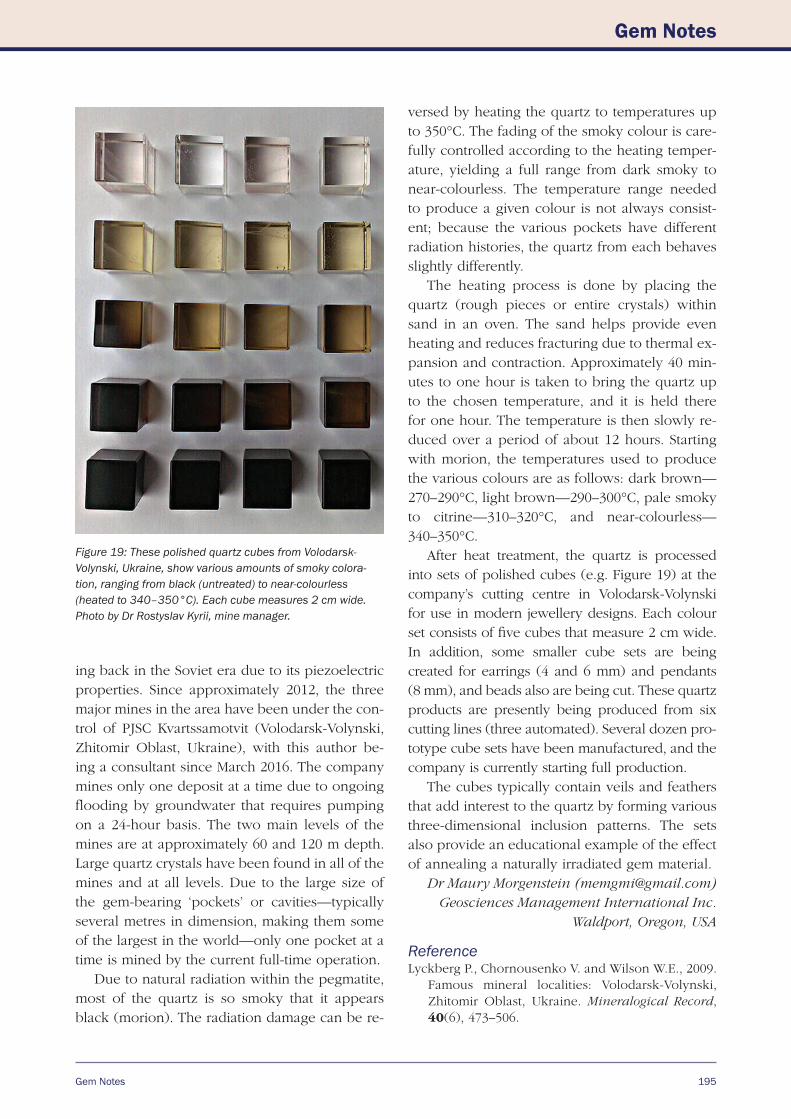
versed by heating the quartz to temperatures up to 350°C. The fading of the smoky colour is care-fully controlled according to the heating temper-ature, yielding a full range from dark smoky to near-colourless. The temperature range needed to produce a given colour is not always consist-ent; because the various pockets have different radiation histories, the quartz from each behaves slightly differently.
The heating process is done by placing the quartz (rough pieces or entire crystals) within sand in an oven. The sand helps provide even heating and reduces fracturing due to thermal ex-pansion and contraction. Approximately 40 min-utes to one hour is taken to bring the quartz up to the chosen temperature, and it is held there for one hour. The temperature is then slowly re-duced over a period of about 12 hours. Starting with morion, the temperatures used to produce the various colours are as follows: dark brown—270–290°C, light brown—290–300°C, pale smoky to citrine—310–320°C, and near-colourless—340–350°C.
After heat treatment, the quartz is processed into sets of polished cubes (e.g. Figure 19) at the company’s cutting centre in Volodarsk-Volynski for use in modern jewellery designs. Each colour set consists of five cubes that measure 2 cm wide. In addition, some smaller cube sets are being created for earrings (4 and 6 mm) and pendants (8 mm), and beads also are being cut. These quartz products are presently being produced from six cutting lines (three automated). Several dozen pro-totype cube sets have been manufactured, and the company is currently starting full production.
The cubes typically contain veils and feathers that add interest to the quartz by forming various three-dimensional inclusion patterns. The sets also provide an educational example of the effect of annealing a naturally irradiated gem material.
Dr Maury Morgenstein ([email protected])Geosciences Management International Inc.
Waldport, Oregon, USA
ReferenceLyckberg P., Chornousenko V. and Wilson W.E., 2009.
Famous mineral localities: Volodarsk-Volynski, Zhitomir Oblast, Ukraine. Mineralogical Record, 40(6), 473–506.
Figure 19: These polished quartz cubes from Volodarsk-Volynski, Ukraine, show various amounts of smoky colora-tion, ranging from black (untreated) to near-colourless (heated to 340–350°C). Each cube measures 2 cm wide. Photo by Dr Rostyslav Kyrii, mine manager.
Gem Notes 197
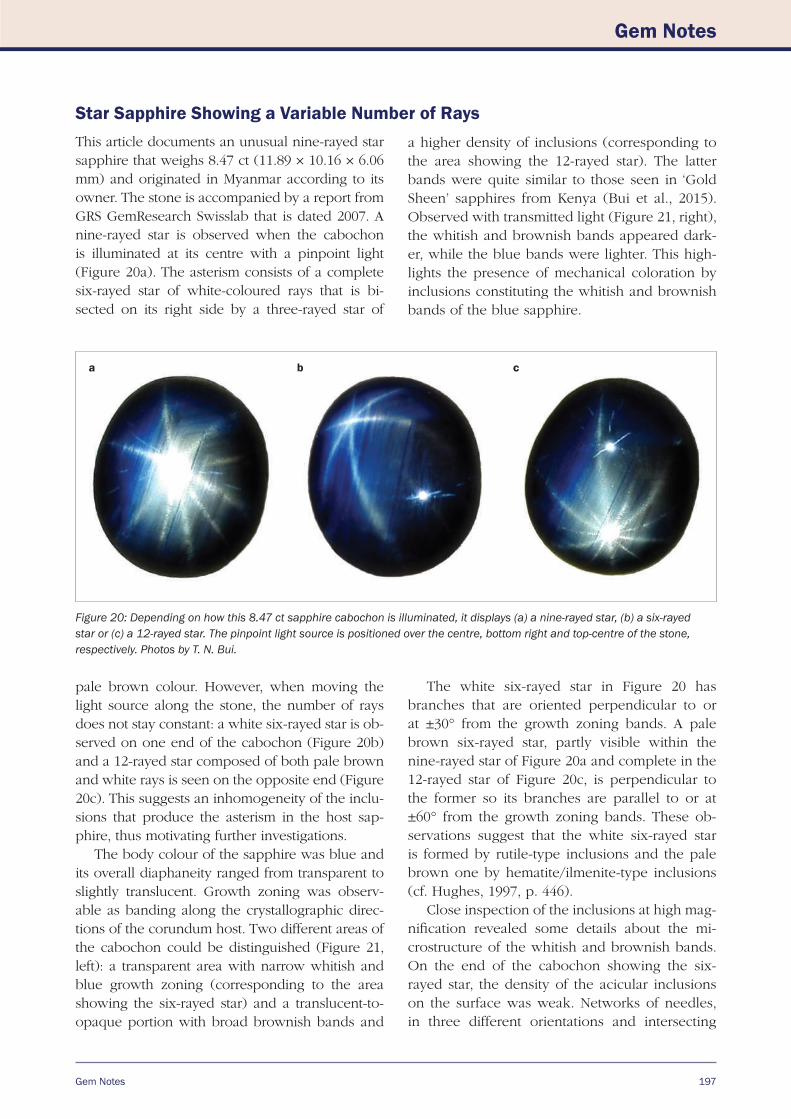
Star Sapphire Showing a Variable Number of RaysThis article documents an unusual nine-rayed star sapphire that weighs 8.47 ct (11.89 × 10.16 × 6.06 mm) and originated in Myanmar according to its owner. The stone is accompanied by a report from GRS GemResearch Swisslab that is dated 2007. A nine-rayed star is observed when the cabochon is illuminated at its centre with a pinpoint light (Figure 20a). The asterism consists of a complete six-rayed star of white-coloured rays that is bi-sected on its right side by a three-rayed star of
Figure 20: Depending on how this 8.47 ct sapphire cabochon is illuminated, it displays (a) a nine-rayed star, (b) a six-rayed star or (c) a 12-rayed star. The pinpoint light source is positioned over the centre, bottom right and top-centre of the stone, respectively. Photos by T. N. Bui.
pale brown colour. However, when moving the light source along the stone, the number of rays does not stay constant: a white six-rayed star is ob-served on one end of the cabochon (Figure 20b) and a 12-rayed star composed of both pale brown and white rays is seen on the opposite end (Figure 20c). This suggests an inhomogeneity of the inclu-sions that produce the asterism in the host sap-phire, thus motivating further investigations.
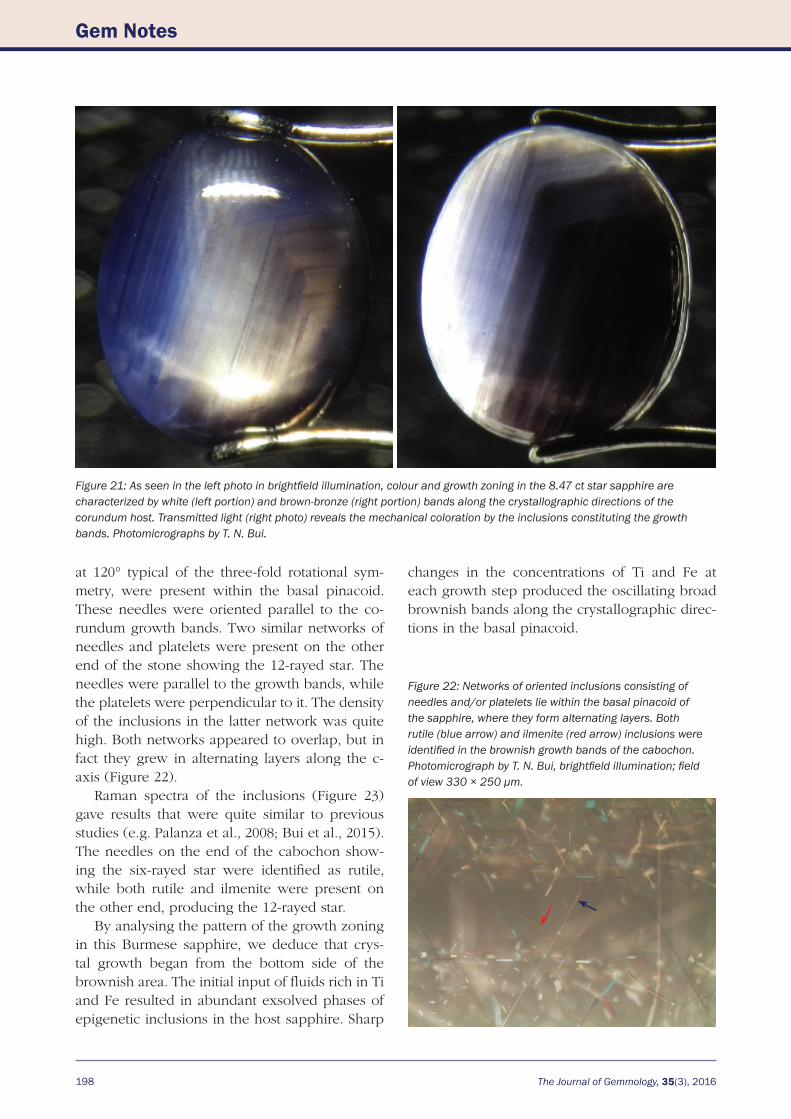
The body colour of the sapphire was blue and its overall diaphaneity ranged from transparent to slightly translucent. Growth zoning was observ-able as banding along the crystallographic direc-tions of the corundum host. Two different areas of the cabochon could be distinguished (Figure 21, left): a transparent area with narrow whitish and blue growth zoning (corresponding to the area showing the six-rayed star) and a translucent-to-opaque portion with broad brownish bands and
a higher density of inclusions (corresponding to the area showing the 12-rayed star). The latter bands were quite similar to those seen in ‘Gold Sheen’ sapphires from Kenya (Bui et al., 2015). Observed with transmitted light (Figure 21, right), the whitish and brownish bands appeared dark-er, while the blue bands were lighter. This high-lights the presence of mechanical coloration by inclusions constituting the whitish and brownish bands of the blue sapphire.
a b c
The white six-rayed star in Figure 20 has branches that are oriented perpendicular to or at ±30° from the growth zoning bands. A pale brown six-rayed star, partly visible within the nine-rayed star of Figure 20a and complete in the 12-rayed star of Figure 20c, is perpendicular to the former so its branches are parallel to or at ±60° from the growth zoning bands. These ob-servations suggest that the white six-rayed star is formed by rutile-type inclusions and the pale brown one by hematite/ilmenite-type inclusions (cf. Hughes, 1997, p. 446).
Close inspection of the inclusions at high mag-nification revealed some details about the mi-crostructure of the whitish and brownish bands. On the end of the cabochon showing the six-rayed star, the density of the acicular inclusions on the surface was weak. Networks of needles, in three different orientations and intersecting
Gem Notes
198 The Journal of Gemmology, 35(3), 2016
Gem Notes
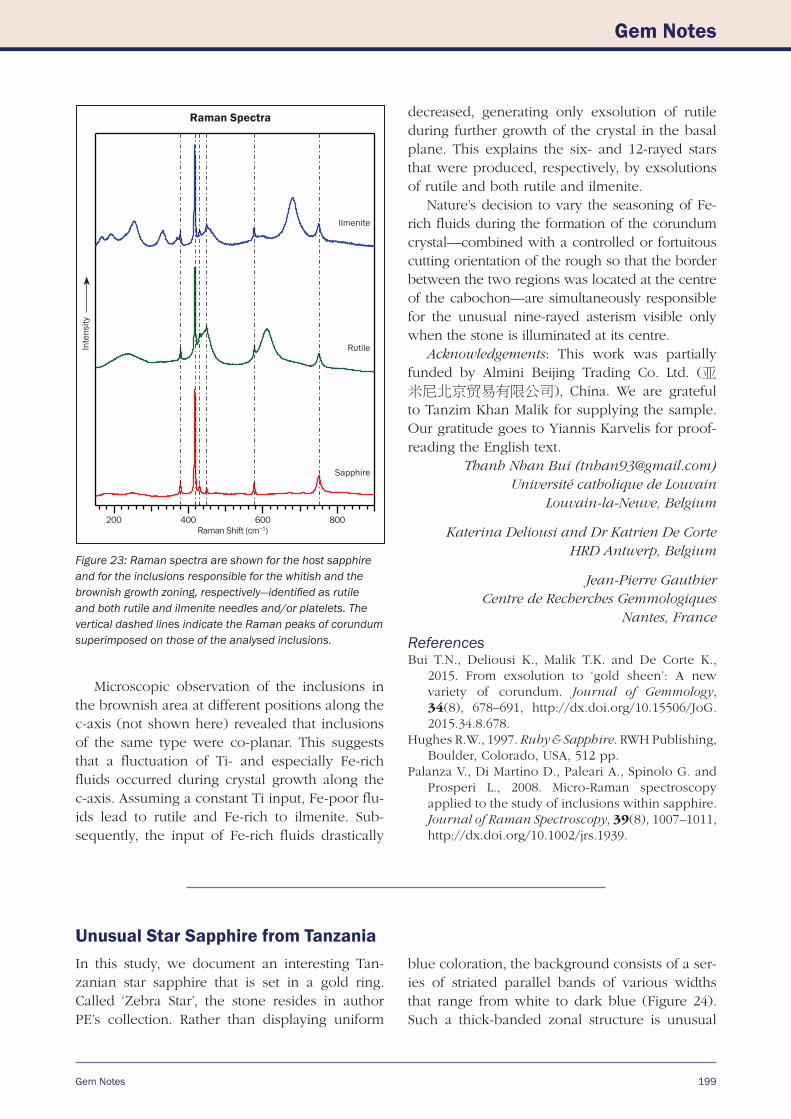
at 120° typical of the three-fold rotational sym-metry, were present within the basal pinacoid. These needles were oriented parallel to the co-rundum growth bands. Two similar networks of needles and platelets were present on the other end of the stone showing the 12-rayed star. The needles were parallel to the growth bands, while the platelets were perpendicular to it. The density of the inclusions in the latter network was quite high. Both networks appeared to overlap, but in fact they grew in alternating layers along the c-axis (Figure 22).
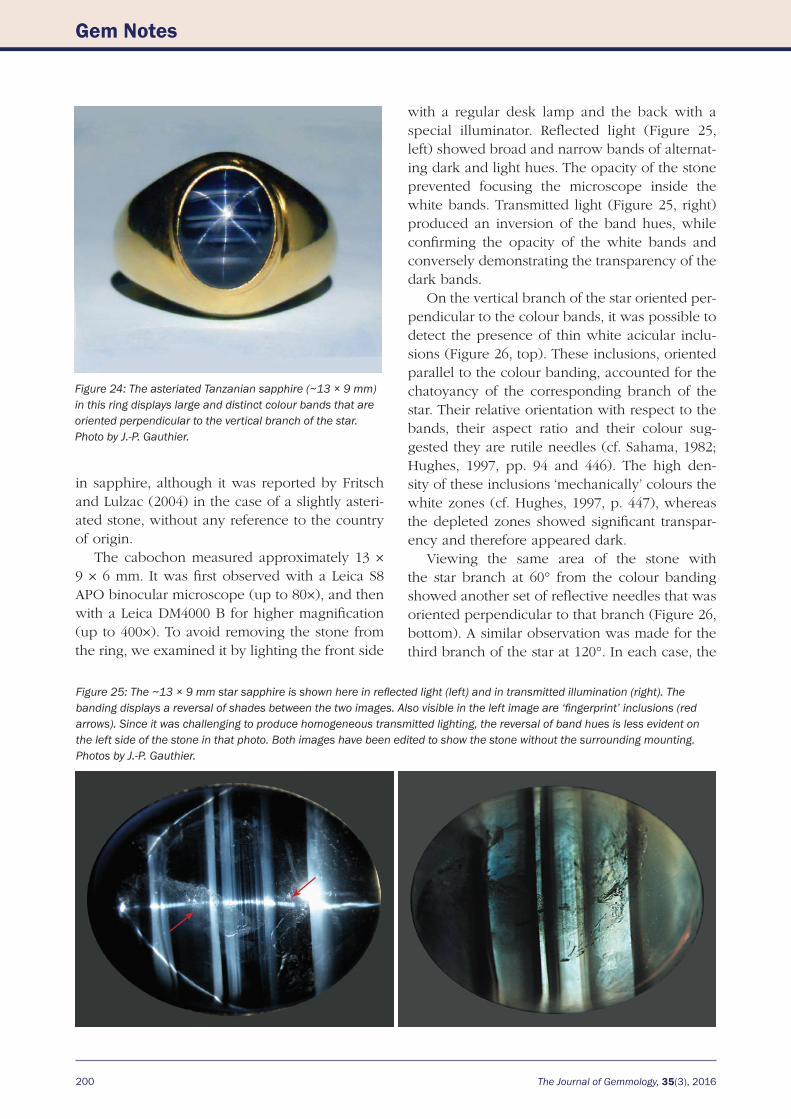
Raman spectra of the inclusions (Figure 23) gave results that were quite similar to previous studies (e.g. Palanza et al., 2008; Bui et al., 2015). The needles on the end of the cabochon show-ing the six-rayed star were identified as rutile, while both rutile and ilmenite were present on the other end, producing the 12-rayed star.
By analysing the pattern of the growth zoning in this Burmese sapphire, we deduce that crys-tal growth began from the bottom side of the brownish area. The initial input of fluids rich in Ti and Fe resulted in abundant exsolved phases of epigenetic inclusions in the host sapphire. Sharp
changes in the concentrations of Ti and Fe at each growth step produced the oscillating broad brownish bands along the crystallographic direc-tions in the basal pinacoid.
Figure 21: As seen in the left photo in brightfield illumination, colour and growth zoning in the 8.47 ct star sapphire are characterized by white (left portion) and brown-bronze (right portion) bands along the crystallographic directions of the corundum host. Transmitted light (right photo) reveals the mechanical coloration by the inclusions constituting the growth bands. Photomicrographs by T. N. Bui.
Figure 22: Networks of oriented inclusions consisting of needles and/or platelets lie within the basal pinacoid of the sapphire, where they form alternating layers. Both rutile (blue arrow) and ilmenite (red arrow) inclusions were identified in the brownish growth bands of the cabochon. Photomicrograph by T. N. Bui, brightfield illumination; field of view 330 × 250 μm.
Gem Notes
Gem Notes
199
Unusual Star Sapphire from Tanzania
Microscopic observation of the inclusions in the brownish area at different positions along the c-axis (not shown here) revealed that inclusions of the same type were co-planar. This suggests that a fluctuation of Ti- and especially Fe-rich fluids occurred during crystal growth along the c-axis. Assuming a constant Ti input, Fe-poor flu-ids lead to rutile and Fe-rich to ilmenite. Sub-sequently, the input of Fe-rich fluids drastically
decreased, generating only exsolution of rutile during further growth of the crystal in the basal plane. This explains the six- and 12-rayed stars that were produced, respectively, by exsolutions of rutile and both rutile and ilmenite.
Nature’s decision to vary the seasoning of Fe-rich fluids during the formation of the corundum crystal—combined with a controlled or fortuitous cutting orientation of the rough so that the border between the two regions was located at the centre of the cabochon—are simultaneously responsible for the unusual nine-rayed asterism visible only when the stone is illuminated at its centre.
Acknowledgements: This work was partially funded by Almini Beijing Trading Co. Ltd. (亚米尼北京贸易有限公司), China. We are grateful to Tanzim Khan Malik for supplying the sample. Our gratitude goes to Yiannis Karvelis for proof-reading the English text.
Thanh Nhan Bui ([email protected])Université catholique de Louvain
Louvain-la-Neuve, Belgium
Katerina Deliousi and Dr Katrien De CorteHRD Antwerp, Belgium
Jean-Pierre GauthierCentre de Recherches Gemmologiques
Nantes, France
ReferencesBui T.N., Deliousi K., Malik T.K. and De Corte K.,
2015. From exsolution to ‘gold sheen’: A new variety of corundum. Journal of Gemmology, 34(8), 678–691, http://dx.doi.org/10.15506/JoG. 2015.34.8.678.
Hughes R.W., 1997. Ruby & Sapphire. RWH Publishing, Boulder, Colorado, USA, 512 pp.
Palanza V., Di Martino D., Paleari A., Spinolo G. and Prosperi L., 2008. Micro-Raman spectroscopy applied to the study of inclusions within sapphire. Journal of Raman Spectroscopy, 39(8), 1007–1011, http://dx.doi.org/10.1002/jrs.1939.
Raman Spectra
200 400 600 800 Raman Shift (cm−1)
Inte
nsity
Ilmenite
Rutile
Sapphire
Figure 23: Raman spectra are shown for the host sapphire and for the inclusions responsible for the whitish and the brownish growth zoning, respectively—identified as rutile and both rutile and ilmenite needles and/or platelets. The vertical dashed lines indicate the Raman peaks of corundum superimposed on those of the analysed inclusions.
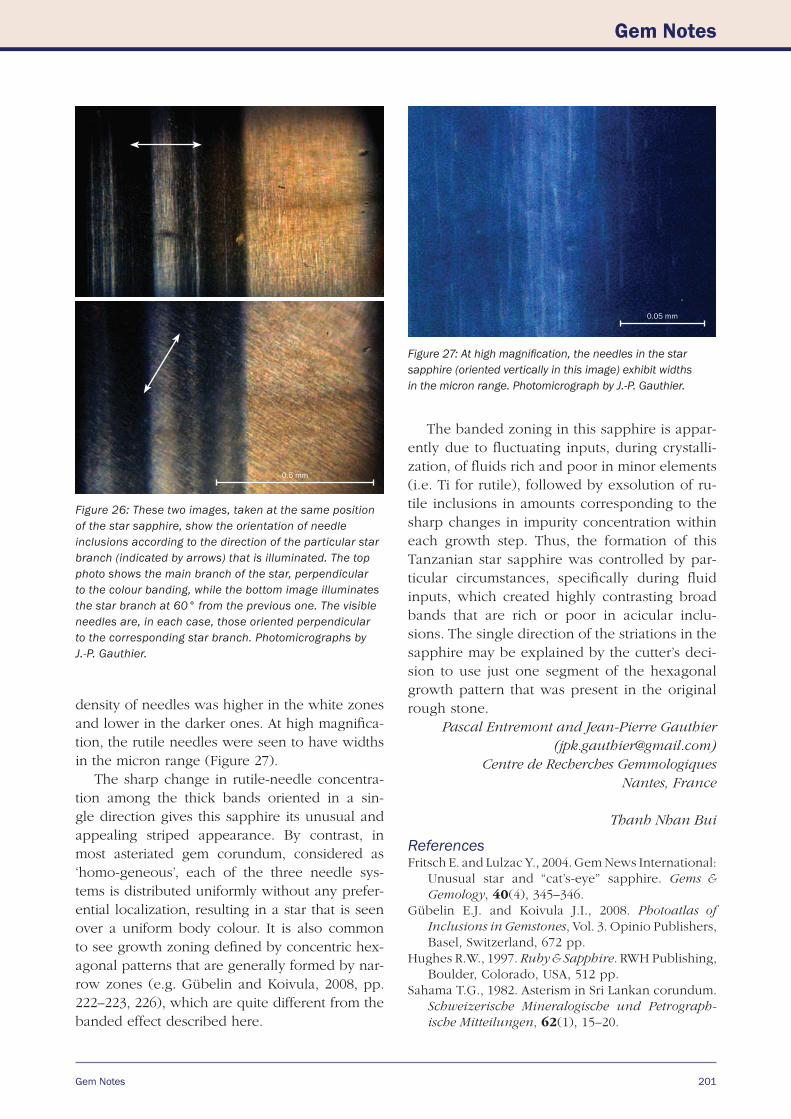
In this study, we document an interesting Tan-zanian star sapphire that is set in a gold ring. Called ‘Zebra Star’, the stone resides in author PE’s collection. Rather than displaying uniform
blue coloration, the background consists of a ser-ies of striated parallel bands of various widths that range from white to dark blue (Figure 24). Such a thick-banded zonal structure is unusual
200 The Journal of Gemmology, 35(3), 2016
Gem Notes
in sapphire, although it was reported by Fritsch and Lulzac (2004) in the case of a slightly asteri-ated stone, without any reference to the country of origin.
The cabochon measured approximately 13 × 9 × 6 mm. It was first observed with a Leica S8 APO binocular microscope (up to 80×), and then with a Leica DM4000 B for higher magnification (up to 400×). To avoid removing the stone from the ring, we examined it by lighting the front side
with a regular desk lamp and the back with a special illuminator. Reflected light (Figure 25, left) showed broad and narrow bands of alternat-ing dark and light hues. The opacity of the stone prevented focusing the microscope inside the white bands. Transmitted light (Figure 25, right) produced an inversion of the band hues, while confirming the opacity of the white bands and conversely demonstrating the transparency of the dark bands.
On the vertical branch of the star oriented per-pendicular to the colour bands, it was possible to detect the presence of thin white acicular inclu-sions (Figure 26, top). These inclusions, oriented parallel to the colour banding, accounted for the chatoyancy of the corresponding branch of the star. Their relative orientation with respect to the bands, their aspect ratio and their colour sug-gested they are rutile needles (cf. Sahama, 1982; Hughes, 1997, pp. 94 and 446). The high den-sity of these inclusions ‘mechanically’ colours the white zones (cf. Hughes, 1997, p. 447), whereas the depleted zones showed significant transpar-ency and therefore appeared dark.
Viewing the same area of the stone with the star branch at 60° from the colour banding showed another set of reflective needles that was oriented perpendicular to that branch (Figure 26, bottom). A similar observation was made for the third branch of the star at 120°. In each case, the
Figure 24: The asteriated Tanzanian sapphire (~13 × 9 mm) in this ring displays large and distinct colour bands that are oriented perpendicular to the vertical branch of the star. Photo by J.-P. Gauthier.
Figure 25: The ~13 × 9 mm star sapphire is shown here in reflected light (left) and in transmitted illumination (right). The banding displays a reversal of shades between the two images. Also visible in the left image are ‘fingerprint’ inclusions (red arrows). Since it was challenging to produce homogeneous transmitted lighting, the reversal of band hues is less evident on the left side of the stone in that photo. Both images have been edited to show the stone without the surrounding mounting. Photos by J.-P. Gauthier.
Gem Notes
Gem Notes
201
density of needles was higher in the white zones and lower in the darker ones. At high magnifica-tion, the rutile needles were seen to have widths in the micron range (Figure 27).
The sharp change in rutile-needle concentra-tion among the thick bands oriented in a sin-gle direction gives this sapphire its unusual and appealing striped appearance. By contrast, in most asteriated gem corundum, considered as ‘homo-geneous’, each of the three needle sys-tems is distributed uniformly without any prefer-ential localization, resulting in a star that is seen over a uniform body colour. It is also common to see growth zoning defined by concentric hex-agonal patterns that are generally formed by nar-row zones (e.g. Gübelin and Koivula, 2008, pp. 222–223, 226), which are quite different from the banded effect described here.
The banded zoning in this sapphire is appar-ently due to fluctuating inputs, during crystalli-zation, of fluids rich and poor in minor elements (i.e. Ti for rutile), followed by exsolution of ru-tile inclusions in amounts corresponding to the sharp changes in impurity concentration within each growth step. Thus, the formation of this Tanzanian star sapphire was controlled by par-ticular circumstances, specifically during fluid inputs, which created highly contrasting broad bands that are rich or poor in acicular inclu-sions. The single direction of the striations in the sapphire may be explained by the cutter’s deci-sion to use just one segment of the hexagonal growth pattern that was present in the original rough stone.
Pascal Entremont and Jean-Pierre Gauthier ([email protected])
Centre de Recherches GemmologiquesNantes, France
Thanh Nhan Bui
ReferencesFritsch E. and Lulzac Y., 2004. Gem News International:
Unusual star and “cat’s-eye” sapphire. Gems & Gemology, 40(4), 345–346.
Gübelin E.J. and Koivula J.I., 2008. Photoatlas of Inclusions in Gemstones, Vol. 3. Opinio Publishers, Basel, Switzerland, 672 pp.
Hughes R.W., 1997. Ruby & Sapphire. RWH Publishing, Boulder, Colorado, USA, 512 pp.
Sahama T.G., 1982. Asterism in Sri Lankan corundum. Schweizerische Mineralogische und Petrograph-ische Mitteilungen, 62(1), 15–20.
0.5 mm
Figure 26: These two images, taken at the same position of the star sapphire, show the orientation of needle inclusions according to the direction of the particular star branch (indicated by arrows) that is illuminated. The top photo shows the main branch of the star, perpendicular to the colour banding, while the bottom image illuminates the star branch at 60° from the previous one. The visible needles are, in each case, those oriented perpendicular to the corresponding star branch. Photomicrographs by J.-P. Gauthier.
0.05 mm
Figure 27: At high magnification, the needles in the star sapphire (oriented vertically in this image) exhibit widths in the micron range. Photomicrograph by J.-P. Gauthier.
202 The Journal of Gemmology, 35(3), 2016
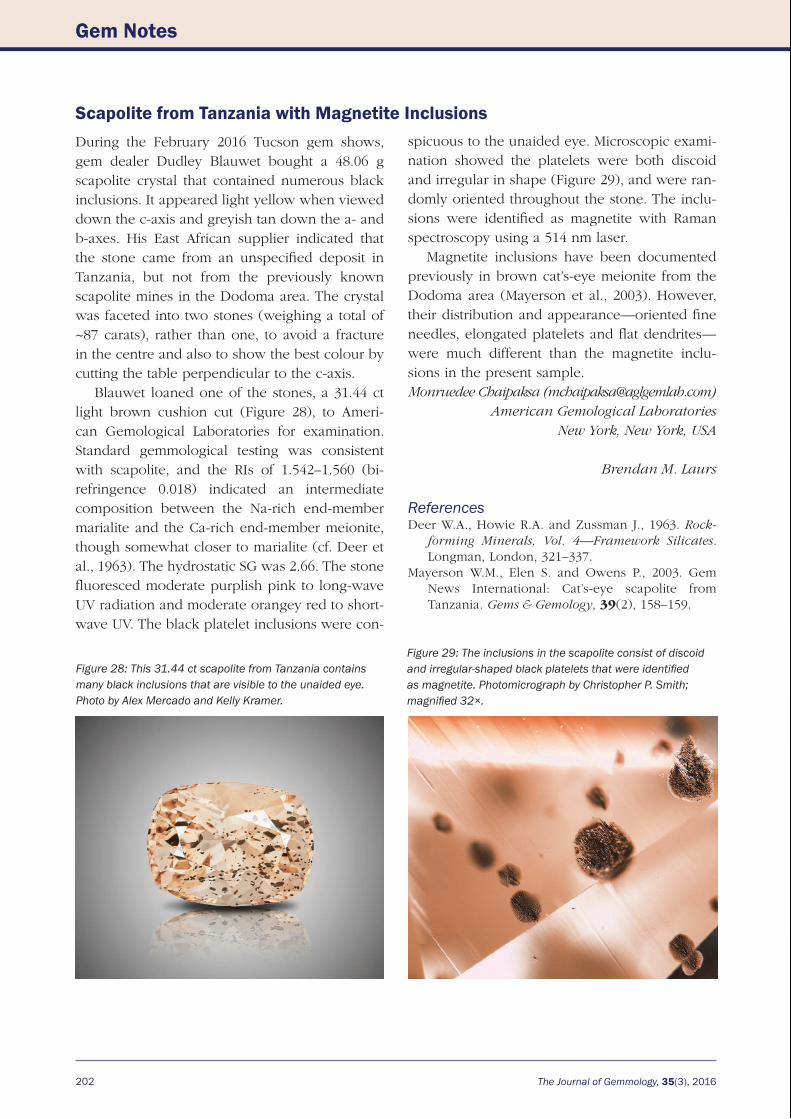
Scapolite from Tanzania with Magnetite InclusionsDuring the February 2016 Tucson gem shows, gem dealer Dudley Blauwet bought a 48.06 g scapolite crystal that contained numerous black inclusions. It appeared light yellow when viewed down the c-axis and greyish tan down the a- and b-axes. His East African supplier indicated that the stone came from an unspecified deposit in Tanzania, but not from the previously known scapolite mines in the Dodoma area. The crystal was faceted into two stones (weighing a total of ~87 carats), rather than one, to avoid a fracture in the centre and also to show the best colour by cutting the table perpendicular to the c-axis.
Blauwet loaned one of the stones, a 31.44 ct light brown cushion cut (Figure 28), to Ameri-can Gemological Laboratories for examination. Standard gemmological testing was consistent with scapolite, and the RIs of 1.542–1.560 (bi-refringence 0.018) indicated an intermediate composition between the Na-rich end-member marialite and the Ca-rich end-member meionite, though somewhat closer to marialite (cf. Deer et al., 1963). The hydrostatic SG was 2.66. The stone fluoresced moderate purplish pink to long -wave UV radiation and moderate orangey red to short-wave UV. The black platelet inclusions were con-
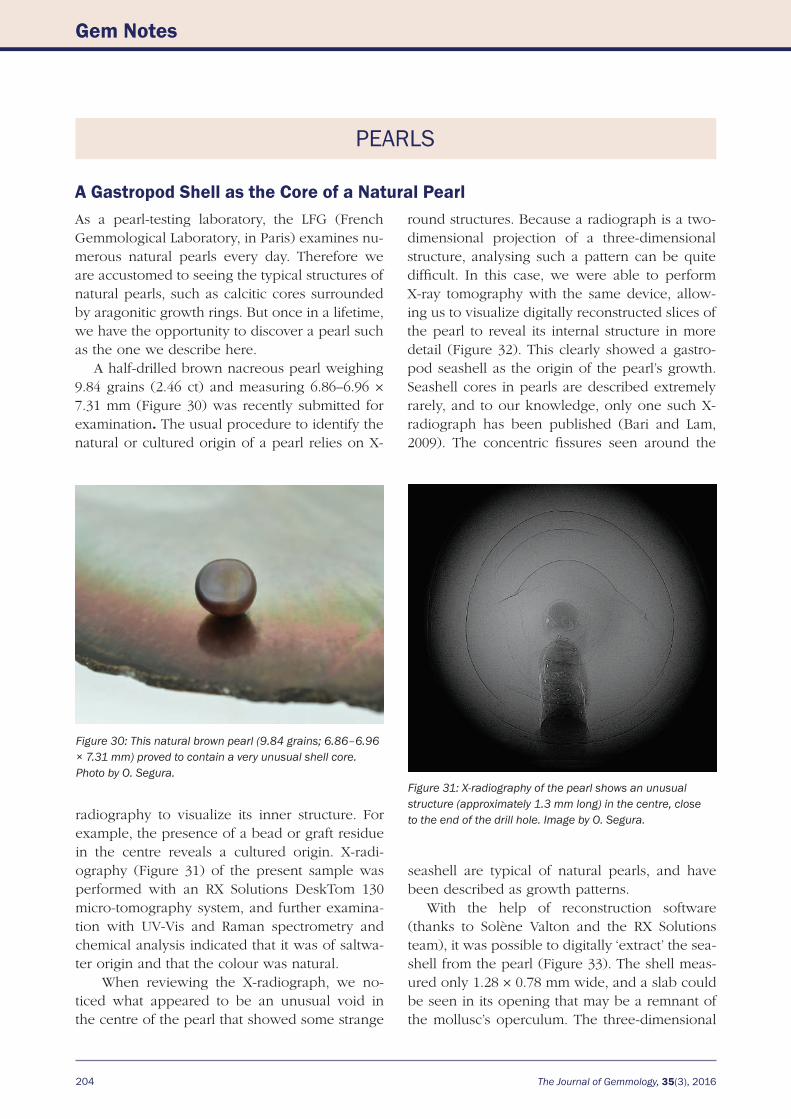
spicuous to the unaided eye. Microscopic exami-nation showed the platelets were both discoid and irregular in shape (Figure 29), and were ran-domly oriented throughout the stone. The inclu-sions were identified as magnetite with Raman spectroscopy using a 514 nm laser.
Magnetite inclusions have been documented previously in brown cat’s-eye meionite from the Dodoma area (Mayerson et al., 2003). However, their distribution and appearance—oriented fine needles, elongated platelets and flat dendrites—were much different than the magnetite inclu-sions in the present sample. Monruedee Chaipaksa ([email protected])
American Gemological LaboratoriesNew York, New York, USA
Brendan M. Laurs
ReferencesDeer W.A., Howie R.A. and Zussman J., 1963. Rock-
forming Minerals, Vol. 4—Framework Silicates. Longman, London, 321–337.
Mayerson W.M., Elen S. and Owens P., 2003. Gem News International: Cat’s-eye scapolite from Tanzania. Gems & Gemology, 39(2), 158–159.
Figure 28: This 31.44 ct scapolite from Tanzania contains many black inclusions that are visible to the unaided eye. Photo by Alex Mercado and Kelly Kramer.
Figure 29: The inclusions in the scapolite consist of discoid and irregular-shaped black platelets that were identified as magnetite. Photomicrograph by Christopher P. Smith; magnified 32×.
Gem Notes
204 The Journal of Gemmology, 35(3), 2016
Gem Notes
PEARLS
A Gastropod Shell as the Core of a Natural PearlAs a pearl-testing laboratory, the LFG (French Gemmological Laboratory, in Paris) examines nu-merous natural pearls every day. Therefore we are accustomed to seeing the typical structures of natural pearls, such as calcitic cores surrounded by aragonitic growth rings. But once in a lifetime, we have the opportunity to discover a pearl such as the one we describe here.
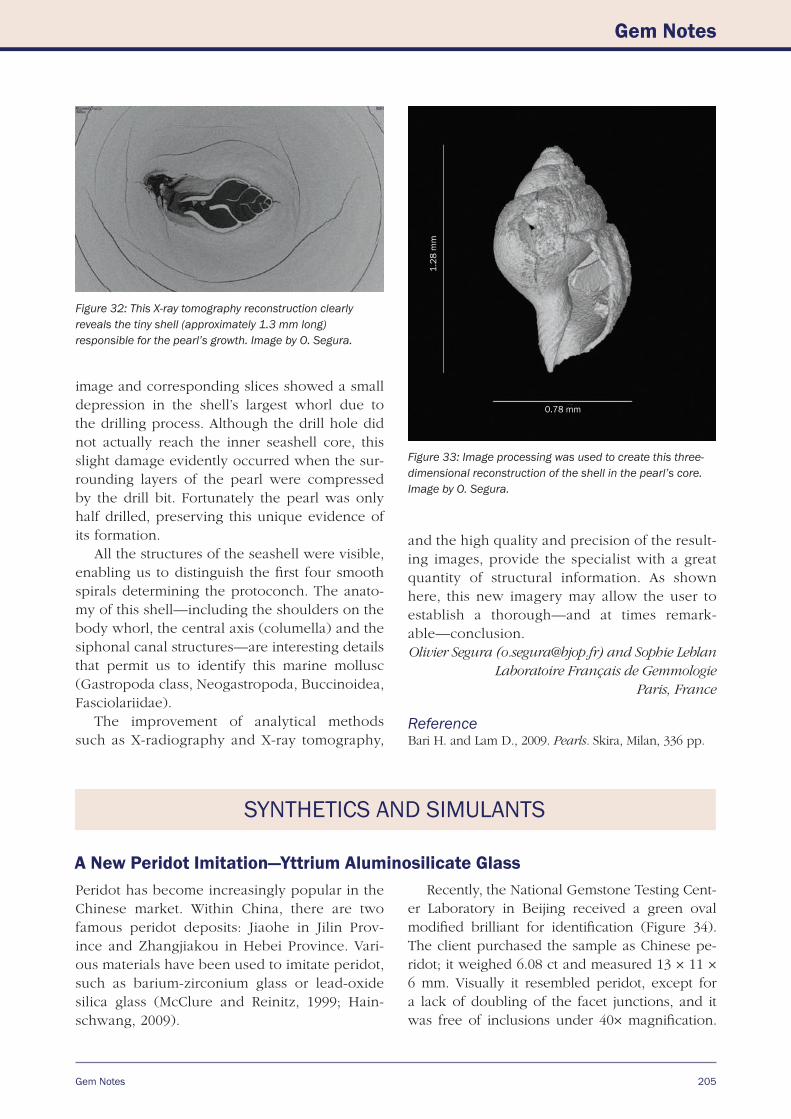
A half-drilled brown nacreous pearl weighing 9.84 grains (2.46 ct) and measuring 6.86–6.96 × 7.31 mm (Figure 30) was recently submitted for examination. The usual procedure to identify the natural or cultured origin of a pearl relies on X-
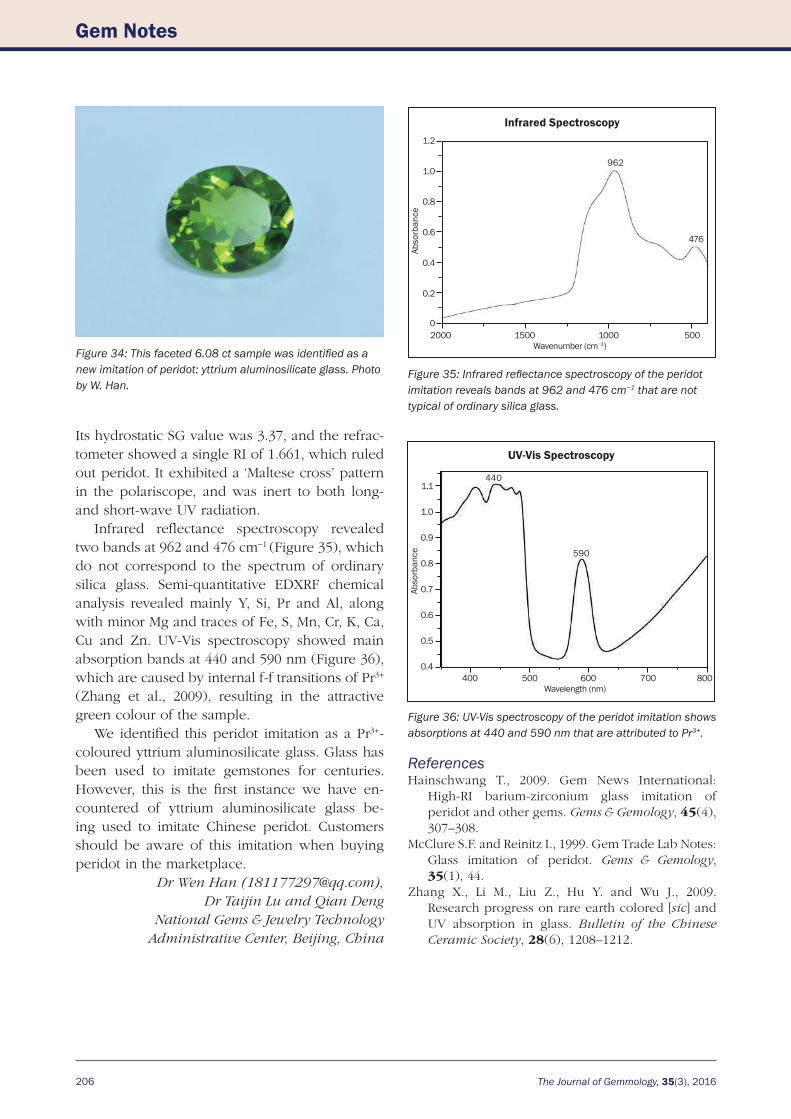
round structures. Because a radiograph is a two-dimensional projection of a three-dimensional structure, analysing such a pattern can be quite difficult. In this case, we were able to perform X-ray tomography with the same device, allow-ing us to visualize digitally reconstructed slices of the pearl to reveal its internal structure in more detail (Figure 32). This clearly showed a gastro-pod seashell as the origin of the pearl’s growth. Seashell cores in pearls are described extremely rarely, and to our knowledge, only one such X-radiograph has been published (Bari and Lam, 2009). The concentric fissures seen around the
Figure 30: This natural brown pearl (9.84 grains; 6.86–6.96 × 7.31 mm) proved to contain a very unusual shell core. Photo by O. Segura.
Figure 31: X-radiography of the pearl shows an unusual structure (approximately 1.3 mm long) in the centre, close to the end of the drill hole. Image by O. Segura.radiography to visualize its inner structure. For
example, the presence of a bead or graft residue in the centre reveals a cultured origin. X-radi-ography (Figure 31) of the present sample was performed with an RX Solutions DeskTom 130 micro-tomography system, and further examina-tion with UV-Vis and Raman spectrometry and chemical analysis indicated that it was of saltwa-ter origin and that the colour was natural.
When reviewing the X-radiograph, we no-ticed what appeared to be an unusual void in the centre of the pearl that showed some strange
seashell are typical of natural pearls, and have been described as growth patterns.
With the help of reconstruction software (thanks to Solène Valton and the RX Solutions team), it was possible to digitally ‘extract’ the sea-shell from the pearl (Figure 33). The shell meas-ured only 1.28 × 0.78 mm wide, and a slab could be seen in its opening that may be a remnant of the mollusc’s operculum. The three-dimensional
Gem Notes
Gem Notes
205
image and corresponding slices showed a small depression in the shell’s largest whorl due to the drilling process. Although the drill hole did not actually reach the inner seashell core, this slight damage evidently occurred when the sur-rounding layers of the pearl were compressed by the drill bit. Fortunately the pearl was only half drilled, preserving this unique evidence of its formation.
All the structures of the seashell were visible, enabling us to distinguish the first four smooth spirals determining the protoconch. The anato-my of this shell—including the shoulders on the body whorl, the central axis (columella) and the siphonal canal structures—are interesting details that permit us to identify this marine mollusc (Gastropoda class, Neogastropoda, Buccinoidea, Fasciolariidae).
The improvement of analytical methods such as X-radiography and X-ray tomography,
and the high quality and precision of the result-ing images, provide the specialist with a great quantity of structural information. As shown here, this new imagery may allow the user to establish a thorough—and at times remark-able—conclusion.Olivier Segura ([email protected]) and Sophie Leblan
Laboratoire Français de GemmologieParis, France
ReferenceBari H. and Lam D., 2009. Pearls. Skira, Milan, 336 pp.
Figure 32: This X-ray tomography reconstruction clearly reveals the tiny shell (approximately 1.3 mm long) responsible for the pearl’s growth. Image by O. Segura.
Figure 33: Image processing was used to create this three-dimensional reconstruction of the shell in the pearl’s core. Image by O. Segura.
SYNTHETICS AND SIMULANTS
A New Peridot Imitation—Yttrium Aluminosilicate Glass
1.28
mm
0.78 mm
Peridot has become increasingly popular in the Chinese market. Within China, there are two famous peridot deposits: Jiaohe in Jilin Prov-ince and Zhangjiakou in Hebei Province. Vari-ous materials have been used to imitate peridot, such as barium-zirconium glass or lead-oxide silica glass (McClure and Reinitz, 1999; Hain-schwang, 2009).
Recently, the National Gemstone Testing Cent-er Laboratory in Beijing received a green oval modified brilliant for identification (Figure 34). The client purchased the sample as Chinese pe-ridot; it weighed 6.08 ct and measured 13 × 11 × 6 mm. Visually it resembled peridot, except for a lack of doubling of the facet junctions, and it was free of inclusions under 40× magnification.
206 The Journal of Gemmology, 35(3), 2016
Its hydrostatic SG value was 3.37, and the refrac-tometer showed a single RI of 1.661, which ruled out peridot. It exhibited a ‘Maltese cross’ pattern in the polariscope, and was inert to both long- and short-wave UV radiation.
Infrared reflectance spectroscopy revealed two bands at 962 and 476 cm−1 (Figure 35), which do not correspond to the spectrum of ordinary silica glass. Semi-quantitative EDXRF chemical analysis revealed mainly Y, Si, Pr and Al, along with minor Mg and traces of Fe, S, Mn, Cr, K, Ca, Cu and Zn. UV-Vis spectroscopy showed main absorption bands at 440 and 590 nm (Figure 36), which are caused by internal f-f transitions of Pr3+
(Zhang et al., 2009), resulting in the attractive green colour of the sample.
We identified this peridot imitation as a Pr3+-coloured yttrium aluminosilicate glass. Glass has been used to imitate gemstones for centuries. However, this is the first instance we have en-countered of yttrium aluminosilicate glass be-ing used to imitate Chinese peridot. Customers should be aware of this imitation when buying peridot in the marketplace.
Dr Wen Han ([email protected]),Dr Taijin Lu and Qian Deng
National Gems & Jewelry Technology Administrative Center, Beijing, China
ReferencesHainschwang T., 2009. Gem News International:
High-RI barium-zirconium glass imitation of peridot and other gems. Gems & Gemology, 45(4), 307–308.
McClure S.F. and Reinitz I., 1999. Gem Trade Lab Notes: Glass imitation of peridot. Gems & Gemology, 35(1), 44.
Zhang X., Li M., Liu Z., Hu Y. and Wu J., 2009. Research progress on rare earth colored [sic] and UV absorption in glass. Bulletin of the Chinese Ceramic Society, 28(6), 1208–1212.
Figure 34: This faceted 6.08 ct sample was identified as a new imitation of peridot: yttrium aluminosilicate glass. Photo by W. Han.
Infrared Spectroscopy
2000 1500 1000 500Wavenumber (cm−1)
1.2
1.0
0.8
0.6
0.4
0.2
0
Abso
rban
ce
476
962
UV-Vis Spectroscopy
400 500 600 700 800Wavelength (nm)
1.1
1.0
0.9
0.8
0.7
0.6
0.5
0.4
Abso
rban
ce
440
590
Figure 35: Infrared reflectance spectroscopy of the peridot imitation reveals bands at 962 and 476 cm−1 that are not typical of ordinary silica glass.
Figure 36: UV-Vis spectroscopy of the peridot imitation shows absorptions at 440 and 590 nm that are attributed to Pr3+.
Gem Notes
208 The Journal of Gemmology, 35(3), 2016
Gem Notes
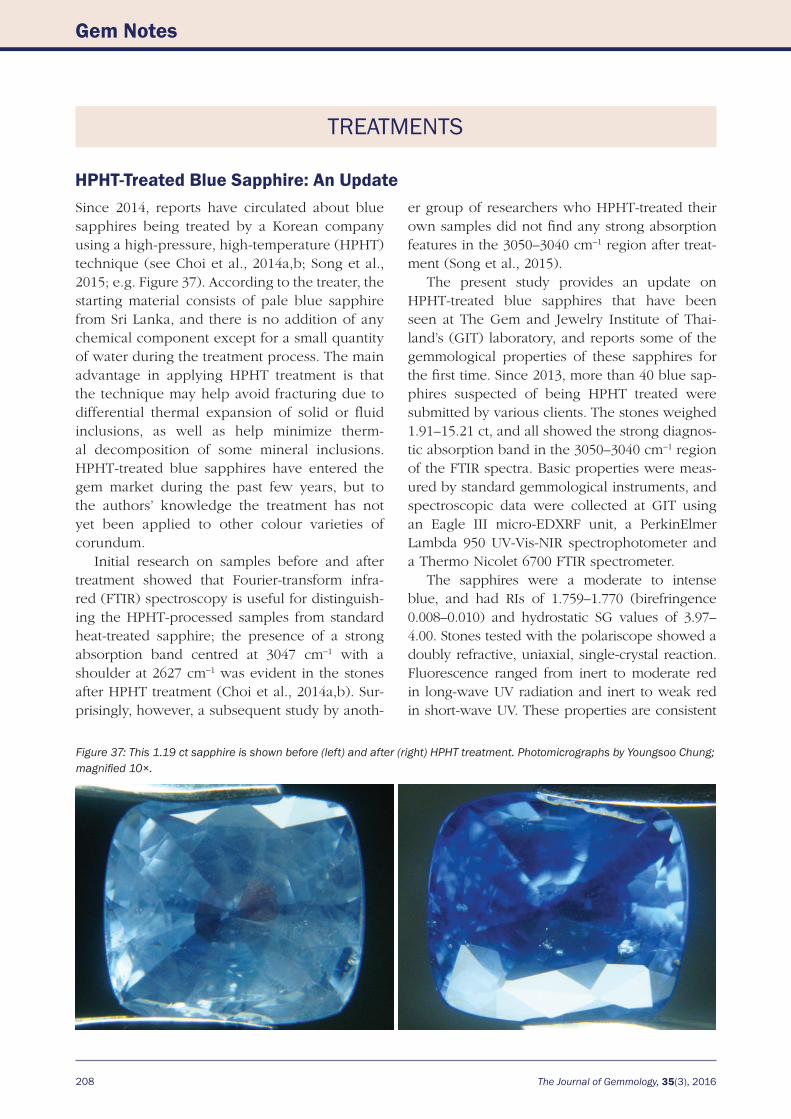
Since 2014, reports have circulated about blue sapphires being treated by a Korean company using a high-pressure, high-temperature (HPHT) technique (see Choi et al., 2014a,b; Song et al., 2015; e.g. Figure 37). According to the treater, the starting material consists of pale blue sapphire from Sri Lanka, and there is no addition of any chemical component except for a small quantity of water during the treatment process. The main advantage in applying HPHT treatment is that the technique may help avoid fracturing due to differential thermal expansion of solid or fluid inclusions, as well as help minimize therm-al decomposition of some mineral inclusions. HPHT-treated blue sapphires have entered the gem market during the past few years, but to the authors’ knowledge the treatment has not yet been applied to other colour varieties of corundum.
Initial research on samples before and after treatment showed that Fourier-transform infra-red (FTIR) spectroscopy is useful for distinguish-ing the HPHT-processed samples from standard heat-treated sapphire; the presence of a strong absorption band centred at 3047 cm−1 with a shoulder at 2627 cm−1 was evident in the stones after HPHT treatment (Choi et al., 2014a,b). Sur-prisingly, however, a subsequent study by anoth-
TREATMENTS
HPHT-Treated Blue Sapphire: An Updateer group of researchers who HPHT-treated their own samples did not find any strong absorption features in the 3050–3040 cm−1 region after treat-ment (Song et al., 2015).
The present study provides an update on HPHT-treated blue sapphires that have been seen at The Gem and Jewelry Institute of Thai-land’s (GIT) laboratory, and reports some of the gemmological properties of these sapphires for the first time. Since 2013, more than 40 blue sap-phires suspected of being HPHT treated were submitted by various clients. The stones weighed 1.91–15.21 ct, and all showed the strong diagnos-tic absorption band in the 3050–3040 cm−1 region of the FTIR spectra. Basic properties were meas-ured by standard gemmological instruments, and spectroscopic data were collected at GIT using an Eagle III micro-EDXRF unit, a PerkinElmer Lambda 950 UV-Vis-NIR spectrophotometer and a Thermo Nicolet 6700 FTIR spectrometer.
The sapphires were a moderate to intense blue, and had RIs of 1.759–1.770 (birefringence 0.008–0.010) and hydrostatic SG values of 3.97–4.00. Stones tested with the polariscope showed a doubly refractive, uniaxial, single-crystal reaction. Fluorescence ranged from inert to moderate red in long-wave UV radiation and inert to weak red in short-wave UV. These properties are consistent
Figure 37: This 1.19 ct sapphire is shown before (left) and after (right) HPHT treatment. Photomicrographs by Youngsoo Chung; magnified 10×.
Gem Notes
Gem Notes
209
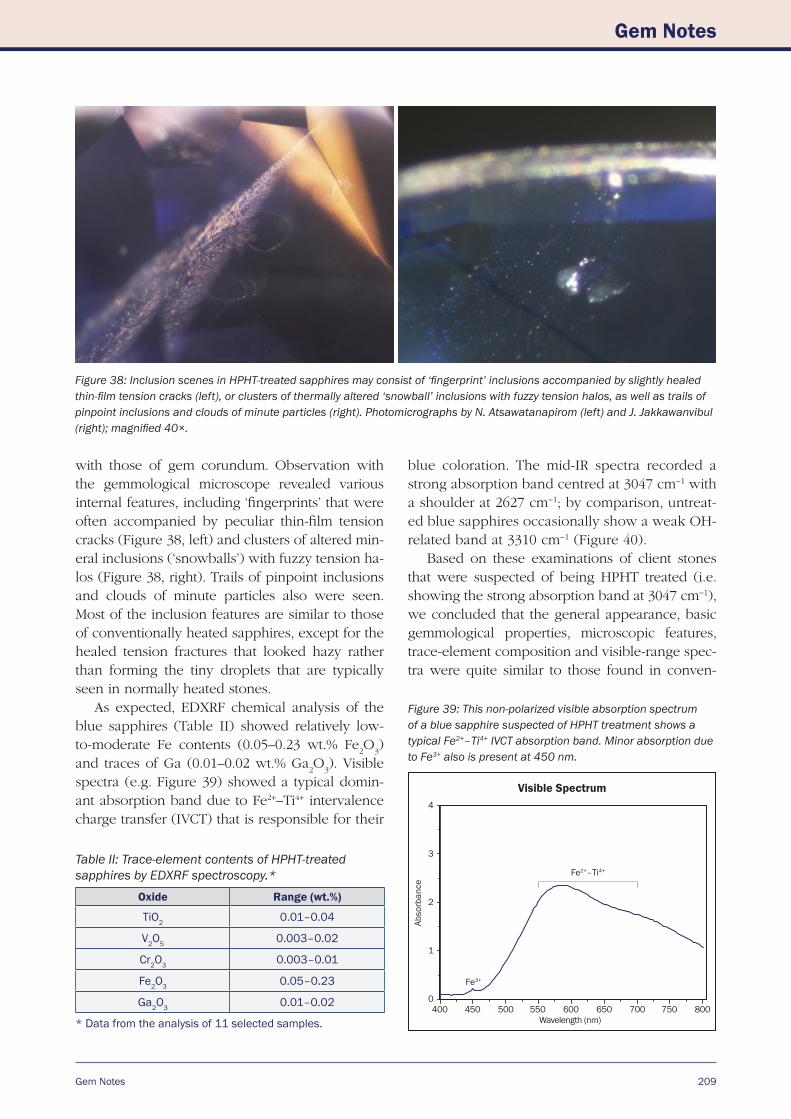
with those of gem corundum. Observation with the gemmological microscope revealed various internal features, including ‘fingerprints’ that were often accompanied by peculiar thin-film tension cracks (Figure 38, left) and clusters of altered min-eral inclusions (‘snowballs’) with fuzzy tension ha-los (Figure 38, right). Trails of pinpoint inclusions and clouds of minute particles also were seen. Most of the inclusion features are similar to those of conventionally heated sapphires, except for the healed tension fractures that looked hazy rather than forming the tiny droplets that are typically seen in normally heated stones.
As expected, EDXRF chemical analysis of the blue sapphires (Table II) showed relatively low-to-moderate Fe contents (0.05–0.23 wt.% Fe
2O
3)
and traces of Ga (0.01–0.02 wt.% Ga2O
3). Visible
spectra (e.g. Figure 39) showed a typical domin-ant absorption band due to Fe2+–Ti4+ intervalence charge transfer (IVCT) that is responsible for their
Table II: Trace-element contents of HPHT-treated sapphires by EDXRF spectroscopy.*
Oxide Range (wt.%)
TiO2 0.01–0.04
V2O5 0.003–0.02
Cr2O3 0.003–0.01
Fe2O3 0.05–0.23
Ga2O3 0.01–0.02
* Data from the analysis of 11 selected samples.
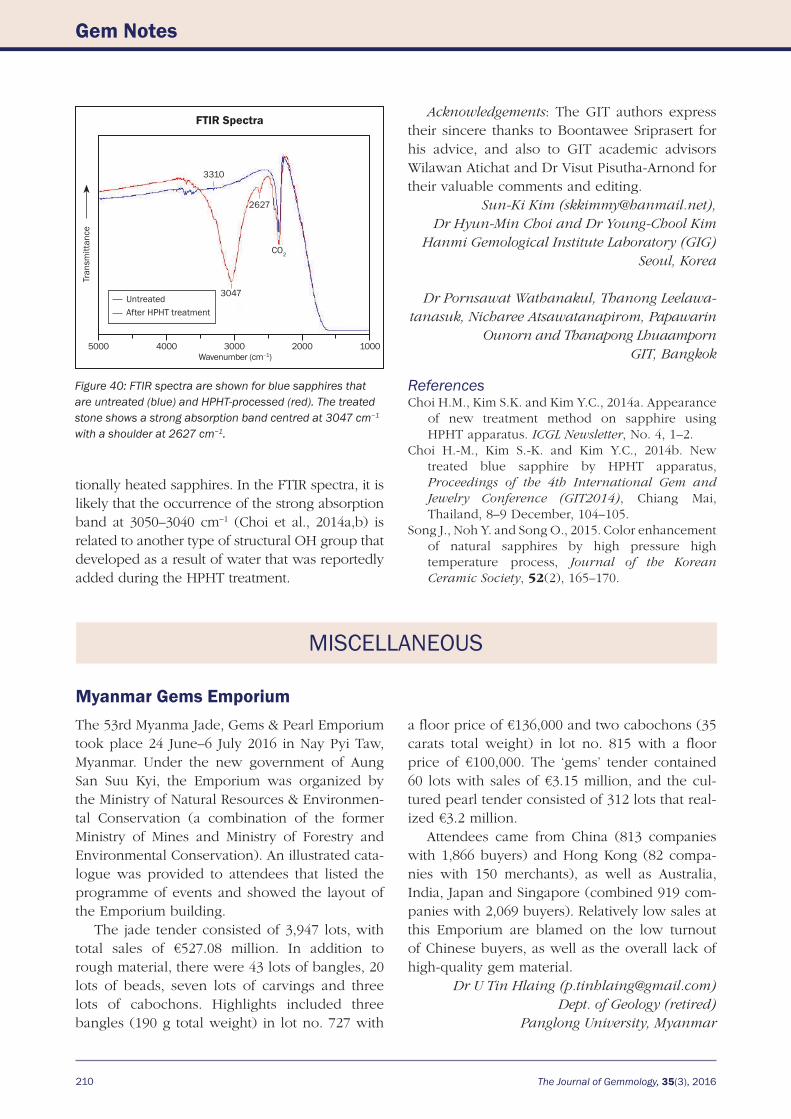
blue coloration. The mid-IR spectra recorded a strong absorption band centred at 3047 cm−1 with a shoulder at 2627 cm−1; by comparison, untreat-ed blue sapphires occasionally show a weak OH-related band at 3310 cm−1 (Figure 40).
Based on these examinations of client stones that were suspected of being HPHT treated (i.e. showing the strong absorption band at 3047 cm−1), we concluded that the general appearance, basic gemmological properties, microscopic features, trace-element composition and visible-range spec-tra were quite similar to those found in conven-
Figure 38: Inclusion scenes in HPHT-treated sapphires may consist of ‘fingerprint’ inclusions accompanied by slightly healed thin-film tension cracks (left), or clusters of thermally altered ‘snowball’ inclusions with fuzzy tension halos, as well as trails of pinpoint inclusions and clouds of minute particles (right). Photomicrographs by N. Atsawatanapirom (left) and J. Jakkawanvibul (right); magnified 40×.
400 450 500 550 600 650 700 750 8000.0
1.0
2.0
3.0
Absorba
nce
4.0
Visible Spectrum
400 450 500 550 600 650 700 750 800Wavelength (nm)
4
3
2
1
0
Abso
rban
ce
Fe2+–Ti4+
Fe3+
Figure 39: This non-polarized visible absorption spectrum of a blue sapphire suspected of HPHT treatment shows a typical Fe2+–Ti4+ IVCT absorption band. Minor absorption due to Fe3+ also is present at 450 nm.
210 The Journal of Gemmology, 35(3), 2016
Gem Notes
tionally heated sapphires. In the FTIR spectra, it is likely that the occurrence of the strong absorption band at 3050–3040 cm−1 (Choi et al., 2014a,b) is related to another type of structural OH group that developed as a result of water that was reportedly added during the HPHT treatment.
Acknowledgements: The GIT authors express their sincere thanks to Boontawee Sriprasert for his advice, and also to GIT academic advisors Wilawan Atichat and Dr Visut Pisutha-Arnond for their valuable comments and editing.
Sun-Ki Kim ([email protected]), Dr Hyun-Min Choi and Dr Young-Chool Kim
Hanmi Gemological Institute Laboratory (GIG)Seoul, Korea
Dr Pornsawat Wathanakul, Thanong Leelawa-tanasuk, Nicharee Atsawatanapirom, Papawarin
Ounorn and Thanapong LhuaampornGIT, Bangkok
ReferencesChoi H.M., Kim S.K. and Kim Y.C., 2014a. Appearance
of new treatment method on sapphire using HPHT apparatus. ICGL Newsletter, No. 4, 1–2.
Choi H.-M., Kim S.-K. and Kim Y.C., 2014b. New treated blue sapphire by HPHT apparatus, Proceedings of the 4th International Gem and Jewelry Conference (GIT2014), Chiang Mai, Thailand, 8–9 December, 104–105.
Song J., Noh Y. and Song O., 2015. Color enhancement of natural sapphires by high pressure high temperature process, Journal of the Korean Ceramic Society, 52(2), 165–170.
Figure 40: FTIR spectra are shown for blue sapphires that are untreated (blue) and HPHT-processed (red). The treated stone shows a strong absorption band centred at 3047 cm−1 with a shoulder at 2627 cm−1.
The 53rd Myanma Jade, Gems & Pearl Emporium took place 24 June–6 July 2016 in Nay Pyi Taw, Myanmar. Under the new government of Aung San Suu Kyi, the Emporium was organized by the Ministry of Natural Resources & Environmen-tal Conservation (a combination of the former Ministry of Mines and Ministry of Forestry and Environmental Conservation). An illustrated cata-logue was provided to attendees that listed the programme of events and showed the layout of the Emporium building.
The jade tender consisted of 3,947 lots, with total sales of €527.08 million. In addition to rough material, there were 43 lots of bangles, 20 lots of beads, seven lots of carvings and three lots of cabochons. Highlights included three bangles (190 g total weight) in lot no. 727 with
a floor price of €136,000 and two cabochons (35 carats total weight) in lot no. 815 with a floor price of €100,000. The ‘gems’ tender contained 60 lots with sales of €3.15 million, and the cul-tured pearl tender consisted of 312 lots that real-ized €3.2 million.
Attendees came from China (813 companies with 1,866 buyers) and Hong Kong (82 compa-nies with 150 merchants), as well as Australia, India, Japan and Singapore (combined 919 com-panies with 2,069 buyers). Relatively low sales at this Emporium are blamed on the low turnout of Chinese buyers, as well as the overall lack of high-quality gem material.
Dr U Tin Hlaing ([email protected])Dept. of Geology (retired)
Panglong University, Myanmar
MISCELLANEOUS
Myanmar Gems Emporium
FTIR Spectra
Tran
smitt
ance
5000 4000 3000 2000 1000Wavenumber (cm–1)
3310
2627
3047
CO2
UntreatedAfter HPHT treatment
Gem Notes 211
Head Office: Crown Color Ltd.
14/F, Central Building, suite 1408, 1-3 Pedder Street Central Hong Kong SAR
Tel:+852-2537-8986New York Office: + 212-223-2363 Geneva Office: +41-22-8100540
Fine Rubies, Sapphires and EmeraldsBangkok - Geneva - Hong Kong - New York
Crown Color is a proud supporter of the
Journal of Gemmology
Join us on social media to keep up-to-date with the latest news, events and offers from Gem-A
[email protected]/1GisBTP
Social Media_09-2016.indd 1 19/09/2016 14:56:49
212 The Journal of Gemmology, 35(3), 2016
Feature Article
The Journal of Gemmology, 35(3), 2016, pp. 212–223, http://dx.doi.org/10.15506/JoG.2016.35.3.212© 2016 The Gemmological Association of Great Britain
Simultaneous High Sensitivity Trace-Element and Isotopic Analysis of Gemstones Using Laser Ablation
Inductively Coupled Plasma Time-of-Flight Mass Spectrometry
Hao A. O. Wang, Michael S. Krzemnicki, Jean-Pierre Chalain, Pierre Lefèvre, Wei Zhou and Laurent E. Cartier
GemTOF, installed at the Swiss Gemmological Institute SSEF, is a next-gener-ation chemical analysis technique for gemmology: laser ablation inductively coupled plasma time-of-flight mass spectrometry (LA-ICP-TOF-MS). The system enables full elemental mass-spectrum acquisition at an ultra-high acquisition speed. Nearly all elements in the periodic table can be simultaneously acquired with low limits of detection. Major-to-trace (and even ultra-trace) element com-positions can be accurately quantified, and slight concentration differences can be distinguished. The data can be processed with multivariate statisti-cal analysis, thereby increasing the reliability of origin determination as well as the detection of potentially new diffusion treatments. Additionally, higher precision for isotopic analysis is expected than with sequential-acquisition LA-ICP-quadrupole-MS (LA-ICP-Q-MS), especially for short transient signals. Novel research directions in gemstone age dating, analysis of inclusions and chemical zoning will benefit from the advantages of this system.
IntroductionIn the past several decades, gem testing has evolved from a rather basic characterization of physical properties (e.g. RI, SG, absorption and fluorescence) into advanced materials science, using sophisticated instrumental technologies for detailed chemical and structural analyses. As gemmology is primarily an applied science, this
analytical evolution was driven by challenging issues confronting the gem trade rather than by fundamental research. From the use of X-ray radiography and X-ray diffraction to detect beaded cultured pearls in the early 20th century (Anderson, 1932), additional technological in-novations in gemmology include the chemical characterization of synthetic coloured stones by
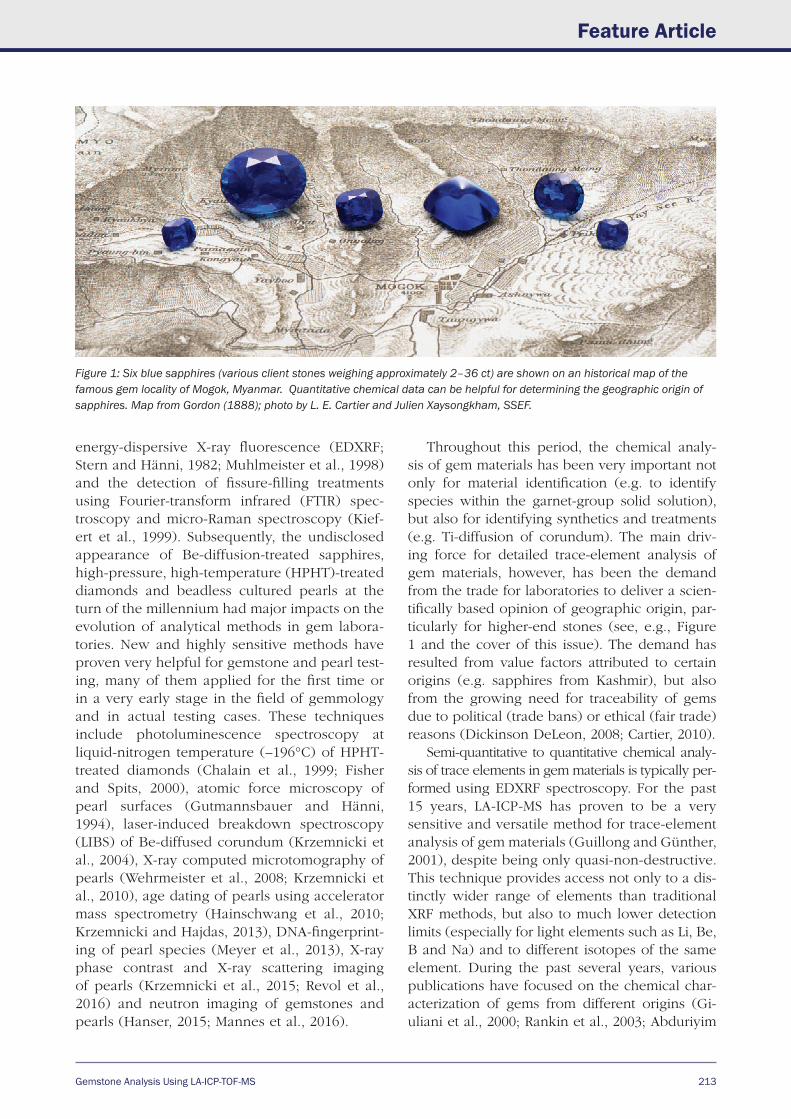
Gemstone Analysis Using LA-ICP-TOF-MS
Feature Article
213
Figure 1: Six blue sapphires (various client stones weighing approximately 2–36 ct) are shown on an historical map of the famous gem locality of Mogok, Myanmar. Quantitative chemical data can be helpful for determining the geographic origin of sapphires. Map from Gordon (1888); photo by L. E. Cartier and Julien Xaysongkham, SSEF.
energy-dispersive X-ray fluorescence (EDXRF; Stern and Hänni, 1982; Muhlmeister et al., 1998) and the detection of fissure-filling treatments using Fourier-transform infrared (FTIR) spec-troscopy and micro-Raman spectroscopy (Kief-ert et al., 1999). Subsequently, the undisclosed appearance of Be-diffusion-treated sapphires, high-pressure, high-temperature (HPHT)-treated diamonds and beadless cultured pearls at the turn of the millennium had major impacts on the evolution of analytical methods in gem labora-tories. New and highly sensitive methods have proven very helpful for gemstone and pearl test-ing, many of them applied for the first time or in a very early stage in the field of gemmology and in actual testing cases. These techniques include photoluminescence spectroscopy at liquid-nitrogen temperature (–196°C) of HPHT-treated diamonds (Chalain et al., 1999; Fisher and Spits, 2000), atomic force microscopy of pearl surfaces (Gutmannsbauer and Hänni, 1994), laser-induced breakdown spectroscopy (LIBS) of Be-diffused corundum (Krzemnicki et al., 2004), X-ray computed microtomography of pearls (Wehrmeister et al., 2008; Krzemnicki et al., 2010), age dating of pearls using accelerator mass spectrometry (Hainschwang et al., 2010; Krzemnicki and Hajdas, 2013), DNA-fingerprint-ing of pearl species (Meyer et al., 2013), X-ray phase contrast and X-ray scattering imaging of pearls (Krzemnicki et al., 2015; Revol et al., 2016) and neutron imaging of gemstones and pearls (Hanser, 2015; Mannes et al., 2016).
Throughout this period, the chemical analy-sis of gem materials has been very important not only for material identification (e.g. to identify species within the garnet-group solid solution), but also for identifying synthetics and treatments (e.g. Ti-diffusion of corundum). The main driv-ing force for detailed trace-element analysis of gem materials, however, has been the demand from the trade for laboratories to deliver a scien-tifically based opinion of geographic origin, par-ticularly for higher-end stones (see, e.g., Figure 1 and the cover of this issue). The demand has resulted from value factors attributed to certain origins (e.g. sapphires from Kashmir), but also from the growing need for traceability of gems due to political (trade bans) or ethical (fair trade) reasons (Dickinson DeLeon, 2008; Cartier, 2010).
Semi-quantitative to quantitative chemical analy-sis of trace elements in gem materials is typically per-formed using EDXRF spectroscopy. For the past 15 years, LA-ICP-MS has proven to be a very sensitive and versatile method for trace-element analysis of gem materials (Guillong and Günther, 2001), despite being only quasi-non-destructive. This technique provides access not only to a dis-tinctly wider range of elements than traditional XRF methods, but also to much lower detection limits (especially for light elements such as Li, Be, B and Na) and to different isotopes of the same element. During the past several years, various publications have focused on the chemical char-acterization of gems from different origins (Gi-uliani et al., 2000; Rankin et al., 2003; Abduriyim
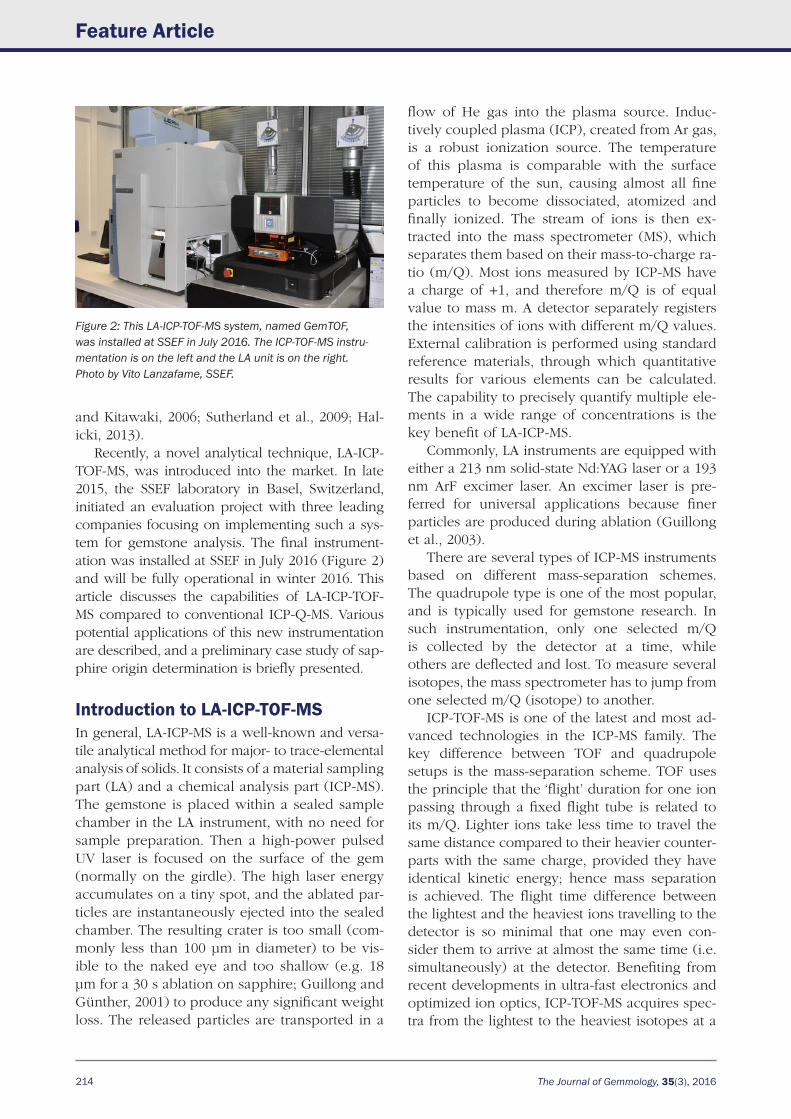
214 The Journal of Gemmology, 35(3), 2016
Feature Article
Figure 2: This LA-ICP-TOF-MS system, named GemTOF, was installed at SSEF in July 2016. The ICP-TOF-MS instru-mentation is on the left and the LA unit is on the right. Photo by Vito Lanzafame, SSEF.
and Kitawaki, 2006; Sutherland et al., 2009; Hal-icki, 2013).
Recently, a novel analytical technique, LA-ICP-TOF-MS, was introduced into the market. In late 2015, the SSEF laboratory in Basel, Switzerland, initiated an evaluation project with three leading companies focusing on implementing such a sys-tem for gemstone analysis. The final instrument-ation was installed at SSEF in July 2016 (Figure 2) and will be fully operational in winter 2016. This article discusses the capabilities of LA-ICP-TOF-MS compared to conventional ICP-Q-MS. Various potential applications of this new instrumentation are described, and a preliminary case study of sap-phire origin determination is briefly presented.
Introduction to LA-ICP-TOF-MSIn general, LA-ICP-MS is a well-known and versa-tile analytical method for major- to trace-elemental analysis of solids. It consists of a material sampling part (LA) and a chemical analysis part (ICP-MS). The gemstone is placed within a sealed sample chamber in the LA instrument, with no need for sample preparation. Then a high-power pulsed UV laser is focused on the surface of the gem (normally on the girdle). The high laser energy accumulates on a tiny spot, and the ablated par-ticles are instantaneously ejected into the sealed chamber. The resulting crater is too small (com-monly less than 100 µm in diameter) to be vis-ible to the naked eye and too shallow (e.g. 18 µm for a 30 s ablation on sapphire; Guillong and Günther, 2001) to produce any significant weight loss. The released particles are transported in a
flow of He gas into the plasma source. Induc-tively coupled plasma (ICP), created from Ar gas, is a robust ionization source. The temperature of this plasma is comparable with the surface temperature of the sun, causing almost all fine particles to become dissociated, atomized and finally ionized. The stream of ions is then ex-tracted into the mass spectrometer (MS), which separates them based on their mass-to-charge ra-tio (m/Q). Most ions measured by ICP-MS have a charge of +1, and therefore m/Q is of equal value to mass m. A detector separately registers the intensities of ions with different m/Q values. External calibration is performed using standard reference materials, through which quantitative results for various elements can be calculated. The capability to precisely quantify multiple ele-ments in a wide range of concentrations is the key benefit of LA-ICP-MS.
Commonly, LA instruments are equipped with either a 213 nm solid-state Nd:YAG laser or a 193 nm ArF excimer laser. An excimer laser is pre-ferred for universal applications because finer particles are produced during ablation (Guillong et al., 2003).
There are several types of ICP-MS instruments based on different mass-separation schemes. The quadrupole type is one of the most popular, and is typically used for gemstone research. In such instrumentation, only one selected m/Q is collected by the detector at a time, while others are deflected and lost. To measure several isotopes, the mass spectrometer has to jump from one selected m/Q (isotope) to another.
ICP-TOF-MS is one of the latest and most ad-vanced technologies in the ICP-MS family. The key difference between TOF and quadrupole setups is the mass-separation scheme. TOF uses the principle that the ‘flight’ duration for one ion passing through a fixed flight tube is related to its m/Q. Lighter ions take less time to travel the same distance compared to their heavier counter-parts with the same charge, provided they have identical kinetic energy; hence mass separation is achieved. The flight time difference between the lightest and the heaviest ions travelling to the detector is so minimal that one may even con-sider them to arrive at almost the same time (i.e. simultaneously) at the detector. Benefiting from recent developments in ultra-fast electronics and optimized ion optics, ICP-TOF-MS acquires spec-tra from the lightest to the heaviest isotopes at a
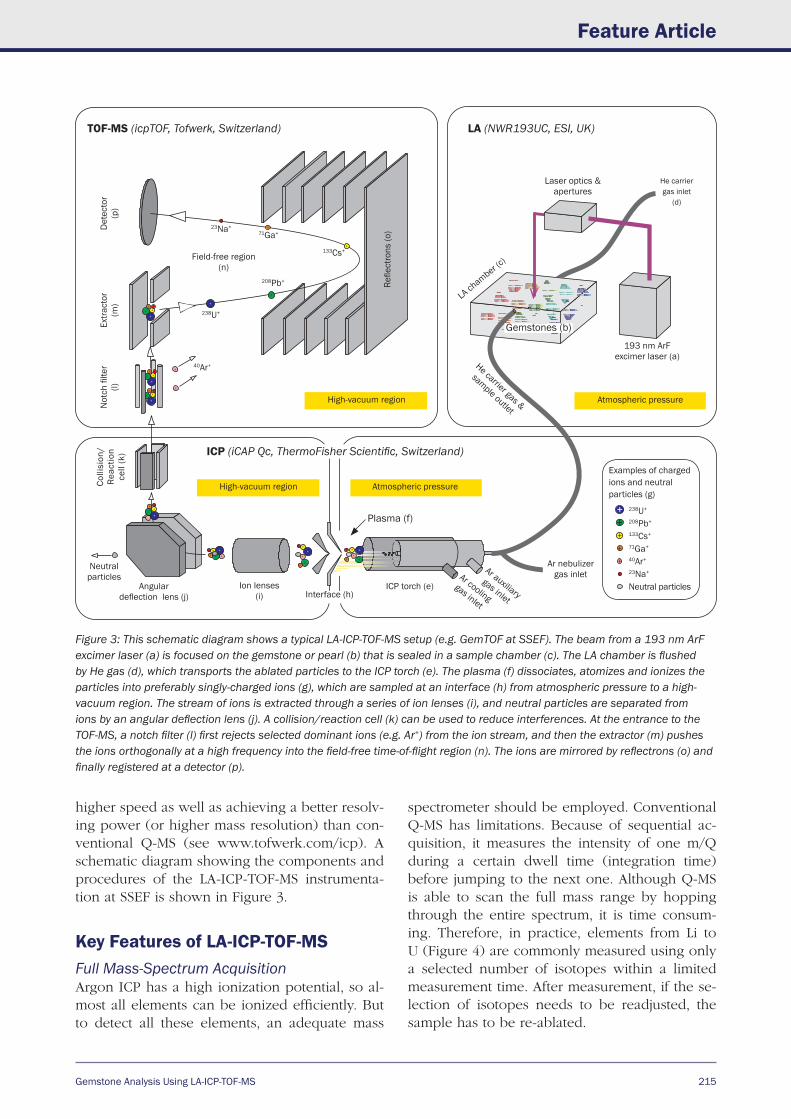
Gemstone Analysis Using LA-ICP-TOF-MS
Feature Article
215
higher speed as well as achieving a better resolv-ing power (or higher mass resolution) than con-ventional Q-MS (see www.tofwerk.com/icp). A schematic diagram showing the components and procedures of the LA-ICP-TOF-MS instrumenta-tion at SSEF is shown in Figure 3.
Key Features of LA-ICP-TOF-MSFull Mass-Spectrum AcquisitionArgon ICP has a high ionization potential, so al-most all elements can be ionized efficiently. But to detect all these elements, an adequate mass
spectrometer should be employed. Conventional Q-MS has limitations. Because of sequential ac-quisition, it measures the intensity of one m/Q during a certain dwell time (integration time) before jumping to the next one. Although Q-MS is able to scan the full mass range by hopping through the entire spectrum, it is time consum-ing. Therefore, in practice, elements from Li to U (Figure 4) are commonly measured using only a selected number of isotopes within a limited measurement time. After measurement, if the se-lection of isotopes needs to be readjusted, the sample has to be re-ablated.
Figure 3: This schematic diagram shows a typical LA-ICP-TOF-MS setup (e.g. GemTOF at SSEF). The beam from a 193 nm ArF excimer laser (a) is focused on the gemstone or pearl (b) that is sealed in a sample chamber (c). The LA chamber is flushed by He gas (d), which transports the ablated particles to the ICP torch (e). The plasma (f) dissociates, atomizes and ionizes the particles into preferably singly-charged ions (g), which are sampled at an interface (h) from atmospheric pressure to a high-vacuum region. The stream of ions is extracted through a series of ion lenses (i), and neutral particles are separated from ions by an angular deflection lens (j). A collision/reaction cell (k) can be used to reduce interferences. At the entrance to the TOF-MS, a notch filter (l) first rejects selected dominant ions (e.g. Ar+) from the ion stream, and then the extractor (m) pushes the ions orthogonally at a high frequency into the field-free time-of-flight region (n). The ions are mirrored by reflectrons (o) and finally registered at a detector (p).
Not
ch fi
lter
(l)Ex
tract
or
(m)
Det
ecto
r (p
)
Field-free region (n)
Examples of charged ions and neutral particles (g)
238U+
208Pb+
133Cs+
71Ga+
40Ar+
23Na+
Neutral particlesAr cooling
gas inlet
Ar auxiliary
gas inlet
Ar nebulizer gas inlet
Atmospheric pressureHigh-vacuum region
Plasma (f)
ICP torch (e)Interface (h)
Ion lenses (i)
Angular deflection lens (j)
Colli
sion
/Re
actio
n ce
ll (k
)
Gemstones (b)
Atmospheric pressure
193 nm ArF excimer laser (a)
He carrier gas &
sample outlet
LA chamber (c
)
He carrier gas inlet
(d)
Laser optics & apertures
Refle
ctro
ns (o
)High-vacuum region
40Ar+
133Cs+
23Na+71Ga+
208Pb+
238U+
Neutralparticles
TOF-MS (icpTOF, Tofwerk, Switzerland) LA (NWR193UC, ESI, UK)
ICP (iCAP Qc, ThermoFisher Scientific, Switzerland)
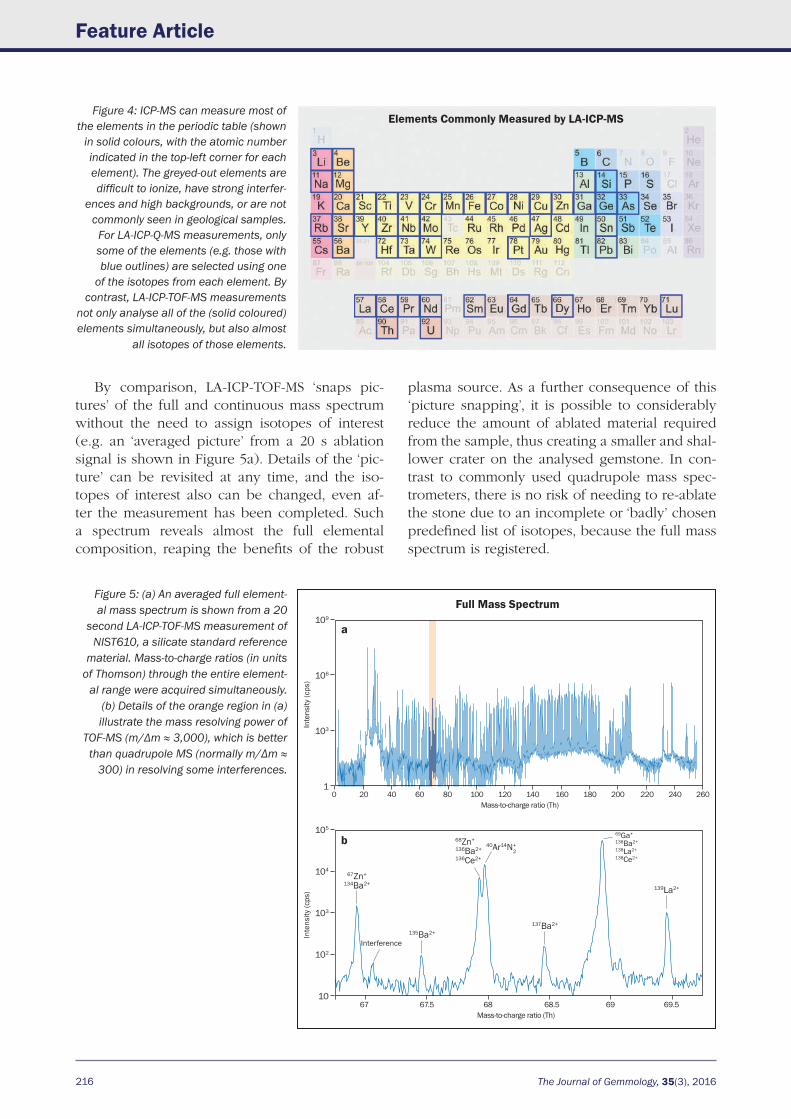
216 The Journal of Gemmology, 35(3), 2016
Feature Article
By comparison, LA-ICP-TOF-MS ‘snaps pic-tures’ of the full and continuous mass spectrum without the need to assign isotopes of interest (e.g. an ‘averaged picture’ from a 20 s ablation signal is shown in Figure 5a). Details of the ‘pic-ture’ can be revisited at any time, and the iso-topes of interest also can be changed, even af-ter the measurement has been completed. Such a spectrum reveals almost the full elemental composition, reaping the benefits of the robust
plasma source. As a further consequence of this ‘picture snapping’, it is possible to considerably reduce the amount of ablated material required from the sample, thus creating a smaller and shal-lower crater on the analysed gemstone. In con-trast to commonly used quadrupole mass spec-trometers, there is no risk of needing to re-ablate the stone due to an incomplete or ‘badly’ chosen predefined list of isotopes, because the full mass spectrum is registered.
Figure 4: ICP-MS can measure most of the elements in the periodic table (shown
in solid colours, with the atomic number indicated in the top-left corner for each element). The greyed-out elements are difficult to ionize, have strong interfer-
ences and high backgrounds, or are not commonly seen in geological samples.
For LA-ICP-Q-MS measurements, only some of the elements (e.g. those with blue outlines) are selected using one
of the isotopes from each element. By contrast, LA-ICP-TOF-MS measurements
not only analyse all of the (solid coloured) elements simultaneously, but also almost
all isotopes of those elements.
Elements Commonly Measured by LA-ICP-MS
a
Full Mass Spectrum
Inte
nsity
(cps
)
109
106
103
10 20 40 60 80 100 120 140 160 180 200 220 240 260
Mass-to-charge ratio (Th)
b
Inte
nsity
(cps
)
105
104
103
102
10 67 67.5 68 68.5 69 69.5
Mass-to-charge ratio (Th)
67Zn+
134Ba2+
135Ba2+
Interference
137Ba2+
68Zn+
136Ba2+
136Ce2+
40Ar14N2+
69Ga+
138Ba2+
138La2+
138Ce2+
139La2+
Figure 5: (a) An averaged full element-al mass spectrum is shown from a 20
second LA-ICP-TOF-MS measurement of NIST610, a silicate standard reference
material. Mass-to-charge ratios (in units of Thomson) through the entire element-
al range were acquired simultaneously. (b) Details of the orange region in (a) illustrate the mass resolving power of
TOF-MS (m/Δm ≈ 3,000), which is better than quadrupole MS (normally m/Δm ≈
300) in resolving some interferences.
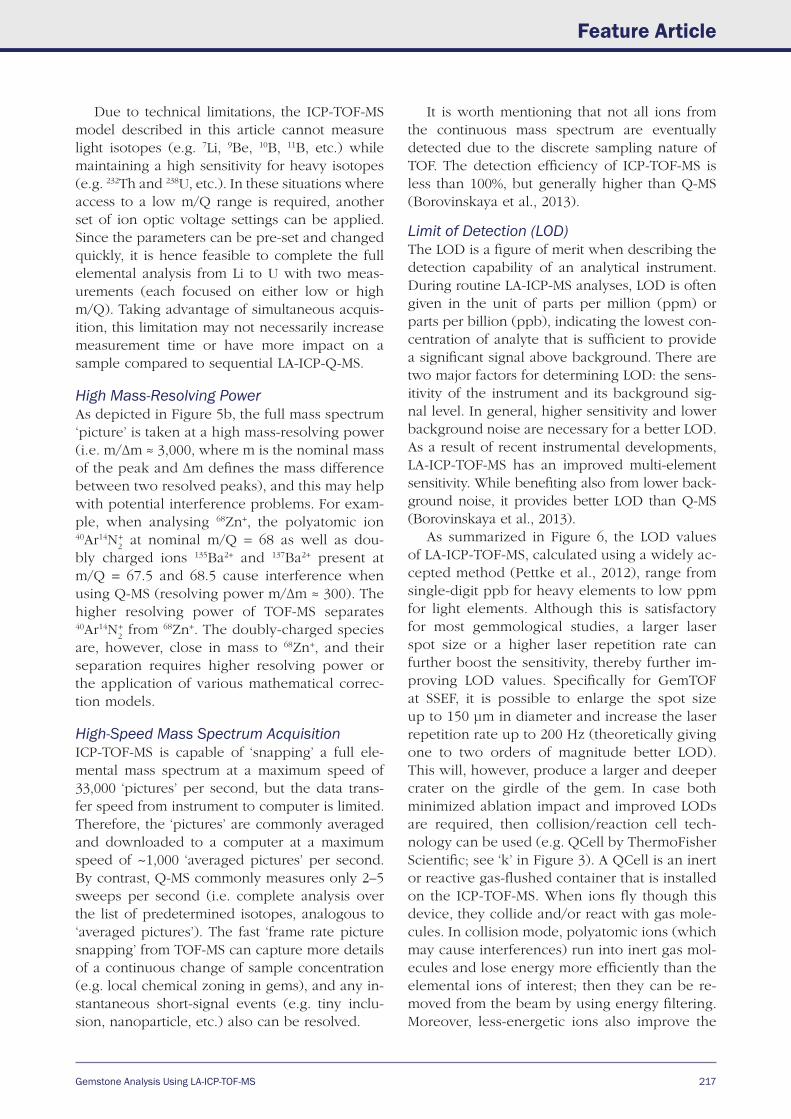
Gemstone Analysis Using LA-ICP-TOF-MS
Feature Article
217
Due to technical limitations, the ICP-TOF-MS model described in this article cannot measure light isotopes (e.g. 7Li, 9Be, 10B, 11B, etc.) while maintaining a high sensitivity for heavy isotopes (e.g. 232Th and 238U, etc.). In these situations where access to a low m/Q range is required, another set of ion optic voltage settings can be applied. Since the parameters can be pre-set and changed quickly, it is hence feasible to complete the full elemental analysis from Li to U with two meas-urements (each focused on either low or high m/Q). Taking advantage of simultaneous acquis-ition, this limitation may not necessarily increase measurement time or have more impact on a sample compared to sequential LA-ICP-Q-MS.
High Mass-Resolving PowerAs depicted in Figure 5b, the full mass spectrum ‘picture’ is taken at a high mass-resolving power (i.e. m/Δm ≈ 3,000, where m is the nominal mass of the peak and Δm defines the mass difference between two resolved peaks), and this may help with potential interference problems. For exam-ple, when analysing 68Zn+, the polyatomic ion 40Ar14N
2+ at nominal m/Q = 68 as well as dou-
bly charged ions 135Ba2+ and 137Ba2+ present at m/Q = 67.5 and 68.5 cause interference when using Q-MS (resolving power m/Δm ≈ 300). The higher resolving power of TOF-MS separates 40Ar14N
2+ from 68Zn+. The doubly-charged species
are, however, close in mass to 68Zn+, and their separation requires higher resolving power or the application of various mathematical correc-tion models.
High-Speed Mass Spectrum AcquisitionICP-TOF-MS is capable of ‘snapping’ a full ele-mental mass spectrum at a maximum speed of 33,000 ‘pictures’ per second, but the data trans-fer speed from instrument to computer is limited. Therefore, the ‘pictures’ are commonly averaged and downloaded to a computer at a maximum speed of ~1,000 ‘averaged pictures’ per second. By contrast, Q-MS commonly measures only 2–5 sweeps per second (i.e. complete analysis over the list of predetermined isotopes, analogous to ‘averaged pictures’). The fast ‘frame rate picture snapping’ from TOF-MS can capture more details of a continuous change of sample concentration (e.g. local chemical zoning in gems), and any in-stantaneous short-signal events (e.g. tiny inclu-sion, nanoparticle, etc.) also can be resolved.
It is worth mentioning that not all ions from the continuous mass spectrum are eventually detected due to the discrete sampling nature of TOF. The detection efficiency of ICP-TOF-MS is less than 100%, but generally higher than Q-MS (Borovinskaya et al., 2013).
Limit of Detection (LOD)The LOD is a figure of merit when describing the detection capability of an analytical instrument. During routine LA-ICP-MS analyses, LOD is often given in the unit of parts per million (ppm) or parts per billion (ppb), indicating the lowest con-centration of analyte that is sufficient to provide a significant signal above background. There are two major factors for determining LOD: the sens-itivity of the instrument and its background sig-nal level. In general, higher sensitivity and lower background noise are necessary for a better LOD. As a result of recent instrumental developments, LA-ICP-TOF-MS has an improved multi-element sensitivity. While benefiting also from lower back-ground noise, it provides better LOD than Q-MS (Borovinskaya et al., 2013).
As summarized in Figure 6, the LOD values of LA-ICP-TOF-MS, calculated using a widely ac-cepted method (Pettke et al., 2012), range from single-digit ppb for heavy elements to low ppm for light elements. Although this is satisfactory for most gemmological studies, a larger laser spot size or a higher laser repetition rate can further boost the sensitivity, thereby further im-proving LOD values. Specifically for GemTOF at SSEF, it is possible to enlarge the spot size up to 150 µm in diameter and increase the laser repetition rate up to 200 Hz (theoretically giving one to two orders of magnitude better LOD). This will, however, produce a larger and deeper crater on the girdle of the gem. In case both minimized ablation impact and improved LODs are required, then collision/reaction cell tech-nology can be used (e.g. QCell by ThermoFisher Scientific; see ‘k’ in Figure 3). A QCell is an inert or reactive gas-flushed container that is installed on the ICP-TOF-MS. When ions fly though this device, they collide and/or react with gas mole-cules. In collision mode, polyatomic ions (which may cause interferences) run into inert gas mol-ecules and lose energy more efficiently than the elemental ions of interest; then they can be re-moved from the beam by using energy filtering. Moreover, less-energetic ions also improve the
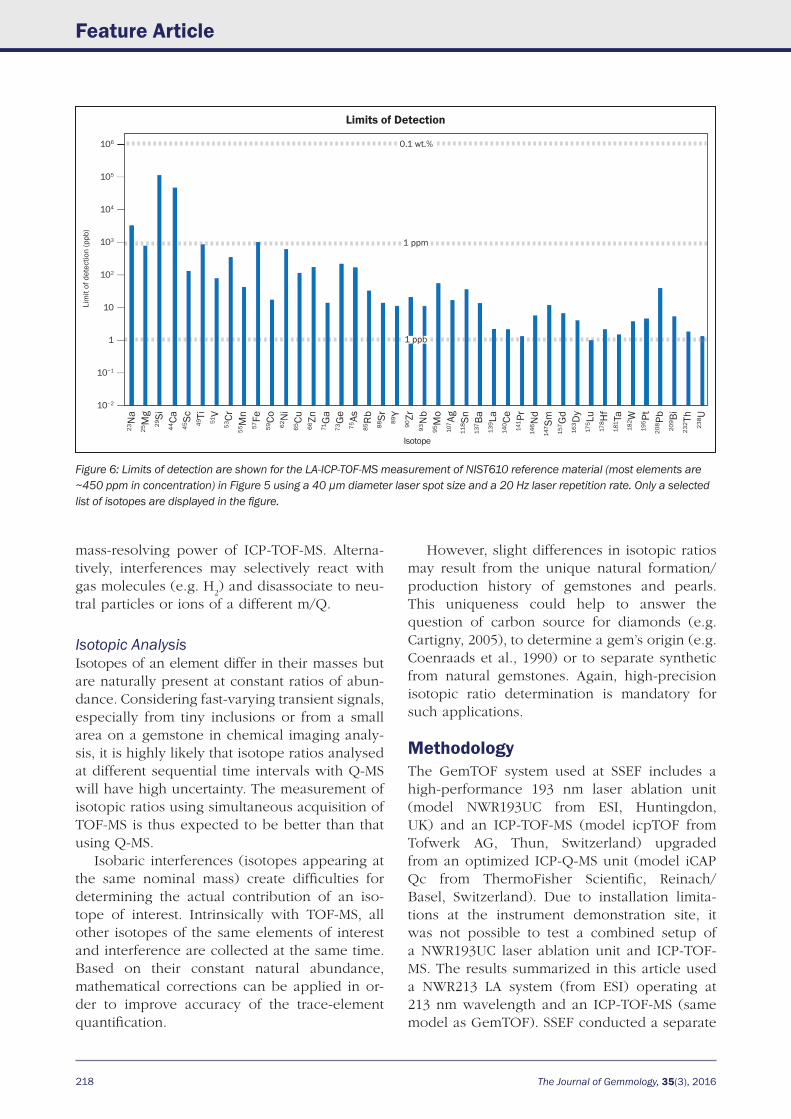
218 The Journal of Gemmology, 35(3), 2016
Feature Article
mass-resolving power of ICP-TOF-MS. Alterna-tively, interferences may selectively react with gas molecules (e.g. H
2) and disassociate to neu-
tral particles or ions of a different m/Q.
Isotopic AnalysisIsotopes of an element differ in their masses but are naturally present at constant ratios of abun-dance. Considering fast-varying transient signals, especially from tiny inclusions or from a small area on a gemstone in chemical imaging analy-sis, it is highly likely that isotope ratios analysed at different sequential time intervals with Q-MS will have high uncertainty. The measurement of isotopic ratios using simultaneous acquisition of TOF-MS is thus expected to be better than that using Q-MS.
Isobaric interferences (isotopes appearing at the same nominal mass) create difficulties for determining the actual contribution of an iso-tope of interest. Intrinsically with TOF-MS, all other isotopes of the same elements of interest and interference are collected at the same time. Based on their constant natural abundance, mathematical corrections can be applied in or-der to improve accuracy of the trace-element quantification.
However, slight differences in isotopic ratios may result from the unique natural formation/production history of gemstones and pearls. This uniqueness could help to answer the question of carbon source for diamonds (e.g. Cartigny, 2005), to determine a gem’s origin (e.g. Coenraads et al., 1990) or to separate synthetic from natural gemstones. Again, high-precision isotopic ratio determination is mandatory for such applications.
MethodologyThe GemTOF system used at SSEF includes a high-performance 193 nm laser ablation unit (model NWR193UC from ESI, Huntingdon, UK) and an ICP-TOF-MS (model icpTOF from Tofwerk AG, Thun, Switzerland) upgraded from an optimized ICP-Q-MS unit (model iCAP Qc from ThermoFisher Scientific, Reinach/Basel, Switzerland). Due to installation limita-tions at the instrument demonstration site, it was not possible to test a combined setup of a NWR193UC laser ablation unit and ICP-TOF-MS. The results summarized in this article used a NWR213 LA system (from ESI) operating at 213 nm wavelength and an ICP-TOF-MS (same model as GemTOF). SSEF conducted a separate
Figure 6: Limits of detection are shown for the LA-ICP-TOF-MS measurement of NIST610 reference material (most elements are ~450 ppm in concentration) in Figure 5 using a 40 µm diameter laser spot size and a 20 Hz laser repetition rate. Only a selected list of isotopes are displayed in the figure.
23N
a25
Mg
29Si
44Ca
45Sc
49Ti
51V
53Cr
55M
n57
Fe59
Co62
Ni
65Cu
66Zn
71G
a73
Ge
75As
85Rb
88Sr 89Y
90Zr
93N
b95
Mo
107 A
g11
8 Sn
137 B
a13
9 La
140 C
e14
1 Pr
146 N
d14
7 Sm
157 G
d16
3 Dy
175 L
u17
8 Hf
181 T
a18
2 W19
5 Pt
208 P
b20
9 Bi
232 T
h23
8 U
Limits of Detection
106
105
104
103
102
10
1
10−1
10−2
Lim
it of
det
ectio
n (p
pb)
Isotope
0.1 wt.%
1 ppm
1 ppb
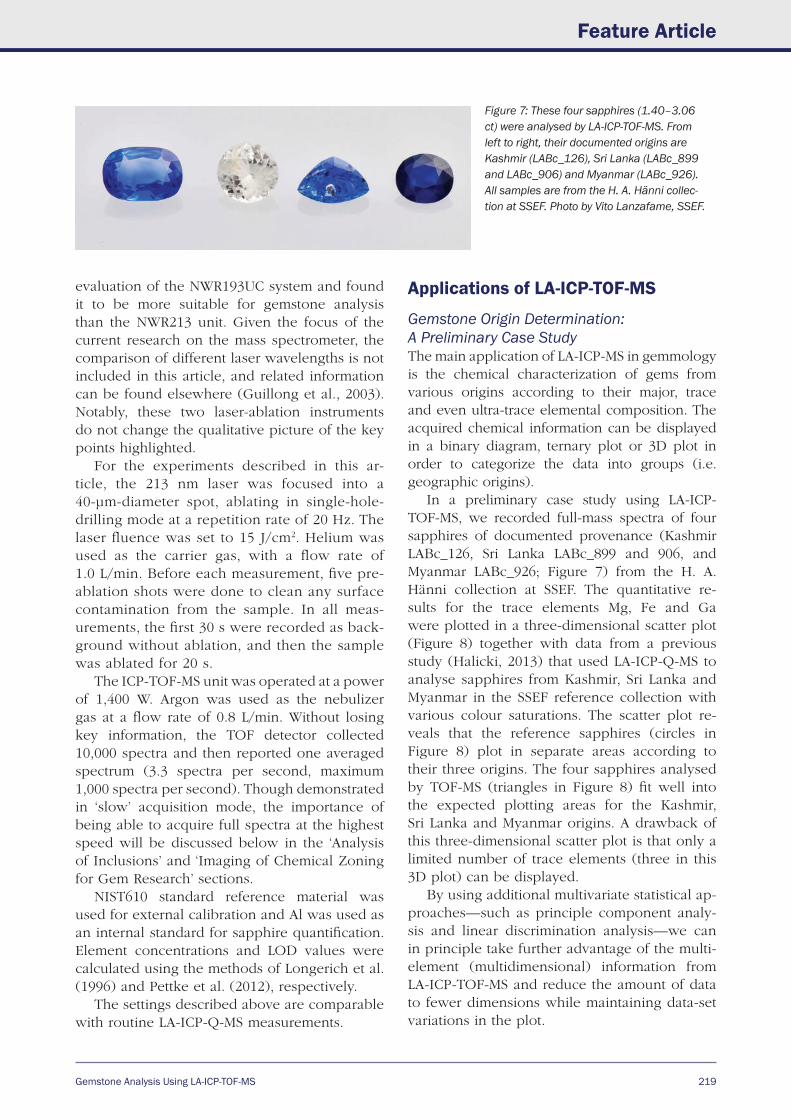
Gemstone Analysis Using LA-ICP-TOF-MS
Feature Article
219
evaluation of the NWR193UC system and found it to be more suitable for gemstone analysis than the NWR213 unit. Given the focus of the current research on the mass spectrometer, the comparison of different laser wavelengths is not included in this article, and related information can be found elsewhere (Guillong et al., 2003). Notably, these two laser-ablation instruments do not change the qualitative picture of the key points highlighted.
For the experiments described in this ar-ticle, the 213 nm laser was focused into a 40-µm-diameter spot, ablating in single-hole-drilling mode at a repetition rate of 20 Hz. The laser fluence was set to 15 J/cm2. Helium was used as the carrier gas, with a flow rate of 1.0 L/min. Before each measurement, five pre-ablation shots were done to clean any surface contamination from the sample. In all meas-urements, the first 30 s were recorded as back-ground without ablation, and then the sample was ablated for 20 s.
The ICP-TOF-MS unit was operated at a power of 1,400 W. Argon was used as the nebulizer gas at a flow rate of 0.8 L/min. Without losing key information, the TOF detector collected 10,000 spectra and then reported one averaged spectrum (3.3 spectra per second, maximum 1,000 spectra per second). Though demonstrated in ‘slow’ acquisition mode, the importance of being able to acquire full spectra at the highest speed will be discussed below in the ‘Analysis of Inclusions’ and ‘Imaging of Chemical Zoning for Gem Research’ sections.
NIST610 standard reference material was used for external calibration and Al was used as an internal standard for sapphire quantification. Element concentrations and LOD values were calculated using the methods of Longerich et al. (1996) and Pettke et al. (2012), respectively.
The settings described above are comparable with routine LA-ICP-Q-MS measurements.
Applications of LA-ICP-TOF-MS
Gemstone Origin Determination: A Preliminary Case StudyThe main application of LA-ICP-MS in gemmology is the chemical characterization of gems from various origins according to their major, trace and even ultra-trace elemental composition. The acquired chemical information can be displayed in a binary diagram, ternary plot or 3D plot in order to categorize the data into groups (i.e. geographic origins).
In a preliminary case study using LA-ICP-TOF-MS, we recorded full-mass spectra of four sapphires of documented provenance (Kashmir LABc_126, Sri Lanka LABc_899 and 906, and Myanmar LABc_926; Figure 7) from the H. A. Hänni collection at SSEF. The quantitative re-sults for the trace elements Mg, Fe and Ga were plotted in a three-dimensional scatter plot (Figure 8) together with data from a previous study (Halicki, 2013) that used LA-ICP-Q-MS to analyse sapphires from Kashmir, Sri Lanka and Myanmar in the SSEF reference collection with various colour saturations. The scatter plot re-veals that the reference sapphires (circles in Figure 8) plot in separate areas according to their three origins. The four sapphires analysed by TOF-MS (triangles in Figure 8) fit well into the expected plotting areas for the Kashmir, Sri Lanka and Myanmar origins. A drawback of this three-dimensional scatter plot is that only a limited number of trace elements (three in this 3D plot) can be displayed.
By using additional multivariate statistical ap-proaches—such as principle component analy-sis and linear discrimination analysis—we can in principle take further advantage of the multi-element (multidimensional) information from LA-ICP-TOF-MS and reduce the amount of data to fewer dimensions while maintaining data-set variations in the plot.
Figure 7: These four sapphires (1.40–3.06 ct) were analysed by LA-ICP-TOF-MS. From left to right, their documented origins are Kashmir (LABc_126), Sri Lanka (LABc_899 and LABc_906) and Myanmar (LABc_926). All samples are from the H. A. Hänni collec-tion at SSEF. Photo by Vito Lanzafame, SSEF.
220 The Journal of Gemmology, 35(3), 2016
Feature Article
Detecting Diffusion Treatments or CoatingsLA-ICP-Q-MS measures a set of preselected ele-ments/isotopes of interest, and ignores all oth-ers. This involves choosing the elements/isotopes prior to analysis, and thus one may—by lack of knowledge—omit a crucial element, especially in the case of a previously unknown diffusion treatment or coating. However, LA-ICP-TOF-MS collects all information in the full mass spectrum with no information loss. It is therefore perfectly adapted to detect new and undisclosed chemical treatments. And thus it may help avoid an un-prepared situation for gem laboratories such as when Be diffusion-treated corundum entered the market (Emmett et al., 2003).
Analysis of InclusionsMost gemstones contain various types of inclu-sions, which may provide key information about the formation conditions of the sample in a minute volume. If the laser is used to analyse a surface-reaching inclusion or to ablate through a shallow surface layer of the host gem to reach an inclusion, such information can be registered by the ICP-MS. The sampling of inclusions by the laser usually lasts for only a very short time (ranging from less than a second to a few seconds of ablation time), as inclusions are commonly very small. The short signal interval often is too
brief for complete sequential acquisition of all isotopes of interest with one sweep using Q-MS. However, since TOF-MS offers simultaneous acquisition at a very high speed, hundreds of full-mass spectra can be collected from a tiny inclusion with only <0.5 s of ablation time. Consequently, TOF-MS provides more accurate concentrations for specific elements and a more reproducible multi-element quantification of the chemical composition of a tiny inclusion in a complex matrix such as a gemstone.
Geological Age DatingSome elements in nature have constant ratios for their isotopes (only stable isotopes), while others have one or more radiogenic isotopes, which results in a steady change of their isotopic ratios over time due to the radioactive decay from parent to daughter isotopes. The decay process is related to the half-life of the parent radiogenic isotope. By measuring the ratio of the daughter-to-parent isotopes, the elapsed time or age can be calculated using the known half-life constant for the radiogenic pair.
The widely used U-Pb dating system (‘geolog-ical clock’) uses daughter-parent radiogenic pairs of 206Pb/238U and 207Pb/235U. Zircon is by far the most useful mineral for age dating, as it contains U but no Pb when it forms, with limited contami-
Figure 8: This three-dimensional scatter plot shows quantitative LA-ICP-TOF-MS
results for the sapphires in Figure 7, together with data for SSEF reference
sapphires from Kashmir, Sri Lanka and Myanmar. Trace-element concentrations
of Mg, Fe and Ga are displayed using logarithmic scales. Additional plots of
this data, seen from different directions, are available in the online data
depository on The Journal’s website.
Kashmir databaseSri Lanka databaseMyanmar databaseLABc_126 (Kashmir)LABc_899 (Sri Lanka)LABc_906 (Sri Lanka)LABc_926 (Myanmar)
104
103
102Fe (ppm)
102
10103
102
10
1 Mg (ppm)
Ga (p
pm)
3D Scatter Plot
Gemstone Analysis Using LA-ICP-TOF-MS
Feature Article
221
nation from host rocks after formation. Age dat-ing of surface or near-surface zircon inclusions in gem corundum (so far mostly sapphires) has been studied (Coenraads et al., 1990; Sutherland et al., 2002, 2008; Graham et al., 2008). More re-cently, age dating of zircon inclusions analysed by LA-ICP-Q-MS was performed on faceted sap-phires from highly relevant origins to the gem trade (e.g. Link, 2015). These studies show that age dating can be used as a valuable tool for origin determination in gemmological testing, re-flecting different formation times for sapphires from particular geological contexts. However, to precisely determine geological age, ratios of par-ent and daughter isotopes need to be measured at a high reproducibility. At the same time, inter-fering isotopes from the geological background of a given sample must be monitored and used to correct the ratio of radiogenic isotopes. As dis-cussed previously, higher-precision isotopic ratios are expected when possible interfering isotopes are measured simultaneously by LA-ICP-TOF-MS. Therefore, this technique can be quite suitable for age dating, especially when the zircon inclu-sions are minute.
Besides a sensitive mass spectrometer, precise age dating relies on proper standard reference ma-terials as well as corrections for laser ablation arte-facts (e.g. fractionation). This must be addressed regardless of whether TOF-MS or Q-MS is used.
Imaging of Chemical Zoning for Gem ResearchThe formation of gem materials is a complex pro-cess both spatially and temporally. Chemical (and colour) zoning is common, caused by intrinsic (e.g. oscillatory growth zoning) or extrinsic (e.g. change of rock chemistry due to fluid infiltration) factors. Detailed mapping of elemental distribu-tion may provide valuable information about for-mation kinetics that cannot be readily perceived based on just a few analytical spots. Quantitative imaging of trace-element distribution thus can be a powerful tool, particularly at high spatial resolu-tion, such as from using homogenized 10 µm (or even smaller) laser spots. The amount of ablated material from such a tiny laser spot is minute and provides a brief transient signal. By controlling the ablation process, it is possible to gain two-dimensional or even three-dimensional elemental distribution images (Burger et al., 2015). Hence LA-ICP-TOF-MS is preferred for chemical map-ping at high spatial resolution.
Conclusion and OutlookThe Swiss Gemmological Institute SSEF recent-ly installed an LA-ICP-TOF-MS system, named GemTOF. This system is equipped with a 193 nm LA unit and an ICP-TOF-MS instrument.
LA-ICP-TOF-MS is a relatively new and highly sensitive technique for the chemical analysis of gemstones and pearls. This article discusses the advantages, compared to LA-ICP-Q-MS, as well as limitations of this technique. The main advantage is the simultaneous acquisition of full elemental mass spectra with high mass-resolving power and ultra-high acquisition speed. ICP-TOF-MS does not jump from one mass to the next through a series of preselected isotopes, as Q-MS does. Therefore, it is not necessary to preselect isotopes of interest, which requires assumptions about the trace-element composition of a sample and care-ful consideration of possible peak interferences before the measurement is performed. Since a full mass spectrum is recorded, TOF-MS allows adjustments for the isotope of interest, even after ablation and analysis, in contrast to Q-MS where re-ablation would be needed.
LA-ICP-TOF-MS yields high-quality elemental analyses, produces multidimensional data and feeds the database for statistical analysis. The combination of improved sensitivity and low background noise guarantees a superior limit of detection for heavy elements in single-digit ppb and for light elements in low ppm concentrations. In addition to routine measurements, this new and sophisticated analytical method complements other gemmological testing instruments. This will enhance applications such as trace-element char-acterization of gemstones and pearls for origin determination and treatment detection, and will open new research opportunities for age dat-ing, inclusion studies and high-spatial-resolution chemical mapping of gems.
ReferencesAbduriyim A. and Kitawaki H., 2006. Determination
of the origin of blue sapphire using laser ablation inductively coupled plasma mass spectrometry (LA-ICP-MS). Journal of Gemmology, 30(1), 23–36, http://dx.doi.org/10.15506/JoG.2006.30.1.23.
Anderson B.W., 1932. The use of X-rays in the study of pearls. British Journal of Radiology, 5(49), 57–64.
Borovinskaya O., Hattendorf B., Tanner M., Gschwind S. and Günther D., 2013. A prototype of a new inductively coupled plasma time-of-flight mass
222 The Journal of Gemmology, 35(3), 2016
Feature Article
spectrometer providing temporally resolved, multi-element detection of short signals generated by single particles and droplets. Journal of Analytical Atomic Spectrometry, 28(2), 226–233, http://dx.doi.org/10.1039/c2ja30227f.
Burger M., Gundlach-Graham A., Allner S., Schwarz G., Wang H.A.O., Gyr L., Burgener S., Hattendorf B., Grolimund D. and Günther D., 2015. High-speed, high-resolution, multielemental LA-ICP-TOFMS imaging: Part II. Critical evaluation of quantitative three-dimensional imaging of major, minor, and trace elements in geological samples. Analytical Chemistry, 87(16), 8259–8267, http://dx.doi.org/10.1021/acs.analchem.5b01977.
Cartier L.E., 2010. Environmental stewardship in gemstone mining: Quo vadis? InColor, No. 15, Fall/Winter, 2–9.
Cartigny P., 2005. Stable isotopes and the origin of diamond. Elements, 1(2), 79–84, http://dx.doi.org/10.2113/gselements.1.2.79.
Chalain J.-P., Fritsch E. and Hänni H.A., 1999. Detection of GE POL diamonds: A first stage. Revue de Gemmologie AFG, 138(9), 30–33.
Coenraads R.R., Sutherland F.L. and Kinny P.D., 1990. The origin of sapphires: U-Pb dating of zircon inclusions sheds new light. Mineralogical Magazine, 54(374), 113–122, http://dx.doi.org/10. 1180/minmag.1990.054.374.13.
Dickinson DeLeon S.W., 2008. Jewels of Responsibility from Mines to Markets: Comparative Case Analysis in Burma, Madagascar and Colombia. M.S. thesis, University of Vermont, Burlington, USA, 190 pp.
Emmett J.L., Scarratt K., McClure S.F., Moses T., Douthit T.R., Hughes R., Novak S., Shigley J.E., Wang W., Bordelon O. and Kane R.E., 2003. Beryllium diffusion of ruby and sapphire. Gems & Gemology, 39(2), 84–135, http://dx.doi.org/10.5741/gems.39. 2.84.
Fisher D. and Spits R.A., 2000. Spectroscopic evidence of GE POL HPHT-treated natural type IIa diamonds. Gems & Gemology, 36(1), 42–49, http://dx.doi.org/10.5741/gems.36.1.42.
Giuliani G., Chaussidon M., Schubnel H.-J., Piat D.H., Rollion-Bard C., France-Lanord C., Giard D., de Narvaez D. and Rondeau B., 2000. Oxygen isotopes and emerald trade routes since antiquity. Science, 287(5453), 631–633, http://dx.doi.org/10.1126/science.287.5453.631.
Gordon R., 1888. On the ruby mines near Mogok, Burma. Proceedings of the Royal Geographical Society and Monthly Record of Geography, 10(5), 261–275, http://dx.doi.org/10.2307/1801309.
Graham I., Sutherland L., Zaw K., Nechaev V. and Khanchuk A., 2008. Advances in our understanding of the gem corundum deposits of the West Pacific continental margins intraplate basaltic fields. Ore Geology Reviews, 34(1–2), 200–215, http://dx.doi.org/10.1016/j.oregeorev.2008.04.006.
Guillong M. and Günther D., 2001. Quasi ‘non-de-structive’ laser ablation-inductively coupled plasma-mass spectrometry fingerprinting of sapphires. Spectrochimica Acta Part B: Atomic Spectroscopy, 56(7), 1219–1231, http://dx.doi.org/ 10.1016/s0584-8547(01)00185-9.
Guillong M., Horn I. and Günther D., 2003. A com-parison of 266 nm, 213 nm and 193 nm produced from a single solid state Nd:YAG laser for laser ablation ICP-MS. Journal of Analytical Atomic Spectrometry, 18(10), 1224–1230, http://dx.doi.org/10.1039/b305434a.
Gutmannsbauer W. and Hänni H.A., 1994. Structural and chemical investigations on shells and pearls of nacre forming salt- and fresh-water bivalve molluscs. Journal of Gemmology, 24(4), 241–252, http://dx.doi.org/10.15506/JoG.1994.24.4.241.
Hainschwang T., Hochstrasser T., Hajdas I. and Keut-schegger W., 2010. A cautionary tale about a little-known type of non-nacreous calcareous concretion produced by the Magilus antiquus marine snail. Journal of Gemmology, 32(1–4), 15–22, http://dx.doi.org/10.15506/JoG.2010.32.1-4.15.
Halicki P., 2013. Part I: Chemical Characterisation of Gem-Quality Sapphires from Metamorphic and Magmatic Host Rocks: LA-ICP-MS Study. M.S. thesis, University of Basel, Switzerland, 180 pp.
Hanser C., 2015. Comparison of Imaging Techniques for the Analysis of Internal Structures of Pearls. M.S. thesis, University of Freiburg, Germany, 140 pp.
Kiefert L., Hänni H.A., Chalain J.-P. and Weber W., 1999. Identification of filler substances in emeralds by infrared and Raman spectroscopy. Journal of Gemmology, 26(8), 501–520, http://dx.doi.org/10. 15506/JoG.1999.26.8.501.
Krzemnicki M.S. and Hajdas I., 2013. Age determination of pearls: A new approach for pearl testing and identification. Radiocarbon, 55(3–4), http://dx.doi. org/10.2458/azu_js_rc.55.16389.
Krzemnicki M.S., Hänni H.A. and Walters R.A., 2004. A new method for detecting Be diffusion-treated sapphires: Laser-induced breakdown spectroscopy (LIBS). Gems & Gemology, 40(4), 314–322, http://dx.doi.org/10.5741/gems.40.4.314.
Krzemnicki M.S., Friess S.D., Chalus P., Hänni H.A. and Karampelas S., 2010. X-ray computed microtomography: Distinguishing natural pearls from beaded and non-beaded cultured pearls. Gems & Gemology, 46(2), 128–134, http://dx.doi.org/10.5741/gems.46.2.128.
Krzemnicki M.S., Revol V., Hanser C., Cartier L. and Hänni H.A., 2015. X-ray phase contrast and X-ray scattering images of pearls. Proceedings of the 34th International Gemmological Conference, Vilnius, Lithuania, 26–30 August, 117–120.
Link K., 2015. Age determination of zircon inclusions in faceted sapphires. Journal of Gemmology,
Gemstone Analysis Using LA-ICP-TOF-MS
Feature Article
223
34(8), 692–700, http://dx.doi.org/10.15506/JoG. 2015.34.8.692.
Longerich H.P., Jackson S.E. and Günther D., 1996. Inter-laboratory note: Laser ablation inductively coupled plasma mass spectrometric transient sig-nal data acquisition and analyte concentration calculation. Journal of Analytical Atomic Spectro-metry, 11(9), 899–904, http://dx.doi.org/10.1039/ja9961100899.
Mannes D., Hanser C., Krzemnicki M., Harti R., Jerjen I. and Lehmann E., 2016. Gemmological investi-gations on pearls and emeralds using neutron imaging. Abstract Proceedings of the 8th Interna-tional Topical Meeting on Neutron Radiography (ITMNR-8), Beijing, China, 4–8 September, poster no. PA9, p. 97.
Meyer J.B., Cartier L.E., Pinto-Figueroa E.A., Krzemnicki M.S., Hänni H.A. and McDonald B.A., 2013. DNA fingerprinting of pearls to determine their origins. PLoS ONE, 8(10), article e75606, 11 pp., http://dx.doi.org/10.1371/journal.pone.0075606.
Muhlmeister S., Fritsch E., Shigley J.E., Devouard B. and Laurs B.M., 1998. Separating natural and synthetic rubies on the basis of trace-element chemistry. Gems & Gemology, 34(2), 80–101, http://dx.doi.org/10.5741/gems.34.2.80.
Pettke T., Oberli F., Audétat A., Guillong M., Simon A.C., Hanley J.J. and Klemm L.M., 2012. Recent developments in element concentration and isotope ratio analysis of individual fluid inclusions by laser ablation single and multiple collector ICP-MS. Ore Geology Reviews, 44, 10–38, http://dx.doi.org/10.1016/j.oregeorev.2011.11.001.
Rankin A.H., Greenwood J. and Hargreaves D., 2003. Chemical fingerprinting of some East African gem rubies by laser ablation ICP-MS. Journal of Gemmology, 28(8), 473–482, http://dx.doi.org/10. 15506/JoG.2003.28.8.473.
Revol V., Hanser C. and Krzemnicki M., 2016. Characterization of pearls by X-ray phase contrast imaging with a grating interferometer. Case Studies in Nondestructive Testing and Evaluation, 6, 1–7, http://dx.doi.org/10.1016/j.csndt.2016.06.001.
Stern W.B. and Hänni H.A., 1982. Energy dispersive X-ray spectrometry: A non-destructive tool in gem-mology. Journal of Gemmology, 18(4), 285–296, http://dx.doi.org/10.15506/JoG.1982.184.285.
Sutherland F.L., Bosshart G., Fanning C.M., Hoskin P.W.O. and Coenraads R.R., 2002. Sapphire crystal-lization, age and origin, Ban Huai Sai, Laos: Age based on zircon inclusions. Journal of Asian Earth Sciences, 20(7), 841–849, http://dx.doi.org/10. 1016/s1367-9120(01)00067-0.
Sutherland F.L., Duroc-Danner J.M. and Meffre S., 2008. Age and origin of gem corundum and zircon megacrysts from the Mercaderes–Rio Mayo area, south-west Colombia, South America. Ore Geology Reviews, 34(1–2), 155–168, http://dx.doi.org/10.1016/j.oregeorev.2008.01.004.
Sutherland F.L., Zaw K., Meffre S., Giuliani G., Fallick A.E., Graham I.T. and Webb G.B., 2009. Gem-corundum megacrysts from east Australian basalt fields: Trace elements, oxygen isotopes and origins. Australian Journal of Earth Sciences, 56(7), 1003–1022, http://dx.doi.org/10.1080/081 20090903112109.
Wehrmeister U., Goetz H., Jacob D.E., Soldati A.L., Xu W., Duschner H. and Hofmeister W., 2008. Visualization of the internal structures of cultured pearls by computerized X-ray microtomography. Journal of Gemmology, 31(1), 15–21, http://dx.doi.org/10.15506/JoG.2008.31.1.15.
The AuthorsDr Hao A. O. Wang, Dr Michael S. Krzemnicki, Jean-Pierre Chalain, Pierre Lefèvre, Dr Wei Zhou and Dr Laurent E. Cartier Swiss Gemmological Institute SSEF Aeschengraben 26, 4051 Basel, SwitzerlandEmail: [email protected]
AcknowledgementsThe authors thank all parties who contrib-uted to the LA-ICP-TOF-MS evaluation project, especially Dr Martin Tanner and Dr Olga Borovinskaya from Tofwerk AG (Thun, Switzer-land), Dr Robert Hutchinson and Kevin Boyce from ESI (Huntingdon, UK) and Dr Serge Bilger from ThermoFisher Scientific (Reinach/Basel, Switzerland). We thank the Board of the Swiss Foundation of Gemstone Research (SSEF) for their support of this research. The Swiss Association of Gemstone Dealers is appreci-ated for their generous financial donation. The authors appreciate helpful comments on this article from three anonymous review-ers and Dr Borovinskaya. Thanks also to the entire SSEF team for their support and fruitful discussions.
224 The Journal of Gemmology, 35(3), 2016
Feature Article
The Journal of Gemmology, 35(3), 2016, pp. 224–246, http://dx.doi.org/10.15506/JoG.2016.35.3.224© 2016 The Gemmological Association of Great Britain
Developments in emerald synthesis occurred over a period of nearly five decades (1911–1958) at a facility in Bitterfeld, Germany, operated primarily under the name IG Farben. Initial experiments involving the flux method of growth performed by H. Wild in Idar-Oberstein led to collaborations with Bitterfeld scientist O. Dreibrodt in the 1910s and 1920s. Almost two decades of research then ensued, culminating in a breakthrough by H. Espig of IG Farben in 1929 that permitted the growth of larger synthetic emerald crystals. A standard synthesis process was developed between 1930 and 1935, and production on a limited scale lasted until 1942. Although the possibility of restarting production was explored in the 1950s, those initiatives were abandoned without further operations. The evolution of the company's flux-growth technology from the first trials before 1914 through the standardized production after 1935 is recorded in variations in the properties of the resulting synthetic emeralds. While Cr was always present as a colour-causing trace element, in later eras Ni was added as well. Growth was performed in platinum crucibles with the nutrient at the bottom, seeds centrally located in a molybdate melt and silica plates floating on top of the melt. To create a barrier between the seeds and the silica plates, a platinum net was originally employed but was subsequently replaced by a platinum baffle. Natural beryl seeds were used in the early years, followed by flat synthetic emerald plates. As a consequence, the morphology of the synthetic emerald crystals changed from prismatic to thick tabular or short prismatic.
Synthetic Emeralds Grown by IG Farben:Historical Development and Properties
Related to Growth Technology
Karl Schmetzer, H. Albert Gilg and Elisabeth Vaupel
IntroductionIn February 1935, the trade press first announced that scientists at Interessen-Gemeinschaft Farben-industrie Aktiengesellschaft, known as IG Farben AG, in Bitterfeld, Germany, had succeeded in growing synthetic emeralds of facetable size and quality (e.g. Figure 1), denominated ‘Igmerald’
(for IG Farben synthetic emerald; Anonymous, 1935a). The first gemmological and mineralogical descriptions were published by M. Jaeger, the director of the IG Farben plant at Bitterfeld, and H. Espig, the technical leader of synthetic gemstone production at the company, which mainly grew rubies, sapphires and spinels by
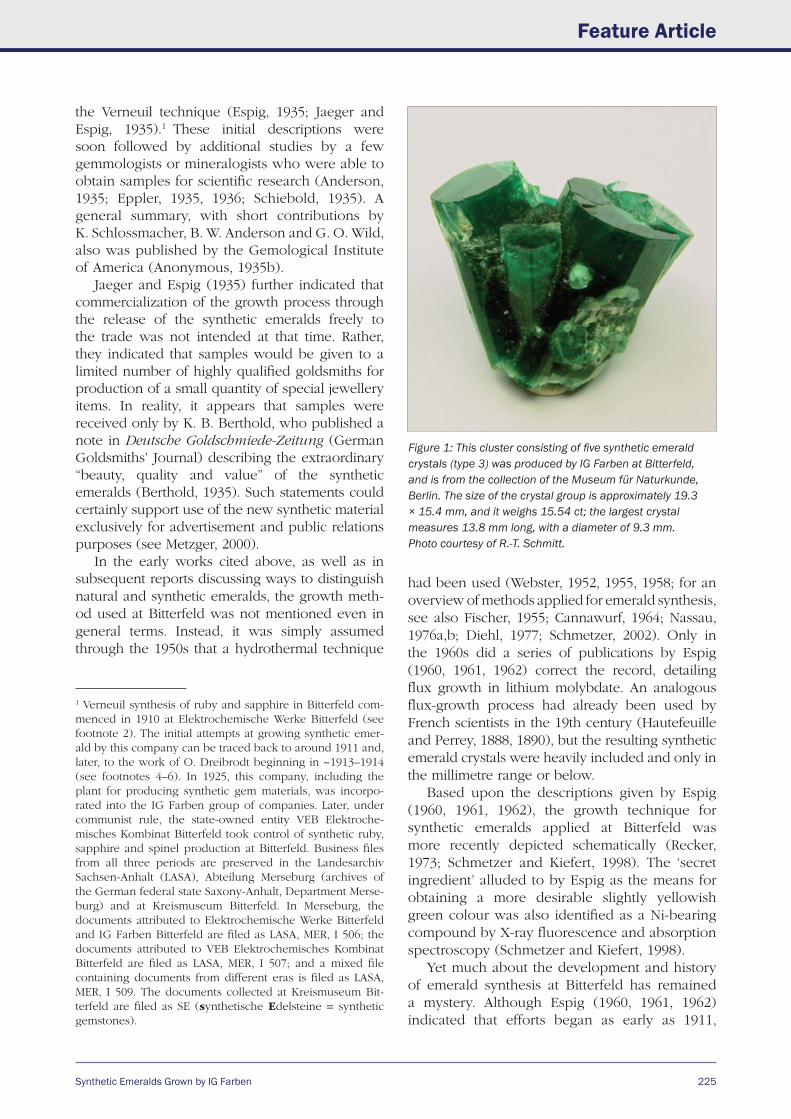
Synthetic Emeralds Grown by IG Farben
Feature Article
225
the Verneuil technique (Espig, 1935; Jaeger and Espig, 1935).1 These initial descriptions were soon followed by additional studies by a few gemmologists or mineralogists who were able to obtain samples for scientific research (Anderson, 1935; Eppler, 1935, 1936; Schiebold, 1935). A general summary, with short contributions by K. Schlossmacher, B. W. Anderson and G. O. Wild, also was published by the Gemological Institute of America (Anonymous, 1935b).
Jaeger and Espig (1935) further indicated that commercialization of the growth process through the release of the synthetic emeralds freely to the trade was not intended at that time. Rather, they indicated that samples would be given to a limited number of highly qualified goldsmiths for production of a small quantity of special jewellery items. In reality, it appears that samples were received only by K. B. Berthold, who published a note in Deutsche Goldschmiede-Zeitung (German Goldsmiths’ Journal) describing the extraordinary “beauty, quality and value” of the synthetic emeralds (Berthold, 1935). Such statements could certainly support use of the new synthetic material exclusively for advertisement and public relations purposes (see Metzger, 2000).
In the early works cited above, as well as in subsequent reports discussing ways to distinguish natural and synthetic emeralds, the growth meth-od used at Bitterfeld was not mentioned even in general terms. Instead, it was simply assumed through the 1950s that a hydrothermal technique
had been used (Webster, 1952, 1955, 1958; for an overview of methods applied for emerald synthesis, see also Fischer, 1955; Cannawurf, 1964; Nassau, 1976a,b; Diehl, 1977; Schmetzer, 2002). Only in the 1960s did a series of publications by Espig (1960, 1961, 1962) correct the record, detailing flux growth in lithium molybdate. An analogous flux-growth process had already been used by French scientists in the 19th century (Hautefeuille and Perrey, 1888, 1890), but the resulting synthetic emerald crystals were heavily included and only in the millimetre range or below.
Based upon the descriptions given by Espig (1960, 1961, 1962), the growth technique for synthetic emeralds applied at Bitterfeld was more recently depicted schematically (Recker, 1973; Schmetzer and Kiefert, 1998). The ‘secret ingredient’ alluded to by Espig as the means for obtaining a more desirable slightly yellowish green colour was also identified as a Ni-bearing compound by X-ray fluorescence and absorption spectroscopy (Schmetzer and Kiefert, 1998).
Yet much about the development and history of emerald synthesis at Bitterfeld has remained a mystery. Although Espig (1960, 1961, 1962) indicated that efforts began as early as 1911,
1 Verneuil synthesis of ruby and sapphire in Bitterfeld com-menced in 1910 at Elektrochemische Werke Bitterfeld (see footnote 2). The initial attempts at growing synthetic emer-ald by this company can be traced back to around 1911 and, later, to the work of O. Dreibrodt beginning in ~1913–1914 (see footnotes 4–6). In 1925, this company, including the plant for producing synthetic gem materials, was incorpo-rated into the IG Farben group of companies. Later, under communist rule, the state-owned entity VEB Elektroche-misches Kombinat Bitterfeld took control of synthetic ruby, sapphire and spinel production at Bitterfeld. Business files from all three periods are preserved in the Landesarchiv Sachsen-Anhalt (LASA), Abteilung Merseburg (archives of the German federal state Saxony-Anhalt, Department Merse-burg) and at Kreismuseum Bitterfeld. In Merseburg, the documents attributed to Elektrochemische Werke Bitterfeld and IG Farben Bitterfeld are filed as LASA, MER, I 506; the documents attributed to VEB Elektrochemisches Kombinat Bitterfeld are filed as LASA, MER, I 507; and a mixed file containing documents from different eras is filed as LASA, MER, I 509. The documents collected at Kreismuseum Bit-terfeld are filed as SE (synthetische Edelsteine = synthetic gemstones).
Figure 1: This cluster consisting of five synthetic emerald crystals (type 3) was produced by IG Farben at Bitterfeld, and is from the collection of the Museum für Naturkunde, Berlin. The size of the crystal group is approximately 19.3 × 15.4 mm, and it weighs 15.54 ct; the largest crystal measures 13.8 mm long, with a diameter of 9.3 mm. Photo courtesy of R.-T. Schmitt.
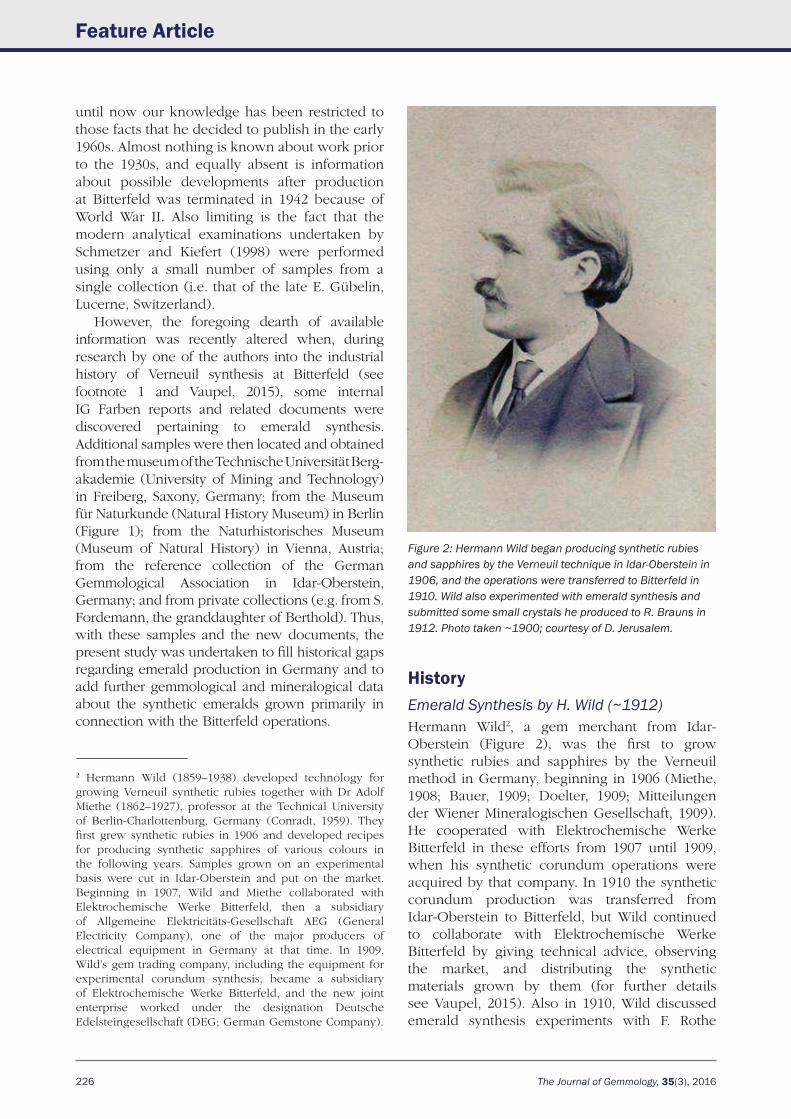
226 The Journal of Gemmology, 35(3), 2016
Feature Article
until now our knowledge has been restricted to those facts that he decided to publish in the early 1960s. Almost nothing is known about work prior to the 1930s, and equally absent is information about possible developments after production at Bitterfeld was terminated in 1942 because of World War II. Also limiting is the fact that the modern analytical examinations undertaken by Schmetzer and Kiefert (1998) were performed using only a small number of samples from a single collection (i.e. that of the late E. Gübelin, Lucerne, Switzerland).
However, the foregoing dearth of available information was recently altered when, during research by one of the authors into the industrial history of Verneuil synthesis at Bitterfeld (see footnote 1 and Vaupel, 2015), some internal IG Farben reports and related documents were discovered pertaining to emerald synthesis. Additional samples were then located and obtained from the museum of the Technische Universität Berg-akademie (University of Mining and Technology) in Freiberg, Saxony, Germany; from the Museum für Naturkunde (Natural History Museum) in Berlin (Figure 1); from the Naturhistorisches Museum (Museum of Natural History) in Vienna, Austria; from the reference collection of the German Gemmological Association in Idar-Oberstein, Germany; and from private collections (e.g. from S. Fordemann, the granddaughter of Berthold). Thus, with these samples and the new documents, the present study was undertaken to fill historical gaps regarding emerald production in Germany and to add further gemmological and mineralogical data about the synthetic emeralds grown primarily in connection with the Bitterfeld operations.
HistoryEmerald Synthesis by H. Wild (~1912)Hermann Wild2, a gem merchant from Idar-Oberstein (Figure 2), was the first to grow synthetic rubies and sapphires by the Verneuil method in Germany, beginning in 1906 (Miethe, 1908; Bauer, 1909; Doelter, 1909; Mitteilungen der Wiener Mineralogischen Gesellschaft, 1909). He cooperated with Elektrochemische Werke Bitterfeld in these efforts from 1907 until 1909, when his synthetic corundum operations were acquired by that company. In 1910 the synthetic corundum production was transferred from Idar-Oberstein to Bitterfeld, but Wild continued to collaborate with Elektrochemische Werke Bitterfeld by giving technical advice, observing the market, and distributing the synthetic materials grown by them (for further details see Vaupel, 2015). Also in 1910, Wild discussed emerald synthesis experiments with F. Rothe
2 Hermann Wild (1859–1938) developed technology for growing Verneuil synthetic rubies together with Dr Adolf Miethe (1862–1927), professor at the Technical University of Berlin-Charlottenburg, Germany (Conradt, 1959). They first grew synthetic rubies in 1906 and developed recipes for producing synthetic sapphires of various colours in the following years. Samples grown on an experimental basis were cut in Idar-Oberstein and put on the market. Beginning in 1907, Wild and Miethe collaborated with Elektrochemische Werke Bitterfeld, then a subsidiary of Allgemeine Elektricitäts-Gesellschaft AEG (General Electricity Company), one of the major producers of electrical equipment in Germany at that time. In 1909, Wild’s gem trading company, including the equipment for experimental corundum synthesis, became a subsidiary of Elektrochemische Werke Bitterfeld, and the new joint enterprise worked under the designation Deutsche Edelsteingesellschaft (DEG; German Gemstone Company).
Figure 2: Hermann Wild began producing synthetic rubies and sapphires by the Verneuil technique in Idar-Oberstein in 1906, and the operations were transferred to Bitterfeld in 1910. Wild also experimented with emerald synthesis and submitted some small crystals he produced to R. Brauns in 1912. Photo taken ~1900; courtesy of D. Jerusalem.
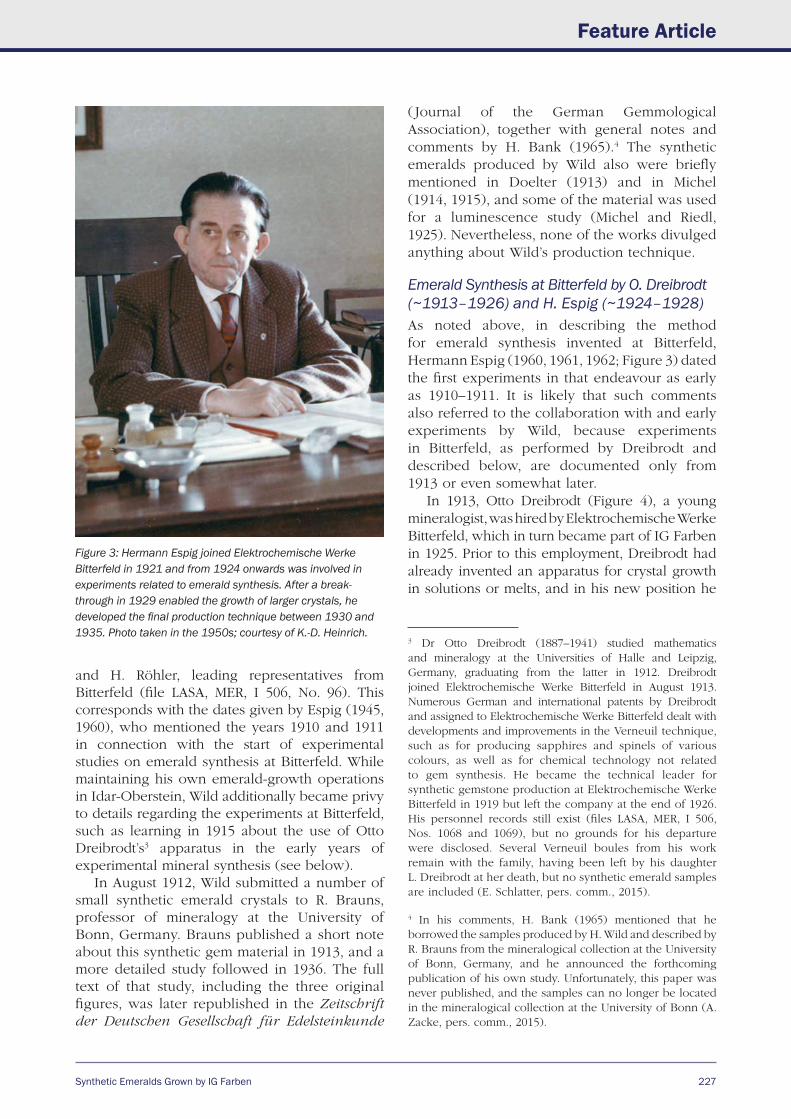
Synthetic Emeralds Grown by IG Farben
Feature Article
227
and H. Röhler, leading representatives from Bitterfeld (file LASA, MER, I 506, No. 96). This corresponds with the dates given by Espig (1945, 1960), who mentioned the years 1910 and 1911 in connection with the start of experimental studies on emerald synthesis at Bitterfeld. While maintaining his own emerald-growth operations in Idar-Oberstein, Wild additionally became privy to details regarding the experiments at Bitterfeld, such as learning in 1915 about the use of Otto Dreibrodt’s3 apparatus in the early years of experimental mineral synthesis (see below).
In August 1912, Wild submitted a number of small synthetic emerald crystals to R. Brauns, professor of mineralogy at the University of Bonn, Germany. Brauns published a short note about this synthetic gem material in 1913, and a more detailed study followed in 1936. The full text of that study, including the three original figures, was later republished in the Zeitschrift der Deutschen Gesellschaft für Edelsteinkunde
( Journal of the German Gemmological Association), together with general notes and comments by H. Bank (1965).4 The synthetic emeralds produced by Wild also were briefly mentioned in Doelter (1913) and in Michel (1914, 1915), and some of the material was used for a luminescence study (Michel and Riedl, 1925). Nevertheless, none of the works divulged anything about Wild’s production technique.
Emerald Synthesis at Bitterfeld by O. Dreibrodt (~1913–1926) and H. Espig (~1924–1928)As noted above, in describing the method for emerald synthesis invented at Bitterfeld, Hermann Espig (1960, 1961, 1962; Figure 3) dated the first experiments in that endeavour as early as 1910–1911. It is likely that such comments also referred to the collaboration with and early experiments by Wild, because experiments in Bitterfeld, as performed by Dreibrodt and described below, are documented only from 1913 or even somewhat later.
In 1913, Otto Dreibrodt (Figure 4), a young mineralogist, was hired by Elektrochemische Werke Bitterfeld, which in turn became part of IG Farben in 1925. Prior to this employment, Dreibrodt had already invented an apparatus for crystal growth in solutions or melts, and in his new position he
3 Dr Otto Dreibrodt (1887–1941) studied mathematics and mineralogy at the Universities of Halle and Leipzig, Germany, graduating from the latter in 1912. Dreibrodt joined Elektrochemische Werke Bitterfeld in August 1913. Numerous German and international patents by Dreibrodt and assigned to Elektrochemische Werke Bitterfeld dealt with developments and improvements in the Verneuil technique, such as for producing sapphires and spinels of various colours, as well as for chemical technology not related to gem synthesis. He became the technical leader for synthetic gemstone production at Elektrochemische Werke Bitterfeld in 1919 but left the company at the end of 1926. His personnel records still exist (files LASA, MER, I 506, Nos. 1068 and 1069), but no grounds for his departure were disclosed. Several Verneuil boules from his work remain with the family, having been left by his daughter L. Dreibrodt at her death, but no synthetic emerald samples are included (E. Schlatter, pers. comm., 2015).
4 In his comments, H. Bank (1965) mentioned that he borrowed the samples produced by H. Wild and described by R. Brauns from the mineralogical collection at the University of Bonn, Germany, and he announced the forthcoming publication of his own study. Unfortunately, this paper was never published, and the samples can no longer be located in the mineralogical collection at the University of Bonn (A. Zacke, pers. comm., 2015).
Figure 3: Hermann Espig joined Elektrochemische Werke Bitterfeld in 1921 and from 1924 onwards was involved in experiments related to emerald synthesis. After a break-through in 1929 enabled the growth of larger crystals, he developed the final production technique between 1930 and 1935. Photo taken in the 1950s; courtesy of K.-D. Heinrich.
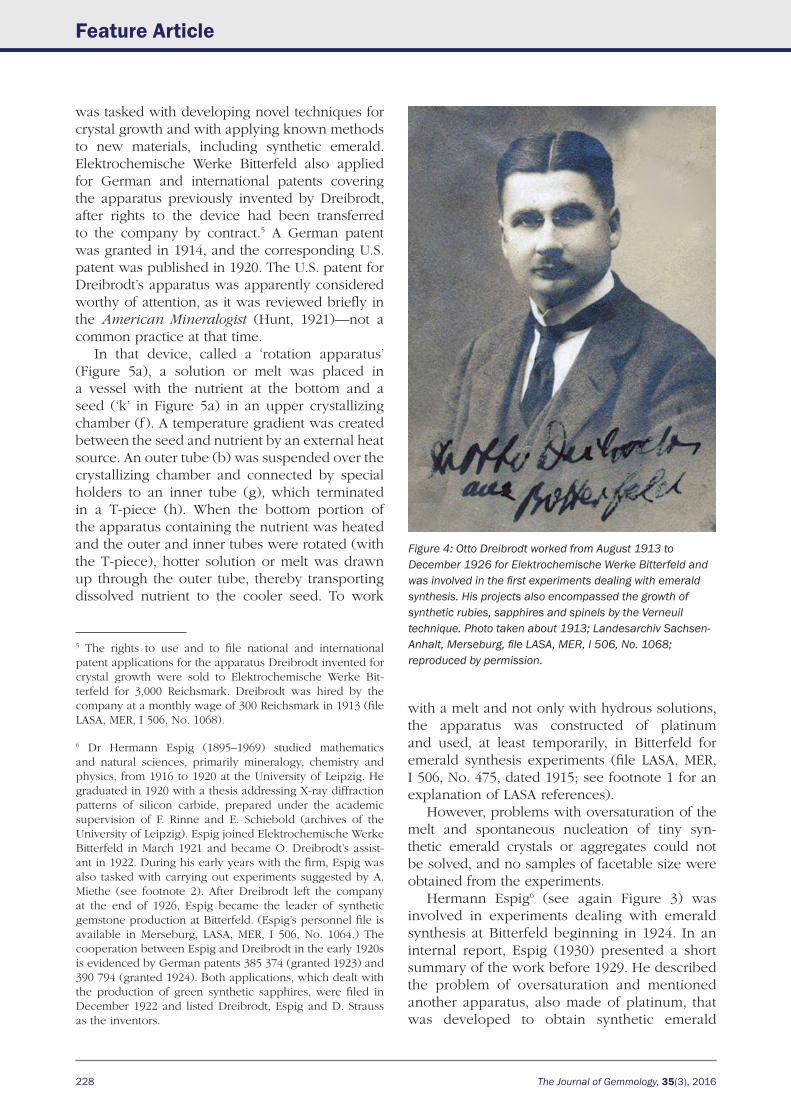
228 The Journal of Gemmology, 35(3), 2016
Feature Article
was tasked with developing novel techniques for crystal growth and with applying known methods to new materials, including synthetic emerald. Elektrochemische Werke Bitterfeld also applied for German and international patents covering the apparatus previously invented by Dreibrodt, after rights to the device had been transferred to the company by contract.5 A German patent was granted in 1914, and the corresponding U.S. patent was published in 1920. The U.S. patent for Dreibrodt’s apparatus was apparently considered worthy of attention, as it was reviewed briefly in the American Mineralogist (Hunt, 1921)—not a common practice at that time.
In that device, called a ‘rotation apparatus’ (Figure 5a), a solution or melt was placed in a vessel with the nutrient at the bottom and a seed (‘k’ in Figure 5a) in an upper crystallizing chamber (f). A temperature gradient was created between the seed and nutrient by an external heat source. An outer tube (b) was suspended over the crystallizing chamber and connected by special holders to an inner tube (g), which terminated in a T-piece (h). When the bottom portion of the apparatus containing the nutrient was heated and the outer and inner tubes were rotated (with the T-piece), hotter solution or melt was drawn up through the outer tube, thereby transporting dissolved nutrient to the cooler seed. To work
with a melt and not only with hydrous solutions, the apparatus was constructed of platinum and used, at least temporarily, in Bitterfeld for emerald synthesis experiments (file LASA, MER, I 506, No. 475, dated 1915; see footnote 1 for an explanation of LASA references).
However, problems with oversaturation of the melt and spontaneous nucleation of tiny syn-thetic emerald crystals or aggregates could not be solved, and no samples of facetable size were obtained from the experiments.
Hermann Espig6 (see again Figure 3) was involved in experiments dealing with emerald synthesis at Bitterfeld beginning in 1924. In an internal report, Espig (1930) presented a short summary of the work before 1929. He described the problem of oversaturation and mentioned another apparatus, also made of platinum, that was developed to obtain synthetic emerald
Figure 4: Otto Dreibrodt worked from August 1913 to December 1926 for Elektrochemische Werke Bitterfeld and was involved in the first experiments dealing with emerald synthesis. His projects also encompassed the growth of synthetic rubies, sapphires and spinels by the Verneuil technique. Photo taken about 1913; Landesarchiv Sachsen-Anhalt, Merseburg, file LASA, MER, I 506, No. 1068; reproduced by permission.
5 The rights to use and to file national and international patent applications for the apparatus Dreibrodt invented for crystal growth were sold to Elektrochemische Werke Bit-terfeld for 3,000 Reichsmark. Dreibrodt was hired by the company at a monthly wage of 300 Reichsmark in 1913 (file LASA, MER, I 506, No. 1068).
6 Dr Hermann Espig (1895–1969) studied mathematics and natural sciences, primarily mineralogy, chemistry and physics, from 1916 to 1920 at the University of Leipzig. He graduated in 1920 with a thesis addressing X-ray diffraction patterns of silicon carbide, prepared under the academic supervision of F. Rinne and E. Schiebold (archives of the University of Leipzig). Espig joined Elektrochemische Werke Bitterfeld in March 1921 and became O. Dreibrodt’s assist-ant in 1922. During his early years with the firm, Espig was also tasked with carrying out experiments suggested by A. Miethe (see footnote 2). After Dreibrodt left the company at the end of 1926, Espig became the leader of synthetic gemstone production at Bitterfeld. (Espig’s personnel file is available in Merseburg, LASA, MER, I 506, No. 1064.) The cooperation between Espig and Dreibrodt in the early 1920s is evidenced by German patents 385 374 (granted 1923) and 390 794 (granted 1924). Both applications, which dealt with the production of green synthetic sapphires, were filed in December 1922 and listed Dreibrodt, Espig and D. Strauss as the inventors.
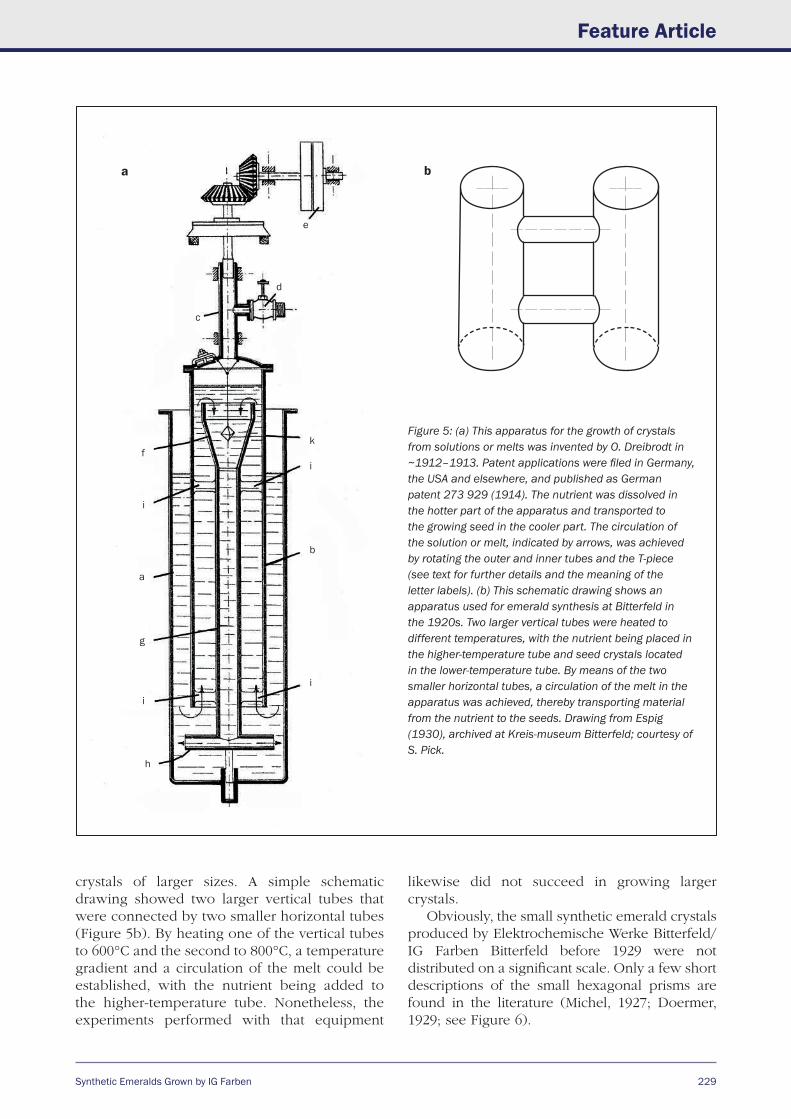
Synthetic Emeralds Grown by IG Farben
Feature Article
229
i
k
i
i
i
h
g
f
e
d
a
c
b
a b
Figure 5: (a) This apparatus for the growth of crystals from solutions or melts was invented by O. Dreibrodt in ~1912–1913. Patent applications were filed in Germany, the USA and elsewhere, and published as German patent 273 929 (1914). The nutrient was dissolved in the hotter part of the apparatus and transported to the growing seed in the cooler part. The circulation of the solution or melt, indicated by arrows, was achieved by rotating the outer and inner tubes and the T-piece (see text for further details and the meaning of the letter labels). (b) This schematic drawing shows an apparatus used for emerald synthesis at Bitterfeld in the 1920s. Two larger vertical tubes were heated to different temperatures, with the nutrient being placed in the higher-temperature tube and seed crystals located in the lower-temperature tube. By means of the two smaller horizontal tubes, a circulation of the melt in the apparatus was achieved, thereby transporting material from the nutrient to the seeds. Drawing from Espig (1930), archived at Kreis-museum Bitterfeld; courtesy of S. Pick.
crystals of larger sizes. A simple schematic drawing showed two larger vertical tubes that were connected by two smaller horizontal tubes (Figure 5b). By heating one of the vertical tubes to 600°C and the second to 800°C, a temperature gradient and a circulation of the melt could be established, with the nutrient being added to the higher-temperature tube. Nonetheless, the experiments performed with that equipment
likewise did not succeed in growing larger crystals.
Obviously, the small synthetic emerald crystals produced by Elektrochemische Werke Bitterfeld/IG Farben Bitterfeld before 1929 were not distributed on a significant scale. Only a few short descriptions of the small hexagonal prisms are found in the literature (Michel, 1927; Doermer, 1929; see Figure 6).
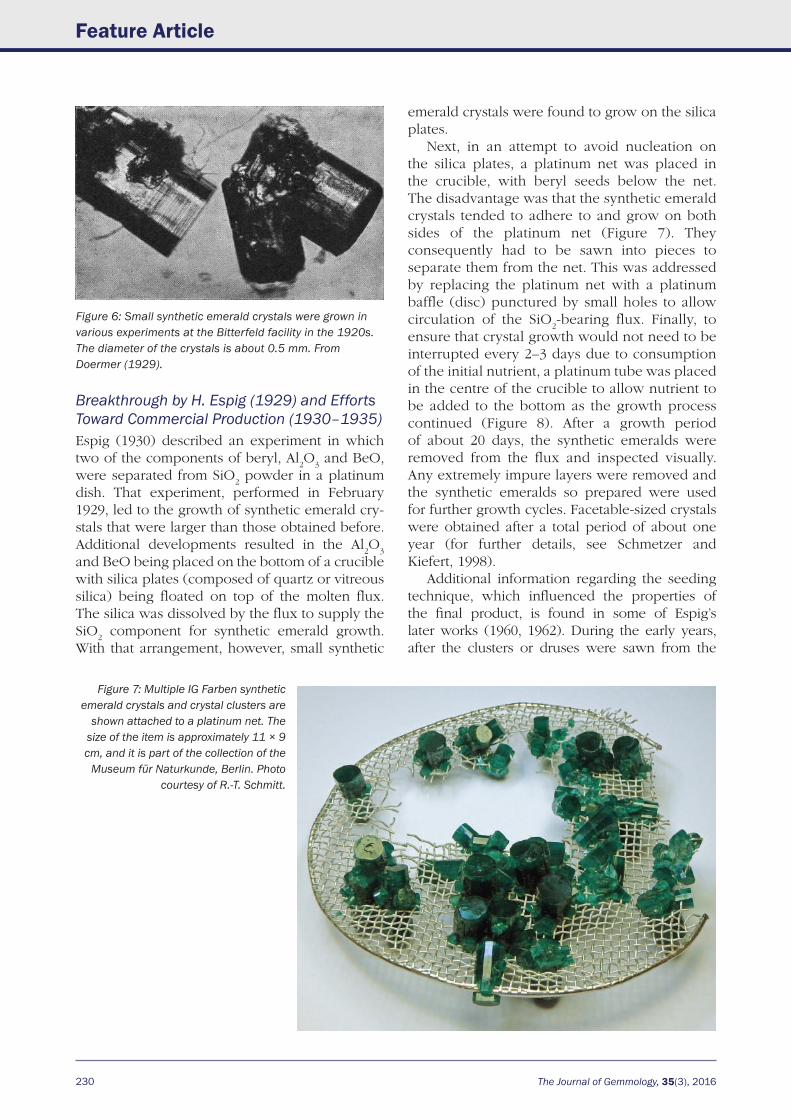
230 The Journal of Gemmology, 35(3), 2016
Feature Article
Breakthrough by H. Espig (1929) and Efforts Toward Commercial Production (1930–1935)Espig (1930) described an experiment in which two of the components of beryl, Al
2O
3 and BeO,
were separated from SiO2 powder in a platinum
dish. That experiment, performed in February 1929, led to the growth of synthetic emerald cry-stals that were larger than those obtained before. Additional developments resulted in the Al
2O
3
and BeO being placed on the bottom of a crucible with silica plates (composed of quartz or vitreous silica) being floated on top of the molten flux. The silica was dissolved by the flux to supply the SiO
2 component for synthetic emerald growth.
With that arrangement, however, small synthetic
emerald crystals were found to grow on the silica plates.
Next, in an attempt to avoid nucleation on the silica plates, a platinum net was placed in the crucible, with beryl seeds below the net. The disadvantage was that the synthetic emerald crystals tended to adhere to and grow on both sides of the platinum net (Figure 7). They consequently had to be sawn into pieces to separate them from the net. This was addressed by replacing the platinum net with a platinum baffle (disc) punctured by small holes to allow circulation of the SiO
2-bearing flux. Finally, to
ensure that crystal growth would not need to be interrupted every 2–3 days due to consumption of the initial nutrient, a platinum tube was placed in the centre of the crucible to allow nutrient to be added to the bottom as the growth process continued (Figure 8). After a growth period of about 20 days, the synthetic emeralds were removed from the flux and inspected visually. Any extremely impure layers were removed and the synthetic emeralds so prepared were used for further growth cycles. Facetable-sized crystals were obtained after a total period of about one year (for further details, see Schmetzer and Kiefert, 1998).
Additional information regarding the seeding technique, which influenced the properties of the final product, is found in some of Espig’s later works (1960, 1962). During the early years, after the clusters or druses were sawn from the
Figure 6: Small synthetic emerald crystals were grown in various experiments at the Bitterfeld facility in the 1920s. The diameter of the crystals is about 0.5 mm. From Doermer (1929).
Figure 7: Multiple IG Farben synthetic emerald crystals and crystal clusters are
shown attached to a platinum net. The size of the item is approximately 11 × 9 cm, and it is part of the collection of the
Museum für Naturkunde, Berlin. Photo courtesy of R.-T. Schmitt.
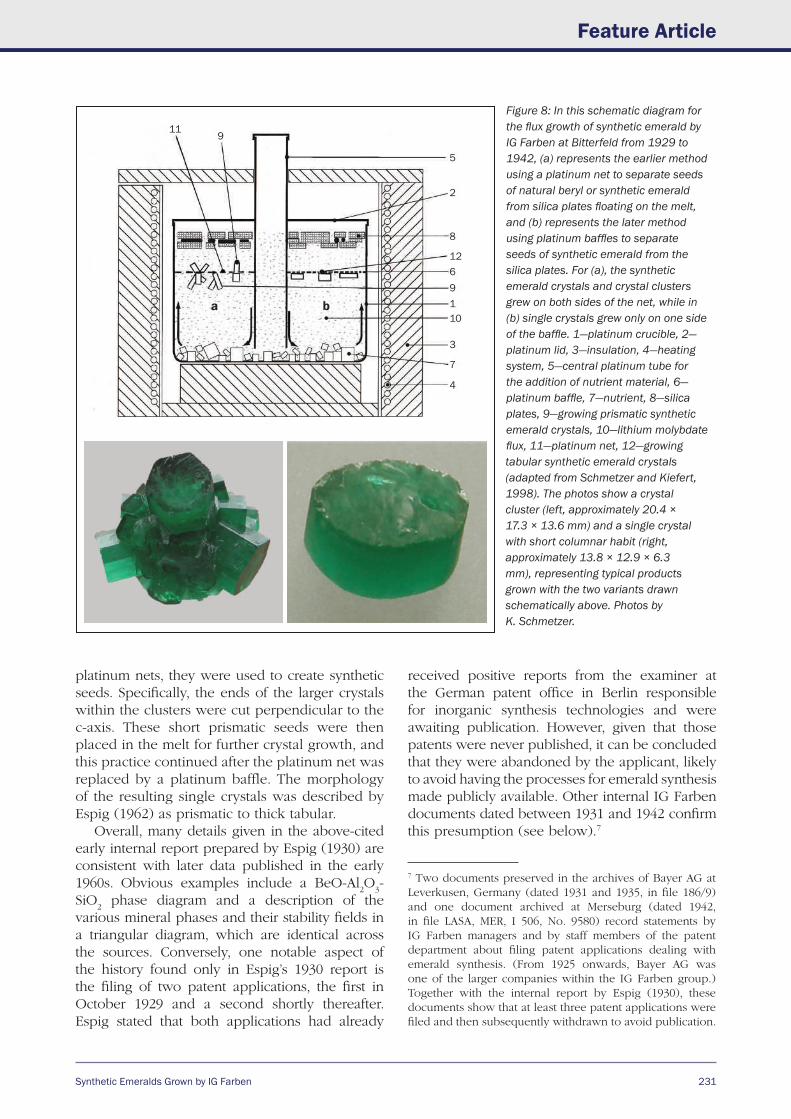
Synthetic Emeralds Grown by IG Farben
Feature Article
231
platinum nets, they were used to create synthetic seeds. Specifically, the ends of the larger crystals within the clusters were cut perpendicular to the c-axis. These short prismatic seeds were then placed in the melt for further crystal growth, and this practice continued after the platinum net was replaced by a platinum baffle. The morphology of the resulting single crystals was described by Espig (1962) as prismatic to thick tabular.
Overall, many details given in the above-cited early internal report prepared by Espig (1930) are consistent with later data published in the early 1960s. Obvious examples include a BeO-Al
2O
3-
SiO2 phase diagram and a description of the
various mineral phases and their stability fields in a triangular diagram, which are identical across the sources. Conversely, one notable aspect of the history found only in Espig’s 1930 report is the filing of two patent applications, the first in October 1929 and a second shortly thereafter. Espig stated that both applications had already
received positive reports from the examiner at the German patent office in Berlin responsible for inorganic synthesis technologies and were awaiting publication. However, given that those patents were never published, it can be concluded that they were abandoned by the applicant, likely to avoid having the processes for emerald synthesis made publicly available. Other internal IG Farben documents dated between 1931 and 1942 confirm this presumption (see below).7
119
5
2
3
1019612
8
4
7
a b
Figure 8: In this schematic diagram for the flux growth of synthetic emerald by IG Farben at Bitterfeld from 1929 to 1942, (a) represents the earlier method using a platinum net to separate seeds of natural beryl or synthetic emerald from silica plates floating on the melt, and (b) represents the later method using platinum baffles to separate seeds of synthetic emerald from the silica plates. For (a), the synthetic emerald crystals and crystal clusters grew on both sides of the net, while in (b) single crystals grew only on one side of the baffle. 1—platinum crucible, 2—platinum lid, 3—insulation, 4—heating system, 5—central platinum tube for the addition of nutrient material, 6—platinum baffle, 7—nutrient, 8—silica plates, 9—growing prismatic synthetic emerald crystals, 10—lithium molybdate flux, 11—platinum net, 12—growing tabular synthetic emerald crystals (adapted from Schmetzer and Kiefert, 1998). The photos show a crystal cluster (left, approximately 20.4 × 17.3 × 13.6 mm) and a single crystal with short columnar habit (right, approximately 13.8 × 12.9 × 6.3 mm), representing typical products grown with the two variants drawn schematically above. Photos by K. Schmetzer.
7 Two documents preserved in the archives of Bayer AG at Leverkusen, Germany (dated 1931 and 1935, in file 186/9) and one document archived at Merseburg (dated 1942, in file LASA, MER, I 506, No. 9580) record statements by IG Farben managers and by staff members of the patent department about filing patent applications dealing with emerald synthesis. (From 1925 onwards, Bayer AG was one of the larger companies within the IG Farben group.) Together with the internal report by Espig (1930), these documents show that at least three patent applications were filed and then subsequently withdrawn to avoid publication.
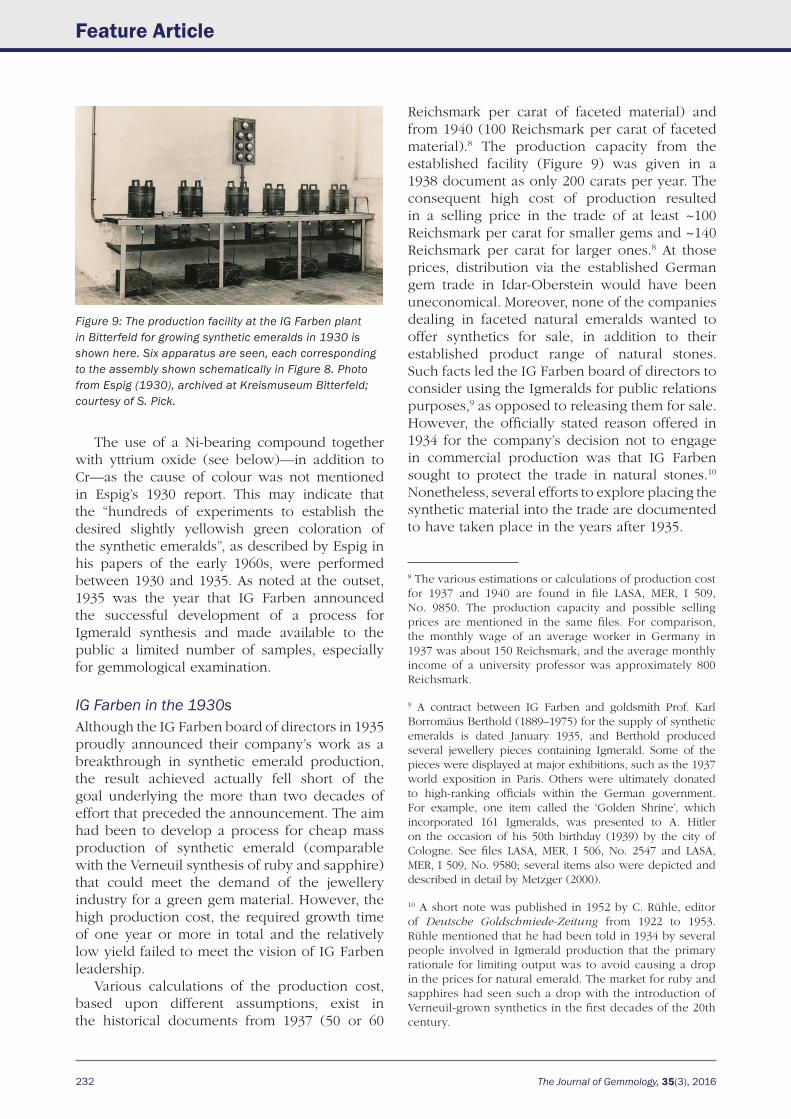
232 The Journal of Gemmology, 35(3), 2016
Feature Article
The use of a Ni-bearing compound together with yttrium oxide (see below)—in addition to Cr—as the cause of colour was not mentioned in Espig’s 1930 report. This may indicate that the “hundreds of experiments to establish the desired slightly yellowish green coloration of the synthetic emeralds”, as described by Espig in his papers of the early 1960s, were performed between 1930 and 1935. As noted at the outset, 1935 was the year that IG Farben announced the successful development of a process for Igmerald synthesis and made available to the public a limited number of samples, especially for gemmological examination.
IG Farben in the 1930sAlthough the IG Farben board of directors in 1935 proudly announced their company’s work as a breakthrough in synthetic emerald production, the result achieved actually fell short of the goal underlying the more than two decades of effort that preceded the announcement. The aim had been to develop a process for cheap mass production of synthetic emerald (comparable with the Verneuil synthesis of ruby and sapphire) that could meet the demand of the jewellery industry for a green gem material. However, the high production cost, the required growth time of one year or more in total and the relatively low yield failed to meet the vision of IG Farben leadership.
Various calculations of the production cost, based upon different assumptions, exist in the historical documents from 1937 (50 or 60
Reichsmark per carat of faceted material) and from 1940 (100 Reichsmark per carat of faceted material).8 The production capacity from the established facility (Figure 9) was given in a 1938 document as only 200 carats per year. The consequent high cost of production resulted in a selling price in the trade of at least ~100 Reichsmark per carat for smaller gems and ~140 Reichsmark per carat for larger ones.8 At those prices, distribution via the established German gem trade in Idar-Oberstein would have been uneconomical. Moreover, none of the companies dealing in faceted natural emeralds wanted to offer synthetics for sale, in addition to their established product range of natural stones. Such facts led the IG Farben board of directors to consider using the Igmeralds for public relations purposes,9 as opposed to releasing them for sale. However, the officially stated reason offered in 1934 for the company’s decision not to engage in commercial production was that IG Farben sought to protect the trade in natural stones.10 Nonetheless, several efforts to explore placing the synthetic material into the trade are documented to have taken place in the years after 1935.
Figure 9: The production facility at the IG Farben plant in Bitterfeld for growing synthetic emeralds in 1930 is shown here. Six apparatus are seen, each corresponding to the assembly shown schematically in Figure 8. Photo from Espig (1930), archived at Kreismuseum Bitterfeld; courtesy of S. Pick.
8 The various estimations or calculations of production cost for 1937 and 1940 are found in file LASA, MER, I 509, No. 9850. The production capacity and possible selling prices are mentioned in the same files. For comparison, the monthly wage of an average worker in Germany in 1937 was about 150 Reichsmark, and the average monthly income of a university professor was approximately 800 Reichsmark.
9 A contract between IG Farben and goldsmith Prof. Karl Borromäus Berthold (1889–1975) for the supply of synthetic emeralds is dated January 1935, and Berthold produced several jewellery pieces containing Igmerald. Some of the pieces were displayed at major exhibitions, such as the 1937 world exposition in Paris. Others were ultimately donated to high-ranking officials within the German government. For example, one item called the ‘Golden Shrine’, which incorporated 161 Igmeralds, was presented to A. Hitler on the occasion of his 50th birthday (1939) by the city of Cologne. See files LASA, MER, I 506, No. 2547 and LASA, MER, I 509, No. 9580; several items also were depicted and described in detail by Metzger (2000).
10 A short note was published in 1952 by C. Rühle, editor of Deutsche Goldschmiede-Zeitung from 1922 to 1953. Rühle mentioned that he had been told in 1934 by several people involved in Igmerald production that the primary rationale for limiting output was to avoid causing a drop in the prices for natural emerald. The market for ruby and sapphires had seen such a drop with the introduction of Verneuil-grown synthetics in the first decades of the 20th century.
Synthetic Emeralds Grown by IG Farben
Feature Article
233
This ambiguity between official statements and proprietary activities was also reflected in the patent policy of the company (again see footnote 7). As indicated previously, Espig’s June 1930 internal report referenced two patent applications filed in the German patent office, the first one in October 1929, and a possible application in the USA also was considered. Both German applications were abandoned by the company, and at least one further application, filed about 1934, also was abandoned in 1935. The rationale behind these abandonments is suggested in the minutes from a meeting of IG Farben management in 1931: The company leaders were afraid that it would be impossible to control the worldwide use of the growth technology and especially to prevent possible patent infringement. Several letters dated after 1935 evidence consent amongst management regarding these policies.
IG Farben After 1942According to all available information, the synthesis technique as established by 1935 remained essentially unchanged, and production continued on a limited scale until being terminated in 1942 because of World War II. Although Espig (1960, 1961, 1962) published that production of synthetic emeralds did not resume after 1942, two noteworthy events after 1945 should be mentioned for completeness.
Archived at Kreismuseum Bitterfeld is an internal report by Espig (1946) that recounted an experiment for growing synthetic emeralds. Specifically, a description of the growth process had been prepared in October 1945 for the Russian commander of the synthetic gemstone plant at Bitterfeld, and a practical demonstration also was required by the Russians. The February 1946 document reported that the original platinum apparatus used in emerald synthesis had ceased to be available. Therefore, at least one platinum crucible had to be manufactured from some residual sheet material. The experiment was performed successfully in January 1946 with a growth period of approximately one month. Most interestingly, the recipe for the various ingredients was given, and that recipe included nickel carbonate, the ‘secret’ ingredient not otherwise disclosed until the late 1990s (Schmetzer and Kiefert, 1998). Surprisingly, the list of ingredients also contained yttrium oxide, an Igmerald component not previously recognized. As a consequence of these activities, Espig would later remark in a letter dated 1952 that the production
technology for synthetic emerald was no longer secret because his 1946 report had been sent to Moscow.
In a further internal report, which was recently obtained by the authors from K.-D. Heinrich (the final director of the Bitterfeld plant before its closure in 1990), Espig (1945) stated that the yttrium oxide mentioned above was used in addition to lithium chromate and nickel carbonate as a colour-causing trace element to obtain the desired slightly yellowish green coloration of the synthetic emeralds.
In the Landesarchiv Sachsen-Anhalt, Abteilung Merseburg, a series of documents dated March 1954 to December 1958 revealed several explora-tory efforts toward restarting synthetic emerald production after 1945. Included in them were calculations regarding the profitability of a small production of synthetic emerald comprising about 15–20 carats of faceted material per month (i.e. close to the yield obtained in the late 1930s), with an estimated production expense of 200 DM per carat (using the currency of the German Democratic Republic) and a selling price that was equivalent to that of Chatham synthetic emeralds at the time. The investment for the apparatus, including 15 kg of platinum,11 was computed by Espig in 1955 to be about 118,500 DM.
Obviously, Espig never succeeded in obtaining permission for such a restart. However, samples of the remaining pre-1942 production (an inventory from 1951 mentioned 159 faceted pieces totalling 15.1 carats and 623 crystals totalling 3,124.7 carats) were used as state gifts for important visitors to the German Democratic Republic, mostly from the Soviet Union and other socialist countries.
Materials and MethodsThe present study involved flux-grown synthetic emerald samples grown by four early producers. The oldest were some small crystals produced in the late 19th century from a lithium molybdate
11 Espig listed 15 kg of platinum as well as several ingredients (beryllium oxide, lithium carbonate and yttrium oxide) that had to be purchased from foreign countries using Western currencies. Such complications in the supply chain, the high investment required and the minimal production output of only 15–20 carats per month culminated to suggest only a small possible profit. The combined disadvantages may explain why Espig was never successful in obtaining permission to restart synthetic emerald production. See file LASA, MER, I 507, No. 591, dated 1950s.
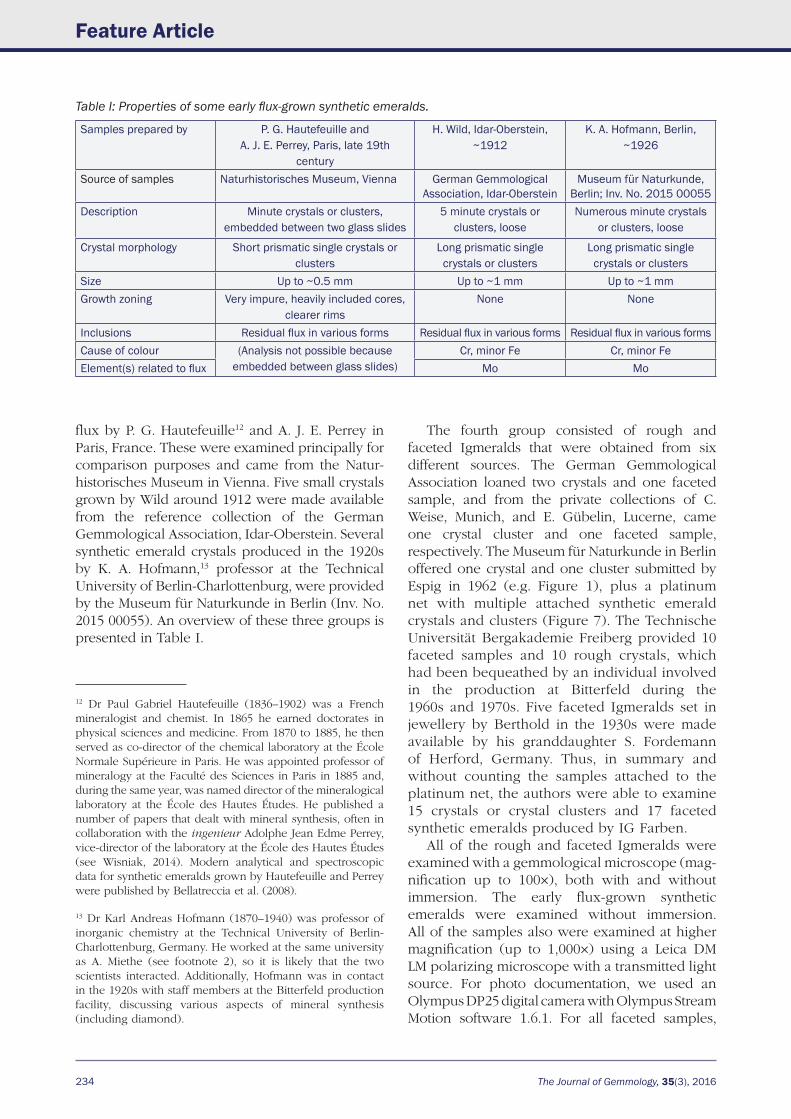
234 The Journal of Gemmology, 35(3), 2016
Feature Article
flux by P. G. Hautefeuille12 and A. J. E. Perrey in Paris, France. These were examined principally for comparison purposes and came from the Natur-historisches Museum in Vienna. Five small crystals grown by Wild around 1912 were made available from the reference collection of the German Gemmological Association, Idar-Oberstein. Several synthetic emerald crystals produced in the 1920s by K. A. Hofmann,13 professor at the Technical University of Berlin-Charlottenburg, were provided by the Museum für Naturkunde in Berlin (Inv. No. 2015 00055). An overview of these three groups is presented in Table I.
The fourth group consisted of rough and faceted Igmeralds that were obtained from six different sources. The German Gemmological Association loaned two crystals and one faceted sample, and from the private collections of C. Weise, Munich, and E. Gübelin, Lucerne, came one crystal cluster and one faceted sample, respectively. The Museum für Naturkunde in Berlin offered one crystal and one cluster submitted by Espig in 1962 (e.g. Figure 1), plus a platinum net with multiple attached synthetic emerald crystals and clusters (Figure 7). The Technische Universität Bergakademie Freiberg provided 10 faceted samples and 10 rough crystals, which had been bequeathed by an individual involved in the production at Bitterfeld during the 1960s and 1970s. Five faceted Igmeralds set in jewellery by Berthold in the 1930s were made available by his granddaughter S. Fordemann of Herford, Germany. Thus, in summary and without counting the samples attached to the platinum net, the authors were able to examine 15 crystals or crystal clusters and 17 faceted synthetic emeralds produced by IG Farben.
All of the rough and faceted Igmeralds were examined with a gemmological microscope (mag-nification up to 100×), both with and without immersion. The early flux-grown synthetic emeralds were examined without immersion. All of the samples also were examined at higher magnification (up to 1,000×) using a Leica DM LM polarizing microscope with a transmitted light source. For photo documentation, we used an Olympus DP25 digital camera with Olympus Stream Motion software 1.6.1. For all faceted samples,
12 Dr Paul Gabriel Hautefeuille (1836–1902) was a French mineralogist and chemist. In 1865 he earned doctorates in physical sciences and medicine. From 1870 to 1885, he then served as co-director of the chemical laboratory at the École Normale Supérieure in Paris. He was appointed professor of mineralogy at the Faculté des Sciences in Paris in 1885 and, during the same year, was named director of the mineralogical laboratory at the École des Hautes Études. He published a number of papers that dealt with mineral synthesis, often in collaboration with the ingenieur Adolphe Jean Edme Perrey, vice-director of the laboratory at the École des Hautes Études (see Wisniak, 2014). Modern analytical and spectroscopic data for synthetic emeralds grown by Hautefeuille and Perrey were published by Bellatreccia et al. (2008).
13 Dr Karl Andreas Hofmann (1870–1940) was professor of inorganic chemistry at the Technical University of Berlin-Charlottenburg, Germany. He worked at the same university as A. Miethe (see footnote 2), so it is likely that the two scientists interacted. Additionally, Hofmann was in contact in the 1920s with staff members at the Bitterfeld production facility, discussing various aspects of mineral synthesis (including diamond).
Table I: Properties of some early flux-grown synthetic emeralds.
Samples prepared by P. G. Hautefeuille and A. J. E. Perrey, Paris, late 19th
century
H. Wild, Idar-Oberstein, ~1912
K. A. Hofmann, Berlin, ~1926
Source of samples Naturhistorisches Museum, Vienna German Gemmological Association, Idar-Oberstein
Museum für Naturkunde, Berlin; Inv. No. 2015 00055
Description Minute crystals or clusters, embedded between two glass slides
5 minute crystals or clusters, loose
Numerous minute crystals or clusters, loose
Crystal morphology Short prismatic single crystals or clusters
Long prismatic single crystals or clusters
Long prismatic single crystals or clusters
Size Up to ~0.5 mm Up to ~1 mm Up to ~1 mmGrowth zoning Very impure, heavily included cores,
clearer rimsNone None
Inclusions Residual flux in various forms Residual flux in various forms Residual flux in various formsCause of colour (Analysis not possible because
embedded between glass slides)Cr, minor Fe Cr, minor Fe
Element(s) related to flux Mo Mo
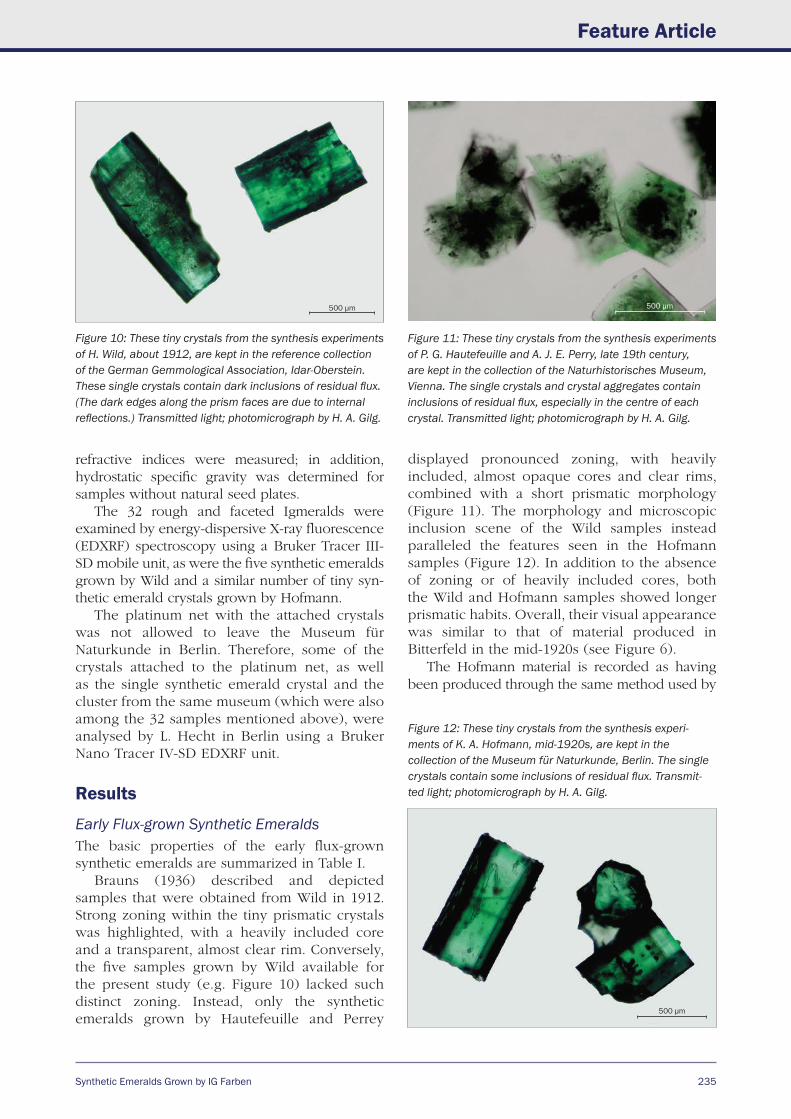
Synthetic Emeralds Grown by IG Farben
Feature Article
235
refractive indices were measured; in addition, hydrostatic specific gravity was determined for samples without natural seed plates.
The 32 rough and faceted Igmeralds were examined by energy-dispersive X-ray fluorescence (EDXRF) spectroscopy using a Bruker Tracer III-SD mobile unit, as were the five synthetic emeralds grown by Wild and a similar number of tiny syn-thetic emerald crystals grown by Hofmann.
The platinum net with the attached crystals was not allowed to leave the Museum für Naturkunde in Berlin. Therefore, some of the crystals attached to the platinum net, as well as the single synthetic emerald crystal and the cluster from the same museum (which were also among the 32 samples mentioned above), were analysed by L. Hecht in Berlin using a Bruker Nano Tracer IV-SD EDXRF unit.
Results
Early Flux-grown Synthetic EmeraldsThe basic properties of the early flux-grown synthetic emeralds are summarized in Table I.
Brauns (1936) described and depicted samples that were obtained from Wild in 1912. Strong zoning within the tiny prismatic crystals was highlighted, with a heavily included core and a transparent, almost clear rim. Conversely, the five samples grown by Wild available for the present study (e.g. Figure 10) lacked such distinct zoning. Instead, only the synthetic emeralds grown by Hautefeuille and Perrey
displayed pronounced zoning, with heavily included, almost opaque cores and clear rims, combined with a short prismatic morphology (Figure 11). The morphology and microscopic inclusion scene of the Wild samples instead paralleled the features seen in the Hofmann samples (Figure 12). In addition to the absence of zoning or of heavily included cores, both the Wild and Hofmann samples showed longer prismatic habits. Overall, their visual appearance was similar to that of material produced in Bitterfeld in the mid-1920s (see Figure 6).
The Hofmann material is recorded as having been produced through the same method used by
Figure 10: These tiny crystals from the synthesis experiments of H. Wild, about 1912, are kept in the reference collection of the German Gemmological Association, Idar-Oberstein. These single crystals contain dark inclusions of residual flux. (The dark edges along the prism faces are due to internal reflections.) Transmitted light; photomicrograph by H. A. Gilg.
Figure 11: These tiny crystals from the synthesis experiments of P. G. Hautefeuille and A. J. E. Perry, late 19th century, are kept in the collection of the Naturhistorisches Museum, Vienna. The single crystals and crystal aggregates contain inclusions of residual flux, especially in the centre of each crystal. Transmitted light; photomicrograph by H. A. Gilg.
Figure 12: These tiny crystals from the synthesis experi-ments of K. A. Hofmann, mid-1920s, are kept in the collection of the Museum für Naturkunde, Berlin. The single crystals contain some inclusions of residual flux. Transmit-ted light; photomicrograph by H. A. Gilg.
500 μm 500 μm
500 μm
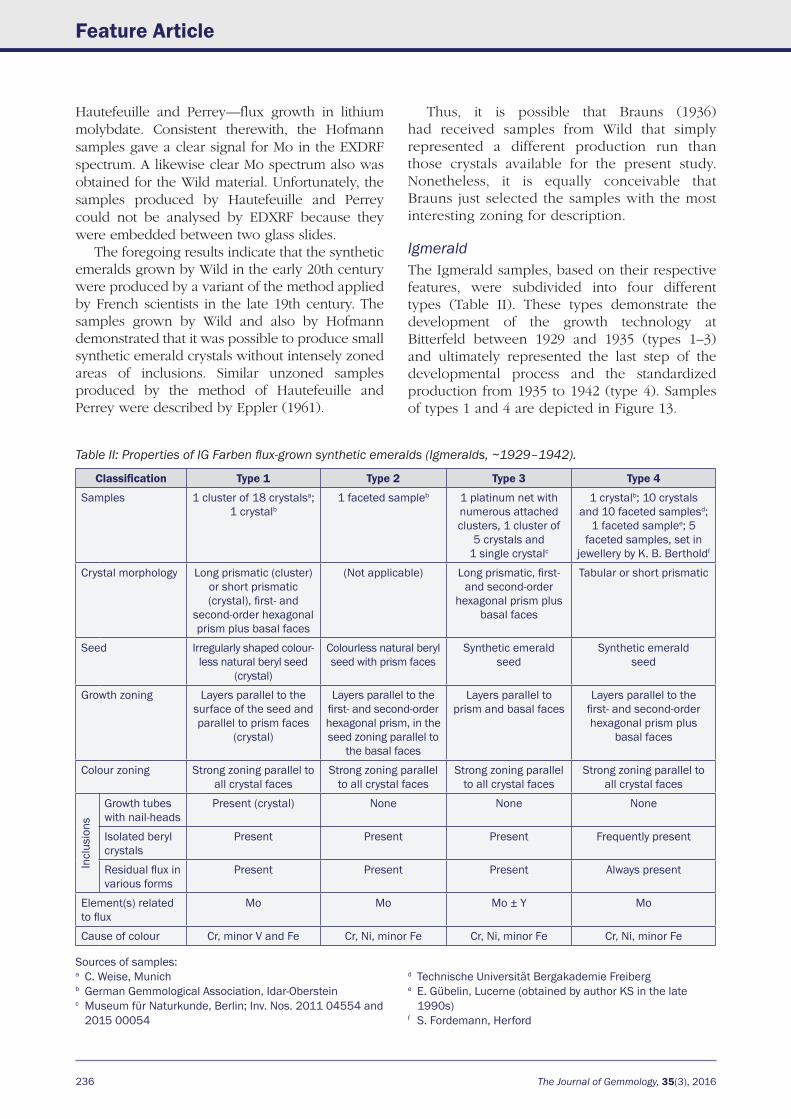
236 The Journal of Gemmology, 35(3), 2016
Feature Article
Hautefeuille and Perrey—flux growth in lithium molybdate. Consistent therewith, the Hofmann samples gave a clear signal for Mo in the EXDRF spectrum. A likewise clear Mo spectrum also was obtained for the Wild material. Unfortunately, the samples produced by Hautefeuille and Perrey could not be analysed by EDXRF because they were embedded between two glass slides.
The foregoing results indicate that the synthetic emeralds grown by Wild in the early 20th century were produced by a variant of the method applied by French scientists in the late 19th century. The samples grown by Wild and also by Hofmann demonstrated that it was possible to produce small synthetic emerald crystals without intensely zoned areas of inclusions. Similar unzoned samples produced by the method of Hautefeuille and Perrey were described by Eppler (1961).
Thus, it is possible that Brauns (1936) had received samples from Wild that simply represented a different production run than those crystals available for the present study. Nonetheless, it is equally conceivable that Brauns just selected the samples with the most interesting zoning for description.
IgmeraldThe Igmerald samples, based on their respective features, were subdivided into four different types (Table II). These types demonstrate the development of the growth technology at Bitterfeld between 1929 and 1935 (types 1–3) and ultimately represented the last step of the developmental process and the standardized production from 1935 to 1942 (type 4). Samples of types 1 and 4 are depicted in Figure 13.
Table II: Properties of IG Farben flux-grown synthetic emeralds (Igmeralds, ~1929–1942).
Classification Type 1 Type 2 Type 3 Type 4
Samples 1 cluster of 18 crystalsa; 1 crystalb
1 faceted sampleb 1 platinum net with numerous attached clusters, 1 cluster of
5 crystals and 1 single crystalc
1 crystalb; 10 crystals and 10 faceted samplesd;
1 faceted samplee; 5 faceted samples, set in
jewellery by K. B. Bertholdf
Crystal morphology Long prismatic (cluster) or short prismatic (crystal), first- and
second-order hexagonal prism plus basal faces
(Not applicable) Long prismatic, first- and second-order
hexagonal prism plus basal faces
Tabular or short prismatic
Seed Irregularly shaped colour-less natural beryl seed
(crystal)
Colourless natural beryl seed with prism faces
Synthetic emerald seed
Synthetic emerald seed
Growth zoning Layers parallel to the surface of the seed and parallel to prism faces
(crystal)
Layers parallel to the first- and second-order hexagonal prism, in the seed zoning parallel to
the basal faces
Layers parallel to prism and basal faces
Layers parallel to the first- and second-order hexagonal prism plus
basal faces
Colour zoning Strong zoning parallel to all crystal faces
Strong zoning parallel to all crystal faces
Strong zoning parallel to all crystal faces
Strong zoning parallel to all crystal faces
Incl
usio
ns
Growth tubes with nail-heads
Present (crystal) None None None
Isolated beryl crystals
Present Present Present Frequently present
Residual flux in various forms
Present Present Present Always present
Element(s) related to flux
Mo Mo Mo ± Y Mo
Cause of colour Cr, minor V and Fe Cr, Ni, minor Fe Cr, Ni, minor Fe Cr, Ni, minor Fe
Sources of samples: a C. Weise, Munichb German Gemmological Association, Idar-Obersteinc Museum für Naturkunde, Berlin; Inv. Nos. 2011 04554 and
2015 00054
d Technische Universität Bergakademie Freiberg e E. Gübelin, Lucerne (obtained by author KS in the late
1990s)f S. Fordemann, Herford
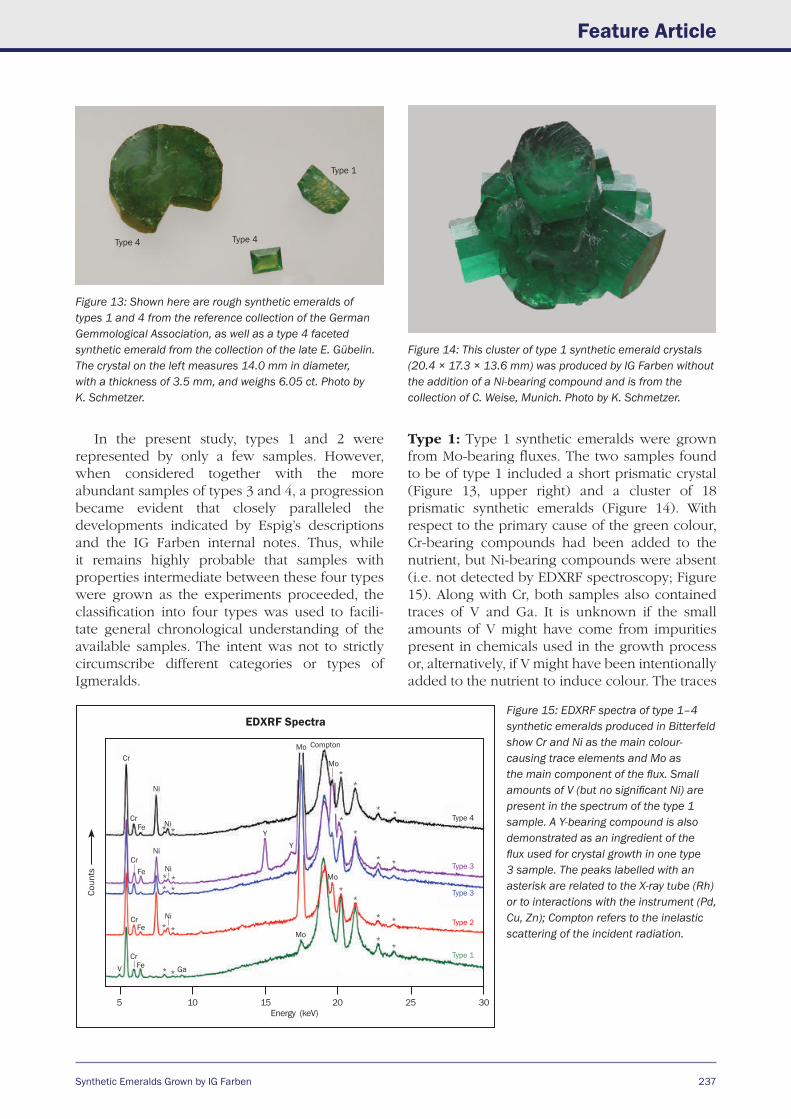
Synthetic Emeralds Grown by IG Farben
Feature Article
237
In the present study, types 1 and 2 were represented by only a few samples. However, when considered together with the more abundant samples of types 3 and 4, a progression became evident that closely paralleled the developments indicated by Espig’s descriptions and the IG Farben internal notes. Thus, while it remains highly probable that samples with properties intermediate between these four types were grown as the experiments proceeded, the classification into four types was used to facili-tate general chronological understanding of the available samples. The intent was not to strictly circumscribe different categories or types of Igmeralds.
Type 1: Type 1 synthetic emeralds were grown from Mo-bearing fluxes. The two samples found to be of type 1 included a short prismatic crystal (Figure 13, upper right) and a cluster of 18 prismatic synthetic emeralds (Figure 14). With respect to the primary cause of the green colour, Cr-bearing compounds had been added to the nutrient, but Ni-bearing compounds were absent (i.e. not detected by EDXRF spectroscopy; Figure 15). Along with Cr, both samples also contained traces of V and Ga. It is unknown if the small amounts of V might have come from impurities present in chemicals used in the growth process or, alternatively, if V might have been intentionally added to the nutrient to induce colour. The traces
Figure 13: Shown here are rough synthetic emeralds of types 1 and 4 from the reference collection of the German Gemmological Association, as well as a type 4 faceted synthetic emerald from the collection of the late E. Gübelin. The crystal on the left measures 14.0 mm in diameter, with a thickness of 3.5 mm, and weighs 6.05 ct. Photo by K. Schmetzer.
Figure 14: This cluster of type 1 synthetic emerald crystals (20.4 × 17.3 × 13.6 mm) was produced by IG Farben without the addition of a Ni-bearing compound and is from the collection of C. Weise, Munich. Photo by K. Schmetzer.
EDXRF Spectra
5 10 15 20 25 30 Energy (keV)
Coun
ts
Cr
Cr
Cr
Cr
CrV Fe
Fe
Fe Ni
Ni
Fe Ni
Ga
* *
**
**
* *
**
YY
Mo
Mo Compton
Mo
Mo
**
**
**
*
*
**
**
**
Type 4
Type 3
Type 3
Type 2
Type 1
Ni
Ni
Figure 15: EDXRF spectra of type 1–4 synthetic emeralds produced in Bitterfeld show Cr and Ni as the main colour-causing trace elements and Mo as the main component of the flux. Small amounts of V (but no significant Ni) are present in the spectrum of the type 1 sample. A Y-bearing compound is also demonstrated as an ingredient of the flux used for crystal growth in one type 3 sample. The peaks labelled with an asterisk are related to the X-ray tube (Rh) or to interactions with the instrument (Pd, Cu, Zn); Compton refers to the inelastic scattering of the incident radiation.
Type 1
Type 4 Type 4
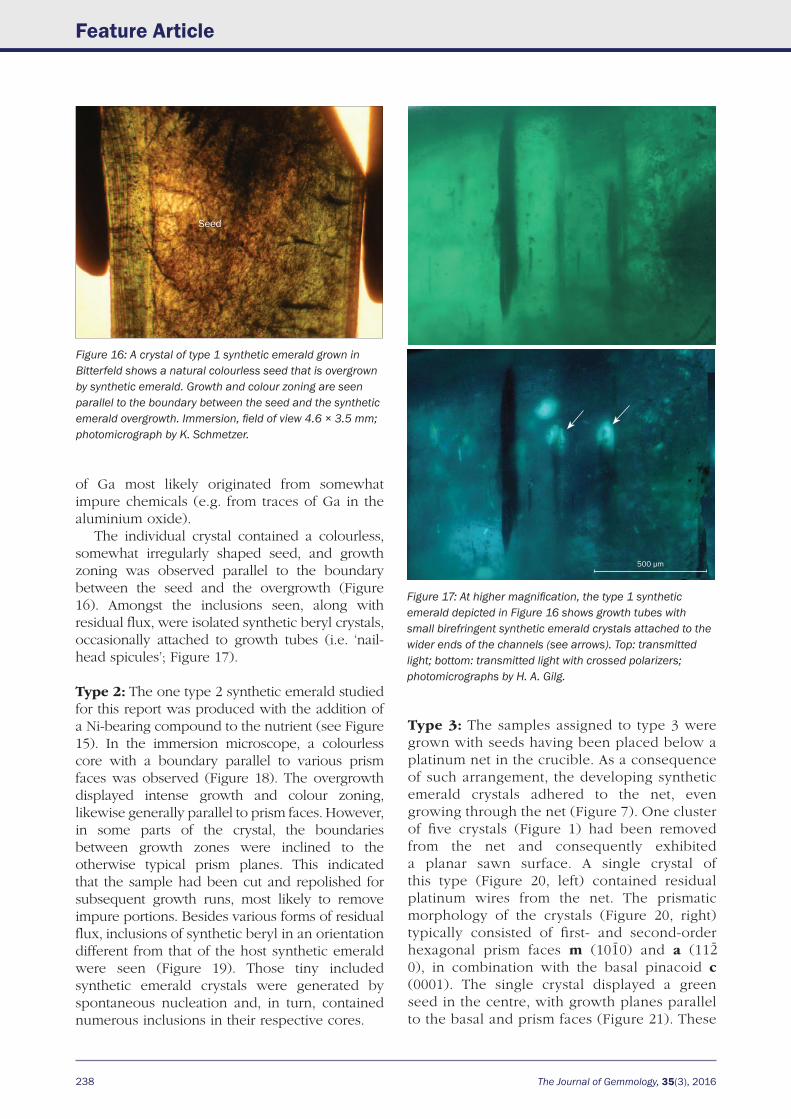
238 The Journal of Gemmology, 35(3), 2016
Feature Article
of Ga most likely originated from somewhat impure chemicals (e.g. from traces of Ga in the aluminium oxide).
The individual crystal contained a colourless, somewhat irregularly shaped seed, and growth zoning was observed parallel to the boundary between the seed and the overgrowth (Figure 16). Amongst the inclusions seen, along with residual flux, were isolated synthetic beryl crystals, occasionally attached to growth tubes (i.e. ‘nail-head spicules’; Figure 17).
Type 2: The one type 2 synthetic emerald studied for this report was produced with the addition of a Ni-bearing compound to the nutrient (see Figure 15). In the immersion microscope, a colourless core with a boundary parallel to various prism faces was observed (Figure 18). The overgrowth displayed intense growth and colour zoning, likewise generally parallel to prism faces. However, in some parts of the crystal, the boundaries between growth zones were inclined to the otherwise typical prism planes. This indicated that the sample had been cut and repolished for subsequent growth runs, most likely to remove impure portions. Besides various forms of residual flux, inclusions of synthetic beryl in an orientation different from that of the host synthetic emerald were seen (Figure 19). Those tiny included synthetic emerald crystals were generated by spontaneous nucleation and, in turn, contained numerous inclusions in their respective cores.
Figure 16: A crystal of type 1 synthetic emerald grown in Bitterfeld shows a natural colourless seed that is overgrown by synthetic emerald. Growth and colour zoning are seen parallel to the boundary between the seed and the synthetic emerald overgrowth. Immersion, field of view 4.6 × 3.5 mm; photomicrograph by K. Schmetzer.
Figure 17: At higher magnification, the type 1 synthetic emerald depicted in Figure 16 shows growth tubes with small birefringent synthetic emerald crystals attached to the wider ends of the channels (see arrows). Top: transmitted light; bottom: transmitted light with crossed polarizers; photomicrographs by H. A. Gilg.
Type 3: The samples assigned to type 3 were grown with seeds having been placed below a platinum net in the crucible. As a consequence of such arrangement, the developing synthetic emerald crystals adhered to the net, even growing through the net (Figure 7). One cluster of five crystals (Figure 1) had been removed from the net and consequently exhibited a planar sawn surface. A single crystal of this type (Figure 20, left) contained residual platinum wires from the net. The prismatic morphology of the crystals (Figure 20, right) typically consisted of first- and second-order hexagonal prism faces m (101-0) and a (112-
0), in combination with the basal pinacoid c (0001). The single crystal displayed a green seed in the centre, with growth planes parallel to the basal and prism faces (Figure 21). These
500 μm
Seed
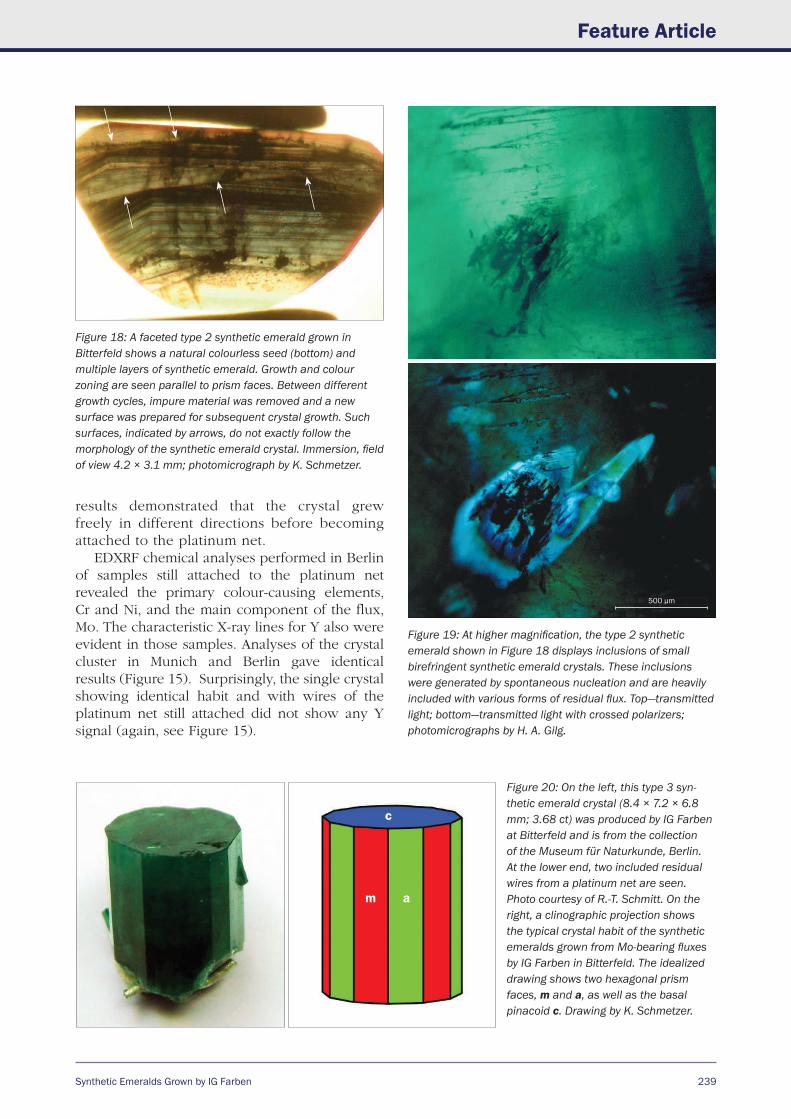
Synthetic Emeralds Grown by IG Farben
Feature Article
239
results demonstrated that the crystal grew freely in different directions before becoming attached to the platinum net.
EDXRF chemical analyses performed in Berlin of samples still attached to the platinum net revealed the primary colour-causing elements, Cr and Ni, and the main component of the flux, Mo. The characteristic X-ray lines for Y also were evident in those samples. Analyses of the crystal cluster in Munich and Berlin gave identical results (Figure 15). Surprisingly, the single crystal showing identical habit and with wires of the platinum net still attached did not show any Y signal (again, see Figure 15).
Figure 18: A faceted type 2 synthetic emerald grown in Bitterfeld shows a natural colourless seed (bottom) and multiple layers of synthetic emerald. Growth and colour zoning are seen parallel to prism faces. Between different growth cycles, impure material was removed and a new surface was prepared for subsequent crystal growth. Such surfaces, indicated by arrows, do not exactly follow the morphology of the synthetic emerald crystal. Immersion, field of view 4.2 × 3.1 mm; photomicrograph by K. Schmetzer.
Figure 19: At higher magnification, the type 2 synthetic emerald shown in Figure 18 displays inclusions of small birefringent synthetic emerald crystals. These inclusions were generated by spontaneous nucleation and are heavily included with various forms of residual flux. Top—transmitted light; bottom—transmitted light with crossed polarizers; photomicrographs by H. A. Gilg.
c
Figure 20: On the left, this type 3 syn-thetic emerald crystal (8.4 × 7.2 × 6.8 mm; 3.68 ct) was produced by IG Farben at Bitterfeld and is from the collection of the Museum für Naturkunde, Berlin. At the lower end, two included residual wires from a platinum net are seen. Photo courtesy of R.-T. Schmitt. On the right, a clinographic projection shows the typical crystal habit of the synthetic emeralds grown from Mo-bearing fluxes by IG Farben in Bitterfeld. The idealized drawing shows two hexagonal prism faces, m and a, as well as the basal pinacoid c. Drawing by K. Schmetzer.
am
500 μm
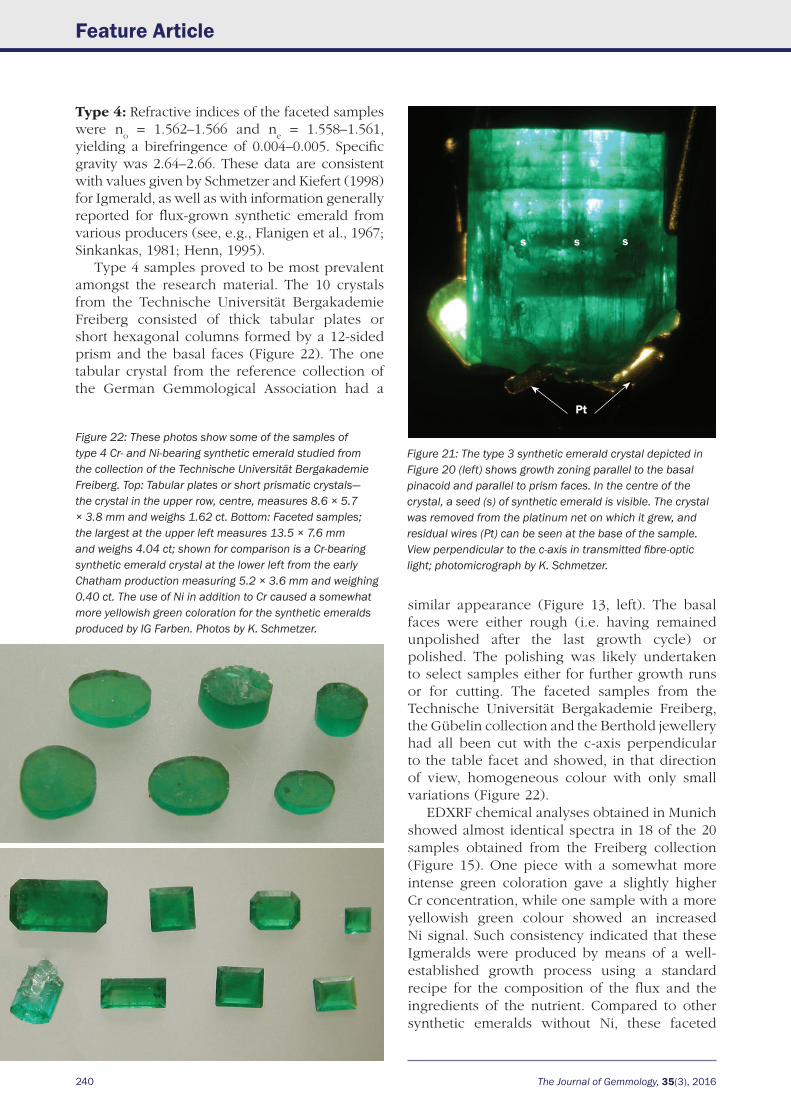
240 The Journal of Gemmology, 35(3), 2016
Feature Article
Figure 21: The type 3 synthetic emerald crystal depicted in Figure 20 (left) shows growth zoning parallel to the basal pinacoid and parallel to prism faces. In the centre of the crystal, a seed (s) of synthetic emerald is visible. The crystal was removed from the platinum net on which it grew, and residual wires (Pt) can be seen at the base of the sample. View perpendicular to the c-axis in transmitted fibre-optic light; photomicrograph by K. Schmetzer.
Figure 22: These photos show some of the samples of type 4 Cr- and Ni-bearing synthetic emerald studied from the collection of the Technische Universität Bergakademie Freiberg. Top: Tabular plates or short prismatic crystals—the crystal in the upper row, centre, measures 8.6 × 5.7 × 3.8 mm and weighs 1.62 ct. Bottom: Faceted samples; the largest at the upper left measures 13.5 × 7.6 mm and weighs 4.04 ct; shown for comparison is a Cr-bearing synthetic emerald crystal at the lower left from the early Chatham production measuring 5.2 × 3.6 mm and weighing 0.40 ct. The use of Ni in addition to Cr caused a somewhat more yellowish green coloration for the synthetic emeralds produced by IG Farben. Photos by K. Schmetzer.
Type 4: Refractive indices of the faceted samples were n
o = 1.562–1.566 and n
e = 1.558–1.561,
yielding a birefringence of 0.004–0.005. Specific gravity was 2.64–2.66. These data are consistent with values given by Schmetzer and Kiefert (1998) for Igmerald, as well as with information generally reported for flux-grown synthetic emerald from various producers (see, e.g., Flanigen et al., 1967; Sinkankas, 1981; Henn, 1995).
Type 4 samples proved to be most prevalent amongst the research material. The 10 crystals from the Technische Universität Bergakademie Freiberg consisted of thick tabular plates or short hexagonal columns formed by a 12-sided prism and the basal faces (Figure 22). The one tabular crystal from the reference collection of the German Gemmological Association had a
similar appearance (Figure 13, left). The basal faces were either rough (i.e. having remained unpolished after the last growth cycle) or polished. The polishing was likely undertaken to select samples either for further growth runs or for cutting. The faceted samples from the Technische Universität Bergakademie Freiberg, the Gübelin collection and the Berthold jewellery had all been cut with the c-axis perpendicular to the table facet and showed, in that direction of view, homogeneous colour with only small variations (Figure 22).
EDXRF chemical analyses obtained in Munich showed almost identical spectra in 18 of the 20 samples obtained from the Freiberg collection (Figure 15). One piece with a somewhat more intense green coloration gave a slightly higher Cr concentration, while one sample with a more yellowish green colour showed an increased Ni signal. Such consistency indicated that these Igmeralds were produced by means of a well-established growth process using a standard recipe for the composition of the flux and the ingredients of the nutrient. Compared to other synthetic emeralds without Ni, these faceted
s s s
Pt
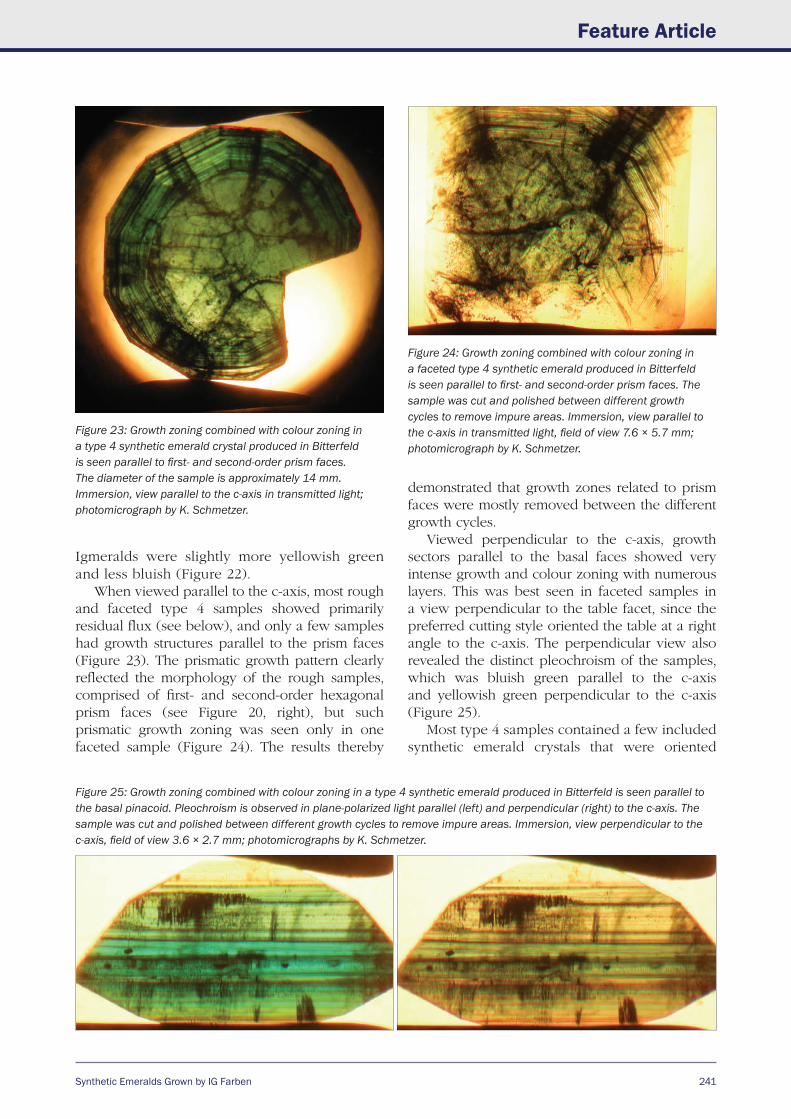
Synthetic Emeralds Grown by IG Farben
Feature Article
241
Igmeralds were slightly more yellowish green and less bluish (Figure 22).
When viewed parallel to the c-axis, most rough and faceted type 4 samples showed primarily residual flux (see below), and only a few samples had growth structures parallel to the prism faces (Figure 23). The prismatic growth pattern clearly reflected the morphology of the rough samples, comprised of first- and second-order hexagonal prism faces (see Figure 20, right), but such prismatic growth zoning was seen only in one faceted sample (Figure 24). The results thereby
Figure 23: Growth zoning combined with colour zoning in a type 4 synthetic emerald crystal produced in Bitterfeld is seen parallel to first- and second-order prism faces. The diameter of the sample is approximately 14 mm. Immersion, view parallel to the c-axis in transmitted light; photomicrograph by K. Schmetzer.
demonstrated that growth zones related to prism faces were mostly removed between the different growth cycles.
Viewed perpendicular to the c-axis, growth sectors parallel to the basal faces showed very intense growth and colour zoning with numerous layers. This was best seen in faceted samples in a view perpendicular to the table facet, since the preferred cutting style oriented the table at a right angle to the c-axis. The perpendicular view also revealed the distinct pleochroism of the samples, which was bluish green parallel to the c-axis and yellowish green perpendicular to the c-axis (Figure 25).
Most type 4 samples contained a few included synthetic emerald crystals that were oriented
Figure 24: Growth zoning combined with colour zoning in a faceted type 4 synthetic emerald produced in Bitterfeld is seen parallel to first- and second-order prism faces. The sample was cut and polished between different growth cycles to remove impure areas. Immersion, view parallel to the c-axis in transmitted light, field of view 7.6 × 5.7 mm; photomicrograph by K. Schmetzer.
Figure 25: Growth zoning combined with colour zoning in a type 4 synthetic emerald produced in Bitterfeld is seen parallel to the basal pinacoid. Pleochroism is observed in plane-polarized light parallel (left) and perpendicular (right) to the c-axis. The sample was cut and polished between different growth cycles to remove impure areas. Immersion, view perpendicular to the c-axis, field of view 3.6 × 2.7 mm; photomicrographs by K. Schmetzer.
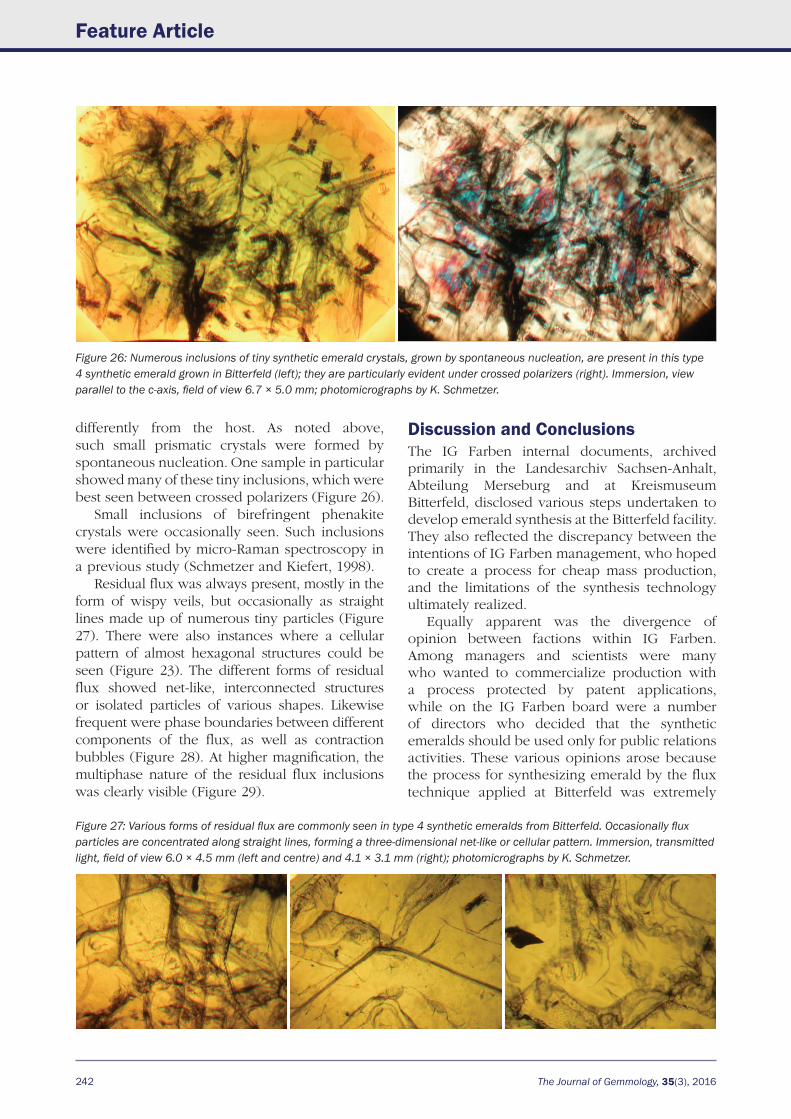
242 The Journal of Gemmology, 35(3), 2016
Feature Article
differently from the host. As noted above, such small prismatic crystals were formed by spontaneous nucleation. One sample in particular showed many of these tiny inclusions, which were best seen between crossed polarizers (Figure 26).
Small inclusions of birefringent phenakite crystals were occasionally seen. Such inclusions were identified by micro-Raman spectroscopy in a previous study (Schmetzer and Kiefert, 1998).
Residual flux was always present, mostly in the form of wispy veils, but occasionally as straight lines made up of numerous tiny particles (Figure 27). There were also instances where a cellular pattern of almost hexagonal structures could be seen (Figure 23). The different forms of residual flux showed net-like, interconnected structures or isolated particles of various shapes. Likewise frequent were phase boundaries between different components of the flux, as well as contraction bubbles (Figure 28). At higher magnification, the multiphase nature of the residual flux inclusions was clearly visible (Figure 29).
Figure 26: Numerous inclusions of tiny synthetic emerald crystals, grown by spontaneous nucleation, are present in this type 4 synthetic emerald grown in Bitterfeld (left); they are particularly evident under crossed polarizers (right). Immersion, view parallel to the c-axis, field of view 6.7 × 5.0 mm; photomicrographs by K. Schmetzer.
Figure 27: Various forms of residual flux are commonly seen in type 4 synthetic emeralds from Bitterfeld. Occasionally flux particles are concentrated along straight lines, forming a three-dimensional net-like or cellular pattern. Immersion, transmitted light, field of view 6.0 × 4.5 mm (left and centre) and 4.1 × 3.1 mm (right); photomicrographs by K. Schmetzer.
Discussion and ConclusionsThe IG Farben internal documents, archived primarily in the Landesarchiv Sachsen-Anhalt, Abteilung Merseburg and at Kreismuseum Bitterfeld, disclosed various steps undertaken to develop emerald synthesis at the Bitterfeld facility. They also reflected the discrepancy between the intentions of IG Farben management, who hoped to create a process for cheap mass production, and the limitations of the synthesis technology ultimately realized.
Equally apparent was the divergence of opinion between factions within IG Farben. Among managers and scientists were many who wanted to commercialize production with a process protected by patent applications, while on the IG Farben board were a number of directors who decided that the synthetic emeralds should be used only for public relations activities. These various opinions arose because the process for synthesizing emerald by the flux technique applied at Bitterfeld was extremely
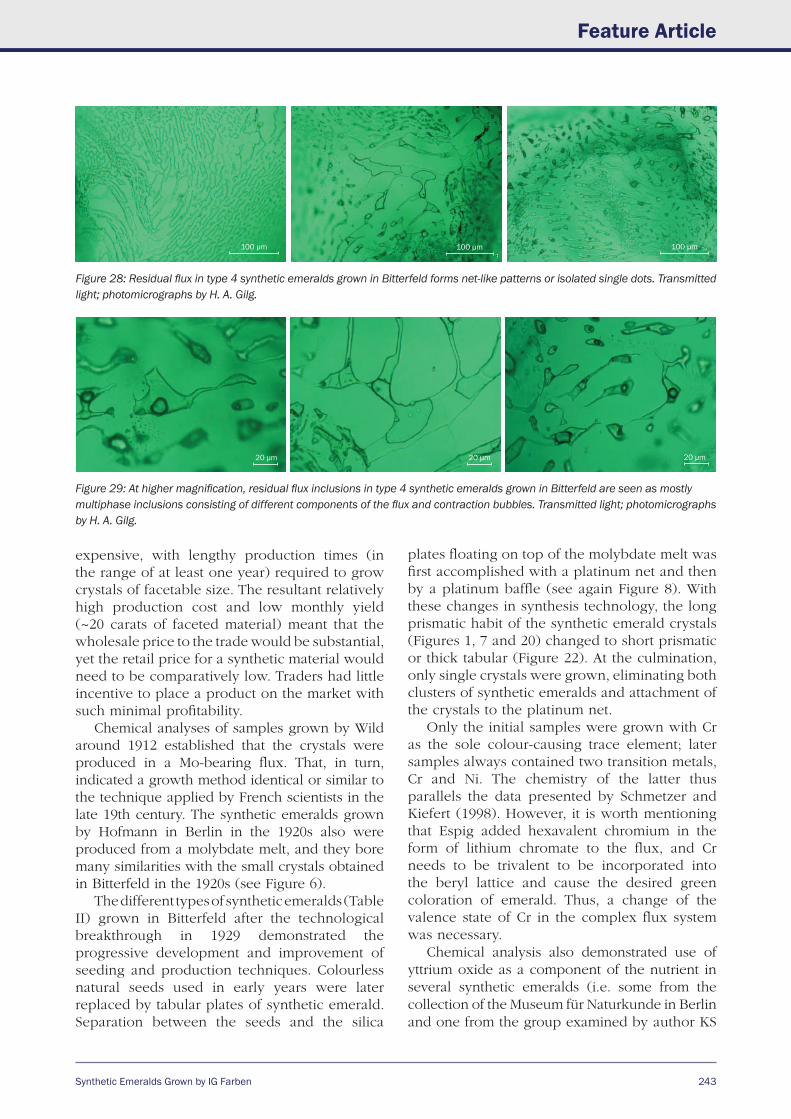
Synthetic Emeralds Grown by IG Farben
Feature Article
243
expensive, with lengthy production times (in the range of at least one year) required to grow crystals of facetable size. The resultant relatively high production cost and low monthly yield (~20 carats of faceted material) meant that the wholesale price to the trade would be substantial, yet the retail price for a synthetic material would need to be comparatively low. Traders had little incentive to place a product on the market with such minimal profitability.
Chemical analyses of samples grown by Wild around 1912 established that the crystals were produced in a Mo-bearing flux. That, in turn, indicated a growth method identical or similar to the technique applied by French scientists in the late 19th century. The synthetic emeralds grown by Hofmann in Berlin in the 1920s also were produced from a molybdate melt, and they bore many similarities with the small crystals obtained in Bitterfeld in the 1920s (see Figure 6).
The different types of synthetic emeralds (Table II) grown in Bitterfeld after the technological breakthrough in 1929 demonstrated the progressive development and improvement of seeding and production techniques. Colourless natural seeds used in early years were later replaced by tabular plates of synthetic emerald. Separation between the seeds and the silica
plates floating on top of the molybdate melt was first accomplished with a platinum net and then by a platinum baffle (see again Figure 8). With these changes in synthesis technology, the long prismatic habit of the synthetic emerald crystals (Figures 1, 7 and 20) changed to short prismatic or thick tabular (Figure 22). At the culmination, only single crystals were grown, eliminating both clusters of synthetic emeralds and attachment of the crystals to the platinum net.
Only the initial samples were grown with Cr as the sole colour-causing trace element; later samples always contained two transition metals, Cr and Ni. The chemistry of the latter thus parallels the data presented by Schmetzer and Kiefert (1998). However, it is worth mentioning that Espig added hexavalent chromium in the form of lithium chromate to the flux, and Cr needs to be trivalent to be incorporated into the beryl lattice and cause the desired green coloration of emerald. Thus, a change of the valence state of Cr in the complex flux system was necessary.
Chemical analysis also demonstrated use of yttrium oxide as a component of the nutrient in several synthetic emeralds (i.e. some from the collection of the Museum für Naturkunde in Berlin and one from the group examined by author KS
Figure 29: At higher magnification, residual flux inclusions in type 4 synthetic emeralds grown in Bitterfeld are seen as mostly multiphase inclusions consisting of different components of the flux and contraction bubbles. Transmitted light; photomicrographs by H. A. Gilg.
Figure 28: Residual flux in type 4 synthetic emeralds grown in Bitterfeld forms net-like patterns or isolated single dots. Transmitted light; photomicrographs by H. A. Gilg.
100 μm 100 μm 100 μm
20 μm 20 μm 20 μm
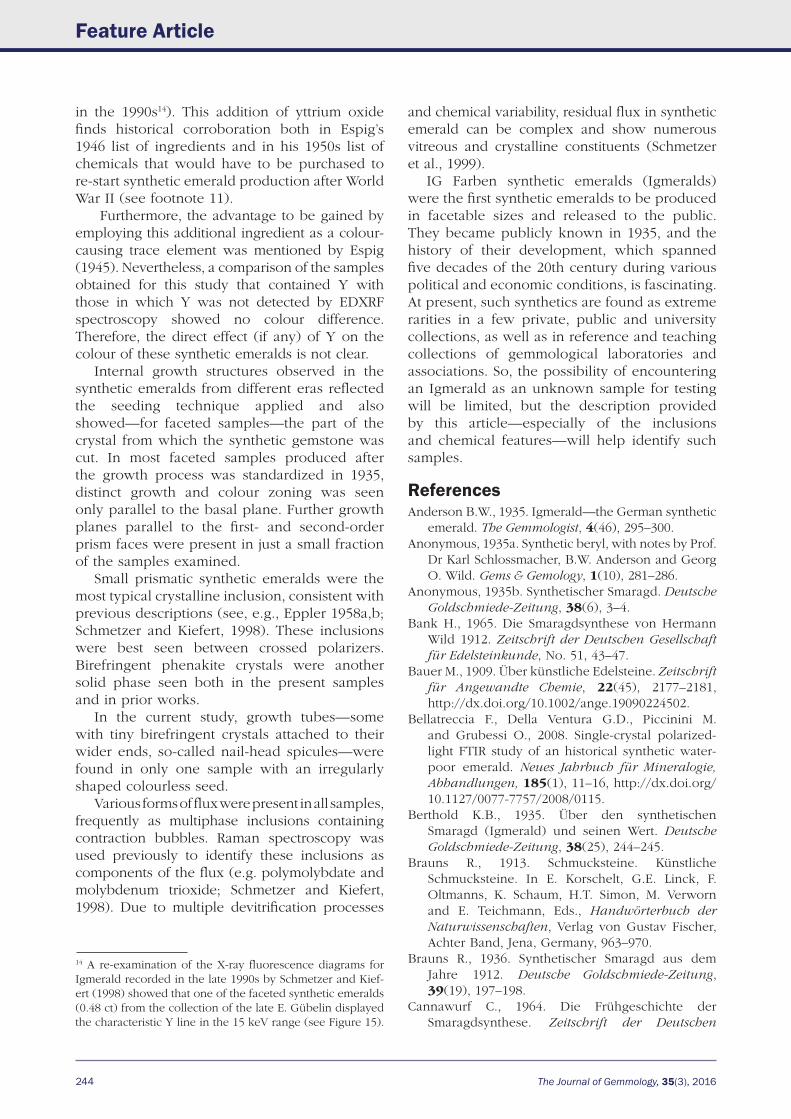
244 The Journal of Gemmology, 35(3), 2016
Feature Article
in the 1990s14). This addition of yttrium oxide finds historical corroboration both in Espig’s 1946 list of ingredients and in his 1950s list of chemicals that would have to be purchased to re-start synthetic emerald production after World War II (see footnote 11).
Furthermore, the advantage to be gained by employing this additional ingredient as a colour-causing trace element was mentioned by Espig (1945). Nevertheless, a comparison of the samples obtained for this study that contained Y with those in which Y was not detected by EDXRF spectroscopy showed no colour difference. Therefore, the direct effect (if any) of Y on the colour of these synthetic emeralds is not clear.
Internal growth structures observed in the synthetic emeralds from different eras reflected the seeding technique applied and also showed—for faceted samples—the part of the crystal from which the synthetic gemstone was cut. In most faceted samples produced after the growth process was standardized in 1935, distinct growth and colour zoning was seen only parallel to the basal plane. Further growth planes parallel to the first- and second-order prism faces were present in just a small fraction of the samples examined.
Small prismatic synthetic emeralds were the most typical crystalline inclusion, consistent with previous descriptions (see, e.g., Eppler 1958a,b; Schmetzer and Kiefert, 1998). These inclusions were best seen between crossed polarizers. Birefringent phenakite crystals were another solid phase seen both in the present samples and in prior works.
In the current study, growth tubes—some with tiny birefringent crystals attached to their wider ends, so-called nail-head spicules—were found in only one sample with an irregularly shaped colourless seed.
Various forms of flux were present in all samples, frequently as multiphase inclusions containing contraction bubbles. Raman spectroscopy was used previously to identify these inclusions as components of the flux (e.g. polymolybdate and molybdenum trioxide; Schmetzer and Kiefert, 1998). Due to multiple devitrification processes
and chemical variability, residual flux in synthetic emerald can be complex and show numerous vitreous and crystalline constituents (Schmetzer et al., 1999).
IG Farben synthetic emeralds (Igmeralds) were the first synthetic emeralds to be produced in facetable sizes and released to the public. They became publicly known in 1935, and the history of their development, which spanned five decades of the 20th century during various political and economic conditions, is fascinating. At present, such synthetics are found as extreme rarities in a few private, public and university collections, as well as in reference and teaching collections of gemmological laboratories and associations. So, the possibility of encountering an Igmerald as an unknown sample for testing will be limited, but the description provided by this article—especially of the inclusions and chemical features—will help identify such samples.
References Anderson B.W., 1935. Igmerald—the German synthetic
emerald. The Gemmologist, 4(46), 295–300.Anonymous, 1935a. Synthetic beryl, with notes by Prof.
Dr Karl Schlossmacher, B.W. Anderson and Georg O. Wild. Gems & Gemology, 1(10), 281–286.
Anonymous, 1935b. Synthetischer Smaragd. Deutsche Goldschmiede-Zeitung, 38(6), 3–4.
Bank H., 1965. Die Smaragdsynthese von Hermann Wild 1912. Zeitschrift der Deutschen Gesellschaft für Edelsteinkunde, No. 51, 43–47.
Bauer M., 1909. Über künstliche Edelsteine. Zeitschrift für Angewandte Chemie, 22(45), 2177–2181, http://dx.doi.org/10.1002/ange.19090224502.
Bellatreccia F., Della Ventura G.D., Piccinini M. and Grubessi O., 2008. Single-crystal polarized-light FTIR study of an historical synthetic water-poor emerald. Neues Jahrbuch für Mineralogie, Abhandlungen, 185(1), 11–16, http://dx.doi.org/ 10.1127/0077-7757/2008/0115.
Berthold K.B., 1935. Über den synthetischen Smaragd (Igmerald) und seinen Wert. Deutsche Goldschmiede-Zeitung, 38(25), 244–245.
Brauns R., 1913. Schmucksteine. Künstliche Schmucksteine. In E. Korschelt, G.E. Linck, F. Oltmanns, K. Schaum, H.T. Simon, M. Verworn and E. Teichmann, Eds., Handwörterbuch der Naturwissenschaften, Verlag von Gustav Fischer, Achter Band, Jena, Germany, 963–970.
Brauns R., 1936. Synthetischer Smaragd aus dem Jahre 1912. Deutsche Goldschmiede-Zeitung, 39(19), 197–198.
Cannawurf C., 1964. Die Frühgeschichte der Smaragdsynthese. Zeitschrift der Deutschen
14 A re-examination of the X-ray fluorescence diagrams for Igmerald recorded in the late 1990s by Schmetzer and Kief-ert (1998) showed that one of the faceted synthetic emeralds (0.48 ct) from the collection of the late E. Gübelin displayed the characteristic Y line in the 15 keV range (see Figure 15).
Synthetic Emeralds Grown by IG Farben
Feature Article
245
Gesellschaft für Edelsteinkunde, No. 46, 7–11.Conradt O., 1959. Hermann Wild und seine Edelstein-
Synthese. Heimatkalender des Landkreises Birkenfeld, 1959, 93–97.
Diehl R., 1977. Neues zum Thema “Synthetischer Smaragd”: Besuch bei Pierre Gilson. Zeitschrift der Deutschen Gemmologische Gesellschaft, 26(2), 61–75.
Doelter C., 1909. Über die Einwirkung von Radium- und ultravioletten Strahlen auf die Mineralfarben. Monatshefte für Chemie und verwandte Teile anderer Wissenschaften, 30(2), 179–229, http://dx.doi.org/10.1007/BF01518117.
Doelter C., 1913. Neuere Darstellungen künstlicher Edelsteine. Die Naturwissenschaften, 1(46), 1107–1110, http://dx.doi.org/10.1007/bf01493156.
Doermer L., 1929. Edelsteine, künstliche. In F. Ullmann, Ed., Encyklopädie der Technischen Chemie, 2. Auflage, 4, Urban & Schwarzenberg, Berlin, Germany, 118–137.
(Dreibrodt O., 1914.) Verfahren und Apparat zur Züchtung großer Kristalle durch Kristallisation in Bewegung aus Lösungen und Schmelzflüssen. German Patent DE 273 929, assigned to Elektrochemische Werke GmbH, 12 May.15
Dreibrodt O., 1920. Method of and Apparatus for Forming Large Crystals. U.S. Patent 1353571 A, assigned to Elektrochemische Werke GmbH, 21 September.
Dreibrodt O., Espig H. and Strauss D., 1923. Verfahren zur Herstellung grüner Korunde von epidotähnlicher Färbung. German Patent DE 385 374, assigned to Elektrochemische Werke GmbH, 23 November.
Dreibrodt O., Espig H. and Strauss D., 1924. Verfahren zur Herstellung smaragdähnlich grüner Korunde. German Patent DE 390 794, assigned to Elek-trochemische Werke GmbH, 23 February.
Eppler W.F., 1935. Der synthetische Smaragd. Deutsche Goldschmiede-Zeitung, 38(15), 144–146.
Eppler W.F., 1936. Neue Untersuchungen an synthetischen Smaragden. Deutsche Gold-schmiede-Zeitung, 39(21), 215–217.
Eppler W.F., 1958a. Synthetic emerald. Journal of Gemmology, 6(8), 360–369, http://dx.doi.org/ 10.15506/jog.1958.6.8.360.
Eppler W.F., 1958b. Synthetischer Smaragd. Deutsche Goldschmiede-Zeitung, 56(4–7), 193–197, 249–251, 327–329, 381–385.
Eppler W.F., 1961. Herbert Smith memorial lecture. Journal of Gemmology, 8(3), 88–95, http://dx.doi.org/10.15506/jog.1961.8.3.88.
Espig H., 1930. Die Smaragdsynthese. Internal report, Kreismuseum Bitterfeld, file SE 16, June, 21 pp.
Espig H., 1935. Der synthetische Smaragd. Zeitschrift für Kristallographie, 92, 387–391, http://dx.doi.org/10.1524/zkri.1935.92.1.387.
Espig H., 1945. Die Herstellung des synthetischen Smaragds. Internal report, private property of K.-D. Heinrich, October, 5 pp.
Espig H., 1946. Versuch einer Smaragdsynthese. Internal report, Kreismuseum Bitterfeld, file SE 10, February, 4 pp.
Espig H., 1960. Die Synthese des Smaragds. Chemische Technik, 12(6), 327–331.
Espig H., 1961. Die Synthese des Smaragds. Deutsche Goldschmiede-Zeitung, 59(10), 660–663.
Espig H., 1962. Die Synthese des Smaragds und einiger anderer Minerale. Berichte der Geologischen Gesellschaft der DDR, 7, 464–475.
Fischer W., 1955. Smaragd-Synthese. In W. Foerst, Ed., Ullmanns Encyklopädie der Technischen Chemie, 3. Auflage, 6. Band, Urban & Schwarzenberg, Munich, Germany, 246–248.
Flanigen E.M., Breck D.W., Mumbach N.R. and Taylor A.M., 1967. Characteristics of synthetic emeralds. American Mineralogist, 52(5–6), 744–772.
Hautefeuille P. and Perrey A., 1888. Sur la reproduction de la phénacite et de l’émeraude. Comptes Rendus Hebdomadaires des Séances de l’Académie des Sciences, 106, 1800–1803.
Hautefeuille P. and Perrey A., 1890. Sur les combinaisons silicatées de la glucine. Annales de Chimie et de Physique, 6(20), 447–480.
Henn U., 1995. Edelsteinkundliches Praktikum. Gemmologie: Zeitschrift der Deutschen Gem-mologischen Gesellschaft, 44(4), 3–112.
Hunt W.F., 1921. Notes and news: An apparatus for growing large crystals. American Mineralogist, 6 (5), 90.
Jaeger M. and Espig H., 1935. Der synthetische Smaragd. Deutsche Goldschmiede-Zeitung, 38 (35), 347–349.
Metzger W., 2000. Ein Goldschmied auf der Suche nach dem »Großdeutschen Stil«. Kritische Berichte, 28(3), 70–86.
Michel H., 1914. Die künstlichen Edelsteine. Verlag von Wilhelm Diebener, Leipzig, Germa ny, 109 pp.
Michel H., 1915. Künstliche Edelsteine. Schriften des Vereins zur Verbreitung naturwissenschaftlicher Kenntnisse, 55, 73–112.
Michel H., 1927. Neues von Edelsteinen. Verein zur Verbreitung naturwissenschaftlicher Kenntnisse, 67, 30–58.
Michel H. and Riedl G., 1925. Die Auswertung der Absorptions- und Lumineszenzerscheinungen der Edelsteine zu ihrer Unterscheidung. Annalen des Naturhistorischen Museums in Wien, 38, 169–173.
15 Inventors during this time were not mentioned in Ger-man patent documents. However, a comparison with the U.S. patent, and with numerous internal letters, shows this was Dreibrodt’s invention.
246 The Journal of Gemmology, 35(3), 2016
Miethe A., 1908. Künstliche Edelsteine. Deutsche Goldschmiede-Zeitung, 11(1), 12–14.
Mitteilungen der Wiener Mineralogischen Gesell-schaft, 1909. Review of a presentation of A. von Loehr entitled: Deutsche Edelsteingesellschaft. Tschermaks mineralogische und petrographische Mitteilungen, 28(1–2), 168–169.
Nassau K., 1976a. Synthetic emerald: The confusing history and the current technologies. Lapidary Journal, 30(1,2), 196–202, 468–492.
Nassau K., 1976b. Synthetic emerald: The confusing history and the current technologies. Journal of Crystal Growth, 35, 211–222, http://dx.doi.org/10.1016/0022-0248(76)90172-x.
Recker K., 1973. Zur künstlichen Herstellung von Schmucksteinen. Zeitschrift der Deutschen Gem-mologischen Gesellschaft, 22(4), 145–178.
Rühle C., 1952. Footnote about Igmerald. Deutsche Goldschmiede-Zeitung, 50(11), 322.
Schiebold E., 1935. Vergleichende Untersuchungen an natürlichen und synthetischen Smaragdkristallen. Zeitschrift für Kristallographie, 92(1–6), 435–473, http://dx.doi.org/10.1524/zkri.1935.92.1.435.
Schmetzer K., 2002. More than 100 years of emerald synthesis. In G. Giuliani, M. Jarnot, G. Neumeier, T. Ottaway, J. Sinkankas and G. Staebler, Eds., Emeralds of the World, extraLapis English No. 2, Lapis International LLC, East Hampton, Connecticut, USA, 84–92.
Schmetzer K. and Kiefert L., 1998. The colour of Igmerald: I.G. Farbenindustrie flux-grown synthetic emerald. Journal of Gemmology, 26(3), 145–155, http://dx.doi.org/10.15506/jog.1998.26. 3.145.
Schmetzer K., Kiefert L. and Bernhardt H.-J., 1999. Multicomponent inclusions in Nacken synthetic emeralds. Journal of Gemmology, 26(8), 486–500, http://dx.doi.org/10.15506/jog.1999.26.8.487.
Sinkankas J., 1981. Emerald and Other Beryls, Chilton Book Co., Radnor, Pennsylvania, USA, 665 pp.
Vaupel E., 2015. Edelsteine aus der Fabrik. Tech-nikgeschichte, 82(4), 273–302, http://dx.doi.org/ 10.5771/0040-117x-2015-4-273.
Webster R., 1952. The secrets of synthetic emerald. The Gemmologist, 21(252), 117–121.
Webster R., 1955. The emerald. Journal of Gemmology, 5(4), 185–221, http://dx.doi.org/10.15506/jog. 1955.5.4.185.
Webster R., 1958. Synthesis of emerald. The Gemmologist, 27(328), 203–206.
The AuthorsDr Karl SchmetzerD-85238 Petershausen, GermanyEmail: [email protected]
Prof. Dr H. Albert GilgLehrstuhl für Ingenieurgeologie, Technische Universität München, D-80333 Munich, Germany
Prof. Dr Elisabeth Vaupel Forschungsinstitut für Wissenschafts- und Technikgeschichte, Deutsches Museum München, D-80538 Munich, Germany
AcknowledgementsThe authors are grateful to the following individuals and institutions for kindly loaning samples and for providing information used in this study: S. Fordemann, Herford, Germany; Dr V. Hammer, Naturhistorisches Museum, Vienna, Austria; Prof. G. Heide and M. Hagen, Technische Universität Bergakademie, Freiberg, Germany; K.-D. Heinrich, Sanders-dorf, Germany; Dr U. Henn, German Gemmological Association, Idar-Oberstein, Germany; D. Jerusalem, Idar-Oberstein; S. Pick, Kreismuseum Bitterfeld, Bitterfeld, Germany; M. Schatz, Landesarchiv Sachsen-Anhalt, Merseburg, Germany; Dr R.-T. Schmitt, Museum für Naturkunde, Berlin, Germany; Prof. E. Schlatter, Nottuln, Germany; Prof. H. Vollstädt, Seddiner See, Germany; C. Weise, Munich, Germany; and Dr A. Zacke, Bonn, Germany. X-ray fluorescence spectra of three synthetic emeralds from the Museum für Naturkunde were recorded by Dr L. Hecht, Berlin.
Wisniak J., 2014. Four brilliant students of Henri Sainte-Claire Deville. 3. Paul Gabriel Hautefeuille. Educación Química, 25(E1), 258–266, http://dx.doi.org/http://dx.doi.org/10.1016/s0187-893x (14)70566-x.
Feature Article
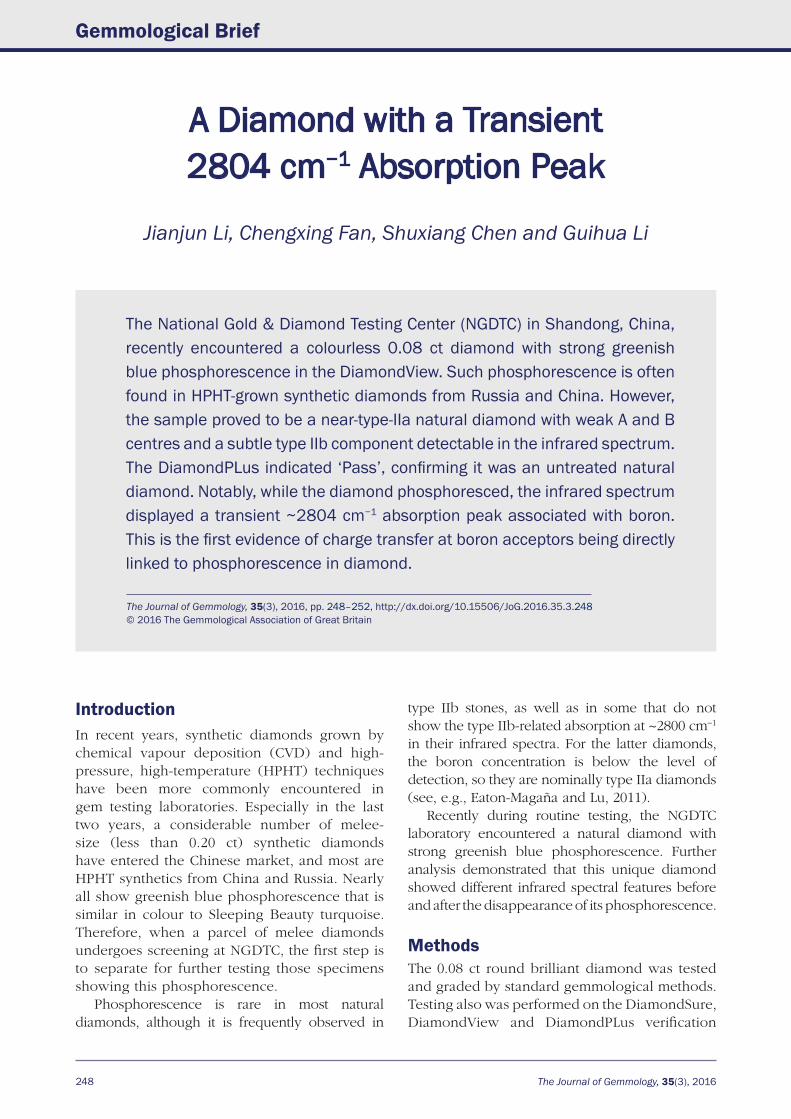
248 The Journal of Gemmology, 35(3), 2016
Gemmological Brief
The Journal of Gemmology, 35(3), 2016, pp. 248–252, http://dx.doi.org/10.15506/JoG.2016.35.3.248© 2016 The Gemmological Association of Great Britain
The National Gold & Diamond Testing Center (NGDTC) in Shandong, China, recently encountered a colourless 0.08 ct diamond with strong greenish blue phosphorescence in the DiamondView. Such phosphorescence is often found in HPHT-grown synthetic diamonds from Russia and China. However, the sample proved to be a near-type-IIa natural diamond with weak A and B centres and a subtle type IIb component detectable in the infrared spectrum. The DiamondPLus indicated ‘Pass’, confirming it was an untreated natural diamond. Notably, while the diamond phosphoresced, the infrared spectrum displayed a transient ~2804 cm−1 absorption peak associated with boron. This is the first evidence of charge transfer at boron acceptors being directly linked to phosphorescence in diamond.
A Diamond with a Transient 2804 cm−1 Absorption Peak
Jianjun Li, Chengxing Fan, Shuxiang Chen and Guihua Li
IntroductionIn recent years, synthetic diamonds grown by chemical vapour deposition (CVD) and high-pressure, high-temperature (HPHT) techniques have been more commonly encountered in gem testing laboratories. Especially in the last two years, a considerable number of melee-size (less than 0.20 ct) synthetic diamonds have entered the Chinese market, and most are HPHT synthetics from China and Russia. Nearly all show greenish blue phosphorescence that is similar in colour to Sleeping Beauty turquoise. Therefore, when a parcel of melee diamonds undergoes screening at NGDTC, the first step is to separate for further testing those specimens showing this phosphorescence.
Phosphorescence is rare in most natural diamonds, although it is frequently observed in
type IIb stones, as well as in some that do not show the type IIb-related absorption at ~2800 cm−1 in their infrared spectra. For the latter diamonds, the boron concentration is below the level of detection, so they are nominally type IIa diamonds (see, e.g., Eaton-Magaña and Lu, 2011).
Recently during routine testing, the NGDTC laboratory encountered a natural diamond with strong greenish blue phosphorescence. Further analysis demonstrated that this unique diamond showed different infrared spectral features before and after the disappearance of its phosphorescence.
MethodsThe 0.08 ct round brilliant diamond was tested and graded by standard gemmological methods. Testing also was performed on the DiamondSure, DiamondView and DiamondPLus verification
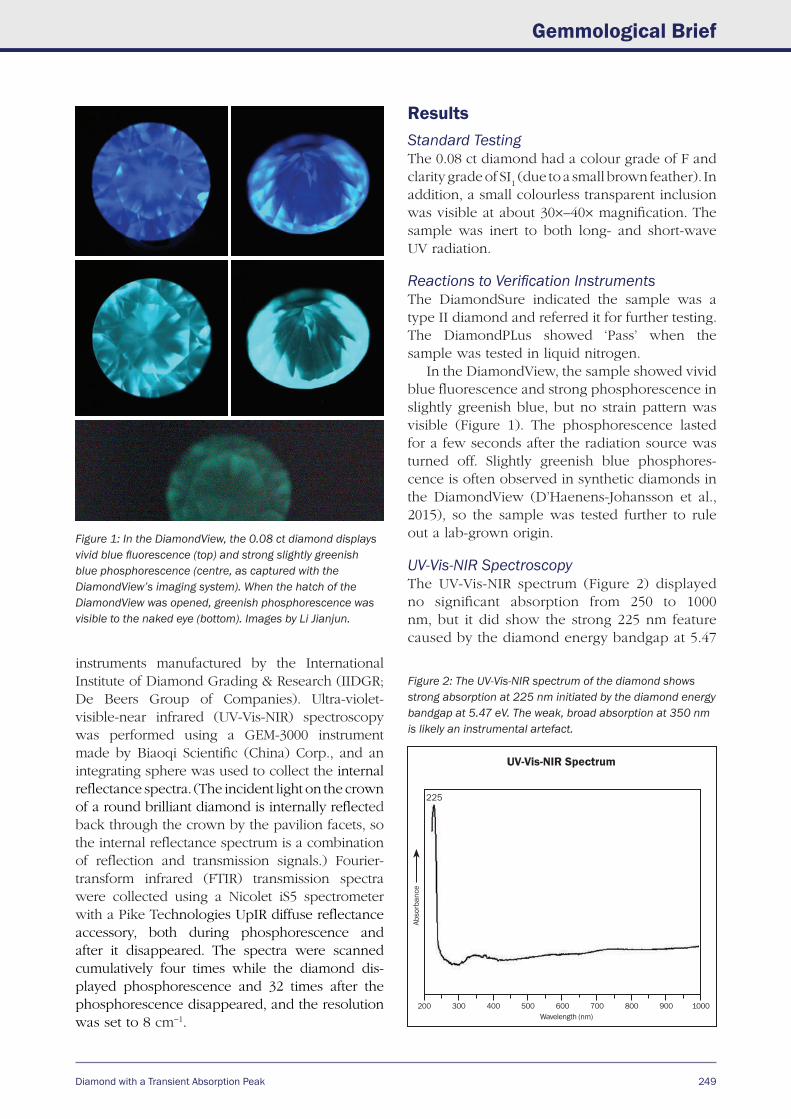
Diamond with a Transient Absorption Peak
Gemmological Brief
249
instruments manufactured by the International Institute of Diamond Grading & Research (IIDGR; De Beers Group of Companies). Ultra-violet-visible-near infrared (UV-Vis-NIR) spectroscopy was performed using a GEM-3000 instrument made by Biaoqi Scientific (China) Corp., and an integrating sphere was used to collect the internal reflectance spectra. (The incident light on the crown of a round brilliant diamond is internally reflected back through the crown by the pavilion facets, so the internal reflectance spectrum is a combination of reflection and transmission signals.) Fourier-transform infrared (FTIR) transmission spectra were collected using a Nicolet iS5 spectrometer with a Pike Technologies UpIR diffuse reflectance accessory, both during phosphorescence and after it disappeared. The spectra were scanned cumulatively four times while the diamond dis-played phosphorescence and 32 times after the phosphorescence disappeared, and the resolution was set to 8 cm−1.
ResultsStandard TestingThe 0.08 ct diamond had a colour grade of F and clarity grade of SI
1 (due to a small brown feather). In
addition, a small colourless transparent inclusion was visible at about 30×–40× magnification. The sample was inert to both long- and short-wave UV radiation.
Reactions to Verification InstrumentsThe DiamondSure indicated the sample was a type II diamond and referred it for further testing. The DiamondPLus showed ‘Pass’ when the sample was tested in liquid nitrogen.
In the DiamondView, the sample showed vivid blue fluorescence and strong phosphorescence in slightly greenish blue, but no strain pattern was visible (Figure 1). The phosphorescence lasted for a few seconds after the radiation source was turned off. Slightly greenish blue phosphores-cence is often observed in synthetic diamonds in the DiamondView (D’Haenens-Johansson et al., 2015), so the sample was tested further to rule out a lab-grown origin.
UV-Vis-NIR SpectroscopyThe UV-Vis-NIR spectrum (Figure 2) displayed no significant absorption from 250 to 1000 nm, but it did show the strong 225 nm feature caused by the diamond energy bandgap at 5.47
Figure 1: In the DiamondView, the 0.08 ct diamond displays vivid blue fluorescence (top) and strong slightly greenish blue phosphorescence (centre, as captured with the DiamondView’s imaging system). When the hatch of the DiamondView was opened, greenish phosphorescence was visible to the naked eye (bottom). Images by Li Jianjun.
UV-Vis-NIR Spectrum
200 300 400 500 600 700 800 900 1000 Wavelength (nm)
Abso
rban
ce
225
Figure 2: The UV-Vis-NIR spectrum of the diamond shows strong absorption at 225 nm initiated by the diamond energy bandgap at 5.47 eV. The weak, broad absorption at 350 nm is likely an instrumental artefact.
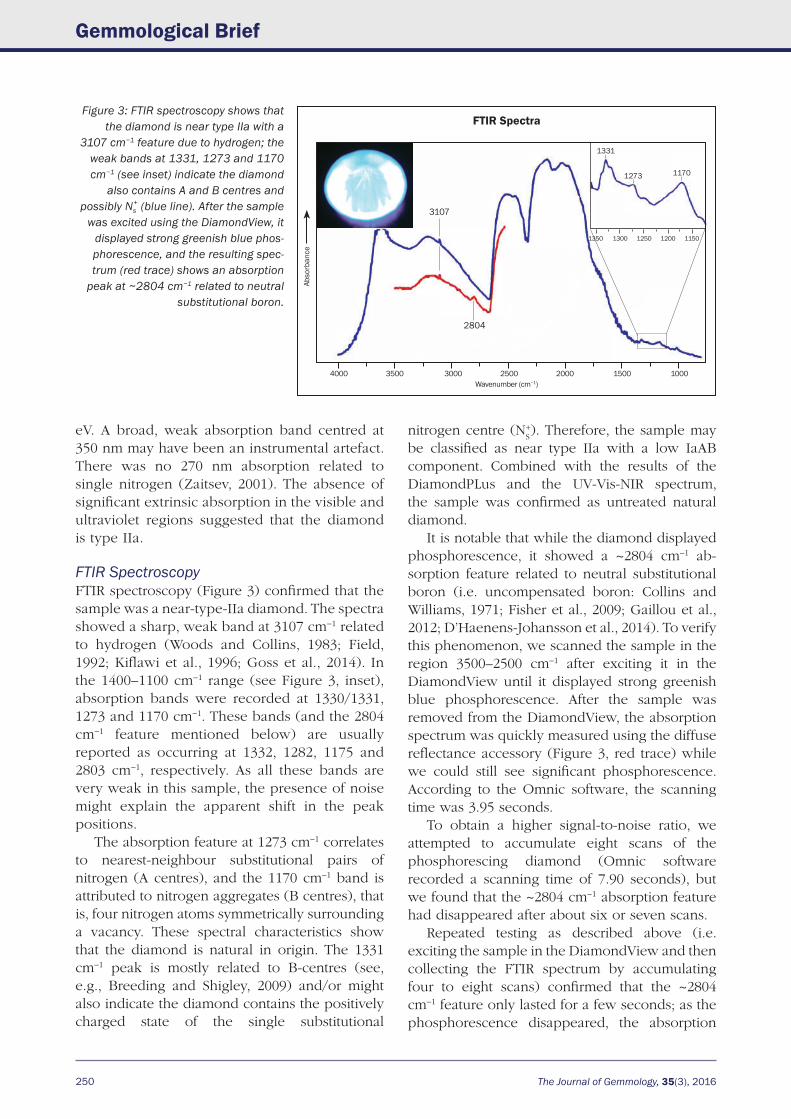
250 The Journal of Gemmology, 35(3), 2016
Gemmological Brief
Figure 3: FTIR spectroscopy shows that the diamond is near type IIa with a
3107 cm−1 feature due to hydrogen; the weak bands at 1331, 1273 and 1170 cm−1 (see inset) indicate the diamond
also contains A and B centres and possibly Ns
+ (blue line). After the sample was excited using the DiamondView, it
displayed strong greenish blue phos-phorescence, and the resulting spec-trum (red trace) shows an absorption
peak at ~2804 cm−1 related to neutral substitutional boron.
FTIR Spectra
4000 3500 3000 2500 2000 1500 1000 Wavenumber (cm−1)
Abso
rban
ce
1350 1300 1250 1200 1150
11701273
1331
3107
2804
eV. A broad, weak absorption band centred at 350 nm may have been an instrumental artefact. There was no 270 nm absorption related to single nitrogen (Zaitsev, 2001). The absence of significant extrinsic absorption in the visible and ultraviolet regions suggested that the diamond is type IIa.
FTIR SpectroscopyFTIR spectroscopy (Figure 3) confirmed that the sample was a near-type-IIa diamond. The spectra showed a sharp, weak band at 3107 cm−1 related to hydrogen (Woods and Collins, 1983; Field, 1992; Kiflawi et al., 1996; Goss et al., 2014). In the 1400–1100 cm−1 range (see Figure 3, inset), absorption bands were recorded at 1330/1331, 1273 and 1170 cm−1. These bands (and the 2804 cm−1 feature mentioned below) are usually reported as occurring at 1332, 1282, 1175 and 2803 cm−1, respectively. As all these bands are very weak in this sample, the presence of noise might explain the apparent shift in the peak positions.
The absorption feature at 1273 cm−1 correlates to nearest-neighbour substitutional pairs of nitrogen (A centres), and the 1170 cm−1 band is attributed to nitrogen aggregates (B centres), that is, four nitrogen atoms symmetrically surrounding a vacancy. These spectral characteristics show that the diamond is natural in origin. The 1331 cm−1 peak is mostly related to B-centres (see, e.g., Breeding and Shigley, 2009) and/or might also indicate the diamond contains the positively charged state of the single substitutional
nitrogen centre (NS+). Therefore, the sample may
be classified as near type IIa with a low IaAB component. Combined with the results of the DiamondPLus and the UV-Vis-NIR spectrum, the sample was confirmed as untreated natural diamond.
It is notable that while the diamond displayed phosphorescence, it showed a ~2804 cm−1 ab-sorption feature related to neutral substitutional boron (i.e. uncompensated boron: Collins and Williams, 1971; Fisher et al., 2009; Gaillou et al., 2012; D’Haenens-Johansson et al., 2014). To verify this phenomenon, we scanned the sample in the region 3500–2500 cm−1 after exciting it in the DiamondView until it displayed strong greenish blue phosphorescence. After the sample was removed from the DiamondView, the absorption spectrum was quickly measured using the diffuse reflectance accessory (Figure 3, red trace) while we could still see significant phosphorescence. According to the Omnic software, the scanning time was 3.95 seconds.
To obtain a higher signal-to-noise ratio, we attempted to accumulate eight scans of the phosphorescing diamond (Omnic software recorded a scanning time of 7.90 seconds), but we found that the ~2804 cm−1 absorption feature had disappeared after about six or seven scans.
Repeated testing as described above (i.e. exciting the sample in the DiamondView and then collecting the FTIR spectrum by accumulating four to eight scans) confirmed that the ~2804 cm−1 feature only lasted for a few seconds; as the phosphorescence disappeared, the absorption
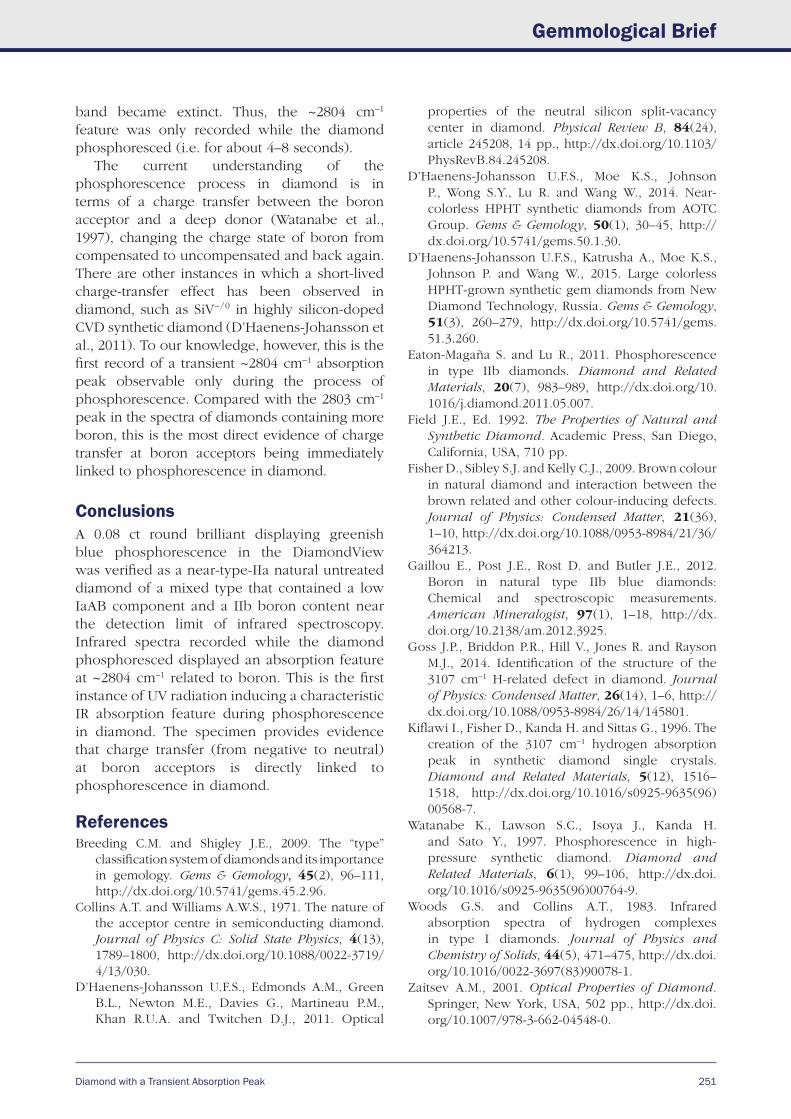
Diamond with a Transient Absorption Peak
Gemmological Brief
251
band became extinct. Thus, the ~2804 cm−1 feature was only recorded while the diamond phosphoresced (i.e. for about 4–8 seconds).
The current understanding of the phosphorescence process in diamond is in terms of a charge transfer between the boron acceptor and a deep donor (Watanabe et al., 1997), changing the charge state of boron from compensated to uncompensated and back again. There are other instances in which a short-lived charge-transfer effect has been observed in diamond, such as SiV−/0 in highly silicon-doped CVD synthetic diamond (D’Haenens-Johansson et al., 2011). To our knowledge, however, this is the first record of a transient ~2804 cm−1 absorption peak observable only during the process of phosphorescence. Compared with the 2803 cm−1 peak in the spectra of diamonds containing more boron, this is the most direct evidence of charge transfer at boron acceptors being immediately linked to phosphorescence in diamond.
ConclusionsA 0.08 ct round brilliant displaying greenish blue phosphorescence in the DiamondView was verified as a near-type-IIa natural untreated diamond of a mixed type that contained a low IaAB component and a IIb boron content near the detection limit of infrared spectroscopy. Infrared spectra recorded while the diamond phosphoresced displayed an absorption feature at ~2804 cm−1 related to boron. This is the first instance of UV radiation inducing a characteristic IR absorption feature during phosphorescence in diamond. The specimen provides evidence that charge transfer (from negative to neutral) at boron acceptors is directly linked to phosphorescence in diamond.
ReferencesBreeding C.M. and Shigley J.E., 2009. The “type”
classification system of diamonds and its importance in gemology. Gems & Gemology, 45(2), 96–111, http://dx.doi.org/10.5741/gems.45.2.96.
Collins A.T. and Williams A.W.S., 1971. The nature of the acceptor centre in semiconducting diamond. Journal of Physics C: Solid State Physics, 4(13), 1789–1800, http://dx.doi.org/10.1088/0022-3719/ 4/13/030.
D’Haenens-Johansson U.F.S., Edmonds A.M., Green B.L., Newton M.E., Davies G., Martineau P.M., Khan R.U.A. and Twitchen D.J., 2011. Optical
properties of the neutral silicon split-vacancy center in diamond. Physical Review B, 84(24), article 245208, 14 pp., http://dx.doi.org/10.1103/PhysRevB.84.245208.
D’Haenens-Johansson U.F.S., Moe K.S., Johnson P., Wong S.Y., Lu R. and Wang W., 2014. Near-colorless HPHT synthetic diamonds from AOTC Group. Gems & Gemology, 50(1), 30–45, http://dx.doi.org/10.5741/gems.50.1.30.
D’Haenens-Johansson U.F.S., Katrusha A., Moe K.S., Johnson P. and Wang W., 2015. Large colorless HPHT-grown synthetic gem diamonds from New Diamond Technology, Russia. Gems & Gemology, 51(3), 260–279, http://dx.doi.org/10.5741/gems. 51.3.260.
Eaton-Magaña S. and Lu R., 2011. Phosphorescence in type IIb diamonds. Diamond and Related Materials, 20(7), 983–989, http://dx.doi.org/10. 1016/j.diamond.2011.05.007.
Field J.E., Ed. 1992. The Properties of Natural and Synthetic Diamond. Academic Press, San Diego, California, USA, 710 pp.
Fisher D., Sibley S.J. and Kelly C.J., 2009. Brown colour in natural diamond and interaction between the brown related and other colour-inducing defects. Journal of Physics: Condensed Matter, 21(36), 1–10, http://dx.doi.org/10.1088/0953-8984/21/36/ 364213.
Gaillou E., Post J.E., Rost D. and Butler J.E., 2012. Boron in natural type IIb blue diamonds: Chemical and spectroscopic measurements. American Mineralogist, 97(1), 1–18, http://dx. doi.org/10.2138/am.2012.3925.
Goss J.P., Briddon P.R., Hill V., Jones R. and Rayson M.J., 2014. Identification of the structure of the 3107 cm−1 H-related defect in diamond. Journal of Physics: Condensed Matter, 26(14), 1–6, http://dx.doi.org/10.1088/0953-8984/26/14/145801.
Kiflawi I., Fisher D., Kanda H. and Sittas G., 1996. The creation of the 3107 cm−1 hydrogen absorption peak in synthetic diamond single crystals. Diamond and Related Materials, 5(12), 1516–1518, http://dx.doi.org/10.1016/s0925-9635(96) 00568-7.
Watanabe K., Lawson S.C., Isoya J., Kanda H. and Sato Y., 1997. Phosphorescence in high-pressure synthetic diamond. Diamond and Related Materials, 6(1), 99–106, http://dx.doi.org/10.1016/s0925-9635(96)00764-9.
Woods G.S. and Collins A.T., 1983. Infrared absorption spectra of hydrogen complexes in type I diamonds. Journal of Physics and Chemistry of Solids, 44(5), 471–475, http://dx.doi.org/10.1016/0022-3697(83)90078-1.
Zaitsev A.M., 2001. Optical Properties of Diamond. Springer, New York, USA, 502 pp., http://dx.doi.org/10.1007/978-3-662-04548-0.
252 The Journal of Gemmology, 35(3), 2016
Gemmological Brief
The Authors Jianjun LiNational Gold & Diamond Testing Center and Shandong Provincial Key Laboratory of Metrology and Measurement, Shandong Institute of Metrology, 28 Qianfoshandong Road, Lixia District, Jinan 250014, Shandong, ChinaEmail: [email protected]
Chengxing FanNational Jewellery Quality Supervision and Inspection Center of China, Fourth Floor South, West Building, Weiping Plaza, 2109 Cuizhu Road, Luohu District, Shenzhen 518020, Guangdong, China
Dr Shuxiang ChenSchool of Material Science and Engineering, Qilu University of Technology, 3501 Daxue Road, Changqing District, Jinan 250353, Shandong, China
Dr Guihua LiNational Gold & Diamond Testing Center, 28 Qianfoshandong Road, Lixia District, Jinan 250014, Shandong, China
AcknowledgementsThe authors thank three anonymous reviewers for their academic viewpoints. Jinda Song, CEO of Biaoqi Scientific (China) Corp., provided this interesting sample for identification.
GemTalk is back!
Gem-A’s popular online forum is back. Visit the new Gem-A website and login with your credentials. Once logged in you can start sharing knowledge and ideas, or simply introduce yourself.
Visit www.gem-a.com/forum/index
GemTalk_09-2016.indd 1 19/09/2016 11:57:11
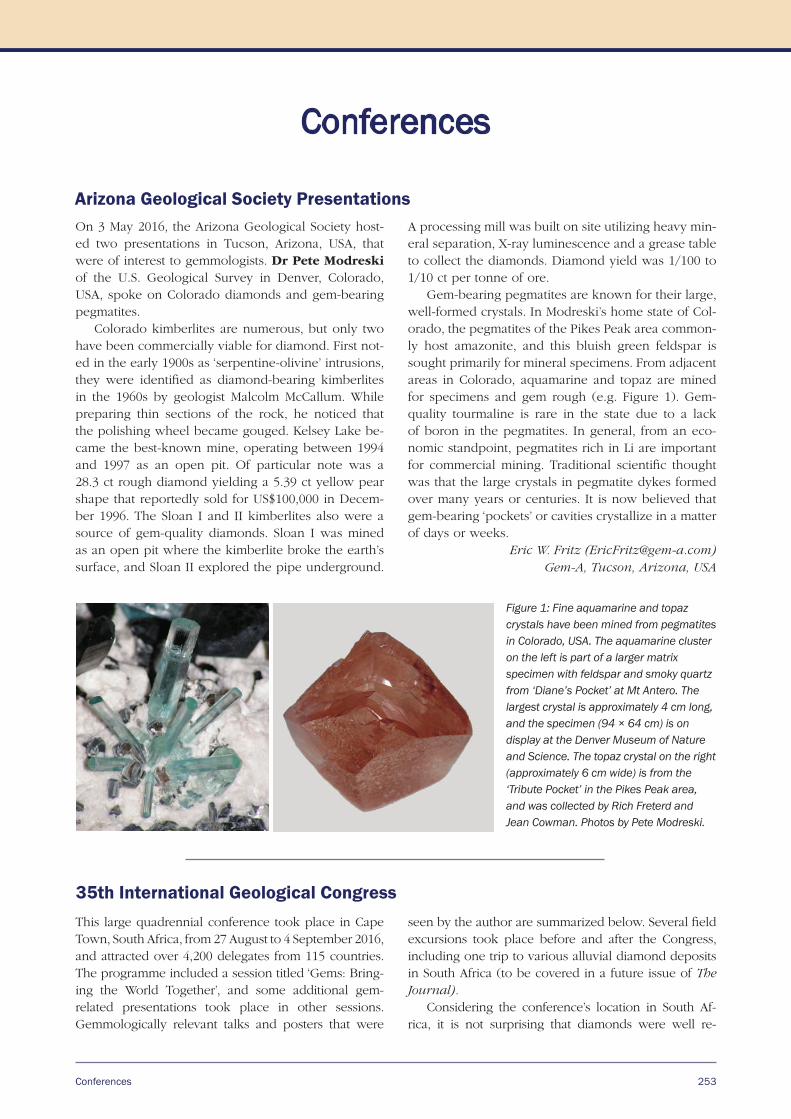
Conferences 253
Arizona Geological Society Presentations
Conferences
On 3 May 2016, the Arizona Geological Society host-ed two presentations in Tucson, Arizona, USA, that were of interest to gemmologists. Dr Pete Modreski of the U.S. Geological Survey in Denver, Colorado, USA, spoke on Colorado diamonds and gem-bearing pegmatites.
Colorado kimberlites are numerous, but only two have been commercially viable for diamond. First not-ed in the early 1900s as ‘serpentine-olivine’ intrusions, they were identified as diamond-bearing kimberlites in the 1960s by geologist Malcolm McCallum. While preparing thin sections of the rock, he noticed that the polishing wheel became gouged. Kelsey Lake be-came the best-known mine, operating between 1994 and 1997 as an open pit. Of particular note was a 28.3 ct rough diamond yielding a 5.39 ct yellow pear shape that reportedly sold for US$100,000 in Decem-ber 1996. The Sloan I and II kimberlites also were a source of gem-quality diamonds. Sloan I was mined as an open pit where the kimberlite broke the earth’s surface, and Sloan II explored the pipe underground.
A processing mill was built on site utilizing heavy min-eral separation, X-ray luminescence and a grease table to collect the diamonds. Diamond yield was 1/100 to 1/10 ct per tonne of ore.
Gem-bearing pegmatites are known for their large, well-formed crystals. In Modreski’s home state of Col-orado, the pegmatites of the Pikes Peak area common-ly host amazonite, and this bluish green feldspar is sought primarily for mineral specimens. From adjacent areas in Colorado, aquamarine and topaz are mined for specimens and gem rough (e.g. Figure 1). Gem-quality tourmaline is rare in the state due to a lack of boron in the pegmatites. In general, from an eco-nomic standpoint, pegmatites rich in Li are important for commercial mining. Traditional scientific thought was that the large crystals in pegmatite dykes formed over many years or centuries. It is now believed that gem-bearing ‘pockets’ or cavities crystallize in a matter of days or weeks.
Eric W. Fritz ([email protected])Gem-A, Tucson, Arizona, USA
Figure 1: Fine aquamarine and topaz crystals have been mined from pegmatites in Colorado, USA. The aquamarine cluster on the left is part of a larger matrix specimen with feldspar and smoky quartz from ‘Diane’s Pocket’ at Mt Antero. The largest crystal is approximately 4 cm long, and the specimen (94 × 64 cm) is on display at the Denver Museum of Nature and Science. The topaz crystal on the right (approximately 6 cm wide) is from the ‘Tribute Pocket’ in the Pikes Peak area, and was collected by Rich Freterd and Jean Cowman. Photos by Pete Modreski.
This large quadrennial conference took place in Cape Town, South Africa, from 27 August to 4 September 2016, and attracted over 4,200 delegates from 115 countries. The programme included a session titled ‘Gems: Bring-ing the World Together’, and some additional gem-related presentations took place in other sessions. Gemmologically relevant talks and posters that were
seen by the author are summarized below. Several field excursions took place before and after the Congress, including one trip to various alluvial diamond deposits in South Africa (to be covered in a future issue of The Journal).
Considering the conference’s location in South Af-rica, it is not surprising that diamonds were well re-
35th International Geological Congress
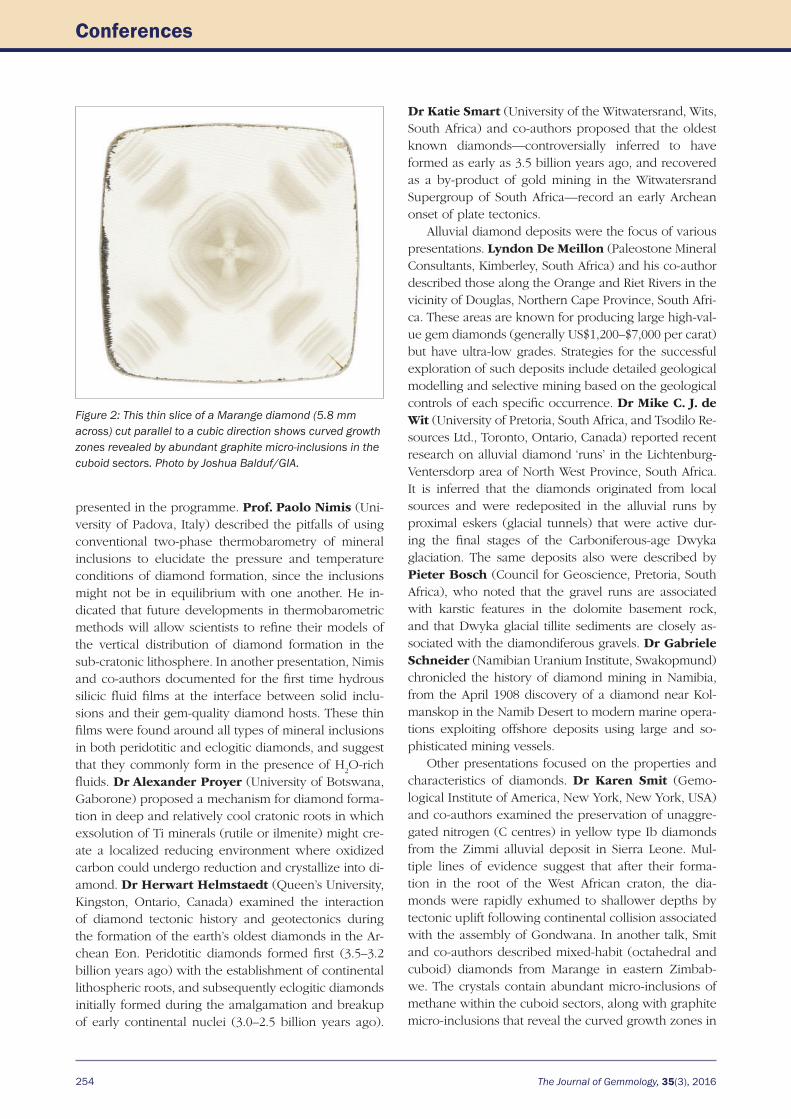
254 The Journal of Gemmology, 35(3), 2016
Conferences
presented in the programme. Prof. Paolo Nimis (Uni-versity of Padova, Italy) described the pitfalls of using conventional two-phase thermobarometry of mineral inclusions to elucidate the pressure and temperature conditions of diamond formation, since the inclusions might not be in equilibrium with one another. He in-dicated that future developments in thermobarometric methods will allow scientists to refine their models of the vertical distribution of diamond formation in the sub-cratonic lithosphere. In another presentation, Nimis and co-authors documented for the first time hydrous silicic fluid films at the interface between solid inclu-sions and their gem-quality diamond hosts. These thin films were found around all types of mineral inclusions in both peridotitic and eclogitic diamonds, and suggest that they commonly form in the presence of H
2O-rich
fluids. Dr Alexander Proyer (University of Botswana, Gaborone) proposed a mechanism for diamond forma-tion in deep and relatively cool cratonic roots in which exsolution of Ti minerals (rutile or ilmenite) might cre-ate a localized reducing environment where oxidized carbon could undergo reduction and crystallize into di-amond. Dr Herwart Helmstaedt (Queen’s University, Kingston, Ontario, Canada) examined the interaction of diamond tectonic history and geotectonics during the formation of the earth’s oldest diamonds in the Ar-chean Eon. Peridotitic diamonds formed first (3.5–3.2 billion years ago) with the establishment of continental lithospheric roots, and subsequently eclogitic diamonds initially formed during the amalgamation and breakup of early continental nuclei (3.0–2.5 billion years ago).
Dr Katie Smart (University of the Witwatersrand, Wits, South Africa) and co-authors proposed that the oldest known diamonds—controversially inferred to have formed as early as 3.5 billion years ago, and recovered as a by-product of gold mining in the Witwatersrand Supergroup of South Africa—record an early Archean onset of plate tectonics.
Alluvial diamond deposits were the focus of various presentations. Lyndon De Meillon (Paleostone Mineral Consultants, Kimberley, South Africa) and his co-author described those along the Orange and Riet Rivers in the vicinity of Douglas, Northern Cape Province, South Afri-ca. These areas are known for producing large high-val-ue gem diamonds (generally US$1,200–$7,000 per carat) but have ultra-low grades. Strategies for the successful exploration of such deposits include detailed geological modelling and selective mining based on the geological controls of each specific occurrence. Dr Mike C. J. de Wit (University of Pretoria, South Africa, and Tsodilo Re-sources Ltd., Toronto, Ontario, Canada) reported recent research on alluvial diamond ‘runs’ in the Lichtenburg-Ventersdorp area of North West Province, South Africa. It is inferred that the diamonds originated from local sources and were redeposited in the alluvial runs by proximal eskers (glacial tunnels) that were active dur-ing the final stages of the Carboniferous-age Dwyka glaciation. The same deposits also were described by Pieter Bosch (Council for Geoscience, Pretoria, South Africa), who noted that the gravel runs are associated with karstic features in the dolomite basement rock, and that Dwyka glacial tillite sediments are closely as-sociated with the diamondiferous gravels. Dr Gabriele Schneider (Namibian Uranium Institute, Swakopmund) chronicled the history of diamond mining in Namibia, from the April 1908 discovery of a diamond near Kol-manskop in the Namib Desert to modern marine opera-tions exploiting offshore deposits using large and so-phisticated mining vessels.
Other presentations focused on the properties and characteristics of diamonds. Dr Karen Smit (Gemo-logical Institute of America, New York, New York, USA) and co-authors examined the preservation of unaggre-gated nitrogen (C centres) in yellow type Ib diamonds from the Zimmi alluvial deposit in Sierra Leone. Mul-tiple lines of evidence suggest that after their forma-tion in the root of the West African craton, the dia-monds were rapidly exhumed to shallower depths by tectonic uplift following continental collision associated with the assembly of Gondwana. In another talk, Smit and co-authors described mixed-habit (octahedral and cuboid) diamonds from Marange in eastern Zimbab-we. The crystals contain abundant micro-inclusions of methane within the cuboid sectors, along with graphite micro-inclusions that reveal the curved growth zones in
Figure 2: This thin slice of a Marange diamond (5.8 mm across) cut parallel to a cubic direction shows curved growth zones revealed by abundant graphite micro-inclusions in the cuboid sectors. Photo by Joshua Balduf/GIA.
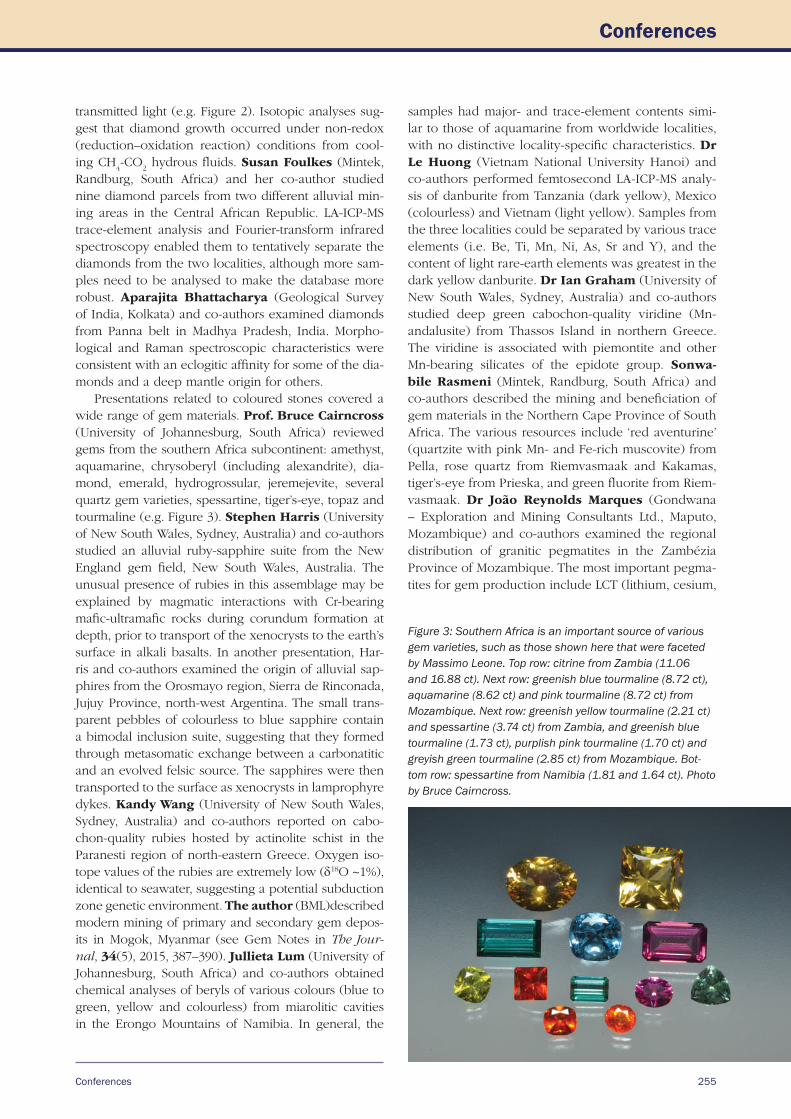
Conferences
Conferences
255
transmitted light (e.g. Figure 2). Isotopic analyses sug-gest that diamond growth occurred under non-redox (reduction–oxidation reaction) conditions from cool-ing CH
4-CO
2 hydrous fluids. Susan Foulkes (Mintek,
Randburg, South Africa) and her co-author studied nine diamond parcels from two different alluvial min-ing areas in the Central African Republic. LA-ICP-MS trace-element analysis and Fourier-transform infrared spectroscopy enabled them to tentatively separate the diamonds from the two localities, although more sam-ples need to be analysed to make the database more robust. Aparajita Bhattacharya (Geological Survey of India, Kolkata) and co-authors examined diamonds from Panna belt in Madhya Pradesh, India. Morpho-logical and Raman spectroscopic characteristics were consistent with an eclogitic affinity for some of the dia-monds and a deep mantle origin for others.
Presentations related to coloured stones covered a wide range of gem materials. Prof. Bruce Cairncross (University of Johannesburg, South Africa) reviewed gems from the southern Africa subcontinent: amethyst, aquamarine, chrysoberyl (including alexandrite), dia-mond, emerald, hydrogrossular, jeremejevite, several quartz gem varieties, spessartine, tiger’s-eye, topaz and tourmaline (e.g. Figure 3). Stephen Harris (University of New South Wales, Sydney, Australia) and co-authors studied an alluvial ruby-sapphire suite from the New England gem field, New South Wales, Australia. The unusual presence of rubies in this assemblage may be explained by magmatic interactions with Cr-bearing mafic-ultramafic rocks during corundum formation at depth, prior to transport of the xenocrysts to the earth’s surface in alkali basalts. In another presentation, Har-ris and co-authors examined the origin of alluvial sap-phires from the Orosmayo region, Sierra de Rinconada, Jujuy Province, north-west Argentina. The small trans-parent pebbles of colourless to blue sapphire contain a bimodal inclusion suite, suggesting that they formed through metasomatic exchange between a carbonatitic and an evolved felsic source. The sapphires were then transported to the surface as xenocrysts in lamprophyre dykes. Kandy Wang (University of New South Wales, Sydney, Australia) and co-authors reported on cabo-chon-quality rubies hosted by actinolite schist in the Paranesti region of north-eastern Greece. Oxygen iso-tope values of the rubies are extremely low (δ18O ~1%), identical to seawater, suggesting a potential subduction zone genetic environment. The author (BML)described modern mining of primary and secondary gem depos-its in Mogok, Myanmar (see Gem Notes in The Jour-nal, 34(5), 2015, 387–390). Jullieta Lum (University of Johannesburg, South Africa) and co-authors obtained chemical analyses of beryls of various colours (blue to green, yellow and colourless) from miarolitic cavities in the Erongo Mountains of Namibia. In general, the
samples had major- and trace-element contents simi-lar to those of aquamarine from worldwide localities, with no distinctive locality-specific characteristics. Dr Le Huong (Vietnam National University Hanoi) and co-authors performed femtosecond LA-ICP-MS analy-sis of danburite from Tanzania (dark yellow), Mexico (colourless) and Vietnam (light yellow). Samples from the three localities could be separated by various trace elements (i.e. Be, Ti, Mn, Ni, As, Sr and Y), and the content of light rare-earth elements was greatest in the dark yellow danburite. Dr Ian Graham (University of New South Wales, Sydney, Australia) and co-authors studied deep green cabochon-quality viridine (Mn-andalusite) from Thassos Island in northern Greece. The viridine is associated with piemontite and other Mn-bearing silicates of the epidote group. Sonwa-bile Rasmeni (Mintek, Randburg, South Africa) and co-authors described the mining and beneficiation of gem materials in the Northern Cape Province of South Africa. The various resources include ‘red aventurine’ (quartzite with pink Mn- and Fe-rich muscovite) from Pella, rose quartz from Riemvasmaak and Kakamas, tiger’s-eye from Prieska, and green fluorite from Riem-vasmaak. Dr João Reynolds Marques (Gondwana – Exploration and Mining Consultants Ltd., Maputo, Mozambique) and co-authors examined the regional distribution of granitic pegmatites in the Zambézia Province of Mozambique. The most important pegma-tites for gem production include LCT (lithium, cesium,
Figure 3: Southern Africa is an important source of various gem varieties, such as those shown here that were faceted by Massimo Leone. Top row: citrine from Zambia (11.06 and 16.88 ct). Next row: greenish blue tourmaline (8.72 ct), aquamarine (8.62 ct) and pink tourmaline (8.72 ct) from Mozambique. Next row: greenish yellow tourmaline (2.21 ct) and spessartine (3.74 ct) from Zambia, and greenish blue tourmaline (1.73 ct), purplish pink tourmaline (1.70 ct) and greyish green tourmaline (2.85 ct) from Mozambique. Bot-tom row: spessartine from Namibia (1.81 and 1.64 ct). Photo by Bruce Cairncross.
256 The Journal of Gemmology, 35(3), 2016
Conferences
tantalum)-type dykes in the Alto Ligonha District for tourmaline, and NYF (niobium, yttrium, fluorine)-type bodies of the Nampula Complex for dark blue aq-uamarine. Prof. Olugbenga Okunlola (University of Ibadan, Nigeria) and co-authors mapped Precambrian rare-metal (Ta-Nb-Sn) granitic pegmatites in south-western Nigeria, some of which contain gem miner-alization. They designated 10 pegmatite subfields, and geochemical data from muscovite suggests that those of Lema-Ndeji show the highest potential for econom-ically significant rare-metal mineralization.
There were two talks related to instrumentation. Dr Anton Du Plessis (Stellenbosch University, South Africa) and co-authors reported applications of X-ray computed microtomography for faceted diamonds and coloured stones. The method can be used to visualize internal and external features of gemstones, and the full three-dimensional dataset is recordable to provide
a unique identifier for insurance purposes. Nicolaas Steenkamp (geological consultant, Pretoria, South Af-rica) and his co-author investigated the use of electric pulsed-power disaggregation using a Russian-made selFrag instrument to break down massive pegmatite, potentially liberating gem-quality garnet and tourma-line. Pegmatite samples from the Limpopo Province of South Africa were submerged in water and subjected to high-voltage discharges, causing them to be fragment-ed along pre-existing fractures as well as mineral grain boundaries. Due to the fractured nature of the miner-als in the pegmatite, the experiments produced ~30% grains measuring <1 mm (i.e. powder), while ~70% consisted of >1 mm pieces that were not completely liberated along the grain boundaries.
The next International Geological Congress will take place in March 2020 in Delhi, India.
Brendan M. Laurs
In The Journal of Gemmology (Vol. 35, No. 2, 2016, p. 162), a letter by Grenville Millington addressed the caption of the lead figure that appeared in my article ‘Oriented Inclusions in Cat’s-eye, Star and Oth-er Chrysoberyls’ published in The Journal (Vol. 35, No. 1, 2016, pp. 28–54). In summary, Mr Millington concluded that any “manipulation” of digital photos should be indicated in the corresponding figure cap-tion. I disagree with this statement.
When photos of gems are taken with modern digital cameras, certain types of stones (e.g. rubies or sap-phires) frequently yield images that closely approxi-mate the visual appearance of the gem to the human eye. This stands in stark contrast to the results of digital photography involving colour-change gemstones such as alexandrites or some garnets, even if the camera has been calibrated against a white standard for the actual lighting used. For such stones showing a differ-ent colour appearance in daylight and incandescent light, what is obtained in the digital photo most often does not match the visual impression of the sample. After many attempts, I have been fortunate on occa-sion to have the photo of a colour-change stone under one of the two relevant light sources appear close to what is actually seen with the eye, but rarely can this be achieved for both light sources. In most cases the results of such efforts, or at least some results, are highly disappointing.
Thus, I normally select the photo ‘closest’ in appear-ance to the actual gemstone and then adjust this digital
image to attain as nearly as possible the real impression of the stone, having the sample, the computer screen and different light sources available on my desk. For my alexandrite book (Russian Alexandrites, 2010), a pre-print of all photos representing colour and colour change of ‘critical’ samples was even prepared in a pa-per version, enabling the colour of the paper pre-print to be corrected against the real gem. Such a procedure is, however, as a practical matter infeasible for articles in gemmological journals, simply for cost reasons.
I had the chance to examine in Germany some years ago the cat’s-eye alexandrite mentioned above and depicted in The Journal (Vol. 35, No. 1, 2016, p. 29). The photo of that stone in its jewellery setting taken by Erica and Harold Van Pelt reportedly was carefully adjusted in the USA by modern digital techniques to match the actual impression of the gem in daylight and incandescent light. I consider such colour adjustment to be not a “manipulation” but rather a normal part of modern digital photography or digital processing of ex-isting photos, what I would call ‘state of the art’ in mod-ern publication technology. Therefore, I do not think that it is necessary to mention such colour adjustment in figure captions. Rather, digital adjustment should be indicated only if the appearance of a sample in the photo has been shifted toward a colour (‘beautified’) which, for whatever reason, is not consistent with the true coloration and visual appearance of the gemstone.
Dr Karl SchmetzerPetershausen, Germany
LettersDigital Manipulation of Gem Photos—Author’s Reply
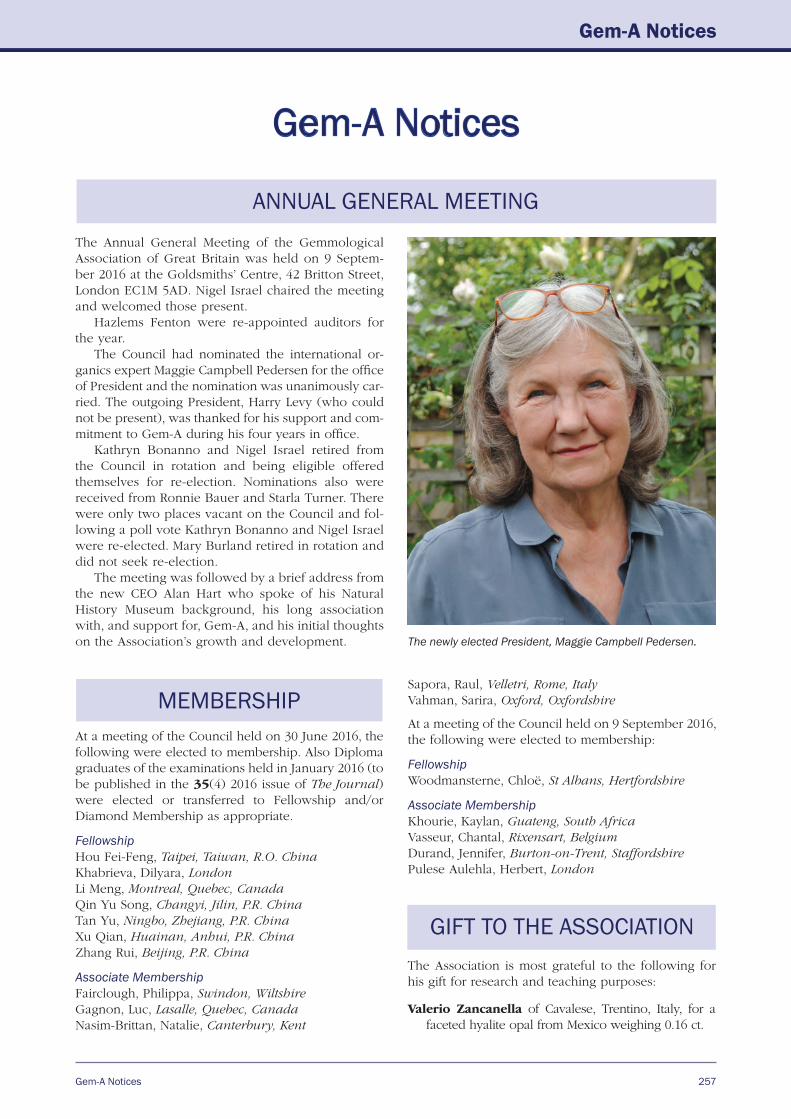
Gem-A Notices
Gem-A Notices
257
MEMBERSHIP
Gem-A Notices
GIFT TO THE ASSOCIATION
ANNUAL GENERAL MEETINGThe Annual General Meeting of the Gemmological Association of Great Britain was held on 9 Septem-ber 2016 at the Goldsmiths’ Centre, 42 Britton Street, London EC1M 5AD. Nigel Israel chaired the meeting and welcomed those present.
Hazlems Fenton were re-appointed auditors for the year.
The Council had nominated the international or-ganics expert Maggie Campbell Pedersen for the office of President and the nomination was unanimously car-ried. The outgoing President, Harry Levy (who could not be present), was thanked for his support and com-mitment to Gem-A during his four years in office.
Kathryn Bonanno and Nigel Israel retired from the Council in rotation and being eligible offered themselves for re-election. Nominations also were received from Ronnie Bauer and Starla Turner. There were only two places vacant on the Council and fol-lowing a poll vote Kathryn Bonanno and Nigel Israel were re-elected. Mary Burland retired in rotation and did not seek re-election.
The meeting was followed by a brief address from the new CEO Alan Hart who spoke of his Natural History Museum background, his long association with, and support for, Gem-A, and his initial thoughts on the Association’s growth and development.
At a meeting of the Council held on 30 June 2016, the following were elected to membership. Also Diploma graduates of the examinations held in January 2016 (to be published in the 35(4) 2016 issue of The Journal) were elected or transferred to Fellowship and/or Diamond Membership as appropriate.
FellowshipHou Fei-Feng, Taipei, Taiwan, R.O. ChinaKhabrieva, Dilyara, LondonLi Meng, Montreal, Quebec, CanadaQin Yu Song, Changyi, Jilin, P.R. ChinaTan Yu, Ningbo, Zhejiang, P.R. ChinaXu Qian, Huainan, Anhui, P.R. ChinaZhang Rui, Beijing, P.R. China
Associate MembershipFairclough, Philippa, Swindon, WiltshireGagnon, Luc, Lasalle, Quebec, CanadaNasim-Brittan, Natalie, Canterbury, Kent
Sapora, Raul, Velletri, Rome, ItalyVahman, Sarira, Oxford, Oxfordshire
At a meeting of the Council held on 9 September 2016, the following were elected to membership:
FellowshipWoodmansterne, Chloë, St Albans, Hertfordshire
Associate MembershipKhourie, Kaylan, Guateng, South AfricaVasseur, Chantal, Rixensart, BelgiumDurand, Jennifer, Burton-on-Trent, StaffordshirePulese Aulehla, Herbert, London
The Association is most grateful to the following for his gift for research and teaching purposes:
Valerio Zancanella of Cavalese, Trentino, Italy, for a faceted hyalite opal from Mexico weighing 0.16 ct.
The newly elected President, Maggie Campbell Pedersen.
258 The Journal of Gemmology, 35(3), 2016
Gem-A Notices
• elect a person who is willing to act as a Di-rector providing he is recommended by the Council, and
27 No person other than a Director retiring by rota-tion may be elected a Director at any general meet-ing unless:
(1) He is recommended for election by the Coun-cil;
(2) If not recommended by the Council then at an Annual General Meeting only providing that:
Not less than forty-two clear days or more than seventy clear days before the date of the meet-ing, the Charity is given notice in writing that: A Fellow (FGA) and/or Diamond Member (DGA) who has been an FGA and/or DGA in good standing for a minimum of the two most recent whole subscription years has been nomi-nated for election to the Council, by two nomi-nators who both have been either Fellows and/or Diamond Members in good standing for a minimum of the most recent whole subscription year, or Associate Members in good standing for the two most recent whole subscription years.
The written nomination must: (a) be signed by the Nominators; (b) state the Nominators’ intention to propose
the election of a person as a Director; (c) contain the details that, if the person were
to be elected, the Charity would have to file at Companies House; and
(d) be signed by the person who is to be pro-posed to show his willingness to be ap-pointed.
28 All members who are entitled to receive notice of a general meeting must be given not less than seven or more than twenty-eight clear days’ notice of any resolution to be put to the meeting to elect a Director other than a Director who is to retire by rotation.
29 (1) The Council may co-opt a person who is a Mem-ber of the association to fill a casual vacancy or an extra Director who is willing to act as a Director, subject to the maximum number of Directors allowed. Co-opted members shall be appointed by Council and shall retire at the first General Meeting of the Association thereafter, but may offer themselves as candidates for elec-tion at that Annual General Meeting and shall not be taken into account in determining the Directors who are to retire by rotation.
(2) In order that the Council may have an appro-priate range of skills, it may, by resolution of two thirds of elected/co-opted Directors, ap-point up to a further three Directors who need
On Thursday 30 June 2016 at Gem-A, 21 Ely Place, London EC1N 6TD, an Extraordinary General Meeting was held for the purpose of considering the following Special Resolution to amend the Articles of Associa-tion (changes and additions in italics): Termination of Membership4 Membership is terminated if: (3) any sum due from the member to the Charity
is not paid in full within six months of it falling due, except that the Council may by Bylaw(s) establish the period, not less than two months of it falling due, that a Member may be in sub-scription arrear before being deemed to have re-signed from Membership.
Notice of general meetings7 (1) The minimum periods of notice required to
hold a general meeting of the Charity are: • eighty-fourclear days for the date of an An-
nual General MeetingDirectors20 Unless determined otherwise by ordinary resolution: (1) The number of Elected or Co-opted Directors
shall be not less than four [see Articles 26, 27 and 29(1)] and the number of Appointed Direc-tors, who need not be members of the Charity, shall not be more than three [see Article 29(2)].
(2) The total number of all Directors shall not ex-ceed twelve.
Retirement24 At the first Annual General Meeting all the Council
must retire from office unless by the close of the meeting the members have failed to elect sufficient Council to hold a quorate meeting of the Council. At each subsequent Annual General Meeting one-third of the elected Council or, if their number is not three or a multiple of three, the number nearest to one third must retire from office.
(1) The elected Directors to retire by rotation shall be those who have been longest in office since their last election. If any Directors became or were appointed Directors on the same day, those to retire shall (unless they otherwise agree among themselves) be determined by lot.
(2) Elected Directors shall normally serve no more than three consecutive three-year terms, but may serve further terms upon recommendation of the Council.
(3) If a Director is required to retire at an Annual General Meeting by a provision of these arti-cles, the retirement shall take effect upon the conclusion of the meeting.
The Election of Directors26 The Charity may by ordinary resolution in any
general meeting:
EXTRAORDINARY GENERAL MEETING
Gem-A Notices
Gem-A Notices
259
not be members of the Association. They shall serve a term up to the fourth Annual General Meeting following their appointment (or the third Annual General Meeting if appointed at an Annual General Meeting). They may serve further terms of three years at the request of the Council.
(3) Appointed Directors may be removed by reso-lution of two thirds of elected/co-opted Direc-tors.
(4) Nothing in these Rules shall require any per-son who is a Director at the date of adoption of these Rules to resign as a Trustee, or shall prevent such person offering themselves, if eli-gible, for re-election if retiring by rotation at an Annual General Meeting.
30 No election, co-option or appointment of Directors may cause the number of Directors to exceed the number fixed as the maximum number of Directors.
Disqualification and removal of Directors 31 A Director shall cease to hold office if he: • ceasestobeaDirectorbyvirtueofanyprovi-
sion in the Act or is prohibited by law from being a director;
• isdisqualifiedfromactingasaTrusteebyvir-tue of the Charities Acts;
• ceases to be a member of the Charity unless an Appointed Director;
• becomesincapablebyreasonofmentaldisor-der, illness or injury of managing and admin-istering his own affairs;
• resignsasaDirectorbynoticetotheCharity(but only if at least two elected Directors will remain in office when the notice of resigna-tion is to take effect); or
• isabsentwithoutthepermissionoftheCoun-cil from three consecutive meetings and the Council resolves that his office be vacated.
Proceedings of the Council33 (1) The Directors shall meet together for the des-
patch of business, adjourn, and otherwise reg-ulate their meetings as they think fit, subject to the provision of the Articles. Such meetings may be held with one or more or all Directors participating by electronic communication if all the Directors so agree.
34 (2) The quorum shall be four elected or co-opted Directors, or such larger number as may be decided from time to time by the Council.
President52 On the nomination of the Council, the President
shall be elected by the members of the Charity at a General Meeting. The term of Office of the Presi-dent shall run from the election at an Annual Gen-eral Meeting until such President’s re-election or a successor is elected at the second Annual General Meeting thereafter; if elected at a General Meeting not an Annual General Meeting, then until the third Annual General Meeting thereafter. Subject to the discretion of the Council and the member-ship, a President would not normally be re-elected more than once. The President shall, ex officio, be entitled to attend meetings of the Council but shall not be entitled to vote unless he is also a member of the Council.
The motion was accepted with two abstentions.
A full version of the updated Memorandum and Articles of Association is available on Gem-A’s website at www.gem-a.com/index.php/membership/resources/applications-articles/memorandum.
OBITUARYMichael J. O’Donoghue FGA
1934–2016
The worldwide Gemmological community has been greatly saddened to hear of the passing of Michael O’Donoghue on 16 June 2016.
Michael did his National Service in the RAF, but, in spite of being offered a commission, he went to Selwyn College, Cambridge, graduating in 1959 with a degree in English Literature.
He became a librarian, working in Cambridge Uni-versity Library, the National Library of Scotland and then in 1962, the British Museum Library. Initially he worked in the State Paper Room, but then moved to the Scientific and Technological Section where he be-came curator of Earth Sciences. He retired from the then renamed British Library ca. 1998. Being a curator
of a major earth science collection of printed mate-rial obviously stirred his interest in gem materials. He became an FGA in 1968, and began teaching the same year at Sir John Cass College.
I studied my gemmology preliminary in 1976–77, and while walking along Cass corridors often passed the open doors of two classrooms where the Gem-mology Diploma was being studied. In one of the rooms there were always about 40 students, heads down continually taking notes by dictation. There were considerably fewer in the other room, but far from taking notes, they seemed to be having a live-ly vocal relationship with their lecturer: Michael, of course! When I selected my Diploma lecturer I had
260 The Journal of Gemmology, 35(3), 2016
Gem-A Notices
Michael O’Donoghue’s talents stretched far beyond gemmology, but it was as a gemmologist that I knew him. My background was not in the gem trade—I had a photographic studio specializing in jewellery, and was simply curious to know more about the gems. Thanks largely to Michael’s inspirational and challeng-ing method of teaching in my Diploma year, I became so engrossed in the subject that I considered switching careers. The evening study group, which was started by Michael (today called ‘Gem Central’ but to which we affectionately referred as ‘The Playgroup’), clinched it for me. We brought our dogs along, we ate choco-late biscuits (both of which Michael enjoyed), and we worked hard for a couple of hours under his guidance. It brought gemmology to life and was fun. That weekly opportunity to study gemstones from his wonderful collection and to share views and experiences pointed me firmly in the direction which I then followed.
Michael did not encourage note-taking during class. He himself provided notes the following week on what we had studied, but in class he wanted his students to listen and give their full attention to what they were hearing. There was of course a certain amount of surreptitious note-taking, especially by some of the students for whom English was not their first language. Michael had a dry sense of humour, and he was fond of explaining things by use of anal-ogy. Though I now forget what he was describing at the time, I well remember a rather bewildered foreign gentleman leaning over to me in class and whispering, ‘How do you spell Kit Kat?’
Michael was never afraid of being challenged him-self. He was delighted to be confronted with an un-usual specimen or with new information. Often—to use an analogy myself—we would come into class a bit like puppies, full of enthusiasm and proudly wag-
no hesitation in choosing Michael, a decision I still have much to be thankful for. Michael had a happy knack of transferring his immense enthusiasm to his students. I remember well how impatient we all were for his classes to start, wondering each week what exciting gems and books he would bring to show us.
Michael was a truly inspirational teacher, and the considerable number of his past students that I have recently talked to about him have all stressed that. He continued teaching until ca. 2009, becoming the Col-lege’s Head of Gemmology.
Knowing that, like him, I was a keen collector of historic gemmological literature, he persuaded me to give my first-ever lecture during a day event at the Library. I remember using covers and pages of books photocopied onto overhead projection transparencies; how times have changed! He visited me regularly to look at my latest purchases, but food and wine were equally important on those occasions.
Michael wrote or edited about 20 books on gem-stones, and led gemmological trips to far-flung plac-es. He was, in 1991, the first editor of Gem & Jewel-lery News, then the joint newsletter of Gem-A and The Society of Jewellery Historians that was later to become Gems&Jewellery. Michael also produced ab-stracts of gemmological journals and reviewed books for The Journal of Gemmology from 1972, and in 1997 was appointed an Assistant Editor, a post he held until he died. In addition, Michael was made a Vice President of Gem-A in 2009.
I would not like anyone to think, however, that Michael was a one-subject enthusiast. He had many other varied interests. He was an accomplished church organist, having started to learn when he was nine. He was also passionate about the railways (his father was a railway executive), and apparently vis-ited at least 110 signal boxes. He was an exception-ally kind man, and for some time was a Samaritans’ volunteer.
Michael leaves a wife, Annie, three children and five grandchildren. Michael’s past students, Gem-A and, indeed, the whole world of gemmology, owe him a massive debt. He is sorely missed, but his gem-mological legacy will continue into the far future.
Nigel Israel
Gem-A Notices
Gem-A Notices
261
ging our tails at some new-found knowledge, only to find that Michael already knew all about it, and could elaborate on it and teach us a lot more. He was always pleased when we showed initiative, and he made us feel good about our discoveries, encouraging us to go
Ralph Ellis McRae Blacklock FGA (D.1967), Dar-lington, Co. Durham, died on 22 August 2016 follow-ing a short illness.
Born on 9 October 1946, Ralph started his career in 1965 in Birmingham with Bernard Lowe stone dealers sorting and selling gems. In 1966 he joined the family fine jewellery business, Blacklocks, in Sunderland. He was awarded his Gemmology Diploma in 1967, com-pleting the course within one year.
Ralph worked with his father Ellis from 1966 until 1986. In that time the business grew with the opening of a second shop in Durham. In the early 1990s Ralph opened a third shop in Newcastle. In 2000 he sold the business and set up independently as a jewellery designer. From 2000 until 2016 he used his gemmo-logical knowledge and design skills to create bespoke pieces, sourcing and identifying fine diamonds and gemstones to set within them, selling through a web-site. In 2009 he was joined by his son Christopher, who was the sixth generation to work in the family business, now entirely online.
By the time of his death, Ralph had designed multi-ple collections and fulfilled hundreds of bespoke orders.
Ralph was a founding director of the Company of Master Jewellers in 1981, served on the Board of the then National Association of Goldsmiths in 1997 and was a director of the Houlden Buying Group from 1998 to 2001.
Ralph leaves wife Roz, sons Chris and Mark, and three grandchildren. Christopher Blacklock
Adi Inskeep (née Redman) FGA (D.1959 with Dis-tinction), Oxford, died at home on 5 April 2016. Adi attended Witwatersrand University, Johannesburg, South Africa, from 1947, completing her BSc in Ge-ology and Botany followed by BSc (Hons) in Eco-nomic Geology in 1952. At the age of 22 Adi was appointed a curator at the University’s Geological Museum, where she constructed many new exciting exhibits, acquiring outstanding material and brought enthusiasm and life to what had previously become a dormant museum. Adi worked at the museum for 12 years, until 1965. She then pursued her interest in human artefacts. Hugh Underhill
out and investigate further. He wanted us to think for ourselves.
Personally, I owe Michael such a lot. He was very special, and he is greatly missed.
Maggie Campbell Pedersen
Individual Membership is changing...
Renew your Individual Membership before 1 January 2017 and pay just £110 — Individual Membership will be £135 for all renewals after this date.
Contact [email protected] for more information or to renew your Membership for 2017.
Gem-A Membership Renewal Change 09-2016.indd 1 19/09/2016 15:01:43
262 The Journal of Gemmology, 35(3), 2016
Learning OpportunitiesCONFERENCES AND SEMINARS
CIBJO Congress 201626–28 October 2016Yerevan, Armeniawww.cibjo.org/congress2016
The Munich Show28–30 October 2016Munich, Germanywww.mineralientage.de/enNote: Includes a seminar programme.
MJSA ConFab30 October 2016New York, New York, USAwww.mjsa.org/eventsprograms/mjsa_confab
CGA Grad Gemmology Conference29 October 2016 Vancouver, British Columbia, Canadawww.canadiangemmological.com
Fabergé Symposium – The Wonder of Fabergé3–4 November 2016Houston, Texas, USAwww.hmns.org/education/adults/faberge-symposium
Gem-A Conference5–6 November 2016 London www.gem-a.com/event/conference/conference-2016
The New Mexico Mineral Symposium 12–13 November 2016 Socorro, New Mexico, USA https://geoinfo.nmt.edu/museum/minsymp
5th GIT International Gem and Jewelry Conference (GIT 2016) 14–15 November 2016 Pattaya, Thailand www.git2016.com
3rd European Congress on Jewellery: The Jewel in Art and Art in Jewell 17–18 November 2016 Barcelona, Spain www.museunacional.cat/en/jewel-art-and-art-jewellery
AGA Tucson Conference1 February 2017 Tucson, Arizona, USA https://accreditedgemologists.org
The 38th Annual Tucson Mineral Symposium: Mineral Treasures of the Midwest11 February 2017 Tucson, Arizona, USA www.friendsofmineralogy.org/symposia.html
Hasselt Diamond Workshop 2017 (SBDD XXII)9–11 March 2017 Hasselt, Belgium www.uhasselt.be/sbdd
Amberif International Fair of Amber, Jewellery and Gemstones22–25 March 2017Gdansk, Polandwww.amberif.amberexpo.pl Note: Includes a seminar programme.
American Gem Society International Conclave5–8 April 2017Hollywood, California, USAwww.americangemsociety.org/Content/uploads/Conclave2017RFP.pdf
14th Annual Sinkankas Symposium – Sapphire8 April 2017 Carlsbad, California, USA www.sinkankassymposium.net
The Santa Fe Symposium 21–24 May 2017 Albuquerque, New Mexico, USA www.santafesymposium.org
Swiss Gemmological Society Conference and European Gemmological Symposium 20178–11 June 2017Zermatt, Switzerlandwww.gemmologie.ch
2017 Society of North American Goldsmiths (SNAG) Conference24–27 May 2017 New Orleans, Louisiana, USA www.snagmetalsmith.org/events/nexus-2017
11th International Conference on New Diamond and Nano Carbons28 May–1 June 2017 Cairns, Australia http://ndnc2017.org
Association for the Study of Jewelry and Related Arts (ASJRA) Annual Conference9–10 June 2017 Compiled by Georgina Brown and Brendan Laurs
Learning Opportunities 263
Boston, Massachusetts, USA www.jewelryconference.com
PEG2017 – 8th International Symposium on Granitic Pegmatites 13–15 June 2017 Kristiansand, Norwaywww.nhm.uio.no/forskning/aktuelt/arrangementer/konferanser-seminarer/peg2017
11th International Kimberlite Conference18–22 September 2017Gaborone, Botswanawww.11ikc.comNote: Pre- and post-conference field trips will visit
diamond deposits in Botswana and neighbouring countries.
World of Gems Conference V23–24 September 2017 Rosemont, Illinois, USA http://gemguide.com/events/world-of-gems-conference
35th International Gemmological Conference 11–15 October 2017 Windhoek, Namibia www.igc-gemmology.org/igc-2017-programme/ 4592655130Note: Pre- and post-conference field trips will visit diamond and coloured stone deposits in Nambia.
EXHIBITIONSAustraliaLustre: Pearling and AustraliaUntil 22 January 2017 Immigration Museum, Melbourne, Victoria, Australia http://tinyurl.com/hcrhscq
Europe
Heavenly Bodies—The Sun, Moon and Stars in JewelleryUntil 30 October 2016 Schmuckmuseum, Pforzheim, Germany www.schmuckmuseum.de/flash/SMP_en.html
Eggs-travagant—Ostereier aus Edelsteinen Until 2 November 2016 Edelsteinmuseum, Idar-Oberstein, Germany www.edelsteinmuseum.de/ausstellungen-deutsches-edelsteinmuseum/sonderausstellungen.html
EnamouredUntil 18 November 2016 The Goldsmiths’ Centre, London www.goldsmiths-centre.org/whats-on/exhibitions/enamoured
Eva’s Beauty Case: Schmuck und Styling im Spiegel der Zeiten (Jewelry and Styling Through the Ages)Until 22 January 2017 LVR-LandesMuseum Bonn, Bonn, Germany www.landesmuseum-bonn.lvr.de/de/ausstellungen/evas_bauty_case/evas_beauty_case.html
Elements: From Actinium to ZirconiumUntil 26 February 2017 Ulster Museum, Belfast, Northern Ireland http://nmni.com/um/What-s-on/Elements
Warrior Treasures: Saxon Gold from the Staffordshire Hoard Until 23 April 2017 Bristol Museum & Art Gallery, Bristol www.bristolmuseums.org.uk/bristol-museum-and-art-gallery/whats-on/warrior-treasures
Must-Haves—Jewellery Created by Greats of the Craft and Must-Sees—Jewellery in the Arts 21 May–10 September 2017 Schmuckmuseum, Pforzheim, Germany www.schmuckmuseum.de/flash/SMP_en.html
Authentically Inauthentic?—Jewellery from Pforzheim’s Industrial Production28 May–10 September 2017 Municipal Museum, Pforzheim, Germany www.schmuckmuseum.de/flash/SMP_en.html
Smycken: Jewellery. From Decorative to PracticalOngoing Nordiska Museet, Stockholm, Sweden www.nordiskamuseet.se/en/utstallningar/jewellery
North AmericaFabergé from the Matilda Geddings Gray Foundation CollectionUntil 27 November 2016 The Metropolitan Museum of Art, New York, New York, USA www.metmuseum.org/exhibitions/listings/2011/faberge
Glitterati: Portraits & Jewelry from Colonial Latin AmericaUntil 27 November 2016 Denver Art Museum, Denver, Colorado, USA www.denverartmuseum.org/exhibitions/glitterati
Learning Opportunities

264 The Journal of Gemmology, 35(3), 2016
Learning Opportunities
OTHER EDUCATIONAL OPPORTUNITIES
Jewelry, from Pearls to Platinum to PlasticUntil 1 January 2017 Newark Museum, Newark, New Jersey, USA www.newarkmuseum.org/jewelry
All That Sparkles...20th Century Artists’ JewelryUntil 8 January 2017 The Bechtler Museum of Modern Art, Charlotte, North Carolina, USA http://bechtler.org/Collection/All-that-sparkles
Gold and the Gods: Jewels of Ancient NubiaUntil 8 January 2017 Museum of Fine Arts, Boston, Massachusetts, USA www.mfa.org/exhibitions/gold-and-gods
Arts of Islamic Lands: Selections from The al-Sabah Collection, KuwaitUntil 29 January 2017 Museum of Fine Arts, Houston, Texas, USA www.mfah.org/exhibitions/arts-islamic-lands-selections-al-sabah-collection-
American Mineral Heritage: Harvard CollectionUntil February 2017 Flandrau Science Center & Planetarium, Tucson, Arizona, USA http://flandrau.org/exhibits/harvard
Beyond Bling: Jewelry from the Lois Boardman Collection Until 5 February 2017 Los Angeles County Museum of Art, California, USA www.lacma.org/art/exhibition/beyond-bling
Bijoux Parisiens: French Jewelry from the Petit Palais, Paris11 February–14 May 2017 Taft Museum of Art, Cincinnati, Ohio, USA www.taftmuseum.org/upcoming-exhibitions-draft
Spectacular! Gems and Jewelry from the Merriweather Post Collection
10 June 2017–14 January 2018 Hillwood Estate, Museum & Gardens, Washington DC, USA www.hillwoodmuseum.org/Spectacular-Gems-and-Jewelry
Amber Secrets: Feathers from the Age of DinosaursOngoing Houston Museum of Natural Science, Texas, USA www.hmns.org/exhibits/special-exhibitions/amber-secrets-feathers-from-the-age-of-dinosaurs
City of Silver and Gold: From Tiffany to CartierOngoing Newark Museum, New Jersey, USA www.newarkmuseum.org/SilverAndGold.html
Fabergé: From a Snowflake to an IcebergOngoing Houston Museum of Natural Science, Texas, USA www.hmns.org/exhibits/special-exhibitions/faberge-a-brilliant-vision
Gemstone CarvingsOngoing Houston Museum of Natural Science, Texas, USA www.hmns.org/exhibits/special-exhibitions/gemstone-carvings
Gilded New YorkOngoing Museum of the City of New York, New York, USA www.mcny.org/content/gilded-new-york
Mightier than the Sword: The Allure, Beauty and Enduring Power of BeadsOngoing Yale Peabody Museum of Natural History, New Haven, Connecticut, USA http://peabody.yale.edu/exhibits/mightier-sword-allure-beauty-and-enduring-power-beads
Gem-A Workshops and CoursesGem-A, London www.gem-a.com/education/courses/workshops
Lectures with The Society of Jewellery HistoriansSociety of Antiquaries of London, Burlington House, London www.societyofjewelleryhistorians.ac.uk/current_lectures
• 25 October 2016 Robert Baines—Bogus or Real: Jewellery and the Capture of Human Drama
• 22 November 2016 Kieran McCarthy—Fabergé and London
• 24 January 2017 Noël Adams—Gold and Garnet Cloisonné Jewellery: Recent Discoveries and New Perspectives
• 28 February 2017 David Callaghan—(To be announced)
• 28 March 2017 Marjan Unger—My Jewellery Collection: Confessions of an Art Historian
New Media 265
New Media
Gemstone Buying Guide, 3rd Edn.By Renée Newman, 2016. International Jewelry Publications, Los Angeles, California, USA, 156 pages, ISBN 978-0929975511. US$19.95 softcover.
This third edition is a completely revised version of the Gemstone Buying Guide, and it has been updated with well-rounded information that is organized into 12 chapters:
• Chapter 1 explains coloured gemstone pricing factors.
• Chapters 2–6 explain how to examine a stone according to the ‘4 Cs’ (cut, carat, colour and clarity).
• Chapter 7 is a short section on cat’s-eye and star stones.
• Chapters 8–9 cover various treatment processes and the identification features useful for dis-
tinguishing between natural and synthetic gem-stones.
• Chapter 10 warns the reader about practices done with the intent to deceive the gemstone buyer.
• Chapter 11 provides 77 pages describing the history, characteristics and sources of the more important gem varieties on the market, organ-ized alphabetically.
• Chapter 12 concludes with a short but none-theless important section on how to care for your gems.
The final pages contain a tabulation of birthstones and anniversary stones, followed by a list of gem vari-eties in order of descending Mohs hardness.
The book includes several new gem varieties that were not covered in previous editions. It is also a ‘feast for the eye’, with 356 colour images by a variety of photographers. Newman once again included several of my photos, which I greatly appreciate. She has also conveyed captivating historical information on the gems that she profiles.
The book is an excellent tool for the novice, as well as for knowledgeable members of the gem and jewel-lery trade. I recommend Newman’s book to anybody buying or selling gemstones.
Mia DixonPalagems.com, Fallbrook, California, USA
By Fine Minerals Inter-national, 2014 (released 2016). Produced by Blue Cap Productions, Honolulu, Hawaii, 1 hour 28 minutes playing time, www.shop.bluecap pro-ductions.com. US$19.99.
Pederneira – A Rainbow of Colors (DVD)
In the world of tourmaline, few mines of the modern era have yielded more of the stunning beauty and va-riety of gem crystals than the Pederneira mine, locat-ed near São José da Safira, Minas Gerais, Brazil. This film was prepared to accompany an extensive article on this famous deposit that was published by Miner-alogical Record (Vol. 46, No. 1, January–February 2015, 1–138). It takes the viewer on a journey from the 1940s
to 2014, from the transformation of coffee plantation to mine, and chronicles several incredibly productive eras, ending with an exploration programme to (hopefully) expand the mine in the future. The scene selection is divided into 21 topics, of which 14 are dedicated to individual gem ‘pockets’ (i.e. cavities in the pegmatite hosting tourmaline crystals).
The video is passionately narrated by various key players in Pederneira’s development, such as Daniel Trinchillo (mine co-owner and mineral dealer), José Menezes de Souza (mine partner, also known as ‘Ze’) and Dr Federico Pezzotta (pegmatite geologist). Each individual adds fascinating personal stories of his in-volvement, with a particularly memorable one by Ze who recounted the discovery of the Rocket Pocket in 2001: Ze received a call from the mine workers stat-ing that they had broken into a new cavity showing gemmy tourmaline. He instructed them to stop work and wait for him to arrive the following morning. How-

266 The Journal of Gemmology, 35(3), 2016
New Media
ever, when he arrived he discovered, to his horror, that the miners conducted further blasting that ultimately caused considerable damage to the material; in Ze’s words, “I almost cried.” Although the colour and qual-ity of the crystals were spectacular, only a very few matrix specimens could be salvaged. Since the same crystals still attached to their host matrix could have yielded “5 to 6 times” the selling price, Ze and the Ped-erneira team quickly learned an expensive lesson in gem and mineral mining. Fortunately, the team moved on from this misstep and subsequent pockets were handled more diligently.
The narration is accompanied by video footage of amazing tourmalines as they are slowly rotated, includ-ing famous named specimens such as the ‘Rocket’ and the ‘Big Blue’ (the latter being a perfect 15-cm-diameter, 23-cm-tall blue-green tourmaline crystal perched upon
a ‘soccer ball’-sized piece of white albite matrix). The film is full of such visual treats.
For those interested in the Pederneira locality, or tourmaline in general, this is a must-watch video. However, gemmologists will find little discussion of gem rough and faceted material, as they are not the subject of focus. Some of the narrators’ English pro-nunciation is challenging to understand, but this actu-ally adds to the authenticity of the story. The audio and video are both of excellent quality, and most of the video was filmed on location at Pederneira. The film truly captures the spectacular beauty of Pedernei-ra tourmaline, and hopefully we will see similar video treatments of additional world-class gem and mineral localities in the future.
Keith MychalukCalgary, Alberta, Canada
By Adolf Peretti and Thierry Falise, 2016. GRS GemResearch Swisslab AG, Lucerne, Switzerland, 237 pages, ISBN 978-952386774, www.mogok.com. Fund-raiser edition, US$200.00 hardcover.
Pigeon Blood Valley—On the Trail of Mogok’s Famed Burmese Ruby
In the foreword of this attractive book, the authors ex-plain that this is a personal journey through the history of this fascinating locality for vivid red rubies (com-monly called pigeon blood red by gem traders). They divide the book into 12 chapters. The text is minimal (only 1–2 pages per chapter), but well written and concise. The authors prefer to let the photographs and captions tell much of their story.
The first four chapters focus on some of the fa-mous old-time ruby dealers, as well as on Burmese kings and British colonization, before shifting to more modern history. The photos show the local people, places, mines and, of course, wonderful jew-els. There are numerous spectacular full-page colour images supplied by auction houses Sotheby’s and Christie’s, as well as by a plethora of famous jewel-lers including Cartier, Graf, Van Cleef & Arpels, Harry Winston and Bulgari, to name a few. These photos show the reader exactly why Mogok is so famous for pigeon-blood rubies, with examples of modern and vintage necklaces, bracelets, rings, watches and ear-rings. The authors also include comprehensive his-toric maps, reproductions of original photos from the late 1800s, and antique letters and stamps from the famous collection of Santpal Sinchawla of Bangkok. These help the reader to better understand this amaz-ing and complicated valley.
In Chapter 5 the authors introduce the reader to the ‘Men Who Mine’, covering many modern-day deposits and the miners who work them. Chapter 6, ‘Till the Last Crumb’, is a tribute to an old tradition of allowing village women and children to go through the mine tailings and keep whatever they find. Chapter 7, ‘Ruby Royalty’, covers some present-day local gem dealers, followed by ‘Warlords and Smugglers’ in Chapter 8. The latter characters are an age-old problem in Mogok, as well as in most gem-producing areas throughout hist-ory. Chapter 9 covers the ‘Subcontinent Influence’ of the many Indians and Nepalese who have become strong players in the Mogok gem business. Chapter 10, ‘The Final Cut’, describes how Mogok locals skilfully trans-form rough material into beautiful gems, often using techniques passed down from their grandfathers’ time.
Chapter 11, ‘The Soul of the City’, shows how Mogok is focused completely on gemstones. The authors start with quotations from older books on Mogok that point out the fantasy and charm of this fabled place, and illustrate the chapter with photo-graphs that confirm the beauty and mystique that visit-ors feel there. The final chapter, ‘A Future between Gloom and Hope’, tackles social and environmental issues in a realistic dialogue. The chapter ends with the author’s statement that “only when the river is no longer red will Mogok be finished”.
The last few pages focus on ‘Specialist Doctor Want-ed’, as one of the overriding purposes of this book is to help the AIDS victims of the Mogok District.
For any gemmologist interested in classic Burmese gemstones, especially ruby, I recommend this book. The hundreds of photographs will give you a new un-derstanding of the Mogok area, and you will gain an appreciation of just how rare and beautiful gemstones from this fabled valley are.
William F. LarsonPalagems.com, Fallbrook, California, USA
New Media
New Media
267
Compiled by Georgina Brown and Brendan Laurs
OTHER BOOK TITLESGeneral ReferenceCollecting Rocks, Gems and Minerals: Iden-tification, Values, Lapidary Uses, 3rd edn.By Patti Polk, 2016. Krause Publications, Fort Collins, Colorado, USA, 352 pages, ISBN 978-1440246159. US$19.99 softcover.
Gem Identification Made Easy, 6th edn.By Antoinette Matlins, 2016. Gemstone Press, Nashville, Tennessee, USA, 400 pages, ISBN 978-0997014556. US$38.99 hardcover.
Gemstones: A Complete Color Reference for Precious and Semiprecious Stones of the World By Karen Hurrell and Mary L. Johnson, 2016. Chart-well Books, New York, New York, USA, 320 pages, ISBN 978-0785834984. US$14.99 softcover.
Jewellery and Objets d’Art20th Century Jewelry & the Icons of Style By Stefano Papi and Alexandra Rhodes, 2016. Thames and Hudson, London, 224 pages, ISBN 978-0500519004. £28.00 hardcover.
The Art of Collecting Cartier: An Eye for ExcellenceBy Vivienne Becker and Nick Foulkes, 2016. Flammarion, Paris, France, 272 pages, ISBN 978-2080202680. €110.00 hardcover.
The Beverley Collection of Gems at Alnwick CastleBy Claudia Wagner, John Boardman and Diana Scarisbrick, 2016. Philip Wilson Publishers, London, 384 pages, ISBN 978-1781300442. £40.00 hardcover.
Evert Nijland: Mercurius & Psyche. Jewellery By Ward Schrijver, 2016. Arnoldsche Art Pub-lishers, Stuttgart, Germany, 316 pages, ISBN 978-3897904699. €34.80 hardcover.
Fine Jewelry Couture: Contemporary HeirloomsBy Olivier Dupon, 2016. Thames and Hudson, London, 256 pages, ISBN 978-0500518601. £39.95 hardcover.
Gemstone/Art: Renaissance to the Present DayEd. by Wilhelm Lindemann, 2016. Arnoldsche Art Publishers, Stuttgart, Germany, 352 pages, ISBN 978-3897904651. €49.80 hardcover.
Jeweler: Masters, Mavericks, and Visionaries of Modern DesignBy Stellene Volandes and Carolina Herrera, 2016.
Rizzoli, New York, New York, USA, 256 pages, ISBN 978-0847848614. US$85.00 hardcover.
Messika Joaillerie By Vivienne Becker, 2016. Assouline Publishing, New York, New York, USA, 80 pages, ISBN 978-1614285274. US$25.00 hardcover.
Open Space—Mind Maps: Positions in Contem-porary Jewellery Ed. by Ellen Maurer Zilioli, 2016. Arnoldsche Art Publishing, Stuttgart, Germany, 208 pages, ISBN 978-3897904637. €29.80 hardcover.
Precious Cufflinks: From Pablo Picasso to James Bond By Walter Grasser, Franz Hemmerle and Alexander von Württemberg, 2016. Hirmer Publishing, Munich, Germany, 112 pages, ISBN 978-3777424231. €39.90 hardcover.
Precious Statements—John Donald: Designer ∙ JewellerBy John Donald and Russell Cassleton Elliott, 2016. McNidder & Grace, Carmarthen, Wales, 304 pages, ISBN 978-0857161284. £65.00 hardcover.
Stories in Stone: The Enchanted Gem Carvings of Vasily Konovalenko By Stephen E. Nash, 2016. University Press of Colo-rado, Boulder, Colorado, USA, 304 pages, ISBN 978-1607325024. US$39.95 softcover.
Untitled. Thomas Gentille. American Jeweler Ed. by Angelika Nollert, 2016. Arnoldsche Art Pub-lishers, Stuttgart, Germany, 208 pages, ISBN 978-3897904668. €39.80 hardcover.
Van Cleef & Arpels: The Art and Science of GemsBy Laurence Mouillefarine, 2016. Éditions Xavier Bar-ral, Paris, France, 304 pages, ISBN 978-2365110983. €78.00 hardcover.
Wallace Chan: Dream Light Water By Juliet Weir de La Rochefoucauld and Wallace Chan, 2016. Rizzoli, New York, New York, USA, 380 pages, ISBN 978-0847847549. US$280.00 hardcover.
Organic MaterialsAmber—Views, Opinions, Vol. 3By Barbara Kosmowska-Ceranowicz, Wiesław Gierłowski and Ewa Wagner-Wysiecka, 2016. Publ. by International Amber Association, PAS Museum of the Earth, MTG SA Gdansk International Fair Co. and Gdansk University of Technology (Faculty of Chem-istry), Gdansk–Warsaw, Poland, 204 pages., ISBN 978-8391289402. PLN35.00 softcover. [Note: Includes contributions from the 2010–2015 Amberif Seminars, excluding 2013.]
268 The Journal of Gemmology, 35(3), 2016
Literature of Interest
* Article freely available for download, as of press time
Coloured StonesThe challenges of cutting a large gem opal rough. T. Grussing, Gems & Gemology, 52(2), 2016, 162–167, http://dx.doi.org/10.5741/gems.52.2.162.*
Classification géologique des gisements d’émeraude [Geological classification of emerald deposits]. G. Giuliani, Y. Branquet, A.E. Fallick, L.A. Groat and D. Marshall, Revue de Gemmologie A.F.G., No. 196, 2016, 12–20.
Nano-structure of the cristobalite and tridymite stacking sequences in the common purple opal from the Gevrekseydi deposit, Seyitömer-Kütahya, Turkey. M. Hatipoğlu, Y. Kibici, G. Yanık, C. Özkul and Y. Yardımcı, Oriental Journal of Chemistry, 31(1), 2015, 35–49, http://dx.doi.org/10.13005/ojc/310104.*
Texture, water content and formation mechanism of agate. M. Tao and H. Xu, Acta Petrologica et Mineralogica, 35(2), 2016, 333–343 (in Chinese with English abstract).
Thoroughly ruby [Art Deco ruby ring]. G. Mil-lington, Gems&Jewellery, 25(4), 2016, 22–27.
Usambara effect in tourmaline: Optical spectroscopy and colourimetric studies. M.N. Taran and I.V. Naumenko, Mineralogical Magazine, 80(5), 2016, 705–717, http://dx.doi.org/10.1180/minmag.2016.080.016.
Cultural HeritageFabergé cossack figures created from Russian gemstones. T. Adams and C.L. McCanless, Gems & Gemology, 52(2), 2016, 132–143, http://dx.doi.org/ 10.5741/gems.52.2.132.*
A multidisciplinary study of a group of post-classical cameos from the National Museum in Krakow, Poland. P. Gołyźniak, L. Natkaniec-Nowak, M. Dumańska-Słowik and B. Naglik, Archaeometry, 58(3), 2016, 413–426, http://dx.doi.org/10.1111/arcm.12174.
Diamonds Diamond-bearing gravels along the lower Kwango River DRC. M.C.J. de Wit and E. Thorose, in M.J. de Wit, F. Guillocheau and M.C.J. de Wit, Eds., Geology and Resource Potential of the Congo Basin. Springer, Berlin, Germany, 2015, 341–360, http://dx. doi.org/10.1007/978-3-642-29482-2_16.
Diamonds: Gem set and match [history of diamond engagement rings]. J. Ogden, Gems&Jewellery, 25(5), 2016, 33.
A method for quantitative evaluation of scintillation in round brilliant diamond. P. Liu, X. Yuan, N. Ang and S. Bin, Journal of Gems & Gemmology, 18(3), 2016, 9–17 (in Chinese with English abstract).
Mining diamonds in the Canadian arctic: The Diavik mine. J.E. Shigley, R. Shor, P. Padua, C.M. Breeding, S.B. Shirey and D. Ashbury, Gems & Gemology, 52(2), 2016, 104–131, http://dx.doi.org/10.5741/gems.52.2.104.*
Le monde des diamants roses et comment les identifier [The world of pink diamonds and how to identify them]. B. Deljanin, A. Peretti and M. Alessandri, Revue de Gemmologie A.F.G., No. 196, 2016, 22–29.
Meet the heavyweights of international diamond mining. E. Laniado, World Diamond Magazine, No. 7, 2016, 74–76.
On land, underground and at sea: The many types of diamond mining. E. Laniado, World Diamond Magazine, No. 7, 2016, 80–82.
Overview of diamond resources in Africa. M. de Wit, Z. Bhebhe, J. Davidson, S.E. Haggerty, P. Hundt, J. Jacob, M. Lynn, T.R. Marshall, C. Skinner, K. Smithson, J. Stiefenhofer, M. Robert, A. Revitt, R. Spaggiari and J. Ward, Episodes, 39(2), 2016, 198–237, http://dx.doi.org/10.18814/epiiugs/2016/v39i2/95776.*
The state of the natural colored diamond market – Spring 2016. A. Bronstein, The GemGuide, 35(4), 2016, 2–5.
Gem LocalitiesAlmandine garnet from the Red Embers mine, Erving, Franklin County, Massachusetts. E.S. Greene, Rocks & Minerals, 91(5), 2016, 453–458, http://dx.doi.org/10.1080/00357529.2016.1205938.
In Rainier’s footsteps: Journey to the Chivor emerald mine. R. Weldon, J.G. Ortiz and T. Ottaway, Gems & Gemology, 52(2), 2016, 168–187, http://dx. doi.org/10.5741/gems.52.2.168.*
L’aventure extraordinaire du Botswana [The extraordinary adventure of Botswana]. D. Girard, Revue de Gemmologie A.F.G., No. 196, 2016, 5–11.
Muzo steps up Colombian emerald brand campaign. M. Feliciano, JNA, No. 383, 2016, 64–67.
Literature of Interest
Literature of Interest
269
Origin of sapphires from a lamprophyre dike at Yogo Gulch, Montana, USA: Clues from their melt inclusions. A.C. Palke, N.D. Renfro and R.B. Berg, Lithos, 260, 2016, 339–344, http://dx.doi.org/10.1016/j.lithos.2016.06.004.
InstrumentationApplication of attenuated total reflectance infrared spectroscopy (ATR-FTIR) for amber identification and research. Y. Xing, Spectroscopy and Spectral Analysis, 36(7), 2016, 2066–2070 (in Chinese with English abstract).
Characterization of pearls by X-ray phase contrast imaging with a grating interferometer. V. Revol, C. Hanser and M. Krzemnicki, Case Studies in Nondestructive Testing and Evaluation, 6, 2016, 1–7, http://dx.doi.org/10.1016/j.csndt.2016.06.001.*
Precious coral non-destructive characterization by Raman and XRF spectroscopy. M. Macchia, V. Resta, G. Quarta and L. Calcagnile, X-Ray Spectrometry, 45(5), 2016, 281–287, http://dx.doi.org/10.1002/xrs.2703.
Review on the application of X-ray diffraction in gem identification, synthesis and crystal structure research. N. Zhang and C. Lin, Rock and Mineral Analysis, 35(3), 2016, 217–228 (in Chinese with English abstract).
X-ray computed tomography for fast and non-destructive multiple pearl inspection. J. Rosc, V.M.F. Hammer and R. Brunner, Case Studies in Nondestructive Testing and Evaluation, 6, 2016, 32–37, http://dx.doi.org/10.1016/j.csndt.2016.08.002.*
MiscellaneousThe color of money. E. Blauer, Rapaport Magazine, 39(2), 2016, 42–48. [Note: Discusses the impact of geographic origin reports and treatments on coloured stone prices.]
The education of a native son. E. Konigsberg, Men’s Journal, 25(8), 2016, 70–75 and 96, www.mensjournal.com/features/articles/the-murder-of-an-african-miner-and-his-sons-quest-for-revenge-w437780.* [Note: Describes the situation at the Bridges family’s tsavorite mine in Kenya.]
The foundations constructivism and design to trends in the drafting of metal jewelry in Art Nouveau: Analytical study of Rene Lalique’s jewelry as a new entrance for teaching metal works in the faculties of art education. N.A.G. Elsaid, American Journal of Educational Research, 3(12), 2015, 1579–1591.
Framework for resource uncertainty prediction and data valuation: An application to diamond deposits. J.G. Manchuk, J. Stiefenhofer, M. Thurston and C.V. Deutsch, CIM Journal, 6(3), 2015, 178–190, http://dx.doi.org/10.15834/cimj.2015.19.
Investing in diamonds. L. Renneboog, Business and Economic Research, 5(1), 2015, 166–196, http://dx.doi.org/10.5296/ber.v5i1.7518.*
Tales from the Tower [British Crown Jewels]. A. Fellows, Gems&Jewellery, 25(5), 2016, 14–15.
News PressThe diamond industry: In the rough. The Economist, 2 July 2016, www.economist.com/news/business/21701497-diamond-ever-its-allure-comes-and-goes-rough.*
Diamonds illuminate the origins of Earth’s deepest oceans. R. Becker, Smithsonian.com, 21 June 2016, www.smithsonianmag.com/science-nature/diamonds-illuminate-origins-earths-deepest-oceans-180959480.*
First, find the world’s biggest diamonds. Then don’t break them. T. Biesheuvel and K. Crowley, Bloomberg, 5 July 2016, www.bloomberg.com/news/articles/2016-07-05/first-find-the-world-s-biggest-diamonds-then-don-t-break-them.*
Fisherman found giant 34kg pearl worth $100million – but kept the two-foot long gem under his bed for TEN YEARS as a good luck charm. D. Boyle, DailyMail.com, 22 August 2016, www.dailymail.co.uk/news/article-3753300/Fisherman-giant-34kg-pearl-worth-100million-kept-bed-TEN-YEARS-good-luck-charm.html.*
How do you cut a massive, 404-carat diamond? J. Tarmy, Bloomberg, 6 July 2016, www.bloomberg.com/news/articles/2016-07-06/how-do-you-cut-a-massive-404-carat-diamond.*
Hunting for diamonds under Canada’s frozen tundra. D. Bochove, Bloomberg, 11 July 2016, www.bloomberg.com/news/features/2016-07-11/hunting-for-diamonds-under-canada-s-frozen-tundra.*
New gold rush: Ivory hunters dig for woolly mammoths in Siberia. A. Chapple, The Guardian.com, 1 September 2016, www.theguardian.com/world/gallery/2016/sep/01/mining-woolly-mammoths-ivory-siberia-amos-chapple-in-pictures.*
Why buyers shunned the world’s largest diamond. M. Hart, Vanity Fair, 5 August 2016, www.vanityfair.com/news/2016/08/why-buyers-shunned-the-worlds-largest-diamond.*
Organic Gems and PearlsAdvanced jet testing. S. Steele, Gems&Jewellery, 25(5), 2016, 22–25.
Does the quality of cultured pearls from the black-lip pearl oyster, Pinctada margaritifera, improve after the second graft? P. Kishore and P.C. Southgate, Aquaculture, 446, 2015, 97–102, http://dx.doi.org/10.1016/j.aquaculture.2015.04.024.
270 The Journal of Gemmology, 35(3), 2016
Literature of Interest
The effect of different culture methods on the quality of round pearls produced by the black-lip pearl oyster Pinctada margaritifera (Linnaeus, 1758). P. Kishore and P.C. Southgate, Aquaculture, 451, 2016, 65–71, http://dx.doi.org/10.1016/j.aquaculture.2015.08.031.
Host and donor influence on pearls produced by the silver-lip pearl oyster, Pinctada maxima. C. McDougall, P. Moase and B.M. Degnan, Aquaculture, 450, 2016, 313–320, http://dx.doi.org/10.1016/j.aquaculture.2015.08.008.
Paua. M.C. Pedersen, Gems&Jewellery, 25(4), 2016, 10–12.
Is pearl colour produced from Pinctada margaritifera predictable through shell phenotypes and rearing environments selections? C.-L. Ky, L. Le Pabic, M.S. Koua, N. Molinari, S. Nakasai and D. Devaux, Aquaculture Research, December 2015, 17 pp., http://dx.doi.org/10.1111/are.12947.
Social StudiesThe color of responsibility: Ethical issues and solutions in colored gemstones. J. Archuleta, Gems & Gemology, 52(2), 2016, 144–160, http://dx.doi.org/10.5741/gems.52.2.144.*
Nostalgia for war and the paradox of peace in the Colombian emerald trade. B. Brazeal, The Extractive Industries and Society, 3(2), 2016, 340–349, http://dx.doi.org/10.1016/j.exis.2015.04.006.
Synthetics and Simulants B–C bond in diamond single crystal synthesized with h-BN additive at high pressure and high temperature. Y. Li, Z. Zhou, X. Guan, S. Li, Y. Wang, X. Jia and H. Ma, Chinese Physics Letters, 33(2), 2016, article 028101, http://dx.doi.org/10.1088/0256-307x/33/2/028101.
Studying the effect of hydrogen on diamond growth by adding C
10H
10Fe under high
pressures and high temperatures. C. Fang, X. Jia, S. Sun, B. Yan, Y. Li, N. Chen, Y. Li and H. Ma, High Pressure Research, 36(1), 2016, 42–54, http://dx.doi.org/10.1080/08957959.2015.1129405.
The synthesis and application of high-quality large diamond single crystal. Y. Liu, Superhard Material Engineering, 28(3), 2016, 41–44 (in Chinese with English abstract).
Technical note: Fake turquoises investigated by Raman microscopy. N.D.E. Bernardino, C.M.S. Izumi and D.L.A. de Faria, Forensic Science International, 262, 2016, 196–200, http://dx.doi.org/10.1016/j.forsciint.2016.03.041.
TreatmentsAnalysis of UV-Vis spectrum on pink-purple spinel from Burma before and after heat treatment. Q. Ren, M. Chen, C. Wang and G. Wu, Journal of Gems & Gemmology, 18(3), 2016, 24–30 (in Chinese with English abstract).
N and Cr ion implantation of natural ruby surfaces and their characterization. K.S. Rao, R.K. Sahoo, T. Dash, P. Magudapathy, B.K. Panigrahi, B.B. Nayak and B.K. Mishra, Nuclear Instruments and Methods in Physics Research Section B: Beam Interactions with Materials and Atoms, 373, 2016, 70–75, http://dx.doi.org/10.1016/j.nimb.2016.03.017.
The soaking experiment of Zachery-treated turquoise and the untreated turquoise ore. J. Li, G. Li, C. Fan and X. Yang, Superhard Material Engineering, 28(2), 2016, 57–61 (in Chinese with English abstract).
CompilationsG&G Micro-World. Iris agate with aurora-like appearance • Inclusions in Burmese amber • Chalcedony-quartz intergrowth • Orbicular chalcedony • Manufactured garnet inclusion in quartz • Spondylus pearl with iridescent flame structure • Metal sulfide in pyrope • Cr inclusions in industrial slag synthetic ruby • Triplite in topaz. Gems & Gemology, 52(2), 2016, 198–205, www.gia.edu/gems-gemology.*
Gem News International. Kämmererite from India • UV-Vis spectra of two Pinctada species shells • Ruby cabochons from Macedonia • Fluid inclusions in Russian sapphires • Tremolite and diopside bead • Coloured synthetic moissanite submitted as synthetic diamonds • Steam-dyed Baltic amber • Polymer-coated serpentine carving • Almandine in graphite schist • Australian opal beads with blue play-of-color • Honduran and Turkish opal • South African rhodochrosite crystals • Colombian quartz with trapiche-like patterns • Angela Conty jewellery collection • Robotic colored stone cutting machines. Gems & Gemology, 52(2), 2016, 206–220, www.gia.edu/gems-gemology.*
Lab Notes. Largest Canadian rough diamond, 187.66 ct • Type IIa diamond with red fluorescence • Black NPD synthetic diamond • Emerald with filled drill holes • Natural blister pearls with partial filling • Yellowish green spinel • Large blue and colourless HPHT-grown synthetic diamonds • Yellow synthetic diamond with Ni-related green fluorescence. Gems & Gemology, 52(2), 2016, 188–197, www.gia.edu/gems-gemology.*

The dark-field loupe is an essential piece of kit used the world over by gemmology professionals to help identify coloured gemstones and fracture-filled diamonds. The loupe allows the stone to be observed against a dark background with reflected illumination, enabling easier viewing of internal features and inclusions. Also an excellent tool for identifying treated gemstones, including diamonds, which could be fracture-filled to improve the stone’s overall appearance.
Gemmological Instruments Ltd is a company limited by guarantee and registered in England No. 838324. Registered office: 3rd Floor, 1–4 Argyll Street, London W1F 7LD VAT Reg. No.: 995 8813 45. Gemmological Instruments Ltd is a wholly owned subsidiary of The Gemmological Association of Great Britain (UK Registered Charity No. 1109555).
Join us.
See better with the dark
Usual price £40 + VAT
Now only £32 + VAT*
To place an order contact [email protected]
* Postage and packing fee applies. 20% VAT applies to UK and European countries, except companies with a valid VAT registration number. Offer ends 31 October 2016.
As recommended by Edward Boehm, RareSource:“The dark-field loupe is the single most significant development in portable gemmological instruments for the serious gemmologist.”
20% offINSTRUMENTS
GI_08-2016_Sept-Oct_A4_Darkfield Loupe.indd 1 19/09/2016 16:05:18
Palagems.com / Palaminerals.com +1 800 854 1598 / +1 760 728 9121
Padparadscha Sapphire from Sri Lanka • 5.30 ct • 9.84 x 8.99 x 6.40 mmBlooms from Pala Internaitonal Grounds • Photo: Mia Dixon
esire never stops; it increases even after satisfaction.
— Sri Lanka proverb
D