
103864-Comm. PA - PSERS text
165
-
Upload
khangminh22 -
Category
Documents
-
view
2 -
download
0
Transcript of 103864-Comm. PA - PSERS text


Introductory Section
Page 1
PennsylvaniaPublic School Employees’
Retirement System
(A Component Unit of the Commonwealth of Pennsylvania)
PO Box 125Harrisburg, Pennsylvania 17108-0125
Telephone:
Toll-Free 1-888-773-7748 1-888-PSERS4U
Local 717-787-8540
Comprehensive Annual Financial Reportfor the
Fiscal Year Ended June 30, 2009
Melva S. VoglerChairman
Board of Trustees
Sally J. TurleyVice Chairman
Board of Trustees
Jeffrey B. ClayExecutive Director
Report prepared by the Public School Employees’ Retirement System staff

Introductory Section
Page 2
Table of Contents
Certifi cate of Achievement for Excellence in Financial Reporting .......................................................... 4
Public Pension Coordinating Council – 2008 Public Pension Standards Award ................................... 5
Chairman’s Report .......................................................................................................................................... 6
Section One – Introductory .......................................................................................................................... 7
Mission Statement .......................................................................................................................................... 8Letter of Transmittal ........................................................................................................................................ 9Administrative Organization PSERS Board of Trustees ..................................................................................................................... 16 Board Committees ................................................................................................................................. 18 Organizational Chart ............................................................................................................................. 19 Organizational Structure ........................................................................................................................ 20 Administrative Staff ............................................................................................................................... 27PSERS Regional Offi ces .............................................................................................................................. 28PSERS Headquarters Building ..................................................................................................................... 29
Section Two – Financial ............................................................................................................................. 31
Independent Auditor’s Report ....................................................................................................................... 32Management’s Discussion and Analysis ...................................................................................................... 33Basic Financial Statements Statements of Plan Net Assets Years ended June 30, 2009 and 2008 ................................................. 44 Statements of Changes in Plan Net Assets Years ended June 30, 2009 and 2008 .............................. 46 Notes to Financial Statements .............................................................................................................. 48Required Supplemental Schedule 1 – Schedules of Funding Progress ....................................................... 71Required Supplemental Schedule 2 – Schedules of Employer Contributions .............................................. 72Supplemental Schedule 1 – Schedule of Operating Expenses .................................................................... 73Supplemental Schedule 2 – Summary of Investment Expenses .................................................................. 74Supplemental Schedule 3 – Schedule of Payments to Non-Investment Consultants .................................. 75
Section Three – Investment ....................................................................................................................... 77
Investment Overview .................................................................................................................................... 78 Portfolio Summary Statistics Asset Allocation as of June 30, 2009 ....................................................... 86 Comparison of Actual Portfolio Distribution to Asset Allocation Plan as of June 30, 2009 ............................................................................................................................... 87 Graph – Comparison of Actual Portfolio Distribution to Asset Allocation Plan ....................................... 87 Graph – Portfolio Distribution 10 Year Trend ......................................................................................... 88Portfolio Detail Statistics as of June 30, 2009 Domestic Common and Preferred Stock ............................................................................................... 88 Collective Trust Funds – Common and Preferred Stock ....................................................................... 89 International Common and Preferred Stock .......................................................................................... 89 Fixed Income ......................................................................................................................................... 90 Postemployment Healthcare Investments ............................................................................................. 90 Comparison of Investment Activity Income Fiscal Years Ended June 30, 2009 and 2008 .................................................................................... 91 Graph – Comparison of Investment Activity Income Fiscal Years Ended June 30, 2009 and 2008 .................................................................................... 91Summary Schedule of Brokers’ Fees ........................................................................................................... 92Professional Consultants .............................................................................................................................. 93
Section Four – Actuarial .......................................................................................................................... 101
Actuary’s Certifi cation Letter Introduction .......................................................................................................................................... 102 Executive Summary ............................................................................................................................ 104
Introductory Section
Page 3
Table 1 – Summary of Results of Actuarial Valuation as of June 30, 2008 ................................................. 114Table 2 – Summary of Sources of Employer Contribution Rate as of June 30, 2008 ................................. 115Table 3 – Determination of Health Insurance Contribution Rate for Fiscal Year 2009/2010 ....................... 116Table 4 – Summary of Market Value of Plan Assets as of June 30, 2008 ................................................... 117Table 5 – Derivation of Actuarial Value of Assets as of June 30, 2008 ........................................................ 118Table 6 – Analysis of Change in Unfunded Accrued Liability as of June 30, 2008 ...................................... 119Table 7 – Schedule of Funding Progress – GASB Statement No. 25 Disclosure ....................................... 120 Schedule of Funding Progress – GASB Statement No. 43 Disclosure ................................. 120Table 8a – Schedule of Employer Contributions – GASB Statement No. 25 Disclosure ............................ 121Table 8b – Schedule of employer contributions – GASB Statement No. 43 Disclosure ............................. 122Table 9 – Solvency Test .............................................................................................................................. 123Table 10 – History and Projection of Contribution Rates and Funded Ratios ............................................ 124Table 11 – History and Projection of Annuitants, Benefi ciaries, Survivor Annuitants and Active Members .................................................................................................................... 125Table 12 – Description of Actuarial Assumptions and Methods .................................................................. 126Table 13 – Summary of Benefi t and Contribution Provisions ..................................................................... 129Table 14 – Summary of Membership Data as of June 20, 2008 ................................................................. 133Exhibit I – Active Membership Data as of June 30, 2008 Number and Average Annual Salary ..................................................................................... 134
Number and Average Annual Annuity as of June 30, 2008:Exhibit II – Retired on Account of Superannuation, Early Retirement & Those in Receipt of Withdrawal Annuities ......................................................................................................... 135Exhibit III – Benefi ciaries and Survivor Annuitants ..................................................................................... 136Exhibit IV – Retired on Account of Disability ............................................................................................... 137Exhibit V – Annuitant and Benefi ciary Membership Data as of June 30, 2008 Number and Average Annual Benefi t .................................................................................... 138Exhibit VI – 10 Year History of Membership Data – Active Members ......................................................... 139Exhibit VI – 10 Year History of Membership Data – The Number and Annual Annuities of Annuitant and Survivor Annuitant Members .......................................................................... 140
Section Five – Statistical ......................................................................................................................... 141
Narrative ........ ............................................................................................................................................. 142Schedule of Trend Data .............................................................................................................................. 143Schedule of Total Changes in Pension Plan Net Assets - 10 Year Trend ................................................... 144Additions and Deductions from Pension Plan Net Assets, Years ended June 30, 2000 through 2009 ............................................................................ 145Schedule of Total Changes in Postemployment Healthcare Plans Net Assets - 10 Year Trend ................. 146Additions to Postemployment Healthcare Plans Net Assets -10 Year Trend .............................................. 147Deductions from Postemployment Healthcare Plans Net Assets -10 Year Trend ...................................... 148Schedule of Pension Investment Income – 10 Year Trend ......................................................................... 149Schedule of Premium Assistance Investment Income – 10 Year Trend ..................................................... 150Schedule of Health Options Program Investment Income – 10 Year Trend ............................................... 151Schedule of Summary Membership Data – 10 Year Trend ........................................................................ 152Schedule of Summary Annuity Data – 10 Year Trend ................................................................................ 153Components of Total Contribution Rate ...................................................................................................... 154Schedule of Pension Benefi t and Refund Deductions from Plan Net Assets - 10 Year Trend ................... 155Schedule of Average Monthly Pension Benefi t Payments - 10 Year Trend ................................................ 156Ten Largest Employers ............................................................................................................................... 158Schedule of Employers ............................................................................................................................... 159
Table of Contents (Continued)

Introductory Section
Page 4

Introductory Section
Page 5
P CP C
Public Pension Coordinating Council
Public Pension Standards AwardFor Funding and Administration
2008
Presented to
Pennsylvania Public School Employees Retirement System
In recognition of meeting professional standards for plan funding and administration as
set forth in the Public Pension Standards.
Presented by the Public Pension Coordinating Council, a confederation of
National Association of State Retirement Administrators (NASRA)National Conference on Public Employee Retirement Systems (NCPERS)
National Council on Teacher Retirement (NCTR)
Alan H. WinkleProgram Administrator

Introductory Section
Page 6
MELVA S. VOGLERChairman
SALLY J. TURLEYVice Chairman
November 6, 2009
The Honorable Edward G. Rendell Governor of Pennsylvania
Members of the General AssemblyMembers of the Retirement SystemMembers of the Boards of PSERS’ Employers
Dear Governor Rendell, Legislators, Members, and Employer Board members:
On behalf of the Board of Trustees of the Pennsylvania Public School Employees’ Retirement System (the System, PSERS), I am pleased to present this ninetieth Comprehensive Annual Financial Report (CAFR) for the fi scal year ended June 30, 2009. The report provides an in-depth review of the fi nancial, actuarial, and investment status of the Pension Fund and PSERS’ post-employment healthcare programs. The CAFR also highlights many of the signifi cant activities of PSERS for the fi scal year ended June 30, 2009, as well as programs to improve services to the active and retired members of the System. Finally, the Investment Section of the CAFR details the changes that were made to PSERS’ asset allocations and investment strategies as a result of the extreme turmoil within the fi nancial markets last year.
The fi nancial integrity and actuarial soundness of the System are attested by the accompanying auditor and actuary reports. Moreover, for the 26th consecutive year, PSERS received the Government Finance Offi cer’s Association’s prestigious Certifi cate of Achievement for Excellence in Financial Reporting Award for its June 30, 2008 CAFR.
Notwithstanding the current soundness of the System, PSERS’ Board of Trustees (Board) and staff are cognizant of the funding challenges facing PSERS in the near future, as further discussed in the Transmittal Letter and Financial Section. In keeping with its Mission Statement, the Board is keenly aware of its responsibilities with regard to this issue to the Commonwealth, its taxpayers, and the employers of the System; all stakeholders in the System. Therefore, signifi cant efforts have been and will continue to be made by PSERS’ Board and staff to work with its stakeholders to resolve the funding and employer contribution rate challenges confronting PSERS. In the interim, the Board will continue to administer the affairs of PSERS in the most competent and effi cient manner possible, with the ultimate goal that the retirement and post-employment healthcare funds are managed prudently for the sole benefi t of the System’s members.
In conclusion, the Board appreciates the continuing cooperation extended by the Governor’s Offi ce, the General Assembly and PSERS’ Employers, which enables and empowers PSERS to meet its challenges and make timely provisions for the members it serves.
Melva S. Vogler Chairman, Board of Trustees
COMMONWEALTH OF PENNSYLVANIAPUBLIC SCHOOL EMPLOYEES’ RETIREMENT BOARD
* 5 North 5th Street * PO Box 125 * Harrisburg, Pennsylvania 17108-0125 *

IntroductionIntroductory
- Chairman’s Report
- Transmittal Letter
- Board of Trustees
- Organizational Chart

Introductory Section
Page 8
Mission Statement
The Board of Trustees and the employees of the Public School Employees’ Retirement System (System) serve the members and stakeholders of the System by:
· Providing timely and accurate payment of benefi ts
· Maintaining a fi nancially sound System
· Prudently investing the assets of the System
· Clearly communicating members’ and employers’ rights and responsibilities, and
· Effectively managing the resources of the System
adopted 6/20/2008

Introductory Section
Page 9
November 6, 2009
The Board of TrusteesPennsylvania Public School Employees’ Retirement SystemHarrisburg, PA 17101
We are pleased to present the ninetieth edition of the Comprehensive Annual Financial Report for the Pennsylvania Public School Employees’ Retirement System (the System, PSERS, Fund) for the year ended June 30, 2009. This report is intended to provide fi nancial, investment, actuarial and statistical information in a single publication. The front cover of this year’s CAFR is a fi ling cabinet and the fi rst page of each of the fi ve major sections of the CAFR represents a fi le folder. The CAFR acts as a fi ling cabinet of all of PSERS’ important fi nancial and operational results that occurred throughout the fi scal year. The management of the System is solely responsible for the accuracy and completion of this report, pursuant to section 24 Pa.C.S. §8502(n) of the Public School Employees’ Retirement Code (Retirement Code). The entire report can be downloaded from PSERS’ website at www.psers.state.pa.us.
The System was established on July 18, 1917 to provide retirement benefi ts to public school employees of the Commonwealth of Pennsylvania. The members eligible to participate in the System include all full-time public school employees, part-time hourly public school employees who render at least 500 hours of service in the school year, and part-time per diem public school employees who render at least 80 days of service in the school year for any of the 742 reporting entities in Pennsylvania. As of June 30, 2009, the System had approximately 280,000 active members with an estimated annual active payroll of $12.5 billion.
The annuitant membership at June 30, 2009 was comprised of approximately 178,000 retirees and benefi ciaries who receive over $300 million each month. The average yearly benefi t paid to annuitants is $22,456. The average benefi t payment for each benefi t type, grouped by years of credited service, is detailed in the Statistical Section of this report.
The System is a governmental cost-sharing multi-employer defi ned benefi t pension plan, to which all members and 742 reporting units contribute. PSERS is administered by a staff of 310. The System is headquartered in Harrisburg, Pennsylvania, and maintains eight fi eld offi ces in strategic areas of the Commonwealth to enable direct contact with the membership and the System’s employers.
Letter of Transmittal
Introductory Section
Page 10
PSERS was established by law as an independent administrative board, directed by a governing board of trustees (Board) which exercises control and management of the System, including the investment of its assets. PSERS is considered a component unit of the Commonwealth of Pennsylvania as defi ned by the Governmental Accounting Standards Board (GASB). An annual audit of the System by a certifi ed public accounting fi rm is required by the Retirement Code. PSERS has contracted with Clifton Gunderson LLP for this audit of its fi nancial statements and has received an unqualifi ed opinion as evidenced in the Independent Auditors’ Report in the Financial Section of this report. An unqualifi ed opinion means that PSERS’ fi nancial statements fairly present its fi nancial condition.
Economic Summary
The worst economic contraction since the Great Depression led to a large decrease in U.S. Gross Domestic Product, an increase in the U.S. unemployment rate, the failure of several large fi nancial institutions and the federal government bailout of several large public companies. The extremely diffi cult economic conditions in this business cycle, which is commonly being referred to as the “Great Recession”, led to negative returns for equity, real estate and commodities around the world. As a result, PSERS experienced a very challenging fi scal year ended June 30, 2009 (FY 2009) as PSERS’ investment portfolio generated a rate of return of -26.54%. The total net assets of the System decreased from $62.7 billion to $43.2 billion from July 1, 2008 to June 30, 2009. The decrease is primarily attributable to the fact that the combined net investment loss and payment of benefi ts and administrative expenses far exceeded member and employer contributions.
Despite the diffi cult economic environment in FY 2009, the Board has continued to fulfi ll its mission to maintain stability and the long-term optimum value of the Fund. This is evidenced in the long-term growth of the System’s assets and the actuarial soundness of the Fund with respect to its funding status. The annualized rate of return for the twenty-fi ve year period ended June 30, 2009 was 9.23% and exceeded the Fund’s long-term investment rate of return assumption during that time period. Of utmost importance to the Board is the assurance that the required reserves are available for payment of retirement benefi ts. PSERS has maintained its position among the top twenty-fi ve largest pension systems in the nation.
Major InitiativesBudgetary and Financial Governance
PSERS submits its administrative budget request to the Governor’s Offi ce of the Budget each October where it is reviewed and evaluated. Any changes proposed by the Governor’s Budget Offi ce are made and a fi nal amount is provided to the Legislature, which passes the fi nal budget and submits it to the Governor for his signing it into law. The administrative budget is not funded from the Commonwealth’s General Fund, rather from the earnings of the Fund itself. While the annual budget is always prepared as conservatively as possible, in response to the economic downturn, PSERS created an internal budgetary reserve that restricted FY 2009 spending wherever possible. Postponed purchases included computers, information technology equipment and offi ce furniture. This was in addition to the Commonwealth initiatives that included banning most out-of-state travel, issuing a moratorium on new vehicle purchases, and imposing a freeze on management salaries and hiring. The projected lapse for FY 2009 is 6.9% of budget as refl ected in the following chart.

Introductory Section
Page 11
Fiscal Year: FY 2005 FY 2006 FY 2007 FY 2008 FY 2009AdministrativeBudget $41,758,334 $39,539,000 $ 39,455,000 $40,811,000 $42,068,000
Expenditures* 39,376,793 36,935,084 38,230,663 38,009,568 39,183,000
Lapse (unspent funds) 2,381,541 2,603,916 1,224,337 2,801,432 2,885,000
PercentageLapsed 5.7% 6.6% 3.1% 6.9% 6.9%
*Expenditures are those posted to the Commonwealth’s accounting system and therefore do not include accruals.
As refl ected in the fi ve-year table, PSERS is committed to the prudent use of its funds and managing its annual budget. As a result, PSERS has annually, underspent its approved budget, thus keeping more funds available to invest for “PSERS’ members”. The System continually looks for ways to cut costs while maintaining excellent customer service and effi ciency of operations.
Customer ServiceWith the successful implementation of the New Pension Administration System (NPAS), PSERS
is intently focused on improving the levels of service provided to its members. With the new system as a key enabler, PSERS’ dedicated staff has been working more effi ciently and effectively resulting in the reduction of signifi cant backlogs that have historically existed. For example, since December 2008, the purchase of service applications on fi le to be processed was reduced by nearly 10,000 or more than 30%.
Reducing backlogs is one result of the service improvements being realized. Paying complete and accurate retirement benefi ts in a much timelier manner is another. Traditionally, PSERS’ retirement benefi ts have been paid to members in two steps; an initial benefi t within about 10 weeks of retirement based on information on fi le with PSERS at that time, and then a fi nal benefi t with retroactive monies within about 18 months of the retirement date using fi nal information. This not only meant staff had to work on each member’s account twice, but since the initial benefi t was calculated on incomplete data, that benefi t would only be on average 87% of the fi nal benefi t. With new processes in place and improved employer reporting, PSERS expects to process at least 20% of all retirements in 2009 as one step, enabling staff to only work on a member’s account once and providing the full benefi t to the member with the initial payment.
Each year PSERS expects to increase the number of retirements processed as one step, eventually making one step retirements the norm and not the exception. Additionally, plans are being put in place to make the most of the new system and optimize and improve each and every benefi t process. PSERS is very pleased with the progress being made and is fully committed to continuing improvements.

Introductory Section
Page 12
Pension Funding A major focus of the System this past fi scal year has been to continue to provide education to
all stakeholders on the funding challenges currently facing PSERS. The employer contribution rate is projected to signifi cantly increase to nearly 30 percent in FY 2013. PSERS has worked closely with school employers and the legislature to educate them on the issue and potential options to minimize the increase as much as possible. During the past year PSERS Executive Director Jeffrey Clay has provided over 35 presentations on the funding issue to school employers, legislators and constituent groups.
In addition, PSERS continues to analyze combinations of various options to address the rate increase. Under all options, however, there will be a need for signifi cant additional funding to the System. As such, the resolution of the current funding issues confronting PSERS is imperative for the System and represents the greatest challenge PSERS has faced in its history. PSERS remains committed to providing all available assistance to the Governor, General Assembly and school employers to resolve the rate spike and future funding issues as soon as possible.
Health Options Program (HOP) InitiativesThe Board added the physical fi tness benefi t, Silver Sneakers, to the HOP Medical Plan, its
Medicare supplement plan covering 45,000 retirees and their dependents effective January 1, 2009. The benefi t is a two-year pilot project to determine if a physical fi tness program can be cost effective in a Medicare supplement environment. After evaluating the group’s participation in the fi tness classes and the impact on claims cost, the Board will decide whether to continue the benefi t past the two-year period.
During the past year the Board also restated the Premium Assistance plan approval policy. The Premium Assistance benefi t reimburses eligible retirees up to $100 per month for the premiums they pay to an approved health insurance plan. Those plans which are approved for Premium Assistance are the plans within the PSERS HOP as well as the plans of the Commonwealth public school systems. The policy is effective January 1, 2010, and restates the criteria the public schools must meet to maintain an approved plan that qualifi es for the Premium Assistance benefi t.
The Board is also expanding the capabilities of the HOP’s HOPbenefi ts.com website. The current website provides general information about HOP and permits users to download plan documents. The expanded website will give HOP Medical Plan participants access to personal health information and provide them with the ability to inquire and receive updates on the status of their claims. The updated website came online in November 2009.
In addition, the Segal Company, PSERS’ healthcare consultant, completed its 2008 claims audit of HOP’s self-funded medical benefi t plans administered by CoreSource, Inc., PSERS’ third party administrator. The claims audit concluded that not only did CoreSource provide excellent service, but that the fi nancial accuracy, payment accuracy, procedural accuracy, and timeliness were exceptional and considerably exceeded industry standards.
Financial Highlights
The fair value of the System’s net assets totaled $43.2 billion as of June 30, 2009. The System is the 12th largest state-sponsored public defi ned benefi t pension fund in the nation and the 21st largest among public and corporate pension funds in the nation. More specifi c information on the System’s assets is detailed in the Statements of Plan Net Assets and Management’s Discussion and Analysis included in the Financial Section of this report.

Introductory Section
Page 13
One of PSERS’ mission critical objectives is the timely and accurate payment of benefi ts. In FY 2009 PSERS provided $4.9 billion in pension and healthcare benefi ts to its members.
The System’s administrative budget request is appropriated by the Pennsylvania General Assembly and funded by the investment income of the System. For FY 2009, the appropriation was $42.1 million.
Funding
Funding is the process of specifi cally setting aside money for current and future use. Proper funding for a defi ned benefi t pension plan entails an actuarial examination of the fund balances and liabilities to ensure money will be available for future and current benefi t payments. The actuarial valuation measures the progress toward funding pension obligations of the System by comparing the actuarial assets to the actuarial liabilities of the System.
The results of PSERS’ latest published actuarial valuation (as of June 30, 2008) indicated that the rates of contribution payable by the members and employers, when taken together with the current assets of the System, are adequate to fund the actuarial liabilities on account of all benefi ts payable under the System at that date. The funded status as of the latest actuarial valuation was 86.0%. Additional comparative information on the funded status of PSERS can be found in the Actuarial Section and in the Financial Section of this report.
Investments
Income from the investment portfolio represents the major source of revenue to the System, accounting for nearly 68% of total revenues over the period from FY 1990 to FY 2009. During FY 2009 the net investment loss was $16.2 billion. The investment portfolio, which is one part of the System’s net assets, totaled $43.3 billion, at fair value, as of June 30, 2009. For FY 2009, the time-weighted rate of return on the System’s investments was -26.54%.
The investment portfolio is well diversifi ed to emphasize a long-term investment approach. The overall objective of the System is to provide benefi ts to its members through a carefully planned and well-executed investment program. The return objectives are to (i) realize a return suffi cient to achieve funding adequacy on an infl ation-adjusted basis and that exceeds the Policy Index (the Policy Index is a custom benchmark based on the Board-established asset allocation structure to generate a return that meets the actuarial rate of return assumption); and (ii) invest the assets to maximize returns for the level of risk taken. The risk objectives are to (i) diversify the assets of the System to minimize the risk of losses within any one asset class, investment type, industry or sector distribution, maturity date, or geographic location; and (ii) invest the assets so that the probability of investment losses (as measured by the Policy Index) in excess of 12.0% in any one year is no greater than 2.5% (or two standard deviations below the expected return).
Additional information on the System’s investments is contained in the Investment Section of this report.

Introductory Section
Page 14
Federal and State Tax Status
The System is a qualifi ed trust fund under Section 401(a) of the Internal Revenue Code (IRC). As a result of the qualifi ed status, the trust fund is entitled to an exemption, under Section 501(a) of the IRC, from federal income taxation on its investment earnings. Additionally, contributions made on behalf of the active members are tax deferred under Section 414(h) of the IRC. The trust fund and any benefi ts accruing to the members of PSERS are exempt from Pennsylvania state and municipal taxes.
It should be noted that the Internal Revenue Service (IRS) announced and initiated a renewed focus on the tax qualifi cation of public pension funds in 2008. PSERS is working proactively in conjunction with the State Employees’ Retirement System to address this IRS initiative.
Internal Controls and Reporting
PSERS’ management is responsible for and has implemented internal controls designed to provide reasonable assurances for the safeguarding of assets and the reliability of fi nancial records.
This report has been prepared in accordance with accounting principles generally accepted in the United States of America. The System maintains a full accrual accounting system. More specifi c accounting information is detailed in the Summary of Signifi cant Accounting Policies (Note 2) in the notes to the fi nancial statements found in the Financial Section of this report.
We believe the internal accounting controls currently in place are adequate to meet the purpose for which they were intended. We also believe the fi nancial statements, supporting schedules and statistical tables to be fairly presented in all material respects.
Professional Services
Professional consultants are appointed by the Board of Trustees to perform services essential to the effi cient operation of the System. An annual audit by an independent certifi ed public accounting fi rm and annual valuation by an actuarial consultant attest to the fi nancial and actuarial soundness of PSERS. The investment performance of the System is reviewed by an investment evaluation fi rm on a quarterly basis. The consultants providing services to the System are listed in the Financial Section and Investment Section of this report.
Other Information
In compliance with the Retirement Code, actuarial tables and the computational procedures used by the System in calculating annuities and other benefi ts were published in the Pennsylvania Bulletin (Vol. 31, No.14). This information can be found at www.pabulletin.com/secure/data/vol31/31-14/index.html.

Introductory Section
Page 15
System Awards
Government Finance Offi cers Association of the United States and CanadaCertifi cate of Achievement for Excellence in Financial Reporting
The Government Finance Offi cers Association of the United States and Canada (GFOA) awarded a Certifi cate of Achievement for Excellence in Financial Reporting to PSERS for its Comprehensive Annual Financial Report for the fi scal year ended June 30, 2008 (FY 2008). The Certifi cate of Achievement is a prestigious national award recognizing conformance with the highest standards for preparation of state and local government fi nancial reports. To be awarded a Certifi cate of Achievement, a government unit must publish an easily readable and effi ciently organized comprehensive annual fi nancial report, whose contents conform to program standards. Such a comprehensive annual fi nancial report must satisfy both generally accepted accounting principles and applicable legal requirements.
A Certifi cate of Achievement is valid for a period of one year only. PSERS has received a Certifi cate of Achievement for 26 consecutive years from FY 1983 to FY 2008. A photograph of this award appears in the Introductory Section of this report. Its attainment represents a signifi cant accomplishment by the System, whose Offi ce of Financial Management holds general responsibility for the compilation and validity of the fi nancial data presented in the Comprehensive Annual Financial Report.
The System believes the current report continues to conform to the Certifi cate of Achievement program requirements and will be submitting this report to GFOA to determine eligibility for the 2009 certifi cate.
Public Pension Coordinating Council – Public Pension Standards AwardThe Public Pension Coordinating Council has awarded its Public Pension Standards Award to
PSERS for 2008. This award is in recognition of meeting professional standards for plan design and administration as set forth in the Public Pension Standards.
The Public Pension Coordinating Council was formed in 1990 to assist the public employee retirement community. The Council is composed of representatives from three national associations whose members are directly involved in the administration of public employee retirement systems: the National Association of State Retirement Administrators (NASRA); the National Conference on Public Employee Retirement Systems (NCPERS); and the National Council on Teacher Retirement (NCTR). A reproduction of this award appears in the Introductory Section.
Acknowledgements
The preparation of this report refl ects the combined efforts of PSERS staff under the direction of the PSERS Board. It is intended to provide complete and reliable information in conformance with accepted standards and to document responsible stewardship of the System’s assets.
Respectfully submitted,
Jeffrey B. Clay Brian S. Carl, CPA, CTPExecutive Director Chief Financial Offi cer

Introductory Section
Page 16
Administrative OrganizationPSERS Board of Trustees
As of July 31, 2009
Seated, front row: Stacey Connors, designee for Honorable Patrick M. Browne; Sally J. Turley, Vice-Chairman; Melva S. Vogler, Board Chairman and Patricia A. Tozer
Standing, second row: Honorable Robert M. McCord; Honorable Glen R. Grell; Thomas J. Gentzel; Glen S. Galante; Richard N. Rose, Hal Moss; John Raymond, designee for Honorable Shirley M. Kitchen; James M. Sando and Jeffrey B. Clay, PSERS’ Executive Director, Board Secre-tary
Not pictured: Dr. Gerald L. Zahorchak, Secretary of Education; Honorable Dwight Evans and Tina Byles-Williams

Introductory Section
Page 17
PSERS Board of Trustees
As of November 6, 2009
Secretary of Education of the Commonwealth of Pennsylvania (ex offi cio) Dr. Gerald L. Zahorchak, Ph.D
Treasurer of the Commonwealth of Pennsylvania (ex offi cio)Honorable Robert M. McCord
Executive Director of the Pennsylvania School Boards Association, Inc. (ex offi cio)Mr. Thomas J. Gentzel
Two members appointed by the Governor of the Commonwealth of PennsylvaniaMr. Hal Moss (term expires 12/31/09)Ms. Tina Byles-Williams (term expires 01/01/12)
Three members elected from among the certifi ed contributors of the System for a term of three years
Mr. Glen S. Galante (term expires 12/31/09)Mr. James M. Sando (term expires 12/31/10)Ms. Melva S. Vogler (term expires 12/31/11)
One member elected from among the noncertifi ed contributors of the System for a term of three years
Ms. Patricia A. Tozer (term expires 12/31/09)
One member elected from among the annuitants of the System for a term of three yearsMrs. Sally J. Turley (term expires 12/31/10)
One member elected by the members of Pennsylvania Public School Boards from among their number for a term of three years
Mr. Richard N. Rose (term expires 12/31/11)
Two members appointed by the Speaker of the House from the Pennsylvania House of Representatives, one representing the Majority Party and one representing the Minority Party
Honorable Dwight Evans (term expires 11/30/10)Honorable Glen R. Grell (term expires 12/31/10)
Two members appointed by the President Pro Tempore of the Pennsylvania Senate, one representing the Majority Party and one representing the Minority Party
Honorable Shirley M. Kitchen (term expires 11/30/12)Honorable Patrick M. Browne (term expires 11/30/10)

Introductory Section
Page 18
2009 Board Committees
As of July 31, 2009
Appeals / Member Services
Ms. Tozer, ChairMr. Gentzel
Senator Kitchen Mr. MossMr. Rose
Mr. SandoMrs. Turley
Audit/Budget
Mr. Galante, ChairRepresentative Evans
Mr. GentzelRepresentative GrellTreasurer McCord
Mr. Rose
Bylaws / Policy
Senator Browne, ChairRepresentative EvansRepresentative Grell
Mr. MossMr. SandoMrs. Turley
Corporate Governance
Mr. Sando, ChairSenator Browne
Ms. Byles-WilliamsMr. Galante
Treasurer McCordMr. Rose
Elections
Dr. Zahorchak, ChairRepresentative Evans
Ms. Byles-WilliamsSenator Kitchen
Mr. MossMs. Tozer
Finance
Mr. Rose, Chair
Committee is comprised of all Board Members
Health Care
Mrs. Turley, ChairRepresentative Evans
Mr. GalanteMr. Gentzel
Representative GrellMs. Tozer
Personnel
Mr. Gentzel, ChairSenator Browne
Treasurer McCordMr. Rose
Mr. SandoMrs. Turley
Technology Steering
Mr. Moss, ChairMs. Byles-Williams
Mr. GalanteSenator Kitchen
Treasurer McCordDr. Zahorchak
NOTE: The chair of the Board of Trustees is a voting ex-Offi cio member of all Committees

Introductory Section
Page 19
Act
uary
Inve
stm
ent A
dvis
ors
INVE
STM
ENT
OFF
ICE
DEP
UTY
EXE
CU
TIVE
DIR
ECTO
R
Inve
stm
ent
Acc
ount
ing
Div
isio
n
Gen
eral
Acc
ount
ing
Div
isio
n
Bur
eau
ofB
enef
itsA
dmin
istr
atio
n
Exce
ptio
nPr
oces
sing
Div
isio
n
Ben
efit
Polic
y an
dSp
ecia
lized
Serv
ice
Div
isio
n
Bur
eau
of
Com
mun
icat
ions
and
Cou
nsel
ing
Publ
icat
ions
Cen
ter
Mem
ber
Serv
ice
Cen
ter
Fiel
d Se
rvic
es D
ivis
ion
Reg
iona
l Offi
ces:
Nor
thw
est R
egio
nSo
uthw
est R
egio
nN
orth
Cen
tral
Reg
ion
Sout
h C
entr
alR
egio
nN
orth
east
Reg
ion
Sout
heas
t Reg
ion
Cen
tral
Wes
t Reg
ion
Cen
tral
Eas
t Reg
ion
PUB
LIC
SC
HO
OL
EMPL
OYE
ES'
RET
IREM
ENT
BO
AR
D
Bur
eau
ofIn
form
atio
nTe
chno
logy
Hea
lthIn
sura
nce
Offi
ce
Hum
anR
esou
rces
Offi
ce
EXEC
UTI
VE D
IREC
TOR
Offi
ce o
f the
Bud
get
Com
ptro
ller
Offi
ce o
f Gen
eral
Cou
nsel
Chi
ef C
ouns
el
Ann
uita
nt A
ccou
ntin
gan
d B
udge
t Div
isio
n
OFF
ICE
OF
FIN
AN
CIA
LM
AN
AG
EMEN
T
Bur
eau
ofA
dmin
istr
atio
n
Com
mun
icat
ion
Serv
ices
Div
isio
n
Bur
eau
ofIn
form
atio
nM
anag
emen
t
Purc
hasi
ng a
ndC
ontr
actin
gD
ivis
ion
Adm
inis
trat
ive
Serv
ices
Div
isio
n
Secu
rity
and
Bus
ines
sC
ontin
uity
Div
isio
n
Dat
aSt
ewar
dshi
pD
ivis
ion
Net
wor
k, S
erve
r,an
d D
atab
ase
Div
isio
n
Bus
ines
sA
pplic
atio
nsD
ivis
ion
Doc
umen
tA
rchi
ve a
nd D
ata
Cap
ture
Div
isio
n
Ben
efit
Proc
essi
ngD
ivis
ion
Empl
oyer
Serv
ice
Cen
ter
Inte
rnal
Aud
itor
Syst
emSu
ppor
tC
ente
r
Info
rmat
ion
Tech
nolo
gy O
ffice
Bus
ines
sA
rchi
tect
ure
Cen
ter
ASS
ISTA
NT
EXEC
UTI
VED
IREC
TOR
OR
-08-
141
June
12,
200
8
Org
aniz
atio
nal C
hart
of t
hePu
blic
Sch
ool E
mpl
oyee
s’ R
etire
men
t Sys
tem

Introductory Section
Page 20
Organizational Structure of thePublic School Employees’ Retirement System
Executive Offi ceThis offi ce is responsible for the overall management of PSERS to achieve the primary objectives of the Fund as established by the Board. Reporting directly to the Executive Director are the Deputy Executive Director, Assistant Executive Director, Chief Investment Offi cer, Chief Financial Offi cer, Internal Auditor, Press Secretary, and Legislative Liaison. The Executive Director serves as chief executive offi cer responsible for the establishment, installation, and maintenance of modern management techniques to provide an effi cient control of funds for and services to the active members and annuitants of the System.
The Executive Offi ce monitors the operation of the investment portfolio and evaluates portfolio performance for consideration by the Board, certifi es expenditures of the Fund, and measures performance of professionals or fi rms with whom the Board contracts for specialized services. The Executive Offi ce also apprises the Board of any development that will in any way affect the System and its operation. A list of payments to non-investment consultants can be found in the Financial Section and a list of professional investment consultants is shown in the Investment Section.
Investment Offi ceThis offi ce is responsible for the investment activities of the System. In compliance with the investment policy established by the Board, PSERS’ investment assets are allocated to numerous outside professional investment advisors and internal investment professionals.
Chief Counsel’s Offi ceThis offi ce provides legal services through a team of professional personnel under the Governor’s Offi ce of General Counsel. It is responsible for representing PSERS in all administrative hearings and other litigation matters; drafting and negotiating PSERS’ investment and administrative services contracts; and providing counsel on a wide variety of matters, including the interpretation of the Retirement Code and the Right-to-Know Law.
In ternal Auditor’s Offi ceThis offi ce performs systematic reviews of the various activities of PSERS, testing for compliance with applicable laws, policies and procedures. The Internal Auditor makes recommendations on the improvement of PSERS’ internal control system.
Of fi ce of Financial ManagementThis offi ce is directed by the Chief Financial Offi cer and has responsibility for planning, organizing and directing a complete accounting and fi nancial reporting system in conformance with accounting principles generally accepted in the United States of America. Oversight is provided for new accounting systems development and maintenance of existing systems, and ensuring appropriate accounting controls. The offi ce is the liaison for other state and federal agencies, reporting units, fi nancial consultants, actuaries, and investment advisors for all accounting, treasury operations, taxation, actuarial and budgetary matters. The offi ce is organized into three divisions: General Accounting Division, Annuitant Accounting and Budget Division, and Investment Accounting Division.

Introductory Section
Page 21
G eneral Accounting DivisionThis division has the responsibility of recording all fi nancial transactions for the pension and health care operations of the System. It maintains PSERS’ General Ledger and prepares interim and annual fi nancial statements. It bills and collects contributions due to the Fund from its employers. It provides accounts receivable services to the System for member debts. It also interacts with the other divisions in the Offi ce of Financial Management to assure that the basic fi nancial statements of the System include all fi nancial activity monitored and controlled by those accounting divisions.
An nuitant Accounting and Budget DivisionThis division is responsible for the mission-critical annuitant payroll and disbursement function. The division also has the responsibility of monitoring and recording post-employment healthcare transactions. It reconciles and monitors the fi nancial activities of the third party administrator of the Health Options Program. Additionally, the division is responsible for accounts payable operations and for developing and monitoring the System’s annual budget.
Investme nt Accounting DivisionThis division serves as intermediary with the custodian bank, the State Treasury Department, brokers, investment managers, the investment evaluator, and investment consultants. The division processes, audits and approves investment expenses, prepares monthly investment fi nancial reports and processes all investment funding allocations. Working with the assistance of a third-party application service provider, it has the responsibility for monitoring the overall internal control structure for investments thereby assuring adequate custody of all investment assets.
The division is also responsible for directing and administering the Class Action Revenue Recovery, the Foreign Cash Overdraft and the Foreign Tax Reclaim Collection programs as part of PSERS’ investment activities. It also supports PSERS’ Investment Offi ce and the Board in achieving investment objectives and monitoring compliance with investment policy. The division is comprised of the Public Market Reporting and Analysis, Private Market Reporting and Analysis, and Treasury and Manager Administration sections.
Deputy Executive DirectorThe Deputy Executive Director directly oversees the benefi t programs for all active and retired members of the System, the development and implementation of the member and employer communications programs and the member counseling programs, and the maintenance of agency policies, procedures, and benefi t related data. Additionally, this position supervises a Chief Technology Offi cer who oversees business and information technology strategic planning, policy development, and implementation. The organizational units directly reporting to this position include the Bureau of Benefi ts Administration, the Bureau of Communications and Counseling, and the Bureau of Information Management. The position oversees the Bureau of Information Technology through the Chief Technology Offi cer.

Introductory Section
Page 22
Information Tech nology Offi ceThis offi ce oversees the Bureau of Information Technology and the Business Architecture Center. It is responsible for strategic information technology planning and policy development, ensuring that information technology plans and policies are aligned with, in support of, and prioritized according to agency needs and requirements, as well as those Commonwealth needs and requirements that are consistent with agency needs, and for communicating such to the agency’s information technology staff. Large information technology contracts and projects are managed by this offi ce. This offi ce is responsible for understanding, analyzing, documenting, and improving PSERS’ organization, business rules, processes, information systems, and the relationships among these components so that PSERS is able to: conduct its business consistently and according to established rules; understand each component, its relationship to each of the other components and to PSERS’ mission, vision, values and goals; fully, yet quickly analyze and understand the impact of potential change to one or more of these components on the others; more effectively identify ineffi cient, duplicate, or suspect processes, and/or technologies; and account for its organizational business rules and processes, information systems and technologies.
Business Architectur e CenterThis center serves as the repository for PSERS’ business knowledge and makes that knowledge available and understandable to agency processing and technology staff. The center receives and responds to data queries from agency staff and investigates system, data, or process problems. This center includes analysts who collect, analyze, and document PSERS’ organizational business rules, processes, and information systems. The center also performs detailed impact analysis as and when change is proposed. Additionally, staff in this unit confi rm that changes have been applied correctly. They look for opportunities for improvement, lead the development of business requirements, and serve as liaisons between PSERS’ end-users and information technology staff.
Bureau of Information Techno logyThis bureau is responsible for planning, coordinating, administering, and implementing information technology resources in accordance with the agency’s strategic plans, goals, objectives, and priorities as communicated by PSERS’ Chief Technology Offi cer, and for providing operational support for those technologies and initiatives. The bureau is organized into three divisions: The Network, Server, and Database Division, the Business Applications Division, and the Document Archive and Data Capture Division.
Network, Server, and Database DivisionThis division is responsible for administering those information technology resources that collectively provide the fundamental hardware, software, and network components and services required to support PSERS’ various applications.
Business Applications Division This division provides consultative, technical, and operational support in the planning, design, specifi cation, confi guration, development, implementation, operation, support, and troubleshooting of PSERS’ business applications.
Document Archive and Data Capture DivisionThis division provides consultative, technical, and operational support in the planning, design, specifi cation, confi guration, development, implementation, operation, support, and troubleshooting of PSERS’ enterprise archive application software, scanning software, and data capture software, as well as the interfaces of those applications with PSERS’ various business applications.

Introductory Section
Page 23
Bureau of Information Management This bureau is responsible for maintaining, documenting, and cleansing PSERS’ member and employer data, managing PSERS’ electronic data records, imaged records, paper and fi lm/fi che records, understanding the meaning and knowing the location of its data. The bureau currently includes the Data Stewardship Division which houses PSERS’ records management program, and the Data Integrity and Member Accounting sections.
Data Stewardship DivisionStaff in t his division are the trustees and primary maintainers of PSERS’ member and employer data, working to make this data most usable to agency processing staff. Specifi cally, this group maintains PSERS’ member demographic information, affi liate information, and is responsible for correctly applying monetary and non-monetary adjustments to member accounts. This division maintains responsibility for PSERS’ records management programs.
Bureau of Benefi ts Administration This bu reau is responsible for administering a comprehensive pension benefi ts program for PSERS. The bureau provides professional and technical services to individuals who are employed full-time and part-time in one of Pennsylvania’s 742 public schools or institutions. They also provide services to retirees, their benefi ciaries and persons legally authorized to act on their behalf. The bureau is organized into three divisions: the Benefi t Processing Division, Benefi t Policy and Specialized Service Division, and Exception Processing Division.
Benefi t Processing Division This division is responsible for handling a high volume of benefi t requests. It houses the Retirement Processing Center and Purchase of Service and Refund Center.
Retirement Processing Center: The Retirement Processing Center determines eligibility and calculates estimated retirement benefi ts, creates payroll records, and originates the initial benefi t payments and direct rollovers. When employers report fi nal salary and service data, staff conduct in-depth reviews of accounts and calculate fi nalized benefi ts.
Purchase of Service and Refund Center: The Purchase of Service and Refund Center determines eligibility and calculates the cost to the members and to the employers for the purchase of additional service credit. Staff also process requests to refund contributions and interest from members terminating from the system who at the time of termination are ineligible for a retirement benefi t.
Benefi t Policy and Specialized Service DivisionThis divi sion is responsible for benefi t policy administration, which includes the development of all benefi t policies, procedures and business rules. In addition, the division processes the most complex and sensitive benefi t requests. Last, the division has a quality assurance program responsible for the review and approval of all benefi t payments. It houses the Benefi t Policy Center and Specialized Service and Quality Assurance Center.

Introductory Section
Page 24
Benefi t Policy Center: The Benefi t Policy Center is responsible for benefi t policy administration, which includes the development of all benefi t policies, procedures and business rules. Policy writing involves extensive research into existing laws, regulations and policy as well as impact analysis. Staff coordinate all requests for legal analysis and legal opinions. When unique and/or new calculations are needed, this area works with the agency’s consulting actuary. This area also manages the fi rst level of the administrative appeal process which involves presenting recommendations, supporting legal analyses, and relevant documents to the Executive Staff Review Committee. In addition, the center reviews unusual and suspicious salary contracts to ensure only retirement-covered compensation is reported by employers. Last, staff reviews atypical requests for membership eligibility.
Specialized Service and Quality Assurance Center: The Specialized Service and Quality Assurance Center is responsible for both processing the most complex benefi t requests and for quality assurance. Much of the work is generated by the review and implementation of portions of Domestic Relations Orders that address the distribution of pension benefi ts when divorce occurs. This area calculates benefi ts for members affected by Section 415(b) of the IRS code and is responsible for the calculation of a workers’ compensation offset. Last, a team of auditors review and approve all retirement and death benefi t calculations, all requests for payment, and all purchase of service calculations.
Exception Processing DivisionThis division is responsible for a variety of benefi t reque sts which involve manual or special processing. It houses the Manual Processing and Multiple Service Membership Center and the Disability and Death Benefi t Center.
Manual Processing and Multiple Service Membership Center: The Manual Processing and Multiple Service Membership Center is responsible for a variety of benefi t requests such as frozen annuity calculations, intent to change recalculations, cost of living increases and the calculation of retirement benefi ts for Multiple Service (MS) members who are retiring from SERS or PSERS. The MS Membership Section processes requests for MS membership eligibility and the calculation of purchase of service requests.
Disability and Death Benefi t Center: The Disability and Death Benefi t Center handles all requests for disability benefi ts. Medical examiners work with staff to obtain suffi cient and current medical information. Staff are responsible for the review of annual earnings affi davit and for the calculation of both initial and fi nal disability retirement benefi ts. Staff are also responsible for the payment of death benefi ts when members die prior to retirement. These payments frequently exceed $1 million and involve extensive communication with benefi ciaries, survivors and estate representatives. Last, this area also processes survivor and death benefi ts when members die subsequent to retirement. Because approximately 5,000 retired members die each year, the center responds to high volumes of requests. The process includes the return of checks issued after death, collection of premium assistance, and the calculation and payment of death benefi ts.

Introductory Section
Page 25
System Support CenterThe System Support Center reports directly to the bureau director and is comprised of a te am of management analysts who serve as the bureau’s link to information technology (IT). The analysts work closely with IT consultants, the Bureau of Information Technology, the Bureau of Information Management, bureau managers and supervisors to ensure the effectiveness of business processes and the integration of those processes with application systems and other technology resources. They are responsible for project management, training, system design, workfl ow analysis and user acceptance testing. They participate in implementation of new business processes, new systems and system enhancements. They utilize end-user software to extract routine data and to provide statistical information.
Bureau of Communications and CounselingThis bureau is responsible for professionally communicating accurate and timely information. The goal is to promote the understanding of PSERS’ benefi ts and processes to the members, the employers, the Legislature, the Governor’s Offi ce, other government organizations, professional organizations, and the public. It is organized into two divisions: Field Services Division and Communications Services Division.
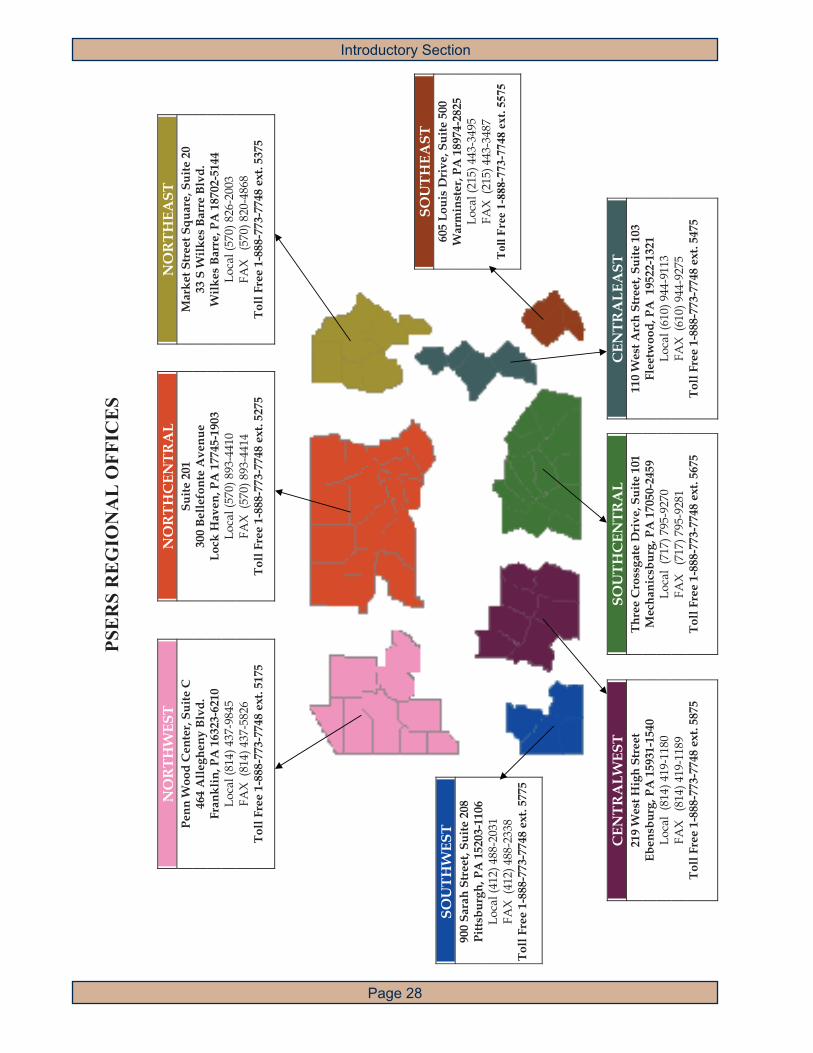
Field Services DivisionThe Field Services Division provides services to both active and retired PSERS’ members through eight regional offi ces located throughout the Commonwealth of Pennsylvania. The regional representatives conduct various meetings and workshops for members and provide counseling services.
Communications Services DivisionThis division provides information to the members, employers, and the general public through th e telephone, on-site visits, the worldwide web, and various publications. This division houses the Member Service Center, Employer Service Center and Publications Center.
Member Service Center: This center answers the PSERS’ telephone system, responding to general inquiries about the benefi ts and processes of PSERS as well as specifi c inquiries related to members’ accounts.
Employer Service Center: Staffi ng of the center includes customer service representatives to answer phone calls and emails, as well as fi eld representatives to visit employers and conduct workshops, to provide assistance and training for proper reporting to the System.
Publications Center: This center is responsible for the development, production and distribution of all printed and audiovisual materials for the System. Publications include newsletters, handbooks, pamphlets, mass communications to the membership, and presentation material. It also responds to general correspondence and email inquiries.
Assistant Executive DirectorThis position reports to the Executive Director and provides assistance to the Executive Director on agency-wide projects. The position administers the Health Options and Premium Assistance Programs in addition to the facilities, human resources, and procurement activities necessary to support, secure and optimize agency operations. Organizational units overseen by the Assistant Executive Director include the Bureau of Administration, the Human Resources Offi ce, and the Health Insurance Offi ce.

Introductory Section
Page 26
Bureau of AdministrationThis bureau is responsible for facilities, purchasing and contracting, documenting administrative policies and proced ures, business continuity, automotive, mail, imaging, printing and other administrative services necessary to support agency functions. The bureau is organized into three divisions: the Purchasing and Contracting Division, the Administrative Services Division and the Security and Business Continuity Division.
Purchasing and Contracting DivisionThis division procures materials, supplies, and services needed to support organizational goals and develops, monitors, processes and evaluates contract usage in the agency.
Administrative Services DivisionThis division manages building and grounds for the agency both at headquarters and at the regional locations. Th e division provides mail, imaging, and printing services to the agency, in addition to asset management, automotive and other administrative services.
Security and Business Conti nuity DivisionThis division develops and implements those policies, programs and procedures necessary to ensure that PSERS’ human, technology, and capital resources are secure and to ensure that PSERS is prepared to quickly recover and continue critical operations in the event of a disaster.
Human Resources Offi ceThis offi ce is responsible for supporting management and staff to facilitate the accomplishment of the agency’s mission. It administers all human resources programs and ensures compliance with labor law and Commonwealth regulations. Programs include position classifi cation, labor relations, recruitment and placement, employee benefi ts, employee compensation and pay, training and staff development, time and attendance, performance management, organizational development and support, employee transactions, Equal Employment Opportunities and other miscellaneous programs.
Health Insurance Offi ceThis offi ce is responsible for all aspects of the PSERS’ HOP and administering PSERS’ health insurance premium assistance benefi ts. The HOP is a voluntary program that provides group health insurance coverage for 65,000 school retirees, their spouses, and eligible dependents.

Introductory Section
Page 27
Administrative Staff
Gerald GornishChief Counsel
Brian S. CarlChief Financial Offi cer
Jeffrey B. ClayExecutive Director
Eugene W. RobisonDirector of Communica-
tions and Counseling
Deborah L. GarrawayDirector of Information
Management
Frank RyderDirector of Government
Relations
Donald J. Halke, IIInternal Auditor
Ginger L. BucherDirector of Benefi ts
Administration
Maribel La LuzDirector of Human
Resources
James F. NooneDirector of Administration
Mary E. GeeseyDirector of Information
Technology
Mark F. SchaferDirector of Health
Insurance
Terrill J. SavidgeDeputy Executive Director
Joseph E. WasiakAssistant Executive Director
Alan H. Van NoordChief Investment Offi cer
Richard R. SpinksChief Technology Offi cer
Evelyn M. TatkovskiPress Secretary
Introductory Section
Page 28
NO
RTH
WES
T Pe
nn W
ood
Cen
ter,
Suite
C
464
Alle
ghen
y Bl
vd.
Fran
klin
, PA
163
23-6
210
Loca
l (81
4) 4
37-9
845
FAX
(814
) 437
-582
6 To
ll Fr
ee 1
-888
-773
-774
8 ex
t. 51
75
NO
RTH
CEN
TRA
L Su
ite 2
01
300
Belle
font
e A
venu
e Lo
ck H
aven
, PA
177
45-1
903
Loca
l (57
0) 8
93-4
410
FAX
(570
) 893
-441
4 To
ll Fr
ee 1
-888
-773
-774
8 ex
t. 52
75
NO
RTH
EAST
M
arke
t Str
eet S
quar
e, S
uite
20
33 S
Wilk
es B
arre
Blv
d.
Wilk
es B
arre
, PA
187
02-5
144
Loca
l (57
0) 8
26-2
003
FAX
(57
0) 8
20-4
868
Toll
Free
1-8
88-7
73-7
748
ext.
5375
SOU
THEA
ST
605
Loui
s D
rive
, Sui
te 5
00
War
min
ster
, PA
189
74-2
825
Loca
l (21
5) 4
43-3
495
FAX
(215
) 443
-348
7 T
oll F
ree
1-88
8-77
3-77
48 e
xt. 5
575
SOU
THW
EST
900
Sara
h St
reet
, Sui
te 2
08
Pitts
burg
h, P
A 1
5203
-110
6 Lo
cal (
412)
488
-203
1 FA
X (4
12) 4
88-2
338
Toll
Free
1-8
88-7
73-7
748
ext.
5775
CEN
TRA
LEA
ST
110
Wes
t Arc
h St
reet
, Sui
te 1
03
Flee
twoo
d, P
A 1
9522
-132
1 Lo
cal (
610)
944
-911
3 FA
X (6
10) 9
44-9
275
Toll
Free
1-8
88-7
73-7
748
ext.
5475
SOU
THC
ENTR
AL
Thre
e C
ross
gate
Dri
ve, S
uite
101
M
echa
nics
burg
, PA
170
50-2
459
Loca
l (7
17) 7
95-9
270
FAX
(71
7) 7
95-9
281
Toll
Free
1-8
88-7
73-7
748
ext.
5675
PSE
RS
RE
GIO
NA
L O
FFIC
ES
CEN
TRA
LWES
T 21
9 W
est H
igh
Stre
et
Eben
sbur
g, P
A 1
5931
-154
0 Lo
cal
(814
) 419
-118
0 FA
X (
814)
419
-118
9 To
ll Fr
ee 1
-888
-773
-774
8 ex
t. 58
75

Introductory Section
Page 29
The headquarters of the Public School Employees’ Retirement System is located at 5 North Fifth Street in downtown Harrisburg, Pennsylvania within the State Capital complex. Regional fi eld offi ces are also maintained in Ebensburg, Fleetwood, Franklin, Lock Haven, Mechanicsburg, Pittsburgh, Warminister and Wilkes Barre.
The building was built and fi rst occupied by the Retirement System in 1987 and is its fi rst home built specifi cally for its use. It is owned by the Five North Fifth Street Corporation, a holding entity formed by PSERS, and is managed by Property Management Inc.
PSERS Headquarters Building

Introductory Section
Page 30

IntroductionFinancial
- Auditor’s Report
- Management’s
Discussion &
Analysis
- Financial Statements
& Footnotes
- Req. Supplemental
Schedules

Page 32
Financial Section
Independent Auditor’s Report
The Board of TrusteesPublic School Employees’ Retirement SystemHarrisburg, Pennsylvania
We have audited the accompanying fi nancial statements of the Public School Employees’ Retirement System (PSERS), a component unit of the Commonwealth of Pennsylvania, as of and for the years ended June 30, 2009 and 2008, as listed in the table of contents. These fi nancial statements are the responsibility of PSERS’ management. Our responsibility is to express an opinion on these fi nancial statements based on our audits.
We conducted our audits in accordance with auditing standards generally accepted in the United States of America. Those standards require that we plan and perform the audit to obtain reasonable assurance about whether the fi nancial statements are free of material misstatement. An audit includes examining, on a test basis, evidence supporting the amounts and disclosures in the fi nancial statements. An audit also includes assessing the accounting principles used and signifi cant estimates made by management, as well as evaluating the overall fi nancial statement presentation. We believe that our audits provide a reasonable basis for our opinion.
In our opinion, the fi nancial statements referred to above present fairly, in all material respects, PSERS’ plan net assets as of June 30, 2009 and 2008, and the changes in its plan net assets for the years then ended in conformity with accounting principles generally accepted in the United States of America.
The Management’s Discussion and Analysis and Required Supplemental Schedules of Funding Progress and Employer Contributions (Schedules 1 and 2) are not a required part of the fi nancial statements, but is supplemental information required by accounting principles generally accepted in the United States of America. We have applied certain limited procedures, which consisted principally of inquiries of management regarding the methods of measurement and presentation of the required supplemental information. However, we did not audit the information and express no opinion on it.
Our audits were made for the purpose of forming an opinion on the fi nancial statements taken as a whole. The Supplemental Schedules 1 through 3 are presented for purposes of additional analysis and are not a required part of the basic fi nancial statements. Supplemental Schedules 1 through 3 have been subjected to the auditing procedures applied in the audit of the basic fi nancial statements, and, in our opinion, are presented fairly, in all material respects, in relation to the basic fi nancial statements taken as a whole.
The Chairman’s Report, Introductory Section, Investment Section, Actuarial Section and Statistical Section as listed in the table of contents are presented for purposes of additional analysis and are not a required part of the basic fi nancial statements. The Chairman’s Report and the Introductory, Investment, Actuarial and Statistical Sections have not been subjected to the auditing procedures applied in the audit of the basic fi nancial statements and, accordingly, we express no opinion on them.
Baltimore, MarylandSeptember 25, 2009Offi ces in 17 states and Washington, DC

Page 33
Financial Section
Management’s Discussion and Analysis (MD&A) of the Commonwealth of Pennsylvania Public School Employees’ Retirement System (PSERS) for the fi scal year ended June 30, 2009, provides a narrative summary of PSERS’ fi nancial position and performance, including highlights and comparative data. The MD&A is presented as required supplemental information to the fi nancial statements and should be read in conjunction with the fi nancial statements, the notes to fi nancial statements and the supplementary schedules.
Overview of Financial Statements
PSERS is primarily responsible for administering a defi ned benefi t pension plan for public school employees in the Commonwealth of Pennsylvania. PSERS also administers two postemployment healthcare programs, the Health Insurance Premium Assistance Program (Premium Assistance) and the Health Options Program (HOP), for its annuitants. The fi nancial statements present the fi nancial activities for the pension plan and the two postemployment healthcare programs.
The Statements of Plan Net Assets provide a snapshot of the fi nancial position of PSERS at June 30, 2009, including comparative amounts for the prior year.
The Statements of Changes in Plan Net Assets summarize PSERS’ fi nancial activities that oc-curred during the fi scal period from July 1, 2008 to June 30, 2009, including comparative amounts for the prior year.
The Notes to Financial Statements provide additional information that is essential to a full un-derstanding of the fi nancial statements. The notes are an integral part of the fi nancial statements and include detailed information not readily evident in the basic fi nancial statements such as accounting policies, along with plan membership and benefi ts, and summary disclosures of selected fi nancial data.
The Required Supplemental Schedules immediately following the notes to fi nancial statements provide two schedules showing historical information concerning the funded status of PSERS and the employer contributions. These schedules emphasize the long-term nature of the pension and premium assistance plans and show the progress of PSERS in accumulating assets suffi cient to pay benefi ts when due.
The remaining supplemental schedules provide additional detailed information concerning the operating expenses, investment expenses and payments to non-investment consultants. All of this supplemental information is considered useful in understanding and evaluating the fi nancial activities of PSERS.
Financial Highlights
• The rate of return on investments was -26.54% for the fi scal year ended June 30, 2009 (FY 2009), -2.82% for the fi scal year ended June 30, 2008 (FY 2008) and 22.93% for the fi scal year ended June 30, 2007 (FY 2007).
Management’s Discussion and Analysis
Page 34
Financial Section
Management’s Discussion and Analysis (Continued)
• PSERS’ total plan net assets decreased by $19.5 billion from $62.7 billion at June 30, 2008 to $43.2 billion at June 30, 2009. PSERS total plan net assets decreased by $4.8 billion from $67.5 billion at June 30, 2007 to $62.7 billion at June 30, 2008. The decrease for both periods is primarily attributable to net investment loss and payment of pension benefi ts and administrative expenses combined that exceeded member and employer contributions.
• PSERS’ funded ratio as of the latest actuarial valuation dated June 30, 2008 increased from 85.8% at June 30, 2007 to 86.0% at June 30, 2008. The increase is primarily due to experience gains on investment assets that were partially offset by liability losses, assumption changes, and by contributions that were less than the normal cost plus interest on the unfunded liability. The funded ratio at June 30, 2006 was 81.2%.
• Total member contributions increased from $1.04 billion in FY 2008 to $1.09 billion in FY 2009. Total member contributions also increased from FY 2007 to FY 2008. The increases for both periods were due to a slight increase in the average member contribution rate and an increase in the active member payroll.
• Total employer contributions decreased from $834.9 million in FY 2008 to $608.4 million in FY 2009. The net decrease is primarily attributable to a decrease in the total employer contribution rate from 7.13% in FY 2008 to 4.76% in FY 2009. Total employer contributions increased from FY 2007 to FY 2008 and were primarily attributable to an increase in the total employer contribution rate from 6.46% in FY 2007 to 7.13% in FY 2008.
• Total PSERS’ benefi t expense remained consistent at $4.9 billion in FY 2009 and FY 2008 as higher monthly benefi ts from an increase in the overall number of retirees and benefi ciaries receiving benefi ts were offset by lower lump sum payments due to a decrease in the number of new retirees in FY 2009. The lower number of new retirees in FY 2009 is consistent with national trends as people delayed retirement due to the signifi cant decline in world fi nancial markets and the global economic recession. Benefi t expense increased by $600 million from $4.3 billion in FY 2007 to $4.9 billion in FY 2008. The increase was primarily attributable to an increase in the number of retirees and benefi ciaries receiving benefi ts and an increase in the average benefi t paid per annuitant.
• Total administrative expenses increased by $2.0 million from $49.3 million in FY 2008 to $51.3 million in FY 2009. The increase is attributable to greater costs and increasing membership within the member funded Health Options Program. Administrative expenses decreased by $1.2 million from $50.5 million in FY 2007 to $49.3 million in FY 2008 primarily due to lower administrative expenses for Premium Assistance and HOP. Administrative expenses were within PSERS’ budgeted amounts for each of the fi scal years.

Page 35
Financial Section
Management’s Discussion and Analysis (Continued)
Funded Status
PSERS uses an actuarial reserve type of funding that is fi nanced by member contributions, employer contributions and earnings from invested assets. An independent actuarial valuation of PSERS’ actuarial assets and liabilities is performed annually. As part of this valuation, the progress toward funding pension obligations of PSERS is measured by comparing the actuarial value of assets to the actuarial accrued liability. This measurement is referred to as the funded ratio or funded status. The most recent actuarial valuation reports that PSERS is 86.0% funded as of June 30, 2008. The results of operations for FY 2009 will be refl ected in the actuarial valuation for the year ended June 30, 2009. Due to the normal lag time for completion of the actuarial valuation, the resulting funded status will be available at the end of the 2009 calendar year and will be reported in the fi nancial statements for the fi scal year ended June 30, 2010 (FY 2010). Based on the investment losses in FY 2009, the funded ratio at June 30, 2009 is expected to decline. In addition, as a result of the impact of FY 2009 investment losses, PSERS’ State Accumulation Account had a negative balance at June 30, 2009 (See Note 3). Employer contributions and investment earnings will be used to reduce the defi cit in this Account in the future. A twenty-year history of PSERS’ funded status follows:
85.8%
86.0%81.2%
83.7%91.2%
97.2%104.8%
114.4%123.8%119.0%
110.6%104.3%
95.4%
89.7%
86.6%
87.3%
81.7%
79.6%
76.5%
0%25%50%75%
100%125%150%
1990 1992 1994 1996 1998 2000 2002 2004 2006 2008
Fiscal Year Ended June 30
PSERS’ Funding Ratio Funded Ratio = Actuarial Value of Assets / Actuarial Accrued Liability

Page 36
Financial Section
Investments
PSERS is a long-term investor and manages the pension fund with long-term objectives in mind. A primary element of PSERS’ investment philosophy is that diversifi cation among various asset classes is the best way to achieve its goals. PSERS makes estimates of future long-term market returns and establishes an asset allocation plan taking into account the risk associated with each asset class as well as the fi nancial objectives of the Fund.
Management’s Discussion and Analysis (Continued)
Analysis of Plan Net Assets (Dollar Amounts in Thousands)
Summary of Plan Net Assets: FY 2009 Increase
(Decrease) FY 2008 Increase
(Decrease) FY 2007
Assets:
Receivables $ 1,355,001 $ (902,691) $ 2,257,692 $ 490,786 $ 1,766,906Investments 43,343,935 (20,548,285) 63,892,220 (4,634,313) 68,526,533Securities lending collateral pool 1,591,720 (3,255,279) 4,846,999 (3,959,980) 8,806,979Capital assets 530 (135) 665 (205) 870
Total Assets 46,291,186 (24,706,390) 70,997,576 (8,103,712) 79,101,288
Liabilities:
Payables and other liabilities 1,492,426 (1,999,527) 3,491,953 720,348 2,771,605Obligations under securities lending 1,591,720 (3,255,279) 4,846,999 (3,959,980) 8,806,979
Total Liabilities 3,084,146 (5,254,806) 8,338,952 (3,239,632) 11,578,584
Plan Net Assets $ 43,207,040 $(19,451,584) $ 62,658,624 $ (4,864,080) $ 67,522,704
Summary of Changes inPlan Net Assets:
Additions:
Contributions $ 1,729,857 $ (172,579) $ 1,902,436 $ 128,832 $ 1,773,604Net investment income (loss) (16,198,312) (14,422,727) (1,775,585) (14,478,306) 12,702,721
Total Additions (14,468,455) (14,595,306) 126,851 (14,349,474) 14,476,325
Deductions:
Benefit expense 4,931,854 (9,827) 4,941,681 621,241 4,320,440Administrative expenses 51,275 2,025 49,250 (1,232) 50,482
Total Deductions 4,983,129 (7,802) 4,990,931 620,009 4,370,922
Changes in Plan Net Assets $ (19,451,584) $(14,587,504) $ (4,864,080) $(14,969,483) $ 10,105,403

Page 37
Financial Section
Management’s Discussion and Analysis (Continued) PSERS had a very challenging fi scal year ended June 30, 2009, as the System generated negative absolute returns. The worst economic contraction since the Great Depression led to a large decrease in U.S. Gross Domestic Product, an increase in the U.S. unemployment rate and the failure of several large fi nancial institutions including the federal government takeover of Fannie Mae and Freddie Mac, the Lehman Brothers and Washington Mutual bankruptcies, and the federal government bailout of AIG and Citigroup. These extremely diffi cult economic conditions led to negative returns for equity, real estate and commodities around the world. For FY 2009, PSERS’ rate of return on investments was -26.54%. The FY 2009 investment return trailed PSERS’ total fund policy index of -20.67%. The annualized rate of return over the past three and fi ve-year periods ended June 30, 2009 was -4.26% and 2.68%, respectively. The return for the three-year period trailed the total fund policy index returns by 151 basis points while the return for the fi ve-year period exceeded the total fund policy index re-turns by 17 basis points. The annualized rate of return for the ten and twenty-fi ve-year periods ended June 30, 2009 was 3.28% and 9.23%, respectively. PSERS’ long-term actuarial investment rate of return assumption was 8.00% at June 30, 2009.
PSERS’ Board of Trustees (Board) decreased the actuarial investment rate of return assumption from 8.50% to 8.25% effective for the June 30, 2008 actuarial valuation. The Board also decreased the rate of return assumption further from 8.25% to 8.00% for the June 30, 2009 actuarial valuation. The changes made by the Board lowered PSERS’ rate of return assumption to the median investment rate of return assumption used by most public pension funds and provided a more realistic outlook on the future earnings potential of the Fund. The 0.5% decrease in the rate of return assumption allowed PSERS to modify its asset allocation plan during FY 2009 to achieve its new return target with lower overall risk. Some of the asset allocation changes are already refl ected in the table and chart which follow as the Fund has reduced its overall exposure to equities and increased its combined allocation to short-term and fi xed income investments at June 30, 2009.

Page 38
Financial Section
Management’s Discussion and Analysis (Continued)
Common and preferred stock32.0%
Asset Distribution At June 30, 2009
Alternative investments20.8%
Short-term12.5%
8.5% Real estate
Fixed income26.2%
Short-term investments (cash and cash equivalents) increased by $1.2 billion from $4.2 billion in FY 2008 to $5.4 billion in FY 2009. Due to the uncertainties in the equity and fi xed income markets, PSERS built up its short-term investment fund during FY 2009. During FY 2009, PSERS brought the management of its short-term investment fund in-house. This fund had been previously man-aged by the Pennsylvania Treasury Department. Fixed income investments fell by $6.7 billion from $18.0 billion in FY 2008 to $11.3 billion in FY 2009 because of allocation reductions as well as mar-ket value depreciation. Similarly, common and preferred stock investments dropped by $14.0 billion from $27.9 billion in FY 2008 to $13.9 billion in FY 2009. The decrease was primarily the result of signifi cant deterioration in the domestic and international equity markets in addition to funds being transferred out of the asset class. Real estate investments declined by $1.3 billion from $5.0 billion in FY 2008 to $3.7 billion in FY 2009 due to substantial market value depreciation which was offset in part by net allocation increases to new and existing real estate partnerships. Alternative investments rose by $100 million from $8.9 billion in FY 2008 to $9.0 billion in FY 2009 as a result of contributions to new and existing partnerships which were almost entirely negated by the downturn in value of partnership portfolio holdings.
(Dollar Amounts in Thousands) Asset Class 2009 % 2008 % 2007 %
Short-term $ 5,398,729 12.5 $ 4,215,171 6.6 $ 4,164,010 6.1 Fixed income 11,333,549 26.2 17,984,233 28.2 15,919,998 23.2 Common and preferred stock 13,883,372 32.0 27,875,324 43.6 38,715,473 56.5 Real estate 3,699,353 8.5 4,951,840 7.8 3,887,986 5.7 Alternative investments 9,028,932 20.8 8,865,652 13.8 5,839,066 8.5
Total $ 43,343,935 100.0 $ 63,892,220 100.0 $ 68,526,533 100.0
The asset distribution of PSERS’ investment portfolio at June 30, 2009, June 30, 2008 and June 30, 2007, at fair value, including postemployment healthcare assets, was:

Page 39
Financial Section
Management’s Discussion and Analysis (Continued)
Short-term investments remained stable at $4.2 billion from FY 2007 to FY 2008. Fixed income investments increased by $2.1 billion from $15.9 billion in FY 2007 to $18.0 billion in FY 2008 mostly due to a few key investment managers shifting a large portion of their direct common and preferred stock holdings to fi xed income while gaining equity exposure through the use of futures and total return swaps. Common and preferred stock investments decreased by $10.8 billion from $38.7 bil-lion in FY 2007 to $27.9 billion in FY 2008. This decline was primarily the result of negative returns in the domestic and international equity markets, allocation reductions to the asset class and certain investment managers shifting a substantial portion of their common and preferred stock investments to fi xed income as described above. Real estate investments increased by $1.1 billion from $3.9 billion in FY 2007 to $5.0 billion in FY 2008 due to net allocation increases to new and existing real estate partnerships which were offset in part by market value depreciation. Alternative investments increased by $3.1 billion from $5.8 billion in FY 2007 to $8.9 billion in FY 2008 due almost entirely to the addition of new investment partnerships and drawdowns of commitments to existing partnerships which were partially offset by distributions.
Securities Lending
Securities lending collateral pool and obligations under securities lending decreased from $4.8 billion in FY 2008 to $1.6 billion in FY 2009 due to a signifi cant decline in both the number of securities on loan and the market value of those securities for which cash collateral was provided. Non-cash collateral is not refl ected in the Statement of Plan Net Assets.
The System experienced a net loss of $26.8 million from securities lending activities in FY 2009 as a result of the decline in valuation of certain securities purchased with cash collateral by the lending agent. Because of the heightened risk associated with the sudden downturn in the market in FY 2009, restrictions were placed on the lending of particular securities in PSERS’ portfolio and the risk profi le of the investments permitted in the collateral pool was reduced.
Contributions
Employer pension contributions decreased by $237.6 million from $753.5 million in FY 2008 to $515.9 million in FY 2009 due to a decrease in the employer pension contribution rate from 6.44% in FY 2008 to 4.00% in FY 2009. Employer pension contributions increased by $94.0 million from $659.5 million in FY 2007 to $753.5 million in FY 2008 due to the increase in the employer pension contribution rate from 5.72% in FY 2007 to 6.44% in FY 2008.
Member pension contributions increased by $31.5 million from $879.6 million in FY 2008 to $911.1 million in FY 2009 as a result of the increase in total active member payroll and an increase in the average member contribution rate from 7.25% in FY 2008 to 7.29% in FY 2009. Member pension contributions increased by $24.3 million from $855.3 million in FY 2007 to $879.6 million in FY 2008 as a result of the increase in the total active member payroll and an increase in the average member contribution rate from 7.21% in FY 2007 to 7.25% in FY 2008.

Page 40
Financial Section
Management’s Discussion and Analysis (Continued)
The employer contributions for health insurance premium assistance increased by $11.2 million from $81.3 million in FY 2008 to $92.5 million in FY 2009 due to an increase in the employer health insurance premium assistance contribution rate from 0.69% in FY 2008 to 0.76% in FY 2009. The employer contributions for health insurance premium assistance decreased by $5.5 million from $86.8 million in FY 2007 to $81.3 million in FY 2008 due to the decrease in the employer health insurance premium assistance contribution rate from 0.74% in FY 2007 to 0.69% in FY 2008. Contributions from the Centers (Ctrs) for Medicare and Medicaid Services (Svcs) to PSERS HOP increased from $28.4 million in FY 2008 to $31.6 million in FY 2009.
A thirty-year history of PSERS’ Contribution Rates follows:
History of PSERS' Contribution Rates as a Percent of Payroll
0
3
6
9
12
15
18
21
1980 1984 1988 1992 1996 2000 2004 2008Year
Per
cent
Average Member Rate Employer Contribution Rate Employer Normal Cost Rate

Page 41
Financial Section
Management’s Discussion and Analysis (Continued)
Projected Fiscal Year 2012-2013 (FY 2013) Employer Contribution Rate Increase
One of the most widely publicized issues at PSERS over the past several years has been the employer contribution rate increase that is projected to occur in FY 2013 fi scal year. The rate increase was fi rst refl ected in the June 30, 2003 actuarial valuation. This valuation took into consideration the actuarial impact of the pension benefi t enhancement enacted in 2001 (Act 9 of 2001), a major downturn in the investment markets between 2001 and 2003 and a series of legislative actions (Act 38 of 2002 and Act 40 of 2003) that changed the basic funding methodologies for PSERS and suppressed the employer contribution rate below the employer normal cost rate and average member contribution rate for a period of ten years as displayed in the previous chart on the History of PSERS’ Contribution Rates. The employer normal cost is the expected contribution from employers to fund on-going liabilities if all other actuarial assumptions are met and the unfunded liability is zero.
Previously, PSERS’ investment returns for the four years ended June 30, 2007 had reduced the projected FY 2013 employer contribution rate by more than 50%, from a high of 27.73% to the projected rate of 11.23% as of June 30, 2007 valuation. Over the past year, however, the sharp downturn in the economy that contributed to the -26.54% return for FY 2009 combined with PSERS’ -2.82% investment return for FY 2008 has essentially eliminated any past progress made in reducing the FY 2013 projected rate increase. The June 30, 2009 actuarial valuation will not be completed until December 2009, but based upon PSERS’ performance through June 30, 2009, the projected rate increase in FY 2013 is now expected to exceed the original projection of 27.73%. The majority of the projected FY 2013 rate increase is devoted to the payment of unfunded liabilities that have accumulated since 2001.
Investment Income
Net investment income (loss) changed by $14.4 billion from $(1.8) billion in FY 2008 to $(16.2) billion in FY 2009, which correlates to the decrease in the investment rate of return from -2.82% for FY 2008 to -26.54% for FY 2009. Net investment income (loss) decreased by $14.5 billion from $12.7 billion in FY 2007 to $(1.8) billion in FY 2008, which is consistent with the decrease in the investment rate of return from 22.93% for FY 2007 to -2.82% for FY 2008. Despite the recent negative performance, as depicted in the following chart, investment earnings provided 68% of PSERS’ funding over the past twenty years. Employer contributions and member contributions provided 17% and 15%, respectively, of PSERS’ funding over the past twenty years. Net investment income (loss) also includes investment expenses as a deduction. The “Total PSERS Benefi ts and Expenses” section that follows includes an analysis of investment expenses.

Page 42
Financial Section
Management’s Discussion and Analysis (Continued)
PSERS’ Sources of Funding Twenty Year History (1990 to 2009)
MemberContributions
15%
InvestmentEarnings
68%
EmployerContributions
17%
Total PSERS’ Benefi ts and Expenses
The primary source of expense during FY 2009 was for the payment of benefi ts totaling $4.9 billion. As the following chart on PSERS’ Benefi ts and Expenses refl ects, benefi t expenses comprised over 90% of the total expenses of the Fund in FY 2009. Total PSERS’ benefi t expense remained consistent at $4.9 billion in FY 2009 and FY 2008 as higher monthly benefi ts from an increase in the overall number of retirees and benefi ciaries receiving benefi ts were offset by lower lump sum payments due to a decrease in the number of new retirees in FY 2009. The lower number of new retirees in FY 2009 is consistent with national trends as people delayed retirement due to the signifi cant decline in world fi nancial markets and the global economic recession. Benefi t expense increased by $600 million from $4.3 billion in FY 2007 to $4.9 billion in FY 2008. The increase is primarily attributable to an increase in the number of retirees and benefi ciaries currently receiving benefi ts and an increase in the average benefi t paid per annuitant.
Investment expenses increased by $78.5 million from $399.1 million in FY 2008 to $477.6 million in FY 2009 mainly due to a rise in management fees in the private market asset classes. The higher fees were essentially the result of new investments made in alternative investment and real estate partnerships during FY 2009 and 2008. Investment expenses increased by $85.3 million from $313.8 million in FY 2007 to $399.1 million in FY 2008 due primarily to an increase in management fees in private markets. The higher fees were almost entirely a result of new investments made in alternative investment and real estate partnerships during FY 2008. Investment expenses are reported as a reduction in net investment income (loss) on the Statements of Changes in Plan Net Assets.
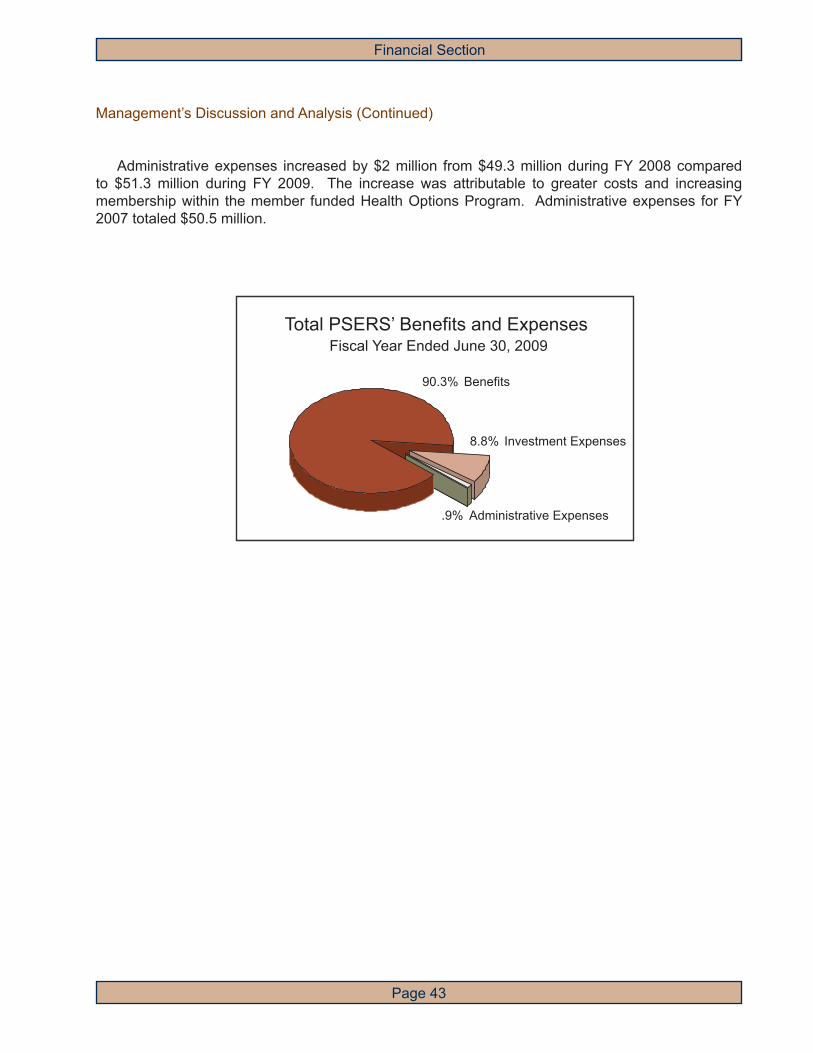
Page 43
Financial Section
Management’s Discussion and Analysis (Continued)
Administrative expenses increased by $2 million from $49.3 million during FY 2008 compared to $51.3 million during FY 2009. The increase was attributable to greater costs and increasing membership within the member funded Health Options Program. Administrative expenses for FY 2007 totaled $50.5 million.
Total PSERS’ Benefits and Expenses Fiscal Year Ended June 30, 2009
Benefits90.3%
Investment Expenses8.8%
Administrative Expenses.9%

Page 44
Financial Section
Statements of Plan Net AssetsJune 30, 2009 and 2008
(Dollar Amounts in Thousands)
The accompanying notes are an integral part of the fi nancial statements.
2009Postemployment Healthcare
Pension Premium
Assistance Health Options
Program TotalsAssets:
Receivables: Members $ 244,327 $ 6,353 $ 30 $ 250,710 Employers 172,099 31,289 - 203,388 Investment income 362,058 201 57 362,316 Investment proceeds 522,405 - - 522,405 Ctrs for Medicare & Medicaid Svcs - - 3,339 3,339 Miscellaneous 6,211 484 6,148 12,843
Total Receivables 1,307,100 38,327 9,574 1,355,001 Investments, at fair value: Short-term 5,204,418 67,268 127,043 5,398,729 Fixed income 11,333,549 - - 11,333,549 Common and preferred stock 13,883,372 - - 13,883,372 Real estate 3,699,353 - - 3,699,353 Alternative investments 9,028,932 - - 9,028,932
Total Investments 43,149,624 67,268 127,043 43,343,935 Securities lending collateral pool 1,591,720 - - 1,591,720 Capital assets (net of accumulated depreciation of $10,933) 530 - - 530
Total Assets 46,048,974 105,595 136,617 46,291,186 Liabilities: Accounts payable and accrued expenses 81,483 338 1,575 83,396 Benefits payable 345,669 143 13,182 358,994 Premium advances - - 15,414 15,414 Investment purchases and other liabilities 1,034,622 - - 1,034,622 Obligations under securities lending 1,591,720 - - 1,591,720
Total Liabilities 3,053,494 481 30,171 3,084,146
Net assets held in trust for pension and postemployment healthcare benefits (Schedules of funding progress arepresented on Required SupplementalSchedule 1) $ 42,995,480 $ 105,114 $ 106,446 $ 43,207,040

Page 45
Financial Section
The accompanying notes are an integral part of the fi nancial statements.
Statements of Plan Net AssetsJune 30, 2009 and 2008
(Dollar Amounts in Thousands)
2008Postemployment Healthcare
Pension Premium
Assistance Health Options
Program TotalsAssets:
Receivables: Members $ 253,356 $ 1,076 $ 55 $ 254,487 Employers 269,581 26,878 - 296,459 Investment income 238,484 199 176 238,859 Investment proceeds 1,464,272 - - 1,464,272 Ctrs for Medicare & Medicaid Svcs - - 45 45 Miscellaneous 2,518 1,052 5,694 9,264
Total Receivables 2,228,211 29,205 5,970 2,263,386 Investments, at fair value: Short-term 4,033,430 67,400 114,341 4,215,171 Fixed income 17,984,233 - - 17,984,233 Common and preferred stock 27,875,324 - - 27,875,324 Real estate 4,951,840 - - 4,951,840 Alternative investments 8,865,652 - - 8,865,652
Total Investments 63,710,479 67,400 114,341 63,892,220 Securities lending collateral pool 4,846,999 - - 4,846,999 Capital assets (net of accumulated depreciation of $10,789) 665 - - 665
Total Assets 70,786,354 96,605 120,311 71,003,270 Liabilities: Accounts payable and accrued expenses 84,108 332 2,929 87,369 Benefits payable 490,692 488 13,884 505,064 Premium advances - - 14,085 14,085 Investment purchases and other liabilities 2,891,129 - - 2,891,129 Obligations under securities lending 4,846,999 - - 4,846,999
Total Liabilities 8,312,928 820 30,898 8,344,646
Net assets held in trust for pension and postemployment healthcare benefits (Schedules of funding progress are presented on Required Supplemental Schedule 1) $ 62,473,426 $ 95,785 $ 89,413 $62,658,624

Page 46
Financial Section
The accompanying notes are an integral part of the fi nancial statements.
Statements of Changes in Plan Net AssetsYears ended June 30, 2009 and 2008
(Dollar Amounts in Thousands)
2009Postemployment Healthcare
Pension Premium
Assistance Health Options
Program TotalsAdditions: Contributions: Members $ 911,118 $ - $ 178,801 $ 1,089,919 Employers 515,889 92,493 - 608,382
Ctrs for Medicare & Medicaid Svcs - - 31,556 31,556 Total contributions 1,427,007 92,493 210,357 1,729,857 Investment income: From investing activities: Net depreciation in fair value of investments (17,007,821) (363) - (17,008,184) Short-term 55,161 2,269 1,528 58,958 Fixed income 587,007 - - 587,007 Common and preferred stock 500,001 - - 500,001 Real estate 92,515 - - 92,515 Alternative investments 75,776 - - 75,776 Total investment activity income (loss) (15,697,361) 1,906 1,528 (15,693,927) Investment expenses (477,520) (45) - (477,565) Net income (loss) from investing activities (16,174,881) 1,861 1,528 (16,171,492) From securities lending activities: Securities lending income 55,574 - - 55,574 Securities lending expense (82,394) - - (82,394) Net loss from securities lending activities (26,820) - - (26,820) Total net investment income (loss) (16,201,701) 1,861 1,528 (16,198,312)Total Additions (14,774,694) 94,354 211,885 (14,468,455)Deductions: Benefits 4,639,297 83,206 181,035 4,903,538 Refunds of contributions 20,369 - - 20,369 Net transfer to State Employees’ Retirement System 7,947 - - 7,947 Administrative expenses 35,639 1,819 13,817 51,275 Total Deductions 4,703,252 85,025 194,852 4,983,129 Net increase (decrease) (19,477,946) 9,329 17,033 (19,451,584)Net assets held in trust for pension and
postemployment healthcare benefits: Balance, beginning of year 62,473,426 95,785 89,413 62,658,624 Balance, end of year $ 42,995,480 $ 105,114 $ 106,446 $ 43,207,040
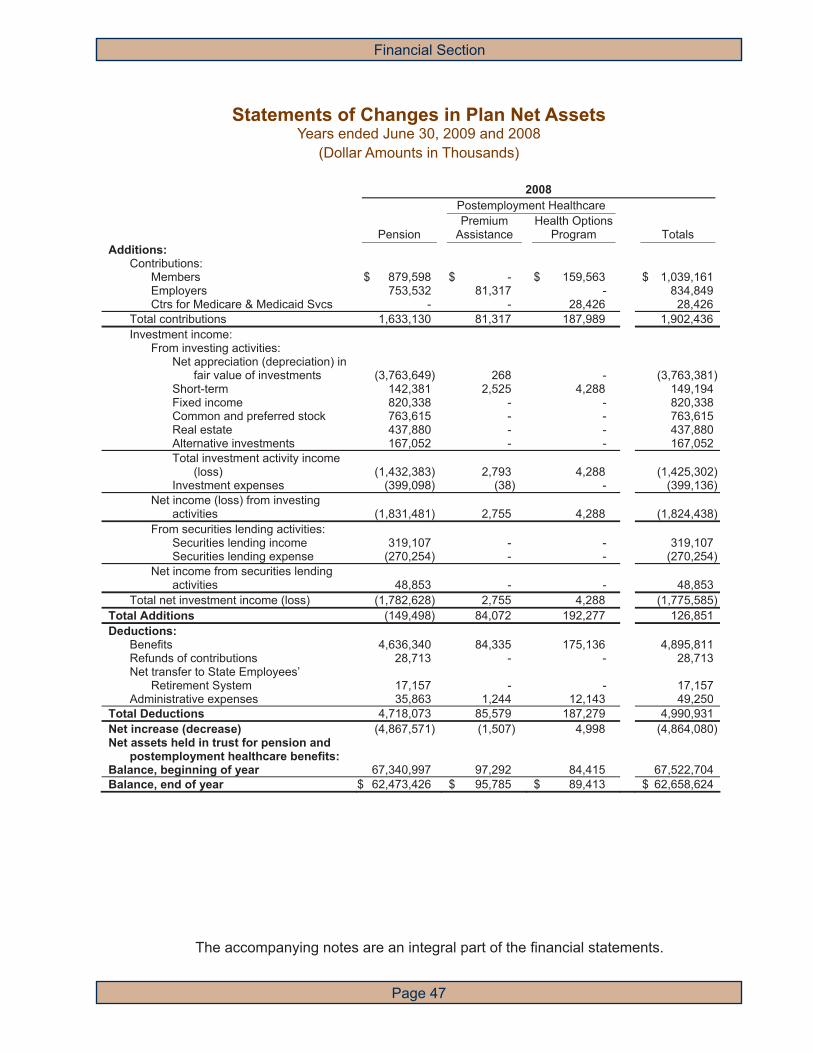
Page 47
Financial Section
The accompanying notes are an integral part of the fi nancial statements.
Statements of Changes in Plan Net AssetsYears ended June 30, 2009 and 2008
(Dollar Amounts in Thousands)
2008Postemployment Healthcare
Pension Premium
Assistance Health Options
Program TotalsAdditions: Contributions: Members $ 879,598 $ - $ 159,563 $ 1,039,161 Employers 753,532 81,317 - 834,849
Ctrs for Medicare & Medicaid Svcs - - 28,426 28,426 Total contributions 1,633,130 81,317 187,989 1,902,436 Investment income: From investing activities: Net appreciation (depreciation) in fair value of investments (3,763,649) 268 - (3,763,381) Short-term 142,381 2,525 4,288 149,194 Fixed income 820,338 - - 820,338 Common and preferred stock 763,615 - - 763,615 Real estate 437,880 - - 437,880 Alternative investments 167,052 - - 167,052 Total investment activity income (loss) (1,432,383) 2,793 4,288 (1,425,302) Investment expenses (399,098) (38) - (399,136) Net income (loss) from investing activities (1,831,481) 2,755 4,288 (1,824,438) From securities lending activities: Securities lending income 319,107 - - 319,107 Securities lending expense (270,254) - - (270,254) Net income from securities lending activities 48,853 - - 48,853 Total net investment income (loss) (1,782,628) 2,755 4,288 (1,775,585)Total Additions (149,498) 84,072 192,277 126,851 Deductions: Benefits 4,636,340 84,335 175,136 4,895,811 Refunds of contributions 28,713 - - 28,713 Net transfer to State Employees’ Retirement System 17,157 - - 17,157 Administrative expenses 35,863 1,244 12,143 49,250 Total Deductions 4,718,073 85,579 187,279 4,990,931 Net increase (decrease) (4,867,571) (1,507) 4,998 (4,864,080)Net assets held in trust for pension and
postemployment healthcare benefits: Balance, beginning of year 67,340,997 97,292 84,415 67,522,704 Balance, end of year $ 62,473,426 $ 95,785 $ 89,413 $ 62,658,624

Page 48
Financial Section
1. Organization and Description of the System
(A) Organization
The System was established on July 18, 1917, under the provisions of Pamphlet Law 1043, No. 343 as a governmental cost-sharing multiple-employer plan that provides retirement allowances and other benefi ts to its members. Membership in the System is mandatory for nearly all qualifying public school employees in the Commonwealth of Pennsylvania (Commonwealth). At June 30, 2009, there were 742 participating employers, generally school districts. Membership as of June 30, 2008, the most recent year for which actual amounts are available, consisted of:
All members are fully vested in their individual balance in the Members’ Savings Account which is described in Note 3.
The System is established by state law as an independent administrative board of the Commonwealth, which is directed by the Public School Employees’ Retirement Board (the Board) that exercises control and management of the System, including the investment of its assets. The System’s board has fi fteen members including the Commonwealth’s Secretary of Education, the State Treasurer, the Executive Director of the Pennsylvania School Boards Association, two members appointed by the Governor, six elected members (three from among the System’s certifi ed members, one from among the System’s noncertifi ed members, one from among the System’s annuitants, and one from among school board members in Pennsylvania), two members from the Senate, and two members from the House of Representatives.
The State Treasurer is the custodian of the System’s fund. The retirement plan of the System is a contributory defi ned benefi t plan for which the benefi t payments to members and contribution provisions by employers and employees are specifi ed in the Pennsylvania Public School Employees’ Retirement Code (the Code). Changes in benefi t and contribution provisions for the retirement plan must be made by legislation. Pursuant to state law, all legislative bills and amendments proposing to change the System’s retirement plan are to be accompanied with an actuarial note prepared by an enrolled pension actuary providing an estimate of the cost and actuarial effect of the proposed change.
Notes to Financial StatementsYears Ended June 30, 2009 and 2008
Currently employed members: Vested 181,000 Nonvested 92,000
Total currently employed members 273,000 Retirees and beneficiaries currently receiving benefits 173,000 Inactive members and vestees entitled to but not receiving benefits 101,000
Total retirees and other members 274,000Total number of members 547,000

Page 49
Financial Section
Notes to Financial Statements (Continued)
Based upon criterion of fi nancial accountability as defi ned by governmental accounting standards, the System is considered a component unit of the Commonwealth of Pennsylvania fi nancial reporting entity and is included in the Comprehensive Annual Financial Report of the Commonwealth of Pennsylvania.
(B) Pension Plan
i. Pension Benefi ts
Under the provisions of the 1975 revision of the Code by the Pennsylvania General Assembly, members are eligible for monthly retirement benefi ts upon reaching (a) age 62 with at least 1 year of credited service: (b) age 60 with 30 or more years of credited service; or (c) 35 or more years of service regardless of age.
Benefi ts are generally equal to 2% or 2.5%, depending upon membership class, of the member’s fi nal average salary (as defi ned in the Code) multiplied by the number of years of credited service. In most cases after completion of fi ve years of service, a member’s right to the defi ned benefi t is vested and early retirement benefi ts may be elected. Under certain features of the System, active members may purchase credit for various types of prior school and non-school service on a lump-sum, installment purchase basis, or through an actuarially calculated benefi t reduction.
In addition to regular retirement benefi ts, the System also provides for disability retirement benefi ts and death benefi ts. Participants are eligible for disability retirement benefi ts after completion of fi ve years of credited service. Such benefi ts are generally equal to 2% or 2.5%, depending upon membership class, of the member’s fi nal average salary (as defi ned in the Code) multiplied by the number of years of credited service, but not less than one-third of such salary nor greater than the benefi t the member would have had at normal retirement age. Members over normal retirement age may apply for disability benefi ts.
Death benefi ts are payable upon the death of an active member who has reached age 62 or who has at least fi ve years of credited service. Such benefi ts are actuarially equivalent to the benefi t that would have been effective if the member had retired on the day before death.
Members with credited service in the Commonwealth of Pennsylvania State Employees’ Retirement System (SERS) may elect to transfer service to the Public School Employees’ Retirement System upon commencement of employment in the public school system. Similarly, a member with credited service in the System may transfer such service to SERS upon becoming a member of that system.
Upon termination of a member’s employment in the public school sector, the member’s accumulated contributions plus interest are refundable from the Members’ Savings Account which is described in Note 3.

Page 50
Financial Section
Notes to Financial Statements (Continued)
ii. Contributions
The contribution policy is set by the Code and requires contributions by active members, employers, and the Commonwealth. The System’s funding policy provides for periodic employer and Commonwealth contributions at actuarially determined rates, expressed as a percentage of annual covered payroll, such that they, along with employee contributions and an actuarially determined rate of investment return, are adequate to accumulate assets to pay retirement benefi ts when due. Level percentage of payroll employer contribution rates is determined using the entry age normal actuarial funding method. This method determines the amount of contributions necessary to (1) fully fund all current costs, (also known as normal cost), which represents the estimated amount necessary to pay for the benefi ts earned by the employees during the current service year; and (2) liquidate the prior service cost for service earned prior to the current service year and subsequent benefi t increases, which represents the amount necessary to fund accrued liabilities over the appropriate amortization periods.
Contribution rates for active members are set by law (redefi ned with the provisions of Act 9 of 2001) and are dependent upon members’ class. In most cases, the contribution rates based on qualifi ed member compensation are as follows:
Membership Class T-C Active members hired before July 22, 1983 5.25%Membership Class T-C Active members hired on or after July 22, 1983 6.25%Membership Class T-D Active members hired before July 22, 1983 6.50%Membership Class T-D Active members hired on or after July 22, 1983 7.50%
Active members newly hired after July 1, 2001, the effective date of Act 9 of 2001, are automatically Class T-D. The contribution rates for all members in Membership Class T-D were effective January 1, 2002.
The total contribution rate for the employers and the Commonwealth was 4.76% and 7.13% of qualifi ed compensation for the years ended June 30, 2009 and 2008, respectively. According to requirements established in Act 29 of 1994, the Commonwealth reimburses school entity employers a portion of the employer contributions paid to the System. The Commonwealth remits employer contributions for employers other than school entities directly to the System. All contributions from employers and the Commonwealth are shown as employer contributions on the Statements of Changes in Plan Net Assets.
A portion of each employer and Commonwealth contribution to the System is set aside for the funding of the health insurance premium assistance program. The premium assistance contribution rate is set at a level necessary to establish reserves suffi cient to provide premium assistance payments for all participating eligible members for the subsequent fi scal year. The portion of the total contribution rate for employers and the Commonwealth used to fund premium assistance was 0.76% and 0.69% for the years ended June 30, 2009 and 2008, respectively.

Page 51
Financial Section
Notes to Financial Statements (Continued)
iii. Funding Status and Annual Required Contributions (ARC)
As of June 30, 2008, the most recent actuarial valuation, the plan was 86.0% funded. The actuarial accrued liability for benefi ts was $70.9 billion, and the actuarial value of assets was $61.0 billion, resulting in an unfunded accrued liability of $9.9 billion. The covered payroll of active members was $11.9 billion and the ratio of the unfunded actuarial accrued liability to the covered payroll was 83.2%.
For fi scal year ended June 30, 2009, the ARC was $1.76 billion. The actual employer contributions for fi scal year ended June 30, 2009, net of purchase of service contributions, were $503.2 million resulting in a 29% contributed rate.
The Schedule of Funding Progress and Schedule of Employer Contributions included as Required Supplemental Information following the notes to the fi nancial statements provide multiyear presentations of funding status and ARC to illustrate their trends over time.
iv. Actuarial Assumptions and Methods
(a) Funding Method
For purposes of determining pension contributions under the PSERS Code, the entry-age normal actuarial cost method of valuation is used in determining benefi t liabilities and normal cost. The outstanding balance of the unfunded accrued liability as of June 30, 2001 and the decrease in the unfunded accrued liability due to the actuarial asset method change provided by Act 38 continue to be amortized over a 10-year period, with level dollar funding, beginning July 1, 2002. The increases in the unfunded accrued liability due to the July 1, 2002 and July 1, 2003 cost-of-living adjustments provided by Act 38 were both recognized at June 30, 2002 and continue to be amortized over a 10-year period, with level dollar funding starting on July 1, 2003 and July 1, 2004, respectively. All other changes in the unfunded accrued liability at June 30, 2001 and June 30, 2002, including the Act 9 benefi t changes, are amortized over a 30-year period, with level dollar funding starting on July 1, 2002, and July 1, 2003, respectively. Post June 30, 2002 gains and losses, and changes in the unfunded accrued liability resulting from changes in actuarial assumptions and methods, are amortized over a 30-year period with level dollar funding. In addition Act 40 also provided a 4.00% fl oor on the employer pension rate.
For purposes of determining the annual required contributions under GASB 25, the same funding method is used as for pension funding, except that (i) the 4% pension fl oor is not taken into account and (ii) in fi scal years in which the amortization requirements of the PSERS Code result in an equivalent single amortization period that is longer than the maximum allowable 30 year period specifi ed by GASB 25. The GASB 25 amortization payment will be set equal to the level dollar amount that will amortize the unfunded accrued liability over a period equal to the maximum allowable period specifi ed by GASB 25. For the fi scal year ended June 30, 2008, a 30 year level dollar open amortization method was used.
Page 52
Financial Section
Notes to Financial Statements (Continued)
(b) Asset Valuation Method
For actuarial purposes, assets are valued using a fi ve-year moving market average value that will recognize the 8.25% actuarial expected investment return immediately and spread the difference between actual and expected investment return (beginning with fi scal year ending June 30, 2001) over a period of fi ve years (adopted as of June 30, 2001). Previously, PSERS immediately recognized interest and dividends when earned, and recognized realized and unrealized gains and losses on the market value of assets over a three-year period.
(c) Actuarial Assumptions
Signifi cant actuarial assumptions employed by the actuary for funding purposes as of June 30, 2008, the date of the most recent actuarial valuation include:
• Investment return – 8.25%, includes infl ation at 3.25%• Salary increases – 6.00%, which refl ects an allowance for infl ation of 3.25%, national
productivity of 1%, and merit or seniority increases of 1.75%• Amortization method – level dollar funding• Benefi t payments – no postretirement benefi t increases assumed in the future• Multiple Decrement Tables – mortality, vesting, retirement age, and withdrawal estimates are
based upon tables provided by the actuary
The System’s actuarial values are calculated separately for retirees and benefi ciaries and for active and inactive members. The actuarial present value of benefi ts to be paid to retirees and benefi ciaries currently receiving benefi ts and deferred survivor benefi ciaries, whose benefi ts have been determined, is calculated using the assumptions noted above. The Reserve for Retirement Account with interest credited thereon at an annual rate of 5.50% is compared to the actuarial accrued liability for the remaining lifetimes of the retirees and benefi ciaries and any defi ciency is then funded by a transfer from the State Accumulation Account.
The actuarial accrued liability for active and inactive members is calculated on the projected benefi t basis using the entry-age normal actuarial cost method under which the present value of each member’s expected benefi t payable at retirement or death is determined. The actuarial assets are subtracted from this present value to arrive at the funded or unfunded actuarial accrued liability.

Page 53
Financial Section
Notes to Financial Statements (Continued)
(C) Postemployment Healthcare Plans
i. Health Insurance Premium Assistance Program
(a) Health Insurance Premium Assistance Benefi ts
The System provides a Health Insurance Premium Assistance Program (premium assistance) for all eligible annuitants who qualify and elect to participate. Under this program, employer contribution rates for premium assistance are established to provide reserves in the Health Insurance Account that are suffi cient for the payment of premium assistance benefi ts for each succeeding year. Effective January 1, 2002, under the provisions of Act 9 of 2001, participating eligible annuitants are entitled to receive premium assistance payments equal to the lesser of $100 per month or their actual out-of-pocket monthly health insurance premium. To receive premium assistance, eligible annuitants must obtain their health insurance through either their school employer or the PSERS’ Health Options Program (HOP).
(b) Funding Status and Annual Required Contributions (ARC)
As of June 30, 2008, the most recent actuarial valuation, the plan was 8.5% funded. The actuarial accrued liability for benefi ts was $1.1 billion, and the actuarial value of assets was $95.8 million, resulting in an unfunded accrued liability of $1.0 billion. The covered payroll of active members was $11.9 billion and the ratio of the unfunded actuarial accrued liability to the covered payroll was 8.7%.
For fi scal year ended June 30, 2009, the ARC was $107.1 million. The actual employer contributions for fi scal year ended June 30, 2009 were $92.5 million resulting in an 86% contributed rate.
The Schedule of Funding Progress and Schedule of Employer Contributions included as Required Supplemental Information following the notes to the fi nancial statements provide multi-year presentations of funding status and ARC to illustrate their trends over time.
The health insurance liability and funding provisions of the PSERS Code differ from the GASB disclosure requirements. As a result, there are different determinations of actuarial liability and contribution requirements for GASB accounting purposes and for Commonwealth funding purposes. For purposes of funding, the actuarial liability equals the assets in the health insurance account, and the contribution required is the amount necessary to establish reserves suffi cient to provide premium assistance payments to all participating eligible annuitants during the fi scal year that immediately follows the year the employer contribution is made. For GASB accounting purposes, the actuarial liability has been determined under the entry age actuarial cost method, and the ARC is equal to the entry age normal cost for health insurance plus an amount that will amortize the entry age unfunded actuarial liability for health insurance over a period of 30 years. The entry age actuarial cost method was selected for this calculation because it meets the GASB parameters for determining actuarial liability and normal cost, and is the cost method specifi ed by the PSERS Code for the PSERS pension plan.
Page 54
Financial Section
Notes to Financial Statements (Continued)
ii. Health Insurance Program (HOP)
The HOP is a PSERS-sponsored voluntary health insurance program for the sole benefi t of annuitants of PSERS, spouses of annuitants, survivor annuitants and their dependents. Benefi ts are provided by managed care providers or by PSERS self-funded fee-for-service plans. All retirees are eligible to participate in the Enhanced or Basic Options (indemnity plans) regardless of their residence. The managed care plans are available to retirees residing in the plan’s service area. The HOP is funded exclusively by the premiums paid by its participants for the benefi t coverage they elect. The hospital, medical/surgical and major medical benefi ts of the Enhanced and Basic Options are self-funded. PSERS uses a third-party administrator to process these claims. An independent actuarial consulting fi rm sets the rates for the self-funded benefi ts so that the combination of contributions and the claims fl uctuation reserve equal 125% of expected annual incurred claims. The HOP maintains a reserve for claims that are incurred but not reported (IBNR). At June 30, 2009 and 2008 PSERS recorded $10,423,000 and $11,143,000, respectively, in IBNR which is included in benefi ts payable.
Effective January 1, 2006, PSERS made signifi cant changes to the HOP, in response to the Medicare Modernization Act. PSERS entered into an Employer/Union Entity contract with the Centers for Medicare and Medicaid Services (CMS) to operate a voluntary Medicare Prescription Drug Plan (PDP). Monthly contributions are received from CMS covering the 40,500 participants in the PDP in addition to the monthly prescription drug premiums paid by the participants. The PSERS pension fund assets are not available to fund or satisfy obligations of the HOP.
2. Summary of Signifi cant Accounting Policies
(A) Basis of Accounting
The fi nancial statements of the System are prepared on the accrual basis of accounting under which expenses are recorded when the liability is incurred, revenues are recorded in the accounting period in which they are earned and become measurable, and investment purchases and sales are recorded as of their trade date. Member and employer contributions are recognized in the period for which employees’ salaries are reported. Benefi ts and refunds are recognized when due and payable in accordance with the terms of the plan.
The accounting and reporting policies of the System conform to accounting principles generally accepted in the United States of America (GAAP). The preparation of fi nancial statements in conformity with GAAP requires management to make estimates and assumptions that affect the reported amounts of assets and liabilities and disclosure of contingent assets and liabilities at the date of the fi nancial statements and the reported amounts of additions and deductions in plan net assets during the reporting period. Actual results could differ from those estimates.
Page 55
Financial Section
Notes to Financial Statements (Continued)
(B) Investments
The System’s investments are reported at fair value. Fair value is the amount that the System can reasonably expect to receive for an investment in a current sale between a willing buyer and a willing seller, that is, other than in a forced or liquidation sale. Short-term securities are carried at cost, which approximates fair value, unless they have published market prices or quotations from national security exchanges or securities pricing services, in which case they are valued at the published market price. Fixed income securities and common and preferred stocks are generally valued based on published market prices and quotations from national security exchanges or securities pricing services. Securities which are not traded on a national security exchange are valued by the respective fund manager or other third parties based on similar sales.
Directly-owned real estate investments are primarily valued based on appraisals performed by independent appraisers and for properties not appraised, the present value of the projected future net income stream is used. Real estate owned investments are reported net of related debt borrowed against the market value of the property. As of June 30, 2009 and 2008, $132,000,000 in line of credit advances were netted against the related property valuation. The line of credit balance is due on March 9, 2012. The line is payable at an interest rate equivalent to the lender’s commercial paper rate plus 100 basis points and is collateralized by certain fi xed income investments of the System.
For alternative investments, which include private equity, private debt, venture capital and equity real estate investments where no readily ascertainable market value exists, management, in consultation with the general partner and investment advisors, has determined the fair values for the individual investments based upon the partnership’s most recent available fi nancial information. Futures contracts, foreign exchange contracts, and options are marked-to-market daily with changes in market value recognized as part of net appreciation/depreciation in the fair value of investments. Initial margin requirements for such fi nancial instruments are provided by investment securities pledged as collateral or by cash.
Collective trust fund investments (CTF) consist primarily of domestic and international institutional funds. The funds do not pay interest or dividends to shareholders and reinvest all income earned on securities held by the fund. The fair value of CTF is based on the reported share value of the respective fund. CTF are managed by state chartered banks for which various state banking departments have regulatory oversight and investment advisors for which the Securities and Exchange Commission has regulatory oversight.
Investment expenses consist of investment manager fees and those administrative expenses directly related to the System’s investment operations. Unsettled investment sales are reported as investment proceeds receivable and unsettled investment purchases are included in investment purchases and other liabilities.
(C) Capital Assets
Capital assets, consisting primarily of data processing equipment and software, are recorded at historical cost. The System depreciates capital assets using the straight-line method over an estimated useful life of seven years.

Page 56
Financial Section
Notes to Financial Statements (Continued)
(D) Benefi ts Payable
Benefi ts payable identifi es the obligations of the System, on an accrual basis, at the end of the fi scal year. It includes the estimated retirement and death benefi ts payable, and the HOP IBNR (incurred but not reported) claims for PSERS’ members or members’ benefi ciaries.
(E) Compensated Absences
The System uses the accrual basis of accounting for measuring liabilities related to vacation leave, sick leave, and other compensated absences. Employees of the System are paid for accumulated vacation leave upon termination or retirement. Retiring employees of the System that meet service, age, or disability requirements are paid between 30% and 100% of sick days available at retirement, up to 163 maximum days paid. As of June 30, 2009 and 2008, $3,222,000 and $3,013,000, respectively, was accrued for unused vacation and sick leave for the System’s employees and included in “Accounts payable and accrued expenses” on the Statements of Plan Net Assets.
(F) Premium Advances
Premium advances in the fi scal year ended June 30, 2009 and 2008 are for HOP premiums related to health care coverage provided in calendar year 2009 and 2008, respectively.
(G) Federal Income Taxes
The Internal Revenue Service (IRS) issued a determination letter dated March 3, 1978 which stated that the plan and its underlying trust qualify under the provisions of Section 501(a) of the Internal Revenue Code (IRC) and therefore are exempt from federal income taxes. The plan has been amended since receiving that determination letter. Additionally, the IRS issued a 1982 ruling which concluded that the Fund and the Board are integral parts of the Commonwealth, and are therefore not subject to federal income tax. In the opinion of management, the System has operated within the terms of the plan and remains qualifi ed under the applicable provisions of the IRC.
Federal tax legislation was enacted in 2001 that modifi ed the rules for making rollovers to or from pension systems and also established maximum amounts of retirement benefi ts that can be paid from pension systems. The Economic Growth and Tax Relief Reconciliation Act of 2001 (EGTRRA) expanded the opportunity for members to rollover funds received from PSERS at retirement to a wider variety of plans including, but not limited to, 403(b) tax sheltered annuities and government sponsored 457 deferred compensation plans. The Act permits the rollover of after-tax contributions from PSERS. EGTRRA provided for periodic increases in the annual compensation limits for qualifi ed retirement plans.
The annual compensation limits for 2008 and 2009 were $230,000 and $245,000, respectively. EGTRRA also provided for periodic increases in the annual benefi t limits for qualifi ed defi ned benefi t plans. The maximum annual defi ned benefi t limits at age 62 for 2008 and 2009 were $185,000 and $195,000, respectively.

Page 57
Financial Section
Notes to Financial Statements (Continued)
(H) Risk Management
The System is exposed to various liabilities and risks of loss, including, without limitation, the ordinary risks of investment losses, risks related to theft or destruction of assets, liabilities resulting from injuries to employees, and liabilities resulting from court challenges to fi duciary decisions. As an administrative agency of the Commonwealth of Pennsylvania, the System is accorded sovereign immunity. For claims not shielded by sovereign immunity, the System participates in certain Commonwealth pooled insurance programs and requires asset managers to carry certain insurance coverage for the protection of the System. The System has implemented a self-insurance program for fi duciary and director and offi cer liability coverage. The System has had no insurance claims during the past three fi scal years.
(I) Reclassifi cations
Certain 2008 amounts have been reclassifi ed in conformity with the 2009 presentation.
(J) Members’ Receivables
Members’ receivables include an amount for members’ obligations to the System for the purchase of service credit of $164,892,000 and $166,951,874 at June 30, 2009 and 2008, respectively. Members have a variety of options to remit purchase of service payments:
• Remit a lump sum payment.• Request an installment plan from one to seven years where the members’ employer establishes
a payroll deduction process. The members’ employer then forwards monthly payments of the withheld amounts to PSERS.
• Accept an actuarial reduction debt through which the amount of the purchase plus accumulated interest will reduce the member’s retirement or death benefi t.
• Rollover funds from an eligible distribution.
Because members have control over the timing of their remittances to the System, many purchase of service receivables extend beyond one year. An estimated $144,278,000 of the $244,327,000 members’ pension receivables at June 30, 2009 are expected to be collected by the System subsequent to June 30, 2010. At June 30, 2008, an estimated $152,000,000 of the $253,356,000 members’ pension receivables was expected to be collected by the System subsequent to June 30, 2009.
(K) Adoption of New Accounting Standards
In June 2004 the Governmental Accounting Standards Board issued Statement No. 45, Accounting and Financial Reporting by Employers for Postemployment Benefi ts Other than Pensions (“GASB 45”). GASB 45 changed how Other Postemployment benefi ts (OPEB) costs are reported by employer governments, charging employer OPEB costs during the periods when employees render services. The System adopted this Statement during the year ended June 30, 2008.
Page 58
Financial Section
Notes to Financial Statements (Continued)
During the year ended June 30, 2008 the System adopted Governmental Accounting Standards Board Statement No. 50, Pension Disclosures, an amendment of GASB statements 25 and 27 (“GASB 50”). GASB 50 was issued by the Governmental Accounting Standards Board to amend fi nancial statement note disclosures and required supplementary information for pension plans to be consistent with applicable standards under GASB 43 and GASB 45.
3. Description of Accounts
The Code requires the System to maintain the following accounts which represent reserves held for future and current benefi t payments as follows:
(A) State Accumulation Account
The State Accumulation Account is credited with the contributions of the Commonwealth and the employers. Additionally, interest earnings of the System (after crediting the Members’ Savings Account with 4% interest and the reserve for retirement with 5.50% statutory interest) are credited to this account. Each year, the necessary amounts, as determined by the actuary for the payment of retirement, disabilities, and death benefi ts, are transferred from the State Accumulation Account to the Reserve for Retirement Account increasing the reserve credit to the 8.25% valuation assumption rate determined by the actuary. All administrative expenses necessary for the operation of the System, except for premium assistance and HOP expenses, are paid from the State Accumulation Account.
(B) Members’ Savings Account
The Members’ Savings Account is credited with all contributions made by active members of the System. Interest is added to the member’s individual account at an annual rate of 4%.
Upon death or retirement of a member, the accumulated contributions plus interest are transferred to the Reserve for Retirement Account for subsequent payment of benefi ts.
(C) Reserve for Retirement Account
The Reserve for Retirement Account represents the amounts transferred from the Members’ Savings and State Accumulation Accounts, plus additional contributions made by the Commonwealth and employers for the payment of supplemental annuities and cost-of-living increases. All death, disability, and retirement benefi ts are paid from this account. Annual interest of 5.50% is credited to the Reserve for Retirement Account.
(D) Health Insurance Account
The Health Insurance Account is credited with contributions of the Commonwealth and the employers for the health insurance premium assistance program. Effective January 1, 2002, under the provisions of Act 9 of 2001, participating eligible annuitants are entitled to receive premium assistance payments equal to the lesser of $100 per month or their out-of-pocket monthly health insurance premium. The Health Insurance Account pays all administrative expenses necessary to operate the health insurance premium assistance program.

Page 59
Financial Section
Notes to Financial Statements (Continued)
(E) Health Insurance Program Account
The Health Insurance Program Account is credited with contributions from members of the HOP and from CMS. All benefi ts related to the HOP (premium payments to the insurance companies and self-funded benefi ts) are paid from this account. The Health Insurance Program Account pays all administrative expenses necessary to operate the HOP.
(F) Pension and Postemployment Healthcare Net Assets
Net assets held in trust for pension and postemployment healthcare benefi ts at June 30 follows:
4. Investments
(A) Summary of Investments
The Board has the responsibility to invest and reinvest available funds of the System in accordance with the guidelines and limitations set forth in the Code and other applicable state law. The Board accomplishes the daily management of the System’s investments through investment advisors who act as agents for the System and through internal investment managers.
The Board invests the funds of the System using the Prudent Investor Standard, as articulated in the Code, which means “the exercise of that degree of judgment, skill and care under the circumstances then prevailing which persons of prudence, discretion and intelligence who are familiar with such matters exercise in the management of their own affairs not in regard to speculation, but in regard to the permanent disposition of the fund, considering the probable income to be derived therefrom as well as the probable safety of their capital.” The Board has adopted its investment policy to formally document investment objectives and responsibilities. This policy, as well as applicable state law, establishes guidelines for permissible investments of the System.
(Dollar Amounts in Thousands) 2009 2008
Pension: State accumulation account $ (5,608,486) $ 16,392,728 Members’ savings account 11,087,345 10,532,683 Reserve for retirement account 37,516,621 35,548,015
$ 42,995,480 $ 62,473,426
Postemployment healthcare: Health insurance account $ 105,114 $ 95,785 Health insurance program account 106,446 89,413
$ 211,560 $ 185,198

Page 60
Financial Section
Notes to Financial Statements (Continued)
A summary of the fair value of investments at June 30 follows:
(Dollar Amounts in Thousands) 2009 2008
Pension investments: Short-term: Pennsylvania Treasury Short-Term Investment Fund $ - $ 2,405,509 PSERS Short-Term Investment Fund 4,253,396 - Other domestic short-term 696,019 1,249,875 International short-term 255,003 378,046
5,204,418 4,033,430 Fixed income: Domestic mortgage-backed securities 3,740,617 6,612,701 U.S. government and agency obligations 1,416,505 1,980,626 Domestic corporate and taxable municipal bonds 2,271,173 4,240,211 Miscellaneous domestic fixed income 456,144 604,069 Collective trust funds 2,529,667 2,294,869 International fixed income 919,443 2,251,757
11,333,549 17,984,233 Common and preferred stock:
Domestic common and preferred stock 3,073,854 8,995,463 Collective trust funds 3,929,724 4,808,851 International common and preferred stock 6,879,794 14,071,010
13,883,372 27,875,324 Real estate: Equity real estate 3,493,360 4,673,806
Directly-owned real estate 205,993 278,034 3,699,353 4,951,840
Alternative investments: Private equity 5,047,201 5,752,298 Private debt 3,283,060 2,371,506 Venture capital 698,671 741,848
9,028,932 8,865,652 Pension investments at fair value $ 43,149,624 $ 63,710,479
Postemployment healthcare investments: Premium Assistance: Pennsylvania Treasury Short-Term Investment Fund $ - $ 19,627 PSERS Short-Term Investment Fund 27,063 - Other domestic short-term 40,205 47,773
67,268 67,400 Health Options Program: Pennsylvania Treasury Short-Term Investment Fund - 60,962 PSERS Short-Term Investment Fund 84,683 - Other domestic short-term 42,360 53,379
127,043 114,341
Postemployment healthcare investments at fair value $ 194,311 $ 181,741

Page 61
Financial Section
Notes to Financial Statements (Continued)
(B) Deposit and Investment Risk Disclosures
i. Deposits
Custodial credit risk for deposits is the risk that, in the event of a fi nancial institution failure, the System would not be able to recover the value of the deposits. The State Treasury Department is the custodian of the System’s fund. State Treasury Department deposits must be held in insured depositories approved by the Commonwealth’s Board of Finance and Revenue and must be fully collateralized.
The System, through its third party administrator, maintains certain bank deposits for the operation of its voluntary health insurance program. These deposits are not required to be collateralized by statute or policy. These deposits totaled $42,360,000 and $53,379,000 at June 30, 2009 and 2008, respectively, and are under the custody of M&T Bank which has an A- rating by Standard and Poor’s (S&P) and an A3 rating by Moody’s Investor Services (Moody’s).
ii. Investment Risks
The System’s investments may be subject to various risks. Among these risks are concentration of credit risk, custodial credit risk, credit risk, interest rate risk, and foreign currency risk. The policies addressing each one of these risks, discussed in more detail below, are contained within the Investment Policy Statement, Objectives, and Guidelines reviewed and approved annually by the Board. Due to the level of risk associated with certain investments, it is possible that changes in the values of investments may occur in the near term and that such changes could materially affect the amounts reported in the Statements of Plan Net Assets.
Concentration of Credit Risk
Concentration of credit risk is the risk of loss attributed to the magnitude of the System’s investment in a single issuer. As of June 30, 2009 and 2008 the System had no single issuer that exceeded 5% of total investments. Investments issued or explicitly guaranteed by the U.S. government and investments in mutual funds, external investment pools, and other pooled investments were excluded.
Custodial Credit Risk
Custodial credit risk for investments is the risk that, in the event of the failure of the counterparty to a transaction, the System would not be able to recover the value of investment or collateral securities that are in the possession of an outside party. In accordance with a contractual relationship between the Commonwealth’s Treasury Department and its custodial agent, substantially all investments, where securities are used as evidence of the investment, are held by the custodian in book-entry form in the System’s name. Those investments are defi ned as insured or registered investments for which the securities are held by the System or its agent and, therefore, have a very minimal level of custodial credit risk. The remaining investments, which do not have securities that are used as evidence of the investment, are primarily in collective trust funds and limited partnerships, which include real estate and alternative investments.

Page 62
Financial Section
Notes to Financial Statements (Continued)
Credit Risk
Credit risk is the risk that an issuer or other counterparty to an investment will not fulfi ll its obligations. The credit risk of a debt instrument is measured by nationally recognized statistical rating organizations (NRSRO) such as Fitch Investor Services (Fitch), Moody’s, and S&P. Annually, the Board establishes an asset allocation plan. This plan manages the overall credit risk of the fi xed income asset class through a clearly defi ned long-term asset allocation policy. This policy establishes a long-term target allocation of the fi xed income asset class at 29.5% of the investment portfolio. The fi xed income target allocation consists of:
• An allocation of 16.5% of the portfolio has been made to the domestic core plus and high yield segments of the fi xed income asset class benchmarked to the Barclays Capital U.S. Universal Index. The domestic core plus allocation is composed of primarily investment grade, relatively liquid, public domestic bonds with an overall weighted-average NRSRO credit rating of A or better while the high yield allocation focuses on less liquid public non-investment grade fi xed income securities with an overall weighted-average NRSRO credit rating of BB+ or less.
• An allocation of 5% of the portfolio has been made to the Treasury Infl ation-Protected Securities (TIPS) segment of the fi xed income asset class benchmarked to the Barclays Capital U.S. TIPS Index and composed of primarily government issued TIPS with an overall weighted-average NRSRO credit rating of AA or better.
• An allocation of 3.0% of the portfolio has been made to the global core plus fi xed income asset class benchmarked to the Barclays Capital Multiverse Index composed of primarily investment grade, relatively liquid U.S. and non-U.S. public bonds with an overall weighted-average NRSRO credit rating of BB- or better.
• An allocation of 5% of the portfolio has been made to cash benchmarked to the Merrill Lynch U.S.Treasury Bill 0-3 Months Index composed of primarily investment grade, relatively liquid U.S. and non-U.S. public bonds with an overall weighted-average NRSRO credit rating of A+ or better.

Page 63
Financial Section
Notes to Financial Statements (Continued)
The following table discloses aggregate market value by credit quality rating category. Many securities have ratings from more than one NRSRO and sometimes those ratings differ from one NRSRO to another. The data listed below uses the rating (expressed as S&P equivalent) available from Fitch, Moody’s and/or S&P that indicates the lowest credit quality at June 30, 2009 and 2008.
* Not Rated securities include $2,529,667 and $2,294,869 in collective trust funds at June 30, 2009 and 2008, respectively. Also included are $4,365,142 in the PSERS Short-Term Investment Fund at June 30, 2009 and $2,486,098 in the Pennsylvania (PA) Treasury Short-Term Investment Fund at June 30, 2008, pooled investment funds for which ratings were unavailable. The pools are comprised of short-term, high credit quality securities which include money market funds, commercial paper, U.S. Treasuries, agencies or repurchase agreements.
** Comprised of U.S. government and agency obligations explicitly guaranteed by the U.S. government and not considered to have credit risk.
Interest Rate Risk
Interest rate risk is the risk that changes in interest rates will adversely affect the fair value of a fi xed income investment. The System manages its interest rate risk by diversifying the fi xed income portfolio and maintaining the fi xed income portfolio at an effective duration range between 65 and 135 percent of the benchmark index.
Duration is a measure of the approximate sensitivity of a bond’s value to interest rate changes. The higher the duration, the greater the changes in fair value when interest rates change. For example, a duration of 4.0 would mean that, given a 100-basis point change up/down in rates, a bond’s price would move down/up approximately 4.0 percent. PSERS measures interest rate risk using option-adjusted duration, which recognizes the fact that yield changes may change the expected cash fl ows due to embedded options.
(Dollar Amounts in Thousands)
Quality Rating2009
Fair Value 2008
Fair Value AAA $ 4,434,124 $ 8,436,260 AA 672,450 1,435,628 A 888,204 1,824,267 BBB 812,151 1,593,709 BB and below 895,804 904,053 NR* 7,433,485 5,748,497
Total Exposed to Credit Risk 15,136,218 19,942,414
U.S. Government Guaranteed** 1,596,060 2,256,990
Total Fixed Income and Short-Term Investments $ 16,732,278 $ 22,199,404

Page 64
Financial Section
Notes to Financial Statements (Continued)
At June 30, 2009 and 2008, the System’s fi xed income portfolio had the following option-adjusted durations by fi xed income sector:
* The option-adjusted duration of 2.1 and 3.1 at June 30, 2009 and 2008, respectively, for the total fi xed income and Short-Term Investment Funds is calculated by weighting the option-adjusted duration of each investment type by market value.
** Fixed income investment managers enter into futures contracts to adjust the durations of their portfolios as a whole rather than any particular investment type within the portfolio. In total, the futures contracts have adjusted PSERS’ total fi xed income and Short-Term Investment Funds duration upward by 0.1 at June 30, 2009 and 2008.
Foreign Currency Risk
Foreign currency risk is the risk that changes in exchange rates will adversely affect the fair value of an investment. As part of the System’s program to manage risk and enhance returns, the System invests in non-U.S. markets. Investment managers in non-U.S. equity and global fi xed income may hedge their non-U.S. foreign currency exposure back to U.S. dollars. For the year ended June 30, 2008, the System also reduced the exposure to currency risk by hedging to a target of 30% of MSCI EAFE Index country currencies to the U.S. dollar. The currency hedge program was discontinued during FY 2009. At June 30, 2009 and 2008 PSERS had the following non-U.S. currency exposure:
(Dollar Amounts in Thousands) 2009 2008
Investment Type
Option-Adjusted Duration Fair Value
Option-AdjustedDuration Fair Value
Domestic mortgage-backed securities 1.7 $ 3,740,617 2.8 $ 6,612,701 U.S. government and agency obligations 3.6 1,416,505 7.1 1,980,626 Domestic corporate and taxable municipal bonds 3.0 2,271,173 2.7 4,240,211 Miscellaneous domestic fixed income 0.4 456,144 0.5 604,069 Fixed income collective trust funds 4.3 2,529,667 3.3 2,294,869 International fixed income 3.8 919,443 5.3 2,251,757 PA Treasury Short-Term Investment Fund - - 0.2 2,486,098 PSERS Short-Term Investment Fund 0.1 4,365,142 - -
Total fixed income & Short-Term Investment Funds 2.1* 15,698,691 3.1* 20,470,331
Total adjustments for futures contracts 0.1** - 0.1** -
Total fixed income & Short-Term Investment Funds 2.2** $ 15,698,691 3.2** $ 20,470,331

Page 65
Financial Section
Notes to Financial Statements (Continued)
2009(Dollar Amounts in Thousands)
Currency Equity Fixed
Income
Alternative Investments &
Real Estate Short-Term* Total
Fair Value
Euro $ 1,047,301 $ 269,565 $ 1,247,221 $ 92,495 $ 2,656,582 Japanese yen 1,254,289 55,862 - 182,435 1,492,586 British pound sterling 1,078,529 31,998 6,776 86,898 1,204,201 Hong Kong dollar 566,206 - - 2,429 568,635 Australian dollar 347,456 1,879 - 44,524 393,859 Swiss franc 378,039 - - (3,390) 374,649 Canadian dollar 407,085 2,761 4,304 (41,540) 372,610 South African rand 167,544 - - 51,311 218,855 Brazil real 124,471 17,867 - 25,069 167,407 Indian rupee 109,516 314 - 44,161 153,991 Other non-U.S. currencies 886,940 89,209 - (63,368) 912,781
Total $ 6,367,376 $ 469,455 $ 1,258,301 $ 421,024 $ 8,516,156
2008(Dollar Amounts in Thousands)
Currency Equity Fixed
Income
Alternative Investments & Real Estate Short-Term*
Currency Hedge**
TotalFair Value
Euro $ 2,911,313 $ 872,140 $ 1,245,999 $ 561,554 $ (2,281,603) $ 3,309,403 British pound sterling 2,682,672 231,969 6,745 (60,345) (1,256,994) 1,604,047 Japanese yen 2,425,174 179,157 - (3,819) (1,177,085) 1,423,427 Canadian dollar 943,768 131,162 18,768 (119,393) - 974,305 Australian dollar 594,116 7,352 - 241,340 (248,944) 593,864 Hong Kong dollar 704,625 - - 3,799 (116,211) 592,213 Swedish krona 157,499 112,328 - 142,750 - 412,577 South Korean won 266,245 - - 26,443 - 292,688 Singapore dollar 271,740 18,010 - (20,947) - 268,803 Brazil real 151,327 3,127 - 80,306 - 234,760 Other non-U.S. currencies 1,967,199 27,047 - (6,613) (416,793) 1,570,840
Total $ 13,075,678 $ 1,582,292 $ 1,271,512 $ 845,075 $ (5,497,630) $ 11,276,927
* Includes investment receivables and payables. ** The currency hedge program was discontinued during FY 2009.

Page 66
Financial Section
Notes to Financial Statements (Continued)
(C) Securities Lending
In accordance with a contract between the Commonwealth and its custodial agent, the System participates in a securities lending program. Under this program, the custodian, acting as the lending agent, loans securities (equities, fi xed income issues and money market instruments) to independent brokers and dealers in exchange for collateral in an amount not less than 102% of the fair value of any securities loaned except for non-U.S. corporations for which 105% of the fair value is required. For Euro fi xed income debt issues, for which the Commonwealth receives Euros as collateral and international fi xed income debt issues denominated in U.S. dollars, the collateral required to be exchanged is in an amount not less than 102% of the fair value of any securities loaned. Collateral is marked-to-market daily. If the fair value of the collateral held falls below the minimum guidelines for securities loaned, additional collateral is obtained. In lieu of certain approved securities or cash, the borrower may deliver to the lending agent irrevocable bank letters of credit as collateral. If the collateral obtained consists in whole or in part of cash, the lending agent may use or invest the cash in accordance with reinvestment guidelines approved by the System.
As of June 30, 2009 and 2008, the System had no credit risk exposure to borrowers because the amounts the System owed the borrowers exceeded the amounts the borrowers owed the System. Under the securities lending program, the lending agent provides indemnifi cation to the Commonwealth if the same borrowers fail to return the underlying securities (and the collateral is inadequate to replace the loaned securities) or fail to pay income distributions on them. There were no losses during the fi scal years ended June 30, 2009 and 2008, resulting from a default of the borrowers or the lending agent.
All securities loans can be terminated on demand by either the System or the borrower, although the average term of the loan is one day. There were no term loans as of June 30, 2009 and 2008.
For the year ended June 30, 2009, cash collateral is invested in one of two short-term collateral investment pools, the fi rst of which is denominated in U.S. dollars and the second in Euros. Each collateral investment pool is managed by the lending agent, is segregated from all other clients of the lending agent, and is not subject to custodial credit risk. For the year ended June 30, 2008, cash collateral was invested in the lending agent’s short-term investment pool which was not segregated from other clients and was not subject to custodial credit risk. The System’s income from securities lending represents its pro-rata share from participating in the program. The weighted-average maturity of the investments in the pool was 15 days and 25 days at June 30, 2009 and 2008, respectively. During the fi scal year ended June 30, 2009, the mismatch between the maturities of the investments made with cash collateral and the maturities of the securities loans may have posed some interest rate risk to the System. During the fi scal year ended June 30, 2008, the relationship between the maturities of the investment pool and the System’s loans was affected by the maturities of the securities loans made by other entities that used the lending agent’s pool, which the System could not determine. The System cannot pledge or sell collateral securities received unless the borrower defaults. In the event of a default, the lending agent may use the collateral to replace the loaned securities.

Page 67
Financial Section
Notes to Financial Statements (Continued)
During the fi scal year ended June 30, 2009, certain securities purchased with cash collateral by the lending agent declined signifi cantly in value, resulting in a net loss to the System from the securities lending program. The System acquired new securities for the collateral pool during the fi scal year ended June 30, 2009 to replace the value lost on the securities that had been purchased by the lending agent.
As of June 30, 2009, the fair value of loaned securities was $2,109,420,000, which includes
$584,108,000 of loaned securities, which are collateralized by securities and irrevocable letters of credit that are not included in the Statements of Plan Net Assets. The fair value of the associated collateral was $2,232,432,000 of which $1,591,720,000 was cash. As of June 30, 2008, the fair value of loaned securities was $7,465,573,000, which includes $2,939,093,000 of loaned securities which are collateralized by securities and irrevocable letters of credit that are not included in the Statements of Plan Net Assets. The fair value of the associated collateral was $8,053,669,000 of which $4,846,999,000 was cash.
5. Derivative and Other Similar Investments
The System enters into a variety of fi nancial contracts, which include options and futures. The System also enters into foreign exchange positions, such as forward and spot contracts to obtain or hedge foreign currency exposure; swap agreements to gain exposure to certain sectors of the equity and fi xed income markets; collateralized mortgage obligations (CMOs); other forward contracts, and U.S. Treasury strips. The System is not a dealer, but an end-user of these instruments. The contracts are used primarily to enhance performance and reduce the volatility of the portfolio. The System is exposed to credit risk in the event of non-performance by counterparties to fi nancial instruments. The System generally enters into transactions only with high quality institutions. Legal risk is mitigated through selection of executing brokers and review of all documentation. The System is exposed to market risk, the risk that future changes in market conditions may make an instrument less valuable. Exposure to market risk is managed in accordance with risk limits set by senior management, through buying or selling instruments or entering into offsetting positions.
The notional or contractual amounts of derivatives indicate the extent of the System’s involvement in the various types and uses of derivative fi nancial instruments and do not measure the System’s exposure to credit or market risks and do not necessarily represent amounts exchanged by the parties. The amounts exchanged are determined by reference to the notional amounts and the other terms of the derivatives.
The following table summarizes the aggregate notional or contractual amounts for the System’s derivative fi nancial instruments at June 30, 2009 and 2008 (in thousands):
2009 2008Futures contracts – long $ 3,310,264 $ 11,962,986 Futures contracts – short 1,806,480 5,046,611 Foreign exchange forward and spot contracts, gross 6,266,360 20,668,439 Options – calls purchased 1,198,018 154,767 Options – puts purchased 766,916 322,841 Options – calls sold 972,583 159,300 Options – puts sold 827,220 501,896 Swaps – total return type 3,658,970 2,570,616 Swaps – interest rate 1,382,764 826,124

Page 68
Financial Section
Futures contracts are contracts in which the buyer agrees to purchase and the seller agrees to make delivery of a specifi c fi nancial instrument at a predetermined date and price. Gains and losses on futures contracts are settled daily based on a notional (underlying) principal value and do not involve an actual transfer of the specifi c instrument. Futures contracts are standardized and are traded on exchanges. The exchange assumes the risk that a counterparty will not pay and generally requires margin payments to minimize such risk. In addition, the System enters into short sales, sales of securities it does not presently own, to neutralize the market risk of certain equity positions. Initial margin requirements on futures contracts and collateral for short sales are provided by investment securities pledged as collateral and by cash held by various brokers. Although the System has the right to access individual pledged securities, it must maintain the amount pledged by substituting other securities for those accessed. The value of securities pledged and the amount of cash held at June 30, 2009 and 2008 represent a restriction on the amount of assets available as of year-end for other purposes.
Option contracts provide the option purchaser with the right, but not the obligation, to buy or sell the underlying security at a set price during a period or at a specifi ed date. The option writer is obligated to buy or sell the underlying security if the option purchaser chooses to exercise the option. The System generally uses exchange listed currency, index, stock, and futures options. The System has authorized an investment manager to write covered call stock index option spreads up to a notional amount of $1,500,000,000.
Foreign exchange contracts involve an agreement to exchange the currency of one country for the currency of another country at an agreed-upon price and settlement date. The contracts reported above primarily include forwards. The $6,266,360,000 of foreign currency contracts outstanding at June 30, 2009 consist of “buy” contracts, which represent the U.S. dollar equivalents of commitments to purchase foreign currencies of $3,609,991,000 and “sell” contracts, which represent U.S. dollar equivalents of commitments to sell foreign currencies of $2,656,369,000. The $20,668,439,000 of foreign currency contracts outstanding at June 30, 2008 consist of “buy” contracts of $8,391,990,000 and “sell” contracts of $12,276,449,000. The unrealized loss on contracts of $(10,398,000) and $(94,298,000) at June 30, 2009 and 2008, respectively, is included in the Statements of Plan Net Assets and represents the fair value of the contracts. The System has authorized an investment manager to manage a currency hedge portfolio consisting of foreign exchange spot and forward contracts, currency futures, and currency options to hedge up to a notional amount of $3,800,000,000 of the MSCI EAFE Index currencies to U.S. dollars. The currency hedge program was discontinued during FY 2009.
Notes to Financial Statements (Continued)

Page 69
Financial Section
Notes to Financial Statements (Continued)
Swap agreements provide for periodic payments at predetermined future dates between parties based on the change in value of underlying securities, indexes or interest rates. During the year ended June 30, 2009 and 2008, the System entered into total return type swaps and interest rate swaps. Under the total return type swap arrangements, the System receives the net return of certain equity securities or indexes in exchange for a short-term rate minus a spread or a predetermined fi xed charge. The receivable (payable) on the total return type swap contracts of $32,464,000 and $(184,438,000) at June 30, 2009 and 2008, respectively, is included in the Statements of Plan Net Assets and represents the fair value of the contracts. The contracts have varying maturity dates ranging from July 15, 2009 to May 28, 2010. Interest rate swap agreements involve the exchange by the System with another party of their respective commitments to pay or receive interest, e.g. an exchange of fl oating rate payments for fi xed rate payments with respect to a notional amount of principal. The System uses interest rate swaps as the most cost-effective way to gain exposure to certain sectors of the fi xed income market. The receivable on the interest rate swap contracts of $10,314,000 and $8,238,000 at June 30, 2009 and 2008, respectively, is included in the Statements of Plan Net Assets and represents the fair value of the contracts. The contracts have varying maturity dates ranging from October 31, 2009 to April 1, 2010.
The System also invests in mortgage-backed securities (MBS) such as CMOs and MBS forwards to maximize yields. These securities are sensitive to prepayments of mortgages, which may result from a drop in interest rates. The MBS forwards are subject to credit risk in the event of nonperformance by counterparties. The fair value of CMOs at June 30, 2009 and 2008 is $2,295,709,000 and $2,574,096,000, respectively.
The System invests in U.S. Treasury strips which essentially act as zero coupon bonds and are subject to market volatility from a rise or drop in interest rates.
Through certain collective trust funds, the System also indirectly holds various derivative fi nancial instruments. The collective trust funds invest in futures and options thereon; forward foreign currency contracts; options; interest rate, currency, equity, index, and total return swaps; interest-only strips; and CMOs, to enhance the performance and reduce the volatility of their portfolios.
6. Pension Plan for Employees of the System
The System contributes to the Commonwealth’s State Employees’ Retirement System (SERS), a cost-sharing multiple-employer defi ned benefi t pension plan. SERS provides retirement, death, and disability benefi ts to plan members and benefi ciaries according to Commonwealth statute. SERS issues a publicly available fi nancial report that can be obtained by writing to SERS, 30 N. Third Street, P. O. Box 1147, Harrisburg, Pennsylvania 17108-1147 or on its website: www.sers.state.pa.us.

Page 70
Financial Section
Notes to Financial Statements (Continued)
The contribution requirements of plan members and the System are mandated by Commonwealth statute. Most SERS plan members are required to contribute 5% or 6.25% of their annual covered payroll depending upon service class. The System is required to contribute at an actuarially determined rate.
The rates applied to annual covered payroll were 3.29% at June 30, 2009, 3.28% at June 30, 2008 and 3.23% at June 30, 2007. The System’s contributions to SERS for the years ended June 30, 2009, 2008 and 2007 were $625,000, $602,000 and $534,000, respectively, which were equal to the required contributions each year.
7. Postemployment Healthcare Plan for Employees of the System
The System participates in the Commonwealth’s Retired Employees Health Program (REHP). The REHP is a single-employer plan and provides certain healthcare benefi ts to qualifying individuals meeting specifi ed age and/or service requirements. The Commonwealth’s Offi ce of Administration (OA), in its sole discretion, determines available REHP benefi ts on an ongoing basis. REHP funding is arranged among OA, the Governor’s Budget Offi ce and the Pennsylvania Employees’ Benefi t Trust Fund (PEBTF). The PEBTF is a third-party administrator for the REHP under the provisions of an Administrative Agreement between OA and PEBTF.
A portion of OPEB costs for retiree healthcare benefi ts are charged as a component of payroll expenditures on a ‘pay-as-you-go’ basis. The 2008-2009 costs were charged at the rate of $240/employee/bi-weekly pay period. Plan members who retired after June 30, 2005 contribute to the plan based on a percentage of their fi nal annual gross base salary at the time of retirement. Plan member contribution rates vary based on retirement date.
In May 2008 the Commonwealth released an Actuarial Valuation of its Post-Retirement Medical Plan as of February 2008 covering the fi scal year ended June 30, 2009. The Valuation indicated overall Annual Required Contributions of $603,186,000, with the System’s allocated portion at $2,486,000. The actuarial valuation is available at the Offi ce of the Budget’s website:www.budget.state.pa.us.
8. Litigation and Contingencies
The System is subject to various threatened and pending lawsuits. These lawsuits include issues related to benefi t calculations and eligibility. It is the opinion of management that the ultimate liability arising from such threatened and pending litigation will not have a material effect on the fi nancial position of the System. The System is exposed to various other liabilities and risks related to fi duciary responsibilities of directors and offi cers.

Page 71
Financial Section
Required Supplemental Schedule 1Schedules of Funding Progress*
(Unaudited - See Accompanying Auditor’s Report)(Dollar Amounts in Millions)
Pension
Valuationas of
June 30
(1)
Actuarialaccruedliabilities
(AAL)
(2)
Actuarialvalue ofassets
(3)
(Funded)Unfundedactuarialaccruedliabilities(FAAL) or
UAAL(1) - (2)
(4)
Ratio ofassetsto AAL(2) / (1)
(5)
Coveredpayroll
(6)
(FAAL) orUAALas a
percentageof covered
payroll(3) / (5)
2008 $ 70,845.6 $ 60,922.1 $ 9,923.5 86.0% $ 11,921.5 83.2%2007 66,495.8 57,057.8 9,438.0 85.8% 11,410.3 82.7%2006 64,627.3 52,464.7 12,162.6 81.2% 11,419.0 106.5%2005 61,129.4 51,122.1 10,007.3 83.6% 10,527.7 95.1%2004 56,978.1 51,949.6 5,028.5 91.2% 10,030.7 50.1%2003 54,313.3 52,770.0 1,543.3 97.2% 9,652.9 16.0%
Premium Assistance
Valuationas of
June 30
(1)
Actuarialaccruedliabilities
(AAL)
(2)
Actuarialvalue ofassets
(3)
(Funded)Unfundedactuarialaccruedliabilities(FAAL) or
UAAL(1) - (2)
(4)
Ratio ofassetsto AAL(2) / (1)
(5)
Coveredpayroll
(6)
(FAAL) orUAALas a
percentageof covered
payroll(3) / (5)
2008 $ 1,133.0 $ 95.8 $ 1,037.2 8.5% $ 11,921.5 8.7%2007 1,058.1 97.3 960.8 9.2% 11,410.3 8.4%2006 1,056.2 92.8 963.4 8.8% 11,419.0 8.4%
Each time a new benefi t is added which applies to service already rendered, an “unfunded accrued liability” is created. The laws governing PSERS require that these additional liabilities be fi nanced systematically over a period of future years. Also, if actual fi nancial experiences are less favorable than assumed fi nancial experiences, the difference is added to unfunded accrued liabilities.
In an infl ationary economy, the value of the dollar is decreasing. In this environment, employees pay in greater dollar amounts, resulting in a dollar increase in unfunded accrued liabilities. This occurs at a time when the actual substance of these items may be decreasing. Looking at just the dollar amounts of unfunded accrued liabilities can be misleading. Unfunded accrued liabilities divided by active employee payroll provides an index which clarifi es understanding. The smaller the ratio of unfunded liabilities to covered payroll, the stronger the system. Observation of this relative index over a period of years will give an indication of whether the system is becoming fi nancially stronger or weaker.
* The amounts reported in the Schedule of Funding Progress do not include assets or liabilities for the HOP.

Page 72
Financial Section
The Board adopted all contribution rates as recommended by the Actuary pursuant to the prevailing provisions of the Retirement Code for each year.
Required Supplemental Schedule 2Schedules of Employer Contributions
(Unaudited - See Accompanying Auditor’s Report)(Dollar Amounts in Thousands)
Pension
Annual ActualRequired Employer Percentage
Year ended June 30 Contributions Contributions Contributed
2009 $ 1,761,295 $ 503,227 29%2008 1,852,238 753,532 41%2007 1,708,821 659,545 39%2006 1,328,373 456,878 34%2005 945,107 431,556 46%2004 321,091 321,091 100%
Premium Assistance
Annual ActualRequired Employer Percentage
Year ended June 30 Contributions Contributions Contributed
2009 $ 107,097 $ 92,493 86%2008 101,352 81,317 80%2007 94,970 86,763 91%
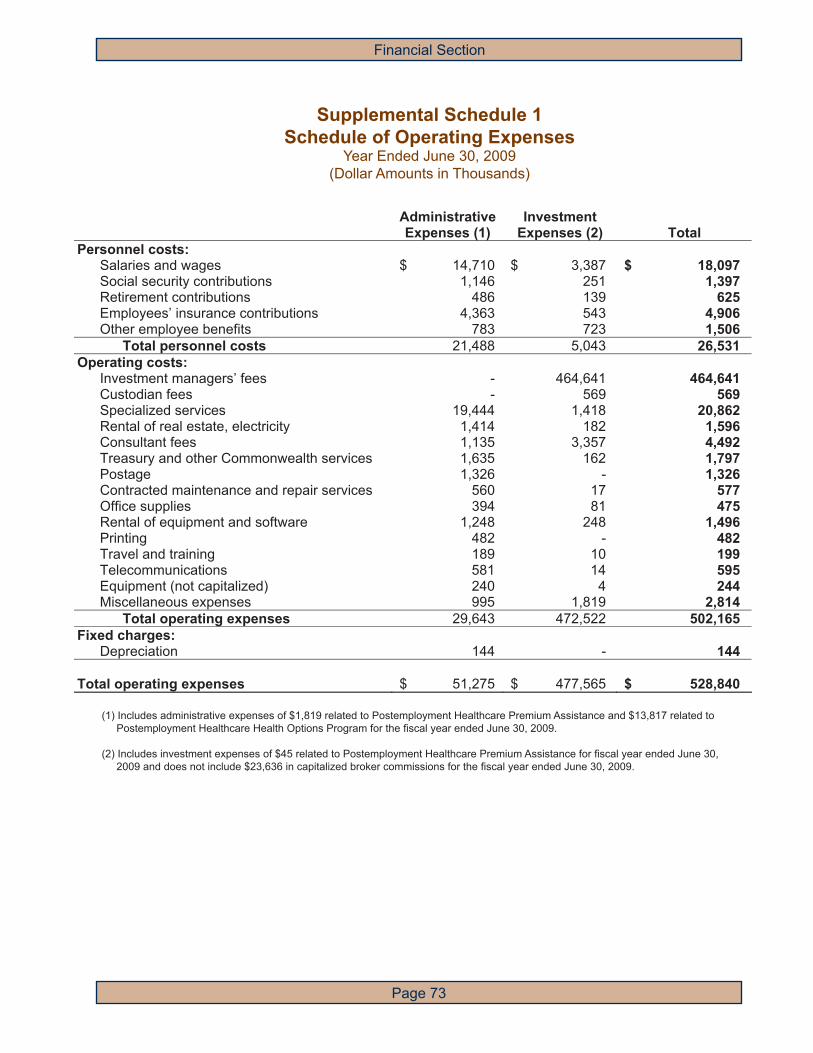
Page 73
Financial Section
(1) Includes administrative expenses of $1,819 related to Postemployment Healthcare Premium Assistance and $13,817 related to Postemployment Healthcare Health Options Program for the fi scal year ended June 30, 2009.
(2) Includes investment expenses of $45 related to Postemployment Healthcare Premium Assistance for fi scal year ended June 30, 2009 and does not include $23,636 in capitalized broker commissions for the fi scal year ended June 30, 2009.
Supplemental Schedule 1Schedule of Operating Expenses
Year Ended June 30, 2009(Dollar Amounts in Thousands)
Administrative Investment Expenses (1) Expenses (2) Total
Personnel costs: Salaries and wages $ 14,710 $ 3,387 $ 18,097 Social security contributions 1,146 251 1,397 Retirement contributions 486 139 625 Employees’ insurance contributions 4,363 543 4,906 Other employee benefits 783 723 1,506
Total personnel costs 21,488 5,043 26,531 Operating costs: Investment managers’ fees - 464,641 464,641 Custodian fees - 569 569 Specialized services 19,444 1,418 20,862 Rental of real estate, electricity 1,414 182 1,596 Consultant fees 1,135 3,357 4,492 Treasury and other Commonwealth services 1,635 162 1,797 Postage 1,326 - 1,326 Contracted maintenance and repair services 560 17 577 Office supplies 394 81 475 Rental of equipment and software 1,248 248 1,496 Printing 482 - 482 Travel and training 189 10 199 Telecommunications 581 14 595 Equipment (not capitalized) 240 4 244 Miscellaneous expenses 995 1,819 2,814
Total operating expenses 29,643 472,522 502,165 Fixed charges: Depreciation 144 - 144
Total operating expenses $ 51,275 $ 477,565 $ 528,840
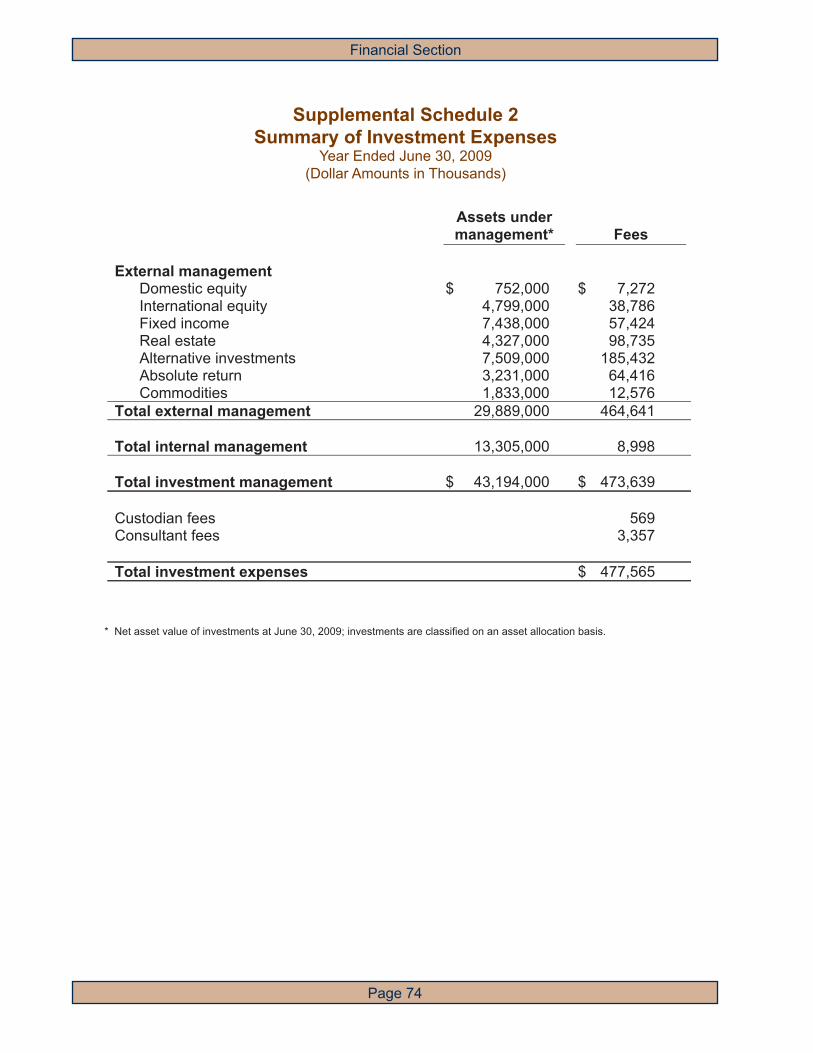
Page 74
Financial Section
* Net asset value of investments at June 30, 2009; investments are classifi ed on an asset allocation basis.
Supplemental Schedule 2Summary of Investment Expenses
Year Ended June 30, 2009(Dollar Amounts in Thousands)
Assets under management* Fees
External management Domestic equity $ 752,000 $ 7,272
International equity 4,799,000 38,786 Fixed income 7,438,000 57,424 Real estate 4,327,000 98,735 Alternative investments 7,509,000 185,432 Absolute return 3,231,000 64,416 Commodities 1,833,000 12,576 Total external management 29,889,000 464,641
Total internal management 13,305,000 8,998
Total investment management $ 43,194,000 $ 473,639
Custodian fees 569 Consultant fees 3,357
Total investment expenses $ 477,565

Page 75
Financial Section
Consultant Fees Services Provided
CoreSource, Inc. $ 9,984,091 Postemployment healthcare benefi ts administration and claims adjudication
Vitech Systems Group, Inc. 3,704,440 NPAS project development
The Segal Company 2,233,306 Actuarial services and consulting for HOPand prescription drug plan
Rx Solutions, Inc. 1,611,620 Administration of postemployment health-care benefi ts and prescription drug plan
Buck Consultants LLC 557,001 Pension benefi t actuarial services
Independent Pharmaceutical Consultants, Inc.
425,362 Administration of postemployment health-care benefi ts and prescription drug plan
Clifton Gunderson LLP 135,820 Financial audit of pension system and postemployment healthcare programs
Gunther International LTD 111,650 Communication and mailing services
Supplemental Schedule 3Schedule of Payments to Non-Investment Consultants
Year Ended June 30, 2009(Payment Amounts Greater than $50,000)

Page 76
Financial Section

Introduction
- Investment Overview
- Portfolio Details
- Investment Income
- Consultants
Investment
- Brokers

Investment Section
Page 78
Investment Overview
Authority and Fiduciary Standard
The Board has the responsibility to invest funds of the System in accordance with guidelines and limitations set forth in the Code and other applicable state law. As fi duciaries, the members of the Board and Staff must act solely in the interests of the members of the System and for the exclusive benefi t of the System’s members. In performance of their duties, the members of the Board and Staff delegated with investment authority shall be held to the Prudent Investor Standard.
The Prudent Investor Standard, as articulated in the Code, means “the exercise of that degree of judgment, skill and care under the circumstances then prevailing which persons of prudence, discretion and intelligence who are familiar with such matters exercise in the management of their own affairs not in regard to speculation, but in regard to the permanent disposition of the fund, considering the probable income to be derived therefrom as well as the probable safety of their capital.”
The Prudent Investor Standard requires a trustee to act prudently and with caution, discretion, loyalty, and care but does not restrict the assets in which the Board can invest. Under the Prudent Investor Standard, which recognizes modern portfolio theory, the Board’s investment and management decisions with respect to individual assets shall be considered in the context of the portfolio as a whole and as part of an overall investment strategy, and not in isolation. No specifi c investment or course of action, taken alone, shall be considered inherently prudent or imprudent. This Standard recognizes the trade-off between risk and return.
Policies and Objectives
The Board is responsible for the formulation of investment policies for the System. The overall investment objectives of the System are as follows:
· Return Objectives – the overall return objective is to realize a return suffi cient to achieve funding adequacy on an infl ation-adjusted basis. Funding adequacy is achieved when the actuarial market value of assets is at least equal to the System’s projected benefi t obligations. The System has a return objective of meeting or exceeding the targeted actuarial rate of return (currently 8.0%) over the long-term. In addition, the Board has the following broad objectives:
1. The assets of the System shall be invested to maximize the returns for the level of risk taken; and,
2. The System shall strive to achieve a return that exceeds the Policy Index (the Policy Index, which is based on the Board-established asset allocation structure, is a custom benchmark designed to generate a return that meets the actuarial rate of return assumption).
·
ALAN H. VAN NOORD, CFAChief Investment Offi cer
COMMONWEALTH OF PENNSYLVANIAPUBLIC SCHOOL EMPLOYEES’ RETIREMENT SYSTEM

Investment Section
Page 79
Risk Objectives
1. The assets of the System shall be diversifi ed to minimize the risk of losses within any one asset class, investment type, industry or sector distribution, maturity date, or geographic location. Failure to do so could impair the System’s ability to achieve its funding and long-term investment goals and objectives; and,
2. The System’s assets shall be invested so that the probability of investment losses (as measured by the Policy Index) in excess of 12% in any one year is no greater than 2.5% (or two standard deviations below the expected return).
To achieve these objectives, the Board meets at least once per year to review the overall asset allocation plan and investment policies for the System. Implementation of investment policies is accomplished through the use of external investment management fi rms who act as agents for the System and through internal investment managers. The Board also retains various investment consultants to assist with the formulation and implementation of investment policies.
Operations
The Board provides oversight of investment activities through the Finance Committee that makes recommendations to the Board. The Finance Committee generally conducts seven meetings per year and may meet more frequently as needed. Investment Offi ce staff, as well as external investment advisors and Investment Accounting staff, assist the Board in achieving investment objectives and monitoring compliance with investment policies. For the fi scal year ended June 30, 2009, Wilshire Associates Incorporated (Wilshire) served as the general investment consultant to assist the Board in formalizing investment objectives, establishing an asset allocation plan, conducting investment advisor searches, reviewing performance, and commenting on compliance with investment policies. In addition, the Board utilized Courtland Partners, Ltd. as a real estate consultant and Portfolio Advisors, LLC as an alternative investment consultant. Alternative investments generally consist of investments in private debt, private equity, and venture capital limited partnerships. Investment Offi ce staff implement the investment decisions within the Investment Policy Statement, Objectives and Guidelines regarding asset allocation, security selection, and other objectives directed by the Board.
The Board employs both external investment management fi rms and internal investment managers to manage the investment portfolio of the System. At fi scal year end, 54 external public market investment management fi rms were managing $16.8 billion in assets of the System, $13.3 billion in assets were managed by the System’s internal investment managers, and the remaining $13.2 billion in assets were managed by numerous emerging, alternative investment, and real estate managers. The performance of each external investment management fi rm and each internal manager is monitored quarterly against a pre-established benchmark as well as the performance of its peer group.
Asset Allocation
The Board reviews the long-term asset allocation targets of the System at least annually, usually in the fi rst quarter of the calendar year. The Board will consult with its actuary, consultants, Investment Offi ce staff, and other sources of information it deems appropriate in formulating the asset allocation plan. The Board believes that the level of risk assumed by the System is largely determined by the Board’s strategic asset allocation plan. The Board, in determining its long-term asset allocation, shall take the following factors into consideration:

Investment Section
Page 80
The System’s investment time horizon;· The demographics of the plan participants and benefi ciaries;· The cash fl ow requirements of the System;· The actuarial assumptions approved by the Board;· The funded status of the System;· The Board’s willingness and ability to take risk; and,· The employers’ (Commonwealth and school districts) fi nancial strength.
In establishing the asset allocation for the System, the Board considers capital market expectations for expected return, volatility, and asset class correlations as prepared by its general investment consultant. The current long-term, top-down asset allocation targets of the Board are discussed in the following paragraphs.
The long-term target allocation as of June 30, 2009 included an equity target allocation of 31.0% consisting of publicly traded stocks. Specifi c targets have been established for U.S. equity exposure (13.2%) and international equity exposure (17.8%). Within the U.S. equity target, the portfolios are diversifi ed between large, small, and micro capitalization investment managers, and growth and value investment managers. The international equity exposure includes both developed and emerging markets portfolios as well as large and small capitalization investment managers.
The fi xed income target allocation of 29.5% consisted of U.S. core fi xed income exposure (7.5%), leveraged Treasury Infl ation-Protected Securities exposure (5.0%), high yield and opportunistic fi xed income exposure (9.0%), global fi xed income exposure (3.0%) and cash (5.0%). Historically, PSERS had an allocation of 0.0% to cash, however, given the known and potential cash fl ow requirements of the System, the Board, Staff, and Wilshire deemed it prudent to have an allocation to this asset class. Within these categories, all sectors of the bond market are represented.
The real estate target allocation of 11.0% consisted primarily of opportunistic limited partnerships and publicly traded real estate securities.
Alternative investments had a target of 17.0%. The primary vehicle used to invest funds in this asset class is the limited partnership. The partnerships are established by individual management groups that have been selected by the System for the purpose of investing in and managing private equity and unlisted subordinated debt positions on behalf of PSERS and other limited partners.
The absolute return target allocation of 7.5% consisted primarily of investment managers retained by the System to generate positive returns over time independent of how the equity, fi xed income, and commodity markets perform. Strategies implemented to achieve this goal include, but are not limited to, global macro, currency, and relative value strategies such as equity long/short. The absolute return program is included in the allocation to generate returns equal to or greater than the targeted actuarial rate of return of 8.0% and to diversify the System’s total portfolio risk.
The commodities target allocation of 4.0% consisted primarily of commodity futures and commodity and commodity-related publicly traded stocks. Commodities are included in the allocation to diversify the System’s total portfolio risk.

Investment Section
Page 81
Investment Results
As of June 30, 2009, the fair value of the investment portfolio was $43.3 billion, a decrease of $20.6 billion from last year’s value. This decrease came primarily from net investment losses ($16.2 billion) and benefi t payments in excess of member and employer contributions ($3.3 billion) which was partially offset by net changes in other investment assets and liabilities ($1.1 billion). The investment portfolio, as invested, was composed of 32.4% common and preferred stocks (equity), 28.6% fi xed income investments, 17.4% alternative investments, 9.9% real estate, 7.5% absolute return portfolios, and 4.2% commodities at June 30, 2009. The table immediately following the Investment Overview illustrates a more detailed description of the investment portfolio’s asset classes in dollars and as a percentage of the total investment portfolio.
The past fi scal year saw the worst economic contraction in the United States since the Great Depression. The U.S. Gross Domestic Product (GDP) dropped by 2.7%, 5.4%, 6.4%, and 0.7% in the third quarter 2008, fourth quarter 2008, fi rst quarter 2009, and second quarter 2009, respectively. The U.S. unemployment rate hit a cyclical low of 4.4% in March 2007, increased to 9.8% in September 2009, and is projected by some to eventually reach or exceed 10%. Coming into the fi scal year, the recent credit crises that started with the popping of the housing bubble and subprime meltdown reached a crescendo in September 2008 with numerous failures of large fi nancial institutions. These included the federal government taking over Fannie Mae and Freddie Mac, the Lehman Brothers Holdings, Inc. bankruptcy, the AIG bailout by the federal government, and the Washington Mutual bankruptcy. These events and other fi nancial stresses were driven by an extreme contraction in liquidity. In response, the U.S. Federal Reserve (the Fed) lowered the target Federal Funds rate to a 0.00% - 0.25% fl oor in the fourth quarter of 2008 and instituted numerous other quantitative easing programs to supply liquidity to the market. The Fed embarked on quantitative easing programs since they could not cut interest rates below 0.00%. The U.S. government started programs to help fi ll the void created by reduced economic activity in the private sector, such as the $787 billion fi scal stimulus package in February 2009. The size of the government purchases and guarantees was estimated by one of the System’s managers to be over $29 trillion, or 200% of GDP.
A logical question arises as to how we have arrived here. While no one knows for certain, it appears that the credit/fi nancial crisis can be traced back to lax underwriting standards for home loans during this decade which spawned a housing and credit bubble. This bubble allowed consumers to borrow against their homes, which signifi cantly reduced homeowners’ equity value (defi ned as fair market value of the house minus the outstanding mortgage balance). This borrowing helped to push the U.S. total debt as a percentage of GDP to 350%, much higher than the levels reached during the Great Depression (250%) and allowed the consumer to spend beyond his/her means as the savings rate in the United States went negative. Housing prices peaked in July 2006 and fell 31.3% by June 2009 according to the S&P/Case-Shiller Composite-20 Home Price Index which measures home prices in 20 metropolitan markets. This drop in home prices has led to a large number of consumers having zero or negative equity in their homes. As the ability of consumers to borrow against the equity in their homes ended, consumption slowed and the unemployment rate increased leading to a signifi cant contraction in economic activity in the United States which spilled over to the world markets. The slowdown in spending was exacerbated by an estimated $14 trillion decline in consumer net worth. This contraction in consumer net worth led to an increased savings rate, which further decreased monies that can be used for consumption.

Investment Section
Page 82
In this environment, equity, real estate, and commodity markets around the world had sharply negative returns during the fi scal year. The Morgan Stanley Capital International (MSCI) U.S. Broad Market Index, a U.S. equity index, returned -26.22% during the fi scal year. The past fi scal year saw the worst quarterly loss since the fourth quarter of 1987 (-22.76% in the quarter ended December 31, 2008) and the worst monthly loss since the crash of October 1987 (-17.65% in October 2008). Foreign markets in local currency terms fared equally as badly as the MSCI All-Country World (ACW) ex. U.S. Investable Market Index, an international equity index, which returned -24.12% when hedged back to the U.S. dollar. However, the unhedged MSCI ACWI ex. U.S. index returned -30.50%, much worse than the hedged index due to the strength of the U.S. dollar. The Venture Economics median return, a benchmark for alternative investments that represents the median performance of the venture capital/private equity industry listed in the Investment Benchmark Reports on Venture Capital and Buy-outs produced by Venture Economics, returned -13.36% during the fi scal year as these investments were written down to prices comparable to losses in the public equity markets. According to the FTSE EPRA/NAREIT Global Real Estate Index, a free-fl oat index designed to track the performance of listed real estate companies and real estate investment trusts worldwide, global publicly traded real estate securities (PTRES) returned -35.22% during the past fi scal year. PTRES performance suffered due to the deterioration of credit markets, uncertain asset values, and the weakened outlook for the global economy. The Dow Jones – UBS Commodity Index, an index of 19 highly liquid and diversifi ed commodities, returned -47.08% during the fi scal year as the severe economic contraction led to a decrease in economic growth projections and a resulting slowdown in demand for fuel and raw materials.
Fixed income markets performed better in this environment as interest rates fell and investors looked to reduce risk. The Barclays U.S. Universal Index, a U.S. fi xed income index, was up 4.93% and the Barclays Multiverse Index, a global fi xed income index, was up 2.54%. Returns in both of these indexes were driven by the Fed reducing the Fed Funds rate as well as falling infl ation expectations due to the economic contraction. The Barclays U.S. TIPS Index, an index of U.S. treasury infl ation protection securities, returned -1.11% driven by falling infl ation expectations and slightly higher real yields.
As a result of the negative returns from domestic and international stock portfolios, alternative investments, real estate, and commodities, the System generated a total return of -26.54% for the one-year period ended June 30, 2009. This return fell short of the total fund Policy Index return of -20.67% by 587 basis points. Annualized total returns for the three-, fi ve-, and ten-year periods ended June 30, 2009 were -4.26%, 2.68%, and 3.28%, respectively. The three-year returns ending June 30, 2009 fell short of the total fund Policy Index returns by 151 basis points while the fi ve- and ten-year returns ending June 30, 2009 exceeded the total fund Policy Index returns by 17 and 82 basis points, respectively.
Wilshire calculates the total investment return of the System as well as the performance of each external investment management fi rm and each internal investment manager employed by the Board to invest the System’s assets. Performance is calculated using a time-weighted return methodology.

Investment Section
Page 83
Annualized Total Returns (%)Net of Fees
Ended June 30, 20091 Year 3 Years 5 Years 10 Years
PSERS Total PortfolioTotal Fund Policy IndexMedian Public Defi ned Benefi t Plan (DBP) Fund Universe (Wilshire Database)
-26.54 -20.67 -19.47
-4.26 -2.75 -3.61
2.682.512.39
3.28 2.46 2.71
PSERS Domestic Stock PortfoliosDomestic Equity Policy Index (1)Median Public DBP Fund Universe - Domestic Equities (Wilshire Database)
-29.37-26.30-27.17
-9.90 -8.09 -8.95
-2.81-1.58-2.03
-0.49-1.31 -0.94
PSERS International Stock PortfoliosInternational Equity Policy Index (2)Median Public DBP Fund Universe - International Equities (Wilshire Database)
-25.66-27.01-31.11
-4.15 -4.98 -6.81
6.14 5.20 3.45
4.40 3.06 2.78
PSERS Domestic Fixed Income PortfoliosDomestic Fixed Income Policy Index (3)Median Public DBP Fund Universe - Domestic Bonds (Wilshire Database)
-1.00 4.75 0.67
4.13 6.54 4.62
4.21 5.17 4.32
5.84 6.06 5.57
PSERS Global Fixed Income PortfoliosGlobal Fixed Income Policy Index (4)Median Public DBP Fund Universe - Global Bonds (Wilshire Database)
0.98 2.54 1.38
5.17 6.46 5.17
4.98 5.40 4.98
5.80 6.03 5.88
PSERS Commodity PortfoliosDow Jones-UBS Commodity Index
-45.09-47.08
N/AN/A
N/AN/A
N/AN/A
PSERS Real Estate (5)Blended Real Estate Index (6)Median Public DBP Fund Universe - Real Estate (Wilshire Database)
-42.68-16.35-31.42
-10.95 1.46 -5.41
4.268.525.44
7.55 9.33 7.92
PSERS Alternative Investments (5)Venture Economics Median Return, Vintage Year WeightedMedian Public DBP Fund Universe - Private Equity (Wilshire Database)
-27.23 -13.36 -25.76
5.67 0.59 2.97
12.52 3.2110.25
8.89 1.13 6.16
(1) MSCI U.S. Broad Market Index effective April 1, 2009; previously was the Dow Jones Wilshire 5000 Index.(2) MSCI All Country World ex. U.S. Investable Market Index effective July 1, 2008; previously was the MSCI ACW ex. U.S.
Index. The benchmark was 30% hedged to the U.S. dollar from July 1, 2006 to March 31, 2009; otherwise, the benchmark is unhedged.
(3) Returns presented are a blend of the Barclays Capital U.S. Universal Index (34.9%), Barclays Capital U.S. TIPS Index (Series-L) (23.2%), and Barclays U.S. High Yield Index (41.9%) effective April 1, 2009. The weights to these indexes have varied in previous quarters. Prior to April 1, 2007, the Barclays Capital Aggregate Bond Index was used in place of the Barclays Capital U.S. Universal Index.
(4) Barclays Multiverse Index effective April 1, 2007; previously was the Barclays Global Aggregate Bond Index.(5) Returns reported on a one-quarter lag, except for publicly traded real estate security investments.(6) Returns presented are a blend of the FTSE EPRA/NAREIT Global Real Estate Index (13.6%) and the NCREIF Index (86.4%).
The NCREIF Index is reported on a one-quarter lag. Prior to October 1, 2007, the Dow Jones Wilshire Real Estate Securities Index was used in place of the FTSE EPRA/NAREIT Global Real Estate Index.
The following table provides the System’s total investment return for each major asset class and the total portfolio, including, where applicable and available, respective benchmark indexes used by asset class and median performance by asset class:

Investment Section
Page 84
The System also is involved in a securities lending program administered by The Bank of New York Mellon Corporation. This program is designed to provide incremental income to the System by lending securities in the System’s portfolio to securities dealers in exchange for either cash collateral, which can be reinvested to generate income, or non-cash collateral plus a cash fee. This program generated $26.8 million in net losses during the year due to losses in the collateral reinvestment pool, primarily from investments in Sigma Finance, Inc., a structured investment vehicle that went bankrupt.
Accomplishments
The System decreased the actuarial investment rate of return assumption from 8.50% to 8.25% effective for the June 30, 2008 actuarial valuation. The Board also decreased the rate of return assumption further from 8.25% to 8.00% for the June 30, 2009 actuarial valuation. This was in expectation that the prospective returns from investment markets will be lower due to anticipated slower growth and a deleveraging of the U.S. economy. This 0.50% decrease has allowed the System to modify its asset allocation plan during FY 2009 to achieve this new return target with lower overall risk.
The System added and fully funded an allocation to cash during the fourth quarter of FY 2009 to provide for current and future liquidity needs. Given the current commitments the System has to alternative investments and real estate, as well as monthly benefi t payments in excess of employer and member contributions, the System felt it prudent to allocate to cash. This allocation allows the System to fund these needs without selling assets at inopportune times.
The System continued its efforts to diversify its market exposures during the fourth quarter of FY 2009 as the target allocation to absolute return mandates, an asset class used as a risk diversifi er added during the current fi scal year, was fully funded.
The System continued its multi-year project to implement an independent accounting book of record for the System’s investment transactions and holdings. In FY 2009, the System continued the process of migrating its real estate and alternative investment portfolios to its internal accounting software provided by Financial Control Systems, Inc. and continued to develop various management reports using the internal accounting software.
Market Update
Subsequent to the close of FY 2009, the equity markets continued a broad rally that started in the middle of March 2009 as the domestic and international economies appeared to be bottoming and a number of “green shoots”, or positive economic statistics, were starting to be priced by the market. For the quarter ended September 30, 2009, the MSCI U.S. Broad Market Index was up 16.47% while the MSCI ACW ex. U.S. Investable Market Index was up 20.05%. Fixed income markets also performed well as credit spreads continued to narrow and interest rates remained low. The Barclays U.S. Universal Index was up 4.48% during the quarter while the Barclays Multiverse Index was up 6.48%. Commodities also had a positive return for the quarter as the Dow Jones – UBS Commodity index was up 4.25%. The System’s assets have increased by over $2 billion during the quarter ended September 30, 2009 as a result of positive investment performance offset partially by benefi t payments in excess of member and employer contributions. The estimated return for the quarter was approximately 8.50%.

Investment Section
Page 85
Summary
The System had a very challenging fi scal year ended June 30, 2009. The worst economic contraction since the Great Depression, defl ating housing bubble, rising unemployment rate, and the credit crisis led to negative returns for most risk assets, including global equity markets, alternative investments, real estate, and commodities. For the fi scal year ended June 30, 2009, the System was unable to meet or exceed its long-term actuarial investment rate of return assumption of 8.0% on a three-, fi ve-, or ten-year basis. While we believe that we are in the midst of a challenging period for asset returns, we continue to believe that the System’s asset allocation is structured to generate a long-term return that meets or exceeds the targeted actuarial rate of return assumption of the System for years to come.
Alan H. Van Noord, CFAChief Investment Offi cer

Investment Section
Page 86
Pension investments Fair Value ($) % Fair ValueCommon and preferred stock (Equity): Domestic common and preferred stock $ 3,073,854 7.1% Collective trust funds 3,929,724 9.1% International common and preferred stock 6,879,794 16.0% Subtotal per Statement of Plan Net Assets 13,883,372 32.2% Net Asset Allocation Adjustment* 100,719 0.2%
Total Common and preferred stock - Asset Allocation Basis 13,984,091 32.4%Fixed income: Domestic mortgage-backed securities 3,740,617 8.9% U.S. government and agency obligations 1,416,505 3.3% Domestic corporate and taxable municipal bonds 2,271,173 5.3% Miscellaneous domestic fi xed income 456,144 1.1% Collective trust funds 2,529,667 5.9% International fi xed income 919,443 2.1% Subtotal per Statement of Plan Net Assets 11,333,549 26.6% Net Asset Allocation Adjustment* 870,053 2.0%Total Fixed income - Asset Allocation Basis 12,203,602 28.6%Real estate: Equity real estate 3,493,360 8.1% Directly-owned real estate 205,993 0.5% Subtotal per Statement of Plan Net Assets 3,699,353 8.6%
Net Asset Allocation Adjustment* 545,657 1.3%Total Real estate - Asset Allocation Basis 4,245,010 9.9%Alternative investments: Private equity 5,047,201 11.7% Private debt 3,283,060 7.6% Venture capital 698,671 1.6% Subtotal per Statement of Plan Net Assets 9,028,932 20.9% Net Asset Allocation Adjustment* -1,520,666 -3.5%Total Alternative investments - Asset Allocation Basis 7,508,266 17.4%Absolute return: Net Asset Allocation Adjustment* 3,237,921 7.5%Total Absolute return - Asset Allocation Basis 3,237,921 7.5%Commodities: Net Asset Allocation Adjustment* 1,820,575 4.2%Total Commodities - Asset Allocation Basis 1,820,575 4.2%
Pension investments - Asset Allocation Basis $ 42,999,465 100.0%
Net pension investment payable 150,159
Pension investments per Statement of Plan Net Assets $ 43,149,624
Postemployment Healthcare investments $ 194,311 100.0%
Portfolio Summary StatisticsAsset Allocation
As of June 30, 2009(Dollar Amounts in Thousands)
* Includes Short-term investments which are allocated to the asset class of the investment manager which holds them, reclassifi cations of certain investments between asset classes and investment receivables\payables to adjust the Statement of Plan Net Assets’ classifi cation to the basis used to measure Asset Allocation. See the table and graph which follow.
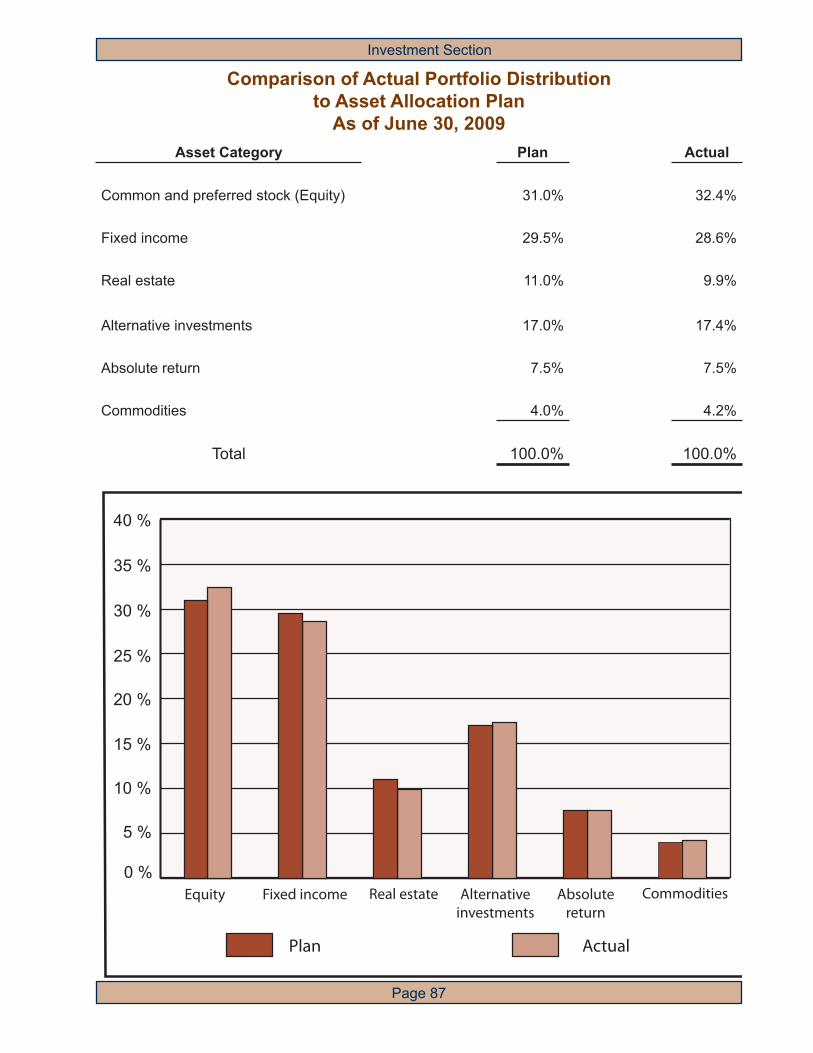
Investment Section
Page 87
Asset Category Plan Actual
Common and preferred stock (Equity) 31.0% 32.4%
Fixed income 29.5% 28.6%
Real estate 11.0% 9.9%
Alternative investments 17.0% 17.4%
Absolute return 7.5% 7.5%
Commodities 4.0% 4.2%
Total 100.0% 100.0%
Comparison of Actual Portfolio Distributionto Asset Allocation Plan
As of June 30, 2009
Plan Actual
Equity Fixed income Real estate Alternativeinvestments
Absolutereturn
0 %
5 %
10 %
15 %
20 %
25 %
30 %
35 %
40 %
Commodities

Investment Section
Page 88
Domestic Common and Preferred Stock10 Largest Holdings in Descending Order by Fair Value
As of June 30, 2009(Dollar Amounts and Shares in Thousands)
Description No. of Shares
Fair
Value ($)Security Capital Preferred Growth 16,299 137,374Exxon Mobil Corporation 1,342 93,786Wyeth 1,678 76,159Chevron Corporation 633 41,961Microsoft Corporation 1,667 39,619Johnson & Johnson 592 33,620Procter & Gamble Company 624 31,866AT&T Inc. 1,229 30,534IBM 285 29,714JP Morgan Chase & Company 834 28,454Total of 10 Largest Holdings 543,087Total System Holdings - Domestic Common and Preferred Stock 3,073,854
Portfolio Distribution 10 Year Trend(Fair Value - Dollar Amounts in Billions)
The following lists of portfolio detail statistics present the ten largest holdings by descending order of fair value for the largest asset classes. Information on the complete holdings of the System is available by writing to the Public School Employees’ Retirement System, Press Secretary, P. O. Box 125, Harrisburg, PA 17108.
2009
Fixed incomeShort-term Equity Alternativeinvestments
Real estate
2008
2007
2006
2005
2004
2003
2002
2001
2000
$49.7
$54.1
$44.5
$43.7
$43.3
$49.0
$52.9
$58.7
$68.5
$63.9

Investment Section
Page 89
Collective Trust Funds - Common and Preferred Stock10 Largest Holdings in Descending Order by Fair Value
As of June 30, 2009(Dollar Amounts and Shares in Thousands)
DescriptionNo. of Shares
FairValue ($)
Bridgewater Pure Alpha Fund II Ltd. 675 846,817Barclays Global Ascent Ltd. 500 630,226AQR Offshore Multi-Strategy Fund Ltd. 8 588,229First Quadrant Global Macro Fund Ltd. 5,505 511,680Wellington Trust Company Commodities II Portfolio 29,542 224,224Barclays Global Investors Capital Structure Investments Fund Ltd. 198 203,025Boston Company US Micro Cap Hedge Fund 149 181,712Barclays Global Investors 32 Capital Fund Ltd. 158 141,939Barclays Global Investors Emerging Markets Alpha Advantage Fund Ltd. 85 126,265Barclays Global Investors Emerging Markets Strategic Insights Fund 4,014 125,359Total of 10 Largest Holdings 3,579,476Total System Holdings - Collective Trust Funds- Common and Preferred Stock 3,929,724
International Common and Preferred Stock10 Largest Holdings in Descending Order by Fair Value
As of June 30, 2009(Dollar Amounts and Shares in Thousands)
DescriptionNo. of
SharesFair
Value ($)Nestle SA 2,228 83,822BP PLC 9,804 77,145Royal Dutch Shell Class A 2,503 64,618HSBC Holdings PLC 6,643 57,641Toyota Motor Corporation 1,297 49,326Roche Holding AG 357 48,536Vodafone Group PLC 25,015 48,281BHP Billiton Limited 1,628 45,695Novartis AG 1,111 44,998Petroleo Brasileiro SA 1,164 38,830Total of 10 Largest Holdings 558,892Total System Holdings - International Common and Preferred Stock 6,879,794

Investment Section
Page 90
Fixed Income10 Largest Holdings in Descending Order by Fair Value
As of June 30, 2009(Dollar Amounts and Shares in Thousands)
DescriptionMaturity
DateInterest Rate (%)
Par Value($) or No. of Shares
FairValue ($)
Brigade Leveraged Capital Fund N/A N/A 754 804,389 Barclays US Extended Core Global Alpha Fund N/A N/A 589 636,746 Bridgewater Int’l Infl ation-Linked Bond Fund N/A N/A 332 354,044 Bridgewater U.S. Infl ation-Linked Bond Fund N/A N/A 243 239,873 PIMCO Abs. Return Strategy V Offshore Fund N/A N/A 156 173,898 U.S. Treasury - Infl ation Index 01/15/15 1.625 173,084 172,488U.S. Treasury - Infl ation Index 01/15/25 2.375 165,411 170,011PIMCO Global Credit Opport.Offshore Fund N/A N/A 143 145,556U.S. Treasury - Infl ation Index 01/15/11 3.500 122,498 127,972U.S. Treasury - Infl ation Index 01/15/26 2.000 108,168 105,903Total of 10 Largest Holdings 2,930,880Total System Holdings - Fixed Income 11,333,549
Postemployment Healthcare Investments10 Largest Holdings in Descending Order by Fair Value
As of June 30, 2009(Dollar Amounts in Thousands)
DescriptionMaturity
DateInterest Rate (%)
ParValue ($)
FairValue ($)
PSERS Short-Term Investment Fund Various Various 111,746 111,746M & T Bank Repurchase Agreement 07/01/09 0.009 21,433 21,433M & T Bank Repurchase Agreement 07/01/09 0.009 13,055 13,055FHLMC Multiclass 2090 Class PK 10/15/13 5.490 3,785 3,968FHLMC Multiclass 2759 Class GB 04/15/25 5.000 3,000 3,074FHLMC Multiclass 1609 Class FA 02/15/22 6.500 2,633 2,664FHLMC Multiclass 2608 Class FJ 03/15/17 0.688 2,334 2,321FHLMC Multiclass 2638 Class FA 11/15/16 0.688 2,287 2,266FHLMC Multiclass 2960 Class BG 06/15/21 5.000 2,158 2,217FHLMC Multiclass 2611 Class UB 06/15/16 4.000 1,977 2,023Total of 10 Largest Holdings 164,767Total System Holdings - Postemployment Healthcare Investments 194,311

Investment Section
Page 91
Comparison of Investment Activity IncomeFor Fiscal Years Ended June 30, 2009 and 2008
(Dollar Amounts in Thousands)
Investing Activities 2009 2008
Net depreciation in fair value of investments $ (17,008,184) $ (3,763,381)
Short-term 58,958 149,194
Fixed income 587,007 820,338
Common and preferred stock 500,001 763,615
Real estate 92,515 437,880
Alternative investments 75,776 167,052
Total investment activity income (loss) $ (15,693,927) $ (1,425,302)
20082009
$ - 20
$ - 4
$ - 6
$ - 8
$ - 10
$ - 12
$ - 14
$ - 16
$ - 18
$ 4
$ - 2
$ 2
$ 0
Netdepreciation in fair value
Fixedincome
Commonand preferred
stock
Short-term Realestate
Alternativeinvestments
(Dollar Amounts in Billions)
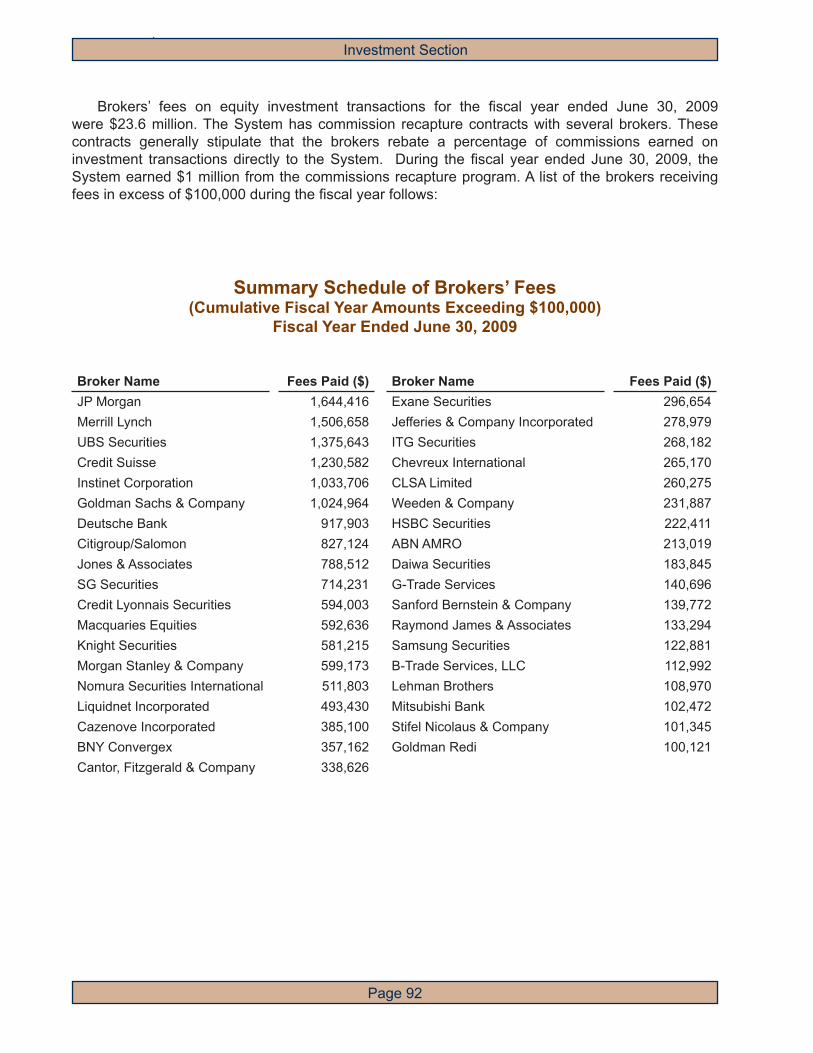
Investment Section
Page 92
Brokers’ fees on equity investment transactions for the fi scal year ended June 30, 2009 were $23.6 million. The System has commission recapture contracts with several brokers. These contracts generally stipulate that the brokers rebate a percentage of commissions earned on investment transactions directly to the System. During the fi scal year ended June 30, 2009, the System earned $1 million from the commissions recapture program. A list of the brokers receiving fees in excess of $100,000 during the fi scal year follows:
Summary Schedule of Brokers’ Fees(Cumulative Fiscal Year Amounts Exceeding $100,000)
Fiscal Year Ended June 30, 2009
Broker Name Fees Paid ($) Broker Name Fees Paid ($)JP Morgan 1,644,416 Exane Securities 296,654Merrill Lynch 1,506,658 Jefferies & Company Incorporated 278,979UBS Securities 1,375,643 ITG Securities 268,182Credit Suisse 1,230,582 Chevreux International 265,170Instinet Corporation 1,033,706 CLSA Limited 260,275Goldman Sachs & Company 1,024,964 Weeden & Company 231,887Deutsche Bank 917,903 HSBC Securities 222,411Citigroup/Salomon 827,124 ABN AMRO 213,019Jones & Associates 788,512 Daiwa Securities 183,845SG Securities 714,231 G-Trade Services 140,696Credit Lyonnais Securities 594,003 Sanford Bernstein & Company 139,772Macquaries Equities 592,636 Raymond James & Associates 133,294Knight Securities 581,215 Samsung Securities 122,881Morgan Stanley & Company 599,173 B-Trade Services, LLC 112,992Nomura Securities International 511,803 Lehman Brothers 108,970Liquidnet Incorporated 493,430 Mitsubishi Bank 102,472Cazenove Incorporated 385,100 Stifel Nicolaus & Company 101,345BNY Convergex 357,162 Goldman Redi 100,121Cantor, Fitzgerald & Company 338,626

Investment Section
Page 93
Professional ConsultantsExternal Investment Advisors
As of June 30, 2009
Absolute Return Managers
♦ Acorn Derivatives Management Corporation♦ AQR Capital Management, LLC♦ Barclays Global Investors, N.A.♦ Boston Company Asset Management, LLC (The)♦ Bridgewater Associates, Inc.♦ First Quadrant♦ FX Concepts, Inc.♦ Pacifi c Investment Management Company
U.S. Style-Oriented Small Cap Equity Managers
♦ Emerald Advisers, Inc.♦ First Pacifi c Advisors, Inc.
U.S. Micro Cap Equity Managers
♦ Donald Smith & Company, Inc.♦ NorthPointe Capital, LLC♦ Oberweis Asset Management, Inc.♦ Thomson Horstmann & Bryant, Inc.♦ Turner Investment Partners, Inc.
Publicly-Traded Real Estate Securities Managers
♦ Cohen & Steers Capital Management, Inc.♦ European Investors, Inc.♦ LaSalle Investment Management♦ Morgan Stanley Investment Management, Inc.♦ Security Capital Research & Management, Inc.
Non-U.S. Large Cap Equity Managers
♦ Baillie Gifford Overseas, Ltd.♦ Barclays Global Investors, NA♦ Marathon Asset Management Ltd.♦ Martin Currie, Inc.♦ Mercator Asset Management, LP
Non-U.S. Small Cap Equity Managers
♦ Acadian Asset Management♦ AXA Rosenberg Investment Management, LLC♦ Batterymarch Financial Management, Inc.

Investment Section
Page 94
♦ GlobeFlex Capital, LP♦ Munder Capital Management♦ Oberweis Asset Management, Inc.♦ Pyramis Global Advisors♦ Victory Capital Management♦ Wasatch Advisors, Inc.
Non-U.S. Emerging Markets Equity Managers
♦ Batterymarch Financial Management, Inc.♦ Boston Company Asset Management, LLC (The)♦ Templeton Investment Counsel, Inc.♦ Wasatch Advisors, Inc.♦ Wellington Management Company, LLP♦ William Blair & Company, LLC
Enhanced Commodity Index Managers
♦ Credit Suisse Asset Management, LLC♦ Neuberger Berman Alternative Fund Management, LLC
Full Discretion Commodity Managers
♦ Deutsche Asset Management♦ Schroders Investment Management North America♦ Wellington Management Company, LLP
U.S. Core Plus Fixed Income Managers
♦ Aberdeen Asset Management, Inc.♦ Barclays Global Investors, NA♦ BlackRock Financial Management, Inc.♦ Pacifi c Investment Management Company♦ Western Asset Management Company
U.S. High Yield Fixed Income Manager
♦ MacKay-Shields Financial Corporation
Global Core Plus Fixed Income Managers
♦ Aberdeen Asset Management, Inc.♦ Fischer Francis Trees & Watts, Inc.♦ Rogge Global Partners
Professional Consultants (Continued)
Non-U.S. Small Cap Equity Managers (Continued)

Investment Section
Page 95
Emerging Markets Debt Manager
♦ Franklin Templeton Investments
Global Treasury Infl ation - Protected Securities Manager
♦ Bridgewater Associates, Inc
Active Currency Hedging Overlay Program Manager
♦ Pareto Investment Management, Ltd.
LIBOR-Plus Short-Term Investment Manager
♦ BlackRock Financial Management, Inc.
Credit Opportunities Managers
♦ BlackRock Mortgage (Offshore) Investors, LP♦ Brigade Leveraged Capital Structures Offshore, Ltd.♦ Hyperion Brookfi eld Asset Management, Inc.♦ LBC Credit Partners II, LP♦ Oaktree Loan Fund 2x, LP♦ Sankaty Credit Opportunities IV, LP♦ Sankaty Managed Account (PSERS), LP♦ TCW Asset Management Company♦ TCW Credit Opportunities Fund, LP
Real Estate Advisors
♦ Charter Oak Advisors, Inc.♦ GF Management, Inc.♦ Grandbridge Real Estate Capital, LLC♦ Grosvenor Investment Management U.S., Inc. ♦ L&B Realty Advisors, LLP
Real Estate Partnerships
♦ Apollo European Real Estate Fund III, LP♦ Apollo Real Estate Finance Corporation♦ AREFIN Co-Invest Corporation♦ AvalonBay Value Added Fund I & II, LP♦ Avenue Real Estate Fund Parallel, LP♦ Beacon Capital Strategic Partners V, LP♦ Berwind Investment Partnership IV, V & VI, LP♦ Blackstone Real Estate Partners V & VI.TE.1, LP♦ BPG Co-Investment Partnership, LP♦ Broadway Partners Real Estate Fund III, LP♦ Cabot Industrial Value Fund III, LP
Professional Consultants (Continued)

Investment Section
Page 96
♦ Carlyle Europe Real Estate Partners III-A, LP♦ Carlyle Realty Partners III, IV & V, LP♦ Centerline Diversifi ed Risk CMBS Fund I & II, LLC♦ Centerline High Yield CMBS Fund III, LLC♦ Centerline Real Estate Special Situations Mortgage Fund, LLC♦ Cornerstone Patriot Fund, LP♦ CS Strategic Partners IV RE, LP♦ CSFB Strategic Partners II & III RE, LP♦ DLJ Real Estate Capital Partners II, III & IV, LP♦ DRA Growth and Income Fund VI, LLC♦ Fillmore West Fund, LP♦ Five Arrows Realty Securities V, LP♦ Fortress Investment Fund I, IV & V, LP♦ Hines U.S. Offi ce Value Added Fund, LP♦ JPMCB Strategic Property Fund♦ Legg Mason Real Estate Capital I & II, Inc.♦ Lehman Brothers Real Estate I, II & III, LP♦ LEM Real Estate Mezzanine Fund II, LP♦ LF Strategic Realty Investors I & II, LLC♦ Lubert-Adler Real Estate Fund II, III, IV, V & VI, LP♦ Madison Marquette Retail Enhancement Fund, LP♦ MGPA Asia Fund III, LP♦ MGPA Europe Fund III, LP♦ Morgan Stanley Real Estate Fund II, LP♦ Morgan Stanley Real Estate Fund IV Special Domestic, LP♦ Morgan Stanley Real Estate Fund IV, V, & VI Special International, LP♦ Morgan Stanley Real Estate Fund V Special U.S., LP♦ Morgan Stanley Real Estate Fund VII Global, LP♦ O’Connor North American Property Partners I & II, LP♦ Paladin Realty Latin America Investors III, LP♦ Peabody Global Real Estate Partners, LP♦ Prime Property Fund, LLC♦ PRISA♦ ProLogis North American Industrial Fund, LP♦ RCG Longview Debt Fund IV, LP♦ RCG Longview Equity Fund, LP♦ RREEF America REIT II, Inc.♦ Stockbridge Real Estate Fund I, II & III, LP♦ Strategic Partners Value Enhancement Fund, LP♦ UBS (US) Trumbull Property Fund, LP♦ Westbrook Real Estate Fund I, LP♦ Whitehall Street Real Estate V, VI, VII, & VIII , LP♦ William E. Simon & Sons Realty Partners, LP
Farmland Advisor
♦ Prudential Agricultural Group
Professional Consultants (Continued)
Real Estate Partnerships (Continued)

Investment Section
Page 97
Private Equity/Venture Capital Partnerships
♦ ABS Capital Partners II, LP♦ Actis Emerging Markets 3, LP♦ Adams Capital Management, LP♦ Aisling Capital Partners II & III, LP♦ Allegheny New Mountain Partners, LP♦ Apax Europe VII, LP♦ Baring Asia Private Equity Fund III & IV, LP♦ BG Media Investors, LP♦ Blue Point Capital Partners (B) I & II, LP♦ Bridgepoint Capital II Partnership, LP♦ Bridgepoint Europe IA, IIA, IIIA and IV , LP♦ Bruckmann, Rosser, Sherrill & Company, LP♦ Capital International Private Equity Fund V, LP♦ Catterton Growth Partners, LP♦ Catterton Partners V & VI, LP♦ Cinven Fund (Fourth), LP (The)♦ Clarity Partners I & II, LP♦ Co-Investment 2000 Fund, LP (The)♦ Co-Investment Fund II, LP (The)♦ Credit Suisse First Boston Equity Partners, LP♦ Credit Suisse First Boston International Equity Partners, LP♦ Crestview Capital Partners I, LP♦ Cross Atlantic Technology Fund I & II, LP♦ CSFB Strategic Partners II, III-B, & III-VC, LP♦ CS Strategic Partners Fund IV & IV-VC, LP♦ CVC Capital Partners Asia Pacifi c III, LP♦ CVC European Equity Partners V, LP♦ Deutsche European Partners IV, LP♦ DLJ Merchant Banking Partners III, LP♦ DLJ Strategic Partners, LP♦ Dubin Clark Fund II, LP♦ Edgewater Growth Capital Partners, LP♦ Edgewater Private Equity Fund III, LP♦ Edison Venture Fund III, LP♦ Evergreen Pacifi c Partners I & II, LP♦ First Reserve Fund XI & XII, LP♦ Franklin Capital Associates III, LP♦ Furman Selz Investors II & III, LP♦ Graham Partners Investments (B), LP♦ Green Equity Investors II, LP♦ Greenpark International Investors III, LP♦ Greenwich Street Capital Partners II, LP♦ Halifax Capital Partners, LP♦ Heritage Fund I, LP♦ HSBC Private Equity Fund 6, LP♦ Irving Place Capital Partners II & III, LP♦ Jefferies Capital Partners IV, LP♦ Jefferson Partners Fund IV (PA), LP
Professional Consultants (Continued)

Investment Section
Page 98
♦ KBL Healthcare Ventures, LP♦ KKR 2006 Fund, LP♦ KRG Capital Fund I, II, III & IV, LP♦ Landmark Equity Partners II, III, IV, V, XIII & XIV, LP♦ Landmark Mezzanine Partners, LP♦ Lehman Brothers Communications Investors, LP♦ Lehman Brothers Merchant Banking Partners II, LP♦ Lexington Capital Partners I, LP♦ Lindsay, Goldberg & Bessemer, LP♦ LLR Equity Partners I, II & III, LP♦ Milestone Partners II & III, LP♦ Morgan Stanley Dean Witter Capital Partners IV, LP♦ Navis Asia Fund V, LP♦ NEPA Venture Fund II, LP♦ New Mountain Partners I & III, LP♦ New York Life Capital Partners, I, II, III & IV, LP♦ Nordic Capital VII Beta, LP♦ Novitas Capital I & II, LP♦ P/A Fund (The)♦ PAI Europe III, IV & V, LP♦ Palladium Equity Partners II-A, LP♦ Partners Group Secondary 2008, LP♦ Permira IV, LP♦ Perseus-Soros BioPharmaceutical Fund, LP♦ Platinum Equity Capital Partners-A I & II, LP♦ PNC Equity Partners I & II, LP♦ Providence Equity Partners VI, LP♦ Psilos Group Partners III, LP♦ Quadrangle Capital Partners I & II, LP♦ Quaker BioVentures I & II, LP♦ SCP Private Equity Partners I & II, LP♦ StarVest Partners I & II, LP♦ Sterling Capital Partners, LP♦ Sterling Venture Partners, LP♦ TDH III, LP♦ Tenaya Capital IV-P & V, LP♦ TL Venture III, LP♦ TPG Partners II, V & VI, LP♦ Trilantic Capital Partners IV, LP♦ U.S. Equity Partners II, LP♦ Wicks Communications & Media Partners, LP♦ Willis Stein & Partners, LP
Private Debt Partnerships
♦ Avenue Asia Special Situations Fund II, III & IV, LP♦ Avenue Europe Special Situations Fund, LP
Professional Consultants (Continued)
Private Equity/Ventue Capital Partnerships (continued)

Investment Section
Page 99
♦ Avenue Special Situations Fund II, III, IV& V, LP♦ Cerberus Institutional Partners, LP (Series Two, Three and Four)♦ Gleacher Mezzanine Fund I & II, LP♦ Gold Hill Venture Lending 03-A, LP♦ GSC Partners CDO Investors III & IV, LP♦ GSC Recovery II & III, LP♦ NYLIM Mezzanine Partners Parallel Fund I & II, LP♦ OCM Opportunities Fund VII & VII-B, LP♦ Versa Capital Fund I & II, LP♦ Windjammer Senior Equity Fund III, LP
Public Market Emerging Investment Program Managers
♦ AH Lisanti Capital Growth, LLC♦ Ativo Capital Management, LLC♦ Biondo Group, LLC (The)♦ Conestoga Capital Advisors♦ Denali Advisors, LLC♦ Great Companies, Inc.♦ Hanseatic Management Services, Inc.♦ Harvest Fund Advisors, LLC♦ John Hsu Capital Group, Inc.♦ Opus Capital Management♦ Piedmont Investment Advisors♦ Pugh Capital Management, Inc.♦ Shah Capital Management, Inc.♦ Stillwater Capital Partners, Inc.♦ Zacks Investment Management, Inc.
Alternative Investment Consultant
♦ Portfolio Advisors, LLC
Custodian and Securities Lending Agent
♦ The Bank of New York Mellon Corporation
Investment Accounting Application Service Provider
♦ Financial Control Systems, Inc.
Investment Evaluator and General Investment Consultant
♦ Wilshire Associates, Inc.
Professional Consultants (Continued)
Private Debt Partnerships (continued)

Investment Section
Page 100
Professional Consultants (Continued)
Proxy Voting Agent
♦ Glass, Lewis & Co., LLC
Real Estate Investment Consultant
♦ Courtland Partners, Ltd.

Introduction
- Actuary’s Letter
- Valuation Results
- History of Rates
- Membership Details
Actuarial
- Assumptions and
Methods

Actuarial Section
Page 102
500 Plaza Drive • Secaucus, NJ 07096-1533201.902.2300 • 201.902.2450 (fax)
February 6, 2009
The Retirement BoardPublic School Employees’ Retirement System of Pennsylvania P.O. Box 125Harrisburg, Pennsylvania 17108
Ladies and Gentlemen:
This report presents the results of the annual actuarial valuation of the Public School Employees’ Retirement System of Pennsylvania (Retirement System or PSERS) as of June 30, 2008.
The valuation takes into account all of the promised benefi ts to which members are entitled as of June 30, 2008, including pension and survivor benefi ts, and as required by the Public School Employees’ Retirement Code, 24 Pa. C.S. §8101 et. seq. (Retirement Code) is the basis for the contribution rate for fi scal year 2009/2010.
The valuation was based on the actuarial assumptions and methods as adopted by the Board of Trustees. As adopted by the Board of Trustees at their January 2009 meeting, the valuation interest rate was changed to 8.25% for the June 30, 2008 valuation and to 8.00% for all future valuation years.
The actuarial assumptions and methods for fi nancial reporting meet the parameters set forth in Governmental Accounting Standards Board (GASB) Statements No. 25, 43, and 50, and are unchanged from the prior valuation. The actuarial assumptions and methods for GASB 25 disclosure are the same as for pension funding, except that in fi scal years in which the amortization requirements of the Retirement Code result in an equivalent single amortization period that is longer than 30 years, the GASB 25 amortization payment will be determined based on 30-year level-dollar funding. The Health Insurance funding provisions of the Retirement Code differ from the GASB 43 disclosure retirements. For funding purposes the actuarial liability equals the assets in the health insurance account, and a contribution is determined that will assure the solvency of the account through the third fi scal year following the valuation date. For purposes of GASB 43 disclosure the Health Insurance actuarial liability and normal cost requirements have been determined under the entry age actuarial cost method, with 30-year level dollar funding. (The entry age actuarial cost method meets the GASB 43 parameters for determining actuarial liability and normal cost, and is the cost method specifi ed by the Retirement Code for the PSERS pension plan.)
Actuarial Section
Page 103
The Retirement BoardPublic School Employees’ Retirement System of Pennsylvania February 6, 2009Page 2
Assets and Membership Data
The Retirement System reported the individual data for members of the Retirement System as of the valuation date to the actuary. While we did not verify the data at their source, we did perform tests for internal consistency and reasonableness. The amount of assets in the trust fund taken into account in the valuation was based on statements prepared for us by the Retirement System.
Funding Adequacy
The valuation results determine that the employer contribution rate for fi scal year 2009/2010 is 4.78%. As of June 30, 2008, the total funded ratio of the plan (for Pensions and Health Insurance combined) is 86.0%, based on the accrued liability and actuarial value of assets calculated under the funding requirements of Section 8328 of the Retirement Code.
Financial Results and Membership Data
Detailed summaries of the fi nancial results of the valuation and membership data used in preparing the valuation are shown in the valuation report. The actuary prepared supporting schedules included in the Actuarial and Statistical Section of the PSERS Comprehensive Annual Financial Report (CAFR), and also prepared the trend data schedules included in the Financial Section of the CAFR.
The report does not take into account broad declines in U.S. equity and bond prices, and increases in bond yields, that have occurred after the valuation date. Taking these into account may signifi cantly reduce the market and actuarial value of assets shown. The effect of these events on any funded ratios shown, and on Retirement System calculations, is not known. Retirement System funding and fi nancial accounting rules generally prohibit refl ection of changes in assets and underlying economic conditions that occur after the valuation date.
Qualifi ed actuaries completed the valuation in accordance with accepted actuarial procedures as prescribed by the Actuarial Standards Board. The qualifi ed actuaries are members of the American Academy of Actuaries and are experienced in performing actuarial valuations of public employee retirement systems. To the best of our knowledge, this report is complete and accurate and has been prepared in accordance with generally accepted actuarial principles and practice.
Respectfully submitted,
Janet Cranna, FSA, MAAA, EA Dana Spangher, FSA, MAAA, EA Edward Quinn, MAAA, EA Principal, Consulting Actuary Director, Consulting Actuary Director, Retirement Actuary
JHC/DES:hn

Actuarial Section
Page 104
104
Executive Summary
This report presents the actuarial valuation as of June 30, 2008 for the Public School Employees’ Retirement System of Pennsylvania.
The principal valuation results include:
• The employer contribution rate for fi scal year 2009/2010, which is 4.78%.
• The total funded ratio of the plan determined as of June 30, 2008 under the funding requirements of Section 8328 of the Retirement Code, which is 86.0% based on the accrued liability and the actuarial value of assets for Pensions and Health Insurance as of that date.
• The determination of the actuarial gain or loss as of June 30, 2008, which is a gain of $1.9 billion.
• Annual disclosures as of June 30, 2008 as required by Statements No. 25, 43, and 50 of the Governmental Accounting Standards Board.
The valuation was completed based upon membership and fi nancial data submitted by the Retirement System. Detailed summaries of the fi nancial results of the valuation and membership data used in preparing the valuation are included in the valuation report. The actuary prepared supporting schedules included in the Actuarial and Statistical Section of the PSERS Comprehensive Annual Financial Report (CAFR), and also prepared the trend data schedules included in the Financial Section of the CAFR.
Changes Since Last Year
Legislative and Administrative Changes
There were no legislative or administrative changes since the prior valuation.
The benefi t provisions and contribution provisions are summarized in Table 13.
Actuarial Assumptions and Methods
As adopted by the Board of Trustees at their January 2009 meeting, the valuation interest rate was changed to 8.25% for the June 30, 2008 valuation.
The actuarial assumptions and methods are outlined in Table 12.

Actuarial Section
Page 105
Contribution Rates
The results of the valuation as of June 30, 2008 determine the employer contribution rate for fi scal year 2009/2010. The calculated employer contribution rate for the 2009/2010 fi scal year is 4.78%, and the Board of Trustees certifi ed this rate at their December 2008 meeting.
The average contribution rate payable by the members is 7.32%. Effective January 1, 2002, the employee contribution rate for members who elected to have prior school service and intervening military service converted to Class T-D service increased by 1.25%. However, anyone who enrolls (or re-enrolls) in PSERS on or after July 1, 2001 is automatically a member of Class T-D with regard to all subsequent school service and subsequent intervening military service, with a member rate equal to 7.5%. The average member contribution rate of 7.32% is a pay-weighted average of member rates that vary based on date of hire and based on Class T-D membership.
Reasons for Change in the Rate Calculated by the Actuary
The employer contribution rate calculated by the actuary increased from 4.76% for fi scal year 2008/2009 to 4.78% for fi scal year 2009/2010. The reconciliation of the employer contribution rates by source is as follows:
• FY2008/2009 rate after adjustment for pension fl oor 4.76%
• Adjustment due to effect of 4% fl oor on FY 2009 pension contribution (0.69)
• FY 2008 /2009 rate prior to adjustment for pension fl oor 4.07%
• Decrease due to change in normal rate (0.02)
• Increase due to payroll growth 0.11
• Decrease due to actuarial gain on assets (1.71)
• Increase due to actuarial loss on liabilities 0.22
• Increase due to change in interest rate from 8.50% to 8.25% 1.72
• Increase due to change in health insurance contribution rate 0.02
• FY 2009/2010 rate prior to adjustment for pension fl oor 4.41%
• Adjustment due to effect of 4% fl oor on FY 2010 pension contribution 0.37
• FY2009/2010 rate after adjustment for pension fl oor 4.78%
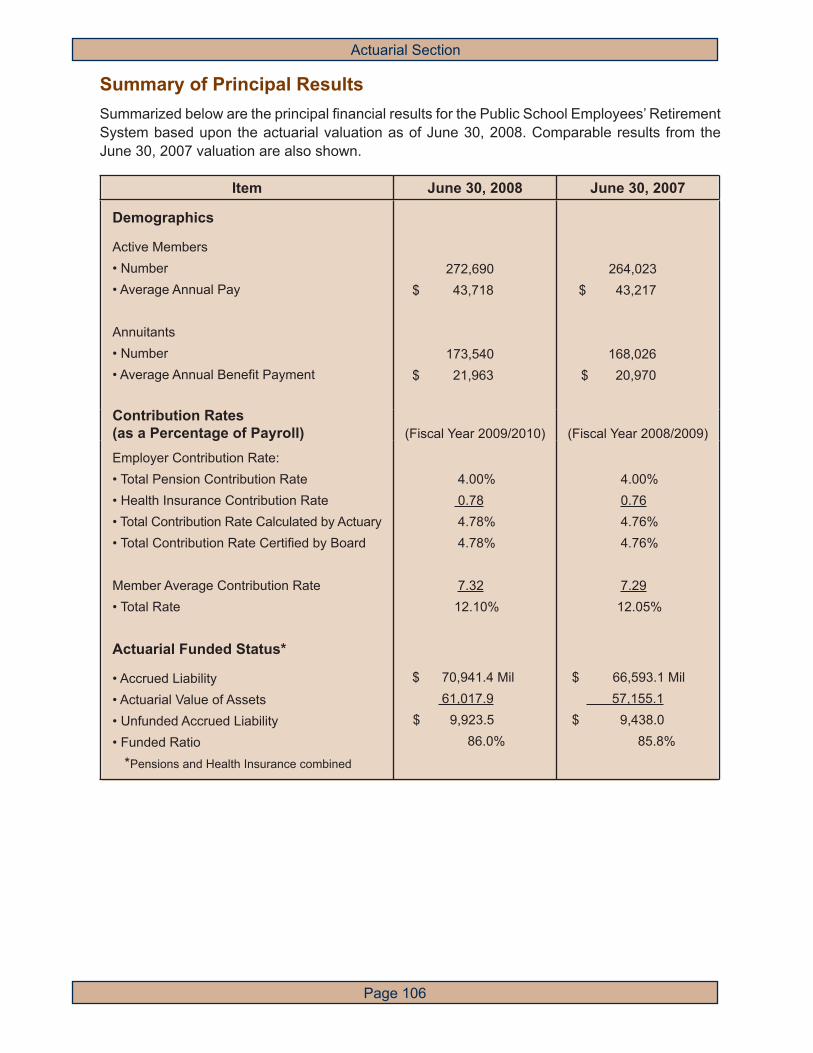
Actuarial Section
Page 106
Summary of Principal ResultsSummarized below are the principal fi nancial results for the Public School Employees’ Retirement System based upon the actuarial valuation as of June 30, 2008. Comparable results from the June 30, 2007 valuation are also shown.
Item June 30, 2008 June 30, 2007
Demographics
Active Members• Number• Average Annual Pay
Annuitants• Number• Average Annual Benefi t Payment
272,690$ 43,718
173,540
$ 21,963
264,023 $ 43,217
168,026$ 20,970
Contribution Rates (as a Percentage of Payroll) (Fiscal Year 2009/2010) (Fiscal Year 2008/2009)
Employer Contribution Rate:• Total Pension Contribution Rate• Health Insurance Contribution Rate• Total Contribution Rate Calculated by Actuary• Total Contribution Rate Certifi ed by Board
Member Average Contribution Rate• Total Rate
Actuarial Funded Status*
• Accrued Liability• Actuarial Value of Assets• Unfunded Accrued Liability• Funded Ratio
* Pensions and Health Insurance combined
4.00% 0.78 4.78% 4.78%
7.3212.10%
$ 70,941.4 Mil 61,017.9
$ 9,923.5 86.0%
4.00% 0.76 4.76% 4.76%
7.2912.05%
$ 66,593.1 Mil 57,155.1 $ 9,438.0 85.8%

Actuarial Section
Page 107
Five-Year History of Principal Financial ResultsFive-Year History of Contribution Rates
(As a % of Payroll)
Fiscal Year Member
Contributions
Employer Contributions
Normal Cost
Unfunded Accrued Liability
Health Insurance Total*
2009/2010 7.32% 7.35% (3.72)% 0.78% 4.78%
2008/2009 7.29 6.68 (3.37) 0.76 4.76
2007/2008 7.25 6.68 (0.24) 0.69 7.13
2006/2007 7.21 6.62 (0.95) 0.74 6.46
2005/2006 7.16 7.61 (4.28) 0.69 4.69
* Certifi ed by the Board.
The following chart shows a fi ve-year history of employer contribution rates:
Five-Year History of Employer Contribution Rates
2005/2006 2006/2007 2007/2008 2008/2009 2009/2010
Pension Health CarePremium Assistance
0%
3%
6%
9%
12%

Actuarial Section
Page 108
Funded Ratio
The fi nancing objective of the Retirement System is to:
— Fully fund all current costs based on the normal contribution rate determined under the funding method; and
— Liquidate the unfunded accrued liability based on the amortization schedules as required by the Retirement Code, i.e., a schedule of 10 or 30 years for each change in the unfunded accrued liability according to Act 40.
The total contribution rate of 4.78% of payroll payable by employers, when taken together with the contributions payable by the members, current assets, and expected future asset returns, is suffi cient to achieve the fi nancing objective.
The Retirement System’s total funded ratio on this funding basis is measured by comparing the actuarial value of assets (based on a 5-year moving average market value) with the accrued liability. The accrued liability for Pensions is the present value of benefi ts accumulated to date under the Retirement System’s funding method and refl ects future pay increases for active employees. The accrued liability for Health Insurance equals the assets in the Health Insurance account.
On this basis, the Retirement System’s total funded ratio (for Pensions and Health Insurance combined) is 86.0% as of June 30, 2008. This funded ratio is based on an actuarial value of assets of $61.0 billion and an accrued liability of $70.9 billion. The funded ratio for Pensions alone is also 86.0% as of June 30, 2008, based on an actuarial value of assets of $60.9 billion, and an accrued liability of $70.8 billion.
Reasons for Change in the Total Funded Ratio
The total funded ratio increased from 85.8% as of June 30, 2007 to 86.0% as of June 30, 2008. This increase is primarily due to asset gains that occurred during the year. These gains were partially offset by liability losses and assumption changes, and by contributions that were less than the normal cost plus one year’s interest on the June 30, 2007 unfunded accrued liability.

Actuarial Section
Page 109
Five-Year History of Total Funded Ratio*(Dollar Amounts in Millions)
Valuation as of June 30
Accrued Liability
Actuarial Value of Assets
Unfunded Accrued Liability
Funded Ratio
2008 $ 70,941.4 $ 61,017.9 $ 9,923.5 86.0%
2007 66,593.1 57,155.1 9,438.0 85.8
2006 64,720.1 52,557.5 12,162.6 81.2
2005 61,226.6 51,219.3 10,007.3 83.7
2004 57,123.0 52,094.5 5,028.5 91.2
* For Pensions and Health Insurance (under the funding provisions of the Retirement Code)
The following chart shows a fi ve-year history of the accrued liability and the actuarial value of assets.
Five-Year History of Accrued Liability and Actuarial Value of Assets
Actuarial Value of AssetsAccrued Liability
$0
$30
$10
$40
June 30, 2004 June 30, 2005 June 30, 2006 June 30, 2007 June 30, 2008
$50
$60
$70
$80
$20
(Dollar Amounts in Billions)

Actuarial Section
Page 110
The following chart shows a ten-year history of the total funded ratio for Pensions and Health Insurance:
Ten-Year History of Total Funded Ratio
(1999 - 2008)
50%1999 2000 2001 2002 2003 2004 2005 2006 2007 2008
120%
60%
80%
70%
90%
100%
110%
130%
140%

Actuarial Section
Page 111
GASB No. 25 Disclosure
Statement No. 25 of the Governmental Accounting Standards Board (GASB) established reporting standards for the annual fi nancial reports of defi ned benefi t pension plans. The Retirement System complied with Statement No. 25 beginning with the June 30, 1996 valuation. The statement requires disclosure of the “schedule of funding progress” and the “schedule of employer contributions” in the Retirement System’s fi nancial statements.
The “schedule of funding progress” shows historical trend information about the Retirement System’s actuarial value of pension assets, the actuarial accrued liability for pensions and the unfunded actuarial accrued liability for pensions. The actuarial funded ratio for pensions is measured by comparing the actuarial value of pension assets (based on a 5-year moving average market value) with the accrued liability for pensions. The accrued liability is the present value of pension benefi ts accumulated to date under the Retirement System’s funding method and refl ects future pay increases for active employees. On this basis, the Retirement System’s funded ratio for pensions is 86.0% as of June 30, 2008. This funded ratio is based on an actuarial value of pension assets of $60.9 billion and an accrued liability for pensions of $70.8 billion. See Table 7 for more detail.
The schedule of employer contributions shows historical trend information about the GASB Annual Required Contribution (ARC) for pensions, and the percentage of the ARC contributed to the Retirement System. The pension contribution requirements of the Retirement Code differ from the GASB disclosure requirements. As a result, there may be different determinations of contribution requirements for GASB accounting purposes and for State funding purposes. For GASB accounting purposes, the ARC equals the employer normal cost for pensions plus an amount that will amortize the unfunded actuarial accrued liability for pensions over a period no longer than 30 years. (For years ending on or before June 30, 2006, the maximum amortization period for the GASB ARC was 40 years.) Although the employer normal cost for GASB accounting equals the PSERS normal cost for funding, section 8328 of the Retirement Code specifi es different amortization periods for different portions of the unfunded accrued liability – each change in the unfunded accrued liability is amortized over either a 10 or 30-year period – as well as a 4% fl oor on the employer pension rate. Therefore, the resulting equivalent single amortization period may be any number of years. Table 8a presents the GASB 25 schedule of employer contributions.

Actuarial Section
Page 112
112
GASB No. 43 Disclosure
GASB Statement No. 43 established reporting standards for the annual fi nancial reports of postemployment benefi t plans other than pension plans, and these reporting requirements apply to the PSERS health insurance premium assistance plan. The Retirement System complied with Statement No. 43 beginning with the June 30, 2006 valuation. The statement requires disclosure of the “schedule of funding progress” and the “schedule of employer contributions” in the Retirement System’s fi nancial statements.
The health insurance liability and funding provisions of the Retirement Code differ from the GASB disclosure requirements. As a result, there are different determinations of actuarial liability and contribution requirements for GASB accounting purposes and for State funding purposes. For purposes of funding, the actuarial liability equals the assets in the health insurance account, and the contribution required is the amount necessary to establish reserves suffi cient to provide premium assistance payments to all participating eligible annuitants during the fi scal year that immediately follows the year the employer contribution is made. For GASB accounting purposes, the actuarial liability has been determined under the entry age actuarial cost method, and the Annual Required Contribution (ARC) is equal to the entry age normal cost for health insurance plus an amount that will amortize the entry age unfunded actuarial liability for health insurance over a period of 30 years. (The entry age actuarial cost method was selected for this calculation because it meets the GASB parameters for determining actuarial liability and normal cost, and is the cost method specifi ed by the Retirement Code for the PSERS pension plan.)
The GASB 43 schedule of funding progress, presented in Table 7, shows that as of June 30, 2008, the health insurance assets were $95,785,000, measured on a market value basis, while the GASB 43 health insurance liabilities were $1,133,011,000, resulting in a funded ratio of 8.5%.
The GASB 43 schedule of employer contributions fi rst applies to fi scal year 2006/2007, and is presented in Table 8b.

Actuarial Section
Page 113
Rate of Return
The investment return of the trust fund (i.e. total return including both realized and unrealized gains and losses) for fi scal years 2003/2004 through 2007/2008 is shown in the table below. The return based on the actuarial value of assets used for determining annual contribution rates is also shown.
The rate of return on market value refl ects the investment earnings on the market value of assets from the beginning of the fi scal year to the end of the fi scal year. The actuarial assets are the assets recognized for valuation purposes. Actuarial assets are based on a smoothed market value that spreads the difference between the actual and expected return over a period of fi ve years. The rate of return on the actuarial value of assets is a measure of the increase in the actuarial value of assets from the beginning of the fi scal year to the end of the fi scal year.
Rate of Return Based on
Fiscal Year Market Value* Actuarial Value
2007/2008 -2.8% 12.4%
2006/2007 22.9 13.9
2005/2006 15.3 7.9
2004/2005 12.9 3.2
2003/2004 19.7 2.6
* Market Value Rate of return provided by Wilshire Associates Incorporated, PSERS investment consultant.

Actuarial Section
Page 114
Item June 30, 2008 June 30, 2007
Member Data1. Number of Members
a) Active Members 272,690 264,023b) Inactive Members and Vestees 100,803 109,186c) Annuitants, Beneficiaries and Survivor Annuitants 173,540 168,026d) Total 547,033 541,235
2. Annualized Salaries 11,921,469$ 11,410,257$
3. Annual Annuities 3,811,499$ 3,523,429$
Valuation Results4. Present Value of Future Pension Benefits
a) Active Members 53,857,049$ 49,167,907$b) Inactive Members and Vestees 941,679 1,589,329c) Annuitants, Beneficiaries and Survivor Annuitants 34,617,953 31,603,788d) Total 89,416,681$ 82,361,024$
5. Present Value of Future Pension Normal Costa) Active Members 9,090,223$ 8,430,801$b) Employer 9,480,821 7,434,353c) Total 18,571,044$ 15,865,154$
6. Pension Accrued Liabilitya) Active Members (4a) - (5c) 35,286,005$ 33,302,753$b) Inactive Members and Vestees 941,679 1,589,329c) Annuitants, Beneficiaries and Survivor Annuitants 34,617,953 31,603,788d) Total 70,845,637$ 66,495,870$
7. Health Insurance Assets for Premium Assistance 95,785$ 97,292$
8. Total Accrued Liability for Funding (6) + (7) 70,941,422$ 66,593,162$
9. Actuarial Value of Assets 61,017,942$ 57,155,130$
10. Funded Status (9) / (8) 86.0 % 85.8 %
11. Unfunded Accrued Liability (8) - (9) 9,923,480$ 9,438,032$
12. Total Normal Cost Rate 14.67 % 13.97 %
13. Member Contribution Rate 7.32 % 7.29 %
14. Employer Normal Cost Rate (12) - (13) 7.35 % 6.68 %
Employer Annual Funding Requirement Fiscal 2009/2010 Fiscal 2008/200915. Employer Contribution Rate Calculated by Actuary
a) Normal 7.35 % 6.68 %b) Unfunded Accrued Liability (3.72) (3.37)c) Preliminary Pension Rate 3.63 % 3.31 %d) Preliminary Pension Rate with 4% Floor 4.00 4.00e) Health Insurance 0.78 0.76f) Total Rate 4.78 % 4.76 %
Table 1
Summary of Results of Actuarial ValuationAs of June 30, 2008
(Dollar Amounts in Thousands)

Actuarial Section
Page 115
Funding 7/1/2008Period Beginning Initial Outstanding Annual Payment
(Years) July 1 Liability Balance Amount Percent *
1. Amortization of:
a) 2001 Fresh Start
Unfunded Base 10 2002 $ (9,137,130) $ (4,949,221) $ (1,504,168) (11.66)%
b) 2001 Asset Method Change (Act 38) 10 2002 (4,638,306) (2,512,387) (763,565) (5.92)%
c) Other 2001 Changes 30 2002 7,570,507 6,750,658 654,914 5.08 %
d) 2002 Changes 30 2003 3,014,171 2,928,010 280,308 2.17 %
e) 2002 COLA 10 2003 463,795 302,225 76,271 0.59 %
f) 2003 COLA 10 2004 754,524 616,444 134,491 1.04 %
g) 2003 Changes 30 2004 3,229,593 3,376,048 319,304 2.48 %
h) 2004 Changes 30 2005 2,903,093 3,067,132 286,891 2.22 %
i) 2005 Changes 30 2006 3,765,745 4,017,250 371,977 2.88 %
j) 2006 Changes 30 2007 812,226 874,170 80,197 0.62 %
k) 2007 Changes 30 2008 (3,870,741) (4,199,754) (382,034) (2.96)%
l) 2008 Changes 30 2009 (347,095) (347,095) (34,165) (0.26)%
Total Amortization Payments $ 9,923,480 $ (479,579) (3.72)%
2. Employer Normal Cost Rate 7.35 %
3. Preliminary Pension Rate (1) + (2) 3.63 %
4. Preliminary Pension Rate with 4% Floor -- Maximum of (3) and 4% 4.00 %
5. Health Insurance Rate 0.78 %
6. Final Total Employer Contribution Rate Calculated by Actuary (4) + (5) 4.78 %
Table 2
Summary of Sources of Employer Contribution RateAs of June 30, 2008
(Dollar Amounts in Thousands)
* Based on Estimated Employer Payroll for Fiscal Year Ending 2010 of $12,899,000.
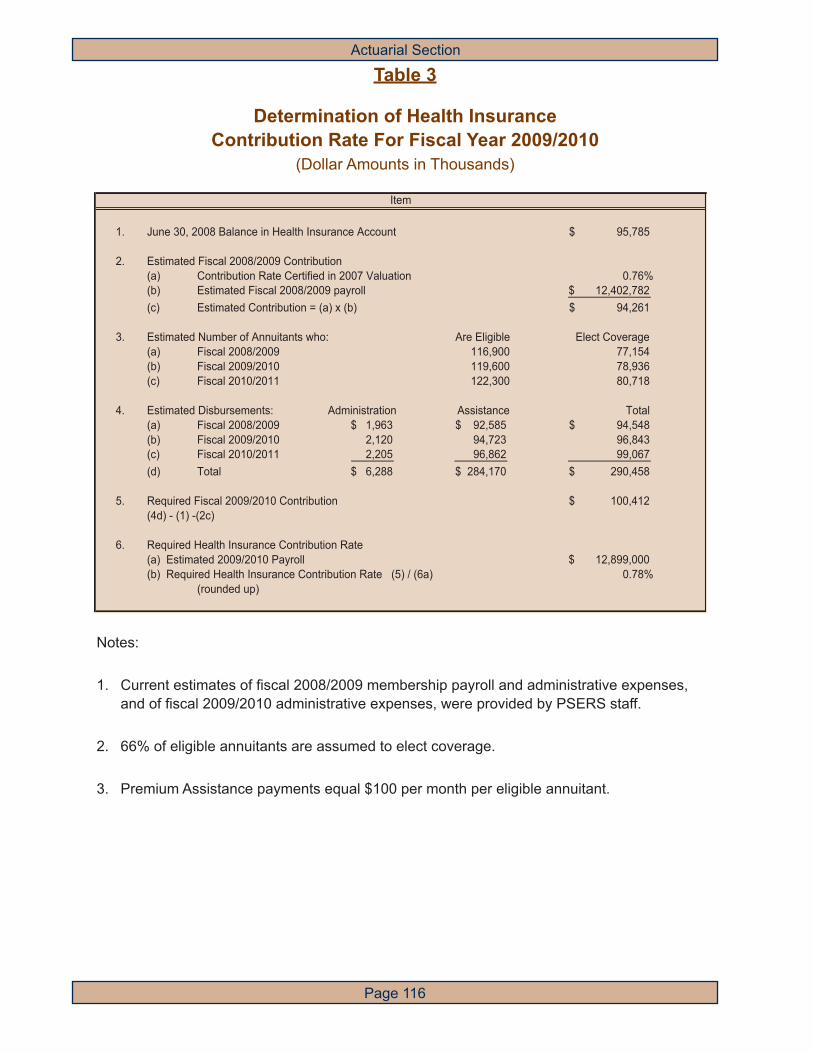
Actuarial Section
Page 116
1. June 30, 2008 Balance in Health Insurance Account 95,785$
2. Estimated Fiscal 2008/2009 Contribution(a) Contribution Rate Certified in 2007 Valuation 0.76%(b) Estimated Fiscal 2008/2009 payroll 12,402,782$ (c) Estimated Contribution = (a) x (b) 94,261$
3. Estimated Number of Annuitants who: Are Eligible Elect Coverage(a) Fiscal 2008/2009 116,900 77,154 (b) Fiscal 2009/2010 119,600 78,936 (c) Fiscal 2010/2011 122,300 80,718
4. Estimated Disbursements: Administration Assistance Total(a) Fiscal 2008/2009 1,963$ 92,585$ 94,548$ (b) Fiscal 2009/2010 2,120 94,723 96,843 (c) Fiscal 2010/2011 2,205 96,862 99,067 (d) Total 6,288$ 284,170$ 290,458$
5. Required Fiscal 2009/2010 Contribution 100,412$ (4d) - (1) -(2c)
6. Required Health Insurance Contribution Rate(a) Estimated 2009/2010 Payroll 12,899,000$ (b) Required Health Insurance Contribution Rate (5) / (6a) 0.78%
(rounded up)
Item
Table 3
Determination of Health Insurance Contribution Rate For Fiscal Year 2009/2010
(Dollar Amounts in Thousands)
1. Current estimates of fiscal 2008/2009 membership payroll and administrative expenses, and of fiscal 2009/2010 administrative expenses, were provided by PSERS staff.
2. 66% of eligible annuitants are assumed to elect coverage. 3. Premium Assistance payments equal $100 per month per eligible annuitant.
Notes:
1. Current estimates of fi scal 2008/2009 membership payroll and administrative expenses, and of fi scal 2009/2010 administrative expenses, were provided by PSERS staff.
2. 66% of eligible annuitants are assumed to elect coverage.
3. Premium Assistance payments equal $100 per month per eligible annuitant.

Actuarial Section
Page 117
Market Value
1. Market Value of Assets as of June 30, 2007 67,438,289$
2. Contributions During Fiscal 2007/2008 1,714,447
3. Disbursements During Fiscal 2007/2008 4,766,545
4. Investment Return During Fiscal 2007/2008
a) Investment Return (Net of Investment
Expenses) (1,779,873)$
b) Administrative Expenses 37,107
c) Investment Return After Expenses (a) - (b) (1,816,980)$
5. Market Value of Assets as of June 30, 2008 (1) + (2) - (3) + (4c) 62,569,211$
6. Rate of Return (per Wilshire) (2.82) %
Asset Allocation by Account
1. Members' Savings Account 10,532,683$
2. Annuity Reserve Account 34,617,953
3. State Accumulation Account 17,322,790
4. Health Insurance Account 95,785
5. Total (1) + (2) + (3) + (4) 62,569,211$
Table 4
Summary of Market Value of Plan AssetsAs of June 30, 2008
(Dollar Amounts in Thousands)

Actuarial Section
Page 118
1. Market Value of Assets as of June 30, 2008 62,569,211$
2. Determination of Deferred Gain (Loss)
Return on AssetsFiscal DeferredYear Actual Expected Difference % Deferred Amount
2007/2008 (1,816,980)$ 4,728,472$ (6,545,452)$ 80% (5,236,362)$
2006/2007 12,658,871 4,359,054 8,299,817 60 4,979,890
2005/2006 7,901,068 4,242,878 3,658,190 40 1,463,276
2004/2005 6,044,305 4,321,981 1,722,324 20 344,465
1,551,269$
3. Actuarial Value of Assets (1) - (2) 61,017,942$
4. Actuarial Rate of Return * 12.43%
Table 5
Derivation of Actuarial Value of AssetsAs of June 30, 2008
(Dollar Amounts in Thousands)
* The actuarial rate of return is the investment return based on the change in the actuarial value of assets from the June 30, 2007 valuation to the June 30, 2008 valuation.

Actuarial Section
Page 119
Item Amount
1. Unfunded Accrued Liability at June 30, 2007 9,438,032$
2. Interest Credit at 8.25% to June 30, 2008 802,232
3. Contributions Toward Unfunded Accrued Liability (30,311)
4. Change due to Effect of 4% Floor on FY 2008 -
Pension Contribution
5. Expected Unfunded Accrued Liability at June 30, 2008
(1) + (2) - (3) + (4) 10,270,575$
6. Actual Unfunded Accrued Liability at June 30, 2008 9,923,480$
7. Increase (Decrease) from Expected
(6) - (5) (347,095)$
8. Reasons for Increase (Decrease)
(a) Experience (Gains) Losses
(i) Gain from Investment Return on
Actuarial Value of Assets (2,186,438)$
(ii) Loss from New Entrants and Pickups 419,868
(iii) Loss from Salary Increases Greater than Expected 56,062
(iv) Loss from Mortality Experience 76,098
(v) Gain from Vested Termination Experience
(Retirement/Disability/Termination) (79,875)
(vi) Gain from Non-vested Termination Experience (189,177)
(vii) Loss from Data/Miscellaneous 8,852
Subtotal (1,894,610)$
(b) Change in Assumption 1,547,515$
(c) Grand Total (347,095)$
Table 6
Analysis of Change in Unfunded Accrued LiabilityAs of June 30, 2008
(Dollar Amounts in Thousands)

Actuarial Section
Page 120
Unfunded UnfundedValuation Actuarial Actuarial Actuarial Accrued
as of Value of Accrued Accrued Funded Covered Liability as aJune 30 Assets Liability Liability Ratio Payroll Percentage of
Covered Payroll
2008 $ 60,922,157 $ 70,845,637 $ 9,923,480 86.0 % $ 11,921,469 83.2 %2007 57,057,838 66,495,870 9,438,032 85.8 11,410,257 82.72006 52,464,726 64,627,361 12,162,635 81.2 11,419,049 106.52005 51,122,156 61,129,444 10,007,288 83.6 10,527,668 95.12004 51,949,622 56,978,143 5,028,521 91.2 10,030,705 50.12003 52,770,018 54,313,328 1,543,310 97.2 9,652,881 16.0
* The amounts reported above include assets and liabilities for Health Insurance Premium Assistance. The health insurance liabilities for GASB 43 disclosure have been calculated under the entry age normal cost method, which provides liabilities that differ from those determined under the funding requirements of the Retirement Code.
Table 7
Schedule of Funding Progress for Pensions*GASB Statement No. 25 Disclosure
(Dollar Amounts in Thousands)
* The amounts reported above include assets and liabilities for Pensions.
Schedule of Funding Progress forPostemployment Benefi ts Other Than Pensions*
GASB Statement No. 43 Disclosure(Dollar Amounts in Thousands)
Unfunded UnfundedValuation Actuarial Actuarial Actuarial Accrued
as of Value of Accrued Accrued Funded Covered Liability as aJune 30 Assets Liability Liability Ratio Payroll Percentage of
Covered Payroll
2008 $ 95,785 $ 1,133,011 $ 1,037,226 8.5 % $ 11,921,469 8.7 %2007 97,292 1,058,092 960,800 9.2 11,410,257 8.42006 92,777 1,056,154 963,377 8.8 11,419,049 8.4

Actuarial Section
Page 121
FiscalYear Annual Actual
Ended Required Employer PercentageJune 30 Contribution Contribution Contributed
2008 $ 1,852,238 $ 753,532 41 %2007 1,708,821 659,545 392006 1,328,373 456,878 342005 945,107 431,556 462004 321,091 321,091 1002003 20,831 20,831 100
Table 8a
Schedule of Employer Contributions for PensionsGASB Statement No. 25 Disclosure
(Dollar Amounts in Thousands)
The Annual Required Contribution (ARC) presented above was determined as part of the actuarial valuation as of two years prior to the dates indicated (i.e., the ARC for the fi scal year ended June 30, 2008 was determined by the valuation completed as of June 30, 2006 which was based on an 8.50% interest rate).
Additional information as of the latest actuarial valuation follows:
Valuation Date: 6/30/2008Actuarial Cost Method: Entry AgeAmortization Method: Level dollar openRemaining Amortization Period: 30 YearsAsset Valuation Method: 5-year smoothed marketActuarial Assumptions:
- Investment Rate of Return * 8.25%- Projected Salaried Increases * 6.00%
* Includes Infl ation at: 3.25%

Actuarial Section
Page 122
FiscalYear Annual Actual
Ended Required Employer PercentageJune 30 Contribution Contribution Contributed
2008 $ 101,352 $ 81,317 80 %2007 94,970 86,763 91
The Annual Required Contribution (ARC) presented above was determined as part of the actuarial valuation as of one year prior to the dates indicated (i.e., the ARC for the fi scal year ended June 30, 2008 was determined by the valuation completed as of June 30, 2007 which was based on an 8.50% interest rate).
Additional information as of the latest actuarial valuation follows:
Valuation Date: 6/30/2008Actuarial Cost Method: Entry AgeAmortization Method: Level dollar openRemaining Amortization Period: 30 YearsAsset Valuation Method: MarketActuarial Assumptions:
- Investment Rate of Return * 8.25%- Projected Salaried Increases * 6.00%
* Includes Infl ation at: 3.25%
Table 8b
Schedule of Employer Contributions forPostemployment Benefi ts Other Than Pensions
GASB Statement No. 43 Disclosure(Dollar Amounts in Thousands)

Actuarial Section
Page 123
(1) (2) (3) Portion of AccruedValuation Active Retirees Active Member Actuarial Liability Covered by
as of Member and Employer Value of Valuation AssetsJune 30 Contributions Beneficiaries Financed Assets (1) (2) (3)
2008 $ 10,532,683 $ 34,713,738 $ 25,695,001 $ 61,017,942 100 % 100 % 61 %2007 10,183,433 31,701,080 24,708,649 57,155,130 100 100 622006 9,571,668 29,209,941 25,938,529 52,557,503 100 100 532005 9,116,347 27,051,245 25,058,989 51,219,293 100 100 602004 8,755,109 24,482,234 23,885,657 52,094,479 100 100 792003 8,282,753 22,094,109 24,066,913 52,900,465 100 100 94
* The amounts reported include assets and liabilities for both Pensions and Health Insurance.
Table 9
Solvency TestComparative Summary of Accrued Liability And
Actuarial Value of Assets*(Dollar Amounts in Thousands)

Actuarial Section
Page 124
Contribution Rates 2
Fiscal YearEndingJune
AppropriationPayroll
(thousands) Employee
EmployerNormal
Cost
Employer Unfunded Liability
Preliminary Employer Pension
Final Employer Pension
Employer Health
InsuranceTotal
Employer Funded Ratio
2000 $ 8,939,598 5.72 % 6.40 % (2.04) % 4.36 % 4.36 % 0.25 % 4.61 % 123.8 %
2001 9,414,884 5.77 6.29 (4.65) 1.64 1.64 0.30 1.94 114.4
2002 3 9,378,944 6.43 5.63 (6.05) (0.42) 0.00 1.09 1.09 104.8
2003 4 9,652,881 7.10 7.20 (10.03) 1.00 0.18 0.97 1.15 97.2
2004 10,030,705 7.08 7.25 (4.27) 2.98 2.98 0.79 3.77 91.2
2005 5 11,062,589 7.12 7.48 (7.10) 0.38 4.00 0.23 4.23 83.7
2006 11,505,093 7.16 7.61 (4.28) 3.33 4.00 0.69 4.69 81.2
2007 6 11,821,951 7.21 6.62 (0.95) 5.67 5.72 0.74 6.46 85.8
2008 12,881,244 7.25 6.68 (0.24) 6.44 6.44 0.69 7.13 86.0
2009 12,402,782 7.29 6.68 (3.37) 3.31 4.00 0.76 4.76 85.0
2010 7 12,899,000 7.32 7.35 (3.72) 3.63 4.00 0.78 4.78 85.2
2011 7 13,297,917 7.34 8.03 (3.73) 4.30 4.30 0.76 5.06 84.4
2012 13,703,700 7.36 8.00 (4.43) 3.57 4.00 0.75 4.75 81.5
2013 14,132,543 7.38 7.97 11.45 19.42 19.42 0.74 20.16 82.6
2014 14,586,335 7.40 7.94 11.39 19.33 19.33 0.73 20.06 83.6
2015 15,066,759 7.41 7.93 10.15 18.08 18.08 0.72 18.80 84.5
2016 15,573,822 7.43 7.90 9.84 17.74 17.74 0.70 18.44 85.4
2017 16,119,772 7.44 7.88 9.53 17.41 17.41 0.69 18.10 86.3
2018 16,711,215 7.45 7.86 9.20 17.06 17.06 0.66 17.72 87.2
2019 17,349,067 7.46 7.85 8.87 16.72 16.72 0.65 17.37 88.1
2020 18,031,134 7.46 7.84 8.54 16.38 16.38 0.63 17.01 89.0
1. The projection of contribution rates is based on the assumption that there are no changes in demographic assumptions, no changes in benefi t provisions, and no actuarial gains or losses other than gains or losses on the actuarial value of assets that result from recognizing currently deferred gains or losses on the market value of assets.
2. In general, the Preliminary Employer Pension Rate equals the sum of the rates for the Employer Normal Cost and the Unfunded Liability; and the Final Employer Pension Rate is the greater of the Preliminary Pension Rate and any Pension Rate Floor stated in the Retirement Code. The Total Employer Rate is the sum of the Final Employer Pension Rate and the Employer Health Insurance Rate.
3. For fi scal years ending on or before June 30, 2002, there was no fl oor specifi ed in the Retirement Code, but the Final Employer Pension Rate could not be less than 0%, since money can only be removed from the trust for purposes allowed by the Retirement Code.
4. Act 2002-38 amended the Retirement Code to place a permanent 1% fl oor on the Employer Pension Rate, but also provided that the Total Employer Rate for the year ending June 30, 2003 could not exceed 1.15%, resulting in a 0.18% Final Employer Pension Rate (the Total Employer Rate of 1.15% minus the 0.97% Employer Health Insurance Rate).
5. Act 2003-40 amended the Retirement Code to increase the Employer Pension Rate Floor from 1% to 4%.6. Revised actuarial assumptions based on a fi ve-year experience review ending June 30, 2005 were used to determine the contributions
for the fi scal year ending June 30, 2007. Since the benefi t changes under Act 2001-9 had not been in effect throughout the entire period covered by the study the Board decided, at its December 2005 meeting, to delay making any changes to the retirement rate assumptions until further data became available. The 5.72% Final Employer Pension Rate equals the 6.46% Total Employer Rate certifi ed by the Board at that meeting, minus the 0.74% Employer Health Insurance Rate. The 5.67% Preliminary Employer Pension Rate equals the sum of the Employer Normal Cost and Unfunded Liability rates. The Normal Cost and Unfunded Liability rates were calculated by the actuary in January 2006, based on the package of assumptions adopted at the December 2005 meeting.
7. The Board at its January 2009 meeting adopted to reduce the interest rate from 8.50% to 8.25% for the June 30, 2008 valuation and to 8.00% thereafter.
Table 10
History and Projection of Contribution Rates and Funded Ratios 1
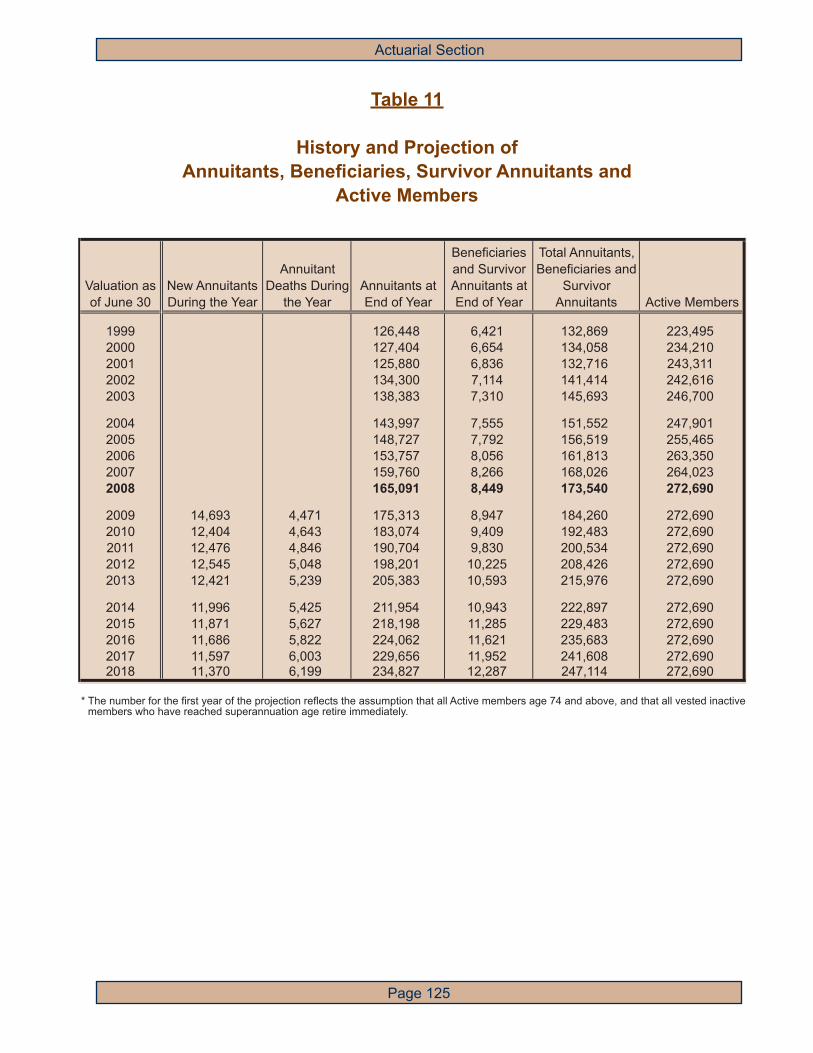
Actuarial Section
Page 125
Valuation as
of June 30
New Annuitants
During the Year
Annuitant
Deaths During
the Year
Annuitants at
End of Year
Beneficiaries
and Survivor
Annuitants at
End of Year
Total Annuitants,
Beneficiaries and
Survivor
Annuitants Active Members
1999 126,448 6,421 132,869 223,495
2000 127,404 6,654 134,058 234,210
2001 125,880 6,836 132,716 243,311
2002 134,300 7,114 141,414 242,616
2003 138,383 7,310 145,693 246,700
2004 143,997 7,555 151,552 247,901
2005 148,727 7,792 156,519 255,465
2006 153,757 8,056 161,813 263,350
2007 159,760 8,266 168,026 264,023
2008 165,091 8,449 173,540 272,690
2009 14,693 4,471 175,313 8,947 184,260 272,690
2010 12,404 4,643 183,074 9,409 192,483 272,690
2011 12,476 4,846 190,704 9,830 200,534 272,690
2012 12,545 5,048 198,201 10,225 208,426 272,690
2013 12,421 5,239 205,383 10,593 215,976 272,690
2014 11,996 5,425 211,954 10,943 222,897 272,690
2015 11,871 5,627 218,198 11,285 229,483 272,690
2016 11,686 5,822 224,062 11,621 235,683 272,690
2017 11,597 6,003 229,656 11,952 241,608 272,6902018 11,370 6,199 234,827 12,287 247,114 272,690
* The number for the fi rst year of the projection refl ects the assumption that all Active members age 74 and above, and that all vested inactive members who have reached superannuation age retire immediately.
Table 11
History and Projection ofAnnuitants, Benefi ciaries, Survivor Annuitants and
Active Members
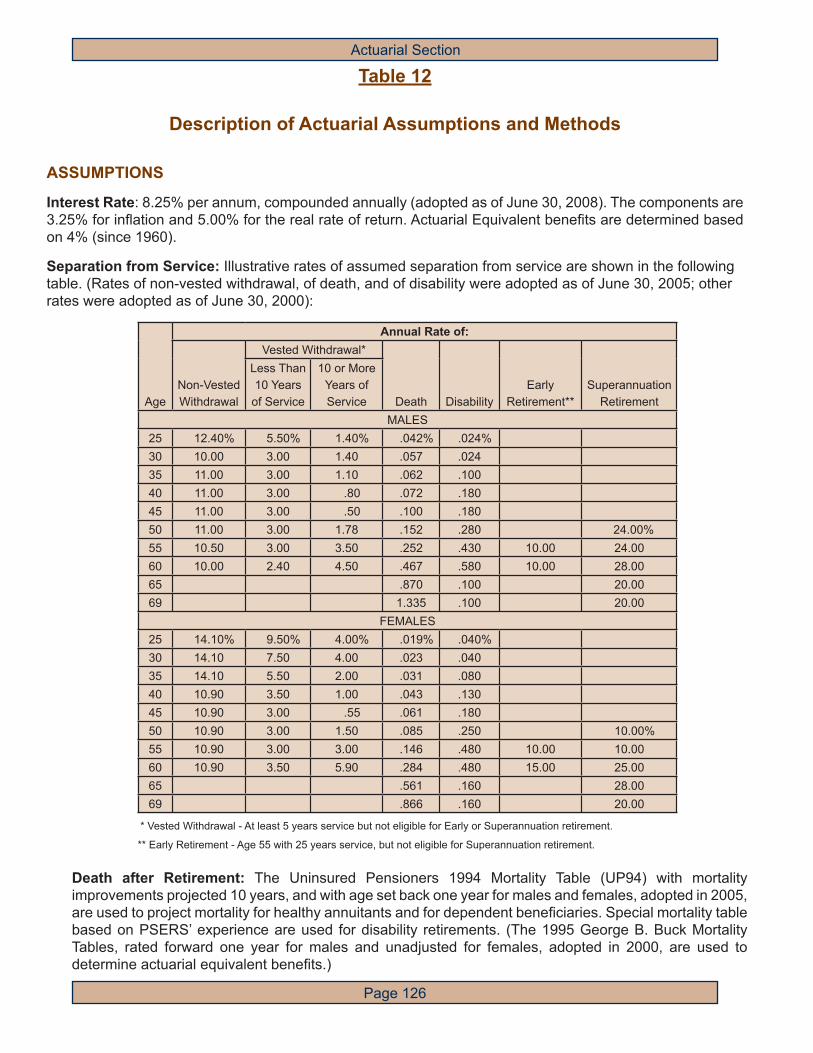
Actuarial Section
Page 126
Age
Annual Rate of:
Non-Vested Withdrawal
Vested Withdrawal*Less Than 10 Years of Service
10 or More Years of Service Death Disability
Early Retirement**
Superannuation Retirement
MALES25 12.40% 5.50% 1.40% .042% .024%30 10.00 3.00 1.40 .057 .02435 11.00 3.00 1.10 .062 .10040 11.00 3.00 .80 .072 .18045 11.00 3.00 .50 .100 .18050 11.00 3.00 1.78 .152 .280 24.00%55 10.50 3.00 3.50 .252 .430 10.00 24.0060 10.00 2.40 4.50 .467 .580 10.00 28.0065 .870 .100 20.0069 1.335 .100 20.00
FEMALES25 14.10% 9.50% 4.00% .019% .040%30 14.10 7.50 4.00 .023 .04035 14.10 5.50 2.00 .031 .08040 10.90 3.50 1.00 .043 .13045 10.90 3.00 .55 .061 .18050 10.90 3.00 1.50 .085 .250 10.00%55 10.90 3.00 3.00 .146 .480 10.00 10.0060 10.90 3.50 5.90 .284 .480 15.00 25.0065 .561 .160 28.0069 .866 .160 20.00
Table 12
Description of Actuarial Assumptions and Methods
ASSUMPTIONS
Interest Rate: 8.25% per annum, compounded annually (adopted as of June 30, 2008). The components are 3.25% for infl ation and 5.00% for the real rate of return. Actuarial Equivalent benefi ts are determined based on 4% (since 1960).
Separation from Service: Illustrative rates of assumed separation from service are shown in the following table. (Rates of non-vested withdrawal, of death, and of disability were adopted as of June 30, 2005; other rates were adopted as of June 30, 2000):
* Vested Withdrawal - At least 5 years service but not eligible for Early or Superannuation retirement.
** Early Retirement - Age 55 with 25 years service, but not eligible for Superannuation retirement.
Death after Retirement: The Uninsured Pensioners 1994 Mortality Table (UP94) with mortality improvements projected 10 years, and with age set back one year for males and females, adopted in 2005, are used to project mortality for healthy annuitants and for dependent benefi ciaries. Special mortality table based on PSERS’ experience are used for disability retirements. (The 1995 George B. Buck Mortality Tables, rated forward one year for males and unadjusted for females, adopted in 2000, are used to determine actuarial equivalent benefi ts.)

Actuarial Section
Page 127
Table 12
Description of Actuarial Assumptions and Methods(Continued)
Salary Increase: Effective average of 6% per annum, compounded annually (adopted as of June 30, 2005). The components are 3.25% for infl ation, 1% for real wage growth and 1.75% for merit or seniority increases. Representative values are as follows:
MISCELLANEOUS
Option 4 Elections: 100% of members are assumed to elect a refund of contributions and a reduced annuity.
Withdrawal Annuity: 90% of members are assumed to commence payment immediately and 10% are assumed to defer payment to superannuation age.
Health Insurance Elections: 66% of eligible retirees are assumed to elect premium assistance.Administrative Expenses: Assumed equal to 2% of contributions made during the year.
METHODS
Calculations: The actuarial calculations were performed by qualifi ed actuaries in accordance with accepted actuarial procedures, based on the current provisions of the retirement system, and on actuarial assumptions that are internally consistent and reasonably based on the actual experience of the System.
Asset Valuation Method: A fi ve-year moving market average value of assets that recognizes the 8.25% (8.50% prior to June 30, 2008) actuarial expected investment return immediately and spreads the difference between the actual return on the market value of assets and the expected return on the actuarial value of assets over a period of fi ve years (adopted as of June 30, 2001).
Age Annual Rate of Salary Increase20 12.00%30 9.0040 7.0050 4.7555 4.5060 4.2565 4.2570 4.25
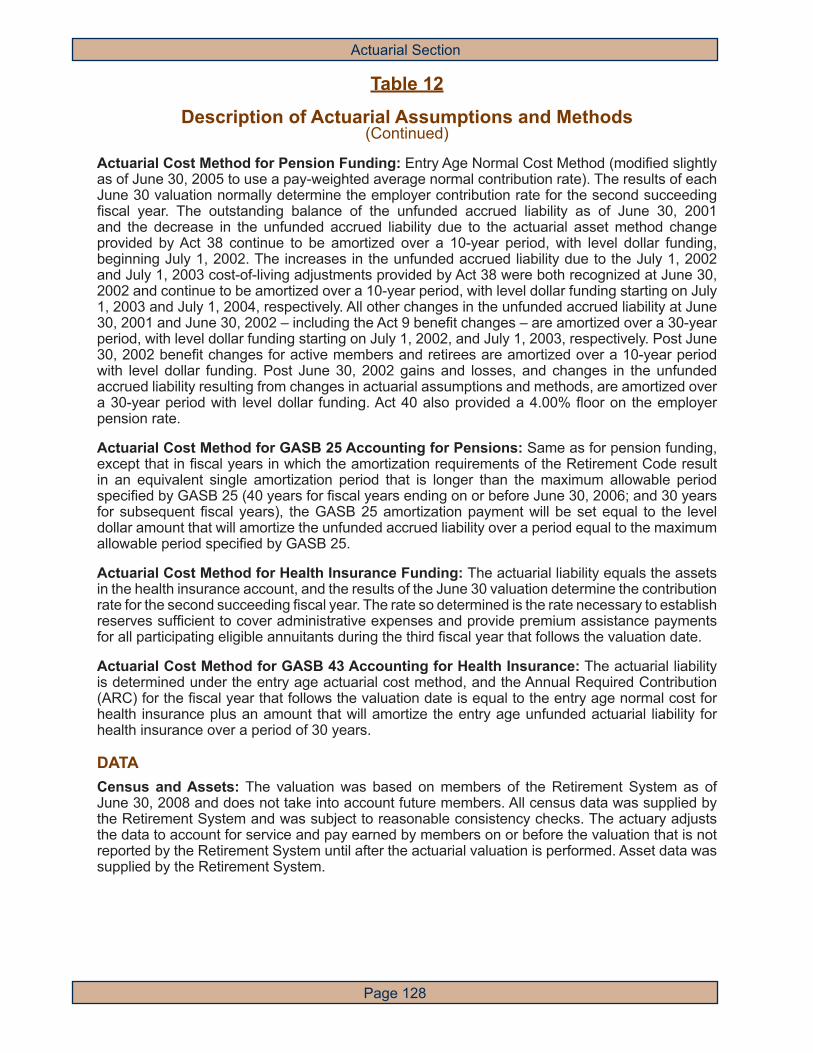
Actuarial Section
Page 128
Table 12
Description of Actuarial Assumptions and Methods(Continued)
Actuarial Cost Method for Pension Funding: Entry Age Normal Cost Method (modifi ed slightly as of June 30, 2005 to use a pay-weighted average normal contribution rate). The results of each June 30 valuation normally determine the employer contribution rate for the second succeeding fi scal year. The outstanding balance of the unfunded accrued liability as of June 30, 2001 and the decrease in the unfunded accrued liability due to the actuarial asset method change provided by Act 38 continue to be amortized over a 10-year period, with level dollar funding, beginning July 1, 2002. The increases in the unfunded accrued liability due to the July 1, 2002 and July 1, 2003 cost-of-living adjustments provided by Act 38 were both recognized at June 30, 2002 and continue to be amortized over a 10-year period, with level dollar funding starting on July 1, 2003 and July 1, 2004, respectively. All other changes in the unfunded accrued liability at June 30, 2001 and June 30, 2002 – including the Act 9 benefi t changes – are amortized over a 30-year period, with level dollar funding starting on July 1, 2002, and July 1, 2003, respectively. Post June 30, 2002 benefi t changes for active members and retirees are amortized over a 10-year period with level dollar funding. Post June 30, 2002 gains and losses, and changes in the unfunded accrued liability resulting from changes in actuarial assumptions and methods, are amortized over a 30-year period with level dollar funding. Act 40 also provided a 4.00% fl oor on the employer pension rate.
Actuarial Cost Method for GASB 25 Accounting for Pensions: Same as for pension funding, except that in fi scal years in which the amortization requirements of the Retirement Code result in an equivalent single amortization period that is longer than the maximum allowable period specifi ed by GASB 25 (40 years for fi scal years ending on or before June 30, 2006; and 30 years for subsequent fi scal years), the GASB 25 amortization payment will be set equal to the level dollar amount that will amortize the unfunded accrued liability over a period equal to the maximum allowable period specifi ed by GASB 25.
Actuarial Cost Method for Health Insurance Funding: The actuarial liability equals the assets in the health insurance account, and the results of the June 30 valuation determine the contribution rate for the second succeeding fi scal year. The rate so determined is the rate necessary to establish reserves suffi cient to cover administrative expenses and provide premium assistance payments for all participating eligible annuitants during the third fi scal year that follows the valuation date.
Actuarial Cost Method for GASB 43 Accounting for Health Insurance: The actuarial liability is determined under the entry age actuarial cost method, and the Annual Required Contribution (ARC) for the fi scal year that follows the valuation date is equal to the entry age normal cost for health insurance plus an amount that will amortize the entry age unfunded actuarial liability for health insurance over a period of 30 years.
DATACensus and Assets: The valuation was based on members of the Retirement System as of June 30, 2008 and does not take into account future members. All census data was supplied by the Retirement System and was subject to reasonable consistency checks. The actuary adjusts the data to account for service and pay earned by members on or before the valuation that is not reported by the Retirement System until after the actuarial valuation is performed. Asset data was supplied by the Retirement System.

Actuarial Section
Page 129
Table 13
Summary of Benefi t and Contribution Provisions
MembershipFor valuation purposes, all employees are considered to be full coverage. All employees who become members on and after January 1, 1966 are members of the dual coverage group. Dual coverage members contribute to both PSERS and to Social Security.
Benefi ts
Superannuation Annuity
Eligibility Age 62, or age 60 with 30 years of service, or 35 years of service regardless of age.
Amount 2.5% of fi nal average salary times years of school service and intervening military service. 2% of fi nal average salary for non-school service and for members who do not elect Class T D coverage. Minimum of $100 per year of service. “Final average salary” means the highest average annual salary for any 3 years of service.
Annual salary is subject to a limit of $200,000, as adjusted under Section 401(a)(17). As of June 30, 2008, the adjusted limit is $225,000.
For members who elect coverage under Class T-D, the maximum benefi t is equal to the limit established by Section 415 of the Internal Revenue Code.
Early Retirement Annuity
Eligibility Age 55 with 25 years of service.
Amount Accrued benefi t as of date of retirement, reduced 1/4% for each month by which commencement of payments precedes Superannuation Age.
For members who elect coverage under Class T-D, the maximum benefi t is equal to the limit established by Section 415 of the Internal Revenue Code.

Actuarial Section
Page 130
Table 13
Summary of Benefi t and Contribution Provisions(Continued)
Withdrawal Annuity
Eligibility 5 years of service.
Amount Accrued benefi t deferred to superannuation retirement age or an actuarially reduced benefi t payable immediately. Actuarially equivalent benefi ts are based on 4% interest and the 1995 George B. Buck mortality tables, rated forward one year for males and unadjusted for females.
Disability Annuity
Eligibility 5 years of service.
Amount The standard single life annuity if the total number of credited service is greater than 16.667, otherwise the standard single life annuity multiplied by the lesser of the following ratios: (Y*/Y) or (16.667/Y) where Y is the number of years of credited service and Y* is the total years of credited service if the member were to continue as a school employee until superannuation retirement age (or at current age, if later). Minimum of $100 per year of service.
Return of Contributions
Eligibility Death or separation from service and member does not qualify for other benefi ts.
Amount Refund of accumulated deductions includes interest (less annuity payments received prior to death in the case of a retired member).
Death Benefi t
Eligibility Death of an active member or vestee who was eligible to receive an annuity.
Amount The present value of the annuity that would have been effective if the member retired on the day before death. Option 1 (see next page) assumed payable if no other option elected.

Actuarial Section
Page 131
Table 13
Summary of Benefi t and Contribution Provisions(Continued)
Normal and Optional Forms of Benefi ts
Normal Form: Life annuity with a guaranteed payment equal to member contributions with interest.
Option 1: Reduced benefi t with refund of balance of present value of annuity at retirement over payments received. If balance is less than $5,000, benefi t is paid in lump sum; otherwise, benefi ciary may elect annuity and/or lump sum.
Option 2: Joint and 100% survivorship annuity.
Option 3: Joint and 50% survivorship annuity.
Option 4: Benefi t of equivalent actuarial value, including lump sum payment of member contributions.
Health Care Premium Assistance
Eligibility Retired members who:
(a) have 24½ or more years of service, or
(b) are disability annuitants, or
(c) have 15 or more years of service and who both terminated school service and retired after attaining superannuation age and
(d) participate in the PSERS health options program or in an employer-sponsored health insurance program.
Amount Participating eligible annuitants receive health insurance premium assistance payments from the Health Insurance Account equal to the lesser of $100 per month or the actual monthly premium. All administrative expenses necessary to operate the health insurance premium assistance program are to be funded by the Health Insurance Account. The Health Insurance Account is credited with contributions of the Commonwealth and the employers.

Actuarial Section
Page 132
Table 13
Summary of Benefi t and Contribution Provisions(Continued)
ContributionsBy Members Members who elected coverage under Class T-D and who were
most recently enrolled prior to July 22, 1983 contribute at a rate of 6½% of compensation, while members who elected coverage under Class T-D and who were most recently enrolled on or after July 22, 1983 contribute at a rate of 7½% of compensation. Members who did not elect coverage under Class T-D and who were most recently enrolled prior to July 22, 1983 contribute at a rate of 5¼% of compensation, while members who did not elect coverage under Class T-D and who were most recently enrolled on or after July 22, 1983 and prior to July 1, 2001 contribute at a rate of 6¼% of compensation. Anyone who enrolls or re-enrolls on or after July 1, 2001 automatically has coverage under class T-D for subsequent school service and subsequent intervening military service, and must contribute at a rate of 7½% of compensation. Reduction in rate for a joint coverage member: 40% of Social Security tax, exclusive of disability and medical coverage portion.
By Commonwealth and School Districts Balance of required contribution determined as normal contribution,
accrued liability contribution, supplemental annuity contribution, experience adjustment factor and premium assistance contribution, is funded by the Commonwealth and the School Districts.
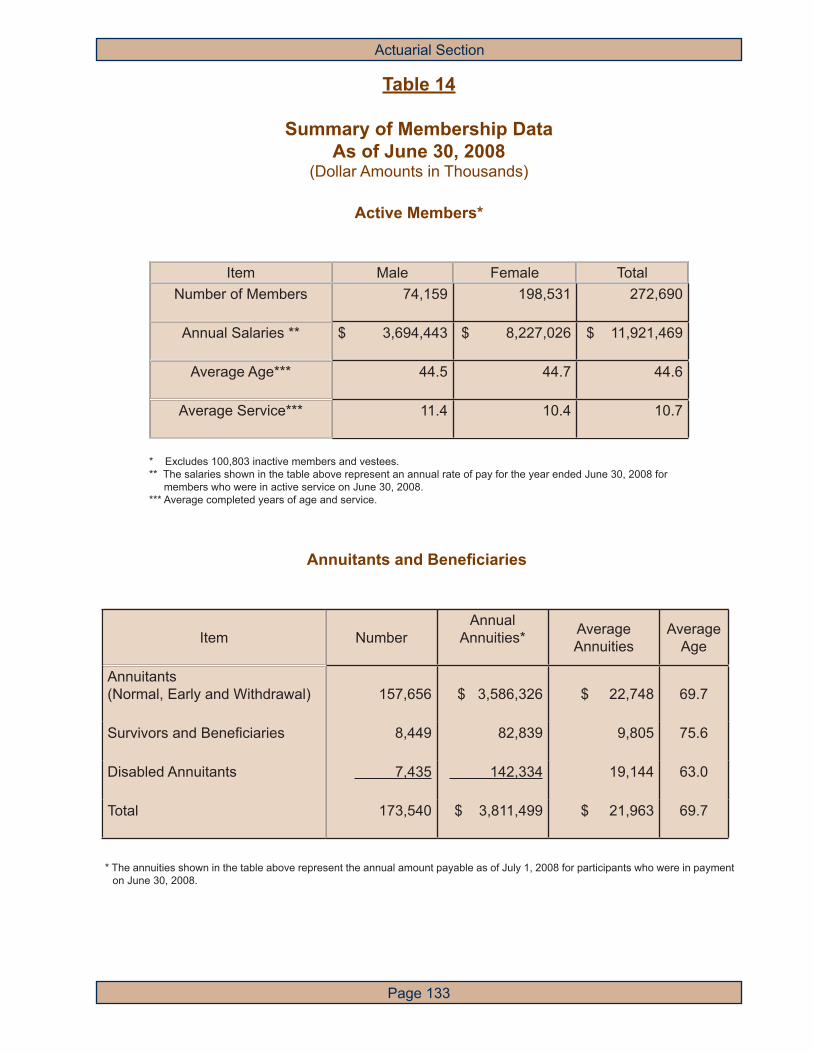
Actuarial Section
Page 133
Item NumberAnnual
Annuities* AverageAnnuities
AverageAge
Annuitants(Normal, Early and Withdrawal) 157,656 $ 3,586,326 $ 22,748 69.7
Survivors and Benefi ciaries 8,449 82,839 9,805 75.6
Disabled Annuitants 7,435 142,334 19,144 63.0
Total 173,540 $ 3,811,499 $ 21,963 69.7
Table 14
Summary of Membership DataAs of June 30, 2008
(Dollar Amounts in Thousands)
Active Members*
Item Male Female TotalNumber of Members 74,159 198,531 272,690
Annual Salaries ** $ 3,694,443 $ 8,227,026 $ 11,921,469
Average Age*** 44.5 44.7 44.6
Average Service*** 11.4 10.4 10.7
* Excludes 100,803 inactive members and vestees.** The salaries shown in the table above represent an annual rate of pay for the year ended June 30, 2008 for members who were in active service on June 30, 2008.*** Average completed years of age and service.
Annuitants and Benefi ciaries
* The annuities shown in the table above represent the annual amount payable as of July 1, 2008 for participants who were in payment on June 30, 2008.

Actuarial Section
Page 134
Years of Service
Age 0-4 5-9 10-14 15-19 20-24 25-29 30-34 35-39 40+ Total
Under 25 9,367 55 9,422$30,000 $29,488 $29,997
25-29 21,668 6,315 44 28,027$37,424 $47,116 $36,586 $39,607
30-34 10,047 13,473 3,318 37 26,875$34,922 $50,036 $57,052 $42,518 $45,241
35-39 9,915 8,751 10,089 2,496 63 31,314$27,218 $47,109 $60,395 $65,491 $42,924 $46,548
40-44 11,328 7,411 5,385 5,892 2,063 82 32,161$22,953 $37,323 $53,529 $65,813 $65,562 $45,303 $42,026
45-49 11,058 9,304 5,768 4,172 4,851 1,935 118 37,206$21,998 $32,253 $43,757 $57,788 $67,712 $63,701 $44,360 $40,149
50-54 8,048 8,504 7,033 5,521 4,486 6,049 4,325 59 44,025$22,489 $32,329 $40,609 $51,667 $61,744 $71,239 $72,055 $46,703 $46,543
55-59 5,474 5,092 5,057 5,477 4,955 3,621 7,387 2,194 29 39,286$23,760 $33,366 $40,907 $49,613 $58,054 $67,199 $76,205 $79,007 $47,795 $52,110
60-64 3,109 2,519 2,171 2,507 2,477 1,806 1,076 999 235 16,899$19,689 $30,219 $36,373 $43,594 $49,465 $56,031 $64,115 $77,960 $78,927 $42,294
Over 64 2,264 1,426 976 817 689 522 387 199 195 7,475$13,574 $21,264 $26,724 $32,436 $37,457 $37,426 $40,256 $51,431 $72,453 $26,612
Total 92,278 62,850 39,841 26,919 19,584 14,015 13,293 3,451 459 272,690$28,381 $39,992 $48,653 $55,228 $60,223 $65,783 $72,547 $76,562 $74,210 $43,718
Exhibit I
Active Membership Data as of June 30, 2008Number and Average Annual Salary

Actuarial Section
Page 135
Years of Service
Age 0-4 5-9 10-14 15-19 20-24 25-29 30-34 35-39 40+ Total
Under 50 2,343 1,235 370 123 26 4,097$804 $1,839 $4,369 $8,524 $14,342 $1,756
50-54 632 1,014 511 271 189 127 13 2,757$1,421 $1,751 $4,463 $9,815 $20,503 $30,184 $32,660 $5,712
55-59 553 2,041 1,123 775 1,329 6,489 3,281 3 15,594$2,574 $2,103 $6,275 $12,720 $27,231 $44,546 $55,316 $28,558 $33,952
60-64 191 718 3,092 2,195 1,862 2,985 11,662 8,965 245 31,915$5,759 $3,862 $3,103 $8,545 $16,650 $28,306 $39,614 $53,938 $60,434 $34,719
65-69 640 1,136 2,975 3,090 2,950 3,656 8,347 5,897 726 29,417$2,676 $3,136 $4,255 $8,744 $15,134 $23,497 $33,877 $44,193 $58,443 $25,880
70-74 690 1,008 2,756 2,625 3,115 3,435 4,914 3,457 1,007 23,007$1,233 $2,420 $3,753 $7,084 $11,820 $19,376 $28,981 $37,278 $45,506 $19,677
75-79 758 1,031 2,580 2,625 2,889 3,184 3,428 2,482 1,052 20,029$4,748 $1,922 $3,442 $6,195 $11,042 $17,207 $25,303 $34,872 $41,619 $16,700
80-84 843 990 2,353 2,450 2,602 2,364 1,927 1,596 742 15,867$6,108 $1,747 $3,361 $6,255 $10,739 $16,318 $21,880 $28,176 $38,831 $13,397
85-89 691 665 1,536 1,572 1,355 1,272 865 948 304 9,208$6,044 $1,727 $3,318 $6,050 $9,763 $14,002 $18,798 $23,327 $31,324 $10,737
Over 89 241 465 957 889 806 726 572 679 430 5,765$2,857 $2,150 $3,856 $6,586 $10,366 $13,649 $18,305 $21,905 $25,768 $11,435
Total 4,054 9,541 20,539 17,450 16,748 19,166 38,331 27,318 4,509 157,656$4,261 $1,975 $3,238 $7,006 $12,387 $20,791 $34,846 $44,786 $43,545 $22,748
Exhibit II
The Number and Average Annual AnnuityAs of June 30, 2008
Retired on Account of Superannuation,Early Retirement and Those in Receipt of
Withdrawal Annuities
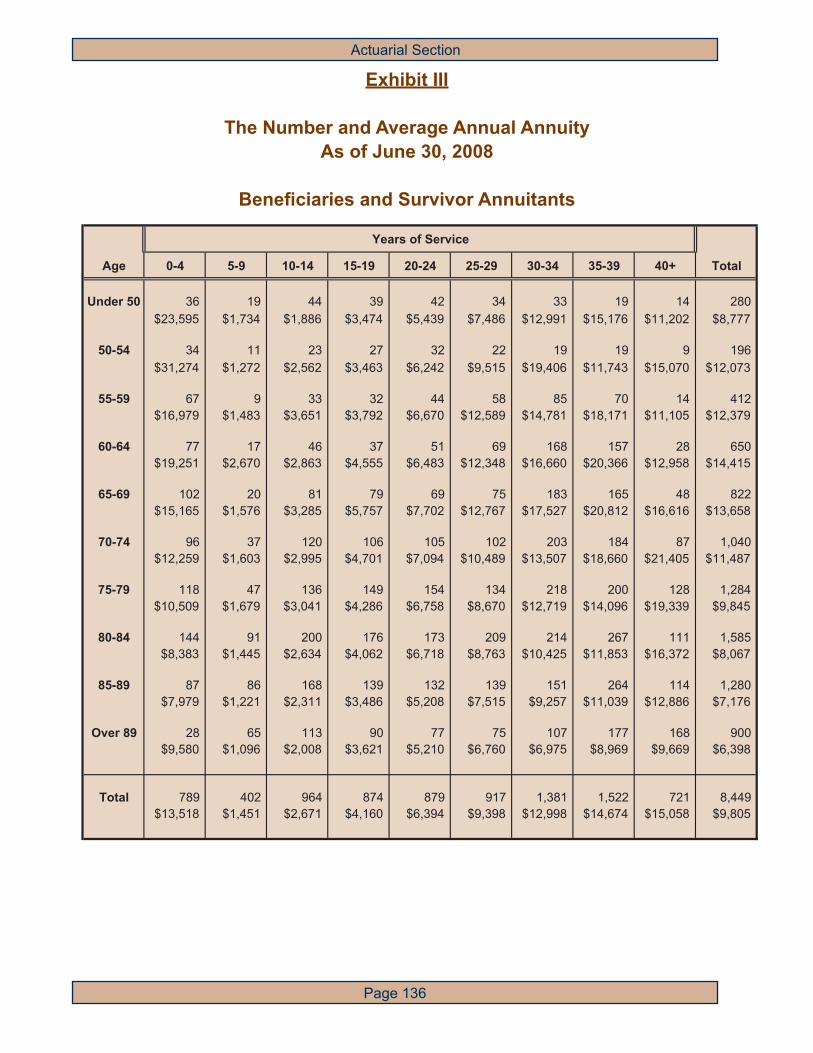
Actuarial Section
Page 136
EXHIBIT III
THE NUMBER AND AVERAGE ANNUAL ANNUITYAS OF JUNE 30, 2008
BENEFICIARIES AND SURVIVOR ANNUITANTS
Years of Service
Age 0-4 5-9 10-14 15-19 20-24 25-29 30-34 35-39 40+ Total
Under 50 36 19 44 39 42 34 33 19 14 280$23,595 $1,734 $1,886 $3,474 $5,439 $7,486 $12,991 $15,176 $11,202 $8,777
50-54 34 11 23 27 32 22 19 19 9 196$31,274 $1,272 $2,562 $3,463 $6,242 $9,515 $19,406 $11,743 $15,070 $12,073
55-59 67 9 33 32 44 58 85 70 14 412$16,979 $1,483 $3,651 $3,792 $6,670 $12,589 $14,781 $18,171 $11,105 $12,379
60-64 77 17 46 37 51 69 168 157 28 650$19,251 $2,670 $2,863 $4,555 $6,483 $12,348 $16,660 $20,366 $12,958 $14,415
65-69 102 20 81 79 69 75 183 165 48 822$15,165 $1,576 $3,285 $5,757 $7,702 $12,767 $17,527 $20,812 $16,616 $13,658
70-74 96 37 120 106 105 102 203 184 87 1,040$12,259 $1,603 $2,995 $4,701 $7,094 $10,489 $13,507 $18,660 $21,405 $11,487
75-79 118 47 136 149 154 134 218 200 128 1,284$10,509 $1,679 $3,041 $4,286 $6,758 $8,670 $12,719 $14,096 $19,339 $9,845
80-84 144 91 200 176 173 209 214 267 111 1,585$8,383 $1,445 $2,634 $4,062 $6,718 $8,763 $10,425 $11,853 $16,372 $8,067
85-89 87 86 168 139 132 139 151 264 114 1,280$7,979 $1,221 $2,311 $3,486 $5,208 $7,515 $9,257 $11,039 $12,886 $7,176
Over 89 28 65 113 90 77 75 107 177 168 900$9,580 $1,096 $2,008 $3,621 $5,210 $6,760 $6,975 $8,969 $9,669 $6,398
Total 789 402 964 874 879 917 1,381 1,522 721 8,449$13,518 $1,451 $2,671 $4,160 $6,394 $9,398 $12,998 $14,674 $15,058 $9,805
Exhibit III
The Number and Average Annual AnnuityAs of June 30, 2008
Benefi ciaries and Survivor Annuitants

Actuarial Section
Page 137
EXHIBIT IV
THE NUMBER AND AVERAGE ANNUAL ANNUITIESAS OF JUNE 30, 2008
RETIRED ON ACCOUNT OF DISABILITY
Years of Service
Age 0-4 5-9 10-14 15-19 20-24 25-29 30-34 35-39 40+ Total
Under 50 226 150 97 38 14 525$18,054 $20,055 $32,167 $61,045 $78,991 $25,970
50-54 195 172 144 133 114 20 1 779$16,202 $19,116 $20,864 $32,297 $51,742 $76,709 $32,568 $27,230
55-59 277 282 238 258 364 184 2 1,605$13,337 $14,973 $17,972 $27,896 $37,573 $53,479 $41,372 $26,785
60-64 239 309 286 309 332 170 5 1,650$8,141 $10,555 $13,303 $21,994 $30,179 $40,174 $55,638 $19,961
65-69 187 275 237 222 163 43 1,127$5,492 $7,939 $10,334 $16,656 $25,208 $30,939 $13,129
70-74 130 192 159 123 81 15 3 703$5,470 $6,906 $8,684 $14,358 $19,957 $29,416 $43,058 $10,485
75-79 99 133 113 106 43 7 1 502$3,864 $5,763 $8,600 $12,984 $20,278 $26,313 $54,601 $9,179
80-84 67 92 48 58 40 7 1 313$3,868 $6,036 $7,992 $11,727 $16,379 $24,413 $24,751 $8,719
85-89 37 38 24 27 20 11 2 159$3,619 $6,077 $7,587 $10,608 $15,478 $20,993 $35,460 $9,086
Over 89 11 21 18 6 7 9 72$3,307 $4,725 $7,955 $10,451 $14,764 $18,692 $8,515
Total 1,468 1,664 1,364 1,280 1,178 466 14 1 7,435$10,511 $11,383 $14,455 $22,248 $32,569 $44,484 $44,168 $54,601 $19,144
Exhibit IV
The Number and Average Annual AnnuityAs of June 30, 2008
Retired on Account of Disability

Actuarial Section
Page 138
Annual Benefit Average AnnualAge Last Birthday Number (Thousands) Benefit
Annuitants(Normal, Early and Withdrawal)
Under 60 22,448 $ 552,390 $ 24,60860 - 64 31,915 1,108,060 34,71965 - 69 29,417 761,314 25,88070 - 74 23,007 452,713 19,67775 - 79 20,029 334,483 16,700Over 79 30,840 377,366 12,236
Total 157,656 $ 3,586,326 $ 22,748
Survivors and Beneficiaries
Under 60 888 $ 9,924 $ 11,17660 - 64 650 9,370 14,41565 - 69 822 11,227 13,65870 - 74 1,040 11,946 11,48775 - 79 1,284 12,641 9,845Over 79 3,765 27,731 7,365
Total 8,449 $ 82,839 $ 9,805
Disabled Annuitants
Under 60 2,909 $ 77,837 $ 26,75760 - 64 1,650 32,935 19,96165 - 69 1,127 14,797 13,13070 - 74 703 7,371 10,48575 - 79 502 4,608 9,179Over 79 544 4,786 8,798
Total 7,435 $ 142,334 $ 19,144
Grand TotalAverage Annual Benefit 173,540 $ 3,811,499 $ 21,963
Exhibit V
Annuitant and Benefi ciary Membership DataAs of June 30, 2008
Number and Average Annual Benefi tExcludes Partial Lump Sum Payments

Actuarial Section
Page 139
Valuationas of
June 30
Number ofActive
Members
PercentageChange in
Membership
Total AnnualPayroll
(Dollars in(Thousands)
PercentageChange in
Payroll
2008 272,690 3.28% $ 11,921,469 4.48%2007 264,023 0.26% 11,410,257 (0.08%)2006 263,350 3.09% 11,419,049 8.47%2005 255,465 3.05% 10,527,668 4.95%2004 247,901 0.49% 10,030,705 3.91%2003 246,700 1.68% 9,652,881 2.92%2002 242,616 (0.29%) 9,378,944 (0.38%)2001 243,311 3.89% 9,414,884 5.32%2000 234,210 4.79% 8,939,598 8.39%1999 223,495 1.27% 8,247,602 1.93%
Exhibit VI
10 year History of Membership Data
Active Members

Actuarial Section
Page 140
YearEndedJune
30Numberon roll
AnnualAnnuities(Dollars in Millions)
AverageAnnual
Annuities Additions *
AnnualAnnuities *(Dollars in
Millions) Deletions *
AnnualAnnuities *(Dollars inMillions)
PercentageChange in
Membership
PercentageChange inAnnuities
2008 173,540 $ 3,811.5 $ 21,963 10,911 $ 345.3 5,397 $ 73.9 3.28% 8.18%
2007 168,026 3,523.4 20,970 10,612 307.5 4,399 56.0 3.84% 7.60%
2006 161,813 3,274.5 20,236 10,637 5,343 3.38% 8.16%
2005 156,519 3,027.6 19,343 10,050 5,083 3.28% 8.20%
2004 151,552 2,798.2 18,464 10,526 4,667 4.02% 9.94%
2003 145,693 2,545.1 17,469 9,079 4,800 3.03% 13.20%
2002 141,414 2,248.3 15,899 13,003 4,305 6.55% 20.10%
2001 132,716 1,872.0 14,105 3,140 4,482 (1.00)% 0.00%
2000 134,058 1,880.6 14,028 5,923 4,734 0.89% 2.73%
1999 132,869 1,830.6 13,777 10,609 4,554 4.88% 26.51%
Exhibit VI(Continued)
10 Year History of Membership Data
The Number and Annual Annuities ofAnnuitant and Survivor Annuitant Members
* The annual annuities added and deleted are for the annuitants and survivor annuitants who were added and deleted. Changes in annuities for continuing payees may also occur due to fi nalization of benefi t calculations and due to the commencement of supplemental annuity payments.

Actuarial
Introduction
- Trend Data
- Historical Plan
Net Assets
- Historical Changes
Plan Net Assets
- Membership Trends
Statistical
- Employers

Statistical Section
Page 142
Statistical SectionNarrative
To assist readers in the assessment of the System’s economic condition, the Statistical Section of this Comprehensive Annual Financial Report presents information to add historical perspective, context, and detail to the fi nancial statements, notes to fi nancial statements, and required supplementary information presented in the preceding sections. To provide historical perspective and a sense of trend, the exhibits in this Section are presented in multiple-year formats. The information is categorized into four topical groups: Financial Trends, Revenue Capacity, Demographic and Economic Information, and Operating Information.
Financial Trends
The Schedule of Trend Data provides key fi nancial, actuarial, and demographic information for a ten-year period ended June 30, 2009.
The Schedules of Total Changes in Pension Plan Net Assets and Total Changes in Postemployment Healthcare Plans Net Assets show the historical combined effects of the additions and deductions of the plans’ net assets over the ten-year period ended June 30, 2009.
The graphs of Additions to Pension Plan Net Assets and Additions to Postemployment Healthcare Plans Net Assets provide visual details of the additions to the plans’ net assets over the ten-year period ended June 30, 2009.
The graphs of Deductions from Pension Plan Net Assets and Deductions from Postemployment Healthcare Plans Net Assets provide visual details of the deductions from the plans’ net assets over the ten-year period ended June 30, 2009.
Revenue Capacity
The Schedules of Pension Investment Income, Premium Assistance Investment Income, and Health Options Program Investment Income provide a ten-year perspective on the System’s largest source of revenue, Net Investment Income, over the ten-year period ended June 30, 2009.
Demographic and Economic Information
The Schedule of Summary Membership Data provides general populations and statistics relating to the System’s active membership over the ten-year period ended June 30, 2008.
The Schedule of Summary Annuity Data provides general populations and statistics relating to the System’s annuitants over the ten-year period ended June 30, 2008.
The Components of Total Contribution Rate Schedule provides a long-term historical perspective of the actuarially required contribution rates to the System’s members and employers.
The Schedule of Pension Benefi t and Refund Deductions from Plan Net Assets provides summary statistics by payment type relating to retirement and refunds over the ten-year period ended June 30, 2009.
The Schedule of Average Monthly Pension Benefi t Payments provides summary statistics of monthly average pension benefi ts and counts of recipients, by payment type, grouped in fi ve-year increments of member credited service over the ten-year period ended June 30, 2008.
Operating Information
The list of Ten Largest Employers shows the System’s ten largest employers in terms of reported annual salaries during FY 2009 and the Schedule of Employers provides the full list of PSERS’ employers.
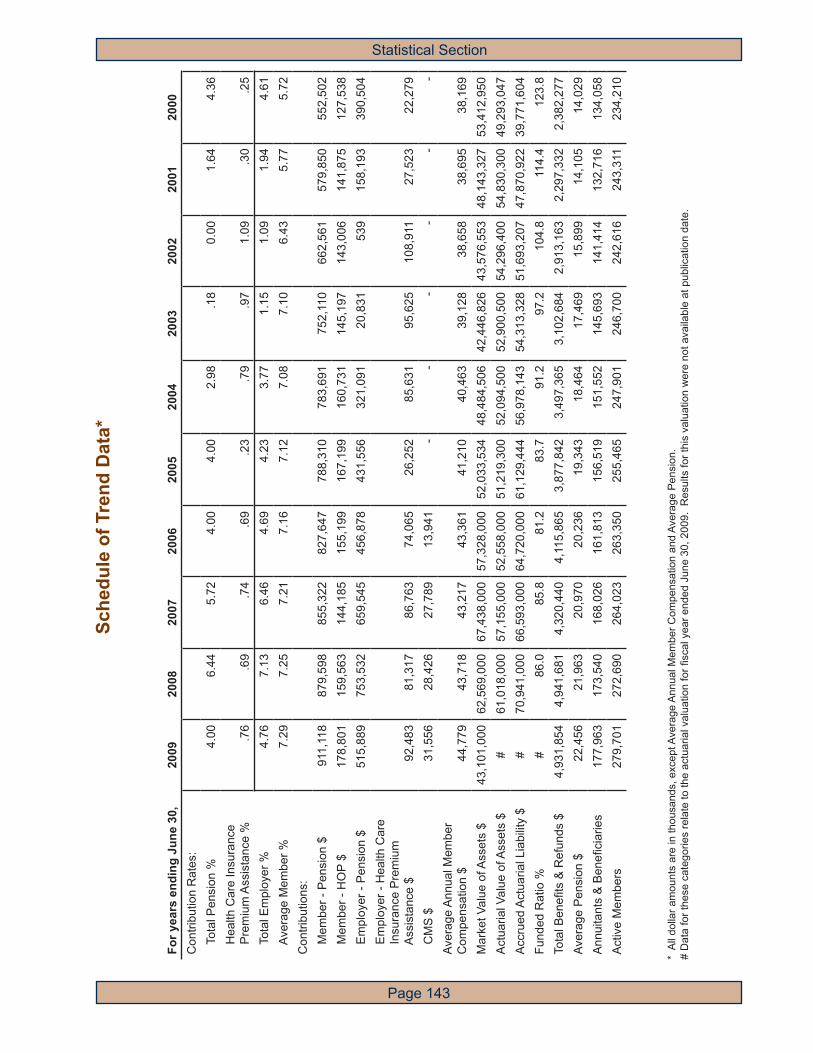
Statistical Section
Page 143
For y
ears
end
ing
June
30,
2009
2008
2007
2006
2005
2004
2003
2002
2001
2000
Con
tribu
tion
Rat
es:
To
tal P
ensi
on %
4.00
6.44
5.72
4.00
4.00
2.98
.18
0.00
1.64
4.36
H
ealth
Car
e In
sura
nce
P
rem
ium
Ass
ista
nce
%.7
6.6
9.7
4.6
9.2
3.7
9.9
71.
09.3
0.2
5
Tota
l Em
ploy
er %
4.76
7.13
6.46
4.69
4.23
3.77
1.15
1.09
1.94
4.61
Av
erag
e M
embe
r %7.
297.
257.
217.
167.
127.
087.
106.
435.
775.
72C
ontri
butio
ns:
M
embe
r - P
ensi
on $
911,
118
879,
598
855,
322
827,
647
788,
310
783,
691
752,
110
662,
561
579,
850
552,
502
M
embe
r - H
OP
$17
8,80
115
9,56
314
4,18
515
5,19
916
7,19
916
0,73
114
5,19
714
3,00
614
1,87
512
7,53
8
Em
ploy
er -
Pen
sion
$51
5,88
975
3,53
265
9,54
545
6,87
843
1,55
632
1,09
120
,831
539
158,
193
390,
504
E
mpl
oyer
- H
ealth
Car
e
Insu
ranc
e P
rem
ium
A
ssis
tanc
e $
92,4
8381
,317
86,7
6374
,065
26,2
5285
,631
95,6
2510
8,91
127
,523
22,2
79
CM
S $
31,5
5628
,426
27,7
8913
,941
--
--
--
Aver
age
Ann
ual M
embe
r C
ompe
nsat
ion
$44
,779
43,7
1843
,217
43,3
6141
,210
40,4
6339
,128
38,6
5838
,695
38,1
69M
arke
t Val
ue o
f Ass
ets
$43
,101
,000
62,5
69,0
0067
,438
,000
57,3
28,0
0052
,033
,534
48,4
84,5
0642
,446
,826
43,5
76,5
5348
,143
,327
53,4
12,9
50A
ctua
rial V
alue
of A
sset
s $
#61
,018
,000
57,1
55,0
0052
,558
,000
51,2
19,3
0052
,094
,500
52,9
00,5
0054
,296
,400
54,8
30,3
0049
,293
,047
Acc
rued
Act
uaria
l Lia
bilit
y $
#70
,941
,000
66,5
93,0
0064
,720
,000
61,1
29,4
4456
,978
,143
54,3
13,3
2851
,693
,207
47,8
70,9
2239
,771
,604
Fund
ed R
atio
%#
86.0
85.8
81.2
83.7
91.2
97.2
104.
811
4.4
123.
8To
tal B
enefi
ts &
Ref
unds
$4,
931,
854
4,94
1,68
14,
320,
440
4,11
5,86
53,
877,
842
3,49
7,36
53,
102,
684
2,91
3,16
32,
297,
332
2,38
2,27
7Av
erag
e P
ensi
on $
22,4
5621
,963
20,9
7020
,236
19,3
4318
,464
17,4
6915
,899
14,1
0514
,029
Ann
uita
nts
& B
enefi
cia
ries
177,
963
173,
540
168,
026
161,
813
156,
519
151,
552
145,
693
141,
414
132,
716
134,
058
Act
ive
Mem
bers
279,
701
272,
690
264,
023
263,
350
255,
465
247,
901
246,
700
242,
616
243,
311
234,
210
Sche
dule
of T
rend
Dat
a*Sc
hedu
le o
f Tre
nd D
ata*
* A
ll do
llar a
mou
nts
are
in th
ousa
nds,
exc
ept A
vera
ge A
nnua
l Mem
ber C
ompe
nsat
ion
and
Aver
age
Pen
sion
.#
Dat
a fo
r the
se c
ateg
orie
s re
late
to th
e ac
tuar
ial v
alua
tion
for fi
sca
l yea
r end
ed J
une
30, 2
009.
Res
ults
for t
his
valu
atio
n w
ere
not a
vaila
ble
at p
ublic
atio
n da
te.

Statistical Section
Page 144
Add
ition
s to
Pla
n N
et A
sset
sD
educ
tions
from
Pla
n N
et A
sset
s
Year
End
ing
June
30
Mem
ber
Con
tribu
tions
Em
ploy
erC
ontri
butio
ns
Net
Inve
stm
ent
Inco
me
Tota
lA
dditi
ons
Mon
thly
B
enefi
ts
Lum
p-S
uman
d In
stal
lmen
tR
efun
ds o
f C
ontri
butio
nsA
dmin
istra
tive
Net
Tran
sfer
s *
Tota
lD
educ
tions
Net
Incr
ease
/ (D
ecre
ase)
2009
$
91
1,11
8 $
515
,889
$
(16
,201
,701
) $
(
14,7
74,6
94)
$ 3
,885
,286
$
754
,011
$
20,
369
$
3
5,63
9 $
7
,947
$
4,7
03,2
52
$ (1
9,47
7,94
6)
2008
879,
598
753
,532
(1
,782
,628
)(1
49,4
98)
3,6
23,6
52
1,0
12,6
88
28,
713
35,
863
17,
157
4,7
18,0
73
(4,8
67,5
71)
2007
855,
322
659,
545
12,6
94,3
27
14,
209,
194
3,1
89,0
04
855
,431
1
8,18
0 3
5,23
9 6,
010
4,1
03,8
64
10,
105,
330
2006
827,
647
456
,878
7,
935,
586
9,22
0,11
1 3
,030
,297
8
30,3
61
16,
330
35,
391
8,4
62
3,9
20,8
41
5,29
9,27
0
2005
788,
310
431,
556
6,07
6,48
2 7,
296,
348
2,9
47,7
49
692
,089
1
6,23
3 32
,670
1
0,85
9 3
,699
,600
3,
596,
748
2004
783,
691
321
,091
8,
242,
008
9,34
6,79
0 2
,692
,485
5
59,9
39
14,7
67
40,
014
16,
315
3,3
23,5
20
6,0
23,2
70
2003
752,
110
20,
831
1,02
0,73
3 1
,793
,674
2
,404
,697
48
5,49
5 1
3,94
3 34
,293
1
2,11
6 2
,950
,544
(1
,156
,870
)
2002
662,
561
539
(2,5
25,6
33)
(1,8
62,5
33)
2,1
11,9
41
595
,184
1
4,85
8 29
,756
9
,434
2
,761
,173
(4
,623
,706
)
2001
579,
850
158,
193
(3,8
47,9
49)
(3,1
09,9
06)
1,9
14,0
62
176
,228
2
2,36
9 31
,335
1
0,86
7 2
,154
,861
(5
,264
,767
)
2000
552,
502
390,
504
5,76
1,02
4 6
,704
,030
1
,894
,418
3
06,3
29
22,
446
25,
837
4,7
10
2,2
53,7
40
4,4
50,2
90
Sche
dule
of T
otal
Cha
nges
in P
ensi
on P
lan
Net
Ass
ets
Sche
dule
of T
otal
Cha
nges
in P
ensi
on P
lan
Net
Ass
ets
10 Y
ear T
rend
10 Y
ear T
rend
(Dol
lar A
mou
nts
in T
hous
ands
)(D
olla
r Am
ount
s in
Tho
usan
ds)
* N
et tr
ansf
ers
to th
e C
omm
onw
ealth
of P
enns
ylva
nia
Sta
te E
mpl
oyee
s’ R
etire
men
t Sys
tem
.
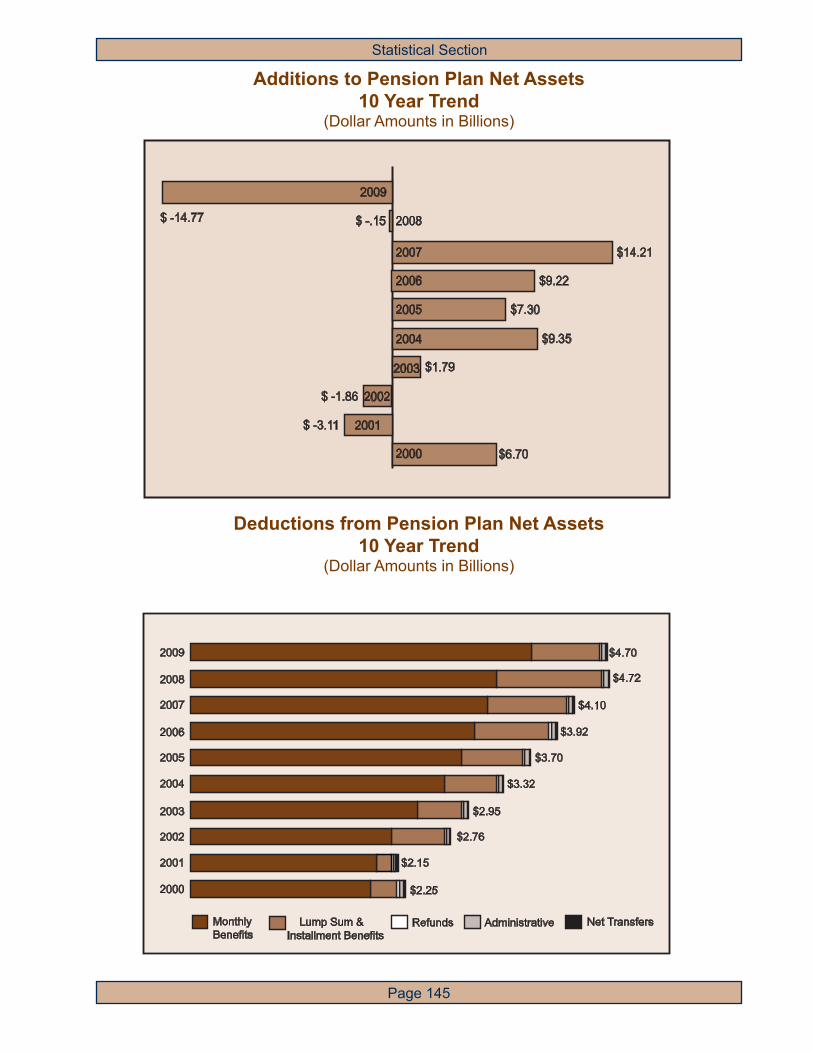
Statistical Section
Page 145
Additions to Pension Plan Net AssetsAdditions to Pension Plan Net Assets10 Year Trend10 Year Trend
(Dollar Amounts in Billions)(Dollar Amounts in Billions)
Deductions from Pension Plan Net AssetsDeductions from Pension Plan Net Assets10 Year Trend10 Year Trend
(Dollar Amounts in Billions)(Dollar Amounts in Billions)
2001
2000 $6.70
$ -3.11
$ -1.86
$ -.15
$1.79
$ -14.77
2003
2002
2004
2005
2006
2007
2009
2008
$9.35
$7.30
$9.22
$14.21
2007
2008
2009
Refunds Administrative
2006
2005
2004
2003
2002
2001
2000 $2.25
Net Transfers
$2.15
$2.76
$3.32
$2.95
$3.70
$3.92
$4.10
$4.72
$4.70
Monthly Benefits
Lump Sum &Installment Benefits

Statistical Section
Page 146
Sche
dule
of T
otal
Cha
nges
in P
oste
mpl
oym
ent H
ealth
care
Pla
ns N
et A
sset
sSc
hedu
le o
f Tot
al C
hang
es in
Pos
tem
ploy
men
t Hea
lthca
re P
lans
Net
Ass
ets
10 Y
ear T
rend
10 Y
ear T
rend
(Dol
lar A
mou
nts
in T
hous
ands
)(D
olla
r Am
ount
s in
Tho
usan
ds)
Prem
ium
Ass
ista
nce
Prem
ium
Ass
ista
nce
Hea
lth O
ptio
ns P
rogr
amH
ealth
Opt
ions
Pro
gramA
dditi
ons
to P
lan
Net
Ass
ets
Add
ition
s to
Pla
n N
et A
sset
sD
educ
tions
from
Pla
n N
et A
sset
sD
educ
tions
from
Pla
n N
et A
sset
s
Year
Year
Endi
ng
Endi
ng
June
30
June
30
Empl
oyer
Empl
oyer
Con
trib
utio
nsC
ontr
ibut
ions
Net
Net
Inve
stm
ent
Inve
stm
ent
Inco
me
Inco
me
Tota
lTo
tal
Add
ition
sA
dditi
ons
Ben
efi ts
Ben
efi ts
Adm
inis
trat
ive
Adm
inis
trat
ive
Tota
lTo
tal
Ded
uctio
nsD
educ
tions
Net
Incr
ease
/N
et In
crea
se /
Dec
reas
eD
ecre
ase
2009
$
92,4
93
$
1,8
61
$
9
4,35
4 $
83,
206
$
1
,819
$
85,
025
$
9,3
29
2008
81,3
17
2,7
55
8
4,07
2 84
,335
1,
244
85,5
79
(
1,50
7)
2007
86,7
63
2,5
73
89,3
36
82,0
31
2,79
0 84
,821
4
,515
2006
74,0
65
2,8
50
76
,915
79
,298
1,
977
81,2
75
(4,3
60)
2005
26,2
52
2,3
69
28,6
21
74,4
65
1,87
6 76
,341
(47,
720)
2004
85,6
31
1,5
91
87,2
22
71,0
98
1,71
4 72
,812
14,
410
2003
95,6
25
1,1
38
96,7
63
67,6
88
1,93
2 69
,620
27,
143
2002
108,
911
1,5
73
11
0,48
4 51
,738
1,
814
53,5
52
5
6,93
2
2001
27,5
23
2,5
12
3
0,03
5 33
,894
99
7 34
,891
(4,8
56)
2000
22,2
79
2,60
3
24
,882
32
,949
1,
024
33,9
73
(
9,09
1)
Add
ition
s to
Pla
n N
et A
sset
sA
dditi
ons
to P
lan
Net
Ass
ets
Ded
uctio
ns fr
om P
lan
Net
Ass
ets
Ded
uctio
ns fr
om P
lan
Net
Ass
ets
Year
Year
Endi
ng
Endi
ng
June
30
June
30
Mem
ber
Mem
ber
Con
trib
utio
nsC
ontr
ibut
ions
CM
SC
MS
Con
trib
utio
nsC
ontr
ibut
ions
Net
Net
Inve
stm
ent
Inve
stm
ent
Inco
me
Inco
me
Tota
lTo
tal
Add
ition
sA
dditi
ons
Ben
efi ts
Ben
efi ts
Adm
inis
trat
ive
Adm
inis
trat
ive
Tota
lTo
tal
Ded
uctio
nsD
educ
tions
Net
Incr
ease
/ N
et In
crea
se /
(Dec
reas
e)(D
ecre
ase)
2009
$
17
8,80
1 $
31,5
56
$
1,
528
$
21
1,88
5 $
181,
035
$
13
,817
$
194,
852
$
17
,033
2008
159,
563
28,4
26
4,28
8 19
2,27
7 17
5,13
6 12
,143
18
7,27
9 4,
998
2007
144,
185
27,7
89
5,82
1 17
7,79
5 16
9,78
4 12
,453
18
2,23
7 (4
,442
)
2006
155,
199
13,9
41
4,20
3 17
3,34
3 15
1,11
7 11
,261
16
2,37
8 10
,965
2005
167,
199
-2,
646
169,
845
136,
447
8,09
9 14
4,54
6 25
,299
2004
160,
731
-1,
005
161,
736
142,
761
7,47
4 15
0,23
5 11
,501
2003
145,
197
-59
6 14
5,79
3 11
8,74
5 6,
053
124,
798
20,9
95
2002
143,
006
-1,
035
144,
041
130,
008
3,80
3 13
3,81
1 10
,230
2001
141,
875
-1,
724
143,
599
139,
912
2,52
2 14
2,43
4 1,
165
2000
127,
538
-1,
506
129,
044
121,
425
2,47
2 12
3,89
7 5,
147

Statistical Section
Page 147
Additions to Postemployment Healthcare Plans Net AssetsAdditions to Postemployment Healthcare Plans Net Assets10 Year Trend10 Year Trend
(Dollar Amounts in Millions)(Dollar Amounts in Millions)
Premium Assistance
Health Options Program
2009
Employer Contributions Net Investment Income / (Loss)
2008
2007
2006
2005
2004
2003
2002
2001
2000
$30.0
$24.9
$110.5
$96.8
$94.4
$87.2
$28.6
$76.9
$89.3
$84.1
2009
Members Contributions
CMS Contributions
Net Investment Income /(Loss)
2008
2007
2006
2005
2004
2003
2002
2001
2000
$143.6
$129.0
$144.0
$145.8
$211.9
$161.7
$169.8
$173.3
$177.8
$192.3
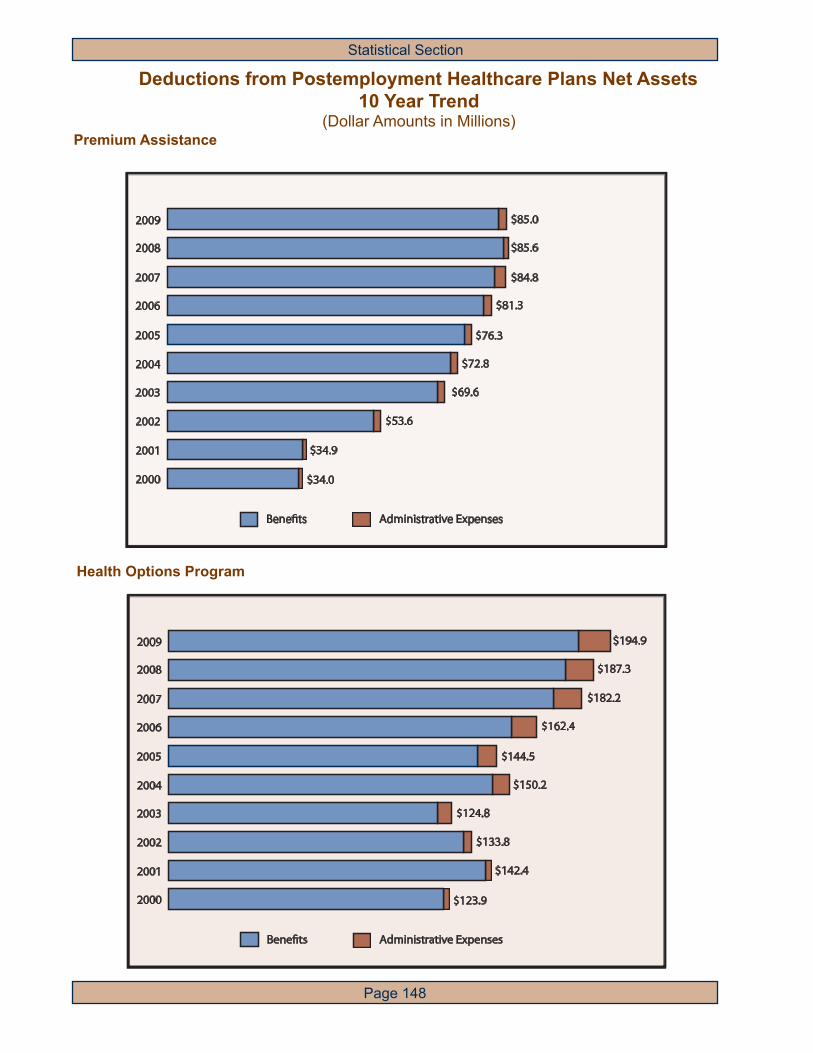
Statistical Section
Page 148
Deductions from Postemployment Healthcare Plans Net Assets10 Year Trend
(Dollar Amounts in Millions)Premium Assistance
Health Options Program
2009
Benefits Administrative Expenses
2008
2007
2006
2005
2004
2003
2002
2001
2000
$34.9
$34.0
$53.6
$69.6
$85.0
$72.8
$76.3
$81.3
$84.8
$85.6
2009
Benefits Administrative Expenses
2008
2007
2006
2005
2004
2003
2002
2001
2000
$142.4
$123.9
$133.8
$124.8
$194.9
$150.2
$144.5
$162.4
$182.2
$187.3
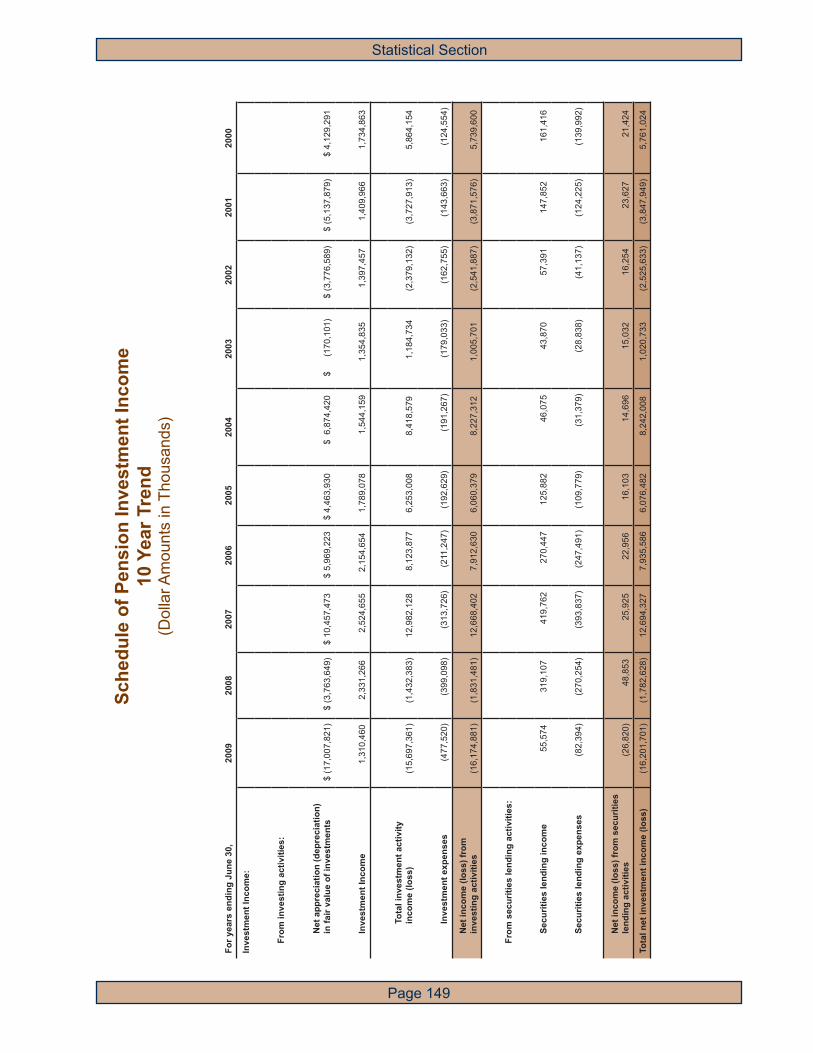
Statistical Section
Page 149
For y
ears
end
ing
June
30,
2009
2008
2007
2006
2005
2004
2003
2002
2001
2000
Inve
stm
ent I
ncom
e:
F
rom
inve
stin
g ac
tiviti
es:
Net
app
reci
atio
n (d
epre
ciat
ion)
in
fair
valu
e of
inve
stm
ents
$ (1
7,00
7,82
1)$
(3,7
63,6
49)
$ 10
,457
,473
$ 5,
969,
223
$ 4,
463,
930
$
6,8
74,4
20$
(
170,
101)
$ (3
,776
,589
)$
(5,1
37,8
79)
$ 4,
129,
291
Inv
estm
ent I
ncom
e1,
310,
460
2,33
1,26
62,
524,
655
2,15
4,65
41,
789,
078
1,54
4,15
9
1,35
4,83
51,
397,
457
1,40
9,96
61,
734,
863
Tota
l inv
estm
ent a
ctiv
ity
in
com
e (lo
ss)
(15,
697,
361)
(1,4
32,3
83)
12,9
82,1
288,
123,
877
6,25
3,00
88,
418,
579
1,18
4,73
4(2
,379
,132
)(3
,727
,913
)5,
864,
154
Inve
stm
ent e
xpen
ses
(477
,520
)(3
99,0
98)
(313
,726
)(2
11,2
47)
(192
,629
)(1
91,2
67)
(
179,
033)
(162
,755
)(1
43,6
63)
(124
,554
)
Net
inco
me
(loss
) fro
m
i
nves
ting
activ
ities
(16,
174,
881)
(1,8
31,4
81)
12,6
68,4
027,
912,
630
6,06
0,37
98,
227,
312
1,00
5,70
1(2
,541
,887
)(3
,871
,576
)5,
739,
600
F
rom
sec
uriti
es le
ndin
g ac
tiviti
es:
Sec
uriti
es le
ndin
g in
com
e55
,574
319,
107
419,
762
270,
447
125,
882
46,0
7543
,870
57,3
9114
7,85
216
1,41
6
Sec
uriti
es le
ndin
g ex
pens
es(8
2,39
4)(2
70,2
54)
(393
,837
)(2
47,4
91)
(109
,779
)
(31,
379)
(28,
838)
(41,
137)
(124
,225
)(1
39,9
92)
Net
inco
me
(loss
) fro
m s
ecur
ities
len
ding
act
iviti
es(2
6,82
0)48
,853
25,9
2522
,956
16,1
0314
,696
15,0
32
16,2
5423
,627
21,4
24
Tota
l net
inve
stm
ent i
ncom
e (lo
ss)
(16,
201,
701)
(1,7
82,6
28)
12,6
94,3
277,
935,
586
6,07
6,48
28,
242,
008
1,02
0,73
3(2
,525
,633
)(3
,847
,949
)5,
761,
024
Sche
dule
of P
ensi
on In
vest
men
t Inc
ome
10 Y
ear T
rend
(Dol
lar A
mou
nts
in T
hous
ands
)

Statistical Section
Page 150
For y
ears
end
ing
June
30,
2009
2008
2007
2006
2005
2004
2003
2002
2001
2000
Inve
stm
ent I
ncom
e:
F
rom
inve
stin
g ac
tiviti
es:
Net
app
reci
atio
n (d
epre
ciat
ion)
in
fair
valu
e of
inve
stm
ents
$
(363
)$
2
68$
88
$
(
480)
$
(2,
218)
$
(3,0
03)
$
(2,4
05)
$
(
564)
$
2
60
$
(55)
Inv
estm
ent I
ncom
e
2
,269
2
,525
2,51
7
3,36
2
4,63
5
4,62
7
3
,566
2,
159
2,
274
2,
680
Tota
l inv
estm
ent a
ctiv
ity
in
com
e (lo
ss)
1,9
06
2,7
93
2,
605
2,
882
2,
417
1,
624
1,1
61
1,59
5
2,53
4
2,62
5
Inve
stm
ent e
xpen
ses
(
45)
(3
8)
(32)
(32)
(48)
(33)
(
23)
(22)
(22)
(22)
Tota
l net
inve
stm
ent i
ncom
e (lo
ss)
1,8
61
2,7
55
2,
573
2,
850
2,3
69
1,59
1
1
,138
1,
573
2,
512
2,
603
Sche
dule
of P
rem
ium
Ass
ista
nce
Inve
stm
ent I
ncom
e10
Yea
r Tre
nd(D
olla
r Am
ount
s in
Tho
usan
ds)

Statistical Section
Page 151
For y
ears
end
ing
June
30,
2009
2008
2007
2006
2005
2004
2003
2002
2001
2000
Inve
stm
ent I
ncom
e:
F
rom
inve
stin
g ac
tiviti
es:
Net
app
reci
atio
n (d
epre
ciat
ion)
in
fair
valu
e of
inve
stm
ents
$
-
$
-
$
-
$
1
23$
672
$
-$
-
$
-
$
-
$
-
Inv
estm
ent I
ncom
e1,
528
4,28
85,
821
4,08
01,
974
1,00
559
61,
035
1,72
41,
506
Tota
l inv
estm
ent a
ctiv
ity
in
com
e (lo
ss)
1,52
84,
288
5,82
14,
203
2,64
61,
005
596
1,03
51,
724
1,50
6
Inve
stm
ent e
xpen
ses
--
--
--
--
--
Tota
l net
inve
stm
ent i
ncom
e (lo
ss)
1,52
84,
288
5,82
14,
203
2,64
61,
005
596
1,03
51,
724
1,50
6
Sche
dule
of H
ealth
Opt
ions
Pro
gram
Inve
stm
ent I
ncom
e10
Yea
r Tre
nd(D
olla
r Am
ount
s in
Tho
usan
ds)

Statistical Section
Page 152
Schedule of Summary Membership Data10 Year Trend *
Male Female Total
For yearended
June 30,Average
AgeAverageService
AverageAnnualSalaries
AverageAge
AverageService
AverageAnnualSalaries
Number of
ActiveMembers
2008 44.5 11.4 $ 49,818 44.7 10.4 $ 41,440 272,6902007 44.5 11.7 49,220 44.7 10.5 40,958 264,0232006 44.6 12.0 49,153 44.7 10.7 41,155 263,3502005 44.9 12.6 47,416 45.0 11.0 38,832 255,4652004 45.1 13.0 47,103 45.1 11.1 37,901 247,9012003 45.1 13.5 45,947 45.0 11.2 36,465 246,7002002 45.2 14.0 45,182 44.9 11.3 36,073 242,6162001 45.5 14.6 45,686 44.9 11.6 35,852 243,3112000 45.2 14.4 45,049 44.6 11.3 35,331 234,2101999 45.2 14.6 43,498 44.7 11.5 34,132 223,495
* Actuarial Valuation for year ended June 30, 2008 is most current valuation completed at publication date.

Statistical Section
Page 153
Schedule of Summary Annuity Data10 Year Trend *
For yearended
June 30,
Numberof
Annuitants &Benefi ciaries
TotalAnnual
Annuities **
AverageAnnualAnnuity
2008 173,540 $ 3,812,000 $ 21,9632007 168,026 3,523,000 20,9702006 161,813 3,274,000 20,2362005 156,519 3,027,550 19,3432004 151,552 2,798,211 18,4642003 145,693 2,545,135 17,4692002 141,414 2,248,291 15,8992001 132,716 1,871,995 14,1052000 134,058 1,880,644 14,0281999 132,869 1,830,582 13,777
* Actuarial Valuation for year ended June 30, 2008 is most current valuation completed at publication date.
** Total Annual Annuities dollar amounts expressed in thousands.

Statistical Section
Page 154
Employer Contribution
EmployerYear
EmployerPayroll
MemberContribution(Average)
NormalRequirement
(A)
(Funded) /UnfundedAccrued
Liability (B)
EmployerPension
Rate
Health Insur-ance
PremiumAssistance
Contribution (C)
TotalEmployer
Rate
Grand TotalContribution
Rate
2008-2009 $ 12,402,782 7.29 6.68 (3.37) 4.00 0.76 4.76 12.05
2007-2008 11,921,469 7.25 6.68 (0.24) 6.44 0.69 7.13 14.38
2006-2007 11,410,257 7.21 6.62 (0.95) 5.72 0.74 6.46 13.67
2005-2006 11,419,049 7.16 7.61 (4.28) 4.00 0.69 4.69 11.85
2004-2005 11,062,589 7.12 7.48 (7.10) 4.00 0.23 4.23 11.35
2003-2004 10,030,705 7.08 7.25 (4.27) 2.98 0.79 3.77 10.85
2002-2003 9,652,881 7.10 7.20 (10.03) 0.18 0.97 1.15 8.25
2001-2002 9,378,944 6.43 5.63 (6.05) 0.00 1.09 1.09 7.52
2000-2001 9,414,884 5.77 6.29 (4.65) 1.64 0.30 1.94 7.71
1999-2000 8,939,598 5.72 6.40 (2.04) 4.36 0.25 4.61 10.33
1998-1999 8,247,602 5.69 6.33 (0.44) 5.89 0.15 6.04 11.73
1997-1998 8,091,481 5.65 6.44 2.17 8.61 0.15 8.76 14.41
1996-1997 7,745,001 5.62 6.44 3.56 10.00 0.60 10.60 16.22
1995-1996 7,616,585 5.59 6.43 4.67 11.10 0.62 11.72 17.31
1994-1995 7,378,342 5.55 6.43 4.18 10.61 0.45 11.06 16.61
1993-1994 6,885,337 5.51 7.34 5.58 12.92 0.25 13.17 18.68
1992-1993 6,348,565 5.48 7.90 5.84 13.74 0.50 14.24 19.72
1991-1992 6,098,222 5.46 8.00 6.40 14.40 0.50 14.90 20.36
1990-1991 5,744,798 5.69 8.28 10.90 19.18 - 19.18 24.87
1989-1990 5,363,535 5.53 8.44 11.24 19.68 - 19.68 25.21
Components of Total Contribution Rate(In Percentages)
The total contribution rate is the total of the employer and member rates actuarially required for the funding of PSERS’ pension and postemployment health insurance premium assistance benefi ts.
The total employer rate is comprised of a normal requirement, an accrued liability requirement and a post-employment healthcare insurance premium assistance requirement.
(A) The normal requirement portion is the percentage of compensation necessary to fund any prospective pension benefi ts payable to the member.
(B) The total funded / unfunded accrued liability portion is the percentage of compensation necessary to fund past pension benefi t enhancements, cost-of-living adjustments and other actuarial gains and losses.
(C) The postemployment healthcare insurance premium assistance portion is the percentage of compensa tion necessary to fund the postemployment health insurance premium assistance program established under the provisions of Act 23 - 1991.
Employer Payroll is the estimated or actual aggregate employer salaries used in the actuarial valuation that determined the employer contribution rates for the employer years.

Statistical Section
Page 155
Ret
irem
ents
*R
efun
ds
For Y
ear
Ende
dJu
ne 3
0,N
orm
alEa
rlyD
isab
ility
Pens
ion
Lum
p Su
m
Ben
efi ts
Dea
thB
enefi
cia
rySu
rviv
orTr
ansf
ers
Tota
l P
ensi
on
Ben
efi ts
Ded
uctio
nsR
efun
ds
Tota
l Pen
sion
B
enefi
ts a
nd
Ref
und
Ded
uctio
ns
2009
$ 2,
110,
018
$ 1
,538
,421
$ 13
0,82
0 $
666,
827
$ 53
,695
$ 86
,164
$ 53
,352
$ 7,
947
$ 4,
647,
244
$ 2
0,36
9$
4,66
7,61
3
2008
4,63
6,34
0**
****
****
**17
,157
4,65
3,49
728
,713
4,68
2,21
0
2007
4,04
4,43
5**
****
****
**6,
010
4,05
0,44
518
,180
4,06
8,62
5
2006
3,86
0,65
8**
****
****
**8,
462
3,86
9,12
016
,330
3,88
5,45
0
2005
3,63
9,83
8**
****
****
**10
,859
3,65
0,69
716
,233
3,66
6,93
0
2004
3,25
2,42
4**
****
****
**16
,315
3,26
8,73
914
,767
3,28
3,50
6
2003
2,89
0,19
2**
****
****
**12
,116
2,90
2,30
813
,943
2,91
6,25
1
2002
2,70
7,12
5**
****
****
**9,
434
2,71
6,55
914
,858
2,73
1,41
7
2001
2,09
0,29
0**
****
****
**10
,867
2,10
1,15
722
,369
2,12
3,52
6
2000
2,20
0,74
7**
****
****
**4,
710
2,20
5,45
722
,446
2,22
7,90
3
Sche
dule
of P
ensi
on B
enefi
t an
d R
efun
d D
educ
tions
from
Pla
n N
et A
sset
s10
Yea
r Tre
nd(D
olla
r Am
ount
s in
Tho
usan
ds)
* D
ata
pres
ente
d in
Nor
mal
Col
umn
for y
ears
200
0 to
200
8 ar
e ag
greg
ate
amou
nts
for a
ll R
etire
men
t Typ
es.
** D
ata
for t
hese
yea
rs is
not
read
ily a
vaila
ble
in th
e fo
rmat
ado
pted
for t
he Y
ear E
nded
Jun
e 30
, 200
9.

Statistical Section
Page 156
Schedule of Average Monthly Pension Benefi t Payments **Grouped by Years of Credited Service
10 Year Trend
Years of Credited Service< 5 5 - 9 10 - 14 15 - 19 20 - 24 25 - 29 30 - 34 35 - 39 40+ Total
Fiscal Year Ended June 30, 2008Normal and Early 4,054 9,541 20,539 17,450 16,748 19,166 38,331 27,318 4,509 157,656
$ 355 $ 165 $ 270 $ 584 $ 1,032 $ 1,733 $ 2,904 $ 3,732 $ 3,629 $ 1,896 Disability - 1,468 1,664 1,364 1,280 1,178 466 14 1 7,435
- $ 876 $ 949 $ 1,205 $ 1,854 $ 2,714 $ 3,707 $ 3,681 $ 4,550 $ 1,595 Benefi ciary and Survivor 789 402 964 874 879 917 1,381 1,522 721 8,449
$ 1,127 $ 121 $ 223 $ 347 $ 533 $ 783 $ 1,083 $ 1,223 $ 1,255 $ 817 Fiscal Year Ended June 30, 2007Normal and Early 2,812 8,675 20,554 17,448 16,304 18,664 37,422 25,100 5,382 152,361
$ 54 $ 149 $ 256 $ 553 $ 971 $ 1,662 $ 2,821 $ 3,574 $ 3,488 $ 1,820 Disability - 1,437 1,689 1,370 1,307 1,154 430 11 1 7,399
- $ 595 $ 770 $ 1,044 $ 1,569 $ 2,476 $ 3,466 $ 3,576 $ 4,550 $ 1,356 Benefi ciary and Survivor 94 430 1,025 930 936 980 1,453 1,628 790 8,266
$ 47 $ 119 $ 218 $ 342 $ 530 $ 768 $ 1,075 $ 1,201 $ 1,234 $ 767 Fiscal Year Ended June 30, 2006Normal and Early 2,723 7,810 20,380 17,198 15,979 18,140 35,227 23,660 5,465 146,582
$ 53 $ 147 $ 249 $ 537 $ 945 $ 1,611 $ 2,747 $ 3,474 $ 3,397 $ 1,756 Disability - 1,375 1,655 1,339 1,261 1,136 398 10 1 7,175
- $ 579 $ 750 $ 1,023 $ 1,510 $ 2,429 $ 3,422 $ 3,549 $ 4,550 $ 1,320 Benefi ciary and Survivor 88 413 1,000 902 911 951 1,404 1,572 815 8,056
$ 47 $ 116 $ 212 $ 327 $ 516 $ 742 $ 1,027 $ 1,154 $ 1,182 $ 739 Fiscal Year Ended June 30, 2005Normal and Early 2,654 7,117 20,423 17,022 15,827 17,732 33,402 21,971 5,615 141,763
$ 67 $ 147 $ 244 $ 523 $ 921 $ 1,561 $ 2,669 $ 3,326 $ 3,278 $ 1,679 Disability 8 1,321 1,641 1,281 1,232 1,113 357 10 1 6,964
$ 1,301 $ 550 $ 723 $ 975 $ 1,464 $ 2,377 $ 3,340 $ 3,546 $ 4,550 $ 1,271 Benefi ciary and Survivor 79 400 976 881 876 913 1,322 1,530 814 7,791
$ 47 $ 110 $ 204 $ 316 $ 496 $ 709 $ 987 $ 1,075 $ 1,099 $ 700 Fiscal Year Ended June 30, 2004Normal and Early 3,111 6,585 20,407 16,821 15,637 17,285 31,443 20,313 5,699 137,301
$ 224 $ 148 $ 240 $ 509 $ 901 $ 1,516 $ 2,592 $ 3,191 $ 3,198 $ 1,602 Disability 24 1,256 1,589 1,205 1,225 1,083 305 8 1 6,696
$ 873 $ 527 $ 700 $ 937 $ 1,435 $ 2,342 $ 3,212 $ 3,227 $ 4,550 $ 1,229 Benefi ciary and Survivor 123 408 946 861 830 881 1,235 1,444 826 7,554
$ 224 $ 107 $ 196 $ 303 $ 465 $ 680 $ 944 $ 997 $ 1,042 $ 658
** Actuarial valuation for year ended June 30, 2008 is the most current valuation completed at the publication date.

Statistical Section
Page 157
Years of Credited Service< 5 5 - 9 10 - 14 15 - 19 20 - 24 25 - 29 30 - 34 35 - 39 40+ Total
Fiscal Year Ended June 30, 2003Normal and Early 2,762 6,165 20,389 16,688 15,509 16,761 29,365 18,553 5,813 132,005
$ 131 $ 149 $ 236 $ 496 $ 879 $ 1,463 $ 2,501 $ 3,021 $ 3,104 $ 1,516 Disability 20 1,182 1,524 1,167 1,198 1,011 268 7 1 6,378
$ 749 $ 505 $ 673 $ 903 $ 1,397 $ 2,267 $ 3,044 $ 3,035 $ 4,550 $ 1,176 Benefi ciary and Survivor 111 396 916 857 815 827 1,166 1,379 842 7,309
$ 180 $ 104 $ 190 $ 287 $ 452 $ 654 $ 889 $ 941 $ 979 $ 622 Fiscal Year Ended June 30, 2002Normal and Early 2,443 5,891 20,446 16,670 15,398 16,430 27,659 17,341 5,925 128,203
$ 46 $ 146 $ 227 $ 472 $ 830 $ 1,367 $ 2,302 $ 2,737 $ 2,849 $ 1,378 Disability - 1,137 1,487 1,144 1,172 940 208 8 1 6,097
- $ 472 $ 630 $ 827 $ 1,308 $ 2,067 $ 2,598 $ 2,901 $ 4,174 $ 1,060 Benefi ciary and Survivor 89 398 891 835 783 796 1,112 1,347 862 7,113
$ 52 $ 98 $ 184 $ 277 $ 430 $ 625 $ 821 $ 889 $ 924 $ 588 Fiscal Year Ended June 30, 2001Normal and Early 2,399 5,345 20,007 16,211 14,889 15,100 25,230 14,975 5,952 120,108
$ 42 $ 137 $ 205 $ 424 $ 759 $ 1,213 $ 2,145 $ 2,381 $ 2,605 $ 1,221 Disability - 1,097 1,444 1,098 1,112 857 159 5 1 5,773
- $ 432 $ 576 $ 767 $ 1,220 $ 1,895 $ 2,054 $ 2,809 $ 4,174 $ 948 Benefi ciary and Survivor 82 397 867 801 745 749 1,044 1,281 868 6,834
$ 53 $ 95 $ 177 $ 268 $ 419 $ 604 $ 782 $ 845 $ 884 $ 562 Fiscal Year Ended June 30, 2000Normal and Early * * * * * * * * * 121,812
* * * * * * * * * $ 1,215 Disability * * * * * * * * * 5,592
* * * * * * * * * $ 923 Benefi ciary and Survivor * * * * * * * * * 6,654
* * * * * * * * * $ 541 Fiscal Year Ended June 30, 1999Normal and Early * * * * * * * * * 121,064
* * * * * * * * * $ 1,193 Disability * * * * * * * * * 5,384
* * * * * * * * * $ 890 Benefi ciary and Survivor * * * * * * * * * 6,421
* * * * * * * * * $ 516
Schedule of Average Monthly Pension Benefi t PaymentsGrouped by Years of Credited Service
10 Year Trend (Continued)
* Data for these years not available in the format adopted for years ending June 30, 2001 through 2008.

Statistical Section
Page 158
Ten Largest Employers(Based on reported members’ salaries)
(Dollar Amounts in Thousands)
Employer
Total ReportedSalaries
(FY 2009)
Percentageof Total Salaries
compared toSalaries from All
Employers
1. City of Philadelphia School District $ 1,125,330 9.12% 2. Pittsburgh School District 282,917 2.29 3. Central Bucks School District 135,779 1.10 4. North Penn School District 106,630 0.86 5. Allentown City School District 102,785 0.83 6. Council Rock School District 101,031 0.82 7. Bethlehem Area School District 94,656 0.77 8. Pennsbury School District 94,577 0.77 9. Reading School District 93,932 0.7610. Lower Merion School District 91,331 0.74
Due to the stable comparable populations of school employees in PSERS’ employers over the years, a single presentation provides perspective for a ten-year period.

Statistical Section
Page 159
Schedule of EmployersSchool Districts
A__________________Abington Heights Abington Albert GallatinAliquippa Allegheny Valley Allegheny-Clarion ValleyAllentown City Altoona Area Ambridge AreaAnnville-CleonaAntietam Apollo-Ridge Armstrong Athens Area Austin Area Avella Area Avon Grove Avonworth
B__________________Bald Eagle Area Baldwin-Whitehall Bangor Area Beaver Area Bedford Area Belle Vernon Area Bellefonte Area Bellwood-Antis Bensalem TownshipBenton Area Bentworth Berlin Brothersvalley Bermudian Springs Berwick AreaBethel Park Bethlehem Area Bethlehem-Center Big Beaver Falls Area Big Spring Blackhawk Blacklick Valley Blairsville-Saltsburg Bloomsburg Area Blue Mountain Blue Ridge Boyertown Area Bradford Area Brandywine Heights Area Brentwood Borough Bristol Borough Bristol Township Brockway Area Brookville Area Brownsville Area Burgettstown Area Burrell Butler Area
C__________________California Area Cambria Heights Cameron County Camp Hill Canon-McMillan Canton Area Carbondale Area Carlisle Area Carlynton Carmichaels Area Catasauqua Area Centennial Center Area Central Bucks Central Cambria Central Columbia Central Dauphin Central Fulton Central Greene Central York Chambersburg Area Charleroi Area Chartiers Houston Chartiers Valley Cheltenham Township Chester-Upland Chestnut Ridge Chichester Clairton City Clarion AreaClarion-Limestone Area Claysburg-Kimmel Clearfi eld Area Coatesville Area Cocalico Colonial Columbia Borough Commodore PerryConemaugh Township AreaConemaugh Valley Conestoga Valley Conewago Valley Conneaut Connellsville Area Conrad Weiser AreaCornell Cornwall-Lebanon Corry Area Coudersport Area Council Rock Cranberry Area Crawford Central Crestwood Cumberland Valley Curwensville Area
D__________________Dallas Dallastown Area Daniel Boone Area Danville Area Deer Lakes Delaware Valley Derry Area Derry Township Donegal Dover Area Downingtown Area Dubois Area Dunmore Duquesne City
E__________________East Allegheny East Lycoming East Penn East Pennsboro Area East Stroudsburg Area Eastern Lancaster County Eastern Lebanon CountyEastern York Easton Area Elizabeth Forward Elizabethtown Area Elk Lake Ellwood City Area Ephrata Area Erie City Everett Area Exeter Township
F__________________Fairfi eld Area Fairview Fannett Metal Farrell Area Ferndale AreaFleetwood Area Forbes Road Forest Area Forest City RegionalForest Hills Fort Cherry Fort LeBoeuf Fox Chapel Area Franklin Area Franklin Regional Frazier Freedom Area Freeport Area

Statistical Section
Page 160
Schedule of Employers (Continued)
G__________________Galeton Area Garnet Valley Gateway General McLane Gettysburg Area Girard Glendale Governor Miffl in Great ValleyGreater Johnstown Greater Latrobe Greater Nanticoke Area Greencastle-Antrim Greensburg Salem Greenville Area Greenwood Grove City Area
H__________________Halifax Area Hamburg Area Hampton Township Hanover Area Hanover Public Harbor Creek Harmony Area Harrisburg City Hatboro-Horsham Haverford Township Hazleton Area Hempfi eld Area Hempfi eld Hermitage Highlands Hollidaysburg Area Homer-Center Hopewell Area Huntingdon Area
I__________________Indiana Area Interboro Iroquois
J__________________Jamestown Area Jeannette City Jefferson-Morgan Jenkintown Jersey Shore Area Jim Thorpe Area Johnsonburg Area Juniata County Juniata Valley
K__________________Kane Area Karns City Area Kennett Consolidated Keystone Central Keystone Oaks Keystone Kiski Area Kutztown Area
L__________________Lackawana Trail Lakeland Lake-Lehman LakeviewLampeter-Strasburg Lancaster Laurel Highlands LaurelLebanon Leechburg Area Lehighton Area Lewisburg Area Ligonier Valley Line Mountain Littlestown Area Lower Dauphin Lower Merion Lower Moreland Township Loyalsock Township
M__________________Mahanoy Area Manheim Central Manheim Township Marion Center Area Marple Newtown Mars Area McGuffey McKeesport Area Mechanicsburg AreaMercer Area Methacton Meyersdale AreaMid Valley Middletown Area Midd-West Midland Borough Miffl in County Miffl inburg Area Millcreek Township Millersburg Area Millville Area
Milton Area Minersville Area Mohawk Area Monaca Monessen Moniteau Montgomery AreaMontour Montoursville Area Montrose Area Moon Area Morrisville Borough Moshannon Valley Mount Carmel Area Mount Pleasant Area Mount Union Area Mountain View Mt. Lebanon Muhlenberg Muncy
N__________________Nazareth Area Neshaminy Neshannock Township New Brighton Area New Castle Area New Hope-Solebury New Kensington-Arnold Newport Norristown Area North Allegheny North Clarion County North East North Hills North Penn North Pocono North Schuylkill North Star Northampton Area Northeast Bradford Northeastern York Northern Bedford County Northern Cambria Northern Lebanon Northern Lehigh Northern Potter Northern Tioga Northern York County Northgate Northwest Area Northwestern LehighNorthwestern Norwin

Statistical Section
Page 161
Schedule of Employers (Continued)
O__________________Octorara Area Oil City Area Old Forge Oley Valley Oswayo Valley Otto-Eldred Owen J Roberts Oxford Area
P__________________Palisades Palmerton Area Palmyra Area Panther Valley Parkland Pen Argyl Area Penn Cambria Penn Hills Penn Manor Penncrest Penn-Delco Pennridge Penns Manor Penns Valley Area PennsburyPenn-Trafford Pequea Valley Perkiomen Valley Peters Township Philadelphia City Philipsburg-Osceola AreaPhoenixville Area Pine Grove Area Pine-Richland Pittsburgh Pittston Area Pleasant Valley Plum Borough Pocono Mountain Port Allegany Portage Area Pottsgrove Pottstown Pottsville Area Punxsutawney Area Purchase Line
Q__________________Quaker ValleyQuakertown Community
R__________________Radnor Towship Reading Red Lion Area Redbank Valley Reynolds Richland Ridgway Area Ridley Ringgold Riverside Beaver County Riverside Riverview Rochester Area Rockwood Area Rose Tree Media
S__________________Saint Clair Area Saint Marys Area Salisbury Township Salisbury-Elk Lick Saucon Valley Sayre Area Schuylkill Haven Area Schuylkill Valley Scranton Selinsgrove Area Seneca Valley Shade Central City Shaler Area Shamokin Area Shanksville-Stonycreek Sharon City Sharpsville Area Shenandoah Valley Shenango Area Shikellamy Shippensburg Area Slippery Rock Area Smethport Area Solanco Somerset Area Souderton Area South Allegheny South Butler County South Eastern South Fayette Township South Middleton South Park South Side Area South Western South Williamsport Area Southeast Delco Southeastern Greene Southern Columbia Area Southern Fulton
Southern Huntingdon County Southern Lehigh Southern Tioga Southern York CountySouthmoreland Spring Cove Spring Grove Area Springfi eld Springfi eld Township Spring-Ford Area State College Area Steel Valley Steelton-Highspire Sto-Rox Stroudsburg Area Sullivan County Susquehanna CommunitySusquehanna Township Susquenita
T__________________Tamaqua Area Titusville Area Towanda Area Tredyffrin-Easttown Trinity Area Tri-Valley Troy Area Tulpehocken Area Tunkhannock Area Turkeyfoot Valley Area Tuscarora Tussey MountainTwin Valley Tyrone Area
U__________________Union Area Union City Area Union Uniontown Area Unionville-Chadds Ford United Upper Adams Upper Darby Upper Dauphin Area Upper Dublin Upper Merion Area Upper Moreland Township Upper Perkiomen Upper Saint Clair

Statistical Section
Page 162
Schedule of Employers (Continued)
V__________________Valley Grove Valley View
W__________________Wallenpaupack Area Wallingford-SwarthmoreWarren County Warrior Run Warwick Washington Wattsburg Area Wayne Highlands Waynesboro Area Weatherly Area Wellsboro Area West Allegheny West Branch Area West Chester Area West Greene West Jefferson Hills West Middlesex Area West Miffl in Area West Perry West Shore West York Area
Area Vocational Technical SchoolsA. W. Beattie Career CenterAdmiral Peary AVTSBeaver County AVTSBedford County Technical CenterBerks CTCBethlehem AVTSBucks County Technical High SchoolButler County AVTSCarbon Career & Technical InstituteCareer Institute of TechnologyCenter for Technical Studies of MontgomeryCountyCentral PA Institute of Science & TechnologyCentral Westmoreland CTCClarion County Career CenterClearfi eld County CTCColumbia-Montour AVTSCrawford County AVTSCTC of Lackawanna CountyCumberland-Perry AVTSDauphin County AVTSDelaware County AVTSEastern Center for Arts & TechnologyEastern Westmoreland CTCErie County Technical SchoolFayette County AVTSForbes Road CTCFranklin County CTCFulton County AVTSGreater Altoona CTC
Greater Johnstown AVTSGreene County CTCHuntingdon Co CTCIndiana County Technology CenterJefferson County-DuBois AVTSLancaster County CTCLawrence County CTCLebanon County CTCLehigh Career & Technical InstituteLenape TechLycoming CTCMercer County Career CenterMiddle Bucks Institute of TechnologyMiffl in-Juniata CTCMon Valley CTCMonroe Career & Tech InstNorth Fayette Co AVTSNorth Montco Tech Career CenterNorthern Tier Career CenterNorthern Westmoreland CTCNorthumberland County AVTSParkway West CTCReading-Muhlenberg CTCSchuylkill Technology CentersSomerset County Technology CenterSteel Center AVTSSUN Area CTCSusquehanna County CTCUpper Bucks County AVTSVenango Technology Center
West Side AVTSWestern Area CTCWestern Center for Technical StudiesWilkes-Barre AVTSYork Co School of Technology
Western Beaver County Western Wayne Westmont HilltopWhitehall-Coplay Wilkes-Barre Area Wilkinsburg Borough William Penn Williams Valley Williamsburg Community Williamsport Area Wilmington Area Wilson Area Wilson Windber Area Wissahickon Woodland Hills Wyalusing Area Wyoming Area Wyoming Valley West Wyomissing Area
Y__________________York City York Suburban Yough

Statistical Section
Page 163
Schedule of Employers (Continued)
Intermediate Units
Allegheny #3Appalachia #8UArin #28Beaver Valley 27Berks County #14Blast #17Bucks County #22Capital Area #15Carbon-Lehigh #21Central #10Central Susquehna #16Chester County #24Colonial #20Delaware County #25
Intermediate Unit #1Lancaster-Lebanon #13Lincoln #12Luzerne #18Midwestern #4Montgomery County #23Northeastern Educational #19Northwest Tri-County #5Pittsburgh-Mt Oliver #2Riverview #6Schuylkill #29Seneca Highlands #9Tuscarora #11Westmoreland #7
Colleges / Universities
Bloomsburg University Bucks County Community CollegeButler County Community CollegeCalifornia UniversityCheyney UniversityClarion University Of PennsylvaniaCommunity College Of Allegheny CountyCommunity College Of Beaver CountyCommunity College Of PhiladelphiaDelaware County Community CollegeEast Stroudsburg UniversityEdinboro UniversityEducation ResourceHarrisburg Area Comunity CollegeIndiana UniversityKutztown University
Lehigh Carbon Community CollegeLock Haven UniversityLuzerne County Community CollegeMansfi eld UniversityMillersville UniversityMontgomery County Community CollegeNorthampton County Area Community CollegePenn State UniversityPennsylvania College Of TechnologyReading Area Community CollegeShippensburg UniversitySlippery Rock UniversityState System Of Higher EducationWest Chester UniversityWestmoreland County Community College
Other
Berks County Earned Income Tax BureauDepartment of Corrections - Commonwealth of PennsylvaniaDepartment of Education - Commonwealth of PennsylvaniaLancaster County AcademyOverbrook School for the BlindPennsylvania School Boards Association
Pennsylvania School for the DeafScotland School for Veterans ChildrenScranton State School for DeafThaddeus Stevens College of TechnologyWestern Pennsylvania School for the BlindWestern Pennsylvania School for the DeafYork County High

Statistical Section
Page 164
Schedule of Employers (Continued)
Charter Schools (C S)21St Century Cyber C SAchievement House C SAd Prima C SAgora Cyber C SAlliance For Progress C S Antonia Pantoja Charter SchoolArchitecture and Design C SAvon Grove C SBear Creek Community C SBeaver Area Academic C SBelmont C SBoys Latin of Philadelphia C SBucks County Montessori C S Career Connections C SCentral Pennsylvania Digital Learning Foundation C SCentre Learning Community C S Chester County Family Academy C SChristopher Columbus C S City Charter High SchoolCollegium C SCommonwealth Connections Academy C SCommunity Academy of Philadelphia C S Crispus Attucks Youthbuild C SCenter for Student Learning C S at PennsburyDelaware Valley C SDiscovery C S Dr. Robert Ketterer C SErin Dudley Forbes C S Eugenio Maria de Hostos Community Bilingual C S Evergreen Community C SFamily C SFell C SFirst Philadelphia C S for LiteracyFolk Arts-Cultural Treasures C SFranklin Towne C SFreire C SGermantown Settlement C S Global Leadership Academy C SGraystone Academy C SGreen Woods C SHope C SImani Education Circle C SIMHOTEP Institute C SIndependence C SInfi nity C SKeystone Education Center C SKhepera C SKipp Academy C SLa Academia; The Partnership C SLaboratory C SLehigh Valley Academy Regional C SLehigh Valley C S for the Performng ArtsLincoln C SLincoln Park Performing Arts C SManchester Academic C SMariana Bracetti Academy C SMaritime Academy C SMastery Charter High SchoolMastery CS - Pickett CampusMastery CS - Shoemaker CampusMastery CS - Thomas CampusMath Civics and Sciences C S
Mathmatics,Science &Technology Commmunity C SMontessori Regional C SMulti-Cultural Academy C SNew Foundations C SNew Hope AcademyNew Media Technology C SNittany Valley C SNorthside Urban Pathways C S Northwood Academy C SNueva Esperanza Academy C SPennsylvania Learners Online Regional Cyber C SPennsylania Leadership C SPennsylvania Cyber C SPennsylvania Distance Learning C SPennsylvania Virtual C SPeople for People C SPerseus House C S of ExcellencePhiladelphia Academy C SPhiladelphia Electrical & Technology Charter High SchoolPhiladelphia Harambee Institute of Science and Technology C SPhiladelphia Montessori C SPhiladelphia Performing Arts C SPlanet Abacus C SPocono Mountain C SPreparatory Charter of Mathematics, Science, Technology and Careers SchoolPropel C S - HomesteadPropel C S - McKeesportPropel C S - MontourPropel-East C SRenaissance Academy-Edison C SRenaissance Advantage C S Renaissance C SRichard Allen Preparatory C SRobert Benjamin Wiley Community C SRoberto Clemente C SRussell Byers C SSankofa Academy C SSchool Lane C SSouderton C S CollaborativeSpectrum C SSugar Valley Rural C SSUSQ-CYBER C SSylvan Heights Science C STidioute Community C STruebright Science Academy C STuscarora Blended Learning C SUniversal Institute C SUrban League of Pittsburgh C SWakisha C SWalter D Palmer Leadershp Learning Partnershp C SWest Oak Lane C SWest Philadelphia Achievement Charter Elementary SchoolWissahickon C S Wonderland C S World Communications C SYoung Scholars C SYoung Scholars of Central Pennsylvania C S