GBuilder---An Application for the Visualization and Integration of EST Cluster Data
6
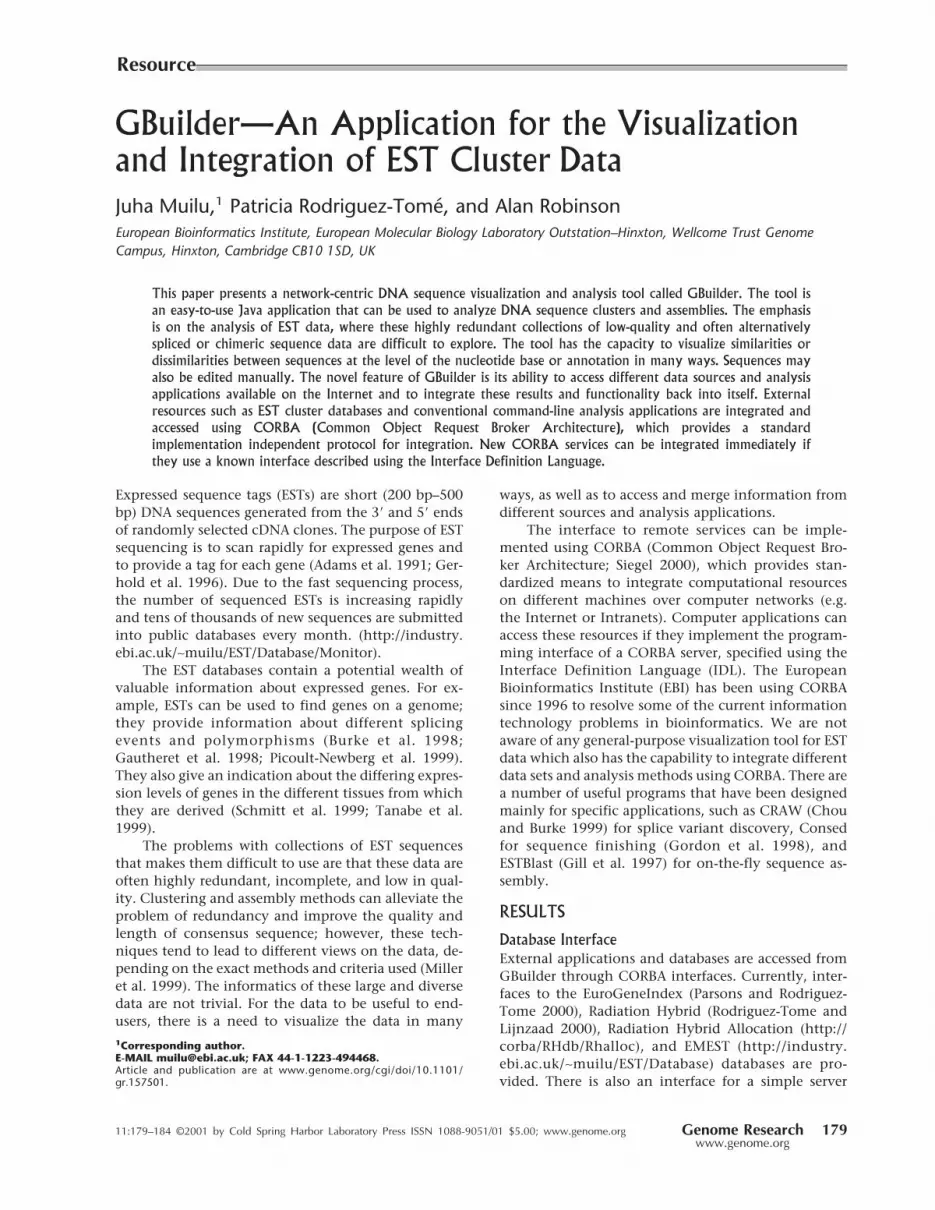
GBuilder—An Application for the Visualization and Integration of EST Cluster Data Juha Muilu, 1 Patricia Rodriguez-Tome ´, and Alan Robinson European Bioinformatics Institute, European Molecular Biology Laboratory Outstation–Hinxton, Wellcome Trust Genome Campus, Hinxton, Cambridge CB10 1SD, UK This paper presents a network-centric DNA sequence visualization and analysis tool called GBuilder. The tool is an easy-to-use Java application that can be used to analyze DNA sequence clusters and assemblies. The emphasis is on the analysis of EST data, where these highly redundant collections of low-quality and often alternatively spliced or chimeric sequence data are difficult to explore. The tool has the capacity to visualize similarities or dissimilarities between sequences at the level of the nucleotide base or annotation in many ways. Sequences may also be edited manually. The novel feature of GBuilder is its ability to access different data sources and analysis applications available on the Internet and to integrate these results and functionality back into itself. External resources such as EST cluster databases and conventional command-line analysis applications are integrated and accessed using CORBA (Common Object Request Broker Architecture), which provides a standard implementation independent protocol for integration. New CORBA services can be integrated immediately if they use a known interface described using the Interface Definition Language. Expressed sequence tags (ESTs) are short (200 bp–500 bp) DNA sequences generated from the 3 and 5 ends of randomly selected cDNA clones. The purpose of EST sequencing is to scan rapidly for expressed genes and to provide a tag for each gene (Adams et al. 1991; Ger- hold et al. 1996). Due to the fast sequencing process, the number of sequenced ESTs is increasing rapidly and tens of thousands of new sequences are submitted into public databases every month. (http://industry. ebi.ac.uk/∼muilu/EST/Database/Monitor). The EST databases contain a potential wealth of valuable information about expressed genes. For ex- ample, ESTs can be used to find genes on a genome; they provide information about different splicing events and polymorphisms (Burke et al. 1998; Gautheret et al. 1998; Picoult-Newberg et al. 1999). They also give an indication about the differing expres- sion levels of genes in the different tissues from which they are derived (Schmitt et al. 1999; Tanabe et al. 1999). The problems with collections of EST sequences that makes them difficult to use are that these data are often highly redundant, incomplete, and low in qual- ity. Clustering and assembly methods can alleviate the problem of redundancy and improve the quality and length of consensus sequence; however, these tech- niques tend to lead to different views on the data, de- pending on the exact methods and criteria used (Miller et al. 1999). The informatics of these large and diverse data are not trivial. For the data to be useful to end- users, there is a need to visualize the data in many ways, as well as to access and merge information from different sources and analysis applications. The interface to remote services can be imple- mented using CORBA (Common Object Request Bro- ker Architecture; Siegel 2000), which provides stan- dardized means to integrate computational resources on different machines over computer networks (e.g. the Internet or Intranets). Computer applications can access these resources if they implement the program- ming interface of a CORBA server, specified using the Interface Definition Language (IDL). The European Bioinformatics Institute (EBI) has been using CORBA since 1996 to resolve some of the current information technology problems in bioinformatics. We are not aware of any general-purpose visualization tool for EST data which also has the capability to integrate different data sets and analysis methods using CORBA. There are a number of useful programs that have been designed mainly for specific applications, such as CRAW (Chou and Burke 1999) for splice variant discovery, Consed for sequence finishing (Gordon et al. 1998), and ESTBlast (Gill et al. 1997) for on-the-fly sequence as- sembly. RESULTS Database Interface External applications and databases are accessed from GBuilder through CORBA interfaces. Currently, inter- faces to the EuroGeneIndex (Parsons and Rodriguez- Tome 2000), Radiation Hybrid (Rodriguez-Tome and Lijnzaad 2000), Radiation Hybrid Allocation (http:// corba/RHdb/Rhalloc), and EMEST (http://industry. ebi.ac.uk/∼muilu/EST/Database) databases are pro- vided. There is also an interface for a simple server 1 Corresponding author. E-MAIL [email protected]; FAX 44-1-1223-494468. Article and publication are at www.genome.org/cgi/doi/10.1101/ gr.157501. Resource 11:179–184 ©2001 by Cold Spring Harbor Laboratory Press ISSN 1088-9051/01 $5.00; www.genome.org Genome Research 179 www.genome.org
-
Upload
independent -
Category
Documents
-
view
0 -
download
0
Transcript of GBuilder---An Application for the Visualization and Integration of EST Cluster Data
GBuilder—An Application for the Visualizationand Integration of EST Cluster DataJuha Muilu,1 Patricia Rodriguez-Tome, and Alan RobinsonEuropean Bioinformatics Institute, European Molecular Biology Laboratory Outstation–Hinxton, Wellcome Trust GenomeCampus, Hinxton, Cambridge CB10 1SD, UK
This paper presents a network-centric DNA sequence visualization and analysis tool called GBuilder. The tool isan easy-to-use Java application that can be used to analyze DNA sequence clusters and assemblies. The emphasisis on the analysis of EST data, where these highly redundant collections of low-quality and often alternativelyspliced or chimeric sequence data are difficult to explore. The tool has the capacity to visualize similarities ordissimilarities between sequences at the level of the nucleotide base or annotation in many ways. Sequences mayalso be edited manually. The novel feature of GBuilder is its ability to access different data sources and analysisapplications available on the Internet and to integrate these results and functionality back into itself. Externalresources such as EST cluster databases and conventional command-line analysis applications are integrated andaccessed using CORBA (Common Object Request Broker Architecture), which provides a standardimplementation independent protocol for integration. New CORBA services can be integrated immediately ifthey use a known interface described using the Interface Definition Language.
Expressed sequence tags (ESTs) are short (200 bp–500bp) DNA sequences generated from the 3� and 5� endsof randomly selected cDNA clones. The purpose of ESTsequencing is to scan rapidly for expressed genes andto provide a tag for each gene (Adams et al. 1991; Ger-hold et al. 1996). Due to the fast sequencing process,the number of sequenced ESTs is increasing rapidlyand tens of thousands of new sequences are submittedinto public databases every month. (http://industry.ebi.ac.uk/∼muilu/EST/Database/Monitor).
The EST databases contain a potential wealth ofvaluable information about expressed genes. For ex-ample, ESTs can be used to find genes on a genome;they provide information about different splicingevents and polymorphisms (Burke et al. 1998;Gautheret et al. 1998; Picoult-Newberg et al. 1999).They also give an indication about the differing expres-sion levels of genes in the different tissues from whichthey are derived (Schmitt et al. 1999; Tanabe et al.1999).
The problems with collections of EST sequencesthat makes them difficult to use are that these data areoften highly redundant, incomplete, and low in qual-ity. Clustering and assembly methods can alleviate theproblem of redundancy and improve the quality andlength of consensus sequence; however, these tech-niques tend to lead to different views on the data, de-pending on the exact methods and criteria used (Milleret al. 1999). The informatics of these large and diversedata are not trivial. For the data to be useful to end-users, there is a need to visualize the data in many
ways, as well as to access and merge information fromdifferent sources and analysis applications.
The interface to remote services can be imple-mented using CORBA (Common Object Request Bro-ker Architecture; Siegel 2000), which provides stan-dardized means to integrate computational resourceson different machines over computer networks (e.g.the Internet or Intranets). Computer applications canaccess these resources if they implement the program-ming interface of a CORBA server, specified using theInterface Definition Language (IDL). The EuropeanBioinformatics Institute (EBI) has been using CORBAsince 1996 to resolve some of the current informationtechnology problems in bioinformatics. We are notaware of any general-purpose visualization tool for ESTdata which also has the capability to integrate differentdata sets and analysis methods using CORBA. There area number of useful programs that have been designedmainly for specific applications, such as CRAW (Chouand Burke 1999) for splice variant discovery, Consedfor sequence finishing (Gordon et al. 1998), andESTBlast (Gill et al. 1997) for on-the-fly sequence as-sembly.
RESULTS
Database InterfaceExternal applications and databases are accessed fromGBuilder through CORBA interfaces. Currently, inter-faces to the EuroGeneIndex (Parsons and Rodriguez-Tome 2000), Radiation Hybrid (Rodriguez-Tome andLijnzaad 2000), Radiation Hybrid Allocation (http://corba/RHdb/Rhalloc), and EMEST (http://industry.ebi.ac.uk/∼muilu/EST/Database) databases are pro-vided. There is also an interface for a simple server
1Corresponding author.E-MAIL [email protected]; FAX 44-1-1223-494468.Article and publication are at www.genome.org/cgi/doi/10.1101/gr.157501.
Resource
11:179–184 ©2001 by Cold Spring Harbor Laboratory Press ISSN 1088-9051/01 $5.00; www.genome.org Genome Research 179www.genome.org

that may provide generic name-value information toGBuilder (http://industry.ebi.ac.uk/∼muilu/GBuilder).GBuilder may also read name-value information froma Java properties file (Flanagan 1999) so that it is pos-sible to use GBuilder without setting up database ser-vices. Table 1 shows the information each CORBAserver can provide currently to GBuilder. Using the ex-isting interfaces, it is straightforward for a programmerto add new databases and property information serversto GBuilder by specifying the type and location of theservice in a configuration file (URL of the IOR).GBuilder provides a database browser, which allowsnavigation of different CORBA-compliant sites and da-tabases.
External ApplicationsThe external analysis applications are made CORBA-compliant using the AppLab application (Senger1999), which provides a CORBA server for executingconventional command line applications and sendingthe results back to the client. Command line param-eters and input and output data are described using aGCG-compliant (http://www.gcg.com/products/wis-package.html) description language, which is thenused to generate meta-data that the clients can use forbuilding a user interface to the program. An example ofa configuration file is shown in Box 1. GBuilder uses aready-made client-side graphical user interface pro-vided by the AppLab package for setting command lineparameters, as well as starting and cancelling programexecution. An important feature of this generic inter-face is that it is independent of server-side applicationsand, thus, there is no need to modify the client pro-gram if new applications are installed on the server.Information about CORBA resources available toGBuilder is read from a configuration file, which isspecified as a URL to GBuilder. Available applicationsare found by making a query to the server and, thus,the list of available applications is always up-to-date.At press time, the following programs are available toGBuilder using the AppLab server located at the EBI:CAP2 (Huang 1996) and CAP3 (Huang and Madan1999) multiple alignment programs, CLEANUP (Grilloet al. 1996) for removing redundant sequences, andNCBI’s DUST for masking out low-complexity regions.
GBuilder can import sequences in FASTA and ACEformat as produced by CAP3. Sequences may be ex-ported and stored as a FASTA file or as serialized Javaobjects. The latter allows the storage of the completestate of the sequence objects, including any annota-tions. Optional positional information about as-sembled sequences may be stored in the FASTA headerafter the accession number. This format is chosen be-cause of its simplicity and the lack of an alternative atthe time GBuilder was developed. A future release ofGBuilder will utilize the Biomolecular Sequence Analy-
sis specification (BSA), adopted by the Object Manage-ment Group (OMG; http://www.omg.org/cgi-bin/doc?lifesci/99–12–01.pdf). The BSA specification pro-vides standardized descriptions for biological objects,as well as for sequence-analysis services.
Visualization FeaturesThe visualization capabilities of GBuilder fall into twocategories: Visualization of similarities between se-quences at the nucleotide level, and at the annotationlevel. In the former case, the nucleotide similarities canbe highlighted between adjacent sequences or betweenselected sequences, as shown in Figure 1. To make thenavigation and detection of problematic regions easieron a large assembly, a user may open another windowthat is linked to the main window by a movable lens.The lens represents the area shown in the new windowand can be zoomed in to display sequences at single-nucleotide resolution while maintaining the globalview in the main window.
It is also possible to visualize common substringsbetween two sequences, which is useful for finding al-ternative-spliced ESTs as shown in Figure 2. The sub-strings are found by using Java implementation(http://www.accessone.com/∼lorre/pages/boyermoore.html) of the Boyer-Moore algorithm (Gusfield 1997),which is applied over the whole sequence usingnonoverlapping subsequent substrings taken from thefirst sequence. This brute-force algorithm works rea-sonably well with sequences of the length of typicalESTs. It is possible to increase and decrease the lengthof the substring to get the required level of accuracyand also increase execution speed.
Besides using the substrings, it is possible to visu-alize how sequences are linked together in a clusteringprocess or visualize the pairwise alignments used in theclustering if this information is stored in a database, asthey are for the EST EuroGeneIndex cluster databases(Parsons and Rodriguez-Tome 2000). An example ofthis is shown in Figure 3. This feature is useful in casesin which an EST super cluster is broken into a numberof subclusters during a multiple-sequence alignment.This often happens because of either alternative splic-ing (Burke et al. 1998; Thanaraj 1999) or low sequencequality (Aaronson et al. 1996). Locating the linkingsequences between the subclusters and then visualiz-ing the pairwise alignment or the substring similaritymay help to identify the reasons behind the subclus-ters.
Annotations can be visualized using color codes,sorting sequences according to a property, or drawinga line between sequences sharing common annota-tion. Text annotations may be displayed alongside thesequence. Visualizing the annotation for ESTs availablefrom the CORBA servers allows users to quickly findout, for example, which ESTs are derived from the
Muilu et al.
180 Genome Researchwww.genome.org

same clone, their putative function, whether they areallocated for radiation hybrid mapping, or how thesequences are clustered in other systems such as Uni-Gene (Schuler 1997). The comparison between othercluster databases or functional and sequence-qualityannotation is valuable, for example, in confirming thesplice variants. Color coding and sorting sequences byclone library is useful in finding sequence variationsbetween libraries or to highlight tissue-specific expres-sion of a putative gene represented by a cluster.
In addition to the visualization features, GBuildercan operate on sequences in a number of ways. BecauseEST sequences are low in quality and often the errorscannot be fixed automatically, manual editing is nec-essary to fix problems and improve the quality of theassembly and consensus sequence. Thus, in GBuilder,
it is possible to edit bases in a simple editor, movesequences in an assembly, delete sequences, or makereverse-complements of sequences.
DISCUSSIONUsing the GBuilder visualization tool, with integratedaccess to different data sources and analysis applica-tions, has proven useful in exploring complex se-quence data, such as collections of EST sequences. Thetool helps to validate the rationales behind EST clus-tering and also allows the identification of alterna-tively spliced gene products, as well as artifacts in se-quences. Combining the visualization features withthe ability to access different databases and analysisapplications brings a new synergy for dynamic re-sources available to users over the Internet.
This integration is made possible using CORBA,which provides a standard and an implementation in-dependent layer between clients and services. Usingknown program interface specifications based on IDL,it is possible to publish new services to users automati-cally and transparently, which may then be integratedinto tools such as GBuilder. These services may be lo-cated on different sites on the Internet or the internalIntranets.
A problem with the network-centric approach isthe vulnerability of network connections. This can beovercome by installing critical services locally. If moreservices become available on different sites over theInternet, the increased volume can overcome the pos-sible low quality of connections.
Future DirectionsWork is underway to make the GBuilder compliantwith the Biomolecular sequence analysis specification(http://industry.ebi.ac.uk/openBSA), which providesdefinitions for basic biological objects and analysismechanisms. The OMG specification is the result ofcollaboration between industrial and academic organi-zations and provides a solid framework for extendingthe integration between different commercial and/ornoncommercial analysis resources.
The goal is to add, for example, new analysis ap-plications and new databases such as STACK (Miller etal. 1999), which is a good resource for alternative geneform discovery (Burke et al. 1998), and UniGene (Bo-guski and Schuler 1995).
METHODSGBuilder is written in Java JDK1.1, which allows it to run onmultiple platforms as a standalone application or as an appletwithin Internet browsers. The CORBA functionality is inde-pendent of the ORB software used; GBuilder has been testedwith OrbixWeb (http://www.iona.com/products/orbixweb),ORBacus (http://www.ooc.com/ob), and JavaORB (http://www.multimania.com/dogweb/). The IDLs used by GBuilder
Box 1. Application Configuration File for theCAP3 Program
The first line defines the name of the script used to executeCAP3. The input data and output data are described in the“Main” section. The input is a FASTA file containing the se-quences. The program can product two outputs: The first isthe sequence assembly (results of CAP3 are converted intofasta format by the launcher script) and the second is thestandard output of the program. All command line param-eters are optional and are given in an “Options” section. Inthe configuration file it is possible to specify, for example,default values and the value range.
Visualization and Integration of EST Cluster Data
Genome Research 181www.genome.org

Figure 2 The substring similarity between two subclusters (U10115 super cluster) is shown. The lines’ colors are based on their positionalong the sequence. Sequences are color coded by the UniGene cluster name. Brown sequences are in UniGene cluster (Mm.3400) andgreen sequences are not in UniGene. The sequences may have been excluded because they are marked as low-quality sequences in dbEST(the quality annotation is shown in Fig. 3).
Figure 1 EuroGeneIndex super cluster from the mouse EST/mRNA database (accession no. U10115). Dissimilarities between adjacentand selected sequences are highlighted. A portion from the Main window, as indicated by the rectangle, can be shown in the otherwindow. Sequences are color coded by clone library.
Muilu et al.
182 Genome Researchwww.genome.org

are available from the EBI Web site (http://industry.ebi.ac.uk/∼muilu/GBuilder).
AvailabilityThe program and source code is available free of charge fromthe Web site. The program is licensed under an open sourcelicense.
ACKNOWLEDGMENTSWe thank Matteo di Tommaso for starting the project; AdamButler, Tom Flores, Tom Freeman, Peter Van Heusden, JeremyParsons, Martin Senger, Mike Starkey, Alphonse Thanaraj, andYagnesh Umrania for their valuable discussions; and DoyleMyers for providing the Java implementation of the Boyer-Moore algorithm. The GBuilder program is developed in theIndustry Programme of the European Bioinformatics Insti-tute.
The publication costs of this article were defrayed in partby payment of page charges. This article must therefore behereby marked “advertisement” in accordance with 18 USCsection 1734 solely to indicate this fact.
REFERENCESAaronson, J.S., Eckman, B., Blevins, R.A., Borkowski, J.A., Myerson,
J., Imran, S., and Elliston, K.O. 1996. Toward the development ofa gene index to the human genome: An assessment of the natureof high-throughput EST sequence data. Genome Res 6: 829–845.
Boguski, M.S. and Schuler, G.D. 1995. ESTablishing a humantranscript map, Nat. Genet. 10: 369–371.
Burke, J., Wang, H., Hide, W., and Davison, D.B. 1998. Alternativegene form discovery and candidate gene selection from geneindexing projects. Genome Res. 8: 276–290.
Chou, A. and Burke, J. 1999. CRAWview: For viewing splicing
variation, gene families, and polymorphism in clusters of ESTsand full-length sequences. Bioinformatics 15: 376–381.
Flanagan, D. 1999. Java in a nutshell: A desktop quick reference.O’Reilly, Sebastopol, CA.
Gautheret, D., Poirot, O., Lopez, F., Audic, S., and Claverie, J.M.1998. Alternate polyadenylation in human mRNAs: A large-scaleanalysis by EST clustering. Genome Res. 8: 524–530.
Gill, R.W., Hodgman, T.C., Littler, C.B., Oxer, M.D., Montgomery,D.S., Taylor, S., and Sanseau, P. 1997. A new dynamic tool toperform assembly of expressed sequence tags (ESTs). Comput.Appl. Biosci. 13: 453–457.
Gordon, D., Abajian, C., and Green, P. 1998. Consed: A graphicaltool for sequence finishing. Genome Res. 8: 195–202.
Grillo, G., Attimonelli, M., Liuni, S., and Pesole, G. 1996. CLEANUP:A fast computer program for removing redundancies fromnucleotide sequence databases. Comput. Appl. Biosci. 12: 1–8.
Gusfiled, D. 1997. Algorithms on strings, trees, and sequences, 1st ed.Cambridge University Press, UK.
Huang, X. 1996. An improved sequence assembly program.Genomics 33: 21–31.
Huang, X. and Madan, A. 1999. CAP3: A DNA sequence assemblyprogram. Genome Res. 9: 868–877.
Miller, R.T., Christoffels, A.G., Gopalakrishnan, C., Burke, J., Ptitsyn,A.A., Broveak, T.R., and Hide, W.A. 1999. A comprehensiveapproach to clustering of expressed human gene sequence: Thesequence tag alignment and consensus knowledge base. GenomeRes. 9: 1143–1155.
Parsons, J.D. and Rodriguez-Tome, P. 2000. JESAM: CORBA softwarecomponents to create and publish EST alignments and clusters.Bioinformatics 16: 313–325.
Picoult-Newberg, L., Ideker, T.E., Pohl, M.G., Taylor, S.L.,Donaldson, M.A., Nickerson, D.A., and Boyce-Jacino, M. 1999.Mining SNPs from EST databases. Genome Res. 9: 167–174.
Rodriguez-Tome, P. and Lijnzaad, P. 2000. RHdb: The radiationhybrid database. Nucleic Acids Res. 28: 146–147.
Schmitt, A.O., Specht, T., Beckmann, G., Dahl, E., Pilarsky, C.P.,Hinzmann, B., and Rosenthal, A. 1999. Exhaustive mining of EST
Figure 3 Sequences that are linked with the longest sequence (U10115 mouse EuroGeneIndex super cluster) are connected by drawinga line between them. Sequences are colored by the number of links they have to other sequences. Sequence quality annotation (measuredlast high quality base) is shown on top of the sequence.
Visualization and Integration of EST Cluster Data
Genome Research 183www.genome.org

libraries for genes differentially expressed in normal and tumourtissues. Nucleic Acids Res. 27: 4251–4260.
Schuler, G.D. 1997. Pieces of the puzzle: Expressed sequence tagsand the catalog of human genes. J. Mol. Med. 75: 694-–698.
Senger, M. 1999. AppLab CORBA-Java based Application Wrapper.CCP11 Newsl, Issue 8. http://www.hgmp.mrc.ac.uk/CCP11
Siegel, J. 2000. CORBA 3 fundamentals and programming. John Wileyand Sons, New York.
Tanabe, K., Nakagomi, S., Kiryu-Seo, S., Namikawa, K., Imai, Y.,Ochi, T., Tohyama, M., and Kiyama, H. 1999.Expressed-sequence-tag approach to identify differentiallyexpressed genes following peripheral nerve axotomy. Brain Res.Mol. Brain Res. 64: 34–40.
Thanaraj, T.A. 1999. A clean data set of EST-confirmed splice sitesfrom Homo sapiens and standards for clean-up procedures.Nucleic Acids Res. 27: 2627–2637.
WWW RESOURCEShttp://corba/RHdb/Rhallochttp://industry.ebi.ac.uk/∼muilu/EST/Databasehttp://industry.ebi.ac.uk/∼muilu/EST/Database/Monitorhttp://industry.ebi.ac.uk/∼muilu/EST/Gbuilderhttp://industry.ebi.ac.uk/openBSAhttp://www.accessone.com/∼lorre/pages/boyermoore.htmlhttp://www.gcg.com/products/wis-package.htmlhttp://www.iona.com/products/orbixwebhttp://www.multimania.com/dogweb/http://www.omg.org/cgi-bin/doc?lifesci/99–12–01.pdfhttp://www.ooc.com/ob
Received July 31, 2000; accepted in revised form October 27, 2000.
Muilu et al.
184 Genome Researchwww.genome.org