Detection of inter-hemispheric asymmetries of brain perfusion in SPECT
Upload
independentCategory
view
1download
0
Gaussian Mixture Modeling of HemisphericLateralization for Language in a Large Sample of HealthyIndividuals Balanced for HandednessBernard Mazoyer*, Laure Zago, Gael Jobard, Fabrice Crivello, Marc Joliot, Guy Perchey,
Emmanuel Mellet, Laurent Petit, Nathalie Tzourio-Mazoyer
Groupe d’Imagerie Neurofonctionnelle, Centre National de la Recherche Scientifique, Commissariat a l’Energie Atomique, et Universite de Bordeaux, Bordeaux, France
Abstract
Hemispheric lateralization for language production and its relationships with manual preference and manual preferencestrength were studied in a sample of 297 subjects, including 153 left-handers (LH). A hemispheric functional lateralizationindex (HFLI) for language was derived from fMRI acquired during a covert sentence generation task as compared with acovert word list recitation. The multimodal HFLI distribution was optimally modeled using a mixture of 3 and 4 Gaussianfunctions in right-handers (RH) and LH, respectively. Gaussian function parameters helped to define 3 types of languagehemispheric lateralization, namely ‘‘Typical’’ (left hemisphere dominance with clear positive HFLI values, 88% of RH, 78% ofLH), ‘‘Ambilateral’’ (no dominant hemisphere with HFLI values close to 0, 12% of RH, 15% of LH) and ‘‘Strongly-atypical’’(right-hemisphere dominance with clear negative HFLI values, 7% of LH). Concordance between dominant hemispheres forhand and for language did not exceed chance level, and most of the association between handedness and languagelateralization was explained by the fact that all Strongly-atypical individuals were left-handed. Similarly, most of therelationship between language lateralization and manual preference strength was explained by the fact that Strongly-atypical individuals exhibited a strong preference for their left hand. These results indicate that concordance of hemisphericdominance for hand and for language occurs barely above the chance level, except in a group of rare individuals (less than1% in the general population) who exhibit strong right hemisphere dominance for both language and their preferred hand.They call for a revisit of models hypothesizing common determinants for handedness and for language dominance.
Citation: Mazoyer B, Zago L, Jobard G, Crivello F, Joliot M, et al. (2014) Gaussian Mixture Modeling of Hemispheric Lateralization for Language in a Large Sampleof Healthy Individuals Balanced for Handedness. PLoS ONE 9(6): e101165. doi:10.1371/journal.pone.0101165
Editor: Carles Soriano-Mas, Bellvitge Biomedical Research Institute-IDIBELL, Spain
Received March 13, 2014; Accepted June 3, 2014; Published June 30, 2014
Copyright: � 2014 Mazoyer et al. This is an open-access article distributed under the terms of the Creative Commons Attribution License, which permitsunrestricted use, distribution, and reproduction in any medium, provided the original author and source are credited.
Data Availability: The authors confirm that all data underlying the findings are fully available without restriction. Relevant data are included within theSupporting Information files.
Funding: Financial support for this study was internal to the authors’ Institution, i.e. the Centre National de la Recherche Scientifique. The funders had no role instudy design, data collection and analysis, decision to publish, or preparation of the manuscript.
Competing Interests: The authors have declared that no competing interests exist.
* Email: [email protected]
Introduction
Two prominent behavioral characteristics of humans, as
compared to non-human primates, are the preponderance of
right-handedness and the capacity to acquire language. Pioneer
studies of language hemispheric lateralization using Wada test [1]
have revealed that about 80% of right-handers (RH) have left
language lateralization, a finding corroborated by recent investi-
gations in healthy volunteers (Table 1). Such coincident high
prevalence of two a priori unrelated phenotypes may indicate
common underpinnings, but the relationship between manual
preference (MP) and language lateralization must be weak and
complex, because a large majority of healthy LH also has ‘‘typical’’
left language lateralization (about 75%, see Table 1). Actually, the
most consistent finding regarding this relationship is an increased
occurrence of atypical language lateralization (whether symmet-
rical or right-lateralized) in LH as compared to RH. This finding
has been reported in both patients using Wada testing and healthy
volunteers using either functional transcranial Doppler or func-
tional magnetic resonance imaging (fMRI). It is worth noticing
that both techniques gave very similar findings despite differences
in instrumentation and physiological underpinnings, in language
tasks, and in methods for computing an index of asymmetry
(Table 1). While functional transcranial Doppler studies and some
fMRI investigations [2] measured hemispheric asymmetries,
others implemented a regional approach based on either one [3]
or a combination of several regions of interest [4]. In addition, the
term ‘‘atypical’’ has different meanings in these studies, since
different thresholds for segregating typical from atypical subjects
were used. For example, the threshold is set to 0 for most
functional transcranial Doppler studies [5–7] while it can be 20 in
fMRI investigations [2,4]. In addition, atypical individuals can be
considered as belonging to a single category [3,5,8,9] or segregated
as having either no clear lateralization (also referred to as
ambilateral, or symmetrical) or strong right-hemisphere domi-
nance (also named strongly-atypical) [4,9–14]. To our knowledge,
no study has so far investigated whether ambilaterality and right-
hemisphere dominance are two different language lateralization
phenotypes or extreme expressions of a continuous atypical
PLOS ONE | www.plosone.org 1 June 2014 | Volume 9 | Issue 6 | e101165

Ta
ble
1.
Re
vie
wo
fso
me
mai
nco
ntr
ibu
tio
ns
on
the
rela
tio
nsh
ipb
etw
ee
nh
and
ed
ne
ssan
dla
ng
uag
ela
tera
lizat
ion
inh
eal
thy
volu
nte
ers
asse
sse
db
ye
ith
er
fun
ctio
nal
Mag
ne
tic
Re
son
ance
Imag
ing
(fM
RI)
or
fun
ctio
nal
Tra
nsc
ran
ial
Do
pp
ler
(fT
CD
).
Au
tho
r[r
efe
ren
ce]
Ta
skR
efe
ren
ceM
eth
od
La
tera
liz
ati
on
ind
ex
MP
(ES
sco
re)
RH
LH
RH
LH
RO
I/th
resh
old
RH
LH
(N)
(N)
%ty
pic
al
%ty
pic
al
Kn
ech
t[5
]co
vert
verb
alfl
ue
ncy
no
ne
fCT
DH
em
isp
he
re/0
.2
5,
25
19
51
31
94
77
Ro
sch
[6]
cove
rtve
rbal
flu
en
cyn
on
efC
TD
He
mis
ph
ere
/0?
20
75
Stro
ob
ant
[7]
cove
rtve
rbal
flu
en
cyn
on
efC
TD
He
mis
ph
ere
/0.
70
30
90
Wh
ite
ho
use
[13
]co
vert
verb
alfl
ue
ncy
no
ne
fCT
DH
em
isp
he
re/3
cat
.4
0,
40
45
30
80
67
29
01
61
90
75
Bad
zako
va[3
]co
vert
verb
alfl
ue
ncy
cro
ssfi
xati
on
fMR
IFr
RO
I/0
.0
,0
10
74
89
58
1
Be
rl[1
4]
sem
anti
cd
eci
sio
nre
vers
esp
ee
ch+t
on
efM
RI
Fr+T
eR
OI/
9ca
t.
40
11
89
8
Be
thm
ann
[12
]se
man
tic
de
cisi
on
lett
er
stri
ng
mat
chin
gfM
RI
Fr+T
eR
OI/
20
,3
cat
.3
3,
24
72
69
2
Hu
ng
-Ge
org
iad
is[1
1]
sem
anti
ce
nco
din
gw
ord
spac
ing
fMR
IFr
RO
I/1
0SR
SR1
71
79
45
3
Pu
jol
[10
]co
vert
verb
alfl
ue
ncy
no
ne
fMR
IFr
RO
I/5
cat
SRSR
50
50
96
76
Spri
ng
er
[2]
sem
anti
cd
eci
sio
nto
ne
de
cisi
on
fMR
IH
em
isp
he
re/2
0.
50
50
94
Szaf
lars
ki[4
]co
vert
verb
alfl
ue
ncy
fin
ge
rta
pp
ing
fMR
IC
om
bin
ed
RO
I/2
0,
52
50
78
36
81
75
96
76
RO
I:re
gio
no
fin
tere
stu
sed
for
late
raliz
atio
nin
de
xco
mp
uta
tio
n(F
r:Fr
on
tal,
Te
:T
em
po
ral)
.th
resh
old
:la
tera
lizat
ion
ind
ex
valu
eu
sed
tose
gre
gat
ety
pic
alfr
om
atyp
ical
lan
gu
age
late
raliz
atio
n.
MP
:M
anu
alP
refe
ren
ce.
ESsc
ore
:Ed
inb
urg
hin
ven
tory
Sco
reo
fri
gh
t-(R
H)
and
left
-han
de
rs(L
H).
SR:
Self
-re
po
rte
dm
anu
alp
refe
ren
ce.
N:
sam
ple
size
.%
typ
ical
:fr
acti
on
of
ind
ivid
ual
se
xhib
itin
gty
pic
alle
ft-h
em
isp
he
red
om
inan
cefo
rla
ng
uag
e.
Sum
mar
yst
atis
tics
(me
ans
we
igh
ted
by
sam
ple
size
s,in
bo
ldit
alic
)ar
ep
rovi
de
dfo
rth
ese
to
fre
po
rts
usi
ng
eac
hm
eth
od
(fT
CD
or
fMR
I).
do
i:10
.13
71
/jo
urn
al.p
on
e.0
10
11
65
.t0
01
Handedness and Language Lateralization
PLOS ONE | www.plosone.org 2 June 2014 | Volume 9 | Issue 6 | e101165
phenotype, likely because tackling this issue requires establishing
language lateralization distribution in a large sample of LH.
In order to better describe the relationship between MP and
language lateralization, several studies have considered MP as a
continuous rather than a binary variable, but such an approach
has given inconsistent findings. Assessing MP strength (MPS) with
the Edinburgh inventory for example, some authors reported a
linear relationship between MPS and either occurrence of atypical
subjects [5,8] or language lateralization index [4]. However, others
did not find such a correlation between such lateralization index
and MPS [9,15], or found one that did not survive exclusion of LH
[15]. Some of these discrepancies may be due to statistical power
limitations and it is noticeable that only one study in the literature
examined a sample of more than 50 LH [5] but did not report on
the relationship between actual values of the lateralization index
and Edinburgh inventory.
The goal of the present study was thus to establish the
distribution of language lateralization in a large sample of LH in
order to 1- investigate whether two groups of atypical subjects
could be identified, 2- compare this distribution to that of RH, and
3- examine its relationship with the MP strength distribution.
Materials and Methods
We recruited 153 LH and 144 RH healthy volunteers, mea-
sured their manual preference strength (MPS), and evaluated their
hemispheric lateralization for language with fMRI during covert
production of sentences and word lists. Note that the sample of
participants of this study is not representative of the general
population, as it was deliberately enriched in left-handers aiming
at a 50/50 ratio.
1. ParticipantsParticipants were recruited within the framework of the
BIL&GIN project, a multimodal imaging/psychometric/genetic
database specifically designed for studying the structural and
functional neural correlates of brain lateralization [16]. The
Comite pour la Protection des Personnes dans la Recherche
Biomedicale de Basse-Normandie approved the study protocol. All
the 297 participants (152 men, 145 women) gave their informed,
written consent, and received an allowance for their participation.
All participants were free of brain abnormality as assessed by an
inspection of their structural T1-MRI scans by a trained
radiologist. Sample mean age was 25.3 years (S.D. = 6.4 years,
range: [18, 57] years), and sample mean level of education was
15.662.3 years (range: [11,20] years), corresponding to almost 5
years of education after the baccalaureate. Skull perimeter of each
participant was measured, men having significantly larger SP than
women (Men: 58.261.5 cm, Women: 55.661.4 cm, p,0.0001,
Student-t test).
2. Participant manual lateralization2.1 Self-reported handedness. Participants were asked to
report whether they considered themselves as right- or left-handed:
144 declared themselves RH (including 72 women), and 153 LH
(including 73 women). Among the latter, 4 women declared
themselves as converted RH. Note that all individuals who
declared themselves as RH used their right hand for writing. Note
also that during the fMRI tasks, LH subjects were free to choose
the hand they preferred for using the response pad, and that 135
used their right hand and 18 their left-hand (including 5 women).
Self-reported LH were 2.6 years younger than RH (RH: 26.566.2
years, LH: 23.968.3 years, p,0.0005, Student-t test), and had 1
year of education less than RH (RH 16.162.2 years, LH 15.162.3
years, p = 0.0002, Student-t test).
2.2 Manual preference strength. MPS was quantified using
the score at the Edinburgh inventory [17], a series of 10 items
dealing with the subject-preferred hand for manipulating objects
and tools. In the present study, we only used 9 of these 10 items,
dropping the ‘‘broom’’ item since very few young people had
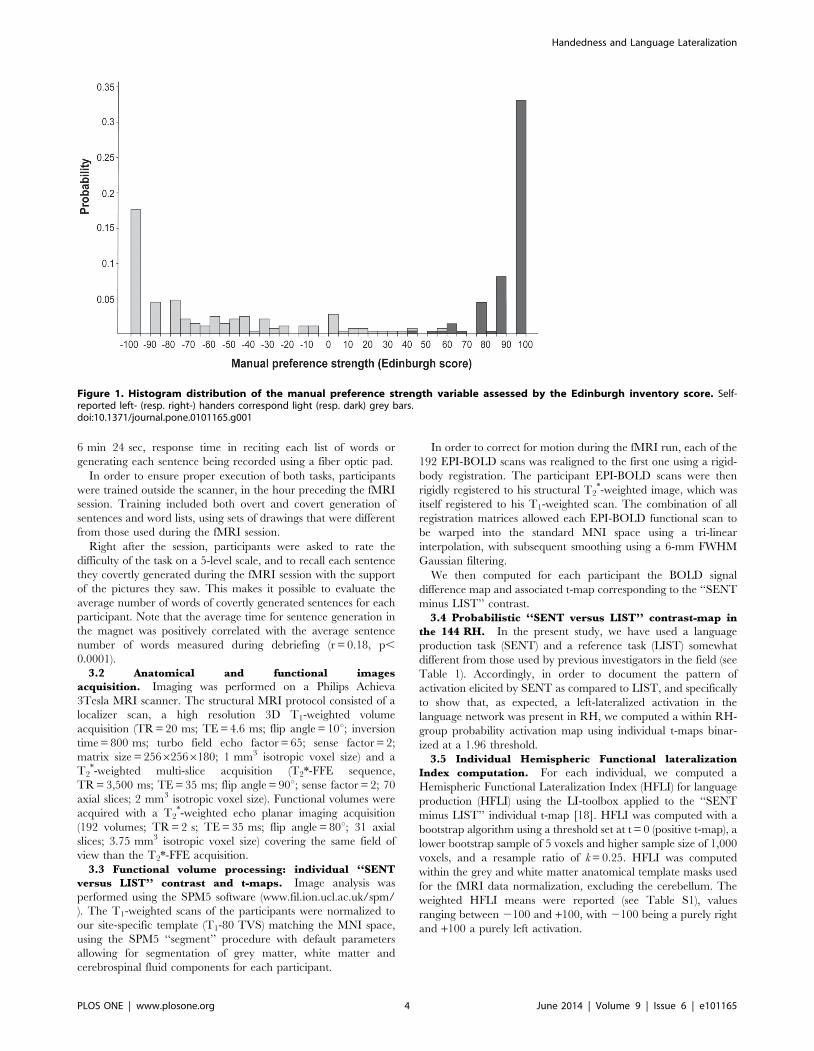
enough familiarity with this tool. Sample distribution of MPS is
shown in Figure 1. Values ranged from 2100 (strong LH) to +100
(strong RH), average MPS values being 93.1 (S.D. = 11.0) for RH,
260.0 (S.D. = 41.0) for LH subjects who used their right hand for
the response pad, and 283.8 (S.D. = 22.0) for LH subjects
responding with left hand, the three subgroups being significantly
different from one another.
In order to compare our results with previous studies, MPS was
transformed as an ordinal variable having either 3 or 7 levels,
named MPS3 and MPS7, respectively. For MPS3, we used
thresholds as close as possible to the 1st and 2nd terciles of MPS
distribution. For MPS7, we used the same MPS category
thresholds as previously defined by others (Knecht et al., 2000b).
Values of thresholds and occurrences for each category and each
variable are shown in Table 2.
3. FMRI of language productionWe evaluated hemispheric dominance for language production
using an index of asymmetry derived from functional MR maps
contrasting covert production of sentences (SENT) with covert
recitation of a list of overlearned words, namely the months of the
year from January to December (LIST).
3.1 Sentence and word list production tasks. Subjects
were presented white line drawing pictures on a black screen
which were either cartoons depicting a scene involving characters,
or a scrambled version of these pictures (Figure 2). Pictures
covered a 14u614u visual area and were presented for 1 sec. Right
after the presentation of a picture, subjects had to covertly
generate either a sentence (SENT) when they saw a cartoon or to
enunciate the ordered list of the months of the year (LIST) when
they saw a scrambled picture.
For SENT, subjects were instructed to generate sentences each
having the same structure, starting with a subject (The little boy,
The gentleman…) and a complement (with his satchel… in
shorts… with glasses…), followed by a verb describing the action
taking place, ending with another complement of place (in the
street… in the playground… on the beach…) or of manner (with
happiness… nastily…). During this generation period, participants
had to fixate a white-cross displayed at the center of the screen and
to press the pad with their index finger when they had finished
enouncing the sentence covertly. For LIST, participants had to
covertly recite the ordered list of months of the year and to press
the pad when they had finished.
Note that a low-level reference task followed each event (SENT
or LIST), consisting in sustaining visual fixation on the central
cross and pressing the pad when the fixation cross was switched to
a square (both stimulus covering a 0.8u60.8u visual area). This
second part of the trial, that lasted at least half the total trial
duration, aimed at refocusing the participant attention on a non-
verbal stimulus and to control for the manual motor response.
Each trial was 18 sec long, the time limit for response being
9 sec including the 1-sec picture display. A 12-sec presentation of a
fixation crosshair preceded and followed the first and last trial of
each run. This slow-event related experimental paradigm
randomly alternated 10 trials of sentence generation with 10 trials
of recitation of a list of months. Overall, the fMRI run lasted
Handedness and Language Lateralization
PLOS ONE | www.plosone.org 3 June 2014 | Volume 9 | Issue 6 | e101165
6 min 24 sec, response time in reciting each list of words or
generating each sentence being recorded using a fiber optic pad.
In order to ensure proper execution of both tasks, participants
were trained outside the scanner, in the hour preceding the fMRI
session. Training included both overt and covert generation of
sentences and word lists, using sets of drawings that were different
from those used during the fMRI session.
Right after the session, participants were asked to rate the
difficulty of the task on a 5-level scale, and to recall each sentence
they covertly generated during the fMRI session with the support
of the pictures they saw. This makes it possible to evaluate the
average number of words of covertly generated sentences for each
participant. Note that the average time for sentence generation in
the magnet was positively correlated with the average sentence
number of words measured during debriefing (r = 0.18, p,
0.0001).
3.2 Anatomical and functional images
acquisition. Imaging was performed on a Philips Achieva
3Tesla MRI scanner. The structural MRI protocol consisted of a
localizer scan, a high resolution 3D T1-weighted volume
acquisition (TR = 20 ms; TE = 4.6 ms; flip angle = 10u; inversion
time = 800 ms; turbo field echo factor = 65; sense factor = 2;
matrix size = 25662566180; 1 mm3 isotropic voxel size) and a
T2*-weighted multi-slice acquisition (T2*-FFE sequence,
TR = 3,500 ms; TE = 35 ms; flip angle = 90u; sense factor = 2; 70
axial slices; 2 mm3 isotropic voxel size). Functional volumes were
acquired with a T2*-weighted echo planar imaging acquisition
(192 volumes; TR = 2 s; TE = 35 ms; flip angle = 80u; 31 axial
slices; 3.75 mm3 isotropic voxel size) covering the same field of
view than the T2*-FFE acquisition.
3.3 Functional volume processing: individual ‘‘SENT
versus LIST’’ contrast and t-maps. Image analysis was
performed using the SPM5 software (www.fil.ion.ucl.ac.uk/spm/
). The T1-weighted scans of the participants were normalized to
our site-specific template (T1-80 TVS) matching the MNI space,
using the SPM5 ‘‘segment’’ procedure with default parameters
allowing for segmentation of grey matter, white matter and
cerebrospinal fluid components for each participant.
In order to correct for motion during the fMRI run, each of the
192 EPI-BOLD scans was realigned to the first one using a rigid-
body registration. The participant EPI-BOLD scans were then
rigidly registered to his structural T2*-weighted image, which was
itself registered to his T1-weighted scan. The combination of all
registration matrices allowed each EPI-BOLD functional scan to
be warped into the standard MNI space using a tri-linear
interpolation, with subsequent smoothing using a 6-mm FWHM
Gaussian filtering.
We then computed for each participant the BOLD signal
difference map and associated t-map corresponding to the ‘‘SENT
minus LIST’’ contrast.
3.4 Probabilistic ‘‘SENT versus LIST’’ contrast-map in
the 144 RH. In the present study, we have used a language
production task (SENT) and a reference task (LIST) somewhat
different from those used by previous investigators in the field (see
Table 1). Accordingly, in order to document the pattern of
activation elicited by SENT as compared to LIST, and specifically
to show that, as expected, a left-lateralized activation in the
language network was present in RH, we computed a within RH-
group probability activation map using individual t-maps binar-
ized at a 1.96 threshold.
3.5 Individual Hemispheric Functional lateralization
Index computation. For each individual, we computed a
Hemispheric Functional Lateralization Index (HFLI) for language
production (HFLI) using the LI-toolbox applied to the ‘‘SENT
minus LIST’’ individual t-map [18]. HFLI was computed with a
bootstrap algorithm using a threshold set at t = 0 (positive t-map), a
lower bootstrap sample of 5 voxels and higher sample size of 1,000
voxels, and a resample ratio of k = 0.25. HFLI was computed
within the grey and white matter anatomical template masks used
for the fMRI data normalization, excluding the cerebellum. The
weighted HFLI means were reported (see Table S1), values
ranging between 2100 and +100, with 2100 being a purely right
and +100 a purely left activation.
Figure 1. Histogram distribution of the manual preference strength variable assessed by the Edinburgh inventory score. Self-reported left- (resp. right-) handers correspond light (resp. dark) grey bars.doi:10.1371/journal.pone.0101165.g001
Handedness and Language Lateralization
PLOS ONE | www.plosone.org 4 June 2014 | Volume 9 | Issue 6 | e101165

4. Statistical analysisAll statistical procedures were conducted using the JMP11 Pro
software package, (www.jmp.com, SAS Institute Inc., 2012).
4.1 Fitting HFLI sample distribution by Gaussian mixture
models; definition of different types of language
hemispheric lateralization. HFLI probability density func-
tion was modeled separately for LH and RH. Because of its
multimodal aspect for either handedness group, a phenomenon
previously noticed by others [19], HFLI probability density
function was modeled using a mixture of n Gaussian components,
namely:
Xi~n
i~1
piN mi,sið Þ, i~1:::n
where N mi,sið Þ denoted the probability density function of a
Gaussian distribution with mean mi and variance s2i , pi being the
weight of the ith Gaussian component in the HFLI distribution
(Pi~n
i~1
pi~1). For each handedness group, the optimal model was
selected as having the lowest corrected Akaike’s information
criterion [20], an index that combines goodness of fit with a
penalty increasing with the number of model parameters. All fits
were performed using the ‘‘Continuous fit’’ procedure of the
JMP11 Pro software, that estimates Gaussian distribution param-
eters mi,si,pið Þ using a maximum likelihood criterion and a quasi-
Newton optimization algorithm.
For both LH and RH, the optimal model, and corresponding
optimal number of Gaussian functions (nopt), were then used for
defining types of language hemispheric lateralization, using lower
and upper HFLI thresholds best segregating the nopt Gaussian
functions from each other. These thresholds were then used for
assigning each participant a language lateralization type based on
his individual HFLI value.
In order to compare our results, a Gaussian mixture model was
also fit to the HFLI distribution observed over the entire sample of
subjects.
Also, in order to compare with previous studies, we used the
classical 2-category language lateralization classification obtained
using a zero threshold on HFLI distribution, subjects having a
positive (resp. negative) HFLI value being declared typical (resp.
atypical).
4.2 Comparison of behavioral variables and cognitive
abilities in groups having different handedness and
language lateralization types. Performances in the two tasks
completed during the fMRI acquisitions were compared between
groups of different handedness and language hemispheric lateral-
ization types using an ANOVA of the response time for sentence
and list generation, as well as of the mean number of words
generated in sentences. Age, educational level, and sex were
included as confounding factors. In order to ensure that the report
made by the subject was consistent, we computed the correlation
between the mean number of words per sentence and the mean
time taken for their generation.
4.3 Relationship between hemispheric lateralization for
language and self-reported handedness. As emphasized in
the Introduction section, various statistical approaches have been
used for assessing the relationship between lateralization for
language and manual preference, depending on whether these
variables were considered as continuous, ordinal, or nominal. In
the present study, we have implemented these different statistical
analyses in order to be able to compare our findings with those of
previous investigators and to demonstrate their robustness.
Ta
ble
2.
Bo
un
dar
ies
and
occ
urr
en
ces
(in
nu
mb
er
of
sub
ject
s(N
)o
rfr
acti
on
of
the
tota
lsa
mp
lesi
ze(i
n%
)o
fth
ed
iffe
ren
tm
anu
alp
refe
ren
cest
ren
gth
(MP
S)ca
teg
ori
es
usi
ng
eit
he
ra
3-l
eve
l(M
PS3
)o
ra
7-l
eve
lsc
ale
(MP
S7,
asin
[5])
.
MP
S3
[21
00
,2
55
][2
54
,9
9]
10
0
N9
91
00
98
%3
3.3
33
.73
3.0
MP
S7
21
00
[29
9,
27
5]
[27
5,
22
5]
[22
5,
25
][2
5,
75
][7
5,
99
]1
00
N5
23
14
22
41
23
89
8
%1
7.5
9.1
15
.57
.74
.41
2.8
33
.0
do
i:10
.13
71
/jo
urn
al.p
on
e.0
10
11
65
.t0
02
Handedness and Language Lateralization
PLOS ONE | www.plosone.org 5 June 2014 | Volume 9 | Issue 6 | e101165
An ANOVA examined the effect of handedness on HFLI value,
including sex, age, level of education and skull perimeter as
confounding variables. This analysis, similar to that performed by
previous investigators [4,10], aimed at testing whether there was a
significant difference in the HFLI average values between RH and
LH.
Using the categorical transformation of HFLI, we also
examined an association between language lateralization type
and handedness (Fisher exact test). This analysis, also implemented
by others [3,13,21,22], aimed at testing whether there was a
significant difference in the proportions of language lateralization
types between RH and LH.
Finally, we implemented an original approach based on the
kappa statistic [23] that is specially suited for measuring the degree
of chance-corrected concordance between the hemisphere con-
tralateral to the preferred hand (Left or non-Left) and the
hemisphere dominant for language (Left or non-Left), pooling
Strongly-atypicals and Ambilaterals in the same language lateral-
ization category (non-Left dominant). This analysis aimed at
testing whether there was a significant concordance in hemispheric
dominance for language production and for the preferred hand in
the entire sample, taking into account the concordance that one
can expect by chance alone. In order to compare our results, we
also measured the kappa statistic when using a 2-category
language lateralization classification defined using a 0 threshold
on HFLI values, as done by others [3,9].
In order to assess the impact of Strongly-atypical subjects on the
results, all analyses were repeated after excluding this subgroup
from the sample.
4.4 Relationship between hemispheric lateralization for
language and manual preference strength. Here again,
different statistical analyses were implemented with the same
motivations as in the previous subsection 4.3.
(a) First, we studied the correlation between MPS and HFLI
values as was done by others [2,9,11,15]. However, because
both MPS and HFLI probability density function’s markedly
differed from normality, correlation between HFLI and
MPS values was investigated using a Spearman rank rather
than a Pearson’s correlation statistic, in each handedness
group as well as in the entire sample.
(b) Considering the MPS3 categorical version of MPS, an
ANOVA examined the effect of MPS3 on HFLI, including
sex, age, level of education and skull perimeter as
confounding variables. Similar analyses have been reported
by others [5,13].
(c) Conversely, an ANOVA examined the effect of language
lateralization types (defined using the 3-category version of
HFLI) on MPS values, including the same confounding
variables as in b).
(d) Then, considering categorical versions of both HFLI and
MPS, we examined an association between language
lateralization and MPS3, an approach similar to that of
Isaacs et al. [8].
(e) In addition, we also used the original approach of the kappa
statistic for measuring the degree of agreement between the
3-level ordinal variables language lateralization and MPS3.
(f) Finally, in order to compare our results, we also conducted
the same analysis than that of Knecht et al [5], searching for
a linear relationship between the occurrence of atypical
individuals (pooling again Ambilateral and Strongly-atypical
individuals) and the 7-level ordinal version of MPS (MPS7).
As before, all analyses, except c) and e), were performed either
with or without including Strongly-atypicals.
Results
1. SENT versus LIST contrast activation probability map inthe RH subgroup
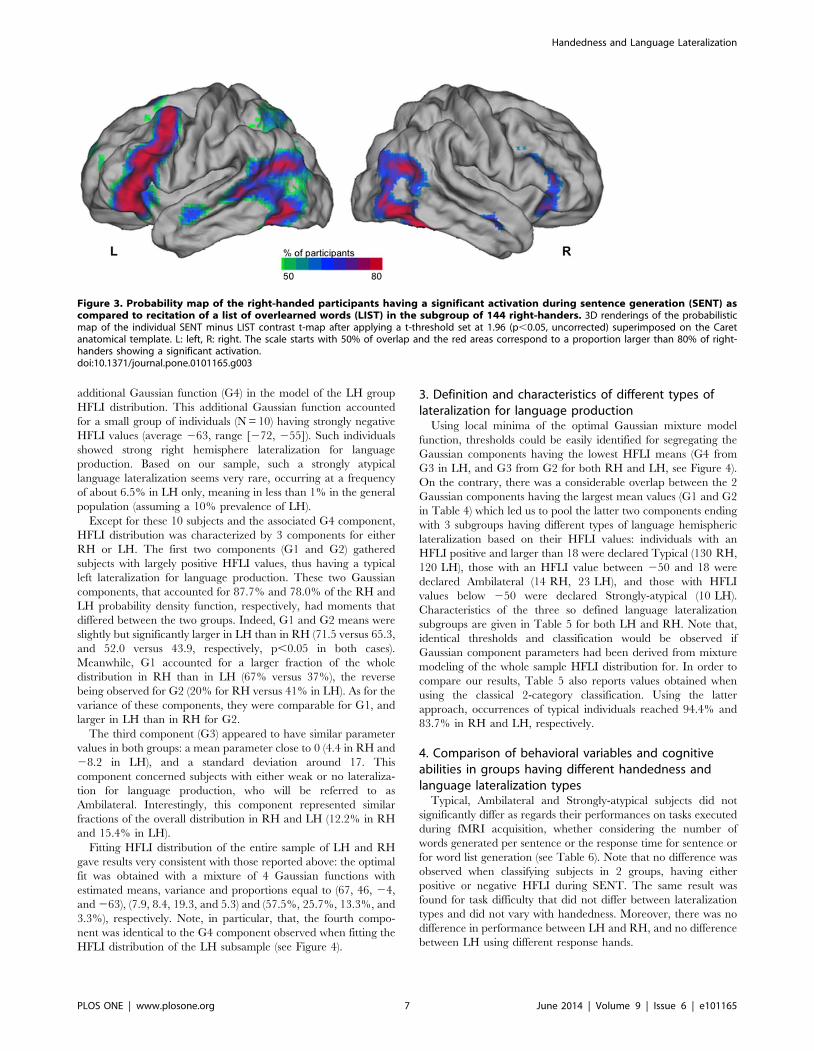
The activation probability map (Figure 3) shows that more than
80% of the RH participants presented activation in the lower part
of the precentral gyrus and the inferior frontal gyrus of the left
hemisphere. High probability activation sites were also observed in
the posterior part of the left superior temporal sulcus and its
termination, in the posterior part of the left middle temporal gyrus
and within the vicinity of the inferior part of the left anterior
occipital sulcus. In the right hemisphere, the regions activated by
at least 80% of the participants were located in the occipital lobe at
the junction of the middle and inferior temporal gyri, and, to a
limited extent, in the inferior frontal gyrus and anterior part of the
superior temporal sulcus.
2. Fitting the HFLI sample distribution by Gaussianmixture models
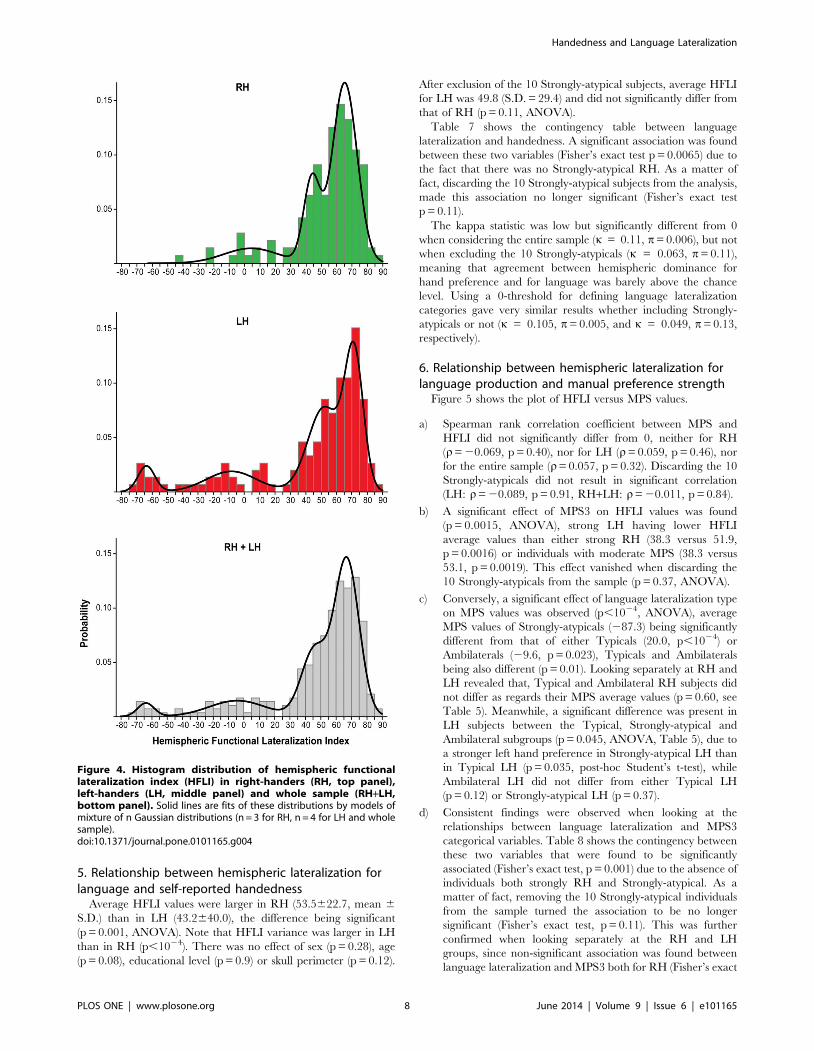
Distributions of HFLI values in LH and RH and corresponding
mixture of Gaussian fits are shown in Figure 4. Both largely
departed from normal, being both multimodal and skewed
towards negative values because of symmetrical or rightward-
asymmetrical individuals.
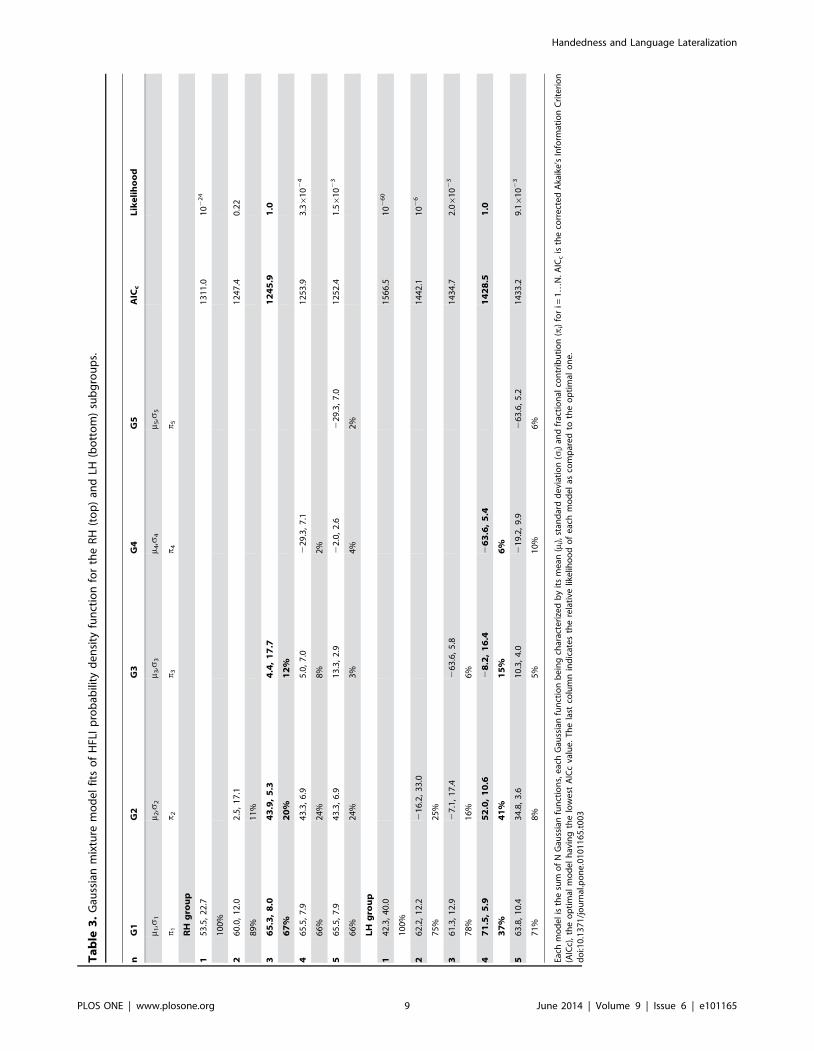
Optimal fits of the HFLI distributions were obtained with
mixtures of 3 and 4 Gaussian functions for the RH and LH
groups, respectively (Table 3). Estimates of optimal model
parameters are given in Table 4 and demonstrate that HFLI
distribution in RH and LH were quite similar, except for an
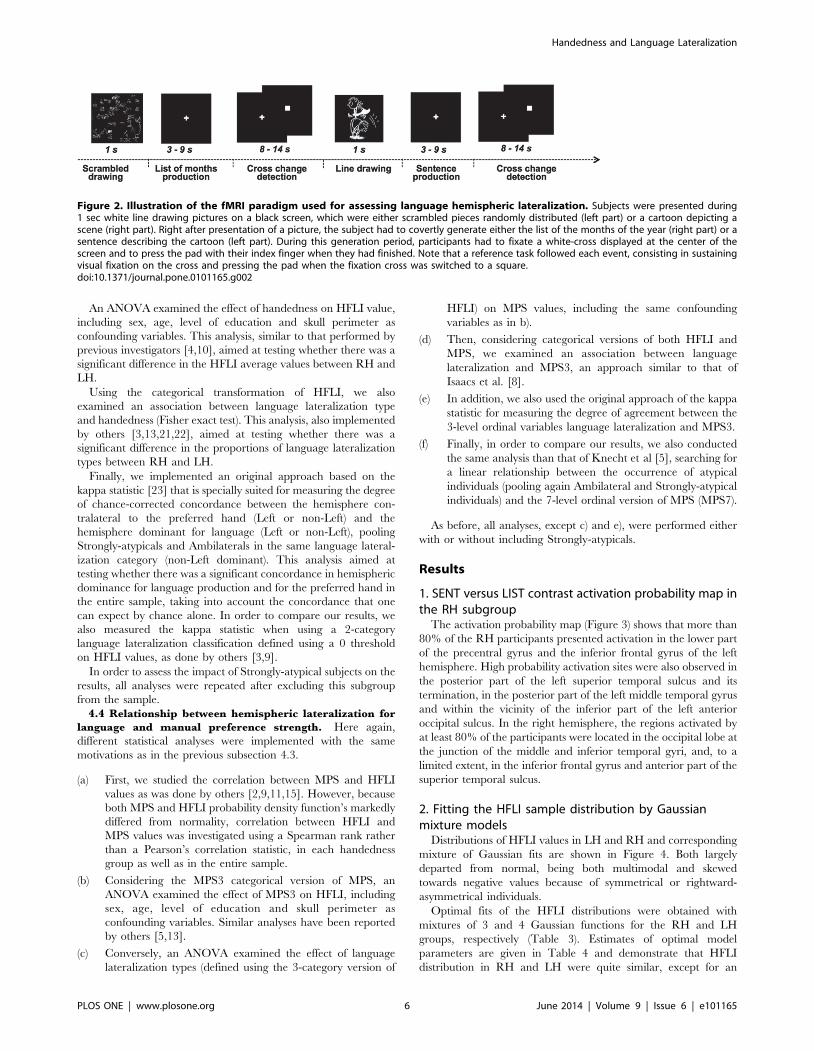
Figure 2. Illustration of the fMRI paradigm used for assessing language hemispheric lateralization. Subjects were presented during1 sec white line drawing pictures on a black screen, which were either scrambled pieces randomly distributed (left part) or a cartoon depicting ascene (right part). Right after presentation of a picture, the subject had to covertly generate either the list of the months of the year (right part) or asentence describing the cartoon (left part). During this generation period, participants had to fixate a white-cross displayed at the center of thescreen and to press the pad with their index finger when they had finished. Note that a reference task followed each event, consisting in sustainingvisual fixation on the cross and pressing the pad when the fixation cross was switched to a square.doi:10.1371/journal.pone.0101165.g002
Handedness and Language Lateralization
PLOS ONE | www.plosone.org 6 June 2014 | Volume 9 | Issue 6 | e101165
additional Gaussian function (G4) in the model of the LH group
HFLI distribution. This additional Gaussian function accounted
for a small group of individuals (N = 10) having strongly negative
HFLI values (average 263, range [272, 255]). Such individuals
showed strong right hemisphere lateralization for language
production. Based on our sample, such a strongly atypical
language lateralization seems very rare, occurring at a frequency
of about 6.5% in LH only, meaning in less than 1% in the general
population (assuming a 10% prevalence of LH).
Except for these 10 subjects and the associated G4 component,
HFLI distribution was characterized by 3 components for either
RH or LH. The first two components (G1 and G2) gathered
subjects with largely positive HFLI values, thus having a typical
left lateralization for language production. These two Gaussian
components, that accounted for 87.7% and 78.0% of the RH and
LH probability density function, respectively, had moments that
differed between the two groups. Indeed, G1 and G2 means were
slightly but significantly larger in LH than in RH (71.5 versus 65.3,
and 52.0 versus 43.9, respectively, p,0.05 in both cases).
Meanwhile, G1 accounted for a larger fraction of the whole
distribution in RH than in LH (67% versus 37%), the reverse
being observed for G2 (20% for RH versus 41% in LH). As for the
variance of these components, they were comparable for G1, and
larger in LH than in RH for G2.
The third component (G3) appeared to have similar parameter
values in both groups: a mean parameter close to 0 (4.4 in RH and
28.2 in LH), and a standard deviation around 17. This
component concerned subjects with either weak or no lateraliza-
tion for language production, who will be referred to as
Ambilateral. Interestingly, this component represented similar
fractions of the overall distribution in RH and LH (12.2% in RH
and 15.4% in LH).
Fitting HFLI distribution of the entire sample of LH and RH
gave results very consistent with those reported above: the optimal
fit was obtained with a mixture of 4 Gaussian functions with
estimated means, variance and proportions equal to (67, 46, 24,
and 263), (7.9, 8.4, 19.3, and 5.3) and (57.5%, 25.7%, 13.3%, and
3.3%), respectively. Note, in particular, that, the fourth compo-
nent was identical to the G4 component observed when fitting the
HFLI distribution of the LH subsample (see Figure 4).
3. Definition and characteristics of different types oflateralization for language production
Using local minima of the optimal Gaussian mixture model
function, thresholds could be easily identified for segregating the
Gaussian components having the lowest HFLI means (G4 from
G3 in LH, and G3 from G2 for both RH and LH, see Figure 4).
On the contrary, there was a considerable overlap between the 2
Gaussian components having the largest mean values (G1 and G2
in Table 4) which led us to pool the latter two components ending
with 3 subgroups having different types of language hemispheric
lateralization based on their HFLI values: individuals with an
HFLI positive and larger than 18 were declared Typical (130 RH,
120 LH), those with an HFLI value between 250 and 18 were
declared Ambilateral (14 RH, 23 LH), and those with HFLI
values below 250 were declared Strongly-atypical (10 LH).
Characteristics of the three so defined language lateralization
subgroups are given in Table 5 for both LH and RH. Note that,
identical thresholds and classification would be observed if
Gaussian component parameters had been derived from mixture
modeling of the whole sample HFLI distribution for. In order to
compare our results, Table 5 also reports values obtained when
using the classical 2-category classification. Using the latter
approach, occurrences of typical individuals reached 94.4% and
83.7% in RH and LH, respectively.
4. Comparison of behavioral variables and cognitiveabilities in groups having different handedness andlanguage lateralization types
Typical, Ambilateral and Strongly-atypical subjects did not
significantly differ as regards their performances on tasks executed
during fMRI acquisition, whether considering the number of
words generated per sentence or the response time for sentence or
for word list generation (see Table 6). Note that no difference was
observed when classifying subjects in 2 groups, having either
positive or negative HFLI during SENT. The same result was
found for task difficulty that did not differ between lateralization
types and did not vary with handedness. Moreover, there was no
difference in performance between LH and RH, and no difference
between LH using different response hands.
Figure 3. Probability map of the right-handed participants having a significant activation during sentence generation (SENT) ascompared to recitation of a list of overlearned words (LIST) in the subgroup of 144 right-handers. 3D renderings of the probabilisticmap of the individual SENT minus LIST contrast t-map after applying a t-threshold set at 1.96 (p,0.05, uncorrected) superimposed on the Caretanatomical template. L: left, R: right. The scale starts with 50% of overlap and the red areas correspond to a proportion larger than 80% of right-handers showing a significant activation.doi:10.1371/journal.pone.0101165.g003
Handedness and Language Lateralization
PLOS ONE | www.plosone.org 7 June 2014 | Volume 9 | Issue 6 | e101165
5. Relationship between hemispheric lateralization forlanguage and self-reported handedness
Average HFLI values were larger in RH (53.5622.7, mean 6
S.D.) than in LH (43.2640.0), the difference being significant
(p = 0.001, ANOVA). Note that HFLI variance was larger in LH
than in RH (p,1024). There was no effect of sex (p = 0.28), age
(p = 0.08), educational level (p = 0.9) or skull perimeter (p = 0.12).
After exclusion of the 10 Strongly-atypical subjects, average HFLI
for LH was 49.8 (S.D. = 29.4) and did not significantly differ from
that of RH (p = 0.11, ANOVA).
Table 7 shows the contingency table between language
lateralization and handedness. A significant association was found
between these two variables (Fisher’s exact test p = 0.0065) due to
the fact that there was no Strongly-atypical RH. As a matter of
fact, discarding the 10 Strongly-atypical subjects from the analysis,
made this association no longer significant (Fisher’s exact test
p = 0.11).
The kappa statistic was low but significantly different from 0
when considering the entire sample (k = 0.11, p= 0.006), but not
when excluding the 10 Strongly-atypicals (k = 0.063, p= 0.11),
meaning that agreement between hemispheric dominance for
hand preference and for language was barely above the chance
level. Using a 0-threshold for defining language lateralization
categories gave very similar results whether including Strongly-
atypicals or not (k = 0.105, p= 0.005, and k = 0.049, p= 0.13,
respectively).
6. Relationship between hemispheric lateralization forlanguage production and manual preference strength
Figure 5 shows the plot of HFLI versus MPS values.
a) Spearman rank correlation coefficient between MPS and
HFLI did not significantly differ from 0, neither for RH
(r= 20.069, p = 0.40), nor for LH (r= 0.059, p = 0.46), nor
for the entire sample (r= 0.057, p = 0.32). Discarding the 10
Strongly-atypicals did not result in significant correlation
(LH: r= 20.089, p = 0.91, RH+LH: r= 20.011, p = 0.84).
b) A significant effect of MPS3 on HFLI values was found
(p = 0.0015, ANOVA), strong LH having lower HFLI
average values than either strong RH (38.3 versus 51.9,
p = 0.0016) or individuals with moderate MPS (38.3 versus
53.1, p = 0.0019). This effect vanished when discarding the
10 Strongly-atypicals from the sample (p = 0.37, ANOVA).
c) Conversely, a significant effect of language lateralization type
on MPS values was observed (p,1024, ANOVA), average
MPS values of Strongly-atypicals (287.3) being significantly
different from that of either Typicals (20.0, p,1024) or
Ambilaterals (29.6, p = 0.023), Typicals and Ambilaterals
being also different (p = 0.01). Looking separately at RH and
LH revealed that, Typical and Ambilateral RH subjects did
not differ as regards their MPS average values (p = 0.60, see
Table 5). Meanwhile, a significant difference was present in
LH subjects between the Typical, Strongly-atypical and
Ambilateral subgroups (p = 0.045, ANOVA, Table 5), due to
a stronger left hand preference in Strongly-atypical LH than
in Typical LH (p = 0.035, post-hoc Student’s t-test), while
Ambilateral LH did not differ from either Typical LH
(p = 0.12) or Strongly-atypical LH (p = 0.37).
d) Consistent findings were observed when looking at the
relationships between language lateralization and MPS3
categorical variables. Table 8 shows the contingency between
these two variables that were found to be significantly
associated (Fisher’s exact test, p = 0.001) due to the absence of
individuals both strongly RH and Strongly-atypical. As a
matter of fact, removing the 10 Strongly-atypical individuals
from the sample turned the association to be no longer
significant (Fisher’s exact test, p = 0.11). This was further
confirmed when looking separately at the RH and LH
groups, since non-significant association was found between
language lateralization and MPS3 both for RH (Fisher’s exact
Figure 4. Histogram distribution of hemispheric functionallateralization index (HFLI) in right-handers (RH, top panel),left-handers (LH, middle panel) and whole sample (RH+LH,bottom panel). Solid lines are fits of these distributions by models ofmixture of n Gaussian distributions (n = 3 for RH, n = 4 for LH and wholesample).doi:10.1371/journal.pone.0101165.g004
Handedness and Language Lateralization
PLOS ONE | www.plosone.org 8 June 2014 | Volume 9 | Issue 6 | e101165
Ta
ble
3.
Gau
ssia
nm
ixtu
rem
od
el
fits
of
HFL
Ip
rob
abili
tyd
en
sity
fun
ctio
nfo
rth
eR
H(t
op
)an
dLH
(bo
tto
m)
sub
gro
up
s.
nG
1G
2G
3G
4G
5A
ICc
Lik
eli
ho
od
m 1,s
1m 2
,s2
m 3,s
3m 4
,s4
m 5,s
5
p1
p2
p3
p4
p5
RH
gro
up
15
3.5
,2
2.7
13
11
.01
02
24
10
0%
26
0.0
,1
2.0
2.5
,1
7.1
12
47
.40
.22
89
%1
1%
36
5.3
,8
.04
3.9
,5
.34
.4,
17
.71
24
5.9
1.0
67
%2
0%
12
%
46
5.5
,7
.94
3.3
,6
.95
.0,
7.0
22
9.3
,7
.11
25
3.9
3.36
10
24
66
%2
4%
8%
2%
56
5.5
,7
.94
3.3
,6
.91
3.3
,2
.92
2.0
,2
.62
29
.3,
7.0
12
52
.41
.56
10
23
66
%2
4%
3%
4%
2%
LH
gro
up
14
2.3
,4
0.0
15
66
.51
02
60
10
0%
26
2.2
,1
2.2
21
6.2
,3
3.0
14
42
.11
02
6
75
%2
5%
36
1.3
,1
2.9
27
.1,
17
.42
63
.6,
5.8
14
34
.72
.06
10
23
78
%1
6%
6%
47
1.5
,5
.95
2.0
,1
0.6
28
.2,
16
.42
63
.6,
5.4
14
28
.51
.0
37
%4
1%
15
%6
%
56
3.8
,1
0.4
34
.8,
3.6
10
.3,
4.0
21
9.2
,9
.92
63
.6,
5.2
14
33
.29
.16
10
23
71
%8
%5
%1
0%
6%
Each
mo
de
lis
the
sum
of
NG
auss
ian
fun
ctio
ns,
eac
hG
auss
ian
fun
ctio
nb
ein
gch
arac
teri
zed
by
its
me
an( m
i),st
and
ard
de
viat
ion
(si)
and
frac
tio
nal
con
trib
uti
on
(pi)
for
i=1
…N
.AIC
cis
the
corr
ect
ed
Aka
ike
’sIn
form
atio
nC
rite
rio
n(A
ICc)
,th
eo
pti
mal
mo
de
lh
avin
gth
elo
we
stA
ICc
valu
e.
Th
ela
stco
lum
nin
dic
ate
sth
ere
lati
velik
elih
oo
do
fe
ach
mo
de
las
com
par
ed
toth
eo
pti
mal
on
e.
do
i:10
.13
71
/jo
urn
al.p
on
e.0
10
11
65
.t0
03
Handedness and Language Lateralization
PLOS ONE | www.plosone.org 9 June 2014 | Volume 9 | Issue 6 | e101165

test, p = 0.54) and for LH whether or not including Strongly-
atypicals (Fisher’s exact test, p = 0.11 and p = 0.34, respec-
tively).
e) As for the kappa statistic, it was again small and failed to
reach significance (k = 0.033, p= 0.055) indicating that
agreement between language lateralization and MPS3 was
weak and again not significantly different from the chance
level.
f) Finally, similar to what was found by others [5], we observed
a significant linear relationship between the occurrence of
atypical individuals (pooling again Strongly-atypicals and
Ambilaterals) in the categories of the 7-level ordinal scale
version of MPS (MPS7) and the corresponding MPS category
mid-values (p = 0.030, slope = 20.089, intercept = 10.7).
However, removing the 10 Strongly-atypicals from this
analysis turned again this relationship to be no longer
significant (p = 0.17).
7. Summary of the resultsIn a large sample of healthy individuals, balanced for
handedness, Gaussian mixture modeling of the distribution of
hemispheric functional asymmetries during sentence production
identified 3 types of lateralization, namely Typical (left-lateralized),
Ambilateral (no lateralization) and Strongly-atypical (right-lateral-
ized), the last category being rare (less than 1% prevalence) and
including only LH. Excluding these rare subjects, we measured a
concordance between dominant hemispheres for language and for
the preferred hand that was not above what could be expected to
occur by chance only, this being true both for RH and for LH. In
LH, a significant association was observed between the strength of
lateralization for language and the strength of manual preference,
but this relationship was largely explained by the existence of the
small group of Strongly-atypical individuals who had both strong
left hand preference and strong right hemisphere dominance for
language.
Discussion
1. Methodological issuesLanguage production has long been known as the most
lateralized language task as compared to speech listening that
elicits smaller leftward asymmetries [7,24,25]. Sentence produc-
tion functional asymmetries have been demonstrated to be in
strong accordance with language lateralization as measured with
Wada procedure [26], language tasks involving sentence leading to
Table 4. Comparison of HFLI optimal Gaussian mixture function model parameters for the RH and LH samples.
G1 G2 G3 G4
m1 [95% CI] m2 [95% CI] m3 [95% CI] m4 [95% CI]
RH 65.3 [63.7, 66.9] 43.9 [42.0, 45.8] 4.4 [23.8, 12.7] –
LH 71.5 [69.9, 73.0] 52.0 [49.4, 54.6] 28.2 [214.9, 21.6] 263.6 [267.0, 260.3]
s1 [95% CI] s2 [95% CI] s3 [95% CI] s4 [95% CI]
RH 8.1 [6.7, 9.8] 5.3 [3.8, 7.4] 17.7 [12.1, 26.0] –
LH 6.0 [4.6, 7.7] 10.6 [8.4, 13.4] 16.4 [11.6, 23.2] 5.4 [2.7, 10.8]
p1 [95% CI] p2 [95% CI] p3 [95% CI] p4 [95% CI]
RH 67.4 [52.9, 79.2] 20.3 [13.9, 28.7] 12.2 [7.5, 19.1] –
LH 36.7 [27.7, 46.7] 41.3 [31.7, 51.7] 15.4 [10.1, 22.7] 6.5 [3.4, 11.9]
Each Gaussian function is characterized by its mean (mi), standard deviation (si) and fractional contribution (pi) for i = 1…n. [95% CI] is the 95% confidence interval.doi:10.1371/journal.pone.0101165.t004
Table 5. Characteristics of language lateralization subjects in the RH and LH subgroups depending on their type of languagelateralization using Gaussian mixture modeling (GMM, top) or a classical 2-category based on a zero threshold on HFLI values(0 THR, bottom).
GMM RH (N = 144) LH (N = 153)
Typical Atypical Strongly-atypical Typical Atypical Strongly-atypical
N (%) 130 (90.3%) 14 (9.7%) 0 (0.0%) 120 (78.4%) 23 (15.0%) 10 (6.5%)
HFLI 59613 22617 – 61613 29617 26365
MPS 93611 94612 – 259642 273629 287618
0 THR RH (N = 144) LH (N = 153)
Typical Atypical Typical Atypical
N (%) 136 (94.4%) 8 (5.6%) 128 (83.7%) 25 (16.3%)
HFLI 57616 213615 58618 237624
MPS 93611 95614 259641 282621
doi:10.1371/journal.pone.0101165.t005
Handedness and Language Lateralization
PLOS ONE | www.plosone.org 10 June 2014 | Volume 9 | Issue 6 | e101165

even more robust leftward asymmetries in healthy controls [27].
We chose to contrast the sentence production task with a high-
level reference task, namely the automatic recitation of a list of
overlearned words, thereby following another recommendation
made by others [24]. The use of an active control task involving
overlearned and automatic recitation of words in mother-tongue,
and globally balanced with the sentence production task in terms
of the number of words to be enounced, helped to subtract out
components common to both tasks, thereby enhancing the
detection of areas involved in lexico-semantic and syntactic
processing.
In the present work we designed a language production
paradigm that allowed for an investigation of inter-individual
variability of hemispheric asymmetries of sentence processing
areas. We chose to rely on a very familiar and overlearned list of
words because it constitutes a high-level reference task in mother
tongue that was balanced with the sentence task in terms of
amount of verbal stimuli to be processed.
This paradigm allowed for obtaining robust asymmetrical
contrast maps at the individual level, and its reliability is evidenced
by the proportion of RH having a HFLI .0 (94.4%) strongly
concordant with existing literature, and independent of the
method used or of the production paradigm applied. As a matter
of fact, we observed a proportion of RH with positive HFLI
identical to that observed by others who used fCTD during a word
fluency task (Table 1, [19]). In addition, the sentence minus list
probabilistic contrast map obtained in the 144 RH illustrates the
involvement of the inferior frontal gyrus and posterior STS area by
this sentence production task, as well as their strong leftward
asymmetry. This confirms the pertinence of the present paradigm
for the determination of individual hemispheric asymmetries of
language areas.
Definition of language lateralization categories in our study
differs from previous works that were based on arbitrary thresholds
(see Table 1). Using a large sample balanced for handedness and
unsupervised Gaussian mixture modeling, we identified three non-
overlapping lateralization types tailored to the multimodal nature
of the HFLI distribution. This resulted in the inclusion of 19
individuals (9 RH and 10 LH) having a small but positive
asymmetry index in the Ambilateral group, who would have
otherwise been considered as typical. Moreover, use of Gaussian
mixture modeling was also important in segregating a subgroup of
individuals (Strongly-atypicals) having much lower mean HFLI
than Ambilaterals.
Because typical subjects represent 90% of the population, it is
important to assess whether or not they constitute a homogeneous
group with respect to hemispheric dominance. Gaussian mixture
model suggests the existence two distinct subgroups of typical
individuals, having strong and moderate left language lateraliza-
tion, respectively, this holding both for RH and for LH. However,
because of the overlap between the two Gaussian distributions
associated to these two putative groups (G1 and G2), it was not
possible to reliably assign Typical subjects to either group. As
proposed by others, additional variables, including regional
patterns of functional asymmetry, may be necessary for identifying
these subgroups and the factors that explain their differences [28].
Finally, it is worth mentioning that in the present studies we
used two measures of handedness, namely self-report and hand
preference inventory, for investigating the relationship between
handedness and hemispheric dominance for language. Other
measures could have been used, such as relative hand skill or
performance at a reaching task. However, a recent report indicates
that none of these different measures emerged as clearly superiorTa
ble
6.
Co
mp
aris
on
of
fMR
Ise
ssio
np
erf
orm
ance
sin
gro
up
sva
ryin
gin
man
ual
pre
fere
nce
or
late
raliz
atio
nty
pe
.
Be
ha
vio
ral
con
tro
ld
uri
ng
fMR
IR
HL
Hp
Ty
pic
al
Am
bil
ate
ral
Str
on
gly
-aty
pic
al
p
Se
lfra
tin
go
fta
skd
iffi
cult
y(/
5)
2.7
9(0
.09
)2
.67
(0.0
9)
0.5
72
.71
(0.0
7)
2.7
1(0
.18
)3
.20
(0.3
4)
0.3
6
Nu
mb
er
of
wo
rds
pe
rse
nte
nce
12
.3(0
.17
)1
2.5
(0.1
7)
0.4
11
2.4
(0.1
2)
12
.0(0
.32
)1
3.4
(0.9
4)
0.1
7
RT
sen
ten
cep
rod
uct
ion
(ms)
55
97
(90
)5
61
8(7
7)
0.8
55
60
8(5
8)
55
76
(16
7)
56
76
(39
1)
0.9
4
RT
wo
rdli
stp
rod
uct
ion
(ms)
52
28
(96
)5
23
4(9
3)
0.9
85
21
9(7
0)
53
63
(19
8)
49
74
(42
8)
0.6
9
pva
lue
corr
esp
on
ds
toth
ere
sult
so
fan
AN
OV
Ae
nte
rin
gse
x,ag
e,
SPan
de
du
cati
on
alle
vel
asco
vari
ate
s(R
T:r
esp
on
seti
me
,N:
nu
mb
er)
.No
teth
atth
ere
was
no
dif
fere
nce
be
twe
en
the
LHg
rou
ps
usi
ng
dif
fere
nt
resp
on
seh
and
.d
oi:1
0.1
37
1/j
ou
rnal
.po
ne
.01
01
16
5.t
00
6
Handedness and Language Lateralization
PLOS ONE | www.plosone.org 11 June 2014 | Volume 9 | Issue 6 | e101165
to the others as regards their correlation with cerebral dominance
for language [9].
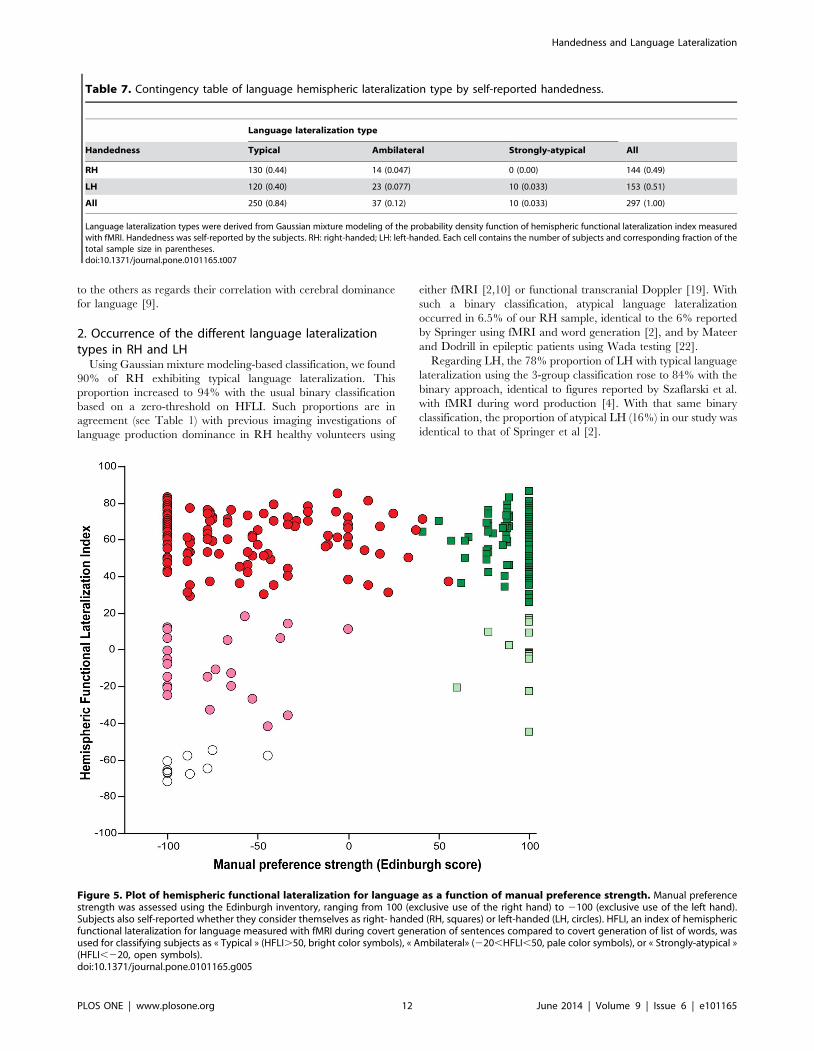
2. Occurrence of the different language lateralizationtypes in RH and LH
Using Gaussian mixture modeling-based classification, we found
90% of RH exhibiting typical language lateralization. This
proportion increased to 94% with the usual binary classification
based on a zero-threshold on HFLI. Such proportions are in
agreement (see Table 1) with previous imaging investigations of
language production dominance in RH healthy volunteers using
either fMRI [2,10] or functional transcranial Doppler [19]. With
such a binary classification, atypical language lateralization
occurred in 6.5% of our RH sample, identical to the 6% reported
by Springer using fMRI and word generation [2], and by Mateer
and Dodrill in epileptic patients using Wada testing [22].
Regarding LH, the 78% proportion of LH with typical language
lateralization using the 3-group classification rose to 84% with the
binary approach, identical to figures reported by Szaflarski et al.
with fMRI during word production [4]. With that same binary
classification, the proportion of atypical LH (16%) in our study was
identical to that of Springer et al [2].
Table 7. Contingency table of language hemispheric lateralization type by self-reported handedness.
Language lateralization type
Handedness Typical Ambilateral Strongly-atypical All
RH 130 (0.44) 14 (0.047) 0 (0.00) 144 (0.49)
LH 120 (0.40) 23 (0.077) 10 (0.033) 153 (0.51)
All 250 (0.84) 37 (0.12) 10 (0.033) 297 (1.00)
Language lateralization types were derived from Gaussian mixture modeling of the probability density function of hemispheric functional lateralization index measuredwith fMRI. Handedness was self-reported by the subjects. RH: right-handed; LH: left-handed. Each cell contains the number of subjects and corresponding fraction of thetotal sample size in parentheses.doi:10.1371/journal.pone.0101165.t007
Figure 5. Plot of hemispheric functional lateralization for language as a function of manual preference strength. Manual preferencestrength was assessed using the Edinburgh inventory, ranging from 100 (exclusive use of the right hand) to 2100 (exclusive use of the left hand).Subjects also self-reported whether they consider themselves as right- handed (RH, squares) or left-handed (LH, circles). HFLI, an index of hemisphericfunctional lateralization for language measured with fMRI during covert generation of sentences compared to covert generation of list of words, wasused for classifying subjects as « Typical » (HFLI.50, bright color symbols), « Ambilateral» (220,HFLI,50, pale color symbols), or « Strongly-atypical »(HFLI,220, open symbols).doi:10.1371/journal.pone.0101165.g005
Handedness and Language Lateralization
PLOS ONE | www.plosone.org 12 June 2014 | Volume 9 | Issue 6 | e101165

Overall, atypical language lateralization was found more
frequent in LH than in RH, in agreement with pioneer
neuropsychological studies conducted by Hecaen [29]. However,
the difference in atypical language lateralization frequency was not
significant because non-typical language lateralization frequency
in RH was far from negligible, ranging in our study from 6% to
10% depending on the threshold used for segregating typical from
non-typical language lateralization. Note that this result cannot be
attributed to inter-individual variability in task difficulty, known to
trigger increased right hemisphere attentional resources, since
there was no difference in performance or in subjective task
difficulty between RH and LH.
3. Right-hemisphere dominance for language is rare andpresent in LH only
Among non left-dominant language lateralization individuals,
Gaussian mixture modeling segregated a subgroup of individuals
with right hemisphere language dominance, confirming the
existence of this rare but normal variant of language organization
[5,10,21]. Based on the 6.5% proportion of Strongly-atypical LH
observed in this study, one can estimate a 0.6% prevalence for
right-hemisphere language lateralization in the general population
(assuming a 10% LH prevalence). This finding is in accordance
with the 8% of LH having an HFLI value below 220 in
Szaflarski’s study (see Figure 2 of [4]) as well as with the 10% of
LH having an HFLI value below 225 in Pujol’s study (see Table
of [10]). It also fits well with a recent review of 1,208 Wada testing
of epileptic patients, in which right hemisphere language
dominance has been observed in 7% of LH patients free from
left hemisphere damage [30].
In our sample, right-hemisphere dominance was observed only
in LH, in agreement with previous studies that reported no case of
rightward dominance in healthy RH subjects during verb
generation [2,10,19]. In patients, there have been reports of
aphasia after a right-hemisphere lesion in LH [29], as well as of a
large prevalence of left-handedness (8 among 9) in epileptic
patients with right language dominance as assessed by the Wada
test [22]. Therefore, Strongly-atypical individuals appear to form a
particular group characterized by joint strong right hemisphere
dominance both for language and for hand, as evidenced by their
287 average Edinburgh score. Such an association between
strength of left-handedness and right hemisphere language
lateralization is in agreement with previous studies using either
Wada test [8] or fMRI [4]. It raises the issue of a genetic origin of
this rare combination of phenotypes. So far, the search for genetic
variants at the origin of handedness has been unfruitful (see [31]
for review). Focusing on this subgroup of Strongly-atypical
subjects, using new generation sequencing techniques, might offer
the opportunity of uncovering some genetic variants involved in
the co-variance between handedness and language hemispheric
lateralization.
4. Hand lateralization and language dominance areassociated by chance, except in right-hemispheredominant individuals
An important finding of our study is that, when ignoring this
group of rare Strongly-atypical individuals, we found no significant
chance-corrected agreement between hemispheric dominance for
hand and hemispheric dominance for language production. Given
the 90% of right-handedness and 90% of left-hemisphere
dominance in the general population, this result may at first sight
seem counterintuitive. However, one should remember that, due
to this joint high prevalence, a high level of agreement between
these two traits is expected due to chance only, namely in about
81% of the subjects. Other studies have already pinpointed such a
lack of agreement [9], which, together with the results of the
present studies appears to refute the dogma of the existence of a
correlation between hemispheric dominance for language and
handedness, and should lead to revisit models, including genetic
ones [32], attempting to explain this association [33].
5. Incidence of atypical individuals and manualpreference strength
Another key result of the present study is that occurrence of
atypical individuals, as assessed by the 2-category classification,
was found significantly correlated with strength of handedness. In
a previous study, Knecht et al. [5] described a link between
handedness and the occurrence of atypical individuals (defined as
having negative left-minus-right laterality index as measured with
fCTD during verb generation). Specifically, these authors reported
an inverse relationship between MPS ranked on the same 7-level
scale, and the incidence of atypical individuals across their entire
study sample of both RH and LH. Although we observed a very
similar relationship in terms of slope and intercept values (see
section 3.5 above) when considering the whole sample of
individuals, we demonstrated that this correlation 1- was present
in LH but not in RH, and 2- vanished when Strongly-atypical
individuals were discarded.
In order to exclude a possible dependence of this finding on the
category boundaries of the MPS7 rating scale, we conducted the
same analysis using a 3-level scale with almost the same number of
individuals in each category (MPS3). Again, a significant
relationship was found that vanished when the 10 Strongly-
atypical individuals were disregarded, calling for a different
interpretation of Knecht et al findings. First, one should note that
Table 8. Contingency table of language hemispheric lateralization type by manual preference strength.
Language lateralization type
MPS3 Typical Ambilateral Strongly-atypical All
Strong R 87 (0.29) 11 (0.037) 0 (0.00) 98 (0.33)
Moderate 90 (0.30) 9 (0.030) 1 (0.003) 100 (0.33)
Strong L 73 (0.25) 17 (0.057) 9 (0.030) 99 (0.33)
All 250 (0.84) 37 (0.12) 10 (0.033) 297 (1.00)
Language lateralization types were derived from Gaussian mixture modeling of the probability density function of hemispheric functional lateralization index measuredwith fMRI. Manual Preference Strength was measured with the Edinburgh inventory (MPS) and scored on a 3-level scale (MPS3). Strong R: MPS = +100, Moderate: 255,
MPS,+100, Strong L: MPS,255. Each cell contains the number of subjects and corresponding fraction of the total sample size in parentheses.doi:10.1371/journal.pone.0101165.t008
Handedness and Language Lateralization
PLOS ONE | www.plosone.org 13 June 2014 | Volume 9 | Issue 6 | e101165
the first four levels of the MP7 scale included only LH, the fifth
included a majority of LH, and the last two classes included RH
only (see Figure 3 of [5]). Because individual lateralization index
values were not available from Knecht et al. report, we could not
directly test whether discarding right hemisphere dominant
individuals from their sample would render non significant the
association they reported. However, based on the results of the
distribution of lateralization index by MPS they reported, it is clear
that strongly-atypical individuals are present in their sample, and
that they are all LH and have stronger manual preference
strength. Therefore, the claimed linear relationship between
manual preference strength and occurrence of atypical individuals
may just reflect two subgroup effects hitherto described, namely 1-
larger MPS and HFLI in Strongly-atypicals as compared to
Ambilateral LH, and 2-larger HFLI and MPS values in RH as
compared to atypical LH. As a matter of fact, in the present study,
there was no difference in MP strength or manual ability between
typical and Ambilateral RH, the MP strength of Ambilateral RH
being even stronger than that of typical RH.
Conclusion
This study demonstrates that, except in a small sample of strong
LH with rightward asymmetry, concordance of hemispheric
dominance for hand and for language production occurs by
chance. The present result thus questions the existence of a link
between control of the hand and of language by the same
hemisphere, while indicating that a rightward representation of
language, although rare, is a normal variant of language
lateralization.
Supporting Information
Table S1 Raw data of the study sample.
(XLSX)
Acknowledgments
The authors are indebted to Isabelle Hesling for very helpful comments in
preparing the manuscript, and to Nicolas Delcroix and Marie-Renee
Boudou-Turbelin for their help in acquiring and processing the BIL&GIN
database.
Author Contributions
Conceived and designed the experiments: BM LZ GJ FC MJ EM LP
NTM. Performed the experiments: BM LZ GJ FC MJ GP EM LP NTM.
Analyzed the data: BM NTM. Wrote the paper: BM LZ GJ FC MJ EM LP
NTM.
References
1. Wada J, Rasmussen T (1960) Intracarotid injection of sodium amytal for the
lateralization of cerebral speech dominance: experimental and clinical
observations. J Neurosurg 17: 266–282.
2. Springer JA, Binder JR, Hammeke TA, Swanson SJ, Frost JA, et al. (1999)
Language dominance in neurologically normal and epilepsy subjects: a
functional MRI study. Brain 122: 2033–2046.
3. Badzakova-Trajkov G, Haberling IS, Roberts RP, Corballis MC (2010)
Cerebral asymmetries: complementary and independent processes. PLoS One
5: e9682.
4. Szaflarski JP, Binder JR, Possing ET, McKiernan KA, Ward BD, et al. (2002)
Language lateralization in left-handed and ambidextrous people: fMRI data.
Neurology 59: 238–244.
5. Knecht S, Drager B, Deppe M, Bobe L, Lohmann H, et al. (2000b) Handedness
and hemispheric language dominance in healthy humans. Brain 123: 2512–
2518.
6. Rosch RE, Bishop DV, Badcock NA (2012) Lateralised visual attention is
unrelated to language lateralisation, and not influenced by task difficulty–A
functional transcranial Doppler study. Neuropsychologia 50: 810–815.
7. Stroobant N, Buijs D, Vingerhoets G (2009) Variation in brain lateralization
during various language tasks: A functional transcranial Doppler study. Behav
Brain Res 199: 190–196.
8. Isaacs KL, Barr WB, Nelson PK, Devinsky O (2006) Degree of handedness and
cerebral dominance. Neurology 66: 1855–1858.
9. Groen MA, Whitehouse AJ, Badcock NA, Bishop DV (2013) Associations
between handedness and cerebral lateralisation for language: a comparison of
three measures in children. PLoS One 8: e64876.
10. Pujol J, Deus J, Losilla JM, Capdevila A (1999) Cerebral lateralization of
language in normal left-handed people studied by functional MRI. Neurology
52: 1038–1038.
11. Hund-Georgiadis M, Lex U, Friederici AD, von Cramon DY (2002) Non-
invasive regime for language lateralization in right and left-handers by means of
functional MRI and dichotic listening. Exp Brain Res 145: 166–176.
12. Bethmann A, Tempelmann C, De Bleser R, Scheich H, Brechmann A (2007)
Determining language laterality by fMRI and dichotic listening. Brain Res 1133:
145–157.
13. Whitehouse AJ, Bishop DV (2009) Hemispheric division of function is the result
of independent probabilistic biases. Neuropsychologia 47: 1938–1943.
14. Berl MM, Zimmaro LA, Khan OI, Dustin I, Ritzl E, et al. (2013)
Characterization of atypical language activation patterns in focal epilepsy.
Ann Neurol 75: 33–42.
15. Van der Haegen L, Cai Q, Seurinck R, Brysbaert M (2011) Further fMRI
validation of the visual half field technique as an indicator of language laterality:
a large-group analysis. Neuropsychologia 49: 2879–2888.
16. Petit L, Crivello F, Mellet E, Jobard G, Zago L, et al. (2012) BIL&GIN: Adatabase for the study of hemispheric specialization. In 18th annual meeting of the
organization for human brain mapping. Beijing, China.17. Oldfield RC (1971) The assessment and analysis of handedness: the Edinburgh
inventory. Neuropsychologia 9: 97–113.
18. Wilke M, Lidzba K (2007) LI-tool: a new toolbox to assess lateralization infunctional MR-data. J Neurosci Meth 163: 128–136.
19. Knecht S, Deppe M, Drager B, Bobe L, Lohmann H, et al. (2000a) Languagelateralization in healthy right-handers. Brain 123: 74–81.
20. Akaike H (1974) A new look at the statistical model identification. IEEE T Autom
Contr, 19: 716–723.21. Cai Q, Van der Haegen L, Brysbaert M (2013) Complementary hemispheric
specialization for language production and visuospatial attention. Proc NatlAcad Sci USA 110: E322–E330.
22. Mateer CA, Dodrill CB (1982) Neuropsychological and linguistic correlates ofatypical language lateralization: evidence from sodium amytal studies. Hum
Neurobiol 2: 135–142.
23. Fleiss JL, Cohen J, Everitt BS (1969) Large sample standard errors of kappa andweighted kappa. Psychol Bull 72: 323–327.
24. Binder JR (2011) Functional MRI is a valid noninvasive alternative to Wadatesting. Epilepsy Behav 20: 214–222.
25. Zaca D, Nickerson JP, Deib G, Pillai JJ (2012) Effectiveness of four different
clinical fMRI paradigms for preoperative regional determination of languagelateralization in patients with brain tumors. Neuroradiology 54: 1015–1025.
26. Dym RJ, Burns J, Freeman K, Lipton ML (2011) Is functional MR imagingassessment of hemispheric language dominance as good as the Wada test?: A
meta-analysis. Radiology 261: 446–455.
27. Gutbrod K, Spring D, Degonda N, Heinemann D, Nirkko A, et al. (2012)Determination of language dominance: Wada test and fMRI compared using a
novel sentence task. J Neuroimaging 22: 266–274.28. Seghier ML, Kherif F, Josse G, Price CJ (2011) Regional and hemispheric
determinants of language laterality: implications for preoperative fMRI. HumBrain Mapp 32: 1602–1614.
29. Hecaen H, Sauguet J (1971) Cerebral dominance in left-handed subjects. Cortex
7: 19–48.30. Drane DL, Roraback-Carson J, Hebb AO, Hersonskey T, Lucas T, et al. (2012)
Cortical stimulation mapping and Wada results demonstrate a normal variant ofright hemisphere language organization. Epilepsia 53: 1790–1798.
31. Bishop DV (2013) Cerebral asymmetry and language development: cause,
correlate, or consequence? Science 340: 1230531.32. Armour JA, Davison A, McManus IC (2014) Genome-wide association study of
handedness excludes simple genetic models. Heredity 112: 221–225.33. Corballis MC (2012) Lateralization of the human brain. Prog Brain Res 195:
103–121.
Handedness and Language Lateralization
PLOS ONE | www.plosone.org 14 June 2014 | Volume 9 | Issue 6 | e101165
Copyright © 2022 FDOKUMEN