Galaxy Zoo: The Environmental Dependence of Bars and Bulges in Disc Galaxies
18
Mon. Not. R. Astron. Soc. 000, 1–18 (0000) Printed 7 November 2011 (MN L A T E X style file v2.2) Galaxy Zoo: The Environmental Dependence of Bars and Bulges in Disc Galaxies Ramin A. Skibba 1? , Karen L. Masters 2,3 , Robert C. Nichol 2,3 , Idit Zehavi 4 , Ben Hoyle 5,6 , Edward M. Edmondson 2 , Steven P. Bamford 7 , Carolin N. Cardamone 8,9 , William C. Keel 10 , Chris Lintott 11,12 , Kevin Schawinski 13 , Michael J. Williams 14 1 Steward Observatory, University of Arizona, 933 N. Cherry Ave., Tucson, AZ 85721, USA 2 Institute of Cosmology and Gravitation, University of Portsmouth, Dennis Sciama Building, Burnaby Road, Portsmouth PO1 3FX, UK 3 SEPnet, South East Physics Network, (www.sepnet.ac.uk) 4 Department of Astronomy & CERCA, Case Western Reserve University, 10900 Euclid Ave., Cleveland, OH 44106, USA 5 Institute for Sciences of the Cosmos (ICC-UB, IEEC), University of Barcelona, Marti i Franques 1, Barcelona, 08024, Spain 6 Helsinki Institute of Physics, P.O. Box 64, FIN-00014 University of Helsinki, Finland 7 School of Physics and Astronomy, University of Nottingham, University Park, Nottingham NG7 2RD, UK 8 Department of Physics, Massachusetts Institute of Technology, 77 Massachusetts Avenue, Cambridge, MA 02139, USA 9 The Sheridan Center for Teaching & Learning, Brown University, Box 1912, 96 Waterman St., Providence, RI 02912, USA 10 Department of Physics & Astronomy, 206 Gallalee Hall, 514 University Blvd., University of Alabama, Tuscaloosa, AL 35487, USA 11 Oxford Astrophysics, Department of Physics, University of Oxford, Denys Wilkinson Building, Keble Road, Oxford OX1 3RH, UK 12 Adler Planetarium, 1300 S. Lakeshore Drive, Chicago, IL 60605, USA 13 Yale Center for Astronomy and Astrophysics, Yale University, P.O. Box 208121, New Haven, CT 06520, USA 14 Max-Planck-Institut f¨ ur extraterrestrische Physik, D-85748 Garching bei M¨ unchen, Germany 7 November 2011 ABSTRACT We present an analysis of the environmental dependence of bars and bulges in disc galaxies, using a volume-limited catalogue of 15810 galaxies at z< 0.06 from the Sloan Digital Sky Survey with visual morphologies from the Galaxy Zoo 2 project. We find that the likelihood of having a bar, or bulge, in disc galaxies increases when the galaxies have redder (optical) colours and larger stellar masses, and observe a transition in the bar and bulge likelihoods at M * =2 × 10 10 M , such that massive disc galaxies are more likely to host bars and bulges. In addition, while most bulge- dominated galaxies are on the “red sequence” of the colour-magnitude diagram, we see a wider variety of colours for galaxies that host bars. We use galaxy clustering methods to demonstrate statistically significant environmental correlations of barred, and bulge-dominated, galaxies, from projected separations of 150 kpc/h to 3 Mpc/h. These environmental correlations appear to be independent of each other: i.e., bulge- dominated disc galaxies exhibit a significant bar-environment correlation, and barred disc galaxies show a bulge-environment correlation. We demonstrate that approxi- mately half (50 ± 20 %) of the bar-environment correlation can be explained by the fact that more massive dark matter haloes host redder disc galaxies, which are then more likely to have bars. Likewise, we show that the environmental dependence of stellar mass can only explain a small fraction (25 ± 15 %) of the bar-environment cor- relation. Therefore, a significant fraction of our observed environmental dependence of barred galaxies is not due to colour or stellar mass dependences, and hence could be due to another galaxy property. Finally, by analyzing the projected clustering of barred and unbarred disc galaxies with halo occupation models, we argue that barred galaxies are in slightly higher-mass haloes than unbarred ones, and some of them (ap- proximately 25%) are satellite galaxies in groups. We also discuss implications about the effects of minor mergers and interactions on bar formation. Key words: methods: statistical - galaxies: evolution - galaxies: structure - galaxies: spiral - galaxies: bulges - galaxies: haloes - galaxies: clustering - large scale structure of the universe ? E-mail: [email protected] c 0000 RAS arXiv:1111.0969v1 [astro-ph.CO] 3 Nov 2011
-
Upload
independent -
Category
Documents
-
view
0 -
download
0
Transcript of Galaxy Zoo: The Environmental Dependence of Bars and Bulges in Disc Galaxies
Mon. Not. R. Astron. Soc. 000, 1–18 (0000) Printed 7 November 2011 (MN LATEX style file v2.2)
Galaxy Zoo: The Environmental Dependence of Bars andBulges in Disc Galaxies
Ramin A. Skibba1?, Karen L. Masters2,3, Robert C. Nichol2,3, Idit Zehavi4,Ben Hoyle5,6, Edward M. Edmondson2, Steven P. Bamford7, Carolin N. Cardamone8,9,William C. Keel10, Chris Lintott11,12, Kevin Schawinski13, Michael J. Williams141Steward Observatory, University of Arizona, 933 N. Cherry Ave., Tucson, AZ 85721, USA2Institute of Cosmology and Gravitation, University of Portsmouth, Dennis Sciama Building, Burnaby Road, Portsmouth PO1 3FX, UK3SEPnet, South East Physics Network, (www.sepnet.ac.uk)4Department of Astronomy & CERCA, Case Western Reserve University, 10900 Euclid Ave., Cleveland, OH 44106, USA5Institute for Sciences of the Cosmos (ICC-UB, IEEC), University of Barcelona, Marti i Franques 1, Barcelona, 08024, Spain6Helsinki Institute of Physics, P.O. Box 64, FIN-00014 University of Helsinki, Finland7School of Physics and Astronomy, University of Nottingham, University Park, Nottingham NG7 2RD, UK8Department of Physics, Massachusetts Institute of Technology, 77 Massachusetts Avenue, Cambridge, MA 02139, USA9The Sheridan Center for Teaching & Learning, Brown University, Box 1912, 96 Waterman St., Providence, RI 02912, USA10Department of Physics & Astronomy, 206 Gallalee Hall, 514 University Blvd., University of Alabama, Tuscaloosa, AL 35487, USA11Oxford Astrophysics, Department of Physics, University of Oxford, Denys Wilkinson Building, Keble Road, Oxford OX1 3RH, UK12Adler Planetarium, 1300 S. Lakeshore Drive, Chicago, IL 60605, USA13Yale Center for Astronomy and Astrophysics, Yale University, P.O. Box 208121, New Haven, CT 06520, USA14Max-Planck-Institut fur extraterrestrische Physik, D-85748 Garching bei Munchen, Germany
7 November 2011
ABSTRACTWe present an analysis of the environmental dependence of bars and bulges in discgalaxies, using a volume-limited catalogue of 15810 galaxies at z < 0.06 from theSloan Digital Sky Survey with visual morphologies from the Galaxy Zoo 2 project.We find that the likelihood of having a bar, or bulge, in disc galaxies increases whenthe galaxies have redder (optical) colours and larger stellar masses, and observe atransition in the bar and bulge likelihoods at M∗ = 2 × 10¹⁰ M, such that massivedisc galaxies are more likely to host bars and bulges. In addition, while most bulge-dominated galaxies are on the “red sequence” of the colour-magnitude diagram, wesee a wider variety of colours for galaxies that host bars. We use galaxy clusteringmethods to demonstrate statistically significant environmental correlations of barred,and bulge-dominated, galaxies, from projected separations of 150 kpc/h to 3 Mpc/h.These environmental correlations appear to be independent of each other: i.e., bulge-dominated disc galaxies exhibit a significant bar-environment correlation, and barreddisc galaxies show a bulge-environment correlation. We demonstrate that approxi-mately half (50 ± 20 %) of the bar-environment correlation can be explained by thefact that more massive dark matter haloes host redder disc galaxies, which are thenmore likely to have bars. Likewise, we show that the environmental dependence ofstellar mass can only explain a small fraction (25± 15 %) of the bar-environment cor-relation. Therefore, a significant fraction of our observed environmental dependenceof barred galaxies is not due to colour or stellar mass dependences, and hence couldbe due to another galaxy property. Finally, by analyzing the projected clustering ofbarred and unbarred disc galaxies with halo occupation models, we argue that barredgalaxies are in slightly higher-mass haloes than unbarred ones, and some of them (ap-proximately 25%) are satellite galaxies in groups. We also discuss implications aboutthe effects of minor mergers and interactions on bar formation.
Key words: methods: statistical - galaxies: evolution - galaxies: structure - galaxies:spiral - galaxies: bulges - galaxies: haloes - galaxies: clustering - large scale structureof the universe
? E-mail: [email protected]© 0000 RAS
arX
iv:1
111.
0969
v1 [
astr
o-ph
.CO
] 3
Nov
201
1

2 R. A. Skibba, K. L. Masters, R. C. Nichol, et al.
1 INTRODUCTION
In recent years, there has been a resurgence in interest inthe “secular” processes that could affect galaxy evolution(e.g., Weinzirl et al. 2009; Schawinski et al. 2010; Emsellemet al. 2011), driven by the growing understanding that ma-jor mergers are rare (e.g., Hopkins et al. 2010b; Darg et al.2010; Lotz et al. 2011), and may not play as important a rolein galaxy evolution as had previously been thought (Daveet al. 2011). In particular, bars have been found to be com-mon structures in disc galaxies, and are thought to affect theevolution of galaxies (e.g., Sellwood & Wilkinson 1993; Ko-rmendy & Kennicutt 2004) and the dark matter haloes thathost them (e.g., Debattista & Sellwood 2000; Weinberg &Katz 2002). The abundance and properties of barred galax-ies have been analyzed in low and high-redshift surveys (e.g.,Jogee et al. 2005; Sheth et al. 2005, 2008; Barazza et al.2008; Aguerri et al. 2009; Nair & Abraham 2010; Cameronet al. 2010; Masters et al. 2011; Hoyle et al. 2011; Ellisonet al. 2011) and have been modeled with detailed numer-ical simulations, including their interactions with the hostdark matter haloes (e.g., Valenzuela & Klypin 2003; O’Neill& Dubinski 2003; Debattista et al. 2006; Heller et al. 2007;Weinberg & Katz 2007).
Bars are extended linear structures in the central re-gions of galaxies, which form from disc instabilities andangular momentum redistribution within the disc (e.g.,Athanassoula 2003; Berentzen et al. 2007; Foyle et al. 2008).Bars are efficient at driving gas inwards, perhaps sparkingcentral star formation (e.g., Friedli et al. 1994; Ellison et al.2011), and thus may help to grow a central bulge componentin galaxy discs (e.g., Dalcanton et al. 2004; Debattista etal. 2006; Gadotti 2011). Such bulges are sometimes referredto as “pseudo-bulges”, to distinguish them from “classical”bulges, which are often thought to have formed from thehierarchical merging of smaller objects (e.g., Kormendy &Kennicutt 2004; Drory & Fisher 2007; De Lucia et al. 2011;Fontanot et al. 2011).
Bars and (classical) bulges may also be related struc-tures and in some cases could form simultaneously. Galaxieswith earlier-type morphologies, which have more prominentbulges, tend to have more, and longer, bars (Elmegreen &Elmegreen 1985; Weinzirl et al. 2009; Masters et al. 2011;Hoyle et al. 2011; cf., Barazza et al. 2008). In addition, atleast in some galaxies, the bars and bulges have similar stel-lar populations (Sanchez-Blazquez et al. 2011). Nonetheless,there are some barred galaxies that lack bulges and manybulge-dominated galaxies that lack bars (e.g., Laurikainenet al. 2007; Perez & Sanchez-Blazquez 2011).
Various classification methods have been developed toobservationally identify bars, either visually or using auto-mated techniques, such as ellipse-fitting of isophotes andFourier decomposition of surface brightness distributions(e.g., Erwin 2005; Aguerri et al. 2009; Gadotti 2009). Thesehave yielded similar, but not always consistent, bar fractions(see discussions in Sheth et al. 2008; Nair & Abraham 2010;Masters et al. 2011). All bar identification methods are af-fected by issues such as inclination, spatial resolution, wave-length dependence, surface brightness limits, and selectionbiases (e.g., Menendez-Delmestre et al. 2007).
In this paper, we use data from the Galaxy Zoo 2 project(see Masters et al. 2011), which provides detailed visual clas-
sifications of tens of thousands of galaxies in the Sloan Dig-ital Sky Survey (SDSS; York et al. 2000). Galaxy Zoo yieldsa relatively large catalogue of galaxies with reliable classifi-cations in a variety of environments. It is particularly suitedfor analyses of the environmental dependence of the morpho-logical and structural properties of galaxies across a rangeof scales, and is therefore less affected by cosmic variancethan other catalogues.
It has long been known that galaxy morphologies arecorrelated with the environment, such that spiral galaxiestend to be located in low-density regions and early-typegalaxies in denser regions (e.g., Dressler 1980; Postman &Geller 1984; and confirmed by Galaxy Zoo: Bamford et al.2009; Skibba et al. 2009). There are a variety of ways toassess the correlation between galaxy properties and the en-vironment, such as fixed aperture counts and distances tonearest neighbors (see reviews by Haas et al. 2011; Muldrewet al. 2011). We follow Skibba & Sheth (2009) and Skibbaet al. (2009) by using two-point galaxy clustering.
There has been some recent work focused specificallyon the environmental dependence of barred galaxies (vanden Bergh 2002; Li et al. 2009; Aguerri et al. 2009; Mendez-Abreu et al. 2010). All of these studies argue that there islittle to no dependence of galaxy bars on the environment.Contrary to these results, Barazza et al. (2009) and Mari-nova et al. (2009) detect a slightly larger bar fraction inthe cores of galaxy clusters, and Barway et al. (2010) finda higher bar fraction of faint S0s in group/cluster environ-ments. There is as yet no consensus on the environmentaldependence of galaxy bars. These studies have been ham-pered by small number statistics, however, with typicallybetween a few hundred and less than a thousand galaxies.We improve upon this work by analyzing the environmentaldependence galaxy bars and bulges in Galaxy Zoo 2, usinga volume-limited catalogue consisting of 15810 disc galaxiesin the SDSS.
This paper is organized as follows. In the next section,we describe the Galaxy Zoo 2 data and our volume-limitedcatalogue. We introduce mark clustering statistics, and inparticular, the marked correlation function, in Section 3. InSection 4, we show the distributions and correlations be-tween measures of bars and bulges. Then in Section 5, wepresent some of our main results, about the environmentaldependence of barred and bulge-dominated galaxies, and weinterpret the results with mock catalogues and halo occupa-tion models in Section 6. We end with a discussion of ourresults in Section 7.
2 DATA
2.1 Morphological Information from Galaxy Zoo
To identify bars in local galaxies we use classifications pro-vided by members of the public through the Galaxy Zoowebsite1. Specifically, we use classifications from the sec-ond phase of Galaxy Zoo (hereafter GZ2) which ran for 14months (between 9th Feb 2009 and 22nd April 2010)2. In
1 http://www.galaxyzoo.org2 This version of the website is archived athttp://zoo2.galaxyzoo.org
c© 0000 RAS, MNRAS 000, 1–18
Environmental Dependence of Bars and Bulges 3
GZ2, volunteers were asked to provide detailed classifica-tions for the brightest (in terms of flux) 250,000 galaxiesin the SDSS Data Release 7 (DR7; Abazajian et al. 2009)Main Galaxy Sample (MGS; Strauss et al. 2002). The se-lection criteria for GZ2 are mr < 17 and r90 > 3′′, wheremr is the r-band Petrosian magnitude, and r90 is the radiuscontaining 90% of this flux. Additionally, where the galaxyhas a measured redshift, the selection 0.0005 < z < 0.25 isapplied.
Following the method of the original Galaxy Zoo (Lin-tott et al. 2008, 2011), volunteers were asked to classifygalaxies from the gri composite images. The complete GZ2decision tree is shown in Fig. 1 of Masters et al. (2011). Userswere presented each question in turn, with their progressdown the tree depending on their previous answers. In the 14months GZ2 ran, 60 million individual classifications werecollected, with each galaxy in GZ2 having been classifiedby a median of 40 volunteers (i.e., 40 people answering thequestion at the top of the tree). As was discussed for GZ1in Lintott et al. (2008) and Bamford et al. (2009), the con-version of these raw clicks into a unique classification foreach galaxy is a process similar to data reduction that musttake into account possible spurious classifications and otherproblems. An iterative weighting scheme is used to removethe influence of unreliable users, and a cleaning procedure isapplied to remove multiple classifications of the same galaxyby the same user.
In what follows we will call the total number of cleanedand weighted classifications for a given question, NX , andthe fraction of positive answers to a given question pX . Forexample, we will discuss Ntotal, which is the total (weighted)number of users classifying a given galaxy; pfeatures, the(weighted) fraction of such users identifying the galaxy ashaving features; Nbar, the total (weighted) number of clas-sifications to the “bar question”; and pbar, the (weighted)fraction of users who indicated that they saw a bar.
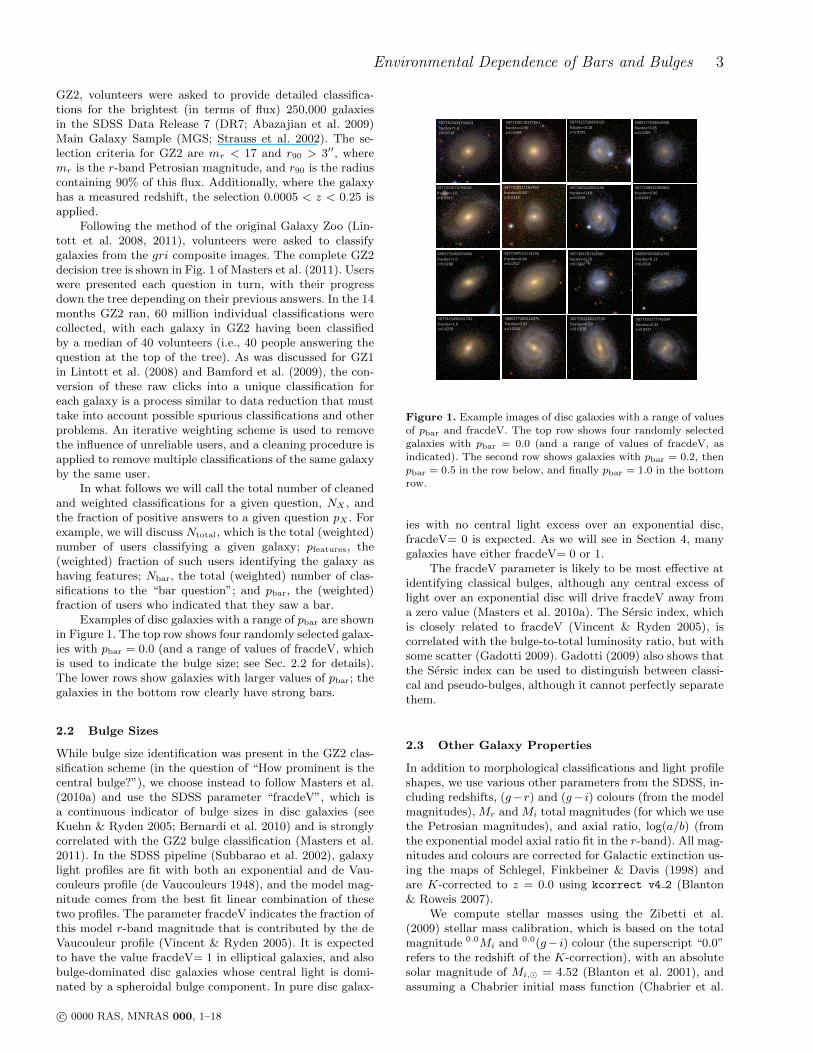
Examples of disc galaxies with a range of pbar are shownin Figure 1. The top row shows four randomly selected galax-ies with pbar = 0.0 (and a range of values of fracdeV, whichis used to indicate the bulge size; see Sec. 2.2 for details).The lower rows show galaxies with larger values of pbar; thegalaxies in the bottom row clearly have strong bars.
2.2 Bulge Sizes
While bulge size identification was present in the GZ2 clas-sification scheme (in the question of “How prominent is thecentral bulge?”), we choose instead to follow Masters et al.(2010a) and use the SDSS parameter “fracdeV”, which isa continuous indicator of bulge sizes in disc galaxies (seeKuehn & Ryden 2005; Bernardi et al. 2010) and is stronglycorrelated with the GZ2 bulge classification (Masters et al.2011). In the SDSS pipeline (Subbarao et al. 2002), galaxylight profiles are fit with both an exponential and de Vau-couleurs profile (de Vaucouleurs 1948), and the model mag-nitude comes from the best fit linear combination of thesetwo profiles. The parameter fracdeV indicates the fraction ofthis model r-band magnitude that is contributed by the deVaucouleur profile (Vincent & Ryden 2005). It is expectedto have the value fracdeV= 1 in elliptical galaxies, and alsobulge-dominated disc galaxies whose central light is domi-nated by a spheroidal bulge component. In pure disc galax-
!"##$%!$&'(()#$)*
+,-./012)3(*
42(3(%%"*
!"##%&%%''))#!5(*
+,-./012(3!&*
42(3(5(&*
!""()##%'(%)'&#'*
+,-./012(3")*
42(3(%5'*
!"##5&5####$!!&$*
+,-./012(355*
42(3(55#*
!"##5!5$5)#&$5%%*
+,-./012)3(*
42(3(5)"*
!"##$%!#%'"%$)%(*
+,-./012(3)"*
42(3(%&!*
!"##5&"))(%%#'')*
+,-./012(3&'*
42(3(%&"*
!"##%'(5%%'!()&$*
+,-./012(3'(*
42(3(55&*
!"##5$"&5%&(!"'%*
+,-./012(3('*
42(3(5$5*
!"##5)"&)))'%$!(*
+,-./012(3""*
42(3(5%!*
!"##%&#!%%))&)!(*
+,-./012(3"$*
42(3(5(#*
!""()#!''(%!!"('*
+,-./012)3(*
42(3(%""*
!"##5'$#")5%'''!*
+,-./012(3%"*
42(3(5$%*
!""()##(5$'!"$$"*
+,-./012(3(!*
42(3(5(&*
!"##$%!'#5)&$($'*
+,-./012)3(*
42(3(%'#*
!""((#((!"(!$#")*
+,-./012(3))*
42(3(5(5*
Figure 1. Example images of disc galaxies with a range of values
of pbar and fracdeV. The top row shows four randomly selectedgalaxies with pbar = 0.0 (and a range of values of fracdeV, as
indicated). The second row shows galaxies with pbar = 0.2, then
pbar = 0.5 in the row below, and finally pbar = 1.0 in the bottomrow.
ies with no central light excess over an exponential disc,fracdeV= 0 is expected. As we will see in Section 4, manygalaxies have either fracdeV= 0 or 1.
The fracdeV parameter is likely to be most effective atidentifying classical bulges, although any central excess oflight over an exponential disc will drive fracdeV away froma zero value (Masters et al. 2010a). The Sersic index, whichis closely related to fracdeV (Vincent & Ryden 2005), iscorrelated with the bulge-to-total luminosity ratio, but withsome scatter (Gadotti 2009). Gadotti (2009) also shows thatthe Sersic index can be used to distinguish between classi-cal and pseudo-bulges, although it cannot perfectly separatethem.
2.3 Other Galaxy Properties
In addition to morphological classifications and light profileshapes, we use various other parameters from the SDSS, in-cluding redshifts, (g−r) and (g− i) colours (from the modelmagnitudes), Mr and Mi total magnitudes (for which we usethe Petrosian magnitudes), and axial ratio, log(a/b) (fromthe exponential model axial ratio fit in the r-band). All mag-nitudes and colours are corrected for Galactic extinction us-ing the maps of Schlegel, Finkbeiner & Davis (1998) andare K-corrected to z = 0.0 using kcorrect v4 2 (Blanton& Roweis 2007).
We compute stellar masses using the Zibetti et al.(2009) stellar mass calibration, which is based on the totalmagnitude 0.0Mi and 0.0(g− i) colour (the superscript “0.0”refers to the redshift of the K-correction), with an absolutesolar magnitude of Mi, = 4.52 (Blanton et al. 2001), andassuming a Chabrier initial mass function (Chabrier et al.
c© 0000 RAS, MNRAS 000, 1–18

4 R. A. Skibba, K. L. Masters, R. C. Nichol, et al.
2003). We refer the reader to Zibetti et al. (2009) for detailsof the model.
The stellar mass-to-light ratios typically have 0.2 −0.3 dex scatter. A more accurate method to estimate stellarmasses would have been to apply stellar population mod-els (e.g., Maraston 2005) directly to the SDSS photometryin all five optical passbands. The Zibetti et al. (2009) cali-bration (which uses an updated version of Bruzual & Char-lot (2003) models) is nonetheless consistent with Maraston(2005), with no systematic offsets between their masses andwith discrepancies only at young stellar ages, and is suffi-cient for the analysis in this paper.
2.4 Volume-Limited Disc Galaxy Sample
We perform our analysis on a volume-limited sample. Ourcatalogue is a subsample of the GZ2 catalogue, with limits−23.5 < 0.0Mr − 5log(h) ≤ −19.4 and 0.017 ≤ z < 0.060.This catalogue is similar to the volume-limited catalogueused in Skibba et al. (2009; hereafter S09), but it has aslightly fainter absolute magnitude threshold because it islimited to slightly lower redshifts where we expect the baridentification in GZ2 to be most reliable (see Masters etal. 2011, hereafter M11, and Hoyle et al. 2011 for furtherdiscussion of this choice); in addition, GZ2 has a slightlybrighter flux limit than GZ1.
The absolute magnitude threshold of our volume-limited catalogue approximately corresponds to Mr < M∗+1, where M∗ is the Schechter function break in the r-band luminosity function (Blanton et al. 2001). It alsocorresponds to an approximate stellar mass threshold of≈ 4×10⁹ M (Zibetti et al. 2009) and a halo mass thresholdof ≈ 5×10¹¹ h−1 M (Skibba & Sheth 2009), although thereis substantial scatter between galaxy luminosity and stellarand halo masses.
The absolute magnitude and redshift limits result in acatalogue of 45581 galaxies. We limit the sample further tolog(a/b) < 0.3, which is approximately an inclination of 60,in order to select face-on or nearly face-on galaxies. This isa comparable inclination cut to other recent studies of bars(e.g., Barazza et al. 2008; Sheth et al. 2008; Aguerri et al.2009) and identical to the cut used by M11 to study the barfraction of GZ2. After this inclination cut, the catalogue isreduced to 32019 galaxies.
We require a reasonable number of answers to the baridentification question in GZ2. As can been seen in the GZ2classification tree, in order to identify the presence of a barin a galaxy, the volunteer must first identify the galaxyas “having features”, and in addition answer “no” to thequestion “Could this be an edge-on disc?” We thereforelimit the sample to Nbar ≥ Ntotal/4 (which is equivalentto pfeaturespnotedge−on ≥ 0.25), resulting in a catalogue of15989 galaxies. We also remove a small number (179) of ob-jects with Nbar < 10 which may have bar identificationsdominated by a small number of classifiers.
Our resulting volume-limited catalogue comprises 15810nearly face-on disc galaxies with reliable bar classifications.The galaxy distribution in redshift and magnitude, and thecuts used to define the catalogue, are shown in Figure 2.Note that, because of the Nbar cuts, elliptical galaxies areexcluded from the sample. We emphasize that only discgalaxies (i.e., spiral galaxies and S0s) constitute the sam-
Figure 2. Distribution in redshift and Petrosian r-band absolutemagnitude, with the selection criteria of the volume-limited cat-
alogue: −23.5 < 0.0Mr − 5log(h) ≤ −19.4 and 0.017 ≤ z < 0.060.Without the Nbar classification cut (selecting galaxies with suffi-
cient classifications) and a/b axis ratio cut (selecting nearly face-
on disc galaxies), the magnitude-redshift distribution is virtuallyidentical; these cuts do not bias the catalogue.
ple, including “bulge-dominated” disc galaxies and “puredisc” galaxies, to which we often refer as “disc-dominated”galaxies. We will distinguish between bulge-dominated anddisc-dominated with the fracdeV parameter (described inSec. 2.2).
In principle, some of the selection criteria, such as theNbar requirements, could bias our results by excluding cer-tain galaxies in an environmentally dependent way. Never-theless, M11 have tested this by comparing the luminos-ity, colour, axial ratio, and redshift distributions with andwithout this requirement, and have found no significant dif-ferences. Therefore, it is unlikely that there are any signifi-cant biases introduced; on the contrary, these criteria shouldeliminate biases by removing contaminating objects, such aselliptical galaxies or mergers with unreliable bar classifica-tions.
We have also tested our clustering measurements as afunction of the axial ratio a/b, and confirmed that they arenot affected by the inclination cut. In particular, the corre-lation functions for different inclinations are within 0.03 dex(7%), well within the error bars, and the mark correlationfunctions, described in the next section, are within 2%, ex-cept at separations of rp < 500 kpc/h, where they still agreewithin 10%.
In addition, “fiber-collided” galaxies are not includedin the catalogue. The thickness of the spectroscopic fibersmeans that some galaxies closer than 55′′ on the sky willbe missing spectra and redshifts. This fiber-collision con-straint is partly alleviated by the fact that neighbouringplates have overlap regions, but it still results in 7% of tar-geted galaxies not having a measured redshift (Zehavi et al.
c© 0000 RAS, MNRAS 000, 1–18
Environmental Dependence of Bars and Bulges 5
2005) and could significantly affect clustering measurements,especially at separations smaller than 100 kpc/h (Guo, Ze-havi & Zheng, in prep.). Nevertheless, we focus our analysison marked correlation functions, in which the effects of fibercollisions are expected to cancel out (see Eqn. 5 in Section 3,where we describe the marked correlation functions). More-over, the fiber assignments were based solely on target po-sitions, and in cases where multiple targets could only havea single fiber assigned, the target selected to be observedwas chosen randomly—hence independently of galaxy prop-erties. Therefore, we argue that the effects of fiber collisionsare likely to be negligible for the marked correlation func-tions.
Throughout this paper we assume a spatially flat cos-mology with Ωm = 0.3 and ΩΛ = 1 − Ωm. We write theHubble constant as H0 = 100h km s−1 Mpc−1.
3 MARK CLUSTERING STATISTICS ANDENVIRONMENTAL CORRELATIONS
We characterize galaxies by their properties, or “marks”,such as their luminosity, colour, morphological type, stel-lar mass, star formation rate, etc. In most galaxy clusteringanalyses, a galaxy catalogue is cut into subsamples basedon the mark, and the two-point clustering in the subsampleis studied by treating each galaxy in it equally (e.g., Madg-wick et al. 2003, Zehavi et al. 2005, Tinker et al. 2008).These studies have shown that galaxy properties are corre-lated with the environment, such that elliptical, luminous,and redder galaxies tend to be more strongly clustered thanspiral, fainter, and bluer galaxies.
Nonetheless, the galaxy marks in these studies are usedto define the subsamples for the analyses, but are not consid-ered further. This procedure is not ideal because the choiceof critical threshold for dividing galaxy catalogues is some-what arbitrary, and because throwing away the actual valueof the mark represents a loss of information. In the currentera of large galaxy surveys, one can now measure not onlygalaxy clustering as a function of their properties, but thespatial correlations of the galaxy properties themselves. Wedo this with “marked statistics”, in which we weight eachgalaxy by a particular mark, rather than simply count galax-ies as “one” or “zero”.
Marked clustering statistics have been applied to a vari-ety of astrophysical datasets by Beisbart & Kerscher (2000),Gottlober et al. (2002), and Martınez et al. (2010). Markedstatistics are well-suited for identifying and quantifying cor-relations between galaxy properties and their environments(Sheth, Connolly & Skibba 2005). They relate traditionalunmarked galaxy clustering to the clustering in which eachgalaxy is weighted by a particular property. Marked statis-tics are straightforward to measure and interpret: if theweighted and unweighted clustering are significantly differ-ent at a particular scale, then the galaxy mark is correlated(or anti-correlated) with the environment at that scale, andthe degree to which they are different quantifies the strengthof the correlation. In addition, issues that plague traditionalclustering measurements, such as incompleteness and com-plicated survey geometry, do not significantly affect mea-surements of marked statistics, as these effects cancel out tosome extent, since the weighted and unweighted measure-
ments are usually similarly affected. Mark correlations haverecently been measured and analyzed in galaxy and darkmatter halo catalogues (e.g., Sheth & Tormen 2004; Shethet al. 2006; Harker et al. 2006; Wetzel et al. 2007; Mateuset al. 2008; White & Padmanabhan 2009; S09). Finally, thehalo model framework has been used to interpret the cor-relations of luminosity and colour marks in terms of thecorrelation between halo mass and environment (Skibba etal. 2006, Skibba & Sheth 2009). We focus on morphologicalmarks here, in particular, the likelihood of galaxies havinga bar or bulge component.
There are a variety of marked statistics, but the easiestto measure and interpret is the marked two-point correlationfunction. The marked correlation function is defined as thefollowing:
M(r) ≡ 1 +W (r)
1 + ξ(r), (1)
where ξ(r) is the two-point correlation function, the sumover galaxy pairs separated by r, in which all galaxies are“weighted” by unity. W (r) is the same sum over galaxy pairsseparated by r, but now each member of the pair is weightedby the ratio of its mark to the mean mark of all the galax-ies in the catalogue (e.g., Stoyan & Stoyan 1994). That is,for a given separation r, ξ(r) receives a count of 1 for eachgalaxy pair, and W (r) receives a count of WiWj for W (r).The fact that the real-space (not redshift-distorted) markedstatistic M(r) can be approximately estimated by the sim-ple pair count ratio WW/DD (where DD are the counts ofdata-data pairs and WW are the weighted counts), with-out requiring a random galaxy catalogue, implies that themarked correlation function is less sensitive than the un-marked correlation function to the effects of the survey edges(Sheth, Connolly & Skibba 2005). In effect, the denominatorin Eqn. 1 divides out the contribution to the weighted cor-relation function which comes from the spatial contributionof the points, leaving only the contribution from the fluctua-tions of the marks. The mark correlation function measuresthe clustering of the marks themselves, in environments ofa given scale.
In practice, in order to obviate issues involving redshiftdistortions, we use the projected two-point correlation func-tion
wp(rp) =
∫dr ξ(rp, π) = 2
∫ ∞rp
drr ξ(r)√r2 − rp2
, (2)
where r =√rp2 + π2, rp and π are the galaxy separations
perpendicular and parallel to the line of sight, and we inte-grate up to line-of-sight separations of π = 40 Mpc/h. Weestimate ξ(rp, π) using the Landy & Szalay (1993) estimator
ξ(rp, π) =DD − 2DR+RR
RR, (3)
where DD, DR, and RR are the normalized counts of data-data, data-random, and random-random pairs at each sep-aration bin. Similarly, the weighted projected correlationfunction is measured by integrating along the line-of-sightthe analogous weighted statistic
W (rp, π) =WW − 2WR+RR
RR, (4)
where W refers to a galaxy weighted by some property (forexample, pbar or fracdeV; see Section 4), and R now refers
c© 0000 RAS, MNRAS 000, 1–18
6 R. A. Skibba, K. L. Masters, R. C. Nichol, et al.
to an object in the catalogue of random points, weighted bya mark chosen randomly from its distribution.
We then define the marked projected correlation func-tion:
Mp(rp) =1 + Wp(rp)/rp1 + wp(rp)/rp
, (5)
which makes Mp(rp) ≈ M(r) on scales larger than a fewMpc, in the linear regime. The projected correlation func-tions wp and Wp(rp) are normalized by rp, so as to be madeunitless. On large scales both the real-space and projectedmarked correlation functions (Eqns 1 and 5) will approachunity, because at increasing scale the correlation functionsξ(r) and W (r) (or wp(rp) and Wp(rp)) become small asthe universe appears nearly homogeneous. The simple ra-tio of the weighted to the unweighted correlation functionW (r)/ξ(r) (or Wp(rp)/wp(rp)) approaches unity similarly,provided that there are sufficient number statistics and thecatalogue’s volume is sufficiently large.
For the correlation functions and error measurements,which require random catalogues, we use the hierarchi-cal pixelization scheme SDSSPix3, which characterizes thesurvey geometry, including edges and holes from miss-ing fields and areas near bright stars. This pixelizationscheme has been used for clustering analyses (Scrantonet al. 2005, Hansen et al. 2009) and lensing analyses(Sheldon et al. 2009). We use the Scranton et al. code,jack random polygon, to construct the catalogues, and weuse at least twenty times as many random points as in thedata for all of the clustering measurements.
We estimate statistical errors on our measurements us-ing “jack-knife” resampling. We define Nsub = 30 spatiallycontiguous subsamples of the full dataset, and the jack-knifesubsamples are then created by omitting each of these sub-samples in turn. The scatter between the clustering mea-surements from the jack-knife samples is used to estimatethe error on the clustering statistics, wp, Wp, and Mp. Thejack-knife covariance matrix is then,
Covar(xi, xj) =Nsub − 1
Nsub
Nsub∑k=1
(xki − xi)(xkj − xj), (6)
where xi is the mean value of the statistic x measured in theith radial bin in all of the samples (see Zehavi et al. 2005;Norberg et al. 2009). As shown by these authors (see alsoMcBride et al. 2011), however, the jack-knife technique onlyrecovers a noisy realization of the error covariance matrix,as measured from mock catalogues, but in any case, ourresults are not sensitive to correlated errors in the clusteringmeasurements.
4 RESULTS: DISTRIBUTIONS ANDCORRELATIONS OF BAR AND BULGEPROPERTIES
The structural galaxy properties that we examine in thispaper are the bar fraction or probability, pbar, and fracdeV,which quantifies bulge strength (see Sections 2.1 and 2.2).Using pbar, we can compute the bar fraction of galaxies in
3 http://dls.physics.ucdavis.edu/~scranton/SDSSPix
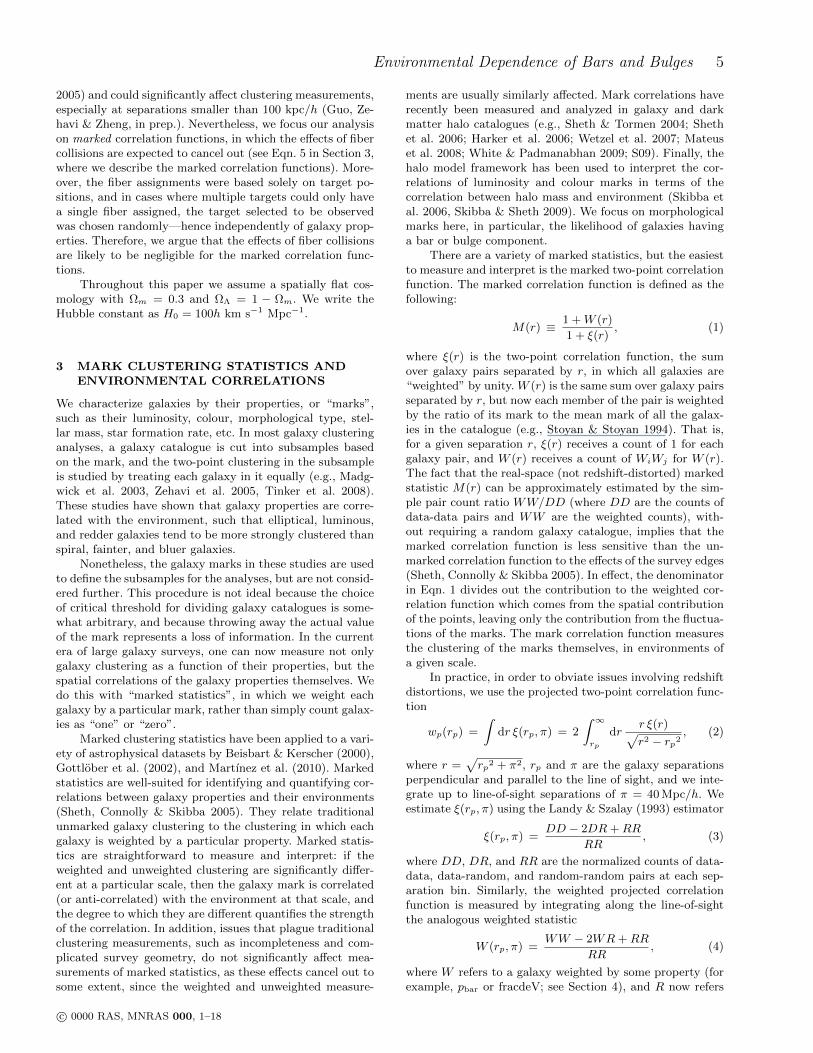
Figure 3. Distribution of bar likelihood (pbar, blue dashed his-togram) and bulge strength (fracdeV, red solid histogram) of
galaxies in the volume-limited catalogue. The histograms havebeen slightly offset from each other, for clarity.
the volume-limited catalogue, such as with a pbar threshold,though as noted by M11, Galaxy Zoo tends to identify barsthat are consistent with optically-identified strong bars (i.e.,SB types). If one generously counts barred galaxies as thosewith pbar > 0.2, the bar fraction is fbar = 48.8±0.5% (wherethe error is estimated with bootstrap resampling), while ifone counts those with pbar > 0.5, the fraction is 25.3±0.4%.The latter can be compared to M11, who obtain a fractionof 29.4±0.5% for their sample. Our slightly lower fraction islikely due to the different selection criteria, including morelower luminosity galaxies, which tend to have bars less oftenthan higher luminosity galaxies, as we will see below.
In this section and Section 5, we will analyze pbar andfracdeV, their environmental dependence, and their relationto each other and to galaxy colour and stellar mass. Wewill later (Sec. 5.2 and 6.3) compare the clustering of barredand unbarred galaxies. At that point, we separate the barredand unbarred galaxies as those with pbar > 0.2 and < 0.2,respectively, because it approximately splits the sample inhalf. The pbar > 0.5 threshold appears to identify strongbars, while we associate the range 0.2 < pbar < 0.5 withweak bars (Fig. 1).
We first show the pbar and fracdeV distributions Fig-ure 3. The pbar distribution is smooth, with most galax-ies in the catalogue (62%) having pbar < 0.3. In contrast,the fracdeV distribution is peaked near 0 and 1; namely,most galaxies are either distinctly disc-dominated or bulge-dominated. Recall though that, because of our selection cri-teria, all of the bulge-dominated galaxies in the cataloguehave spiral arms or discs (i.e., elliptical galaxies are ex-cluded).
As discussed in Section 1, some authors have arguedthat the formation and evolution of bars and bulges couldbe related, depending on the type of bulge, gas content,
c© 0000 RAS, MNRAS 000, 1–18

Environmental Dependence of Bars and Bulges 7
Figure 4. Distribution of pbar versus fracdeV, with contours in-dicating 10, 20, 50, and 75% of the maximum counts.
and angular momentum distribution (e.g., Debattista et al.2006; Laurikainen et al. 2007). Nevertheless, we find thatpbar and fracdeV are not simply, or monotonically, corre-lated, as can be seen from the distribution of pbar versusfracdeV in Figure 4. We find that a large fraction of bulge-dominated galaxies are barred (in the upper right cornerof the figure) and a large fraction are unbarred (upper leftcorner): for example, of those with fracdeV> 0.7, 27% havepbar > 0.7 and 49% have pbar < 0.3. On the other hand,disc-dominated galaxies are mostly unbarred (76% of thosewith fracdeV< 0.3 have pbar < 0.3), and only a few per centhave bars—the lower right quadrant of the figure is empty.These results are consistent with M11, who showed that thebar fraction of disc galaxies increases with fracdeV, whichis clearly the case for galaxies with pbar > 0.5 on the righthalf of the figure.
We show the colour-magnitude distribution of the cat-alogue in Figure 5. Many of the galaxies in the catalogueare disc-dominated, and the majority of them are locatedin the “blue cloud”, the bluer mode of the bimodal colourdistribution (e.g., Skibba 2009). Note that most of the bulge-dominated galaxies (fracdeV≥ 0.9, red contour) are on thered sequence (and they tend to have older stellar popula-tions, rather than being reddened by dust (Masters et al.2010a)). Many of these galaxies may also be barred, butbarred galaxies (pbar ≥ 0.5, blue contour) have a much widerrange of colours. In addition, barred galaxies have a bimodalcolour distribution based on bar length, such that galaxieswith longer bars are on the red sequence (Hoyle et al. 2011).
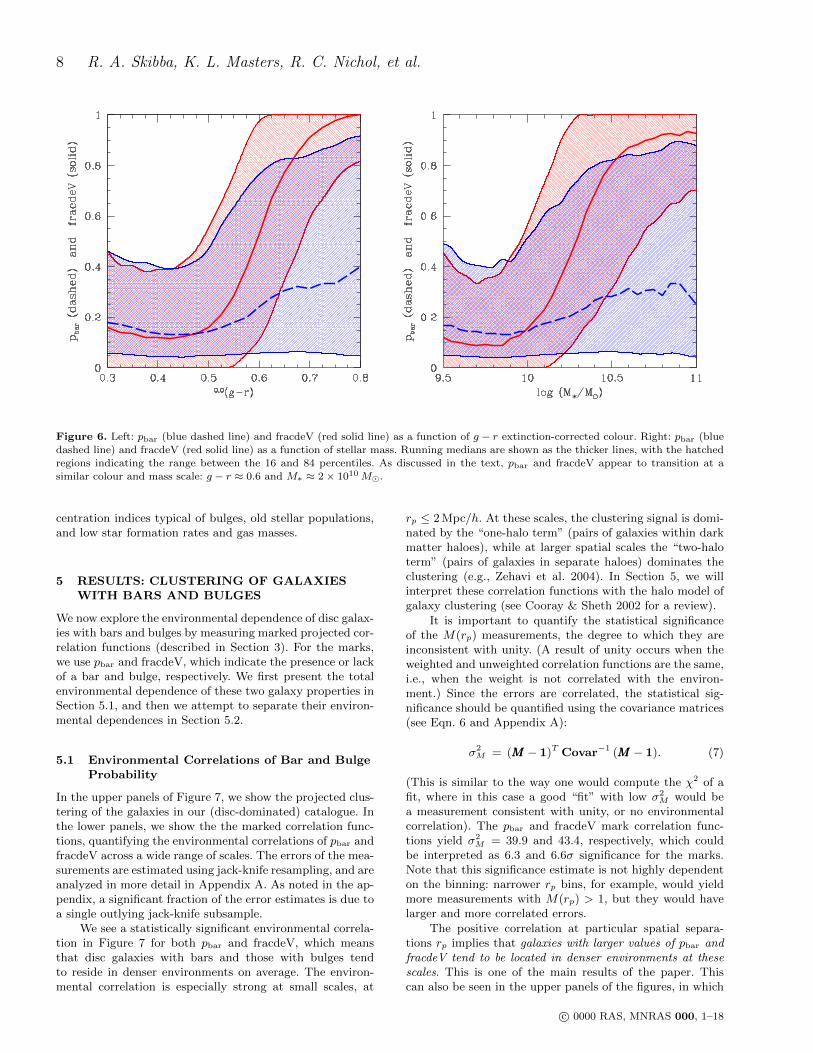
Next, we show the distribution of pbar and fracdeV asa function of g − r colour and stellar mass in Figure 6. Themajority of blue galaxies and low-mass galaxies are disc-dominated, while most red and massive galaxies are bulge-dominated. The bar probability is also positively correlatedwith colour and stellar mass, consistent with other studies(e.g., Sheth et al. 2008; Nair & Abraham 2010; M11), such
Figure 5. The optical colour-magnitude diagram (CMD), usingextinction-corrected g−r colour and r-band magnitude, with filled
gray contours indicating 5, 10, 20, 50, and 75% of the maximumcounts. The majority of the barred disc galaxies (with pbar ≥ 0.5)
and bulge-dominated disc galaxies (with fracdeV≥ 0.9) are indi-
cated by the blue and red contours, respectively. pbar ≥ 0.5 andfracdeV≥ 0.9 select a similar number of galaxies in the catalogue.
that redder and more massive galaxies are more likely tohave bars. Some studies have found a bimodal distributionof bars, such that blue, low-mass, or Sc/Sd-type galaxiesalso often have bars (Barazza et al. 2008; Nair & Abraham2010), in contrast to our finding that the median pbar < 0.2at bluer colours and lower stellar masses. It is possible thatin Galaxy Zoo, a large fraction of weak or short bars aremissed in these galaxies.
Compared to the correlation with fracdeV, the corre-lations with pbar in Figure 6 are not as strong and havemore scatter, especially at the red and massive end. In otherwords, red and massive galaxies are more likely to have barsthan blue and less-massive galaxies, but nonetheless thereare many red and massive galaxies that lack bars. Eitherthese galaxies never formed bars, or perhaps more likely, itis possible that they had bars in the past that were weakened(so that they are no longer detectable by GZ2) or destroyed;some galaxies may even have multiple episodes of bar for-mation in their lifetime (Bournaud & Combes 2002).
It is interesting that the transition from mostly un-barred to mostly barred galaxies and from disc-dominatedto bulge-dominated galaxies occurs at similar colours andstellar masses. The colour transition occurs at extinction-corrected g − r ≈ 0.6, in the “green valley” of the colour-magnitude distribution (e.g., Wyder et al. 2007), betweenthe blue and red peaks of the distribution (see Figure 5).The stellar mass transition occurs at M∗ ≈ 2 × 10¹⁰ M,and is similar to the mass scale identified by Kauffmann etal. (2003; see also Schiminovich et al. 2007), above whichgalaxies have high stellar mass surface densities, high con-
c© 0000 RAS, MNRAS 000, 1–18
8 R. A. Skibba, K. L. Masters, R. C. Nichol, et al.
Figure 6. Left: pbar (blue dashed line) and fracdeV (red solid line) as a function of g − r extinction-corrected colour. Right: pbar (bluedashed line) and fracdeV (red solid line) as a function of stellar mass. Running medians are shown as the thicker lines, with the hatched
regions indicating the range between the 16 and 84 percentiles. As discussed in the text, pbar and fracdeV appear to transition at a
similar colour and mass scale: g − r ≈ 0.6 and M∗ ≈ 2× 10¹⁰ M.
centration indices typical of bulges, old stellar populations,and low star formation rates and gas masses.
5 RESULTS: CLUSTERING OF GALAXIESWITH BARS AND BULGES
We now explore the environmental dependence of disc galax-ies with bars and bulges by measuring marked projected cor-relation functions (described in Section 3). For the marks,we use pbar and fracdeV, which indicate the presence or lackof a bar and bulge, respectively. We first present the totalenvironmental dependence of these two galaxy properties inSection 5.1, and then we attempt to separate their environ-mental dependences in Section 5.2.
5.1 Environmental Correlations of Bar and BulgeProbability
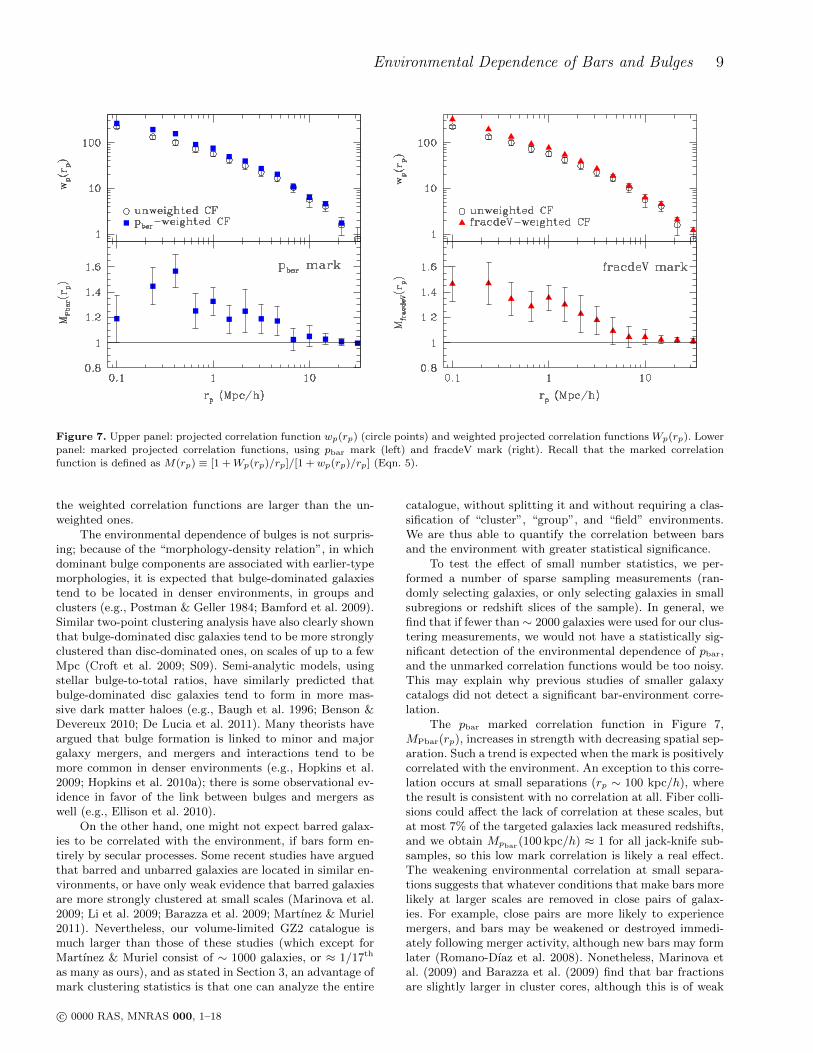
In the upper panels of Figure 7, we show the projected clus-tering of the galaxies in our (disc-dominated) catalogue. Inthe lower panels, we show the the marked correlation func-tions, quantifying the environmental correlations of pbar andfracdeV across a wide range of scales. The errors of the mea-surements are estimated using jack-knife resampling, and areanalyzed in more detail in Appendix A. As noted in the ap-pendix, a significant fraction of the error estimates is due toa single outlying jack-knife subsample.
We see a statistically significant environmental correla-tion in Figure 7 for both pbar and fracdeV, which meansthat disc galaxies with bars and those with bulges tendto reside in denser environments on average. The environ-mental correlation is especially strong at small scales, at
rp ≤ 2 Mpc/h. At these scales, the clustering signal is domi-nated by the “one-halo term” (pairs of galaxies within darkmatter haloes), while at larger spatial scales the “two-haloterm” (pairs of galaxies in separate haloes) dominates theclustering (e.g., Zehavi et al. 2004). In Section 5, we willinterpret these correlation functions with the halo model ofgalaxy clustering (see Cooray & Sheth 2002 for a review).
It is important to quantify the statistical significanceof the M(rp) measurements, the degree to which they areinconsistent with unity. (A result of unity occurs when theweighted and unweighted correlation functions are the same,i.e., when the weight is not correlated with the environ-ment.) Since the errors are correlated, the statistical sig-nificance should be quantified using the covariance matrices(see Eqn. 6 and Appendix A):
σ2M = (MMM − 1)T Covar−1 (MMM − 1). (7)
(This is similar to the way one would compute the χ2 of afit, where in this case a good “fit” with low σ2
M would bea measurement consistent with unity, or no environmentalcorrelation). The pbar and fracdeV mark correlation func-tions yield σ2
M = 39.9 and 43.4, respectively, which couldbe interpreted as 6.3 and 6.6σ significance for the marks.Note that this significance estimate is not highly dependenton the binning: narrower rp bins, for example, would yieldmore measurements with M(rp) > 1, but they would havelarger and more correlated errors.
The positive correlation at particular spatial separa-tions rp implies that galaxies with larger values of pbar andfracdeV tend to be located in denser environments at thesescales. This is one of the main results of the paper. Thiscan also be seen in the upper panels of the figures, in which
c© 0000 RAS, MNRAS 000, 1–18
Environmental Dependence of Bars and Bulges 9
Figure 7. Upper panel: projected correlation function wp(rp) (circle points) and weighted projected correlation functions Wp(rp). Lowerpanel: marked projected correlation functions, using pbar mark (left) and fracdeV mark (right). Recall that the marked correlation
function is defined as M(rp) ≡ [1 + Wp(rp)/rp]/[1 + wp(rp)/rp] (Eqn. 5).
the weighted correlation functions are larger than the un-weighted ones.
The environmental dependence of bulges is not surpris-ing; because of the “morphology-density relation”, in whichdominant bulge components are associated with earlier-typemorphologies, it is expected that bulge-dominated galaxiestend to be located in denser environments, in groups andclusters (e.g., Postman & Geller 1984; Bamford et al. 2009).Similar two-point clustering analysis have also clearly shownthat bulge-dominated disc galaxies tend to be more stronglyclustered than disc-dominated ones, on scales of up to a fewMpc (Croft et al. 2009; S09). Semi-analytic models, usingstellar bulge-to-total ratios, have similarly predicted thatbulge-dominated disc galaxies tend to form in more mas-sive dark matter haloes (e.g., Baugh et al. 1996; Benson &Devereux 2010; De Lucia et al. 2011). Many theorists haveargued that bulge formation is linked to minor and majorgalaxy mergers, and mergers and interactions tend to bemore common in denser environments (e.g., Hopkins et al.2009; Hopkins et al. 2010a); there is some observational ev-idence in favor of the link between bulges and mergers aswell (e.g., Ellison et al. 2010).
On the other hand, one might not expect barred galax-ies to be correlated with the environment, if bars form en-tirely by secular processes. Some recent studies have arguedthat barred and unbarred galaxies are located in similar en-vironments, or have only weak evidence that barred galaxiesare more strongly clustered at small scales (Marinova et al.2009; Li et al. 2009; Barazza et al. 2009; Martınez & Muriel2011). Nevertheless, our volume-limited GZ2 catalogue ismuch larger than those of these studies (which except forMartınez & Muriel consist of ∼ 1000 galaxies, or ≈ 1/17th
as many as ours), and as stated in Section 3, an advantage ofmark clustering statistics is that one can analyze the entire
catalogue, without splitting it and without requiring a clas-sification of “cluster”, “group”, and “field” environments.We are thus able to quantify the correlation between barsand the environment with greater statistical significance.
To test the effect of small number statistics, we per-formed a number of sparse sampling measurements (ran-domly selecting galaxies, or only selecting galaxies in smallsubregions or redshift slices of the sample). In general, wefind that if fewer than∼ 2000 galaxies were used for our clus-tering measurements, we would not have a statistically sig-nificant detection of the environmental dependence of pbar,and the unmarked correlation functions would be too noisy.This may explain why previous studies of smaller galaxycatalogs did not detect a significant bar-environment corre-lation.
The pbar marked correlation function in Figure 7,MPbar(rp), increases in strength with decreasing spatial sep-aration. Such a trend is expected when the mark is positivelycorrelated with the environment. An exception to this corre-lation occurs at small separations (rp ∼ 100 kpc/h), wherethe result is consistent with no correlation at all. Fiber colli-sions could affect the lack of correlation at these scales, butat most 7% of the targeted galaxies lack measured redshifts,and we obtain Mpbar(100 kpc/h) ≈ 1 for all jack-knife sub-samples, so this low mark correlation is likely a real effect.The weakening environmental correlation at small separa-tions suggests that whatever conditions that make bars morelikely at larger scales are removed in close pairs of galax-ies. For example, close pairs are more likely to experiencemergers, and bars may be weakened or destroyed immedi-ately following merger activity, although new bars may formlater (Romano-Dıaz et al. 2008). Nonetheless, Marinova etal. (2009) and Barazza et al. (2009) find that bar fractionsare slightly larger in cluster cores, although this is of weak
c© 0000 RAS, MNRAS 000, 1–18

10 R. A. Skibba, K. L. Masters, R. C. Nichol, et al.
statistical significance according to the authors. More re-cently, Nair & Ellison (in prep.) find that the bar fractionof disc galaxies decreases as pair separation decreases, con-sistent with our results.
It is interesting that MPbar(rp) peaks at approximately400 kpc/h (more precisely, the bin’s range is 316 < rp <525 kpc/h). Many of the galaxies contributing to the signalat these scales are likely “satellite” galaxies in groups, ratherthan the central galaxies. In fact, considering that these aredisc galaxies and that pbar is correlated with colour, it islikely that many of these are the same objects as the “redspirals” discussed in S09 (most of which have bars, accordingto Masters et al. 2010b; M11), a relatively large fraction ofwhich are satellites (fsat ≈ 1/3).
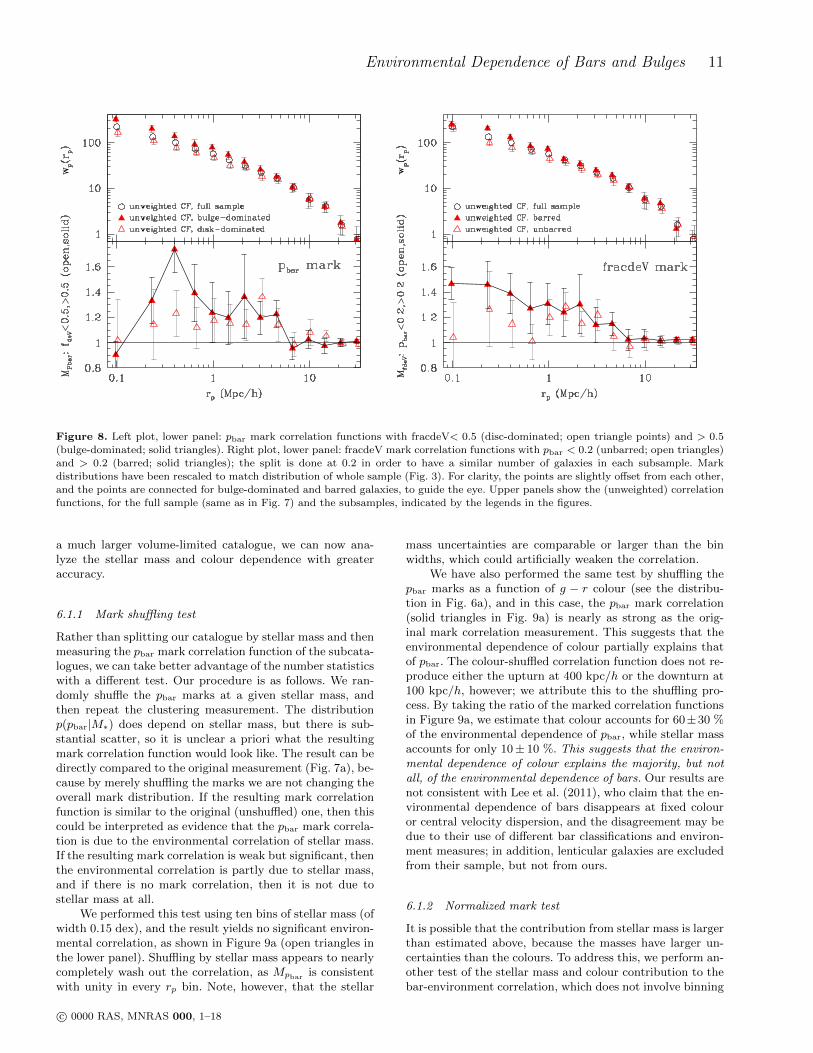
We also show (unmarked) clustering of barred versusnon-barred galaxies (pbar > 0.2 and < 0.2), and bulge-dominated versus disc-dominated ones (fracdeV> 0.5 and< 0.5), in the upper panels of Figure 8. At large scales(rp > 2 Mpc/h), their clustering strength is the same.At smaller separations, however, barred galaxies tend tobe more strongly clustered than unbarred ones and bulge-dominated galaxies tend to be more strongly clustered thandisc-dominated ones. The scale at which the correlationfunctions diverge corresponds to the scale of the transitionfrom the “one-halo term” (pairs of galaxies within haloes)to the “two-halo term” (galaxies in separate haloes). Theseclustering measurements then suggest that barred and un-barred galaxies may reside in the same dark matter haloes,but the former are more likely to be central galaxies than thelatter. The same applies for the presence/absence of bulgesin central/satellite galaxies. We will return to this issue whenwe apply halo occupation modeling to the measured corre-lation functions, in Section 6.3.
5.2 Disentangling the Environmental Correlations
As we have shown in previous sections, disc galaxies withlarge bulges are more likely to have a bar (see Fig. 4). Wehave also shown that both bulge-dominated discs and discswith bars are more strongly clustered than average (Fig. 7).We address in this Section the question of whether one ofthese two galaxy properties is more dependent on the envi-ronment, or whether their environmental correlations are in-dependent. That is to say, we will determine whether bulge-dominated galaxies with bars are more strongly clusteredthan bulge-dominated galaxies without bars, and whetherbarred galaxies with bulges are more strongly clustered thanbarred galaxies with no or small bulges.
In addition, we know that disc galaxies hosting barstend to be redder and have higher stellar masses than thosewith weak or no bars (Fig. 6). We will later address in Sec-tion 6.1 whether the environmental correlations of galaxycolour or stellar mass (e.g., Skibba & Sheth 2009; Li & White2009) can account for the environmental correlation we haveobserved of bars.
In the lower panels of Figure 8, we show the pbar
mark correlation functions for bulge-dominated and disc-dominated galaxies (fracdeV> 0.5 and < 0.5), as well as thefracdeV mark correlation functions for barred and unbarredgalaxies (pbar > 0.2 and < 0.2). Using the fracdeV> 0.5threshold, 44% of our (disc) galaxy catalogue is bulge-dominated, and using pbar > 0.2, 49% of it is barred. Fol-
lowing the procedure described in the appendix of S09, themark correlations are shown when the marks are rescaled sothat they have the same distribution as that of the wholesample (see Fig. 3). Such a rescaling is necessary in order tocompare the mark correlation functions. (In this case, themark correlation measurements are similar, within ∼10%,when the mark distributions are not rescaled.)
The pbar and fracdeV mark correlation functions are allstill above unity, but they are statistically significant onlyfor bulge-dominated (fracdeV> 0.5) and barred (pbar > 0.2)galaxies, respectively. Using Eqn. 7, these pbar and fracdeVmark correlations both have a statistical significance of6σ. In other words, bulge-dominated galaxies exhibit a sig-nificant bar-environment correlation, and barred galaxiesexhibit a bulge-environment correlation. Considering thatthese residual environmental correlations are so significant,it appears that the environmental dependencies of barredand bulge-dominated galaxies are somewhat independent ofeach other: the bar-environment correlation is not due to thebulge-environment correlation, and vice versa. The environ-mental dependencies of bars and pseudo-bulges (e.g., Drory& Fisher 2007), however, may be more closely related, asdiscussed in the introduction.
6 INTERPRETATION OF THEPBAR-ENVIRONMENT CORRELATION
In the previous section, we quantified the environmental de-pendence of barred galaxies, using projected clustering mea-surements with the largest catalogue of galaxies with barclassifications to date. Here we perform tests and analysesof these results, in order to better understand the origin ofthese environmental correlations.
We also quantified the environmental dependence ofgalaxy bulges, but as stated in Section 5.1, this has beenthoroughly studied already and is closely related to themorphology-density relation. Furthermore, the colour andstellar mass dependence of the morphology-density relationhas been studied elsewhere (e.g., Kauffmann et al. 2004;Blanton et al. 2005; Park et al. 2007; van der Wel et al.2010), including with Galaxy Zoo data (Bamford et al. 2009;Skibba et al. 2009), so we will not study it further here.
In Section 6.1, we examine the stellar mass and colourdependence of the measured pbar-environment correlation.Then in Section 6.2, we use mock galaxy catalogues to pre-dict the strength of the pbar-environment correlation if itwere entirely due to redder galaxies occupying more mas-sive dark matter haloes. Lastly, we apply halo occupationmodels to the clustering of barred and unbarred galaxies inSection 6.3.
6.1 Dependence of the environmental correlationon stellar mass and colour
The probability of a galaxy being barred is correlated withits stellar mass (see Fig. 6b; Nair & Abraham 2010), so it isimportant to ask whether the environmental dependence ofbarred galaxies measured in Section 5.1 is due to the envi-ronmental dependence of stellar mass. Li et al. (2009) arguethat in their catalogue, at fixed stellar mass, the projectedclustering of barred and unbarred galaxies is similar. With
c© 0000 RAS, MNRAS 000, 1–18
Environmental Dependence of Bars and Bulges 11
Figure 8. Left plot, lower panel: pbar mark correlation functions with fracdeV< 0.5 (disc-dominated; open triangle points) and > 0.5(bulge-dominated; solid triangles). Right plot, lower panel: fracdeV mark correlation functions with pbar < 0.2 (unbarred; open triangles)
and > 0.2 (barred; solid triangles); the split is done at 0.2 in order to have a similar number of galaxies in each subsample. Mark
distributions have been rescaled to match distribution of whole sample (Fig. 3). For clarity, the points are slightly offset from each other,and the points are connected for bulge-dominated and barred galaxies, to guide the eye. Upper panels show the (unweighted) correlation
functions, for the full sample (same as in Fig. 7) and the subsamples, indicated by the legends in the figures.
a much larger volume-limited catalogue, we can now ana-lyze the stellar mass and colour dependence with greateraccuracy.
6.1.1 Mark shuffling test
Rather than splitting our catalogue by stellar mass and thenmeasuring the pbar mark correlation function of the subcata-logues, we can take better advantage of the number statisticswith a different test. Our procedure is as follows. We ran-domly shuffle the pbar marks at a given stellar mass, andthen repeat the clustering measurement. The distributionp(pbar|M∗) does depend on stellar mass, but there is sub-stantial scatter, so it is unclear a priori what the resultingmark correlation function would look like. The result can bedirectly compared to the original measurement (Fig. 7a), be-cause by merely shuffling the marks we are not changing theoverall mark distribution. If the resulting mark correlationfunction is similar to the original (unshuffled) one, then thiscould be interpreted as evidence that the pbar mark correla-tion is due to the environmental correlation of stellar mass.If the resulting mark correlation is weak but significant, thenthe environmental correlation is partly due to stellar mass,and if there is no mark correlation, then it is not due tostellar mass at all.
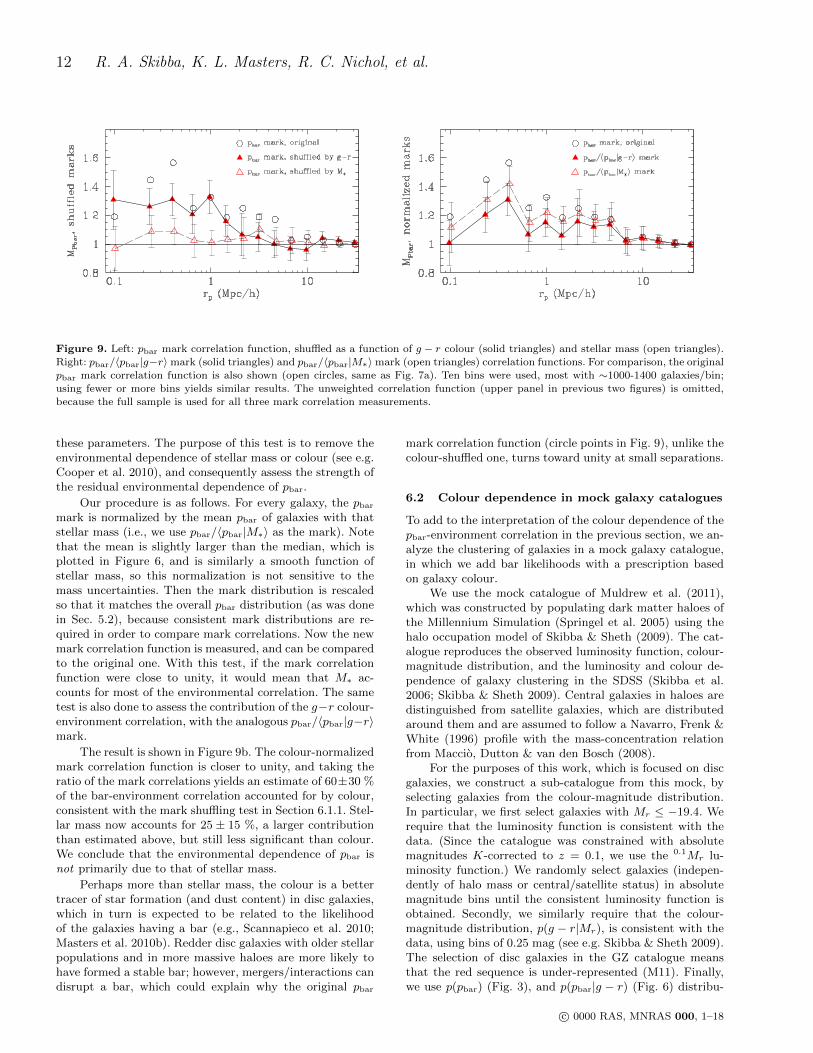
We performed this test using ten bins of stellar mass (ofwidth 0.15 dex), and the result yields no significant environ-mental correlation, as shown in Figure 9a (open triangles inthe lower panel). Shuffling by stellar mass appears to nearlycompletely wash out the correlation, as Mpbar is consistentwith unity in every rp bin. Note, however, that the stellar
mass uncertainties are comparable or larger than the binwidths, which could artificially weaken the correlation.
We have also performed the same test by shuffling thepbar marks as a function of g − r colour (see the distribu-tion in Fig. 6a), and in this case, the pbar mark correlation(solid triangles in Fig. 9a) is nearly as strong as the orig-inal mark correlation measurement. This suggests that theenvironmental dependence of colour partially explains thatof pbar. The colour-shuffled correlation function does not re-produce either the upturn at 400 kpc/h or the downturn at100 kpc/h, however; we attribute this to the shuffling pro-cess. By taking the ratio of the marked correlation functionsin Figure 9a, we estimate that colour accounts for 60±30 %of the environmental dependence of pbar, while stellar massaccounts for only 10± 10 %. This suggests that the environ-mental dependence of colour explains the majority, but notall, of the environmental dependence of bars. Our results arenot consistent with Lee et al. (2011), who claim that the en-vironmental dependence of bars disappears at fixed colouror central velocity dispersion, and the disagreement may bedue to their use of different bar classifications and environ-ment measures; in addition, lenticular galaxies are excludedfrom their sample, but not from ours.
6.1.2 Normalized mark test
It is possible that the contribution from stellar mass is largerthan estimated above, because the masses have larger un-certainties than the colours. To address this, we perform an-other test of the stellar mass and colour contribution to thebar-environment correlation, which does not involve binning
c© 0000 RAS, MNRAS 000, 1–18
12 R. A. Skibba, K. L. Masters, R. C. Nichol, et al.
Figure 9. Left: pbar mark correlation function, shuffled as a function of g − r colour (solid triangles) and stellar mass (open triangles).Right: pbar/〈pbar|g−r〉mark (solid triangles) and pbar/〈pbar|M∗〉mark (open triangles) correlation functions. For comparison, the original
pbar mark correlation function is also shown (open circles, same as Fig. 7a). Ten bins were used, most with ∼1000-1400 galaxies/bin;
using fewer or more bins yields similar results. The unweighted correlation function (upper panel in previous two figures) is omitted,because the full sample is used for all three mark correlation measurements.
these parameters. The purpose of this test is to remove theenvironmental dependence of stellar mass or colour (see e.g.Cooper et al. 2010), and consequently assess the strength ofthe residual environmental dependence of pbar.
Our procedure is as follows. For every galaxy, the pbar
mark is normalized by the mean pbar of galaxies with thatstellar mass (i.e., we use pbar/〈pbar|M∗〉 as the mark). Notethat the mean is slightly larger than the median, which isplotted in Figure 6, and is similarly a smooth function ofstellar mass, so this normalization is not sensitive to themass uncertainties. Then the mark distribution is rescaledso that it matches the overall pbar distribution (as was donein Sec. 5.2), because consistent mark distributions are re-quired in order to compare mark correlations. Now the newmark correlation function is measured, and can be comparedto the original one. With this test, if the mark correlationfunction were close to unity, it would mean that M∗ ac-counts for most of the environmental correlation. The sametest is also done to assess the contribution of the g−r colour-environment correlation, with the analogous pbar/〈pbar|g−r〉mark.
The result is shown in Figure 9b. The colour-normalizedmark correlation function is closer to unity, and taking theratio of the mark correlations yields an estimate of 60±30 %of the bar-environment correlation accounted for by colour,consistent with the mark shuffling test in Section 6.1.1. Stel-lar mass now accounts for 25 ± 15 %, a larger contributionthan estimated above, but still less significant than colour.We conclude that the environmental dependence of pbar isnot primarily due to that of stellar mass.
Perhaps more than stellar mass, the colour is a bettertracer of star formation (and dust content) in disc galaxies,which in turn is expected to be related to the likelihoodof the galaxies having a bar (e.g., Scannapieco et al. 2010;Masters et al. 2010b). Redder disc galaxies with older stellarpopulations and in more massive haloes are more likely tohave formed a stable bar; however, mergers/interactions candisrupt a bar, which could explain why the original pbar
mark correlation function (circle points in Fig. 9), unlike thecolour-shuffled one, turns toward unity at small separations.
6.2 Colour dependence in mock galaxy catalogues
To add to the interpretation of the colour dependence of thepbar-environment correlation in the previous section, we an-alyze the clustering of galaxies in a mock galaxy catalogue,in which we add bar likelihoods with a prescription basedon galaxy colour.
We use the mock catalogue of Muldrew et al. (2011),which was constructed by populating dark matter haloes ofthe Millennium Simulation (Springel et al. 2005) using thehalo occupation model of Skibba & Sheth (2009). The cat-alogue reproduces the observed luminosity function, colour-magnitude distribution, and the luminosity and colour de-pendence of galaxy clustering in the SDSS (Skibba et al.2006; Skibba & Sheth 2009). Central galaxies in haloes aredistinguished from satellite galaxies, which are distributedaround them and are assumed to follow a Navarro, Frenk &White (1996) profile with the mass-concentration relationfrom Maccio, Dutton & van den Bosch (2008).
For the purposes of this work, which is focused on discgalaxies, we construct a sub-catalogue from this mock, byselecting galaxies from the colour-magnitude distribution.In particular, we first select galaxies with Mr ≤ −19.4. Werequire that the luminosity function is consistent with thedata. (Since the catalogue was constrained with absolutemagnitudes K-corrected to z = 0.1, we use the 0.1Mr lu-minosity function.) We randomly select galaxies (indepen-dently of halo mass or central/satellite status) in absolutemagnitude bins until the consistent luminosity function isobtained. Secondly, we similarly require that the colour-magnitude distribution, p(g − r|Mr), is consistent with thedata, using bins of 0.25 mag (see e.g. Skibba & Sheth 2009).The selection of disc galaxies in the GZ catalogue meansthat the red sequence is under-represented (M11). Finally,we use p(pbar) (Fig. 3), and p(pbar|g − r) (Fig. 6) distribu-
c© 0000 RAS, MNRAS 000, 1–18

Environmental Dependence of Bars and Bulges 13
Figure 10. Clustering comparison between the Galaxy Zoo andmock catalogues. Solid red circles indicate the projected corre-
lation function and mark correlation function of the mock cata-logue, using pbar(g − r) as the mark (see distribution in Fig. 6a,
and text for details). For comparison, the original GZ measure-
ments are also shown here (open circles, same as Fig. 7a); thepoints are slightly offset in the lower panel, for clarity.
tions to generate “pbar” for the mock galaxies. That is, weassume that the environmental dependence of pbar is due tothat of g − r colour, which in turn is due to more massivehaloes in dense environments.
We can now measure the projected correlation func-tion and pbar marked correlation function of the mock cata-logue, in order to compare to the GZ measurements in Fig-ure 7. The result (averaged over eight realizations) is shownin Figure 10. As with the observational measurements, theerrors are estimated using jack-knife resampling; the vari-ance of the eight mocks is much smaller. If we were to ap-ply the observed errors instead (and account for the differ-ent size of the GZ and mock catalogues), we obtain similarerror bars at large scales but smaller ones at small scales(rp < few Mpc/h).
In the upper panel, the discrepancy between these pro-jected correlation functions at large scales has been previ-ously observed and is not statistically significant (see Zehaviet al. 2005; Skibba et al. 2006); it is likely due to cosmicvariance. The discrepancy at small scales, however, is signif-icant. The fact that the correlation functions are consistentat scales of rp ≥ 1 Mpc/h, but the small-scale clustering ofthe GZ catalogue is suppressed, could mean that the satellitedistribution as a function of halo mass is slightly differentin the real universe, and is not reproduced with the colour-magnitude selection procedure.
The pbar(g−r) mark correlation function of the mock isweaker than the GZ measurement, but similar to the (g−r)-shuffled mark measurement in Figure 9a. This suggests thatpart, but not all, of the environmental dependence of pbar isdue to more massive haloes hosting redder galaxies, which
Figure 11. Mean of halo occupation distributions in the mockcatalogue. Black solid histogram: mean occupation number of
all (colour-magnitude selected) disc galaxies in the mock; bluedashed histogram: mean occupation number of central galaxies;
green short-dashed histogram: mean occupation number of satel-
lite galaxies. The peak of the halo mass distribution is indicatedby the arrow. The red dotted histogram shows the mean occu-
pation number for galaxies with pbar > 0.2 (where the bar likeli-
hood is computed from the p(pbar|g− r) distribution), which area combination of central galaxies in low-mass haloes and satel-
lites in massive haloes. A larger pbar threshold yields a lower
〈Nbar|Mhalo〉, but of similar shape.
are more likely than average to be barred. By taking theratio of the marked correlation functions, we estimate thatthe colour-halo mass correlation accounts for 50 ± 20 % ofthe environmental dependence of pbar, consistent with theestimate in Section 6.1; conversely, the rest (also 50±20 %) isdue to other processes unrelated to colour (or stellar mass),perhaps involving the gas content and angular momentumdistribution.
Also note that, as in Figure 9, the pbar(g− r) mark cor-relation function in Figure 10 lacks a drop in strength atrp ∼ 100 kpc/h, which we see in the original clustering mea-surement. This implies that, in the real universe, althoughgalaxies at small separations (usually center-satellite galaxypairs) tend to be redder in more massive haloes, this does notentail a higher bar fraction; the lack of a pbar-environmentcorrelation at small separations in Figure 7a is not relatedto galaxy colour.
Finally, we have computed the halo mass distribu-tion and halo occupation distribution of galaxies in themock catalogue. The halo occupation distribution (HOD)is the number distribution of galaxies occupying haloes ofa given mass, and of particular importance for galaxy clus-tering is the mean occupation function, 〈N |M〉 (which isdescribed further in Section 6.3). The mean occupation func-tions of galaxies in the mock are shown in Figure 11. Themock galaxies are mostly hosted by haloes with massesMvir ≥ 4× 10¹¹ h−1 M; there are fewer haloes less massive
c© 0000 RAS, MNRAS 000, 1–18

14 R. A. Skibba, K. L. Masters, R. C. Nichol, et al.
than this, due to the luminosity threshold (Mr = −19.4).The central galaxy HOD drops off at high masses be-cause the central galaxies of these haloes rarely meet theCMD selection criteria of our GZ catalogue; to wit, manycentrals in massive haloes are elliptical, not disc, galax-ies. Satellite galaxies dominate in number at masses ofMvir ≥ 1013 h−1 M. In the mock, the “barred” galaxies(determined from the p(pbar|g − r) distribution), indicatedby the dotted histogram, consist of a combination of cen-tral galaxies in low-mass haloes and satellites in massivehaloes. The fraction of barred galaxies in the mock is notstrongly halo mass dependent, but it is highest between1012.5 < Mvir < 1014.3 h−1 M, in the haloes that typi-cally host galaxy groups. The HOD statistics of the mockcatalogue can be compared to the results of halo occupationmodeling, in the following section.
6.3 Halo occupation modeling of the clusteringmeasurements
In this section, complementary to the mock catalogue anal-ysis of the previous section, we apply dark matter halo mod-els to the measured projected correlation functions, wp(rp),of the whole volume-limited sample of (disc) galaxies, andof the subsamples of barred and unbarred galaxies, plottedin the upper panels of Figure 7 and Figure 8b. Since thereare only small differences between these measurements forbarred and unbarred galaxies, one can expect small differ-ences between the well-fitting models. The purpose of thehalo model analysis is to constrain the types of haloes thathost barred and unbarred disc galaxies.
We use a halo occupation model of galaxy clustering,(e.g., Zheng et al. 2007; Zehavi et al. 2011), in which thehalo occupation distribution, P (N |M), of central and satel-lite galaxies depends on halo mass, M , and the luminos-ity threshold, Lmin. In this case the luminosity thresholdis Mr ≤ −19.4, corresponding to an approximate halo massthreshold of Mmin ≈ 4−5×10¹¹ h−1 M (which is consistentwith the mock catalogues in Section 6.2).
Haloes of mass M are occupied by Ngal galaxies, con-sisting of a single central galaxy and Nsat satellite galaxies,such that the mean occupation function is described as thefollowing:
〈Ngal|M,Lmin〉 = 〈Ncen|M,Lmin〉[1+〈Nsat|M,Lmin〉
](8)
where,
〈Ncen|M〉 =1
2
[1 + erf
(log(M/Mmin)
σlogM
)](9)
and
〈Nsat|M〉 =
(M −M0
M′1
)α. (10)
In practice, we account for the fact that there is significantscatter in the relation between central galaxy luminosity andhalo mass, and that the satellite halo occupation functiondrops off more rapidly than a power-law at low masses justabove Mmin. See Appendix A2 of Skibba & Sheth (2009) fordetails.
We will also use the halo occupation models to compare
Figure 12. Halo occupation models of clustering of all galaxies inthe sample (solid black curve), the barred subsample of galaxies
(red dashed curve), and the unbarred subsample (blue dottedcurve). The corresponding measured correlation functions are also
shown, for barred and unbarred galaxies (solid and open triangle,
respectively).
the fraction of satellite galaxies of barred and of unbarredgalaxies. The satellite fraction is given by
fsat =
∫Mmin
dM (dn/dM) 〈Nsat|M〉∫Mmin
dM (dn/dM) (〈Ncen|M〉+ 〈Nsat|M〉), (11)
where dn/dM is the halo mass function (Sheth & Tormen1999; Tinker et al. 2008b). Note that we will not attempt toaccount for the fact that central galaxies in massive haloeswill often not meet the selection criteria for disc galaxies,because these galaxies will be dominated in number by satel-lites (see Fig. 11), whose abundance we can constrain.
In Figure 12, we show the results of the halo occupationmodeling, applied to the whole catalogue and to the subsam-ples of barred and unbarred galaxies. As stated above, thehalo mass threshold of the three measurements is approxi-mately the same. Nonetheless, because of differences in thesmall-scale clustering, there are differences in the satelliteHOD, 〈Nsat|M〉 (Eqn. 10). In particular, firstly, the frac-tion of satellite galaxies varies. The whole catalogue hasfsat ≈ 23%, consistent with the mock catalogue analysis inSection 6.2, which yielded a similar fraction (also ≈ 23%).For comparison, the barred and unbarred subsamples havefsat ≈ 25% and 20%, respectively.
Secondly, the key difference between the well-fittingmodels for the barred subsample is that they have a steeperslope α (compared to the slope for the full sample and for un-barred galaxies), which means that the larger satellite frac-tion of barred galaxies is due to more satellites in more mas-sive haloes. In contrast, the well-fitting models for the un-barred subsample have a shallower slope (α ≈ 0.8; the value
of M′1/Mmin is slightly larger as well); that is, not only is
the unbarred sample dominated by central galaxies in lower
c© 0000 RAS, MNRAS 000, 1–18
Environmental Dependence of Bars and Bulges 15
mass haloes, but the small fraction of unbarred satellites isnot in massive haloes either.
7 CONCLUSIONS AND DISCUSSION
We selected a volume-limited catalogue of 15810 nearly face-on disc galaxies in the SDSS, which have visual morphologyclassifications from Galaxy Zoo 2. We analyzed the proper-ties of galaxies with bars and bulges, characterizing bar andbulge likelihood with the pbar and fracdeV parameters. Us-ing “marked” two-point correlation functions, we quantifiedthe environmental dependence of bar and bulge likelihoodas a function of the projected separation between galaxies.
To conclude, the following are the main results of ourpaper:
• Correlations of bars and bulges with colour andstellar mass: We find a strong correlation between the barlikelihood (pbar) and optical colour and stellar mass, suchthat redder and more massive disc galaxies are up to twiceas likely to have bars than their bluer low-mass counterparts,although there is considerable scatter in the correlation, es-pecially at the red (high-mass) end. We find similar corre-lations with bulge strength (fracdeV), but with less scatter.The quantities pbar and fracdeV appear to have a transitionat the same stellar mass and colour (M∗ ≈ 2 × 10¹⁰ M,g − r ≈ 0.6).• Environmental dependence of bars and bulges:
We clearly detect and quantify the environmental depen-dence of barred galaxies and of bulge-dominated galaxies,such that barred and bulge-dominated disc galaxies tendto be found in denser environments than their unbarredand disc-dominated counterparts. In particular, by analyz-ing pbar and fracdeV marked correlation functions, we ob-tained environmental correlations that are statistically sig-nificant (at a level of > 6σ) on scales of 150 kpc to a fewMpc. From sparse sampling tests with our catalogue, we ar-gue that the small number statistics of previous studies in-hibited their detection of a bar-environment correlation.• Contribution from colour and stellar mass to
bar-environment correlation: By accounting for the en-vironmental dependence of colour and stellar mass, we arguethat they contribute approximately a half (50±20 %) and aquarter (25±15 %), of the pbar-environment correlation, re-spectively. We observed that the environmental dependenceof pbar appears to be partially due to the fact that reddergalaxies, which are often barred, tend to be hosted by moremassive haloes. Conversely, approximately half of the bar-environment correlation is not due to colour or stellar mass,and must be due to another parameter (e.g., gas content, orangular momentum distribution).• Halo model analysis of clustering of barred
galaxies: Our analyses with a mock galaxy catalogue andhalo occupation models suggest that barred galaxies are of-ten either central galaxies in low-mass dark matter haloes(M ∼ 1012 M) or satellite galaxies in more massive haloes(M ∼ 1013−14 M, hosting galaxy groups).
We argue that the environmental dependence of galaxycolours can account for approximately a half (50 ± 20 %)of the environmental correlation of pbar. The optical coloursare correlated with star formation rate and age, as well as
gas and dust content, all of which may be related to thepresence of disc instabilities such as bars. We find that agalaxy’s stellar mass and bulge component, on the otherhand, do not appear to be strongly related to its likelihoodof having a bar. This suggests that it is primarily older discgalaxies with lower star formation rates (which often residein denser environments) that are able to form and maintaina stellar bar (see Masters et al. 2010b).
Conversely, this means that the remaining half of theenvironmental correlation of pbar is not explained by the en-vironmental dependence of colour or stellar mass, suggestingthat bar formation (or the lack of bar destruction) is likelyinfluenced by the galaxy’s environment, in addition to theeffects described above. Bulge formation, which is to someextent independently correlated with the environment (seeSection 5.2), is also expected to be affected by interactionsand merger activity (e.g., Hopkins et al. 2009).
During the final stages of this work, Martınez & Muriel(2011) in a related study found that the bar fraction doesnot significantly depend on group mass or luminosity, oron the distance to the nearest neighbour. Their sample issmaller than ours, however, and is apparent magnitude-limited rather than volume-limited. In addition, they usebar classifications from Nair & Abraham (2010), which in-clude weaker bars than Galaxy Zoo 2 (see M11), which arebars that tend to be found in bluer galaxies (and hence inless dense environments). In another recent paper, Lee et al.(2011) also analyze the environmental dependence of bars,using bar classifications consistent with Nair & Abraham(2010), and claim that the bar fraction does not depend onthe environment at fixed colour or central velocity disper-sion, contrary to our results. However, a crucial differencebetween these two analyses and ours is that they use envi-ronment measures that mix environments at different scales,while we analyze the environmental correlations as a func-tion of galaxy separation.
A particularly interesting result of this paper is thescale dependence of the environmental correlations of barand bulge likelihood (see Fig. 7, Sec. 5). Environmental cor-relations should be interpreted differently at different scales(Blanton & Berlind 2007; Wilman et al. 2010; Muldrew et al.2011), as galaxies at small separations (rp < 2 Mpc/h) areoften hosted by the same dark matter halo, while galaxies atlarger separations are often hosted by separate haloes. Wesee that more massive haloes, which tend to reside in rela-tively dense environments, tend to host more disc galaxieswith bars and bulges.
Moreover, the pbar-environment correlation peaks atrp ∼ 400 kpc/h, which suggests that many barred galax-ies are central or satellite galaxies in groups and clus-ters. That is, some aspect of group environment triggersthe formation of bars, in spite of the fact that bars are of-ten thought to form by internally driven secular processes(e.g., Kormendy & Kennicutt 2004). Secular processes maysometimes be externally driven. For example, cosmologi-cal simulations predict that tidal interactions with darkmatter substructures, which are common in such environ-ments, could induce bar formation and growth (Romano-Dıaz et al. 2008; Kazantzidis et al. 2008). On the other hand,the pbar-environment correlation is not significant for closerpairs, suggesting that the enhanced likelihood of galaxiesbeing barred is erased if the galaxies are merging with
c© 0000 RAS, MNRAS 000, 1–18

16 R. A. Skibba, K. L. Masters, R. C. Nichol, et al.
each other; however, this measurement at small separations(rp < 100 kpc/h) has large uncertainty and may be affectedby fiber collisions (see Sec. 2.4), so it should be viewed withcaution. Analyses of bars in close pairs of galaxies (e.g., Nair& Ellison, in prep.) could shed more light on this issue.
In general, we can at least conclude that group environ-ments increase the likelihood of bar formation in disc galax-ies. Minor mergers and interactions are relatively commonin galaxy groups (Hopkins et al. 2010b), and tidal interac-tions with neighboring galaxies can trigger disc instabilitiesand subsequent bar formation (Noguchi 1996; Berentzen etal. 2004); there is observational evidence for this as well(Elmegreen et al. 1990; Keel et al. 1996). Tidal interactionscan also affect the bar’s pattern speed and other properties(Miwa & Noguchi 1998). The evolution of barred galaxiesin group environments and in minor mergers/interactions isclearly in need of further study.
Considering that bar formation does appear to dependon the host galaxy’s environment, and that bars form bysecular evolution, our results suggest that the dichotomy be-tween internal secular processes and external environmentalprocesses is not as strict as previously thought. It is possiblethat some structural changes in galaxy discs may be trig-gered or influenced by the galaxy’s environment. For exam-ple, Kormendy & Bender (2011) recently argued that, “ha-rassment”, the cumulative effect of encounters with satellitegalaxies, may influence secular evolution.
Lastly, we note that our results can be used to constraingalaxy formation models, such as the semi-analytic modelsof Benson & Devereux (2010) and De Lucia et al. (2011) andthe simulations of Debattista et al. (2006) and Heller et al.(2007). Marked correlation functions, and marked clusteringstatistics in general, are sensitive to environmental correla-tions at different scales, such that small changes in model pa-rameters could yield environmental dependencies of galaxybars and bulges that can be compared to measurements withGalaxy Zoo (see Figures 7-9). In addition, a result from ourhalo model analysis is that barred galaxies tend to be cen-tral galaxies in lower mass haloes (Mhalo ∼ 1012 M) andsatellite galaxies in more massive haloes (Mhalo ∼ 1013 M),which can also be compared to other models.
ACKNOWLEDGMENTS
We thank Sara Ellison, Preethi Nair, and Dimitri Gadottifor valuable discussions about our results. KLM acknowl-edges funding from The Leverhulme Trust as a 2010 EarlyCareer Fellow. RCN and EME acknowledge STFC rollinggrant ST/I001204/1 “Survey Cosmology and Astrophysics”for support. IZ acknowledges support by NSF grant AST-0907947. BH acknowledges grant number FP7-PEOPLE-2007- 4-3-IRG n 20218. KS acknowledges support providedby NASA through Einstein Postdoctoral Fellowship grantnumber PF9-00069 issued by the Chandra X-ray Observa-tory Center, which is operated by the Smithsonian Astro-physical Observatory for and on behalf of NASA under con-tract NAS8-03060.
We thank Jeffrey Gardner, Andrew Connolly, andCameron McBride for assistance with their Ntropy code,which was used to measure all of the correlation func-tions presented here. Ntropy was funded by the NASA
Advanced Information Systems Research Program grantNNG05GA60G.
This publication has been made possible by the partic-ipation of more than 200000 volunteers in the Galaxy Zooproject. Their contributions are individually acknowledgedat http://www.galaxyzoo.org/Volunteers.aspx. GalaxyZoo is supported by The Leverhulme Trust.
Funding for the SDSS and SDSS-II has been providedby the Alfred P. Sloan Foundation, the Participating In-stitutions, the National Science Foundation, the U.S. De-partment of Energy, the National Aeronautics and SpaceAdministration, the Japanese Monbukagakusho, the MaxPlanck Society, and the Higher Education Funding Councilfor England. The SDSS was managed by the AstrophysicalResearch Consortium for the Participating Institutions.
The SDSS is managed by the Astrophysical ResearchConsortium for the Participating Institutions. The Partic-ipating Institutions are the American Museum of Natu-ral History, Astrophysical Institute Potsdam, University ofBasel, University of Cambridge, Case Western Reserve Uni-versity, University of Chicago, Drexel University, Fermilab,the Institute for Advanced Study, the Japan ParticipationGroup, Johns Hopkins University, the Joint Institute forNuclear Astrophysics, the Kavli Institute for Particle As-trophysics and Cosmology, the Korean Scientist Group, theChinese Academy of Sciences (LAMOST), Los Alamos Na-tional Laboratory, the Max-Planck-Institute for Astronomy(MPIA), the Max-Planck-Institute for Astrophysics (MPA),New Mexico State University, Ohio State University, Uni-versity of Pittsburgh, University of Portsmouth, PrincetonUniversity, the United States Naval Observatory, and theUniversity of Washington.
REFERENCES
Abazajian K. N., et al., 2009, ApJS, 182, 543
Aguerri J. A. L., Mendez-Abreu J., Corsini E. M., 2009, A&A,
495, 491
Athanassoula E., 2003, MNRAS, 341, 1179
Bamford S. P., et al., 2009, MNRAS, 393, 1324
Barazza F. D., Jogee S., Marinova I., 2008, ApJ, 675, 1194
Barazza F. D., et al., 2009, A&A, 497, 713
Barway S., Wadadekar Y., Kembhavi A. K., 2011, MNRAS, 410,L18
Baugh C. M., Cole S., Frenk C. S., 1996, MNRAS, 283, 1361
Beisbart C., Kerscher M., 2000, ApJ, 545, 6
Benson A. J., Devereux N., 2010, MNRAS, 402, 2321
Berentzen I., Athanassoula E., Heller C. H., Fricke K. J., 2004,
MNRAS, 347, 220
Berentzen I., Shlosman I., Martinez-Valpuesta I., Heller C. H.,2007, ApJ, 666, 189
Bernardi M., Shankar F., Hyde J. B., Mei S., Marulli F., ShethR. K., 2010, MNRAS, 404, 2087
Blanton M. R., et al., 2001, AJ, 121, 2358
Blanton M. R., Eisenstein D., Hogg D. W., Schlegel D. J.,
Brinkmann J., 2005, ApJ, 629, 143
Blanton M. R., Roweis S., 2007, AJ, 133, 734
Blanton M. R., Berlind A. A., 2007, ApJ, 664, 791
Bournaud F., Combes F., 2002, A&A, 392, 83
Bruzual G., Charlot S., 2003, MNRAS, 344, 1000
Bureau M., Aronica G., Athanassoula E., Dettmar R.-J., Bosma
A., Freeman K., C., 2006, MNRAS, 370, 753
Cameron E., et al., 2010, MNRAS, 409, 346
Chabrier G., 2003, ApJ, 586, L133
c© 0000 RAS, MNRAS 000, 1–18

Environmental Dependence of Bars and Bulges 17
Cooper M. C., Gallazzi A., Newman J. A., Yan R., 2010, MNRAS,
402, 1942
Cooray A., Sheth R., 2002, Phys. Rep., 372, 1
Croft R. A. C., Di Matteo T., Springel V., Hernquist L., 2009,
MNRAS, 400, 43
Dalcanton J. J., Yoachim P., Bernstein R. A., 2004, ApJ, 608, 189
Darg D. W., et al., 2010, MNRAS, 401, 1043
Dave R., Oppenheimer B. D., Finlator K., 2011, MNRAS, 415,
11
Debattista V. P., Sellwood J. A.., 2000, ApJ, 543, 704
Debattista V. P., Mayer L., Carollo C. M., Moore B., Wadsley J.,
Quinn T., 2006, ApJ, 645, 209
De Lucia G., Fontanot F., Wilman D., Monaco P., 2011, MNRAS,
414, 1439
de Vaucouleurs G., 1948, Ann. d’Astrophys., 11, 247
Dressler A., 1980, ApJ, 236, 351
Drory N., Fisher D. B., 2007, ApJ, 664, 640
Ellison S. L., Patton D. R., Simard L., McConnachie A. W.,Baldry I. K., Mendel J. T., 2010, MNRAS, 407, 1514
Ellison S. L., Nair P., Patton D. R., Scudder J. M., Mendel J. T.,
Simard L., 2011, MNRAS, 416, 2182
Elmegreen B. G., Elmegreen D. M., 1985, ApJ, 288, 438
Elmegreen D. M., Elmegreen B. G., Bellin A. D., 1990, ApJ, 364,
415
Emsellem E., et al., 2011, MNRAS, 414, 888
Erwin P., 2005, MNRAS, 364, 283
Fontanot F., De Lucia G., Wilman D., Monaco P., 2011, MNRAS,416, 409
Friedli D., Benz W., Kennicutt R., 1994, ApJ, 430, L105
Foyle K., Courteau S., Thacker R. J., 2008, MNRAS, 386, 1821
Gadotti D. A., 2009, MNRAS, 393 1531
Gadotti D. A., 2011, MNRAS, 415, 3308
Gardner J. P., Connolly A., McBride C., 2007, astro-
ph/0709.1967
Gottlober S., Kerscher M., Kravtsov A. V., Faltenbacher A.,
Klypin A., Muller V., 2002, A&A, 387, 778
Haas M. R., Schaye J., Jeeson-Daniel A., 2011, MNRAS, in press
Hansen S. M., Sheldon E. S., Wechsler R. H., Koester B. P., 2009,
ApJ, 699, 1333
Heller C. H., Shlosman I., Athanassoula E., 2007, ApJ, 671, 226
Hopkins P. F., et al., 2009, MNRAS, 397, 802
Hopkins P. F., et al., 2010a, ApJ, 715, 202
Hopkins P. F., et al., 2010b, ApJ, 724, 915
Hoyle B., et al., 2011, MNRAS, 415, 3627
Jogee S. Scoville N., Kenney J. D. P., 2005, ApJ, 630, 837
Kauffmann G., et al., 2003, MNRAS, 341, 54
Kauffmann G., White S.D.M., Heckman T.M., Menard B.,Brinchmann J., Charlot S., Tremonti C., Brinkmann J., 2004,MNRAS, 353, 713
Kazantzidis S., Bullock J. S., Zentner A. R., Kravtsov A. V.,Moustakas L. A., 2008, ApJ, 688, 254
Keel W. C., Byrd C. C., Klaric M., 1996, in Buta R., CrockerD. A., Elmegreen B. G., eds, Proc. IAU Colloq. 157, Barred
Galaxies. Astron. Soc. Pac., San Francisco, p. 360
Kormendy J., Kennicutt R. C., 2004, ARA&A, 42, 603
Kormendy J., Bender R., 2011, ApJS, in press
Kuehn F., Ryden B. S., 2005, ApJ, 634, 1032
Landy S. D., Szalay A. S., 1993, ApJ, 412, 64
Laurikainen E., Salo H., Buta R., Knapen J. H., 2007, MNRAS,381, 401
Lee G.-H., Park C., Lee M. G., Choi Y.-Y., 2011, ApJ, in press(arXiv:1110.1933)
Li C., Gadotti D. A., Mao S., Kauffmann G., 2009, MNRAS, 397,
726
Li C., White S. D. M., 2009, MNRAS, 398, 2177
Lintott C. J., et al., 2008, MNRAS, 389, 1179
Lintott C., et al., 2011, MNRAS, 410, 166
Lotz J. M., Jonsson P., Cox T. J., Croton D., Primack J. R.,
Somerville R. S., Stewart K., 2011, ApJ, in press
Maccio A. V., Dutton A. A., van den Bosch F. C., 2008, MNRAS,391, 1940
Madgwick D. S., et al., 2003, MNRAS, 344, 847
Maraston C., 2005, MNRAS, 362, 799
Marinova I., et al., 2009, ApJ, 698, 1639
Martınez V. J., Arnalte-Mur P., Stoyan D., 2010, A&A, 513, 22
Martınez H. J., Muriel H., 2011, MNRAS Letters, in press(arXiv:1109.6285)
Masters K. L., et al., 2010a, MNRAS, 404, 792
Masters K. L., et al., 2010b, MNRAS, 405, 783
Masters K. L., et al., 2011, MNRAS, 411, 2026 (M11)
McBride C. K., Connolly A. J., Gardner J. P., Scranton R., New-
man J. A., Scoccimarro R., Zehavi I., Schneider D. P., 2011,
ApJ, 726, 13
Mendez-Abreu J., Sanchez-Janssen R., Aguerri J. A. L., 2010,ApJ, 711, L61
Menendez-Delmestre K., Sheth K., Schinnerer E., Jarrett T. H.,Scoville N. Z., 2007, ApJ, 657, 790
Miwa T., Noguchi M., 1998, ApJ, 499, 149
Muldrew S. I., Croton D. J., Skibba R. A., Pearce F. R., et al.,2011, MNRAS, in press (arXiv:1109.6328)
Nair P. B., Abraham R. G., 2010, ApJ, 714, L260
Navarro J. F., Frenk C. S., White S. D. M., 1996, ApJ, 462, 563
Noguchi M., 1996, ApJ, 469, 605
Norberg P., Baugh C. M., Gaztanaga E., Croton D. J., 2009,
MNRAS, 396, 19
Norberg P., Gaztanaga E., Baugh C. M., Croton D. J., 2011,
MNRAS, in press (arXiv:1106.5701)
O’Neill J. K., Dubinski J., 2003, MNRAS, 346, 251
Park C., Choi Y.-Y., Vogeley M. S., Gott III J. R., Blanton M.
R., 2007, ApJ, 658, 898
Perez I., Sanchez-Blazquez P., 2011, A&A, 529, A64
Postman M., Geller M. J., 1984, ApJ, 281, 95
Romano-Dıaz E., Shlosman I., Heller C., Hoffman Y., 2008, ApJ,687, L13
Sanchez-Blazquez P., Ocvirk P., Gibson B. K., Perez I., PeletierR. F., 2011, MNRAS, 415, 709
Scannapieco C., Gadotti D. A., Jonsson P., White S. D. M., 2010,
MNRAS, 407, L41
Schawinski K., et al., 2010, ApJ, 711, 284
Schiminovich D., et al., 2007, ApJS, 173, 315
Schlegel D. J., Finkbeiner D. P., Davis M., 1998, ApJ, 500, 525
Scranton R. et al., 2005, ApJ, 633, 589
Sellwood J. A., Wilkinson A., 1993, Rep. Prog. Phys., 56, 173
Sheldon E. S., et al., 2009, ApJ, 703, 2217.
Sheth K., et al., 2005, ApJ, 632, 217
Sheth K., et al., 2008, ApJ, 675, 1141
Sheth R. K., Connolly A. J., Skibba R., 2005, astro-ph/0511773
Sheth R. K., Jimenez R., Panter B., Heavens A. F., 2006, ApJ,
650, L25
Skibba R. A., Sheth R. K., Connolly A. J., Scranton R., 2006,
MNRAS, 369, 68
Skibba R. A., Sheth R. K., 2009, MNRAS, 392, 1080
Skibba R. A., 2009, MNRAS, 392, 1467
Skibba R. A., Bamford S. P., Nichol R. C., et al., 2009, MNRAS,399, 966 (S09)
Springel V., et al., 2005, Nature, 435, 629
Stoyan D., Stoyan H., 1994, Fractals, Random Shapes, and PointFields. Wiley, Chichester
Strauss M. A., et al., 2002, AJ, 124, 1810
Subbarao M., Frieman J., Bernardi M., Loveday J., Nichol B.,
Castander F., Meiksin A., 2002, SPIE, 4847, 452
Tinker J. L., Conroy C., Norberg P., Patiri S. G., Weinberg D.H., Warren M. S., 2008, ApJ, 686, 53
Valenzuela O., Klypin A., 2003, MNRAS, 345, 406
van den Bergh S., 2002, AJ, 124, 782
c© 0000 RAS, MNRAS 000, 1–18

18 R. A. Skibba, K. L. Masters, R. C. Nichol, et al.
van der Wel A., 2008, ApJ, 675, L13
van der Wel A., Bell E. F., Holden B. P., Skibba R. A., Rix H.-W.,2010, ApJ, 714, 1779
Vincent R. A., Ryden B. S., 2005, ApJ, 623, 137
Weinberg M. D., Katz N., 2002, ApJ, 580, 627
Weinberg M. D., Katz N., 2007, MNRAS, 375, 460
Weinzirl T., Jogee S., Khochfar S., Burkert A., Kormendy J.,2009, ApJ, 696, 411
Wetzel A. R., Cohn J. D., White M., Holz D. E., Warren M. S.,
2007, ApJ, 656, 139
White M., Padmanabhan N., 2009, MNRAS, 395, 2381
Wilman D. J., Zibetti S., Budavari T., 2010, MNRAS, 406, 1701
Wyder T. K., et al., 2007, ApJS, 173, 293
York D. G. et al., 2000, AJ, 120, 1579
Zehavi I., et al., 2004, ApJ, 608, 16
Zehavi I., et al., 2005, ApJ, 630, 1
Zehavi I., et al., 2011, ApJ, 736, 59
Zheng Z., Coil A. L., Zehavi I., 2007, ApJ, 667, 760
Zibetti S., Charlot S., Rix H.-W., 2009, MNRAS, 400, 1181
APPENDIX A: ERRORS OF THECLUSTERING MEASUREMENTS
As discussed in Section 3, we use jack-knife resampling to es-timate the statistical errors of our clustering measurementswp(rp) and Mp(rp) (Figures 7-9). The jack-knife errors ofour marked projected correlation functions tend to be largerthan thePoisson errors (not shown). We note that Norberget al. (2009) has shown that the jack-knife method does notrecover the scale dependence of errors of the (unmarked)correlation function, often overestimating the errors at smallscales, and the results are sensitive to the number of sub-catalogues into which the data is split. Although our un-certainty estimates are important, our primary results arenot particularly sensitive to the precise value of the errors.We have performed additional error analyses with twice asmany jack-knife sub-catalogues, and obtained similar errors(within 10%) at all scales for both the correlation functionsand marked correlation functions.
We estimate the error in each rp (projected galaxy sep-aration) bin by computing the variance of the measurementsof the jack-knife sub-catalogues. For example, clusteringmeasurements of the thirty jack-knife sub-catalogues usedto estimate the errors of the measurements in Figure 7a areshown in Figure A1. Most of the jack-knife sub-cataloguesyield similar measurements, although a single outlying mea-surement is responsible for a significant fraction of the er-ror. Outliers may be due to anomolously large structures orvoids, or in the case of mark clustering, to noise in the marks.Nonetheless, the outlying measurement is not an extremeoutlier, and the Sloan Great Wall, an extremely massivesuperstructure that can influence clustering measurements(Zehavi et al. 2011; Norberg et al. 2011) is beyond our up-per redshift limit (z < 0.060). The jack-knife measurementsfor the lower panel of Figure 7b (with the fracdeV mark)are similar, also with a single outlier. If the outlier wereexcluded, the resulting jack-knife error estimates would belower by 21% on average for wp, by 18% for MPbar, and by25% for MfracdeV.
We also compute jack-knife covariance matrices(Eqn. 6) for each of the clustering measurements. We showthe covariance matrix of the measurement in the lower panelof Figure 7a (pbar mark) in Figure A2. Most of the errors
Figure A1. Jack-knife clustering measurements for Fig. 7a.
Figure A2. Jack-knife covariance matrix for Fig. 7a.
are not strongly correlated, although the rp bins centered at1 and 2 Mpc/h are weakly correlated with smaller-scale bins(most of which have stronger mark correlations), which mayexplain why the mark correlation measurements of thesebins are slightly larger than in the neighboring rp bins.
In any case, the range of jack-knife clustering measure-ments in Figure A1 is not extremely large, and the corre-lations between the rp bins in Figure A2 are not extremelystrong, so we conclude that the measured mark correlationfunctions are robust, as are the inferred environmental cor-relations.
c© 0000 RAS, MNRAS 000, 1–18