Galaxy Zoo DECaLS: Detailed visual morphology ...
23
MNRAS 509, 3966–3988 (2022) https://doi.org/10.1093/mnras/stab2093 Advance Access publication 2021 September 30 Galaxy Zoo DECaLS: Detailed visual morphology measurements from volunteers and deep learning for 314 000 galaxies Mike Walmsley , 1‹ Chris Lintott , 1 Tobias G´ eron , 1 Sandor Kruk , 2 Coleman Krawczyk, 3 Kyle W. Willett, 4 Steven Bamford, 5 Lee S. Kelvin , 6 Lucy Fortson, 7 Yarin Gal, 8 William Keel , 9 Karen L. Masters , 10 Vihang Mehta, 9 Brooke D. Simmons, 11 Rebecca Smethurst , 1 Lewis Smith, 8 Elisabeth M. Baeten 12 and Christine Macmillan 12 1 Oxford Astrophysics, Department of Physics, University of Oxford, Denys Wilkinson Building, Keble Road, Oxford OX1 3RH, UK 2 European Space Agency, ESTEC, Keplerlaan 1, NL-2201 AZ Noordwijk, the Netherlands 3 Institute of Cosmology and Gravitation, University of Portsmouth Dennis Sciama Building, Burnaby Road, Portsmouth PO1 3FX, UK 4 School of Physics and Astronomy, University of Minnesota, 116 Church St SE, Minneapolis, MN 55455, USA 5 School of Physics and Astronomy, University of Nottingham, University Park, Nottingham, NG7 2RD, UK 6 Department of Astrophysical Sciences, Princeton University, 4 Ivy Lane, Princeton, NJ 08544, USA 7 Minnesota Institute for Astrophysics, University of Minnesota, 116 Church St SE, Minneapolis, MN 55455, USA 8 Oxford Applied and Theoretical Machine Learning (OATML) Group, Department of Computer Science, University of Oxford, Oxford OX1 3QD, UK 9 Department of Physics and Astronomy, University of Alabama, Tuscaloosa, AL 35487, USA 10 Department of Physics and Astronomy, Haverford College, 370 Lancaster Avenue, Haverford, PA 19041, USA 11 Department of Physics, Lancaster University, Bailrigg, Lancaster LA1 4YB, UK 12 Citizen Scientist, Zooniverse c/o University of Oxford, Keble Road, Oxford OX1 3RH, UK Accepted 2021 July 16. Received 2021 July 16; in original form 2021 January 5 A B S T R A C T We present Galaxy Zoo DECaLS: detailed visual morphological classifications for Dark Energy Camera Legacy Survey images of galaxies within the SDSS DR8 footprint. Deeper DECaLS images (r = 23.6 versus r = 22.2 from SDSS) reveal spiral arms, weak bars, and tidal features not previously visible in SDSS imaging. To best exploit the greater depth of DECaLS images, volunteers select from a new set of answers designed to improve our sensitivity to mergers and bars. Galaxy Zoo volunteers provide 7.5 million individual classifications over 314 000 galaxies. 140 000 galaxies receive at least 30 classifications, sufficient to accurately measure detailed morphology like bars, and the remainder receive approximately 5. All classifications are used to train an ensemble of Bayesian convolutional neural networks (a state-of-the-art deep learning method) to predict posteriors for the detailed morphology of all 314 000 galaxies. We use active learning to focus our volunteer effort on the galaxies which, if labelled, would be most informative for training our ensemble. When measured against confident volunteer classifications, the trained networks are approximately 99 per cent accurate on every question. Morphology is a fundamental feature of every galaxy; our human and machine classifications are an accurate and detailed resource for understanding how galaxies evolve. Key words: methods: data analysis – galaxies: bar – galaxies: general – galaxies: interactions. 1 INTRODUCTION Morphology is a key driver and tracer of galaxy evolution. For example, bars are thought to move gas inwards (Sakamoto et al. 1999) driving and/or shutting down star formation (Sheth et al. 2004; Jogee, Scoville & Kenney 2005), and bulges are linked to global quenching (Masters et al. 2011; Fang et al. 2013; Bluck et al. 2014) and inside-out quenching (Spindler et al. 2017; Lin et al. 2019). Morphology also traces other key drivers, such as the merger history of a galaxy. Mergers support galaxy assembly (Wang et al. 2011; Martin et al. 2018), though their relative contribution is an open question (Casteels et al. 2014), and may create tidal features, E-mail: [email protected] bulges, and discs, allowing past mergers to be identified (Hopkins et al. 2010; Fontanot et al. 2011; Kaviraj 2014; Brooks & Christensen 2015). Unpicking the complex interplay between morphology and galaxy evolution requires measurements of detailed morphology in large samples. While modern surveys reveal exquisite morphological detail, they image far more galaxies than scientists can visually classify. Galaxy Zoo solves this problem by asking members of the public to volunteer as ‘citizen scientists’ and provide classifications through a web interface. Galaxy Zoo has provided morphology measurements for surveys including SDSS (Lintott et al. 2008; Willett et al. 2013) and large HST programs (Simmons et al. 2017b; Willett et al. 2017). Knowing the morphology of homogeneous samples of hundreds of thousands of galaxies supports science only possible at scale. © 2021 The Author(s). Published by Oxford University Press on behalf of Royal Astronomical Society. This is an Open Access article distributed under the terms of the Creative Commons Attribution License (http://creativecommons.org/licenses/by/4.0/), which permits unrestricted reuse, distribution, and reproduction in any medium, provided the original work is properly cited. Downloaded from https://academic.oup.com/mnras/article/509/3/3966/6378289 by guest on 26 May 2022
-
Upload
khangminh22 -
Category
Documents
-
view
1 -
download
0
Transcript of Galaxy Zoo DECaLS: Detailed visual morphology ...

MNRAS 509, 3966–3988 (2022) https://doi.org/10.1093/mnras/stab2093 Advance Access publication 2021 September 30
Galaxy Zoo DECaLS: Detailed visual morphology measurements from
volunteers and deep learning for 314 000 galaxies
Mike Walmsley , 1 ‹ Chris Lintott , 1 Tobias G eron , 1 Sandor Kruk , 2 Coleman Krawczyk, 3
Kyle W. Willett, 4 Steven Bamford, 5 Lee S. Kelvin , 6 Lucy Fortson, 7 Yarin Gal, 8 William Keel , 9
Karen L. Masters , 10 Vihang Mehta, 9 Brooke D. Simmons, 11 Rebecca Smethurst , 1 Lewis Smith, 8
Elisabeth M. Baeten
12 and Christine Macmillan
12
1 Oxford Astrophysics, Department of Physics, University of Oxford, Denys Wilkinson Building, Keble Road, Oxford OX1 3RH, UK
2 European Space Agency, ESTEC, Keplerlaan 1, NL-2201 AZ Noordwijk, the Netherlands 3 Institute of Cosmology and Gravitation, University of Portsmouth Dennis Sciama Building, Burnaby Road, Portsmouth PO1 3FX, UK
4 School of Physics and Astronomy, University of Minnesota, 116 Church St SE, Minneapolis, MN 55455, USA
5 School of Physics and Astronomy, University of Nottingham, University Park, Nottingham, NG7 2RD, UK
6 Department of Astrophysical Sciences, Princeton University, 4 Ivy Lane, Princeton, NJ 08544, USA
7 Minnesota Institute for Astrophysics, University of Minnesota, 116 Church St SE, Minneapolis, MN 55455, USA
8 Oxford Applied and Theoretical Machine Learning (OATML) Group, Department of Computer Science, University of Oxford, Oxford OX1 3QD, UK
9 Department of Physics and Astronomy, University of Alabama, Tuscaloosa, AL 35487, USA
10 Department of Physics and Astronomy, Haverford Colleg e , 370 Lancaster Avenue, Haverford, PA 19041, USA
11 Department of Physics, Lancaster University, Bailrigg, Lancaster LA1 4YB, UK
12 Citizen Scientist, Zooniverse c/o University of Oxford, Keble Road, Oxford OX1 3RH, UK
Accepted 2021 July 16. Received 2021 July 16; in original form 2021 January 5
A B S T R A C T
We present Galaxy Zoo DECaLS: detailed visual morphological classifications for Dark Energy Camera Le gac y Surv e y images of galaxies within the SDSS DR8 footprint. Deeper DECaLS images ( r = 23.6 versus r = 22.2 from SDSS) reveal spiral arms, weak bars, and tidal features not previously visible in SDSS imaging. To best exploit the greater depth of DECaLS images, volunteers select from a new set of answers designed to impro v e our sensitivity to mergers and bars. Galaxy Zoo volunteers provide 7.5 million individual classifications o v er 314 000 galaxies. 140 000 galaxies receive at least 30 classifications, sufficient to accurately measure detailed morphology like bars, and the remainder receive approximately 5. All classifications are used
to train an ensemble of Bayesian convolutional neural networks (a state-of-the-art deep learning method) to predict posteriors for the detailed morphology of all 314 000 galaxies. We use active learning to focus our volunteer effort on the galaxies which, if labelled, would be most informative for training our ensemble. When measured against confident volunteer classifications, the trained networks are approximately 99 per cent accurate on every question. Morphology is a fundamental feature of every
galaxy; our human and machine classifications are an accurate and detailed resource for understanding how galaxies evolve.
Key words: methods: data analysis – galaxies: bar – galaxies: general – galaxies: interactions.
1
M
e
1
2
g
2
2
h
2
o
�
b
e
2
e
s
d
c
p
t
m
W
Dow
nloaded from https://academ
ic.oup.com/m
nras/article/509/3/3966/6378289 by guest on 26 May 2022
I N T RO D U C T I O Norphology is a key driver and tracer of galaxy evolution. Forxample, bars are thought to mo v e gas inwards (Sakamoto et al.999 ) driving and/or shutting down star formation (Sheth et al.004 ; Jogee, Scoville & Kenney 2005 ), and bulges are linked tolobal quenching (Masters et al. 2011 ; Fang et al. 2013 ; Bluck et al.014 ) and inside-out quenching (Spindler et al. 2017 ; Lin et al.019 ). Morphology also traces other key drivers, such as the mergeristory of a galaxy. Mergers support galaxy assembly (Wang et al.011 ; Martin et al. 2018 ), though their relative contribution is anpen question (Casteels et al. 2014 ), and may create tidal features,
E-mail: [email protected]
W
o
Published by Oxford University Press on behalf of Royal Astronomical SocieCommons Attribution License ( http://cr eativecommons.or g/licenses/by/4.0/), whi
ulges, and discs, allowing past mergers to be identified (Hopkinst al. 2010 ; Fontanot et al. 2011 ; Kaviraj 2014 ; Brooks & Christensen015 ). Unpicking the complex interplay between morphology and galaxy
volution requires measurements of detailed morphology in largeamples. While modern surv e ys rev eal e xquisite morphologicaletail, they image far more galaxies than scientists can visuallylassify. Galaxy Zoo solves this problem by asking members of theublic to volunteer as ‘citizen scientists’ and provide classificationshrough a web interface. Galaxy Zoo has provided morphologyeasurements for surv e ys including SDSS (Lintott et al. 2008 ;illett et al. 2013 ) and large HST programs (Simmons et al. 2017b ;illett et al. 2017 ). Knowing the morphology of homogeneous samples of hundreds
f thousands of galaxies supports science only possible at scale.
© 2021 The Author(s). ty. This is an Open Access article distributed under the terms of the Creative ch permits unrestricted reuse, distribution, and reproduction in any medium,
provided the original work is properly cited.

Galaxy Zoo DECaLS data release 3967
Tv
s
tcf
ea
2u2
c
eobdct
otGi
d
ag
m
Glcc
v(tfovupwWgovaqqv
oa
n
i
rdaS
o
1
2
2
O
s
(
Th
0a
r
ci
(
t
a
(
d
30
if
pT
Dp(
c
2
WS
D
g
I
pmS
c
g
F
w
i
e
F
tm
Sgtt
c
Dow
nloaded from https://academ
ic.oup.com/m
nras/article/509/3/3966/6378289 by guest on 26 May 2022
he catalogues produced by the collective effort of Galaxy Zoo olunteers ha ve been used as the foundation of a large number oftudies of galaxy morphology (see Masters 2019 for a re vie w), withhe method’s ability to provide estimates of confidence alongside lassification especially valuable. Galaxy Zoo measures subtle ef- ects in large populations (Masters et al. 2010 ; Willett et al. 2015 ; Hartt al. 2017 ); identifies unusual populations that challenge standard strophysics (Simmons et al. 2013 ; Tojeiro et al. 2013 ; Kruk et al.017 ); and finds unexpected and interesting objects that provide nique data on broader galaxy evolution questions (Cardamone et al. 009 ; Lintott et al. 2009 ; Keel et al. 2015 ). Here, we present the first volunteer classifications of galaxy images
ollected by the Dark Energy Camera Le gac y Surv e y (DECaLS; De yt al. 2019 ). This work represents the first systematic engagement f volunteers with low-redshift images as deep as those provided y DECaLS, and thus represents a more reliable catalogue of etailed morphology than has hitherto been available. These detailed lassifications include the presence and strength of bars and bulges, he count and winding of spiral arms, and the indications of recentr ongoing mergers. Our volunteer classifications were sourced o v er hree separate Galaxy Zoo DECaLS (GZD) classification campaigns, ZD-1, GZD-2, and GZD-5, which classified galaxies first released
n DECaLS Data Releases 1, 2, and 5, respectively. The key practicalifferences are that GZD-5 uses an impro v ed decision tree aimedt better identification of mergers and weak bars, and includes alaxies with just 5 total votes as well as galaxies with 40 orore. Across all campaigns, we collect 7 496 325 responses fromalaxy Zoo volunteers, recording 30 or more classifications in at
east one campaign for 139 919 galaxies and fewer (approximately 5 lassifications) for an additional 173 870 galaxies, totalling 313 789 lassified galaxies.
For the first time in a Galaxy Zoo data release, we also pro-ide automated classifications made using Bayesian deep learning Walmsley et al. 2020 ). By using our volunteer classifications to rain a deep learning algorithm, we can make detailed classifications or all 313 789 galaxies in our target sample, providing morphol- gy measurements faster than would be possible than relying on olunteers alone. Bayesian deep learning allows us to learn from
ncertain volunteer responses and to estimate the uncertainty of our redictions. It also allows us to identify which galaxies, if labelled, ould be most informative for training our classifier (active learning). e chose to partially focus our volunteers on such informative
alaxies, requesting 40 classifications per informative galaxy and nly 5 for the remainder. Our classifier predicts posteriors for how
olunteers would have answered all decision tree questions, 1 with an ccuracy comparable to asking 5 to 15 volunteers, depending on the uestion, and achieving approximately 99 per cent accuracy on every uestion for galaxies where the volunteers are confident (volunteer ote fractions below 0.2 or abo v e 0.8).
In Section 2, we describe the observations used and the creation f RGB images suitable for classification. In Section 3, we give n o v erview of the volunteer classification process and detail theew decision trees used. In Section 4, we investigate the effects ofmpro v ed imaging and impro v ed decision trees, and we compare ouresults to other morphological measurements. Then, in Section 5, we escribe the design and performance of our automated classifier –n ensemble of Bayesian convolutional neural networks. Finally, in ection 6, we provide guidance (and example code) for ef fecti ve usef the classifications.
Excluding the final ‘Is there anything odd?’ question as it is multiple-choice.
2
s3
I MAG I NG
.1 Obser v ations
ur galaxy images are created from data collected by the DECaLSurv e y (De y et al. 2019 ). DECaLS uses the Dark Energy CameraDECam; Flaugher et al. 2015 ) at the 4m Blanco telescope at Cerroololo Inter-American Observatory, near La Serena, Chile. DECam
as a roughly he xagonal 3.2 de g 2 field of view with a pixel scale of.262 arcsec per pixel. The median point spread function full-width t half-maximum (FWHM) is 1 . ′′ 29, 1 . ′′ 18, and 1 . ′′ 11 for g , r , and z,espectively.
The DECaLS surv e y contributes targeting images for the up-oming Dark Energy Spectroscopic Instrument (DESI). DECaLS
s responsible for the DESI footprint in the Southern Galactic CapSGC) and the δ ≤ 34 region of the Northern Galactic Cap (NGC),otalling 10 480 de g 2 . 2 1130 de g 2 of the SGC DESI footprint arelready being imaged by DECam through the Dark Energy Surv e yDES; The Dark Energy Surv e y Collaboration 2005 ) so DECaLSoes not repeat this part of the DESI footprint. DECaLS implements a-pass strategy to tile the sky. Each pass is slightly offset (approx. 0.1–.6 deg ). The choice of pass and exposure time for each observations optimized in real-time based on the observing conditions recorded or the previous targets, as well as the interstellar dust reddening, skyosition, and estimated observing conditions of possible next targets. his allows a near-uniform depth across the surv e y. In DECaLS DR1,R2, and DR5, from which our images are drawn, the median 5 σoint source depths for areas with 3 observations was approximately AB) g = 24.65, r = 23.61, and z = 22.84. 3 The DECaLS surv e yompleted observations in 2019 March.
.2 Selection
e identify galaxies in the DECaLS imaging using the NASA–loan Atlas v1.0.0 (NSA). As the NSA was derived from SDSSR8 imaging (Aihara et al. 2011 ), this data release only includesalaxies that are within both the DECaLS and SDSS DR8 footprint.n effect, we are using deeper DECaLS imaging of the galaxiesreviously imaged in SDSS DR8. This ensures our morphological easurements have a wealth of ancillary information derived from
DSS and related surv e ys, and allows us to measure any shift inlassifications versus Galaxy Zoo 2 using the subset of SDSS DR8alaxies classified both in this work and in Galaxy Zoo 2 (Section 4).ig. 1 shows the resulting GZ DECaLS sk y co v erage. NSA v1.0.0as not published but the values of the columns used here are
dentical to those in NSA v1.0.1, released in SDSS DR13 (Albaretit al. 2017 ); only the column naming conventions are different.
Selecting galaxies with the NSA introduces two implicit cuts. irst, the NSA primarily includes galaxies brighter than m r = 17.77,
he SDSS spectroscopic target selection limit. Galaxies fainter than r = 17.77 are included only if they are in deeper survey areas (e.g.tripe82) or were measured using ‘spare’ fibres after all brighter alaxies in a given field were covered; we suggest researchers enforce heir own magnitude cut according to their science case. Secondly, he NSA only co v ers redshifts of z = 0.15 or below. To these implicituts, we add an explicit cut requiring Petrosian radius (the NSA
The remaining DESI footprint is being imaged by DECaLS’ companion urv e ys, MzLS and BASS (Dey et al. 2019 ). See https://www.legac ysurve y.org/dr5/description/ and related pages.
MNRAS 509, 3966–3988 (2022)

3968 M. Walmsley et al.
Figure 1. Sk y co v erage of GZ DECaLS (equatorial coordinates), resulting from the imaging o v erlap of DECaLS DR5 and SDSS DR8, shown in red. Darker areas indicate more galaxies. Sky coverage of Galaxy Zoo 2, which used images sourced from SDSS DR7, shown in light blue. The NSA includes galaxies imaged by SDSS DR8, including galaxies newly imaged at the Southern Galactic Cap (approx. 2500 deg 2 ).
v
g
z
a
s
g
F
t
w
s
w
P
g
a
c
a
w
c
o
v
i
p
w
m
dp
a
w
L
i
d
4
S5
v6
dp
d
i
i
2
W
m
c
a
t
R
v
m
e
i
s
t
s
s
p
b
fl
r
d
X
w
a
i
w
d
c
v
t
a
i
z
c
G
3
V
c
t
1
2
D
M
Dow
nloaded from https://academ
ic.oup.com/m
nras/article/509/3/3966/6378289 by guest on 26 May 2022
1.0.0 PETROTHETA 4 column) of at least 3 arcsec, to ensure thealaxy is sufficiently extended for meaningful classification.
For each galaxy, if the coordinates had been imaged in the g , r , and bands, and the galaxy passed the selection cuts abo v e, we acquired combined FITS cutout of the grz bands from the DECaLS cutoutervice ( www.legac ysurve y.org ).
Galaxy Zoo presents volunteers with 424 × 424 pixel squarealaxy images. GZD-1 and GZD-2 acquired 424 × 424 pixel squareITS cutouts directly from the cutout service. To ensure that galaxies
ypically fit well within a 424 pixel image, cutouts were downloadedith an interpolated pixel scale s of
= max ( min (0 . 04 p 50 , 0 . 02 p 90 ) , 0 . 1) , (1)
here p 50 is the Petrosian 50 per cent-light radius and p 90 is theetrosian 90 per cent-light radius. Approximately 1 per cent ofalaxies have incorrectly large radii reported in the NSA (typicallys a result of foreground stars or other interloping sources) and thisauses the field to be incorrectly large and hence the target galaxy toppear incorrectly small. To allow researchers to mitigate this issue,e flag images for which there are more source pixels away from the
entre than near the centre; specifically, for which the mean distancef all likely source pix els 5 e xceeds 161 (approximately the expectedalue for all pixels). We find by eye that this simple proceduredentifies the worst-affected galaxies. We report the mean sourceixel distance and distance flags as wrong size statistic androng size warning , respectively. For GZD-5, to a v oid banding artefacts caused by the interpolationethod of the DECaLS cutout service, each FITS image was
ownloaded at the fixed native telescope resolution of 0.262 arcsec 2
er pixel, 6 with enough pixels to cover the same area as 424 pixelst the interpolated pixel scale s . These individually sized FITSere then resized locally up to the interpolated pixel scale s byanczos interpolation (Lanczos 1938 ). Image processing is otherwise
dentical between campaigns. Galaxies with incomplete imaging,efined as more than 20 per cent missing pixels in any band, were
Azimuthally averaged SDSS-style Petrosian radius, derived from the r band. ee Albareti et al. ( 2017 ) and the NSA v1.0.1 data model. Arbitrarily defined as pixels with double the 20th percentile band-averaged alue after the scaling in Section 2.3. Up to a maximum of 512 pixels per side. Highly extended galaxies were ownloaded at reduced resolution such that the FITS had exactly 512 pixels er side.
M
c
a
a
7
a8
NRAS 509, 3966–3988 (2022)
iscarded. For GZD-1/2, 92 960 of 101 252 galaxies had completemaging (91.8 per cent). For GZD-5, 216 106 of 247 746 galaxies notn DECaLS DR1/2 had complete imaging (87.2 per cent). 7
.3 RGB image construction
e convert the measured grz fluxes into RGB images following theethodology of Lupton et al. ( 2004 ). To use the grz bands as RGB
olours, we multiply the flux values in each band by 125.0, 71.43,nd 52.63, respectively. These numbers are chosen by eye 8 such thatypical subjects show an appropriate range of colour once mapped toGB channels. For background pixels with very low flux, and therefore high
ariance in the proportion of flux per band, naively colouring by theeasured flux creates a speckled effect (Willett et al. 2017 ). As an xtreme e xample, a pix el with 1 photon in the g band and no photonsn r or z would be rendered entirely red. To remo v e these colourfulpeckles, we desaturate pixels with very low flux. We first estimatehe total per-pixel photon count N assuming an exposure time of 90econds per band and a mean photon frequency of 600 nm. Poissontatistics imply the standard deviation on the total mean flux in thatixel is proportional to
√
N . For pixels with a standard deviationelow 100, we scale the per-band deviation from the mean per-pixelux by a factor of 1 per cent of the standard deviation. The effect is toeduce the saturation of low-flux pixels in proportion to the standardeviation of the total flux. Mathematically, we set
′ ijc = X ij + α( X ijc −X ij ) where α= min (0 . 01
√
X ij T /λ, 1) , (2)
here X ijc and X
′ ijc are the flux at pixel ij in channel c before and
fter desaturation, X ij is the mean flux across bands at pixel ij , Ts the mean exposure time (here, 90 s) and λ is the mean photonavelength (here, 600 nm). Pixel values were scaled by arcsinh( x ) to compensate for the high
ynamic range typically found in galaxy flux, creating images whichan show both bright cores and faint outer features. To remo v e theery brightest and darkest pixels, we linearly rescale the pixel valueso lie on the ( −0.5, 300) interval and then clip the pixel values to 0nd 255, respectively. We use these final values to create an RGBmage using pillow (Kemenade et al. 2020 ).
The images are available on Zenodo at https:// doi.org/ 10.5281/enodo.4573248 . The code used to download the FITS cutouts andonvert them to RGB images is available on GitHub for GZD-1,ZD-2, and GZD-5.
VO LUNTEER CLASSI FI CATI ONS
olunteer classifications for GZ DECaLS were collected during threeampaigns. GZD-1 and GZD-2 classified all 99 109 galaxies passinghe criteria abo v e from DECALS DR1 and DR2, respectively. GZD- ran from 2015 September to 2016 February, and GZD-2 from016 April to 2017 February. GZD-5 classified 262 000 DECALSR5-only galaxies passing the criteria abo v e. GZD-5 ran from 2017arch to 2020 October. GZD-5 used more complex retirement
riteria aimed at improving our automated classification (3.1) andn impro v ed decision tree aimed at better identification of weak barsnd minor mergers (4.2).
Note that these numbers do not sum to the total number of galaxies classified cross both campaigns because some galaxies are shared between campaigns. By Dustin Lang, who we gratefully acknowledge.

Galaxy Zoo DECaLS data release 3969
Figure 2. GZD-1, GZD-2, and GZD-5 classification counts, excluding implausible classifications (Section 4.3.1). GZD-1 has approximately 40–60 classifications, GZD-2 has approximately 40, and GZD-5 has either approximately 5 or approximately 30–40. 5.9 per cent of GZD-5 galaxies received more than 40 classifications due to mistaken duplicate uploads.
msa
pe
3
HIc
cH
tif
odh
Udtt
o
cbgu2ldg
w
9
it
mi
nt
Ftt
cgun(i
I
w
t
B
‘t
d
D
oa
etW
e
c
G
Er
ua
u(
w
ttTwu
ao
p
r
10 ‘Artifact’ answers are sufficiently rare that we chose to ignore votes for this answer when calculating which galaxies to label.
Dow
nloaded from https://academ
ic.oup.com/m
nras/article/509/3/3966/6378289 by guest on 26 May 2022
This iteration of the Galaxy Zoo project used the infrastructure ade available by the Zooniverse platform; in particular, the open
ource Panoptes platform (The Zooniverse Team 2020 ). The platform
llows for the rapid creation of citizen science projects, and presentsarticipating volunteers with one of a subject set of images chosen ither randomly, or through criteria described in Section 3.1.
.1 Selecting total classifications
ow many volunteer classifications should each galaxy receive? deally, all galaxies would receive enough classifications to be onfident in the average response (i.e. the vote fraction) while stilllassifying all the target galaxies within a reasonable timeframe. o we ver, the size of modern surveys make this increasingly imprac-
ical. Collecting 40 volunteer classifications for all 314 000 galaxies n this data release would have taken around eight years without urther promotion efforts. The larger data sets of future surv e ys willnly be more challenging. In anticipation of future classification emands, we have therefore implemented a variable retirement rate ere (moti v ated and described further in Walmsley et al. 2020 ).nlike previous data releases, GZ DECaLS galaxies each received ifferent numbers of classifications (Fig. 2 ). Beginning part-way hrough GZD-5, we prioritize classifications for the galaxies expected o most impro v e our machine learning models, and rely more heavilyn those models for classifying the remainder. For GZD-1 and GZD-2, all galaxies received at least 40
lassifications 9 (as with previous data releases). GZD-1 galaxies have etween 40 and 60 classifications, selected at random, while GZD-2 alaxies all have approximately 40. For GZD-5, galaxies classified ntil 2019 June also received approximately 40 classifications. From
019 June, we introduced an active learning system. Using active earning, galaxies expected to be the most informative for training our eep learning model received 40 classifications, and the remaining alaxies received at least 5 classifications.
By ‘most informative’, we mean the galaxies which, if classified, ould most impro v e the performance of our model. We describe our
Note that because classifications from volunteers who respond ‘artefact’ at mplausibly high rates are discounted, the total classifications in Fig. 2 and he published catalogue are slightly lower – see Section 4.3.1.
1
s1
po
ethod for estimating which galaxies would be most informative n full in Walmsley et al. ( 2020 ). Briefly, we use a convolutionaleural network to make repeated predictions for the probability hat k of N total volunteers select ‘Featured’ to the ‘Smooth oreatured’ question. 10 For each prediction, we randomly permute
he network with MC Dropout (Gal 2016 ), approximating (roughly) raining many networks to make predictions on the same data set. Itan be shown that, under some assumptions, the most informative alaxies will be the galaxies with confidently different predictions nder each MC Dropout permutation; that is, where the permuted etworks confidently disagree (Houlsby 2014 ). Formally, we acquire label with volunteers) the galaxies with the highest estimated mutual nformation, given by:
[ k, w] = −N ∑
k= 0
〈 Bin ( k| f w ( x) , N ) 〉 log [ 〈 Bin ( k| f w ( x) , N ) 〉 ]
+
⟨
N ∑
k= 0
Bin ( k| f w ( x) , N ) log [ Bin ( k| f w ( x) , N )]
⟩
, (3)
here f w ( x ) is the output of the neural network trained to predicthe typical volunteer response following Walmsley et al. ( 2020 ) andin( k | f w ( x ), N ) is the probability for k of N volunteers to answer
Featured’ to ‘Smooth or Featured’ given that network-estimated ypical response. Angled brackets indicate the e xpectation o v er theistribution of weights, approximated as the e xpectation o v er MCropout permutations. In short, the ne gativ e term giv es the entropyf the volunteer vote distribution given the mean model predictions, nd the positive term gives the mean entropy from the predictions ofach permuted model. The difference between these terms measures he degree of confident disagreement between permuted models. See
almsley et al. ( 2020 ) for more. We used the same architecture and loss function as in Walmsley
t al. ( 2020 ) while concurrently developing the more sophisticatedlassifier introduced in this Section. The initial training set was allZD-5 galaxies fully classified ( N > 36) by the time of acti v ation.ach active learning cycle proceeded as follows. The model was
etrained with all galaxies fully classified by the cycle start date. Next,nlabelled galaxies were ranked by mutual information (equation 3) nd the most informative 1000 of a random 32 768 11 galaxies wereploaded. Once those galaxies were fully classified by volunteers typically in 1–4 weeks) the cycle was repeated. 6939 total galaxiesere uploaded in total. 12
We chose to select from a subset of galaxies not yet classified forwo reasons. The first was for computational efficiency: calculating he acquisition function requires making 5 predictions per galaxy. he second was that ad hoc experiments showed that galaxies ith the very highest acquisition function values were often highly nusual and might be too unusual to learn from ef fecti vely. We alsodded a retirement rule to retire galaxies receiving 5 classifications f ‘artefact’, to help a v oid v olunteers being presented with theserioritized artefacts. We emphasize that the number of classifications each galaxy
eceived under active learning is not random. Fig. 3 shows how
1 To allow for out-of-memory shuffling, binary-encoded galaxy images were tored in ‘shards’ of 4096 galaxies each. 32 768 corresponds to 8 such shards. 2 Technical errors with duplicate uploads led to some active-learning- rioritized galaxies receiving more than 40 classifications; the median number f classifications is 44.
MNRAS 509, 3966–3988 (2022)

3970 M. Walmsley et al.
Figure 3. ‘Featured’ vote fraction and Petrosian radius (as measured by the NSA PETROTHETA column) for galaxies selected either at random (prior to enabling active learning) or prioritized as informative. Prioritized galaxies are dramatically more featured and slightly more extended than the previously classified random galaxies.
a
a
g
i
‘
e
3
T
s
d
b
b
t
w
i
h
‘
d
a
i
a
s
Z
i
i
e
e
b
G
b
c
m
i
t
o
b
r
a
1
tlo
a
s
A
a
r
a
t
T
w
c
c
a
s
2<
c
t
t
t
c
g
c
o
i
t
o
i
s
b
(
r
‘
‘
p
m
r
e
2
(
m
6
d
f
a
fi
w
G
i
t
g
M
Dow
nloaded from https://academ
ic.oup.com/m
nras/article/509/3/3966/6378289 by guest on 26 May 2022
ctive-learning-prioritized galaxies are dramatically more featurednd slightly more extended than the previously classified randomalaxies, matching our intuition that small ‘smooth’ elliptical galax-es are easier to classify and hence less informative than extendedfeatured’ galaxies. For details on handling this and other selectionffects, see Section 6.
.2 Decision trees
he questions and answers we ask our volunteers define the mea-urements we can publish. It is therefore critical that the Galaxy Zooecision tree matches the science goals of the research community. The questions in a given Galaxy Zoo workflow are designed to
e answerable even by a classifier with little or no astrophysicalackground. This moti v ates a focus primarily on the appearance ofhe galaxy, rather than incorporating physical interpretations whichould require prior knowledge of galaxies. As an example, the
nitial question in all decision trees from Galaxy Zoo 2 onwardsas asked the viewer to distinguish primarily between ‘smooth’ andfeatured’ galaxies, rather than ‘elliptical’ and ‘disc’ galaxies. Thisistinction between descriptive and interpretive classification is notl w ays perfectly enforced. For example, the ‘features’ response to thenitial question is worded as ‘features or disc’, and a later questionsks whether the galaxy is ‘merging or disturbed’, which requiresome interpretation. 13 To aid classifiers, all iterations of Galaxyoo have therefore included illustrative icons in the classification
nterface. Additional help is also available; in the current project, thenterface includes a brief tutorial, a detailed field guide with multiplexamples of each type of galaxy, and specific help text available forach individual classification task.
The largest workflow change between Galaxy Zoo versions wasetween the original Galaxy Zoo (GZ1) and Galaxy Zoo 2 (GZ2).Z1 presented classifiers with a single task per galaxy, a choiceetween smooth/elliptical, multiple versions of featured/disc (in-luding edge-on, face-on, and directionality of spiral structure), anderger. GZ2 re-classified the brightest quarter of the GZ1 sample
n much greater detail, including a branched, multi-task decisionree. Subsequent changes to the decision tree for different versionsf Galaxy Zoo have been mostly iterative in nature, driven in party the data itself and in part by experience-based reflection whichevealed minor adjustments that could help classifiers provide moreccurate information. As an example of the former, a new branch was
3 The step from visual description to interpretation may explain why a model rained by Fischer, Dom ınguez S anchez & Bernardi ( 2019 ) on expert T-Type abels makes more confident predictions than volunteers on whether a subset f low-mass GZ2 galaxies show spiral structure; see Peterken et al. ( 2021 ).
n
i
e
E
n
w
NRAS 509, 3966–3988 (2022)
dded for GZ-Hubble and GZ-CANDELS to capture information ontar-forming clumps in classifications of higher redshift galaxies.s an example of the latter, the final 2 tasks of GZ2 have been
djusted o v er multiple v ersions to facilitate reliable identification ofare features. Such adjustments have generally been minimized to v oid complicating comparisons with previous campaigns.
The decision tree used for GZD-1 and GZD-2 has three modifica-ions versus the Galaxy Zoo 2 decision tree (Willett et al. 2013 ).he ‘Can’t Tell’ answer to ‘How many spiral arms are there?’as remo v ed, the number of answers to ‘How prominent is the
entral bulge?’ was reduced from four to three, and ‘Is the galaxyurrently merging, or is there any sign of tidal debris?’ was added as standalone question.
For GZD-5, we made three further changes. Several Galaxy Zootudies (e.g. Masters et al. 2012 ; Skibba et al. 2012 ; Willett et al.013 ; Kruk et al. 2018 ) found that galaxies selected with 0.2 < p bar
0.5 in GZ2 correspond to ‘weak bars’ when compared with expertlassification such as those in Nair & Abraham ( 2010 ). Therefore,o increase the detection of bars, we changed the possible answerso the ‘Does this galaxy have a bar?’ question from ‘Yes’ or ‘No’o ‘Strong’, ‘Weak’ or ‘No’. We define a strong bar as one that islearly visible and extending across a large fraction of the size of thealaxy. A weak bar is smaller and fainter relative to the galaxy, andan appear more oval than the strong bar, while still being longer inne direction than the other. Our definition of strong versus weak bars similar that of Nair & Abraham ( 2010 ), with the exception thathe y also hav e an ‘intermediate’ classification. We added examplesf galaxies with ‘weak bars’ to the Field Guide and provided a newcon for this classification option, as shown in Fig. 4 .
Secondly, to allow for more fine-grained measurements of bulgeize, we increased the number of ‘How prominent is the centralulge?’ answers from three (‘No’, ‘Obvious’, ‘Dominant’) to five‘No Bulge’, ‘Small’, ‘Moderate’, ‘Large’, ‘Dominant’). We alsoe-included the ‘Can’t Tell’ answer.
Thirdly, we modified the ‘Merging’ question from ‘Merging’,Tidal’, ‘Both’, or ‘None’, to the more phenomenological ‘Merging’,Major Disturbance’, ‘Minor Disturbance’, or ‘No’. Our goal was toresent more direct answers to our volunteers and to better distinguishajor and minor mergers, to support recent scientific interest in the
ole of major and minor mergers on mass assembly (L opez-Sanjuant al. 2010 ; Kaviraj 2013 ), black hole accretion (Alexander & Hickox012 ; Simmons, Smethurst & Lintott 2017a ), and morphologyHopkins et al. 2009 ; Lotz et al. 2011 ; Lofthouse et al. 2017 ). Weade this final ‘merger’ change two months after launching GZD-5;
722 GZD-5 galaxies (2.7 per cent) were fully classified before thatate and so do not have responses from volunteers to this question. We also make several improvements to the illustrative icons shown
or each answer. These icons are the most visible guide for volunteerss to what each answer means (complementing the tutorial, help text,eld guide, and ‘Talk’ forum). Fig. 4 shows the GZD-5 decision treeith new icons as shown to volunteers. The decision tree used inZD-1 and GZD-2 is shown in Fig. A1 . For the ‘Smooth or Featured?’ question, we changed the ‘Smooth’
con to include three example galaxies at various ellipticities, andhe ‘Featured’ icon to include an edge-on disc rather than a ringalaxy. For ‘Edge On?’, we replaced the previous tick icon with ae w descripti ve icon, and the previous cross icon with the ‘Featured’con abo v e. We also modified the te xt to no longer specify ‘e xactly’dge on, and renamed the answers from ‘Yes’ and ‘No’ to ‘Yes -dge On Disc’ and ‘No – Something Else’. For ‘Bulge?’, we createdew icons to match the change from four to fiv e answers. F or ‘Bar’,e replaced the previous tick and cross icons with ne w descripti ve

Galaxy Zoo DECaLS data release 3971
Figure 4. Classification decision tree for GZD-5, with new icons as shown to volunteers. Questions shaded with the same colours are at the same level of branching in the tree; grey have zero-dependent questions, green one, blue two, and purple three.
i
a
Zaidp
t
caatb
4
4
Tt
2
a
a
Ga
Figure 5. Comparison of ‘Featured’ fraction for galaxies classified in both GZ2 and GZ DECaLS. Ambiguous galaxies are consistently reported as more featured in GZ DECaLS, which we attribute to the significantly impro v ed imaging depth of DECaLS.
f
e
ptwt
i
gt
S
D−
W
ca
a
D
d
og
pt
Abfi
np
14 See also http://www.legac ysurve y.org/dr5/description/.
Dow
nloaded from https://academ
ic.oup.com/m
nras/article/509/3/3966/6378289 by guest on 26 May 2022
cons for ‘Strong Bar’, ‘Weak Bar’, and ‘No Bar’. For ‘Merger?’, wedded new descriptive icons to match the updated answers.
Changes to the decision tree complicate comparisons other Galaxy oo projects. As we show in the following sections, the available nswers will affect the sensitivity of volunteers to certain morpholog- cal features, and so morphology measurements made with different ecision trees may not be directly comparable. This difficulty in com- arison has historically required us to be conserv ati ve in our changeso the decision tree. Ho we v er, the adv ent of ef fecti ve automatedlassifications allows us to retrospectively make classifications using ny preferred decision tree. Specifically, in this work, we train our utomated classifier to predict what volunteers would have said using he GZD-5 decision tree, for galaxies which were originally classified y volunteers using the GZD-1/2 decision tree (Section 5.1).
VO LUNTEER ANALYSIS
.1 Impro v ed feature detection from DECaLS imagery
he images used in GZ DECaLS are deeper and higher resolution han were available for GZ2. The GZ2 primary sample (Willett et al.013 ) uses images from SDSS DR7 (Abazajian et al. 2009 ), whichre 95 per cent complete to r = 22.2 with a median seeing of 1 . ′′ 4nd a plate scale of 0 . ′′ 396 per pixel (York et al. 2000 ). In contrast,Z DECaLS uses images from DECaLS DR2 to DR5, which have median 5 σ point source depth of r = 23.6, a seeing better than 1 . ′′ 3
or at least one observation, and a plate scale of 0 . ′′ 262 per pixel (Deyt al. 2019 ). 14
We expect the improved imaging to reveal morphology not reviously visible, particularly for features which are faint (e.g. idal features, low surface brightness spiral arms) or intricate (e.g. eak bars, flocculent spiral arms). Our changes to the decision
ree (Section 3.2) were partly made to better exploit this improvedmaging.
To investigate the consequences of improved imaging, we compare alaxies classified in both GZ2 and GZ DECalS. Galaxies will ypically be classified by both projects if they are inside both theDSS DR7 Le gac y catalogue (i.e. the source GZ2 catalogue) andECaLS DR5 footprints (broadly, North Galactic Cap galaxies with 35 < δ < 0) and match the selection criteria of each project (seeillett et al. 2013 and Section 2.2). GZ2’s r < 17.0 cut, with no
orresponding GZ DECaLS magnitude cut, means that the odds of n y giv en GZ2 galaxy being in GZ DECaLS is close to random (forn isotropic sky) but only the brighter half of suitably located GZECaLS galaxies are in GZ2. To exclude the effect of modifying theecision tree in GZD-5 (addressed separately in Section 4.2), we usenly GZ DECaLS classifications from GZD-1 and GZD-2. 33 124 alaxies were classified in both GZ2 and GZD-1 or GZD-2.
We find that volunteers successfully recognize newly visible mor- hology features. Fig. 5 compares the distribution of vote fractions o ‘Is this galaxy smooth or featured?’ for GZ2 and GZ DECaLS.mbiguous galaxies, with ‘featured’ fractions (before debiasing) etween approx. 0.25 and 0.75, are consistently reported as more eatured (median absolute increase of 0.13, median percentage ncrease of 22 per cent) with the deeper GZ DECaLS images.
The shift towards featured galaxies is an accurate response to theew images, rather than systematics from (for example) a changing opulation of volunteers. Fig. 6 compares the GZ2 and GZ DECaLS
MNRAS 509, 3966–3988 (2022)

3972 M. Walmsley et al.
Figure 6. GZ2 and GZ DECaLS images for 6 galaxies drawn randomly from the 1000 galaxies classified in both projects with the largest increase in ‘featured’ vote fraction (reported fractions shown in red). The increased fraction accurately reflects the increased visibility of detailed morphology from impro v ed imaging.
i
c
a
s
f
a
f
o
f
e
w
m
2
p
m
u
o
o
a
s
v
t
t
4
T
w
c
a
O
v
G
t
s
p
a
a
w>
g
c
a
S
i
v
(
m
W
c
r
d
t
B
e
b
s
MNRAS 509, 3966–3988 (2022)
Dow
nloaded from https://academ
ic.oup.com/m
nras/article/509/3/3966/6378289 by guest on 26 May 2022
mages of a random sample of galaxies drawn from the 1000 cross-lassified galaxies with the largest increase in ‘featured’ fraction. Inll of these galaxies (and for a clear majority of galaxies in similaramples), volunteers are correctly recognizing newly visible detailedeatures.
We observe a similar pattern in the vote fractions of spiral armsnd bars for featured galaxies. For galaxies consistently consideredeatured (i.e. where both projects reported a ‘featured’ vote fractionf at least 0.5), the median vote fraction for spiral arms increasedrom 0.84 to 0.9, and for bars from 0.21 to 0.24. This suggests thatven for galaxies where some details were already visible (and henceere considered featured), impro v ed imaging makes our volunteersore likely to identify specific features. We argue the impro v ed depth of DECaLS ( r = 23.6 versus r =
2.2 for SDSS) is revealing low surface brightness features that werereviously ambiguous. There may also be contributions from theodified image processing approach and from the shift between
sing gri bands (SDSS) to grz bands (DECaLS), which might makelder stars more prominent. Comparing classifications made using the same possible answers
n the same galaxies shows how impro v ed DECaLS imaging leads tombiguous galaxies being correctly reported as more featured, and topiral arms and bars being reported with more confidence. Ho we ver,olunteers are also sensitive to which questions are asked and howhose questions are asked. We measure the impact of our changes tohe decision tree ‘Bar’ question for GZD-5 in the next section.
.2 Impro v ed weak bar detection from GZD-5 decision tree
o measure the effect of the new decision tree on bar sensitivity,e compare the classifications made using each tree against expert
lassifications. Nair & Abraham ( 2010 ; hereafter NA10 ) classifiedll 14 034 SDSS DR4 galaxies at 0.01 < z < 0.05 with g < 16.f those, 1497 were imaged by DECaLS DR1/2 and classified byolunteers during GZD-1/2. We re-classified these galaxies duringZD-5 to measure the effect of the new bar answers, as compared
o the expert classifications of NA10 . Note that because NA10 usedhallower SDSS images, NA10 ’s classifications are best used asositi ve e vidence; while NA10 finding a bar in SDSS images implies visible bar in DECaLS images, NA10 not finding a bar may notl w ays exclude a visible bar in DECaLS. To exclude smooth galaxies,hich are unbarred by definition in our schema, we require f featured
0.25 (as measured by GZD-5), selecting a featured sample of 807alaxies classified by NA10 , GZD-1/2, and GZD-5.
Fig. 7 compares volunteer classifications for expert-labelledalibration galaxies made using each tree. We find that barrednd unbarred galaxies are significantly better separated with thetrong/Weak/None answers than with Yes/No answers. Of 220 Nair-
dentified bars (of any type), 184 (84 per cent) receive a majorityote for being barred by volunteers using the new tree, up from 12055 per cent) with the previous tree.
NA10 classified barred galaxies into five subtypes: Strong, Inter-ediate, Weak, Nuclear, Ansae, and Peanut (plus None, implicitly).e can use the first three subtypes as a measurement of expert-
lassified bar strength, and therefore e v aluate ho w our volunteersespond to bars of different strengths. Following the approach toefining summary metrics of Masters et al. ( 2019 ), we summarizehe bar vote fractions into a single volunteer estimate of bar strength, vol = f strong + 0.5 f weak , and compare the distribution of B for eachxpert-classified bar strength (Fig. 8 ). We find that the volunteerar strength estimates increase smoothly with expert-classified bartrength, though individual galaxies vary substantially. This suggests
Galaxy Zoo DECaLS data release 3973
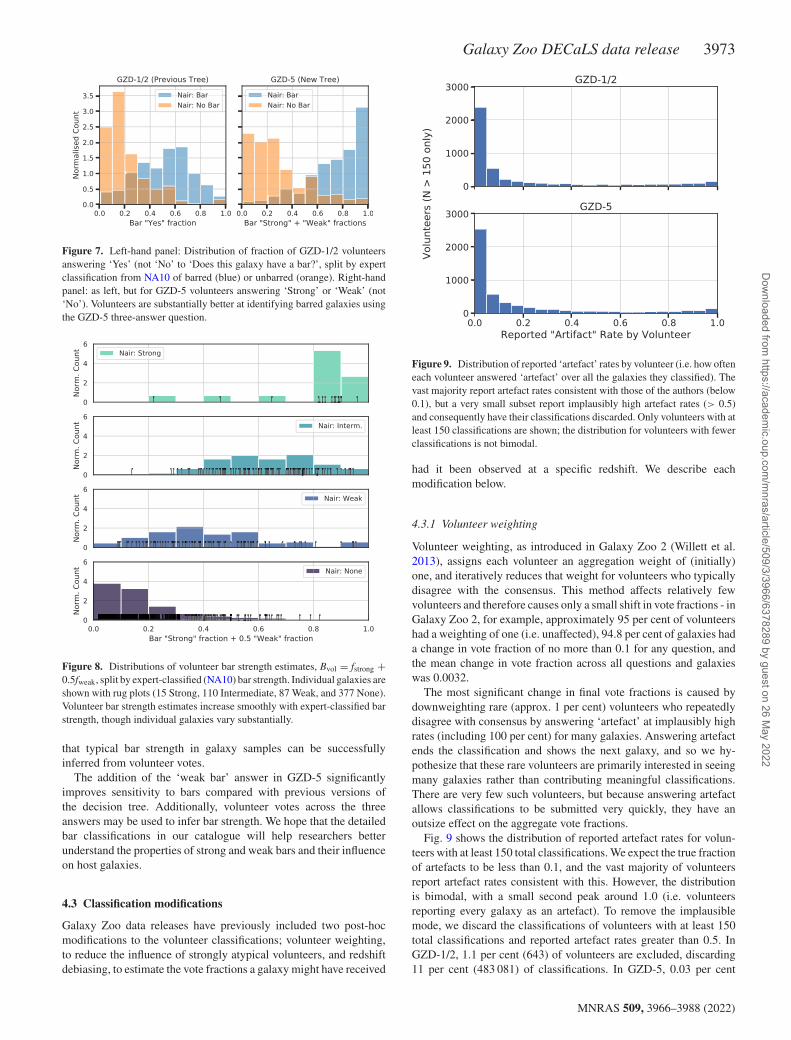
Figure 7. Left-hand panel: Distribution of fraction of GZD-1/2 volunteers answering ‘Yes’ (not ‘No’ to ‘Does this galaxy have a bar?’, split by expert classification from NA10 of barred (blue) or unbarred (orange). Right-hand panel: as left, but for GZD-5 volunteers answering ‘Strong’ or ‘Weak’ (not ‘No’). Volunteers are substantially better at identifying barred galaxies using the GZD-5 three-answer question.
Figure 8. Distributions of volunteer bar strength estimates, B vol = f strong +
0.5 f weak , split by expert-classified ( NA10 ) bar strength. Individual galaxies are shown with rug plots (15 Strong, 110 Intermediate, 87 Weak, and 377 None). Volunteer bar strength estimates increase smoothly with expert-classified bar strength, though individual galaxies vary substantially.
ti
i
ta
buo
4
Gmtd
Figure 9. Distribution of reported ‘artefact’ rates by volunteer (i.e. how often each volunteer answered ‘artefact’ o v er all the galaxies they classified). The vast majority report artefact rates consistent with those of the authors (below
0.1), but a very small subset report implausibly high artefact rates ( > 0.5) and consequently have their classifications discarded. Only volunteers with at least 150 classifications are shown; the distribution for volunteers with fewer classifications is not bimodal.
h
m
4
V
2od
v
G
h
a
t
w
ddre
pmT
ao
t
o
r
i
r
m
tG1
Dow
nloaded from https://academ
ic.oup.com/m
nras/article/509/3/3966/6378289 by guest on 26 May 2022
hat typical bar strength in galaxy samples can be successfully nferred from volunteer votes.
The addition of the ‘weak bar’ answer in GZD-5 significantly mpro v es sensitivity to bars compared with previous versions ofhe decision tree. Additionally, volunteer votes across the three nswers may be used to infer bar strength. We hope that the detailedar classifications in our catalogue will help researchers better nderstand the properties of strong and weak bars and their influence n host galaxies.
.3 Classification modifications
alaxy Zoo data releases have previously included two post-hoc odifications to the volunteer classifications; volunteer weighting,
o reduce the influence of strongly atypical volunteers, and redshift ebiasing, to estimate the vote fractions a galaxy might hav e receiv ed
ad it been observed at a specific redshift. We describe eachodification below.
.3.1 Volunteer weighting
olunteer weighting, as introduced in Galaxy Zoo 2 (Willett et al.013 ), assigns each volunteer an aggregation weight of (initially) ne, and iteratively reduces that weight for volunteers who typically isagree with the consensus. This method af fects relati vely fe wolunteers and therefore causes only a small shift in vote fractions - inalaxy Zoo 2, for example, approximately 95 per cent of volunteersad a weighting of one (i.e. unaffected), 94.8 per cent of galaxies had change in vote fraction of no more than 0.1 for any question, andhe mean change in vote fraction across all questions and galaxiesas 0.0032. The most significant change in final vote fractions is caused by
ownweighting rare (approx. 1 per cent) volunteers who repeatedly isagree with consensus by answering ‘artefact’ at implausibly high ates (including 100 per cent) for many galaxies. Answering artefact nds the classification and shows the next galaxy, and so we hy-othesize that these rare volunteers are primarily interested in seeing any galaxies rather than contributing meaningful classifications. here are very few such v olunteers, b ut because answering artefactllows classifications to be submitted very quickly, they have an utsize effect on the aggregate vote fractions. Fig. 9 shows the distribution of reported artefact rates for volun-
eers with at least 150 total classifications. We expect the true fractionf artefacts to be less than 0.1, and the vast majority of volunteerseport artefact rates consistent with this. Ho we ver, the distributions bimodal, with a small second peak around 1.0 (i.e. volunteerseporting every galaxy as an artefact). To remo v e the implausibleode, we discard the classifications of volunteers with at least 150
otal classifications and reported artefact rates greater than 0.5. In ZD-1/2, 1.1 per cent (643) of volunteers are excluded, discarding 1 per cent (483 081) of classifications. In GZD-5, 0.03 per cent
MNRAS 509, 3966–3988 (2022)

3974 M. Walmsley et al.
(
c
u
p
(
S
t
4
G
m
t
(
m
a
a
i
r
t
p
r
0
o
l
f
o
o
f
o
a
b
t
F
g
q
a
p
f
n
h
s
W
C
n
f
d
t
a
w
i
(
t
a
g
(
Figure 10. Number of GZD-5 galaxies with f > 0.5 for each of the questions debiased using the method described in Section 4.3.2. The solid lines indicate the original vote fractions and the dashed lines indicate the debiased vote fractions. The total sample here is composed of galaxies in the luminosity- limited sample with f > 0.5, 58 916 galaxies. For most questions and answers, debiasing successfully flattens the redshift trends. For ‘Smooth or Featured’ and ‘Bulge Prominence’, redshift debiasing o v ercorrects.
w
‘
A
l
a
e
f
‘
r
c
c
r
w
w
u
a
i
t
m
u
c
e
c
c
t
b
M
Dow
nloaded from https://academ
ic.oup.com/m
nras/article/509/3/3966/6378289 by guest on 26 May 2022
543) volunteers are excluded, discarding 5.3 per cent (249 592) oflassifications.
We investigated the possibility of other groups of atypical vol-nteers giving similar answers across questions by analysing theer -user v ote fractions with either a 2D visualization using UMAPMcInnes, Healy & Melville 2018 ) or with clustering using HDB-CAN (McInnes, Healy & Astels 2017 ). We find no strong evidence
hat such clusters exist.
.3.2 Redshift debiasing
alaxies at higher redshifts appear fainter and smaller on the sky,aking it harder to detect detailed morphological features than if
he galaxy were closer. This creates a bias in visual classificationswhether human or automated) where galaxies of the same intrinsicorphology are less likely to be classified as having detailed features
s redshift increases (Bamford et al. 2009 ). Redshift debiasing is anttempt to mitigate this bias by estimating how a galaxy would appearf it were at a fixed low redshift (here, z = 0.02).
We use the method described in Hart et al. ( 2016 ) to remo v e theedshift bias, which we briefly summarize here and refer the readero their Section 3 for full details. We assume the morphologicalroperties of galaxies (as probed by our decision tree) o v er theedshift window co v ered by Galaxy Zoo DECaLS (0.02 < z <
.15, approximately 1.5 Gyr) do not evolve significantly for galaxiesf similar intrinsic brightness and physical size, and so, for auminosity-limited sample, any change we observe to the voteraction distribution as a function of redshift is purely a consequencef imaging. If so, we can estimate the vote fractions which would bebserved if each galaxy were at low redshift by modifying the voteractions of higher redshift galaxies such that they have the same v erall distribution as their low-redshift counterparts in brightnessnd size.
We base the debiasing on a luminosity-limited sample, selectedetween 0.02 < z < 0.15 and −21.5 > M r > −23. We considerhe galaxies with at least 30 votes for the first question (‘Smooth oreatured’) after volunteer weighting (abo v e), for a total of 87 617alaxies in GZD-1/2 and 58 916 galaxies in GZD-5. For eachuestion, separately, we define a subset of galaxies to which wepply the debiasing procedure.
Each subset is defined using a cut of f > 0.5 for the chain ofreceding questions (for example, for the bar question, we require feat × f notedge-on > 0.5). A further cut of N > 5 (where N is theumber of classifications) is also imposed to ensure that each galaxyas been classified by a significant number of people. We bin theubset of galaxies by M r , log ( R 50 ) and z for each answer in turn.e use the voronoi 2d binning package from Cappellari &opin ( 2003 ) to ensure the bins will have an approximately equalumber of galaxies (with a minimum of 50). We then match voteraction distributions on a bin-by-bin basis, such that the cumulativeistrib ution of v ote fractions at each redshift is shifted to be similaro that of the lowest redshift sample (0.02 < z < 0.03). This methodims to keep the fraction of galaxies abo v e a given threshold constantith redshift. The effect of redshift bias and redshift debiasing question is shown
n Fig. 10 . To illustrate, consider the ‘Smooth or Featured’ questiontop left-hand panel). In a luminosity-limited sample, there should behe same fraction of galaxies with features (selected with f feat > 0.5)t all redshifts. Ho we v er, we observ e that the fraction of ‘featured’alaxies decreases, and the fraction of ‘smooth’ galaxies increasessolid lines). We attribute this to redshift bias; some galaxies that
NRAS 509, 3966–3988 (2022)
ould be considered featured if imaged at low redshift appear asfuzzy blobs’ at high redshift and are instead classified as smooth.fter applying redshift debiasing, the debiased fractions (dashed
ines) change more gradually with redshift. For most questions andnswers, the redshift trend is successfully flattened (recall that forvery size and luminosity bin, we enforce no change in the voteraction distribution with redshift). For ‘Smooth or Featured’ andBulge Prominence’, the debiasing procedure o v ercorrects and henceeverses the redshift trend.
For statistical studies, it is important to test for the presence of alassification bias with redshift and correct it where necessary. Such aorrection has pro v en essential in studies of the morphology densityelation (Bamford et al. 2009 ) and when characterizing populationsith different spiral arm properties (Hart et al. 2016 ). Ho we ver,hile debiasing can be extremely useful, there are caveats to itssage. It is sometimes helpful to think of the original classificationss a lower limit to the probability of features of a given type existingn a galaxy. Debiasing predicts what the classifications would be ifhe same galaxy were imaged at lower redshift, which is typically
ore featured than the original classifications. There is substantialncertainty in this prediction, ho we ver, and this is currently notaptured by the debiased vote fractions, which are reported withoutrror bars.
In some investigations, it may be helpful to consider that the truelassification for a given galaxy is likely to be in between the originallassification and the debiased classification. At the same time,he debiased classifications are not strictly upper limits. They areased on the lowest redshift classifications within the data set itself,

Galaxy Zoo DECaLS data release 3975
w
dc
ah
g
tmm
t
crm
m
5
Ct
tDasee–
ofrsg
rdGo
w
u
q
srnw
a
2
rh
fe
w
d
5
W
h
e
rm
L
w
(
(
a
f
l
q
h
p
Ba
m
L
wt
w
w
a
L
w
twb
L
t
c2
2
Z
e
eBs
(al
msndbbebm
h
p
Dow
nloaded from https://academ
ic.oup.com/m
nras/article/509/3/3966/6378289 by guest on 26 May 2022
hich themselves are at a non-zero redshift, and so there are likelyifferences in the debiased classifications and the ‘true’ debiased lassification that would be assigned if we could image the galaxy atrbitrarily low redshift. As these corrections are applied uniformly, o we v er, the y are useful when considering o v erall populations ofalaxies within a given data set and o v er the redshift ranges wherehe correction is rele v ant. In particular, when comparing different
orphological types, some of the systematic errors in the debiasing ay cancel out. Uncertainties in the debiasing will also decrease as
he sample size increases. For these reasons, we strongly suggest that users of the debiased
lassifications only use them to consider populations of galaxies ather than individual or small samples, and to consider that there ay still be some residual trends and uncertainties that are hard toodel with current methods.
AU TO MA TED CLASSIFICA T I O N S
ombining citizen science with automated classification allows us o do better science than with either alone. The clearest benefit ishat automated classification scales well with sample size. For GZ
ECaLS, classifying all 311 488 suitable galaxies using volunteers lone is infeasible; collecting 40 classifications per galaxy, the tandard from previous Galaxy Zoo projects, would take around ight years without further promotion efforts – by which time we xpect new surveys to start. Automated classification also evolves as the quality of our models impro v es, so too will the quality
f our classifications. And automated classification is replicable rom scratch without requiring a crowd – other researchers may un our open-source code and reco v er our classifications (within tochasticity), or create equi v alent classifications for ne wly imaged alaxies.
Finally, and of particular rele v ance to researchers using this dataelease, automated classification allows us to retroactively update the ecision tree. Because our classifier learns to make predictions from
ZD-5 classifications, using the impro v ed tree with better detection f mergers and weak bars, we can then predict what our volunteersould have said for the GZD-1 and GZD-2 galaxies had we beensing the impro v ed tree at that time. Our specific automated classification approach offers several
ualitativ e benefits o v er previous work. First, through careful con-ideration of uncertainty, we can both learn from uncertain volunteer esponses and predict posteriors (rather than point estimates) for ew galaxies. Secondly, by predicting the answers to every question ith a single model (similarly to Dieleman, Willett & Dambre 2015 ,
nd unlike more recent work e.g. S anchez et al. 2018 ; Khan et al.019 ; Walmsley et al. 2020 ), we improve performance by sharingepresentations between tasks (Caruana 1997 ) – intuiti vely, kno wing ow to recognize spiral arms can also help you count them. Learningrom every galaxy to predict every answer uses our valuable volunteer f fort as ef ficiently as possible. This is particularly ef fecti ve becausee aim to predict detailed morphology, and hence learn to create aetailed representation of each galaxy.
.1 Bayesian deep learning classifier
e require a model which can:
(i) Learn efficiently from volunteer responses of varying (i.e. eteroskedastic) uncertainty. (ii) Predict posteriors for those responses on new galaxies, for
very question.
In previous work (Walmsley et al. 2020 ), we modelled volunteeresponses as being binomially distributed and trained our model to ak e maximum-lik elihood estimates using the loss function
= k log f w ( x) + ( N − k) log (1 − f w ( x)) , (4)
here for some target question, k is the number of responsessuccesses) of some target answer, N is the total number of responsestrials) to all answers, and f w ( x) = ˆ ρ is the predicted probability of volunteer giving that answer.
This Binomial assumption, while broadly successful, broke down or galaxies with vote fractions k
N close to 0 or 1, where the Binomial
ikelihood is extremely sensitive to f w ( x ), and for galaxies where theuestion asked was not appropriate (e.g. predict if a featureless galaxyas a bar). Instead, in this work, the model predicts a distribution ( ρ| f w ( x )) and ρ is then drawn from that distribution. For binary questions, one could parametrize p ( ρ| f w ( x )) with the
eta distribution (being flexible and defined on the unit interval), nd predict the Beta distribution parameters f w ( x) = ( α, ˆ β) byinimizing
=
∫ Bin ( k| ρ, N ) Beta ( ρ| α, β)d αd β, (5)
here the Binomial and Beta distributions are conjugate and hence his integral can be e v aluated analytically.
In practice, we would like to predict the responses to questionsith more than two answers, and hence we replace each distributionith its multi v ariate counterpart; Beta( ρ| α, β) with Dirichlet( � ρ| � α),
nd Binomial( k | ρ, N ) with Multinomial( � k | � ρ, N ).
q =
∫ Multi ( k | ρ, N ) Dirichlet ( ρ| α)d α, (6)
here � k , � ρ, and � α are now all vectors with one element per answer. The Dirichlet-Multinomial distribution is much more flexible than
he Binomial, allowing our model to express uncertainty through ider posteriors and confidence through narrower posteriors. We elieve this is a novel approach. For the base architecture, we use the EfficientNet B0 model (Tan &
e 2019 ). The EfficientNet family of models includes several archi-ectural advances o v er the standard convolutional neural network ar-hitectures commonly used within astrophysics (e.g. Dieleman et al. 015 ; Huertas-Company et al. 2015 ; Khan et al. 2019 ; Cheng et al.020 ; Ferreira et al. 2020 ), including auto-ML-derived structure (He,hao & Chu 2019 ; Tan et al. 2019 ), depthwise convolutions (Howardt al. 2017 ), bottleneck layers (Iandola et al. 2017 ), and squeeze-and-xcitation optimization (Hu, Shen & Sun 2018 ). The EfficientNet 0 model was identified using multi-objective neural architecture
earch (Tan et al. 2019 ), optimizing for both accuracy and FLOPSi.e. computational cost of prediction). This balancing of accuracy nd FLOPS is particularly useful for astrophysics researchers with imited access to GPU resources, leading to a model capable of
aking reliable predictions on hundreds of millions of galaxies. In hort, the architecture is similar to traditional convolutional neural etworks, being composed of a series of convolutional blocks of ecreasing resolution and increasing channels. Each convolutional lock uses mobile inverted bottleneck convolutions following Mo- ileNetV2 (Sandler et al. 2018 ), which combine computationally fficient depthwise convolutions with residual connections between ottlenecks (as opposed to residual connections between blocks with any channels, as in e.g. ResNet; He et al. 2016 ). EfficientNet B0
as 5.3 million parameters. We modify the final EfficientNet B0 layer output units to give
redictions smoothly between 1 and 100 (using softmax acti v ation),
MNRAS 509, 3966–3988 (2022)

3976 M. Walmsley et al.
w
1
a
e
o
g
e
t
t
c
q
o
w
p
a
l
w
v
c
α
c
r
w
l
e
fi
w
g
G
f
b
n
i
u
t
c
p
r
w
p
a
a
c
t
w
W
T
W
3
t
p
w
a
t
a
c
t
f
π
F
p
p
o
(
t
e
u
/
5
O
e
a
a
(
o
o
m
v
b
c
(
oc
m
w
t
f
a
0
s
g
9
r
m
q
d
f
(
a
a
w
p
f
o
p
15 Corresponding to the typical ‘full’ retirement limit of approximately 40 classifications before discarding implausible classifications, see Section 4.3.1.
M
Dow
nloaded from https://academ
ic.oup.com/m
nras/article/509/3/3966/6378289 by guest on 26 May 2022
hich is appropriate for Dirichlet parameters � α. � α elements below can lead to bimodal ‘horseshoe’ posteriors, and � α elements abo v epproximately 100 can lead to extremely confident predictions inxtreme ρ, both of which are implausible for galaxy morphol-gy posteriors. These constraints may cause the most extremealaxies to have predicted vote fractions which are slightly lessxtreme than volunteers would record, but we do not anticipatehis to affect practical use; whether a galaxy is extremely likelyo have a bar or merely highly likely is rarely of scientificonsequence.
We w ould lik e our single model to predict the answer to everyuestion in the Galaxy Zoo tree. To do this, our architecture uses oneutput unit per answer (i.e. for 13 questions with a total of 20 answers,e use 20 output units). We calculate the (ne gativ e log) likelihooder question (equation 6), and then, treating the errors in the model’snswers to each question as independent events, calculate the totaloss as
log L =
∑
q
L q
(k q , N q , f w q
), (7)
here for question q , N q is the total answers, � k q is the observedotes for each answer, and � f w q is the values of the output unitsorresponding to those answers (which we interpret as the Dirichlet
� parameters in equation 6). We train our model using the GZD-5 volunteer classifications. Be-
ause the training set includes both active-learning-selected galaxieseceiving at least 40 classifications and the remaining GZD-5 galaxiesith around 5 classifications, it is crucial that the model is able to
earn efficiently from labels of varying uncertainty. Unlike Walmsleyt al. ( 2020 ), which trained one model per question and needed tolter galaxies where that question asked may not be appropriate,e can predict answers to all questions and learn from all labelledalaxies.
We train or e v aluate our models using the 249 581 (98.5 per cent)ZD-5 galaxies with at least three volunteer classifications. Learning
rom galaxies with even fewer (one or two) classifications shoulde possible in principle, but we do not attempt it here as we doot expect galaxies with so few classifications to be significantlynformative. The Dirichlet concentrations (distribution parameters)sed to calculate our metrics are predicted by three identicallyrained models, each making 5 forward passes with random dropoutonfigurations and augmentations. We ensemble all 15 forwardasses by simply taking the mean posterior given the total votesecorded, which may be interpreted as the posterior of an equally-eighted mixture of Dirichlet-Multinomial distributions. This meanosterior can then be used to calculate credible intervals (error bars)nd in standard statistical analyses. We develop our approach using conventional 80/20 train-test split, and make a new split beforealculating the final metrics reported here.
For the published automated classifications, where we aim simplyo make the best predictions possible rather than to test performance,e train on all 249 581 galaxies with at least 3 votes (98.5 per cent).e also train five rather then three models to maximize performance.
raining each model on an NVIDIA V100 GPU takes around 24 h.e then make predictions (using the updated GZD-5 schema) on all
13 789 galaxies in all campaigns. Each prediction (forward pass)akes approx. 6 ms, equating to approx. 160 ms for each publishedosterior. Starting from the galaxy images shown to volunteers (Section 2.3),
e take an average over channels to remove colour information and v oid biasing our morphology predictions (Walmsley et al. 2020 ),
NRAS 509, 3966–3988 (2022)
hen resize and save the images as 300 ×300 ×1 matrices. We thenpply random augmentations when loading each image into memory,reating a unique randomly modified image to be used as input tohe network. We first apply random horizontal and vertical flips,ollowed by an aliased rotation by a random angle in the range (0,), with missing pixels being filled by reflection on the boundaries.inally, we crop the image about a random centroid to 224 ×224ixels, ef fecti vely zooming in slightly towards a random off-centreoint. We also apply these augmentations at test time to marginalizeur posteriors o v er an y unlearned variance. We train using the AdamKingma & Ba 2015 ) optimizer and a batch size of 128. We endraining once the model loss fails to impro v e for 10 consecutivepochs.
Code for our deep learning classifier, including e xtensiv e doc-mentation and several w ork ed examples, is available at https:/github.com/mwalmsley/zoobot.
.2 Results
ur model successfully predicts posteriors for v olunteer v otes toach question. We show example posteriors for a question with twonswers, ‘Does this galaxy have spiral arms’ (Yes/No), in Fig. 11 ,nd a question with three answers, ‘Does this galaxy have a bar’Strong/Weak/None), in Fig. 12 . In Appendix A, we provide a galleryf the galaxies with the highest expected vote fractions for a selectionf answers, to visually demonstrate the quality of the most confidentachine classifications. To aid intuition for the typical performance, we reduce both the
ote fraction labels and the posteriors down to discrete classificationsy rounding the vote fractions and mean posteriors to 0 or 1, andalculate classification metrics (Table 1 ) and confusion matricesFig. 13 ). Here and throughout this section, we calculate performancen the 11 346 galaxies in the (random) test set with at least 34 15
lassifications (such that the typical volunteer answer is well-easured). To remo v e galaxies for which the question is not rele v ant,e only count galaxies where at least half the volunteers were asked
hat question. We report two sets of classification metrics; metricsor all (rele v ant) g alaxies, and only for g alaxies where the volunteersre confident (defined as having a vote fraction for one answer abo v e.8, following Dom ınguez S anchez et al. 2019 ). The performance on confident galaxies is useful to mea-
ure because such galaxies have a clear correct label. For suchalaxies, performance is near-perfect; we achieve better than9 per cent accuracy for most questions, with the lowest accu-acy (for spiral arm count) being 98.6 per cent. The confusionatrices reflect this, showing little notable confusion for any
uestion. Reported performance on all galaxies will be lower than on confi-
ent galaxies as the correct labels are uncertain. Our measured voteractions are approximations of the theoretical ‘true’ vote fractionsas we cannot ask infinitely many volunteers), and many galaxiesre genuinely ambiguous and do not have a meaningful ‘correct’nswer. No classifier should achieve perfect accuracy on galaxieshere the volunteers themselves are not confident. None the less,erformance is more than sufficient for scientific use; accuracy rangesrom 77.4 per cent (spiral arm count) to 98.7 per cent (disc edgen). We observe some moderate confusion between similar answers,articularly between No or Weak bar, Moderate or Large bulges, and

Galaxy Zoo DECaLS data release 3977
Figure 11. Posteriors for ‘Does this galaxy have spiral arms?’, split by ensemble model (bold colours) and, within each model, dropout forward passes (faded colours). The number of volunteers answering ‘Yes’ (not known to classifier) is shown with a black dashed line. Galaxies are selected at random from the test set, provided the spiral question is rele v ant (defined as a vote fraction of 0.5 or more to the preceding answer, ‘Featured’). The image presented to volunteers is shown to the right. The model input is a cropped, downsized, gre yscale v ersion (Section 5.1). The Dirichlet-Multinomial pos- teriors are strictly only defined at integer votes; for visualization only, we show the -generalized posteriors between integer votes.
T
ttTotteTp
m
Figure 12. Posteriors for ‘Does this galaxy have a bar?’, for the same random
galaxies selected in Fig. 11 . Each point is coloured by the predicted probability of volunteers giving that many ‘Strong’, ‘Weak’, and (implicitly, as the total answers is fixed) ‘None’ votes. The volunteer answer (not known to classifier) is circled. For clarity, only the mean posterior across all models and dropout forward passes is shown.
ttf4p
fn
(
o
t
t
b
3o
v
Dow
nloaded from https://academ
ic.oup.com/m
nras/article/509/3/3966/6378289 by guest on 26 May 2022
wo or Three spiral arms, which matches our intuition for the answershat volunteers might confuse and so likely reflects ambiguity in the raining data. More surprisingly, there is also confusion between wo spiral arms and Can’t Tell. Fig. 14 shows random examples f spirals where the most common volunteer answer was Two, but he classifier predicted Can’t Tell, and vice versa. In both cases, he galaxies generally have diffuse or otherwise subtle spiral arms mbedded in a bright disc, confusing both human and machine. his highlights the difficulty in using classification metrics to assess erformance on ambiguous galaxies. We can mitigate the ambiguity in classifications of galaxies by easuring regression metrics on the vote fractions, without rounding
o discrete classifications. Fig. 15 shows the mean deviations between he model predictions (mean posteriors) and the observed vote ractions, by question, for test set galaxies with approximately 0 volunteer responses. Performance is again excellent, with the redictions typically well within 10 per cent of the observed voteractions. Predicting spiral arm count is relatively challenging, as oted abo v e. Predicting answers to the ‘Merger’ question of ‘None’i.e. not a merger) is also challenging, perhaps because of the rarityf counter-examples. The v olunteer v ote fractions against which we compare our predic-
ions are themselves uncertain for most galaxies. We aim to predicthe true vote fraction, i.e. the vote fraction from lim N → ∞
volunteers,ut we only know the vote fraction from N volunteers. Ho we ver,87 pre-active-learning galaxies were erroneously uploaded twice r more, and so received more than 75 classifications each. Theote fractions for these N > 75 galaxies will be very similar to the
MNRAS 509, 3966–3988 (2022)

3978 M. Walmsley et al.
Table 1. Classification metrics on all galaxies (abo v e) or on galaxies where volunteers are confident for that question (i.e. where one answer has a vote fraction abo v e 0.8). Multiclass precision, recall, and F1 scores are weighted by the number of true galaxies for each answer. Classifications on confident galaxies are near-perfect.
Question Count Accuracy Precision Recall F1
(a) Classification metrics for all galaxies Smooth or featured 11346 0 .9352 0 .9363 0 .9352 0 .9356 Disc edge on 3803 0 .9871 0 .9871 0 .9871 0 .9871 Has spiral arms 2859 0 .9349 0 .9364 0 .9349 0 .9356 Bar 2859 0 .8185 0 .8095 0 .8185 0 .8110 Bulge size 2859 0 .8419 0 .8405 0 .8419 0 .8409 How rounded 6805 0 .9314 0 .9313 0 .9314 0 .9313 Edge on bulge 506 0 .9111 0 .9134 0 .9111 0 .8996 Spiral winding 1997 0 .7832 0 .8041 0 .7832 0 .7874 Spiral arm count 1997 0 .7742 0 .7555 0 .7742 0 .7560 Merging 11346 0 .8798 0 .8672 0 .8798 0 .8511
(b) Classification metrics for galaxies where volunteers are confident Smooth or featured 3495 0 .9997 0 .9997 0 .9997 0 .9997 Disc edge on 3480 0 .9980 0 .9980 0 .9980 0 .9980 Has spiral arms 2024 0 .9921 0 .9933 0 .9921 0 .9924 Bar 543 0 .9945 0 .9964 0 .9945 0 .9951 Bulge size 237 1 .0000 1 .0000 1 .0000 1 .0000 How rounded 3774 0 .9968 0 .9968 0 .9968 0 .9968 Edge on bulge 258 0 .9961 0 .9961 0 .9961 0 .9961 Spiral winding 213 0 .9906 1 .0000 0 .9906 0 .9953 Spiral arm count 659 0 .9863 0 .9891 0 .9863 0 .9871 Merging 3108 0 .9987 0 .9987 0 .9987 0 .9987
l
t
W
N
b
–
t
n
e
g
a
q
a
t
1
u
o
e
c
a
t
U
(
g
g
o
v
p
1
Figure 13. Confusion matrices for each question, made on the test set of 49 700 randomly selected galaxies with at least three volunteer votes. Discrete classifications are made by rounding the vote fraction (label) and mean posterior (prediction) to the nearest integer. The matrices then show
the counts of rounded predictions ( x -axis) against rounded labels (y axis). We report confusion matrices for all 49 700 galaxies (left-hand panel) or only for galaxies where the volunteers are confident in that question, defined as having the vote fraction for one answer abo v e 0.8 (right-hand panel). Such
M
Dow
nloaded from https://academ
ic.oup.com/m
nras/article/509/3/3966/6378289 by guest on 26 May 2022
im N → ∞
true vote fraction limit, allowing us to accurately measurehe mean vote fraction error of our machine learning predictions.
e can also calculate the mean vote fraction error (versus the > 75 vote fractions) from asking fewer ( N << 75) volunteersy artificially truncating the number of votes collected, and askhow many volunteer responses to that question would we need
o have errors similar to that of our model? Note that the actualumber of volunteers needed to be shown that galaxy to achieve anqui v alent mean-squared error will be higher for questions only askediven certain previous answers (i.e. all but ‘Smooth or Featured?’nd ‘Merger?’), as some will give different answers to precedinguestions and so not be asked that question. Fig. 16 shows the modelnd volunteer mean errors for a representative selection of questions;he model predictions are as accurate as asking that question to around0 volunteers. 16
We can also measure if our posteriors correctly estimate thisncertainty. As a qualitative test, Fig. 17 shows a random selectionf galaxies binned by ‘Smooth or Featured’ vote fraction predictionntropy, measuring the model’s uncertainty. Prediction entropy isalculated as the (discrete) Shannon entropy
∑
ω p ( ω )log ( p ( ω )) o v erll possible combinations of votes ω, assuming 10 total votes forhis question (our results are robust to other choices of total votes).nusual, inclined or poorly scaled galaxies have highly uncertain
high entropy) votes, while smooth and especially clearly featuredalaxies have confident (low entropy) votes. The most uncertainalaxies (not shown) are so poorly scaled (due to incorrect estimationf the Petrosian radius in the NASA-Sloan Atlas) that they are barelyisible. These results match our intuition and demonstrate that ourosteriors provide meaningful uncertainties.
6 The model is, in this strict sense, slightly superhuman.
confident galaxies are expected to have a clearly correct label, making correct and incorrect predictions straightforward to measure but also making the classification task easier. Continued below.
NRAS 509, 3966–3988 (2022)

Galaxy Zoo DECaLS data release 3979
Figure 14. Random spiral galaxies where the classifier confuses the most likely volunteer vote for spiral arm count between ‘2’ and ‘Can’t Tell’. Abo v e: galaxies where the classifier predicted ‘2’ but more volunteers answered ‘Can’t Tell’. Below: vice versa, galaxies where the classifier predicted ‘Can’t Tell’ but more volunteers answered ‘2’. Red text shows the v olunteer (v ol.) and machine-learning-predicted (ML) v ote fractions for each answer. Counting the spiral arms is challenging, even for the authors. This highlights the difficulty in assessing performance by reducing the posteriors to classifications and then comparing against uncertain true labels.
f
Swwbesat
bt
a
w
(
2
O
u
cwHucs
u
a
a
o
Figure 15. Mean absolute deviations between the model predictions and the observed vote fractions, by question, for the test set galaxies with approximately 40 volunteer responses. The model is typically well within 10 per cent of the observed vote fractions.
w
f
h
o
oF
5fia
Gc
(
t
W
B
s
d
pf
Totc
Dow
nloaded from https://academ
ic.oup.com/m
nras/article/509/3/3966/6378289 by guest on 26 May 2022
More quantitatively, Fig. 18 shows the calibration of our posteriors or the two binary questions in GZD-5 – ‘Edge-on Disc’ and ‘Haspiral Arms’. A well-calibrated posterior dominated by data (i.e. here the prior has minimal effect) will include the measured value ithin any bounds as often as the total probability within those ounds. We calculate calibration by, for each galaxy, iterating through ach symmetric highest posterior density credible interval (i.e. tarting from the posterior peak and moving the bounds outwards) nd recording both the total probability inside the bounds and whether he recorded volunteer vote is inside the bounds. We then group (bin)y total probability and record the empirical frequency with which he votes lie within bounds of that total probability. In short, were checking if, for all X, the observed value (vote fraction) fallsithin X per cent of the posterior interval X per cent of the time
Cook, Gelman & Rubin 2006 ; Le v asseur, Hezaveh & Wechsler017 ). We find that calibration on these binary questions is excellent.ur classifier is correctly uncertain. The ultimate measure of success is whether our predictions are
seful for science. Masters et al. ( 2019 ; hereafter M19 ) used GZ2lassifications to investigate the relationship between bulge size and inding angle and found – contrary to a conventional view of the ubble sequence – no strong correlation. We repeat this analysis sing our (deeper) DECaLS data, using either volunteer or automated lassification, to check if the automated classifications lead to the ame science results as the volunteers.
Specifically, we select a clean sample of face-on spiral galaxies sing M19 ’s vote fraction cuts of f feat > 0.43, f not-edge − on > 0.715,nd f spiral-yes > 0.619. We also make a cut-off f merging = none > 0.5,nalogous to M19 ’s f odd cut, to remo v e galaxies with ongoing mergersr with otherwise disturbed features. For the volunteer vote fractions,
e can only use either GZD-1/2 or GZD-5 classifications, since theormer decision tree had three bulge size answers and the latterad five; we choose GZD-5 to benefit from the added precisionf additional answers. To a v oid selection effects (Section 6.2) wenly use galaxies classified prior to active learning being activated. or the automated classifications, we use a model trained on GZD- to predict GZD-5 decision tree vote fractions (including the ve bulge answers) for every GZ DECaLS galaxy (313,798). This llows us to expand our sample size from 5378 galaxies usingZD-5 volunteers only to 43 672 galaxies using our automated
lassifier. We calculate bulge size and spiral winding following equations
1) and (3) in M19 , trivially generalizing the bulge size calculationo allow for five bulge size answers:
avg = 0 . 5 f medium
+ 1 . 0 f tight (8)
avg = 0 . 25 f small + 0 . 5 f moderate + 0 . 75 f large + 1 . 0 f dominant . (9)
Both classification methods find no correlation between bulge ize and spiral winding, consistent with M19 . Fig. 19 shows theistrib ution of b ulge size against spiral winding using either volunteerredictions (fractions) or the deep learning predictions (expected ractions) for the sample of featured face-on galaxies selected abo v e.he distributions are indistinguishable, with the automated method ffering a substantially larger (approx. 8X) sample size. We hope his demonstrates the accuracy and scientific value of our automated lassifier.
MNRAS 509, 3966–3988 (2022)

3980 M. Walmsley et al.
Figure 16. Mean error on the true ( N > 75) vote fractions for either a truncated ( N = 0 to N = 20) number of volunteers (solid) or the automated classifier (dashed). Asking only a few volunteers gives a noisy estimate of the true vote fraction. Asking more volunteers reduces this noise. For some number of volunteers, the noise in the vote fraction is similar to the error of the automated classifier, meaning the y hav e a similar mean error versus the true vote fraction; this number is where the solid and dashed lines intersect. We find the automated classifier has a similar mean error to approx. 5 to 15 volunteers, depending on the question.
Figure 17. Galaxies binned by ‘Smooth or Featured’ vote prediction entropy, measuring the model’s uncertainty in the votes. Bins (columns) are equally spaced (boundaries noted abo v e). Fiv e random galaxies are shown per bin. Unusual, inclined, or poorly scaled galaxies have highly uncertain (high entropy) votes, while smooth and especially clearly featured galaxies have confident (low entropy) votes, matching our intuition and demonstrating that our posteriors provide meaningful uncertainties.
6
6
W
a
c
t
g
a
c
s
3
i
f
t
G
(
g
g
r
f
i
p
c
w
o
l
MNRAS 509, 3966–3988 (2022)
Dow
nloaded from https://academ
ic.oup.com/m
nras/article/509/3/3966/6378289 by guest on 26 May 2022
USAG E
.1 Catalogues
e release two volunteer catalogues and two automated catalogues,vailable at https:// doi.org/ 10.5281/ zenodo.4196266 . gz decals volunteers ab includes the volunteer classifi-
ations for 92 960 galaxies from GZD-1 and GZD-2. Classifica-ions are made using the GZD-1/2 decision tree (Fig. A1 ). Allalaxies received at least 40 classifications, and consequently havepproximately 30–40 after volunteer weighting (Section 4.3.1). Thisatalogue is ideal for researchers needing standard morphology mea-urements on a reasonably large sample, with minimal complexity.3 124 galaxies in this catalogue were also previously classifiedn GZ2; the GZD-1/2 classifications are better able to detect fainteatures due to deeper DECaLS imaging, and so should be preferred.gz decals volunteers c includes the volunteer classifica-
ions from GZD-5. Classifications are made using the impro v edZD-5 decision tree which adds more detail for bars and mergers
Section 4.2). This catalogue includes 253 286 galaxies, but eachalaxy does not have the same number of classifications. 59 337alaxies have at least 30 classifications (after denoizing), and theemainder have far fewer (approximately 5). The selection effectsor how many classifications each galaxy receives are detailed belown Section 6.2. This catalogue may be useful to researchers whorefer a larger sample than gz decals volunteers ab at theost of more uncertainty and the introduction of selection effects, orho need detailed bar or merger measurements for a small numberf galaxies. We use gz decals volunteers c to train our deepearning classifier.

Galaxy Zoo DECaLS data release 3981
Figure 18. Calibration curves for the two binary GZ DECaLS questions. The x -axis shows the credible interval width – for data-dominated posteriors, roughly (e.g.) 30 per cent of galaxies should have vote fractions within their 30 per cent credible interval. The y -axis shows what percentage actually do fall within each interval width. We split calibration by galaxies with few votes (and hence typically wider posteriors) and more votes (narrower posteriors). Only credible intervals with at least 100 measurements are shown. Calibration for both questions is excellent.
Figure 19. Distribution of bulge size versus spiral winding, using responses from volunteers (left-hand panel) or our automated predictions (right-hand panel). We observe no clear correlation between bulge size and spiral winding, consistent with M19 . The distributions are consistent between volunteers and our automated method. We hope this demonstrates the accuracy and scientific value of our automated classifier.
dtGgf
Figure 20. Confusion matrices, continued from abo v e. To a v oid the loss of information from rounding, we encourage researchers not to treat Galaxy Zoo classifications as discrete, and instead to use the full vote fractions or posteriors where possible.
t
r
a
i
v
Dow
nloaded from https://academ
ic.oup.com/m
nras/article/509/3/3966/6378289 by guest on 26 May 2022
The automated classifications are made using our Bayesian eep learning classifier, trained on gz decals volunteers c o predict the answers to the GZD-5 decision tree for all Z DECaLS galaxies (including those in GZD-1 and GZD-2). z decals auto posteriors contains the predicted posteriors
or each answer – specifically, the Dirichlet concentration parameters
hat encode the posteriors. We hope this catalogue will be helpful toesearchers analysing galaxies in Bayesian frameworks. gz decals auto fractions reduces those posteriors to the
utomated equi v alent of pre vious Galaxy Zoo data releases, contain-ng the expected vote fractions (mean posteriors). Note that not allote fractions are rele v ant for e very galaxy; we suggest assessing
MNRAS 509, 3966–3988 (2022)

3982 M. Walmsley et al.
r
b
c
c
e
l
s
n
c
a
i
6
T
g
s
a
f
c
G
s
a
w
B
N
W
w
p
s
i
s
1
c
t
5
S
w
t
6
u
(
c
r
g
r
u
t
6
T
f
a
d
l
b
u
t
u
t
w
o
c
i
m
e
w
a
c
t
o
S
a
f
c
s
m
i
i
h
(
s
c
v
F
a
t
7
W
D
c
m
i
t
f
t
s
a
t
c
n
e
e
v
T
o
c
i
d
f
(
b
a
M
Dow
nloaded from https://academ
ic.oup.com/m
nras/article/509/3/3966/6378289 by guest on 26 May 2022
ele v ance using the estimated fraction of volunteers that would haveeen asked each question, which we also include. We hope thisatalogue will be useful to researchers seeking detailed morphologylassifications on the largest possible sample, who might benefit fromrror bars but do not need full posteriors.
We also release Jupyter notebooks sho wing ho w to use each cata-ogue at ht tps://www.github.com/mwalmsley/zoobot . These demon-trate how to load and query each catalogue with pandas (McKin-ey 2010 ), and how to create callable posteriors from the Dirichletoncentration parameters.
The automated catalogues may be interactiv ely e xploredt ht tps://share.st reamlit.io/mwalmsley/galaxy-post er/gz decals mke walmsley.py .
.2 Selection effects for total classifications
he GZD-1/2 catalogue reports at least 40 classifications for allalaxies imaged by DECaLS DR1/2 and passing the appropriateelection cuts (Section 2.2). Additional classifications abo v e 40re assigned independently of the galaxy properties. The selectionunction for total classifications in the GZD-5 catalogue is moreomplex. In practice, if you require a strictly random sample ofZD-5 galaxies with more than five volunteer classifications, you
hould exclude galaxies where ‘random selection’ is False. You maylso consider using the posteriors from our deep learning classifier,hich are comparable across all GZ DECaLS galaxies (Section 5).elow, we describe the GZD-5 total classification selection effects. Early galaxies were initially uploaded ro w-by-ro w from the
ASA-Sloan Atlas, each (eventually) receiving 40 classifications.e also uploaded two additional subsets. For the first, 1355 galaxiesere targeted for classification to support an external researchroject. Of these, 1145 would have otherwise received five clas-ifications. These 1145 galaxies with additional classifications aredentified with the ‘targeted’ group and should be e xcluded. F or theecond, we reclassified the 1497 galaxies classified in both GZD-/2 and the Nair & Abraham ( 2010 ) expert visual morphologylassification catalogue to measure the effect of our new decisionree (results are shown in Section 4.2). Both the GZD-1/2 and GZD- classifications are reported in the respective catalogues (Section 6).imilarly to the targeted galaxies, 651 of these calibration galaxiesould have otherwise received five classifications, are identified with
he ‘calibration’ group, and should be excluded. We then implemented active learning (Section 3.1), prioritizing
939 galaxies from the remaining pool of 199 496 galaxies not yetploaded. The galaxies are identified with the groups ‘active priority’the galaxies identified as ‘most informative’ and selected for 40lassifications) and ‘active baseline’ (the remainder). For a strictlyandom selection, both groups should be excluded, leaving thealaxies classified prior to the introduction of active learning.
Finally, we note that 14 960 (5.9 per cent) of GZD-5 galaxieseceived more than 40 classifications due to being erroneouslyploaded more than once. The images are identical and so we reporthe aggregate classifications across all uploads of the same galaxy.
.3 Suggested usage of vote fractions
he most appropriate usage of the Galaxy Zoo DECaLS voteractions depends on the specific science case. Many galaxies havembiguous vote fractions (e.g. roughly similar vote fractions for bothisc and elliptical morphologies) because of observational limitationsike image resolution, or because the galaxy morphology is truly in-etween the available answers (perhaps because the galaxy has an
NRAS 509, 3966–3988 (2022)
nusual feature such as polar rings, Moiseev et al. 2011 , or becausehe galaxy is undergoing a morphological transition). To make bestse of such galaxies, we recommend that, where possible, readers usehe vote fractions as statistical weights in their analysis. For example,hen investigating the differences in the stellar mass distributionsf elliptical and disc galaxies, the disc (elliptical) vote fractionsan be used as weights when plotting the distributions, resultingn the galaxies with the highest vote fraction for disc (elliptical)orphology dominating the resulting distribution. This ensures that
ach galaxy contributes to the analysis, without excluding galaxiesith ambiguous vote fractions. For examples of using vote fractions
s weights, see Smethurst et al. ( 2015 ) and Masters et al. ( 2019 ). Using the vote fractions as weights is not appropriate for all science
ases. F or e xample, if galaxies of a particular morphology needo be isolated to form a sample for observ ational follo w-up (e.g. v erlapping pairs, see Keel et al. 2013 , and ‘bulgeless’ galaxies, seeimmons et al. 2017a ; Smethurst et al. 2019 ), or if the fraction of certain morphological type of galaxy is to be calculated (e.g. barraction, see Simmons et al. 2014 ). These science cases require aut on the appropriate vote fraction to be chosen. Ho we ver, readershould be aware that making cuts on the vote fractions is a crudeethod to identify galaxies of certain morphologies and will result
n an incomplete sample. Table 2 shows our suggested cuts for populations of common
nterest, based on visual inspection by the authors and chosen forigh specificity (low contamination) at the cost of low sensitivitycompleteness). We urge the reader to adjust these cuts to suit theensitivity and specificity of their science case, to add additionaluts to better select their desired population, and to make their ownisual inspection to verify the selected population is as intended.or a full analysis, we once again suggest the reader a v oid cuts byppropriately weighting ambiguous galaxies, or take advantage ofhe posteriors provided by our automated classifier.
DI SCUSSI ON
hat does a classification mean? The comparison of GZ2 and GZECaLS images (Fig. 6 ) highlights that our classifications aim to
haracterize the clear features of an image, and not what an expertight infer from that image. For example, volunteers might see an
mage of a galaxy that is broadly smooth, and so answer smooth, evenhough our astronomical understanding might suggest that the fainteatures around the galaxy core are likely indicative of spiral armshat would be revealed given deeper images. This situation occurs ineveral galaxies in Fig. 6 . These ‘raw’ classifications will be mostppropriate for researchers working on computer vision or on par-icularly low-redshift, well-resolved galaxies. The redshift-debiasedlassifications, which are ef fecti vely an estimate of galaxy featuresot clearly seen in the image, will be most appropriate for researchersspecially interested in fainter features or studying links between ourstimated intrinsic visual morphologies and other galaxy properties.
We showed in Section 4.2 that changing the answers available toolunteers significantly impro v es our ability to identify weak bars.his highlights that our classifications are only defined in the contextf the answers presented. One cannot straightforwardly comparelassifications made using different decision trees. Our scientificnterests and our understanding of volunteers both evolve, and so ourecision trees must also evolve to match them. However, only the lastew years of volunteer classifications will use the latest decision treebased on previous data releases), placing an upper limit on the num-er of galaxies with compatible classifications at any one time. Ourutomated classifier resolves this here by allowing us to retrospec-

Galaxy Zoo DECaLS data release 3983
Table 2. Suggested cuts for rough identification of galaxy populations, based on visual inspection by the authors. Q. votes is the minimum number of total votes for that question; for example, to identify strong bars, require at least 20 total votes to the question ‘Does this galaxy have a bar?’. This ensures enough votes to calculate reliable vote fractions. Assumes that all previous questions are filtered with the suggested cuts. For continuous measurements such as bulge size and spiral winding, we suggest combining all answers into a summary statistic like equation (8).
Population Approx. Cut Q. Votes Notes
Featured disc featured > 0 . 7 5 –Disc featured > 0 . 3 5 Will include featureless S0 Elliptical smooth > 0 . 7 5 –
Edge-on disc yes > 0 . 8 5 –Not edge-on disc yes < 0 . 3 5 –
Strong bar strong bar > 0 . 8 20 –Weak bar weak bar > 0 . 8 20 –Any bar strong bar + weak bar > 0 . 6 20 –
Spiral arms spiral arms > 0 . 6 20 –No spiral arms spiral arms < 0 . 3 20 Primarily ringed or irregular
Spiral count spiral count { n } > 0 . 75 30 One-armed spirals are often mergers
Round edge-on bulge edge-on bulge rounded > 0 . 6 10 –Boxy edge-on bulge edge-on bulge boxy > 0 . 3 10 Rare - visual inspection required No edge-on bulge edge-on bulge none > 0 . 5 10 –
Merger merger > 0 . 7 10 –Merger or o v erlap merger > 0 . 3 10 To remo v e o v erlaps, redshifts or inspection required. Post-merger major disturb. > 0 . 6 10 –Asymmetric or low surface brightness minor disturb. > 0 . 4 10 –
taGr
h
s
pioqe
&
e
psod
b
tcul
liL
un
e(io
p
(
e
c(
W
e
t
8
Wo
wiw
Cc
G
bm
G
s
t
mm
hlm
m
ft
af
Dow
nloaded from https://academ
ic.oup.com/m
nras/article/509/3/3966/6378289 by guest on 26 May 2022
ively apply the GZD-5 decision tree (with better weak bar detection, mong other changes) to galaxies only classified by volunteers in ZD-1 and GZD-2. This flexibility ensures that Galaxy Zoo will
emain able to answer the most pertinent research questions at scale. We have shown (5.2) that our automated classifier is generally
ighly accurate, well-calibrated, and leads to at least one equi v alentcience result. Ho we v er, we cannot e xclude the possibility of unex-ected systematic biases or of adversarial behaviour from particular mages. Avoiding subtle biases and detecting o v erconfidence on ut-of-distribution data remain open computer science research uestions, often driven by important terrestrial applications (Szegedy t al. 2014 ; Hendrycks & Gimpel 2017 ; Eykholt et al. 2018 ; Smith Gal 2018 ; Geirhos et al. 2019 ; Ren et al. 2019 ; Margalef-Bentabol
t al. 2020 ; Yang et al. 2020 ). Volunteers also have biases (e.g. a slightreference for recognizing left-handed spirals; Land et al. 2008 ) and truggle with images of an adversarial nature (e.g. confusing edge- n discs with cigar-shaped ellipticals), though these can often be isco v ered and resolv ed through discussion with the community andy adapting the website. We believe the future of morphology classification is in the
houghtful combination of volunteers and machine learning. Such ombinations will be more than just faster; they will be replicable, niform, error-bounded, and quick to adapt to new tasks. They will et us ask new questions – draw the spiral arms, select the barength, separate the merging galaxies pixelwise – which would be nfeasible with volunteers alone for all but the smallest samples (e.g. ingard et al. 2020 ). And they will find the interesting, unusual, andnexpected galaxies which challenge our understanding and inspire ew research directions. The best combination of volunteer and machine is unclear. Our
xperiment with activ e learning is one possible approach, but when compared to random selection) suffers from complexity to mplement, an unknown selection function, and no guarantee –r even clear final measurement of – an impro v ement in modelerformance. Many other approaches are suggested in astrophysics
Wright et al. 2017 ; Beck et al. 2018 ; Dickinson et al. 2019 ; Wrightt al. 2019 ; Lochner & Bassett 2020 ; Martin et al. 2020 ) and initizen science and human–computer interaction more broadly Chang, Amershi & Kamar 2017 ; Bansal et al. 2019 ; Liu et al. 2020 ; ilder , Horvitz & Kamar 2020 ). We will continue to search for and
xperiment with strategies to create the most ef fecti ve contributiono research by volunteers.
C O N C L U S I O N
e have presented Galaxy Zoo DECaLS; detailed galaxy morphol- gy classifications for 311 488 galaxies imaged by DECaLS DR5 andithin the SDSS DR11 footprint. The increased depth of DECaLS
maging allows us to better resolve faint morphological features than ith previous Galaxy Zoo data releases using SDSS imaging (Fig. 5 ).lassifications were collected from volunteers on the Zooniverse itizen science platform o v er three campaigns, GZD-1, GZD-2, andZD-5. GZD-5 used an impro v ed decision tree (Fig. 4 ) aimed atest exploiting the deeper DECaLS images to identify weak bars, ergers, and tidal features. All galaxies receive at least five volunteer classifications (Fig. 2 ).
alaxies in GZD-1 and GZD-2 receive at least 40. In GZD-5, twoubsets receive 40: a random subset and a subset of galaxies priori-ized as most likely to be informative for training machine learning
odels. These informative galaxies were identified following the ethod introduced by Walmsley et al. ( 2020 ) as the galaxies with the
ighest mutual information between model parameters and volunteer abels – intuitively, the galaxies on which several machine learning
odels confidently disagree. Volunteer classifications were then used to train deep learning odels to classify all galaxies. Our models are able to both learn
rom uncertain volunteer responses and predict full posteriors (rather han point estimates) for what volunteers would have said. This waschieved by interpreting the model predictions as the parameters or Dirichlet-Multinomial distributions and training to maximize
MNRAS 509, 3966–3988 (2022)

3984 M. Walmsley et al.
t
m
b
p
(
a
m
s
d
e
M
a
e
v
c
e
A
T
v
e
g
C
l
M
s
W
d
F
a
O
F
s
f
a
P
p
(
(
P
t
N
A
P
M
#
i
T
I
B
M
T
a
p
f
w
(
c
U
t
T
E
S
C
U
P
F
F
d
C
C
a
F
D
N
t
g
o
t
H
t
C
E
M
C
A
S
o
U
w
o
R
G
t
C
1
F
E
w
t
a
p
P
D
t
i
F
N
M
Dow
nloaded from https://academ
ic.oup.com/m
nras/article/509/3/3966/6378289 by guest on 26 May 2022
he corresponding likelihood (equation 6). We also approximatearginalizing o v er model weights (i.e. Bayesian deep learning)
y training an ensemble of 5 models where each model makesredictions with MC Dropout. The resulting ensemble is accurateFigs 13 , 15 , 16 , and 20 ) and well-calibrated (Fig. 18 ).
We release both volunteer and automated classification cataloguest data.galaxyzoo.org . The volunteer catalogues include the total andean volunteer responses for each question to each galaxy, and are
plit into the GZD-1/2 and GZD-5 campaigns (due to the modifiedecision tree). The automated catalogue includes predictions forvery galaxy in any campaign. We share the predicted Dirichlet-ultinomial parameters that encode the full posteriors as well
s the expected vote fractions that those posteriors imply. Thexpected vote fractions may used in a similar manner to previous olunteer -only data releases, while the posteriors support moreomplex statistical analyses. We also provide guidance and codexamples.
C K N OW L E D G E M E N T S
he data in this paper are the result of the efforts of the Galaxy Zooolunteers, without whom none of this work would be possible. Theirfforts are individually acknowledged at http://authors.galaxyzoo.or . We would also like to thank our volunteer translators; Mei-Yinhou, Antonia Fern andez Figueroa, Rodrigo Freitas, Na’ama Hal-
akoun, Lauren Huang, Alvaro Menduina, Beatriz Mingo, Ver onicaotta, Jo ao Retr e, and Erik Rosenberg. We w ould lik e to thank Dustin Lang for creating the le gac y-
urv e y.org cutout service and for contributing image processing code.e also thank Sugata Kaviraj and Matthew Hopkins for helpful
iscussions. MW acknowledges funding from the Science and Technology
unding Council (STFC) Grant Code ST/R505006/1. We alsocknowledge support from STFC under grant ST/N003179/1.
RJS acknowledges funding from Christ Church, University ofxford. LF acknowledges partial support from US National Science
oundation a ward OAC 1835530; VM and LF acknowledge partialupport from NSF AST 1716602.
This publication uses data generated via the Zooniverse.org plat-orm, development of which is funded by generous support, including Global Impact Award from Google, and by a grant from the Alfred. Sloan Foundation.
This research made use of the open-source Python scientific com-uting ecosystem, including SCIPY (Jones et al. 2001 ), MATPLOTLIB
Hunter 2007 ), SCIKIT-LEARN (Pedregosa et al. 2011 ), SCIKIT-IMAGE
van der Walt et al. 2014 ), and PANDAS (McKinney 2010 ). This research made use of ASTROPY , a community-developed core
ython package for Astronomy (The Astropy Collaboration 2018 ). This research made use of TENSORFLOW (Abadi et al. 2016 ). The Le gac y Surv e ys consist of three individual and complemen-
ary projects: the Dark Energy Camera Le gac y Surv e y (DECaLS;SF’s OIR Lab Proposal ID # 2014B-0404; PIs: David Schlegel andrjun Dey), the Beijing-Arizona Sky Survey (BASS; NSF’s OIR Labroposal ID # 2015A-0801; PIs: Zhou Xu and Xiaohui Fan), and theayall z-band Le gac y Surv e y (MzLS; NSF’s OIR Lab Proposal ID
2016A-0453; PI: Arjun Dey). DECaLS, BASS and MzLS togethernclude data obtained, respectively, at the Blanco telescope, Cerroololo Inter-American Observatory, The NSF’s National Optical-nfrared Astronomy Research Laboratory (NSF’s OIR Lab); theok telescope, Steward Observatory, University of Arizona; and theayall telescope, Kitt Peak National Observatory, NSF’s OIR Lab.
NRAS 509, 3966–3988 (2022)
he Le gac y Surv e ys project is honored to be permitted to conductstronomical research on Iolkam Du’ag (Kitt Peak), a mountain witharticular significance to the Tohono O’odham Nation. The NSF’s OIR Lab is operated by the Association of Universities
or Research in Astronomy (AURA) under a cooperative agreementith the National Science Foundation. This project used data obtained with the Dark Energy Camera
DECam), which was constructed by the Dark Energy Surv e y (DES)ollaboration. Funding for the DES Projects has been provided by the.S. Department of Energy, the U.S. National Science Foundation,
he Ministry of Science and Education of Spain, the Science andechnology Facilities Council of the United Kingdom, the Higherducation Funding Council for England, the National Center forupercomputing Applications at the University of Illinois at Urbana-hampaign, the Kavli Institute of Cosmological Physics at theniversity of Chicago, Center for Cosmology and Astro-Particlehysics at the Ohio State University, the Mitchell Institute forundamental Physics and Astronomy at Texas A&M University,inanciadora de Estudos e Projetos, Fundacao Carlos Chagas Filhoe Amparo, Financiadora de Estudos e Projetos, Fundacao Carloshagas Filho de Amparo a Pesquisa do Estado do Rio de Janeiro,onselho Nacional de Desenvolvimento Cientifico e Tecnologicond the Ministerio da Ciencia, Tecnologia e Inovacao, the Deutscheorschungsgemeinschaft and the Collaborating Institutions in theark Energy Surv e y. The Collaborating Institutions are Argonneational Laboratory, the University of California at Santa Cruz,
he University of Cambridge, Centro de Investigaciones Ener-eticas, Medioambientales y Tecnologicas-Madrid, the Universityf Chicago, Univ ersity Colle ge London, the DES-Brazil Consor-ium, the University of Edinburgh, the Eidgenossische Technischeochschule (ETH) Zurich, Fermi National Accelerator Laboratory,
he University of Illinois at Urbana-Champaign, the Institut deiencies de l’Espai (IEEC/CSIC), the Institut de Fisica d’Altesnergies, La wrence Berkele y National Laboratory, the Ludwig-aximilians Universitat Munchen and the associated Excellenceluster Uni verse, the Uni versity of Michigan, the National Opticalstronomy Observatory, the University of Nottingham, the Ohiotate University, the University of Pennsylvania, the Universityf Portsmouth, SLAC National Accelerator Laboratory, Stanfordniversity, the University of Sussex, and Texas A&M University. BASS is a key project of the Telescope Access Program (TAP),
hich has been funded by the National Astronomical Observatoriesf China, the Chinese Academy of Sciences (the Strategic Priorityesearch Program ‘The Emergence of Cosmological Structures’rant # XDB09000000), and the Special Fund for Astronomy from
he Ministry of Finance. The BASS is also supported by the Externalooperation Program of Chinese Academy of Sciences (Grant #14A11KYSB20160057), and Chinese National Natural Scienceoundation (Grant # 11433005). The Le gac y Surv e y team makes use of data products from the Near-
arth Object Wide-field Infrared Surv e y Explorer (NEOWISE),hich is a project of the Jet Propulsion Laboratory/California Insti-
ute of Technology. NEOWISE is funded by the National Aeronauticsnd Space Administration.
The Le gac y Surv e ys imaging of the DESI footprint is sup-orted by the Director, Office of Science, Office of High Energyhysics of the U.S. Department of Energy under Contract No.E-AC02-05CH1123, by the National Energy Research Scien-
ific Computing Center, a DOE Office of Science User Facil-ty under the same contract; and by the U.S. National Scienceoundation, Division of Astronomical Sciences under Contracto. AST-0950945 to NOAO.
Galaxy Zoo DECaLS data release 3985
D
T
/pm
dyic
o
R
A
AAAABB
BB
B
CCCCC
CC
DD
DDE
FF
F
FFG
G
HH
H
HH
H
HH
H
H
HHI
JJ
KKK
KK
K
K
KKLLLLLLLL
LL
L
L
L
M
M
M
M
Dow
nloaded from https://academ
ic.oup.com/m
nras/article/509/3/3966/6378289 by guest on 26 May 2022
ATA AVAILABILITY
he data underlying this article are available via Zenodo at https:/ doi.org/ 10.5281/ zenodo.4196266 . This includes the galaxy mor- hology classifications from both volunteers and deep learning odels, as well as the images uploaded to Galaxy Zoo. Any future
ata updates will be released using Zenodo versioning – please check ou are viewing the latest version. The code underlying this article s available at ht tps://github.com/mwalmsley/zoobot . We hope this ode will be a useful resource for researchers looking to train theirwn deep learning models.
EFERENCES
badi M. et al., 2016, TensorFlow: Large-Scale Machine Learning on Heterogeneous Distributed Systems. Available at: http://ar xiv.or g/abs/16 03.04467
bazajian K. N. et al., 2009, ApJS , 182, 543 ihara H. et al., 2011, ApJS , 193, 29 lbareti F. D. et al., 2017, ApJS , 233, 25 lexander D. M., Hickox R. C., 2012, New Astron. Rev. , 56, 93 amford S. P. et al., 2009, MNRAS , 393, 1324 ansal G., Nushi B., Kamar E., Lasecki W. S., Weld D. S., Horvitz E., 2019,
in Law E., Vaughan J. W., eds, Proceedings of the AAAI Conference onHuman Computation and Crowdsourcing, Vol. 7. AAAI Press, Palo Alto, CA, p. 19
eck M. R. et al., 2018, MNRAS , 476, 5516 luck A. F., Trevor Mendel J., Ellison S. L., Moreno J., Simard L., Patton D.
R., Starkenburg E., 2014, MNRAS , 441, 599 rooks A., Christensen C., 2015, in Laurikainen E., Peletier R., Gadotti D.,
eds, Galactic Bulges, Vol. 418. Springer, Cham, p. 317 appellari M., Copin Y., 2003, MNRAS , 342, 345 ardamone C. et al., 2009, MNRAS , 399, 1191 aruana R., 1997, Mach. Learn., 28, 41 asteels K. R. V. et al., 2014, MNRAS , 445, 1157 hang J. C., Amershi S., Kamar E., 2017, in Conference on Human
Factors in Computing Systems - Proceedings. Association for Computing Machinery, New York, p. 2334
heng T. Y. et al., 2020, MNRAS , 493, 4209 ook S. R., Gelman A., Rubin D. B., 2006, J. Comput. Graph. Stat., 15, 675ey A. et al., 2019, AJ , 157, 168 ickinson H., Fortson L., Scarlata C., Beck M., Walmsley M., 2019,
in Proceedings of the International Astronomical Union. International Astronomical Union, Paris
ieleman S., Willett K. W., Dambre J., 2015, MNRAS , 450, 1441 om ınguez S anchez H. et al., 2019, MNRAS , 484, 93 ykholt K. et al., 2018, in Conference on Computer Vision and Pattern
Recognition. IEEE, Piscataway, NJ. Available at: http://ar xiv.or g/ abs/ 17 07.08945
ang J. J., Faber S. M., Koo D. C., Dekel A., 2013, ApJ , 776, 63 erreira L., Conselice C. J., Duncan K., Cheng T. Y., Griffiths A., Whitney
A., 2020, ApJ , 895, 115 ischer J. L., Dom ınguez S anchez H., Bernardi M., 2019, MNRAS , 483,
2057 laugher B. et al., 2015, AJ , 150, 150 ontanot F., de Lucia G., Wilman D., Monaco P., 2011, MNRAS , 416, 409 al Y., 2016, PhD thesis, Uni ver. Cambridge. Av ailable at: http://mlg.eng.ca
m.ac.uk/ yarin/ thesis/thesis.pdfeirhos R., Michaelis C., Wichmann F. A., Rubisch P., Bethge M., Brendel
W., 2019, in 7th International Conference on Learning Representations, ICLR 2019, International Conference on Learning Representations, ICLR. Available at: http://ar xiv.or g/abs/1811.12231
art R. E. et al., 2016, MNRAS , 461, 3663 art R. E., Bamford S. P., Casteels K. R. V., Kruk S. J., Lintott C. J., Masters
K. L., 2017, MNRAS , 468, 1850 e K., Zhang X., Ren S., Sun J., 2016, in Proceedings of the IEEE Computer
Society Conference on Computer Vision and Pattern Recognition No. 3.
IEEE Computer Society, Washington, D.C., p. 770. Available at: http: //ar xiv.or g/pdf/1512.03385v1.pdfhttp://ar xiv.or g/abs/1512.03385
e X., Zhao K., Chu X., 2021, Knowledge-Based Syst., 212, 106622 endrycks D., Gimpel K., 2017, in International Conference on Learning
Representations. Toulon, France. Available at: http://ar xiv.or g/abs/1610 .02136
opkins P. F., Cox T. J., Younger J. D., Hernquist L., 2009, ApJ , 691,1168
opkins P. F. et al., 2010, ApJ , 715, 202 oulsby N., 2014, PhD thesis. Available at: https://www.repository.cam.ac.
uk/handle/1810/248885 oward A. G., Zhu M., Chen B., Kalenichenko D., W ang W., W eyand T.,
Andreetto M., Adam H., 2017, preprint ( arXiv:1704.04861 ) u J., Shen L., Sun G., 2018, in Proceedings of the IEEE Computer Society
Conference on Computer Vision and Pattern Recognition. IEEE Computer Society, Washington, D.C., p. 7132. Available at: http://ar xiv.or g/abs/17 09.01507
uertas-Company M. et al., 2015, ApJS , 221, 8 unter J. D., 2007, Comput. Sci. Eng. , 9, 99
andola F. N., Han S., Moskewicz M. W., Ashraf K., Dally W. J., Keutzer K.,2017, in International Conference on Learning Representations. Toulon, France
ogee S., Scoville N. Z., Kenney J. D. P., 2005, ApJ , 630, 837 ones E. et al., 2001, in SciPy: Open Source Scientific Tools for Python.
Available at: http://www .scipy .org/aviraj S., 2013, MNRAS, 437, L41 aviraj S., 2014, MNRAS , 440, 2944 eel W. C., Manning A. M., Holwerda B. W., Mezzoprete M., Lintott C. J.,
Schawinski K., Gay P., Masters K. L., 2013, PASP , 125, 2 eel W. C. et al., 2015, AJ , 149, 155 emenade H. v. et al., 2020, in python-pillow/Pillow 7.1.2. Available at:
https://zenodo.org/r ecor d/3766443#.YV5JLLgzbIU
han A., Huerta E. A., Wang S., Gruendl R., Jennings E., Zheng H., 2019,Phys. Lett., 795, 248
ingma D. P., Ba J. L., 2015, in 3rd International Conference on LearningRepresentations, ICLR 2015 - Conference Track Proceedings. Interna- tional Conference on Learning Representations, ICLR, San Diego, CA
ruk S. J. et al., 2017, MNRAS , 469, 3363 ruk S. J. et al., 2018, MNRAS , 473, 4731 anczos C., 1938, J. Math. Phys., 17, 123 and K. et al., 2008, MNRAS , 388, 1686 e v asseur L. P., Hezaveh Y. D., Wechsler R. H., 2017, ApJ , 850, L7 in L. et al., 2019, ApJ , 872, 50 ingard T. K., et al., 2020, ApJ, 900, 178 intott C. J. et al., 2008, MNRAS , 389, 1179 intott C. J. et al., 2009, MNRAS , 399, 129 iu A., Guerra S., Fung I., Matute G., Kamar E., Lasecki W., 2020, in
WWW ’20: Proceedings of the World Wide Web Conference. Association for Computing Machinery, Inc., New York, p. 2432. Available at: https://dl.acm.org/doi/10.1145/3366423.3380306
ochner M., Bassett B. A., 2021, Astron. Comput., 36, 100481 ofthouse E. K., Kaviraj S., Conselice C. J., Mortlock A., Hartley W., 2017,
MNRAS , 465, 2895 opez-Sanjuan C., Balcells M., P erez-Gonz alez P. G., Barro G., Gallego J.,
Zamorano J., 2010, A&A , 518, A20 otz J. M., Jonsson P., Cox T. J., Croton D., Primack J. R., Somerville R. S.,
Stewart K., 2011, ApJ , 742, 103 upton R., Blanton M., Fekete G., Hogg D., O’Mullane W., Szalay A., Wherry
N., 2004, PASP, 116, 133 argalef-Bentabol B., Huertas-Company M., Charnock T., Margalef-
Bentabol C., Bernardi M., Dubois Y., Storey-Fisher K., Zanisi L., 2020,MNRAS, 496, 2346
artin G., Kaviraj S., Devriendt J. E., Dubois Y., Pichon C., 2018, MNRAS ,480, 2266
artin G., Kaviraj S., Hocking A., Read S. C., Geach J. E., 2020, MNRAS ,491, 1408
asters K. L., 2019, in Proceedings of the International Astronomical Union,Vol. 14, International Astronomical Union, Cambridge, p. 205
MNRAS 509, 3966–3988 (2022)
3986 M. Walmsley et al.
MMMMMMM
M
NPPR
S
S
S
S
SSSSSSS
S
SS
T
T
TT
T
Tv
WWW
WWWWW
Y
Y
S
S
.
A
m
P
o
A
c
A
F
1
u
t
r
b
m
s
M
Dow
nloaded from https://academ
ic.oup.com/m
nras/article/509/3/3966/6378289 by guest on 26 May 2022
asters K. L. et al., 2010, MNRAS , 404, 792 asters K. L. et al., 2011, MNRAS , 411, 2026 asters K. L. et al., 2012, MNRAS , 424, 2180 asters K. L. et al., 2019, MNRAS , 487, 1808 (M19) cInnes L., Healy J., Astels S., 2017, J. Open Source Softw. , 2, 205 cInnes L., Healy J., Melville J., 2018, J. Open Source Softw., 3, 861 cKinney W., 2010, in Data Structures for Statistical Computing in Python.
Available at: http://conference.scip y.org/proceedings/scip y2010/mckinney.html
oiseev A. V., Smirnova K. I., Smirnova A. A., Reshetnikov V. P., 2011,MNRAS , 418, 244
air P. B., Abraham R. G., 2010, ApJS , 186, 427 (NA10) edregosa F. et al., 2011, J. Mach. Learn. Res., 12, 2825 eterken T. et al., 2021, MNRAS , 502, 3128 en J., Liu P. J., Fertig E., Snoek J., Poplin R., DePristo M. A., Dillon J.
V., Lakshminarayanan B., 2019, in Thirty-third Conference on NeuralInformation Processing Systems (NeurIPS 2019). NeurIPS, VancouverConvention Centre, p. 14707
akamoto K., Okumura S. K., Ishizuki S., Scoville2 N. Z., 1999, TechnicalReport 2, Bar-driven Transport of Molecular Gas to Galactic Centers andits Consequences . Available at: ht tp://st acks.iop.org/0004-637X/525/i=2/a=691http://iopscience.iop .
anchez H. D., Huertas-Company M., Bernardi M., Tuccillo D., Fischer J.L., 2018, MNRAS , 476, 3661
andler M., Howard A., Zhu M., Zhmoginov A., Chen L. C., 2018, inProceedings of the IEEE Computer Society Conference on ComputerVision and Pattern Recognition. IEEE Computer Society, Washington,D.C., p. 4510. Available at: http://ar xiv.or g/abs/1801.04381
heth K., Blain A. W., Kneib J.-P., Frayer D. T., van der Werf P. P., KnudsenK. K., 2004, ApJ , 614, L5
immons B. et al., 2013, MNRAS , 429, 2199 immons B. D. et al., 2014, MNRAS , 445, 3466 immons B. D., Smethurst R. J., Lintott C., 2017a, MNRAS, 12, 1 immons B. D. et al., 2017b, MNRAS , 464, 4420 kibba R. A. et al., 2012, MNRAS , 423, 1485 methurst R. J. et al., 2015, MNRAS , 450, 435 methurst R. J., Simmons B. D., Lintott C. J., Shanahan J., 2019, MNRAS ,
489, 4016 mith L., Gal Y., 2018, in Uncertainty in Artificial Intelligence 2018.
Association for Uncertainty in Artificial Intelligence, Monterey, CA
pindler A. et al., 2017, MNRAS, 23, 1 zegedy C., Zaremba W., Sutskever I., Bruna J., Erhan D., Goodfellow I.,
Fergus R., 2014, in 2nd International Conference on Learning Repre-sentations, ICLR 2014 - Conference Track Proceedings. InternationalConference on Learning Representations, ICLR, Banff, AB, Canada
an M., Le Q. V., 2019, in 36th International Conference on MachineLearning, ICML 2019. ICML, Long Beach, p. 10691. Available at:http://ar xiv.or g/abs/1905.11946
an M., Chen B., Pang R., Vasude v an V., Sandler M., Ho ward A., Le Q.V., 2019, Proceedings of the IEEE Computer Society Conference onComputer Vision and Pattern Recognition, IEEE, Piscataway, p. 2815
NRAS 509, 3966–3988 (2022)
he Astropy Collaboration, 2018, AJ , 156, 123 he Dark Energy Surv e y Collaboration, 2005, in The Dark Energy Surv e y.
Available at: http://ar xiv.or g/abs/astr o-ph/0510346 he Zooniverse Team, 2020, in zooniv erse/panoptes: Zooniv erse API to
support user defined volunteer research projects. Available at: https:// github.com/zooniverse/ panoptes
ojeiro R. et al., 2013, MNRAS , 432, 359 an der Walt S., Sch onberger J. L., Nunez-Iglesias J., Boulogne F ., W arner J.
D., Yager N., Gouillart E., Yu T., 2014, PeerJ, 2, e453 almsley M. et al., 2020, MNRAS , 491, 1554 ang J. et al., 2011, MNRAS , 413, 1373 ilder B., Horvitz E., Kamar E., 2020, in Wilder B., Horvitz E., Kamar E.,
eds, Proceedings of the Twenty-Ninth International Joint Conference onArtificial Intelligence. IJCAI, Yokohama, p. 1526
illett K. W. et al., 2013, MNRAS , 435, 2835 illett K. W. et al., 2015, MNRAS , 449, 820 illett K. W. et al., 2017, MNRAS , 464, 4176 right D. E. et al., 2017, MNRAS , 472, 1315 right D. E., Fortson L., Lintott C., Laraia M., Walmsley M., 2019, ACM
Trans. Social Comput., 2, 1 ang K., Qinami K., Fei-Fei L., Deng J., Russako vsk y O., 2020, in FAT ∗ 2020
- Proceedings of the 2020 Conference on Fairness, Accountability, andTransparency. Association for Computing Machinery, Inc., New York,p. 547
ork D. G. et al., 2000, AJ , 120, 1579
UPPORTING I N F O R M AT I O N
upplementary data are available at https:// doi.org/ 10.5281/ zenodo4196266 .
ppendix C. Example thumbnails of galaxies with confident auto-ated classifications.
lease note: Oxford University Press is not responsible for the contentr functionality of any supporting materials supplied by the authors.ny queries (other than missing material) should be directed to the
orresponding author for the article.
PPENDI X A : GZD-1 / 2 D E C I S I O N TREE
ig. A1 shows the Galaxy Zoo decision tree used for the earlier GZD- and GZD-2 DECaLS campaigns. This tree is based on the treesed for Galaxy Zoo 2 (Willett et al. 2013 ) with three modifications;he ‘Can’t Tell’ answer to ‘How many spiral arms are there?’ wasemo v ed, the number of answers to ‘How prominent is the centralulge?’ was reduced from four to three, and ‘Is the galaxy currentlyerging, or is there any sign of tidal debris?’ was added as a
tandalone question. Please see Section 3.2 for a full discussion.

Galaxy Zoo DECaLS data release 3987
A0: Smooth A1: Featuresor disk
A2: Star orartifact
A0: Yes A1: No
A0: Bar A1: No bar
A0: Spiral A1: No spiral
A0: Nobulge
A2: Obvious A3:Dominant
A1: Ring A2: Lens orarc
A6:Overlapping
A4: Irregular A5: OtherA3: Dustlane
A0:Completely
round
A1: Inbetween
A2: Cigarshaped
A0:Rounded
A1: Boxy A2: Nobulge
A0: Tight A1: Medium A2: Loose
A0: 1 A1: 2 A2: 3 A3: 4 A4: Morethan 4
A0: None
A0: Merging A1: Tidaldebris
A2: Both A3: Neither
T00: Is the galaxy simply smooth and rounded, with no sign of a disk?
T01: Could this be a disk viewed edge-on?
T02: Is there a sign of a bar feature through thecentre of the galaxy?
T03: Is there any sign of a spiral arm pattern?
T04: How prominent is the central bulge, compared with the rest of thegalaxy?
T05: Is the galaxy currently merging or is there any sign of tidal debris?
T06: Do you see any of these odd features in the image?
T07: How rounded is it?
T08: Does the galaxy have a bulgeat its centre? If so, what shape?
T09: How tightly wound do thespiral arms appear?
T10: How many spiral arms are there?
End
1st Tier Question
2nd Tier Question
3rd Tier Question
4th Tier Question
Figure A1. Decision tree used for GZD-1 and GZD-2, based on the Galaxy Zoo 2 decision tree. The GZD-5 decision tree is shown in Fig. 4 .
A
Tat
l
fofr
Dow
nloaded from https://academ
ic.oup.com/m
nras/article/509/3/3966/6378289 by guest on 26 May 2022
PPENDIX B: C ATA L O G U E SAMPLE ROW S
ables B1 and B2 present sample rows from the volunteer nd automated morphology catalogues, respectively. The volun- eer data shown is from GZD-5; the GZD-1/2 catalogue fol-
o ws an equi v alent schema. For bre vity, we sho w only columnsor a single question (‘Bar’) and a single answer (‘Weak’); ther questions and answers follow an identical pattern. A
ull description of all columns is available on data.galaxyzoo.o g .
MNRAS 509, 3966–3988 (2022)

3988 M. Walmsley et al.
Table B1. Sample of GZD-5 volunteer classifications, with illustrative subset of columns. Columns: ‘iauname’ galaxy identifier from NASA- Sloan Atlas; RA and Dec, similarly; ‘Bar’ question total votes for all answers; ‘Bar’ question votes for ‘Weak’ answer; fraction of ‘Bar’ question votes for ‘Weak’ answer; estimated fraction after applying redshift debiasing (Section 4.3.2). Other questions and answers follow the same pattern (not shown for brevity). Full schema online at this link.
iauname ra dec bar total-votes bar weak bar weak fraction bar weak debiased
J112953.88-000427.4 172 .47 − 0 .07 16 1 0 .06 0 .15 J104325.29 + 190335.0 160 .86 19 .06 2 0 0 .00 0 .00 J104629.54 + 115415.1 161 .62 11 .90 4 2 0 .50 –J082950.68 + 125621.8 127 .46 12 .94 0 0 – –J122056.00-015022.0 185 .23 − 1 .84 3 0 0 .00 –
Table B2. Sample of automated classifications (GZD-5 schema), with illustrative subset of columns. Columns: ‘iauname’ galaxy identifier from
NASA-Sloan Atlas; RA and Dec, similarly; proportion of volunteers estimated to be asked the ‘Bar’ question (i.e. the product of the preceding vote fractions) for estimating rele v ance; Dirichlet concentrations defining the predicted posterior for the ‘Bar’ question and ‘Weak’ answer (see Section 5); predicted fraction of ‘Bar’ question votes for the ‘Weak’ answer derived from those concentrations. Other questions and answers follow the same pattern (not shown for brevity). Full schema online at this link.
iauname RA Dec bar proportion asked bar weak concentrations bar weak fraction
J112953.88-000427.4 172 .47 − 0 .07 0 .14 [6.158, 5.0723, 5.4842,... 0 .09 J104325.29 + 190335.0 160 .86 19 .06 0 .13 [4.3723, 4.5933, 4.8582... 0 .07 J100927.56 + 071112.4 152 .36 7 .19 0 .58 [9.3129, 10.3911, 8.4791... 0 .40 J143254.45 + 034938.1 218 .23 3 .83 0 .55 [13.2981, 12.2639, 8.8957... 0 .26 J135942.73 + 010637.3 209 .93 1 .11 0 .77 [15.6247, 15.6893, 14.72.... 0 .28
This paper has been typeset from a T E
X/L
A T E
X file prepared by the author.
MNRAS 509, 3966–3988 (2022)
Dow
nloaded from https://academ
ic.oup.com/m
nras/article/509/3/3966/6378289 by guest on 26 May 2022