Ga-NOTA PET imaging for gastric emptying assessment in mice
12
Chen et al. BMC Gastroenterol (2021) 21:69 https://doi.org/10.1186/s12876-021-01642-7 RESEARCH ARTICLE 68 Ga-NOTA PET imaging for gastric emptying assessment in mice Xueyan Chen 1† , Yu Liu 2† , Donghui Pan 2 , Maoyu Cao 1 , Xinyu Wang 2 , Lizhen Wang 2 , Yuping Xu 2 , Yan Wang 2 , Junjie Yan 2 , Juan Liu 1,3* and Min Yang 2* Abstract Background: Positron emission tomography (PET) has the potential for visualization and quantification of gastric emptying (GE). The traditional Chinese medicine (TCM) has been recognized promising for constipation. This study aimed to establish a PET imaging method for noninvasive GE measurement and to evaluate the efficacy of a TCM on delayed GE caused by constipation using PET imaging. Methods: [ 68 Ga]Ga-NOTA was synthesized as the tracer and sesame paste with different viscosity were selected as test meals. The dynamic PET scans were performed after [ 68 Ga]Ga-NOTA mixed with test meals were administered to normal mice. Two methods were utilized for the quantification of PET imaging. A constipation mouse model was treated with maren chengqi decoction (MCD), and the established PET imaging scans were performed after the treatment. Results: [ 68 Ga]Ga-NOTA was synthesized within 20 min, and its radiochemical purity was > 95%. PET images showed the dynamic process of GE. %ID/g, volume, and total activity correlated well with each other. Among which, the half of GE time derived from %ID/g for 4 test meals were 3.92 ± 0.87 min, 13.1 ± 1.25 min, 17.8 ± 1.31 min, and 59.7 ± 3.11 min, respectively. Constipation mice treated with MCD showed improved body weight and fecal condi- tions as well as ameliorated GE measured by [ 68 Ga]Ga-NOTA PET. Conclusions: A PET imaging method for noninvasive GE measurement was established with stable radiotracer, high image quality, and reliable quantification methods. The efficacy of MCD on delayed GE was demonstrated using PET. Keywords: Gastric emptying, Positron emission tomography, [ 68 Ga]Ga-NOTA, Constipation, Traditional Chinese medicine © The Author(s) 2021. Open Access This article is licensed under a Creative Commons Attribution 4.0 International License, which permits use, sharing, adaptation, distribution and reproduction in any medium or format, as long as you give appropriate credit to the original author(s) and the source, provide a link to the Creative Commons licence, and indicate if changes were made. The images or other third party material in this article are included in the article’s Creative Commons licence, unless indicated otherwise in a credit line to the material. If material is not included in the article’s Creative Commons licence and your intended use is not permitted by statutory regulation or exceeds the permitted use, you will need to obtain permission directly from the copyright holder. To view a copy of this licence, visit http://creativecommons.org/licenses/by/4.0/. The Creative Commons Public Domain Dedication waiver (http://creativeco mmons.org/publicdomain/zero/1.0/) applies to the data made available in this article, unless otherwise stated in a credit line to the data. Background Gastrointestinal motility disorders such as gastropare- sis, functional dyspepsia, and constipation, affect the life quality of a huge population worldwide and cause con- siderable medical expenses and economic burden [1, 2]. Gastric emptying (GE) is one of the most important parts of gastrointestinal motility. Since accelerated, normal, and delayed GE cannot be reliably differentiated based on specific symptoms, objective measurement of GE is required [3]. Besides, abnormal GE frequently occurs in certain diseases such as diabetes, critically ill, systematic sclerosis, and Parkinson’s disease, and the altered GE may be an important mechanism for some effective medica- tions [4–10]. erefore, it is important to visualize and quantify GE. At present, accurate GE measurement remains chal- lenges. e indirect methods such as 13 C breathe test Open Access *Correspondence: [email protected]; [email protected] † Xueyan Chen and Yu Liu have contributed equally 1 Department of Veterinary Medicine, Southwest University, Rongchang, Chongqing 402460, China 2 NHC Key Laboratory of Nuclear Medicine, Jiangsu Key Laboratory of Molecular Nuclear Medicine, Jiangsu Institute of Nuclear Medicine, Wuxi 214063, Jiangsu, China Full list of author information is available at the end of the article
-
Upload
khangminh22 -
Category
Documents
-
view
0 -
download
0
Transcript of Ga-NOTA PET imaging for gastric emptying assessment in mice

Chen et al. BMC Gastroenterol (2021) 21:69 https://doi.org/10.1186/s12876-021-01642-7
RESEARCH ARTICLE
68Ga-NOTA PET imaging for gastric emptying assessment in miceXueyan Chen1†, Yu Liu2†, Donghui Pan2, Maoyu Cao1, Xinyu Wang2, Lizhen Wang2, Yuping Xu2, Yan Wang2, Junjie Yan2, Juan Liu1,3* and Min Yang2*
Abstract
Background: Positron emission tomography (PET) has the potential for visualization and quantification of gastric emptying (GE). The traditional Chinese medicine (TCM) has been recognized promising for constipation. This study aimed to establish a PET imaging method for noninvasive GE measurement and to evaluate the efficacy of a TCM on delayed GE caused by constipation using PET imaging.
Methods: [68Ga]Ga-NOTA was synthesized as the tracer and sesame paste with different viscosity were selected as test meals. The dynamic PET scans were performed after [68Ga]Ga-NOTA mixed with test meals were administered to normal mice. Two methods were utilized for the quantification of PET imaging. A constipation mouse model was treated with maren chengqi decoction (MCD), and the established PET imaging scans were performed after the treatment.
Results: [68Ga]Ga-NOTA was synthesized within 20 min, and its radiochemical purity was > 95%. PET images showed the dynamic process of GE. %ID/g, volume, and total activity correlated well with each other. Among which, the half of GE time derived from %ID/g for 4 test meals were 3.92 ± 0.87 min, 13.1 ± 1.25 min, 17.8 ± 1.31 min, and 59.7 ± 3.11 min, respectively. Constipation mice treated with MCD showed improved body weight and fecal condi-tions as well as ameliorated GE measured by [68Ga]Ga-NOTA PET.
Conclusions: A PET imaging method for noninvasive GE measurement was established with stable radiotracer, high image quality, and reliable quantification methods. The efficacy of MCD on delayed GE was demonstrated using PET.
Keywords: Gastric emptying, Positron emission tomography, [68Ga]Ga-NOTA, Constipation, Traditional Chinese medicine
© The Author(s) 2021. Open Access This article is licensed under a Creative Commons Attribution 4.0 International License, which permits use, sharing, adaptation, distribution and reproduction in any medium or format, as long as you give appropriate credit to the original author(s) and the source, provide a link to the Creative Commons licence, and indicate if changes were made. The images or other third party material in this article are included in the article’s Creative Commons licence, unless indicated otherwise in a credit line to the material. If material is not included in the article’s Creative Commons licence and your intended use is not permitted by statutory regulation or exceeds the permitted use, you will need to obtain permission directly from the copyright holder. To view a copy of this licence, visit http://creat iveco mmons .org/licen ses/by/4.0/. The Creative Commons Public Domain Dedication waiver (http://creat iveco mmons .org/publi cdoma in/zero/1.0/) applies to the data made available in this article, unless otherwise stated in a credit line to the data.
BackgroundGastrointestinal motility disorders such as gastropare-sis, functional dyspepsia, and constipation, affect the life quality of a huge population worldwide and cause con-siderable medical expenses and economic burden [1, 2].
Gastric emptying (GE) is one of the most important parts of gastrointestinal motility. Since accelerated, normal, and delayed GE cannot be reliably differentiated based on specific symptoms, objective measurement of GE is required [3]. Besides, abnormal GE frequently occurs in certain diseases such as diabetes, critically ill, systematic sclerosis, and Parkinson’s disease, and the altered GE may be an important mechanism for some effective medica-tions [4–10]. Therefore, it is important to visualize and quantify GE.
At present, accurate GE measurement remains chal-lenges. The indirect methods such as 13C breathe test
Open Access
*Correspondence: [email protected]; [email protected]†Xueyan Chen and Yu Liu have contributed equally1 Department of Veterinary Medicine, Southwest University, Rongchang, Chongqing 402460, China2 NHC Key Laboratory of Nuclear Medicine, Jiangsu Key Laboratory of Molecular Nuclear Medicine, Jiangsu Institute of Nuclear Medicine, Wuxi 214063, Jiangsu, ChinaFull list of author information is available at the end of the article
Page 2 of 12Chen et al. BMC Gastroenterol (2021) 21:69
and paracetamol absorption test require breathe or blood analysis. These methods can be disrupted by hypergly-cemia and impaired liver or kidney functions [3, 11, 12]. Conventional imaging modalities such as ultrasonogra-phy, bioluminescence, and magnetic resonance imag-ing (MRI) are limited by temporal or spatial resolution, quantitative capability, or low availability [13–15]. Some alternative methods were put forward in recent years and showed potential for the effective visualization and local-ization of solid dosage forms in the intestinal tract of rats [16]. Scintigraphy, a functional imaging modality com-bined with radiotracers (e.g. [99mTc]Tc-phytate, [99mTc]Tc-DTPA, and [99mTc]Tc-sulphur colloid), is currently the reference standard for noninvasive GE evaluation which can provide direct and comprehensive visualization for GE [17].
Although scintigraphy has been widely recognized and standardized [18], few studies explored the value of positron emission tomography (PET), another functional imaging modality using radiotracers, for GE measure-ment. The imaging manners of PET also makes it have the advantages of scintigraphy. They are both direct measures for functional information. Both of them can visualize and determine the intragastric distribution. Besides, PET has better quantification capability and image quality and is considered to be one of the most advanced modalities for medical imaging [19–21]. Previ-ous studies have demonstrated the potential of PET for investigating gastrointestinal absorption and pharma-cokinetic profiles of drugs [22–24]. However, no PET tracer has been tested for the direct GE measurement. Perhaps the primary concern for PET is the low cost-effectiveness, but this concern can be mitigated by using more cost-effective PET radionuclides. At present, PET usually uses 18F as the radionuclide which is produced by the cyclotron. Just like 99mTc, 68Ga is produced by the generator, which has the advantages of simple operation, low economic and site burdens, and no need for addi-tional radiation shielding and high-skilled operators for the cyclotron [25]. Therefore, 68Ga has been currently one of the most popular PET radionuclides in both basic research and clinical applications.
Constipation has negative impacts on life quality and is a considerable burden on health-care resources. The median prevalence of constipation is > 16% worldwide. Besides, constipation is usually associated with other gas-trointestinal disorders and increased prevalence of psy-chological distress [26, 27]. In recent years, research on the treatment of constipation using traditional Chinese medicine (TCM) has increased significantly and shown promising results [28, 29]. Maren Chengqi decoction (MCD) is a modified Chinese herbal formula based on Chengqi decoction. Chengqi decoction is a well-known
TCM that showed efficacy for the treatment of gastro-intestinal disorders in Chinese research [30–33]. Maren (seeds of Cannabis sativa L.) has the effects of laxative and is usually used for the treatment of blood deficiency and constipation in TCM [34–36]. However, it remains unclear whether these TCMs can ameliorate GE in con-stipation and other gastrointestinal disorders. In this study, the primary aim was to establish an available PET imaging method for accurate GE measurement using radionuclide 68Ga. Then, we would like to evaluate the improvement of MCD on delayed GE caused by consti-pation using this established PET imaging method.
MethodsAnimals and generalsICR mice used in this study (8–10 weeks age, half male and half female) were purchased from Changzhou Cavens Animal Co., Ltd. and housed in the Laboratory Animal Center of Jiangsu Institute of Nuclear Medi-cine under a temperature-controlled (23 °C ± 2 °C) and humidity-controlled (~ 50%) condition. Mice were free to access standard autoclaved rodent food [37] and water and were maintained in a 12-h light/dark cycle. All ani-mal experiments were approved by the Laboratory Ani-mal Management and Ethics Committee of Jiangsu Institute of Nuclear Medicine (Ethical Committee Num-ber: JSINM-2018-043). After the experiments, mice were euthanized by cervical dislocation. All reagents, unless otherwise stated, were purchased from commercial sup-pliers and used without further purification. 68Ga3+ for the radiolabeling was obtained from 68Ge/68Ga genera-tors (ITG, Germany). [99mTc]Tc-DTPA which had satis-fied the clinical requirement was generously provided by the Department of Nuclear Medicine, Jiangyuan Hos-pital. All experiments were performed blindly among researcher.
Preparation of [68Ga]Ga‑NOTAThe fresh 68Ga3+ was obtained in the form of [68Ga]GaCl3 which was eluted from 68Ge/68Ga generators with 4 mL 0.05 M HCl. Among them, the 1.5 mL fraction with the highest radioactivity (~ 370 MBq) was used for further radiolabeling. Then, 94 μL 1 M sodium acetate buffer was added into [68Ga]GaCl3 solution, followed by 50 μg maleimide-NOTA (CheMatech, France), and the mixture was heated at 97 °C for 10 min. The product was captured on a C18 column (Agilent, USA) using 10 mL deionized water and then eluted by 0.3 mL 10 mM HCl-containing ethanol. The radiochemical purity and in vitro stability in simulated gastric fluid [38] of the final product were measured by a radio-HPLC (Waters, USA) based on the protocol of previous studies [39].
Page 3 of 12Chen et al. BMC Gastroenterol (2021) 21:69
Preparation of test mealsWe prepared 4 types of test meals to determine the fea-sibility of [68Ga]Ga-NOTA PET for GE evaluation. These test meals could represent liquid food (G1: 2 mL saline), semi-fluid food (G2: 0.5 g black sesame paste with 2 mL saline), fluid food (G3: 1 g black sesame paste with 2 mL saline), and semi-solid food (G4: 1.5 g black sesame paste with 2 mL saline), respectively. The edible black sesame paste (Nanfang, China) we used in this study was in line with Chinese dietary habits and made up of rice, black sesame (≥ 21.5%), sesame, maltodextrin, xylitol, walnuts, and peanuts. Each 40 g of them contained 696 kJ energy, 3.6 g protein, 5.2 g fat, 26 g carbohydrates, 1.8 g sugar, 40 mg sodium, 60 mg calcium, and 0.6 mg iron. The vis-cosity of these test meals was measured by a Rheometer (HAAKE, Germany). Finally, [68Ga]Ga-NOTA or [99mTc]Tc-DTPA was added into these test meals before PET or scintigraphy scans.
PET scansAll PET scans were performed on an Inveon microPET scanner (Siemens Medical Solutions, Germany). Mice were fasted for at least 12 h before scans. Since previous studies demonstrated that anesthesia might have non-negligible effects on the gastrointestinal motility of mice, the mice under conscious state were immobilized in a small-animal retainer on the scanning bed during scans [23]. Meanwhile, a dedicated observer always paid atten-tion to the conditions of the mice, and the scans would be terminated immediately if the mice showed instability (rapid/weak breathing, limb convulsions, etc.). The four test meals (0.3 mL) were mixed with 2.59 MBq [68Ga]Ga-NOTA and intragastrically administered to the mice (n = 4/group) randomly at a constant rate within 10 s. The dynamic image acquisitions were continued from the beginning of the administration to 60 min after admin-istration. The dynamic data of each scan was sorted into 53 frames (5 s × 6, 2 s × 30, 30 s × 3, 90 s × 8, 300 s × 3, 600 s × 3). Images were reconstructed using 3D-ordered subset expectation maximization.
Image data analysisWe utilized two methods for the quantification of PET images. For the first method, regions of interest (ROIs) for the entire stomach were manually drawn on the aver-aged dynamic PET image of each mouse using ASIPro version 6.8. Then these ROIs were used to extract time-activity curves (TAC) of all dynamic images of each mouse and the radioactivity in ROIs was represented by image-derived percentage injected dose per gram (%ID/g). The half of GE time (T1/2) was defined as the reduction in intragastric radioactivity to half of the
highest radioactivity on the TAC at this time point. The GE rate at any time point (GERt) was calculated as GERt =
(
1− %ID/gt/
%ID/g(max)
)
∗ 100% and %ID/g(t) represented the radioactivity at specific time points while %ID/g(max) represented the highest radioactivity on the TAC. For the second method, reconstructed images were processed by PMOD software version 3.8 to accurately measure the volume of gastric content and calculate the total radioactivity. The 3D volumes of interest (VOIs) in stomach of each mouse was automatically extracted using PBAS module, then the average volume and PET unit values could be obtained. The total activity could be calculated as total activity = average PET unit value * conversion factor * 0.037 * volume. Then T1/2 and GER were calculated based on total activity and volume, respectively. Finally, we would evaluate the linear correla-tions between the quantified results obtained from PMOD and ASIPro.
CT scansFor better visualization and anatomical matching of PET images, we performed micro-computed X-ray tomog-raphy (microCT) scans for these mice. Mice were anes-thetized with 1.5–2.5% isoflurane/oxygen mixture before scanning and the anesthesia was maintained during the scans. The mice were lying prone on the scanning bed and the posture remained the same as that of the PET scans. All scans were performed at a tube voltage of 40 kV and a current of 200 μA. CT scans were performed from the tip of the noses to distal femurs in order to cap-ture the entire mice in the optimal field of view. We man-ually compared the acquired CT images and selected one frame that best fitted the position and posture of PET scans. Finally, we manually overlaid the PET images onto the selected CT image.
BiodistributionThe mice were sacrificed at 1 h after intragastric admin-istration of [68Ga]Ga-NOTA mixed with 4 test meals (n = 4/group). The administered dose of radiotracer was the same in different groups. The samples of major tis-sues and organs including blood, heart, liver, spleen, lung, kidney, stomach, duodenum, colon, bladder, pan-creas, muscle, and bone were dissected and weighed. The radioactivity of each sample was measured by a γ-counter and the quantification of these radioactive uptakes was expressed in %ID/g.
Scintigraphy scansWe performed scintigraphy scans for the mice on a clini-cal SPECT scanner (Philips, Netherlands) in Jiangyuan Hospital. In brief, the fasted mice were immobilized on the scanning bed under conscious state. The prepared
Page 4 of 12Chen et al. BMC Gastroenterol (2021) 21:69
liquid test meals (0.3 mL) were mixed with 3.7 MBq [99mTc]Tc-DTPA and intragastrically administered to the mice (n = 5) at a constant rate within 10 s, and then 30-min dynamic image acquisitions were conducted immediately with images acquired 1 frame/min. While the mice were intragastrically administered, we placed a cylindrical bottle with 0.3 mL liquid test meals mixed with 3.7 MBq [99mTc]Tc-DTPA on the upper right side of the mice as a reference. So that we could have intui-tive comparisons between the radioactivity in the stom-ach and the standard. ROIs were drawn manually and the total radioactive counts in these ROIs were calculated.
Mouse model of constipationFifty mice were randomly selected for the induction of constipation model, and another ten mice were selected as the healthy control group. According to the TCM methods and previous studies [40, 41], the constipation model was induced by a kind of Chinese herbal decoc-tion combined with loperamide hydrochloride (Janssen, China) as well as a moderate restriction of water. Briefly, the volatile oil of dried ginger, cinnamon, evodia rutae-carpa, and pepper were extracted. Meanwhile, the aco-nite was boiled with water for 30 min, then the residue of the extracted volatile oil was added and boiled for another 30 min. The product was filtered and the filtered liquid was repeatedly boiled and filtered twice for 30 min each time. The final filtrate was concentrated to ~ 1 g/mL using a rotary evaporator (IKA, Germany) and then mixed with the extracted volatile oil which was dissolved in Tween-80 (1:2). The dose for constipation induction was 2 mL/100 g body weight (i.e., 2 g herbal decoction and 0.2 mg loperamide hydrochloride) once daily for 10 days. The control group was administered with 0.9% saline at the same dose once daily for 10 days. The body weight, fecal quantity, and fecal moisture of mice were measured every day. Fecal granules of mice within 12 h after gavage were taken out and counted. Then, the feces were weighed before (wet weight) and after (dry weight) drying using an oven. The fecal moisture (%) = (wet weight − dry weight) * 100%/wet weight.
Treatment protocol of MCDThe preparation of MCD was based on the record of TCM [31, 32]. In brief, mirabilite (a mineral containing Na2SO4·10H2O), rhubarb (Rheum palmatum L.), maren, zhishi (incompletely mature fruit of Citrus aurantium L.), and magnolia officinalis, were prepared according to the ratio of 4:2:2:1:1. Firstly, magnolia officinalis, zhi-shi, and maren (crushed) were mixed and boiled with water for 60 min and then filtered. The rhubarb was added to the filtration and boiled for another 30 min, and the mirabilite was finally added. The products were
separately concentrated to 1.6 g/mL (high dose), 0.8 g/mL (middle dose), and 0.4 g/mL (low dose) using the rotary evaporator. The constipation mice that were suc-cessfully modeled were randomly divided into 5 groups immediately (n = 10/group), and 3 groups of them were given high dose, middle dose, and low dose of MCD, respectively. Another 2 groups were given 4% magnesium sulfate (positive control group) and 0.9% saline (model group), respectively. The 10 mice of healthy control were given 0.9% saline (control group) during the treatment period, too. The dose for all 6 groups was 1 mL/100 g body weight once daily for 5 days. The body weight, fecal quantity, and fecal moisture of mice were measured every day. [68Ga]Ga-NOTA PET dynamic scans using liquid test meals were performed after the treatment was fin-ished immediately.
Statistical analysisThe data were presented as mean ± SD. Statistical analy-sis was performed using Stata/SE 12.0. The differences between groups were analyzed by student t-test and one-way ANOVA with Bonferroni post-hoc test. Pearson’s correlation coefficient was used to evaluate the asso-ciation between radioactivity calculated by ASIPro and PMOD. Results were considered statistically significant as p < 0.05.
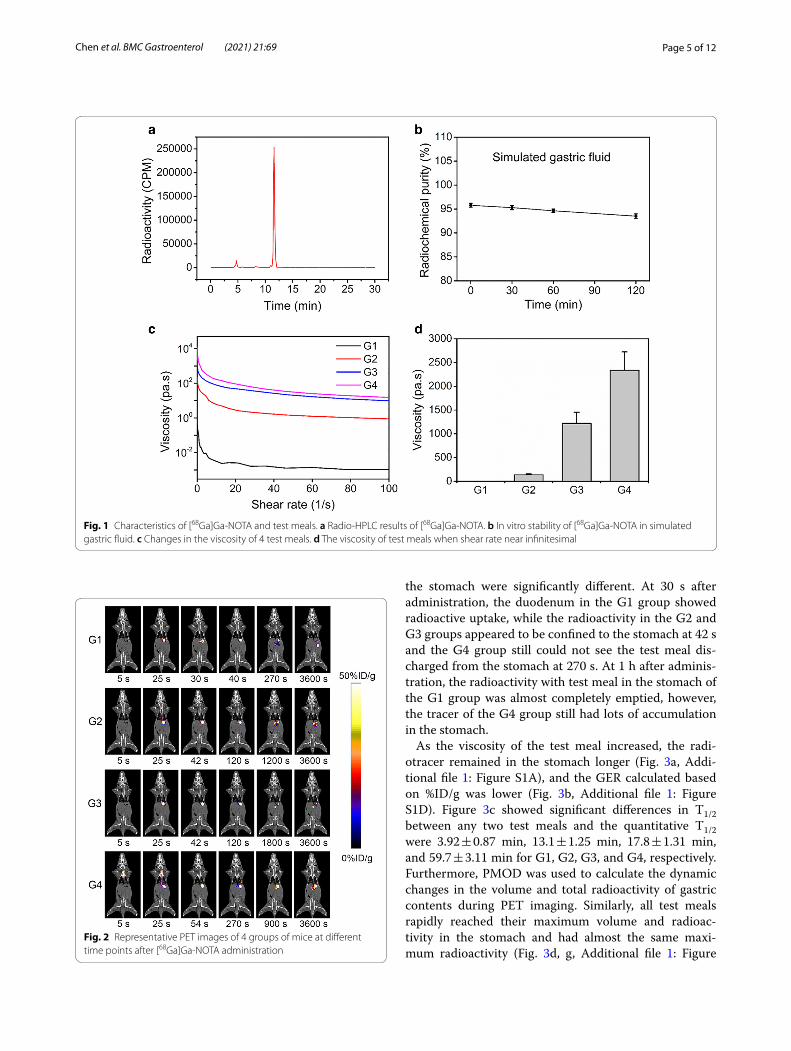
ResultsRadiochemistry and in vitro stabilityThe synthesis of [68Ga]Ga-NOTA was completed within 20 min with a radiochemical purity > 95% (Fig. 1a). The retention times of 68Ga3+ and [68Ga]Ga-NOTA in HPLC were approximately 4.7 and 11.6 min, respectively. After incubated in simulated gastric fluid for 2 h, the radio-chemical purity of [68Ga]Ga-NOTA was still higher than 90% (Fig. 1b).
Test mealsThe viscosity of 4 test meals decreased with increas-ing shear rates (Fig. 1c). At room temperature, when the shear rate was about 0.091 1/s (near infinitesimal), the viscosity of each test meal were 0.26 ± 0.05 Pa.s (G1), 0.137 × 10³ ± 0.020 × 10³ Pa.s (G2), 1.22 × 10³ ± 0.238 × 10³ Pa.s (G3), and 2.34 × 10³ ± 0.387 × 10³ Pa.s (G4), respectively (Fig. 1d).
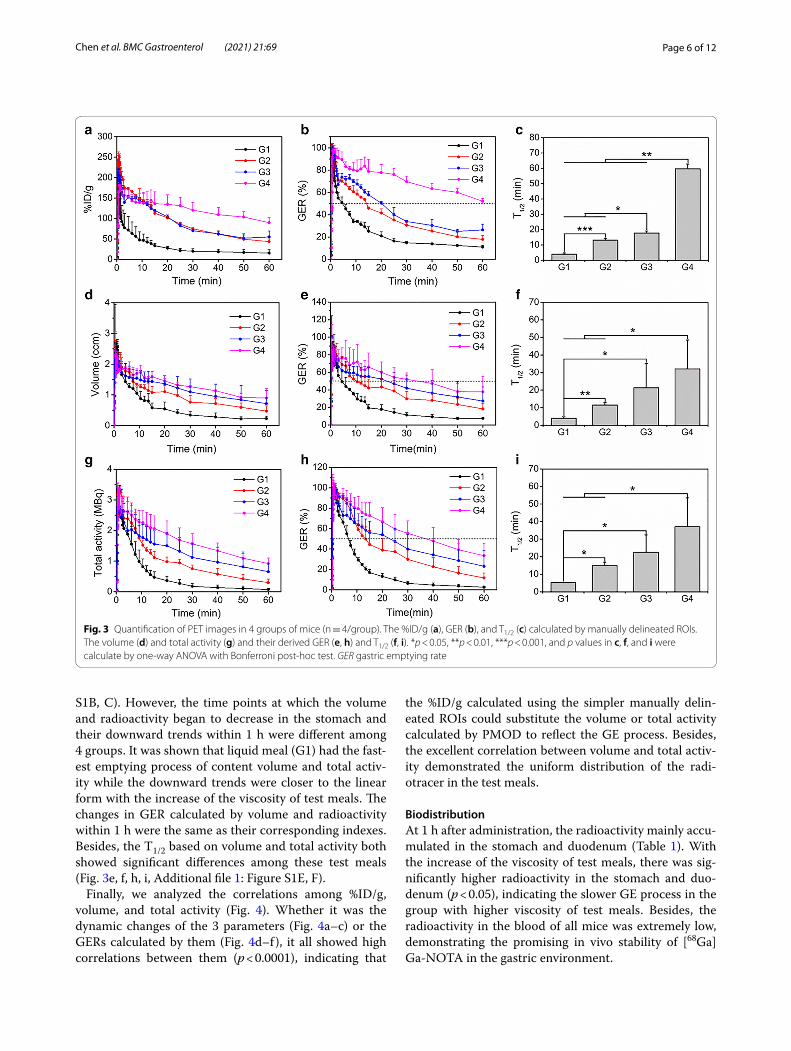
PET images and quantificationThe dynamic accumulation and emptying process of 4 test meals in the stomach was presented on the PET images (Fig. 2). Although the 4 groups of mice reached the maximum radioactivity in the stomach at similar time points by gavage, the PET images showed that the time points at which different contents were discharged from
Page 5 of 12Chen et al. BMC Gastroenterol (2021) 21:69
the stomach were significantly different. At 30 s after administration, the duodenum in the G1 group showed radioactive uptake, while the radioactivity in the G2 and G3 groups appeared to be confined to the stomach at 42 s and the G4 group still could not see the test meal dis-charged from the stomach at 270 s. At 1 h after adminis-tration, the radioactivity with test meal in the stomach of the G1 group was almost completely emptied, however, the tracer of the G4 group still had lots of accumulation in the stomach.
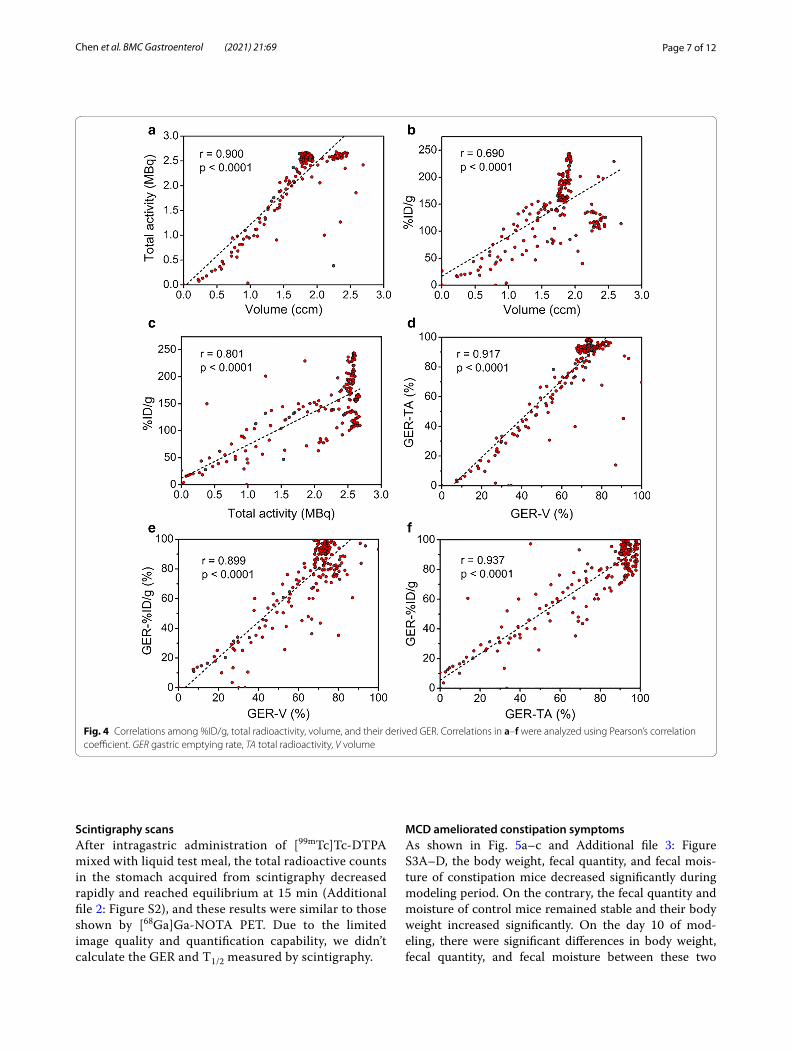
As the viscosity of the test meal increased, the radi-otracer remained in the stomach longer (Fig. 3a, Addi-tional file 1: Figure S1A), and the GER calculated based on %ID/g was lower (Fig. 3b, Additional file 1: Figure S1D). Figure 3c showed significant differences in T1/2 between any two test meals and the quantitative T1/2 were 3.92 ± 0.87 min, 13.1 ± 1.25 min, 17.8 ± 1.31 min, and 59.7 ± 3.11 min for G1, G2, G3, and G4, respectively. Furthermore, PMOD was used to calculate the dynamic changes in the volume and total radioactivity of gastric contents during PET imaging. Similarly, all test meals rapidly reached their maximum volume and radioac-tivity in the stomach and had almost the same maxi-mum radioactivity (Fig. 3d, g, Additional file 1: Figure
Fig. 1 Characteristics of [68Ga]Ga-NOTA and test meals. a Radio-HPLC results of [68Ga]Ga-NOTA. b In vitro stability of [68Ga]Ga-NOTA in simulated gastric fluid. c Changes in the viscosity of 4 test meals. d The viscosity of test meals when shear rate near infinitesimal
Fig. 2 Representative PET images of 4 groups of mice at different time points after [68Ga]Ga-NOTA administration
Page 6 of 12Chen et al. BMC Gastroenterol (2021) 21:69
S1B, C). However, the time points at which the volume and radioactivity began to decrease in the stomach and their downward trends within 1 h were different among 4 groups. It was shown that liquid meal (G1) had the fast-est emptying process of content volume and total activ-ity while the downward trends were closer to the linear form with the increase of the viscosity of test meals. The changes in GER calculated by volume and radioactivity within 1 h were the same as their corresponding indexes. Besides, the T1/2 based on volume and total activity both showed significant differences among these test meals (Fig. 3e, f, h, i, Additional file 1: Figure S1E, F).
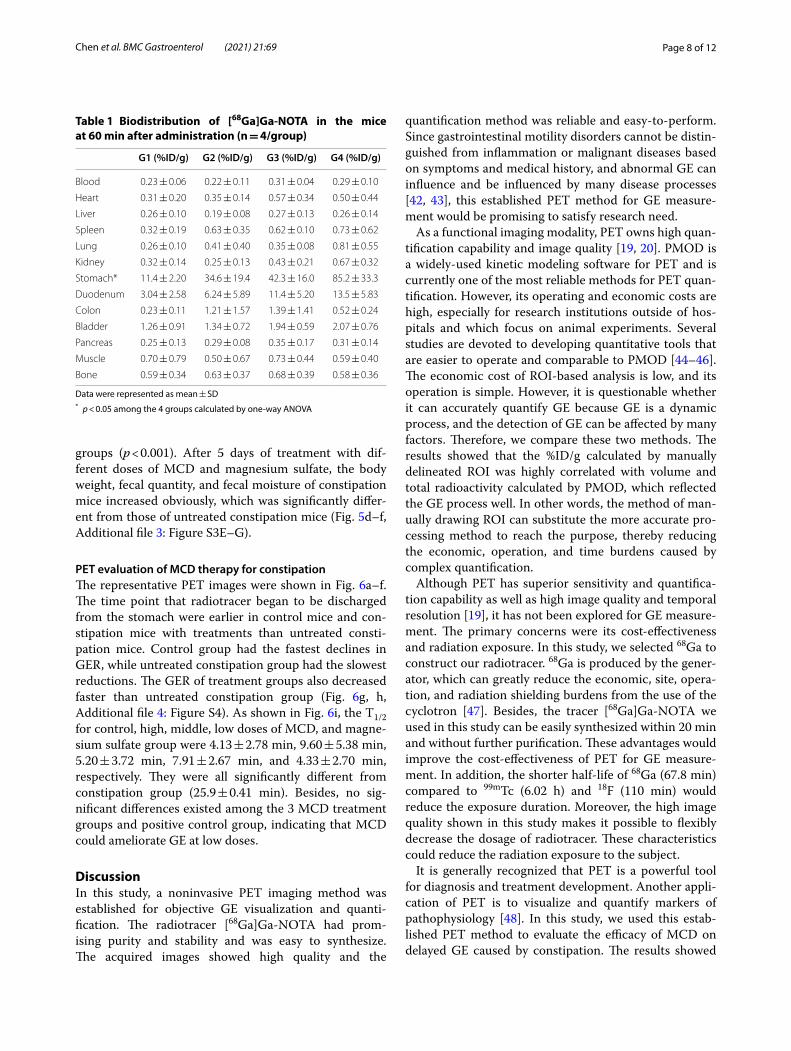
Finally, we analyzed the correlations among %ID/g, volume, and total activity (Fig. 4). Whether it was the dynamic changes of the 3 parameters (Fig. 4a–c) or the GERs calculated by them (Fig. 4d–f), it all showed high correlations between them (p < 0.0001), indicating that
the %ID/g calculated using the simpler manually delin-eated ROIs could substitute the volume or total activity calculated by PMOD to reflect the GE process. Besides, the excellent correlation between volume and total activ-ity demonstrated the uniform distribution of the radi-otracer in the test meals.
BiodistributionAt 1 h after administration, the radioactivity mainly accu-mulated in the stomach and duodenum (Table 1). With the increase of the viscosity of test meals, there was sig-nificantly higher radioactivity in the stomach and duo-denum (p < 0.05), indicating the slower GE process in the group with higher viscosity of test meals. Besides, the radioactivity in the blood of all mice was extremely low, demonstrating the promising in vivo stability of [68Ga]Ga-NOTA in the gastric environment.
Fig. 3 Quantification of PET images in 4 groups of mice (n = 4/group). The %ID/g (a), GER (b), and T1/2 (c) calculated by manually delineated ROIs. The volume (d) and total activity (g) and their derived GER (e, h) and T1/2 (f, i). *p < 0.05, **p < 0.01, ***p < 0.001, and p values in c, f, and i were calculate by one-way ANOVA with Bonferroni post-hoc test. GER gastric emptying rate
Page 7 of 12Chen et al. BMC Gastroenterol (2021) 21:69
Scintigraphy scansAfter intragastric administration of [99mTc]Tc-DTPA mixed with liquid test meal, the total radioactive counts in the stomach acquired from scintigraphy decreased rapidly and reached equilibrium at 15 min (Additional file 2: Figure S2), and these results were similar to those shown by [68Ga]Ga-NOTA PET. Due to the limited image quality and quantification capability, we didn’t calculate the GER and T1/2 measured by scintigraphy.
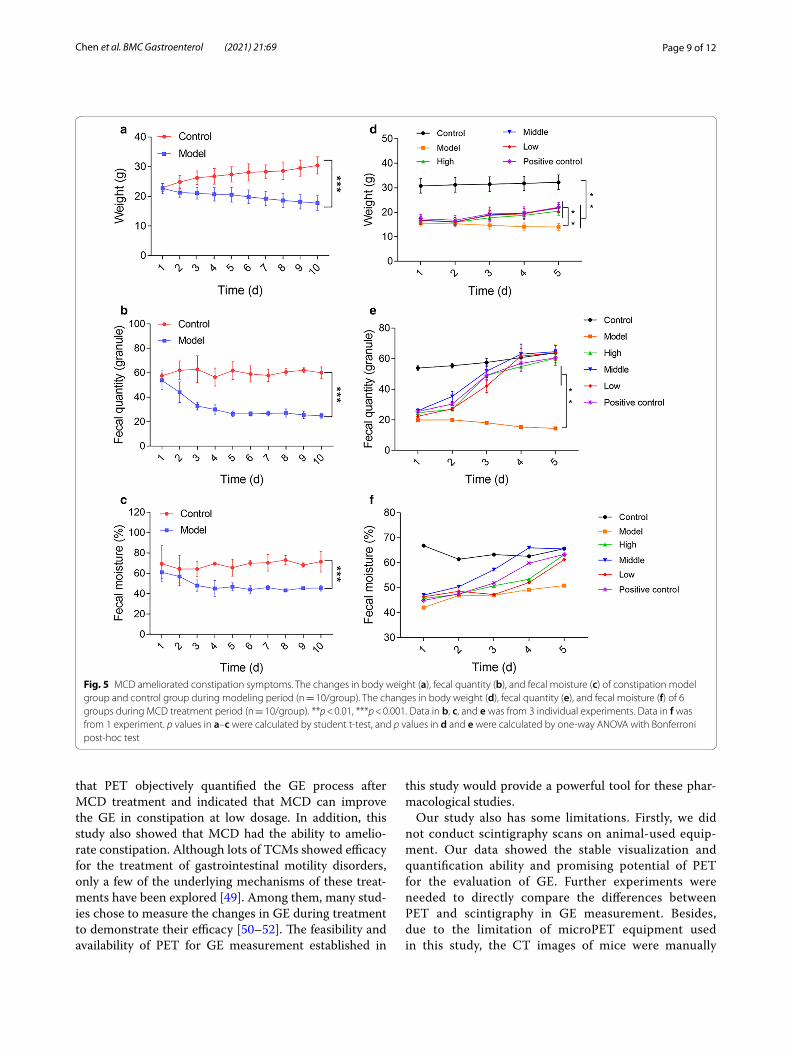
MCD ameliorated constipation symptomsAs shown in Fig. 5a–c and Additional file 3: Figure S3A–D, the body weight, fecal quantity, and fecal mois-ture of constipation mice decreased significantly during modeling period. On the contrary, the fecal quantity and moisture of control mice remained stable and their body weight increased significantly. On the day 10 of mod-eling, there were significant differences in body weight, fecal quantity, and fecal moisture between these two
Fig. 4 Correlations among %ID/g, total radioactivity, volume, and their derived GER. Correlations in a–f were analyzed using Pearson’s correlation coefficient. GER gastric emptying rate, TA total radioactivity, V volume
Page 8 of 12Chen et al. BMC Gastroenterol (2021) 21:69
groups (p < 0.001). After 5 days of treatment with dif-ferent doses of MCD and magnesium sulfate, the body weight, fecal quantity, and fecal moisture of constipation mice increased obviously, which was significantly differ-ent from those of untreated constipation mice (Fig. 5d–f, Additional file 3: Figure S3E–G).
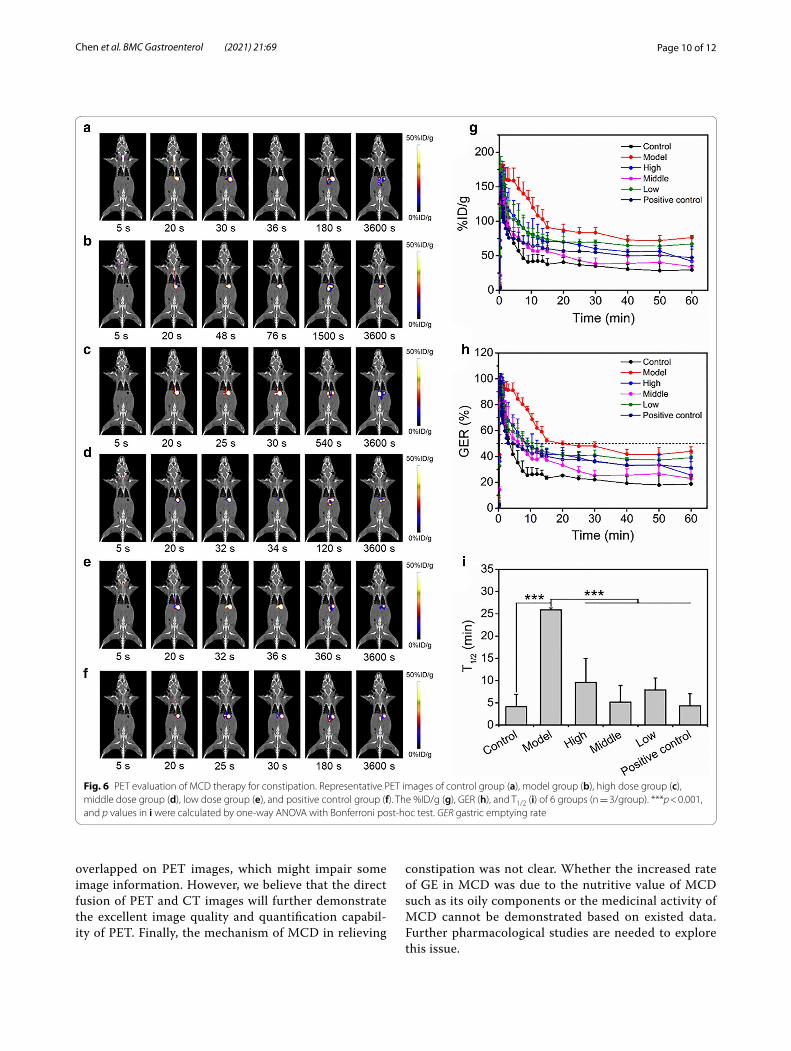
PET evaluation of MCD therapy for constipationThe representative PET images were shown in Fig. 6a–f. The time point that radiotracer began to be discharged from the stomach were earlier in control mice and con-stipation mice with treatments than untreated consti-pation mice. Control group had the fastest declines in GER, while untreated constipation group had the slowest reductions. The GER of treatment groups also decreased faster than untreated constipation group (Fig. 6g, h, Additional file 4: Figure S4). As shown in Fig. 6i, the T1/2 for control, high, middle, low doses of MCD, and magne-sium sulfate group were 4.13 ± 2.78 min, 9.60 ± 5.38 min, 5.20 ± 3.72 min, 7.91 ± 2.67 min, and 4.33 ± 2.70 min, respectively. They were all significantly different from constipation group (25.9 ± 0.41 min). Besides, no sig-nificant differences existed among the 3 MCD treatment groups and positive control group, indicating that MCD could ameliorate GE at low doses.
DiscussionIn this study, a noninvasive PET imaging method was established for objective GE visualization and quanti-fication. The radiotracer [68Ga]Ga-NOTA had prom-ising purity and stability and was easy to synthesize. The acquired images showed high quality and the
quantification method was reliable and easy-to-perform. Since gastrointestinal motility disorders cannot be distin-guished from inflammation or malignant diseases based on symptoms and medical history, and abnormal GE can influence and be influenced by many disease processes [42, 43], this established PET method for GE measure-ment would be promising to satisfy research need.
As a functional imaging modality, PET owns high quan-tification capability and image quality [19, 20]. PMOD is a widely-used kinetic modeling software for PET and is currently one of the most reliable methods for PET quan-tification. However, its operating and economic costs are high, especially for research institutions outside of hos-pitals and which focus on animal experiments. Several studies are devoted to developing quantitative tools that are easier to operate and comparable to PMOD [44–46]. The economic cost of ROI-based analysis is low, and its operation is simple. However, it is questionable whether it can accurately quantify GE because GE is a dynamic process, and the detection of GE can be affected by many factors. Therefore, we compare these two methods. The results showed that the %ID/g calculated by manually delineated ROI was highly correlated with volume and total radioactivity calculated by PMOD, which reflected the GE process well. In other words, the method of man-ually drawing ROI can substitute the more accurate pro-cessing method to reach the purpose, thereby reducing the economic, operation, and time burdens caused by complex quantification.
Although PET has superior sensitivity and quantifica-tion capability as well as high image quality and temporal resolution [19], it has not been explored for GE measure-ment. The primary concerns were its cost-effectiveness and radiation exposure. In this study, we selected 68Ga to construct our radiotracer. 68Ga is produced by the gener-ator, which can greatly reduce the economic, site, opera-tion, and radiation shielding burdens from the use of the cyclotron [47]. Besides, the tracer [68Ga]Ga-NOTA we used in this study can be easily synthesized within 20 min and without further purification. These advantages would improve the cost-effectiveness of PET for GE measure-ment. In addition, the shorter half-life of 68Ga (67.8 min) compared to 99mTc (6.02 h) and 18F (110 min) would reduce the exposure duration. Moreover, the high image quality shown in this study makes it possible to flexibly decrease the dosage of radiotracer. These characteristics could reduce the radiation exposure to the subject.
It is generally recognized that PET is a powerful tool for diagnosis and treatment development. Another appli-cation of PET is to visualize and quantify markers of pathophysiology [48]. In this study, we used this estab-lished PET method to evaluate the efficacy of MCD on delayed GE caused by constipation. The results showed
Table 1 Biodistribution of [68Ga]Ga-NOTA in the mice at 60 min after administration (n = 4/group)
Data were represented as mean ± SD* p < 0.05 among the 4 groups calculated by one-way ANOVA
G1 (%ID/g) G2 (%ID/g) G3 (%ID/g) G4 (%ID/g)
Blood 0.23 ± 0.06 0.22 ± 0.11 0.31 ± 0.04 0.29 ± 0.10
Heart 0.31 ± 0.20 0.35 ± 0.14 0.57 ± 0.34 0.50 ± 0.44
Liver 0.26 ± 0.10 0.19 ± 0.08 0.27 ± 0.13 0.26 ± 0.14
Spleen 0.32 ± 0.19 0.63 ± 0.35 0.62 ± 0.10 0.73 ± 0.62
Lung 0.26 ± 0.10 0.41 ± 0.40 0.35 ± 0.08 0.81 ± 0.55
Kidney 0.32 ± 0.14 0.25 ± 0.13 0.43 ± 0.21 0.67 ± 0.32
Stomach* 11.4 ± 2.20 34.6 ± 19.4 42.3 ± 16.0 85.2 ± 33.3
Duodenum 3.04 ± 2.58 6.24 ± 5.89 11.4 ± 5.20 13.5 ± 5.83
Colon 0.23 ± 0.11 1.21 ± 1.57 1.39 ± 1.41 0.52 ± 0.24
Bladder 1.26 ± 0.91 1.34 ± 0.72 1.94 ± 0.59 2.07 ± 0.76
Pancreas 0.25 ± 0.13 0.29 ± 0.08 0.35 ± 0.17 0.31 ± 0.14
Muscle 0.70 ± 0.79 0.50 ± 0.67 0.73 ± 0.44 0.59 ± 0.40
Bone 0.59 ± 0.34 0.63 ± 0.37 0.68 ± 0.39 0.58 ± 0.36
Page 9 of 12Chen et al. BMC Gastroenterol (2021) 21:69
that PET objectively quantified the GE process after MCD treatment and indicated that MCD can improve the GE in constipation at low dosage. In addition, this study also showed that MCD had the ability to amelio-rate constipation. Although lots of TCMs showed efficacy for the treatment of gastrointestinal motility disorders, only a few of the underlying mechanisms of these treat-ments have been explored [49]. Among them, many stud-ies chose to measure the changes in GE during treatment to demonstrate their efficacy [50–52]. The feasibility and availability of PET for GE measurement established in
this study would provide a powerful tool for these phar-macological studies.
Our study also has some limitations. Firstly, we did not conduct scintigraphy scans on animal-used equip-ment. Our data showed the stable visualization and quantification ability and promising potential of PET for the evaluation of GE. Further experiments were needed to directly compare the differences between PET and scintigraphy in GE measurement. Besides, due to the limitation of microPET equipment used in this study, the CT images of mice were manually
Fig. 5 MCD ameliorated constipation symptoms. The changes in body weight (a), fecal quantity (b), and fecal moisture (c) of constipation model group and control group during modeling period (n = 10/group). The changes in body weight (d), fecal quantity (e), and fecal moisture (f) of 6 groups during MCD treatment period (n = 10/group). **p < 0.01, ***p < 0.001. Data in b, c, and e was from 3 individual experiments. Data in f was from 1 experiment. p values in a–c were calculated by student t-test, and p values in d and e were calculated by one-way ANOVA with Bonferroni post-hoc test
Page 10 of 12Chen et al. BMC Gastroenterol (2021) 21:69
overlapped on PET images, which might impair some image information. However, we believe that the direct fusion of PET and CT images will further demonstrate the excellent image quality and quantification capabil-ity of PET. Finally, the mechanism of MCD in relieving
constipation was not clear. Whether the increased rate of GE in MCD was due to the nutritive value of MCD such as its oily components or the medicinal activity of MCD cannot be demonstrated based on existed data. Further pharmacological studies are needed to explore this issue.
Fig. 6 PET evaluation of MCD therapy for constipation. Representative PET images of control group (a), model group (b), high dose group (c), middle dose group (d), low dose group (e), and positive control group (f). The %ID/g (g), GER (h), and T1/2 (i) of 6 groups (n = 3/group). ***p < 0.001, and p values in i were calculated by one-way ANOVA with Bonferroni post-hoc test. GER gastric emptying rate
Page 11 of 12Chen et al. BMC Gastroenterol (2021) 21:69
ConclusionsIn summary, this study established a noninvasive PET imaging method for GE measurement in mice. The powerful quantification and visualization capabilities of PET made it a unique and important value for evaluat-ing GE. Besides, the more cost-effective radiotracer and quantification method we explored overcame its short-comings and made it more convenient for applications. The improvement of GE in constipation during MCD treatment was demonstrated by PET. These results demonstrated the feasibility and potential of PET for GE measurement.
Supplementary InformationThe online version contains supplementary material available at https ://doi.org/10.1186/s1287 6-021-01642 -7.
Additional file 1: Quantification of the first 3 min of dynamic PET images in 4 groups of mice (n = 4/group).
Additional file 2: Results of scintigraphy.
Additional file 3: Fecal conditions of the mice.
Additional file 4: Quantification of the first 1.5 min of dynamic PET images in 6 groups of mice after treatment period (n = 3/group).
AbbreviationsGE: Gastric emptying; MRI: Magnetic resonance imaging; PET: Positron emis-sion tomography; TCM: Traditional Chinese medicine; MCD: Maren chengqi decoction; ROI: Region of interest; GER: Gastric emptying rate; TAC : Time-activity curve; T1/2: Half of GE time; CT: Computed tomography; SPECT: Single-photon emission computed tomography.
AcknowledgementsNot applicable.
Authors’ contributionsMY, JL, and XW designed research. XC, YL, MC, and DP conducted experiments. YW and YX analyzed the data. YL and JY performed statistical analysis and made the figures and tables. LW reared and cared for the mice. YL and MY wrote the manuscript. All authors read and approved the final manuscript.
FundingThis work was supported by National Key Research and Development Pro-gram (2016YFC1306600), National Significant New Drugs Creation Program (2017ZX09304021), National Natural Science Foundation (31971316 and 31671035), Jiangsu Provincial Medical Innovation Team (CXTDA2017024), and Jiangsu Province Foundation (BK20170204). The founders had no role in the study design, data collection and analysis, decision to publish, or preparation of the manuscript.
Availability of data and materialsThe datasets used and analyzed during the current study are available from the corresponding author on reasonable request.
Ethics approval and consent to participateAll animal experiments were approved by the Laboratory Animal Manage-ment and Ethics Committee of Jiangsu Institute of Nuclear Medicine (Ethical Committee Number: JSINM-2018-043).
Consent for publicationNot applicable.
Competing interestsThe authors declare that they have no competing interests.
Author details1 Department of Veterinary Medicine, Southwest University, Rongchang, Chongqing 402460, China. 2 NHC Key Laboratory of Nuclear Medicine, Jiangsu Key Laboratory of Molecular Nuclear Medicine, Jiangsu Institute of Nuclear Medicine, Wuxi 214063, Jiangsu, China. 3 Immunology Center, Medical Research Institute of Southwest University, Rongchang, Chongqing 402460, China.
Received: 28 May 2020 Accepted: 3 February 2021
References 1. Stanghellini V, Chan FK, Hasler WL, et al. Gastroduodenal disorders. Gas-
troenterology. 2016;150(6):1380–92. 2. Camilleri M, Ford AC, Mawe GM, et al. Chronic constipation. Nat Rev Dis
Primers. 2017;3:17095. 3. Keller J, Bassotti G, Clarke J, et al. Expert consensus document: advances
in the diagnosis and classification of gastric and intestinal motility disor-ders. Nat Rev Gastroenterol Hepatol. 2018;15(5):291–308.
4. Vijayvargiya P, Jameie-Oskooei S, Camilleri M, et al. Association between delayed gastric emptying and upper gastrointestinal symptoms: a sys-tematic review and meta-analysis. Gut. 2019;68(5):804–13.
5. Greis C, Rasuly Z, Janosi RA, et al. Intestinal T lymphocyte homing is asso-ciated with gastric emptying and epithelial barrier function in critically ill: a prospective observational study. Crit Care. 2017;21(1):70.
6. Phillips LK, Deane AM, Jones KL, et al. Gastric emptying and glycaemia in health and diabetes mellitus. Nat Rev Endocrinol. 2015;11(2):112–28.
7. Knudsen K, Szwebs M, Hansen AK, et al. Gastric emptying in Parkinson’s disease—a mini-review. Parkinsonism Relat Disord. 2018;55:18–25.
8. Lang Lehrskov L, Lyngbaek MP, Soederlund L, et al. Interleukin-6 delays gastric emptying in humans with direct effects on glycemic control. Cell Metab. 2018;27(6):1201-11.e1203.
9. Vijayvargiya P, Camilleri M, Chedid V, et al. Effects of promotility agents on gastric emptying and symptoms: a systematic review and meta-analysis. Gastroenterology. 2019;156(6):1650–60.
10. Thomaides T, Karapanayiotides T, Zoukos Y, et al. Gastric emptying after semi-solid food in multiple system atrophy and Parkinson disease. J Neurol. 2005;252(9):1055–9.
11. Phillips LK, Rayner CK, Jones KL, et al. Measurement of gastric emptying in diabetes. J Diabetes Complicat. 2014;28(6):894–903.
12. Keller J, Andresen V, Wolter J, et al. Influence of clinical parameters on the results of 13C-octanoic acid breath tests: examination of different mathematical models in a large patient cohort. Neurogastroenterol Motil. 2009;21(10):1039-e1083.
13. Szarka LA, Camilleri M. Methods for measurement of gastric motility. Am J Physiol Gastrointest Liver Physiol. 2009;296(3):G461–75.
14. Roda A, Mezzanotte L, Aldini R, et al. A new gastric-emptying mouse model based on in vivo non-invasive bioluminescence imaging. Neuro-gastroenterol Motil. 2010;22(10):1117-e1288.
15. Schmidt PT, Abrahamsson H, Dolk A, et al. Methods to assess gastric motility and sensation. Scand J Gastroenterol. 2008;43(11):1285–95.
16. Gomez-Lado N, Seoane-Viano I, Matiz S, et al. Gastrointestinal tracking and gastric emptying of coated capsules in rats with or without sedation using CT imaging. Pharmaceutics. 2020;12(1):81.
17. Maurer AH. Gastrointestinal motility, part 1: esophageal transit and gastric emptying. J Nucl Med. 2015;56(8):1229–38.
18. Abell TL, Camilleri M, Donohoe K, et al. Consensus recommendations for gastric emptying scintigraphy: a joint report of the American Neurogas-troenterology and Motility Society and the Society of Nuclear Medicine. Am J Gastroenterol. 2008;103(3):753–63.
19. Ge J, Zhang Q, Zeng J, et al. Radiolabeling nanomaterials for multimodal-ity imaging: new insights into nuclear medicine and cancer diagnosis. Biomaterials. 2020;228:119553.
20. Conway J. Lung imaging—two dimensional gamma scintigraphy, SPECT, CT and PET. Adv Drug Deliv Rev. 2012;64(4):357–68.
21. LeBlanc AK, Peremans K. PET and SPECT imaging in veterinary medicine. Semin Nucl Med. 2014;44(1):47–56.
Page 12 of 12Chen et al. BMC Gastroenterol (2021) 21:69
• fast, convenient online submission
•
thorough peer review by experienced researchers in your field
• rapid publication on acceptance
• support for research data, including large and complex data types
•
gold Open Access which fosters wider collaboration and increased citations
maximum visibility for your research: over 100M website views per year •
At BMC, research is always in progress.
Learn more biomedcentral.com/submissions
Ready to submit your researchReady to submit your research ? Choose BMC and benefit from: ? Choose BMC and benefit from:
22. Goyanes A, Fernandez-Ferreiro A, Majeed A, et al. PET/CT imaging of 3D printed devices in the gastrointestinal tract of rodents. Int J Pharm. 2018;536(1):158–64.
23. Yamashita S, Takashima T, Kataoka M, et al. PET imaging of the gastro-intestinal absorption of orally administered drugs in conscious and anesthetized rats. J Nucl Med. 2011;52(2):249–56.
24. Shingaki T, Takashima T, Wada Y, et al. Imaging of gastrointestinal absorp-tion and biodistribution of an orally administered probe using positron emission tomography in humans. Clin Pharmacol Ther. 2012;91(4):653–9.
25. Amor-Coarasa A, Schoendorf M, Meckel M, et al. Comprehensive quality control of the ITG 68Ge/68Ga generator and synthesis of 68Ga-DOTATOC and 68Ga-PSMA-HBED-CC for clinical imaging. J Nucl Med. 2016;57(9):1402–5.
26. Rao SS, Rattanakovit K, Patcharatrakul T. Diagnosis and management of chronic constipation in adults. Nat Rev Gastroenterol Hepatol. 2016;13(5):295–305.
27. Belsey J, Greenfield S, Candy D, et al. Systematic review: impact of consti-pation on quality of life in adults and children. Aliment Pharmacol Ther. 2010;31(9):938–49.
28. Gong H, Qin F, He H. Herbal formula modified Buzhong-Yiqi-Tang for functional constipation in adults: a meta-analysis of randomized con-trolled trials. Evid Based Complement Altern Med. 2018;2018:9602525.
29. Peng W, Liang H, Sibbritt D, et al. Complementary and alternative medicine use for constipation: a critical review focusing upon prevalence, type, cost, and users’ profile, perception and motivations. Int J Clin Pract. 2016;70(9):712–22.
30. Chen P, Jiang L, Geng H, et al. Effectiveness of Xinglouchengqi decoction on constipation in patients with acute ischemic stroke: a randomized controlled trial. J Tradit Chin Med. 2020;40(1):112–20.
31. Chu X, Zhou Y, Wang Y, et al. A study on effect of Chengqi Tang combined with enteral nutrition on enteral resuscitation in patients with severe traumatic brain injury. J New Chin Med. 2019;51(9):50–2.
32. Yu L, Zhuang S. Clinical study on transnasal ileus tube combined with enema with compound Dachengqi Tang for adhesive intestinal obstruc-tion. J New Chin Med. 2019;51(8):120–3.
33. Ge H, Xu C, Chu L, et al. Effect of Fufang Dachengqi Decoction on the postoperative gastrointestinal motility in patients with esophageal cancer. Chin J Nurs. 2011;46(6):576–8.
34. Li D, Xie Z, Li Y, et al. Effect and safety of Maren Soft Capsule on constipa-tion. Chin Tradit Herb Drugs. 2013;44(12):1645–7.
35. Cui J, Zheng Y. Clinic observation on efficacy of Maren Soft Capsule in prevention of constipation after anorectal operation. Chin Tradit Herb Drugs. 2014;45(8):1126–8.
36. Chen Z, Jin Z, Yuan Y. Clinical observation of Maren Soft Capsule in treatment of stroke patients with constipation. Chin Tradit Herb Drugs. 2016;47(3):466–8.
37. Reeves PG, Nielsen FH, Fahey GC Jr. AIN-93 purified diets for laboratory rodents: final report of the American Institute of Nutrition ad hoc writing committee on the reformulation of the AIN-76A rodent diet. J Nutr. 1993;123(11):1939–51.
38. Pienaar JA, Singh A, Barnard TG. Acid-happy: survival and recovery of enteropathogenic Escherichia coli (EPEC) in simulated gastric fluid. Microb Pathog. 2019;128:396–404.
39. Xu Q, Zhu C, Xu Y, et al. Preliminary evaluation of [18F]AlF-NOTA-MAL-Cys39-exendin-4 in insulinoma with PET. J Drug Target. 2015;23(9):813–20.
40. Wang J, Chen Y, Yuan ZM. Correlation between integrated pharmacoki-netics and pharmacodynamics of bile processed Rhizoma Coptidis in febrile rats. Acta pharm Sin. 2016;51(1):127–31.
41. Chen L, Zhang T, Peng C. 大黄不同炮制品对热结便秘模型大鼠结肠c-kitmRNA表达的影响. Pharmacol Clin Chin Mater Med. 2009;4:37–40.
42. Doi H, Sakakibara R, Sato M, et al. Plasma levodopa peak delay and impaired gastric emptying in Parkinson’s disease. J Neurol Sci. 2012;319(1–2):86–8.
43. Mihai BM, Mihai C, Cijevschi-Prelipcean C, et al. Bidirectional relationship between gastric emptying and plasma glucose control in normoglyce-mic individuals and diabetic patients. J Diabetes Res. 2018;2018:1736959.
44. Tjerkaski J, Cervenka S, Farde L, et al. Kinfitr—an open-source tool for reproducible PET modelling: validation and evaluation of test–retest reli-ability. EJNMMI Res. 2020;10(1):77.
45. Lopez-Gonzalez FJ, Paredes-Pacheco J, Thurnhofer-Hemsi K, et al. QMod-eling: a multiplatform, easy-to-use and open-source toolbox for PET kinetic analysis. Neuroinformatics. 2019;17(1):103–14.
46. Choi WH, Um YH, Jung WS, et al. Automated quantification of amyloid positron emission tomography: a comparison of PMOD and MIMneuro. Ann Nucl Med. 2016;30(10):682–9.
47. Velikyan I. 68Ga-Based radiopharmaceuticals: production and application relationship. Molecules. 2015;20(7):12913–43.
48. Setiawan E, Wilson AA, Mizrahi R, et al. Role of translocator protein den-sity, a marker of neuroinflammation, in the brain during major depressive episodes. JAMA Psychiatry. 2015;72(3):268–75.
49. Li DY, Dai YK, Zhang YZ, et al. Systematic review and meta-analysis of tra-ditional Chinese medicine in the treatment of constipation-predominant irritable bowel syndrome. PLoS ONE. 2017;12(12):e0189491.
50. Yanai M, Mochiki E, Ogawa A, et al. Intragastric administration of rikkun-shito stimulates upper gastrointestinal motility and gastric emptying in conscious dogs. J Gastroenterol. 2013;48(5):611–9.
51. Shin SJ, Kim D, Kim JS, et al. Effects of Gamisoyo-San Decoction, a traditional Chinese medicine, on gastrointestinal motility. Digestion. 2018;98(4):231–7.
52. Wang X, Zhang C, Zheng M, et al. Metabolomics analysis of L-arginine induced gastrointestinal motility disorder in rats using UPLC-MS after magnolol treatment. Front Pharmacol. 2019;10:183.
Publisher’s NoteSpringer Nature remains neutral with regard to jurisdictional claims in pub-lished maps and institutional affiliations.