FY2021 Annual Operating and Capital Budget - Palomar Health
40
FY2021 Annual Operating and Capital Budget Board of Directors Budget Presentation June 16, 2020
-
Upload
khangminh22 -
Category
Documents
-
view
0 -
download
0
Transcript of FY2021 Annual Operating and Capital Budget - Palomar Health
FY2021 Annual Operating and Capital BudgetBoard of Directors Budget PresentationJune 16, 2020

Executive Summary
FY2021 Budget Overview:
• Key Budget Drivers | Inflationary Assumptions
Key Statistical / Growth Indicators
Revenue:
• Key Revenue Assumptions / Payor Mix• Revenue Trend Analysis
Salaries, Wages, Benefits & FTEs:
• Salaries, Wages, Benefits and FTE Trend Analysis
Non Labor Analysis:
• Supplies | Professional Fees | Purchased Services | Other Direct Expense
FY2021 Annual Budget Summary / EBIDA Recap
Three-Year Capital Plan
Five-Year Financial Projections
2
Agenda

The FY2021 budget lays out a plan for the coming fiscal -year that has been designed to keep Palomar Health on a pathway toward achieving the five-year strategic financial and capital plan and incorporated the impact of the COVID-19 pandemic / recovery plan. The plan includes the following:
• EBIDA of $81.6 million, with growth of $6.9 million from current projected FY2020 performance
• Continued deployment of capital resources from the 2017 issuance of Certificates of Participation (revenue bonds)
• FY2021 includes the addition of 101 clinical FTEs in key areas to align with current practice, industry standards, and community needs
• Expense management initiatives designed to offset revenue losses associated with lower patient volume and revenue
• Continued focus on key organizational goals regarding clinical excellence /outcomes and patient satisfaction
• Reimbursement enhancement strategies that yield rate increases consistent with annual expense inflation
• Alignment of the operating and capital budgets with our current year and long-term strategic plan objectives
Executive SummaryFY2021 Annual Operating and Capital Budget
3

FY2021 Budget – Key Drivers & Overview
4

• Strategic Plan alignment including year-over-year EBIDA improvement, which is consistent with the long-range financial and capital plan targets
• Volume projections reflective of the current situation with a slow building back to pre-COVID-19 levels
• Closure of the Downtown Campus in Q1 drives a reduction of overhead expenses and realignment of services to other locations and sale of the real estate assets in FY2021
• Opening of the expanded Crisis Stabilization Unit and restructured staffing models in the Emergency Department are both designed to better serve the Behavioral Health population
• Opportunity to minimize supply inflation, via strategic purchasing initiatives and vendor renegotiation, is offset by increasing costs driven by PPE shortages
• Salary and wage increases in alignment with the provisions of the current labor union agreements and market dynamics
• Reimbursement pressures driven by industry / payor relationships offset by revenue capture improvement initiatives in revenue cycle and contracting strategies
Key Budget Drivers
5
FY2021 Annual Operating and Capital Budget

• FY2021 budget is based on
industry-wide expectations,
though the COVID-19
pandemic increases the risk of
greater supply inflation for
PPE
• Palomar Health will continue
to focus on standardizing high
cost physician preference
products to offset COVID-19
related increases
Inflationary AssumptionsHealthcare Industry Inflation Comparison
6
FY2021 Annual Operating and Capital Budget
Category / ExpenseFY2021 Budget
Industry Expectation
Implants 0.5% 0-1.3%
General Surgery Supplies 0.5% 0.5%
Surgical Needles 0.5% 0.5%
Oxygen – Gas 4.8% 4.8%
IV Solutions 2.5% 2.5%
Pharmaceuticals 3.6% 3.0-3.9%
Radioactive and X-Ray Material 2.0% 0-4.0%
Other Medical 0.5% 0.5%
Food 3.0% 3.0%
Linen 0.7% 0.7%
All Other: Cleaning, Forms, Office, Uniforms 0-2.6% 1.0%

Key StatisticalIndicators
7

Adjusted Discharges (Incl. SNF)
FY2021 adjusted discharges are decreasing by 2,622 discharges, or 5.4%, year-over-year
8
FY2021 Annual Operating and Capital Budget
Key Statistical Indicators | Inpatient
0
20,000
40,000
60,000
80,000
100,000
120,000
140,000
160,000
FY17 FY18 FY19 Proj 20* Proj20**
Bud 21
96,802 92,715 95,577 93,740 86,675 79,726
60,351 54,845
59,332 60,794 59,340 70,049
North South
Total Patient Days FY2021 budgeted patient days are decreasing by 3.1% over the pre-COVID-19 projection for the current year
0
10,000
20,000
30,000
40,000
50,000
FY17 FY18 FY19 Proj 20* Proj 20** Bud 21
38,657 36,497 37,022 37,432 33,793 34,656
11,313 11,117 11,269 11,191
9,966
11,345
North South
*Pre-Covid**Post-Covid

DeliveriesFY2021 deliveries are decreasing 4.5% based on current year trends
SurgeriesFY2021 inpatient surgeries are decreasing by 6.8%, based on the anticipated COVID-19 impact on Q1 volumes
9
FY2021 Annual Operating and Capital Budget
Key Statistical Indicators | Inpatient
0
1,000
2,000
3,000
4,000
5,000
FY17 FY18 FY19 Proj 20* Proj20**
Bud 21
3,178 3,147 3,116 3,197 3,082 3,070
1,061 876 871 931
924 871
North South
*Pre-Covid**Post-Covid
0
2,000
4,000
6,000
8,000
10,000
FY17 FY18 FY19 Proj 20* Proj20**
Bud 21
7,647 6,799 6,445 6,679
5,730 6,263
1,748
1,541 1,469 1,291
1,116 1,164
North South
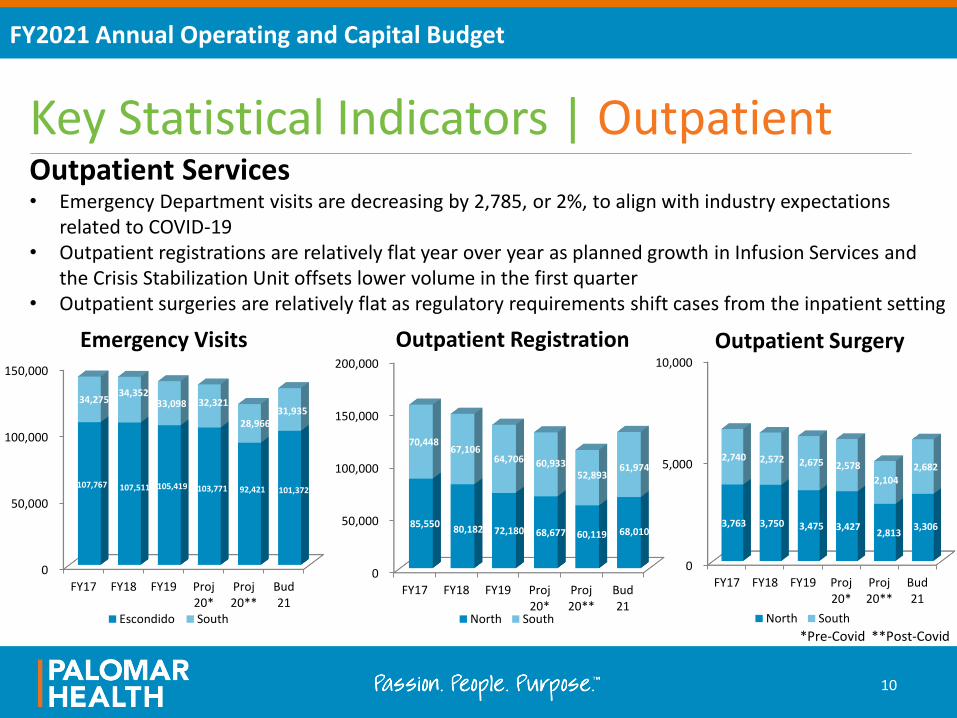
Outpatient Services• Emergency Department visits are decreasing by 2,785, or 2%, to align with industry expectations
related to COVID-19• Outpatient registrations are relatively flat year over year as planned growth in Infusion Services and
the Crisis Stabilization Unit offsets lower volume in the first quarter • Outpatient surgeries are relatively flat as regulatory requirements shift cases from the inpatient setting
10
FY2021 Annual Operating and Capital Budget
Key Statistical Indicators | Outpatient
0
50,000
100,000
150,000
200,000
FY17 FY18 FY19 Proj20*
Proj20**
Bud21
85,550 80,182 72,180 68,677 60,119 68,010
70,448 67,106
64,706 60,933 52,893
61,974
Outpatient Registration
North South
0
50,000
100,000
150,000
FY17 FY18 FY19 Proj20*
Proj20**
Bud21
107,767 107,511 105,419 103,771 92,421 101,372
34,275 34,352
33,098 32,321
28,966 31,935
Emergency Visits
Escondido South
0
5,000
10,000
FY17 FY18 FY19 Proj20*
Proj20**
Bud21
3,763 3,750 3,475 3,427 2,813
3,306
2,740 2,572 2,675 2,578
2,104 2,682
Outpatient Surgery
North South
*Pre-Covid **Post-Covid

0
20
40
60
80
100
Jul-20 Aug-20 Sep-20 Oct-20 Nov-20 Dec-20 Jan-21 Feb-21 Mar-21 Apr-21 May-21 Jun-21
47 45 46 48 47 45 48 47 48 51 44 54
14 14 14 14 14 14 14 14 14
26 26 26 26 26 26 26 26 2626
2626
South ADC
PMC - Poway ARU Behavioral Health
11
FY2021 Annual Operating and Capital Budget
Key Statistical Indicators | ADC by Month• Patient days are expected to begin the fiscal year low and slowly increase due to the COVID-19
pandemic • The Average Daily Census at Poway is driven by the movement of services from the Downtown Campus
150
200
250
300
Jul-20 Aug-20 Sep-20 Oct-20 Nov-20 Dec-20 Jan-21 Feb-21 Mar-21 Apr-21 May-21 Jun-21
202 204 218 216241 245 252 253 261 247 247 232
North ADC
PMC - Escondido

Revenue
12
Assumptions
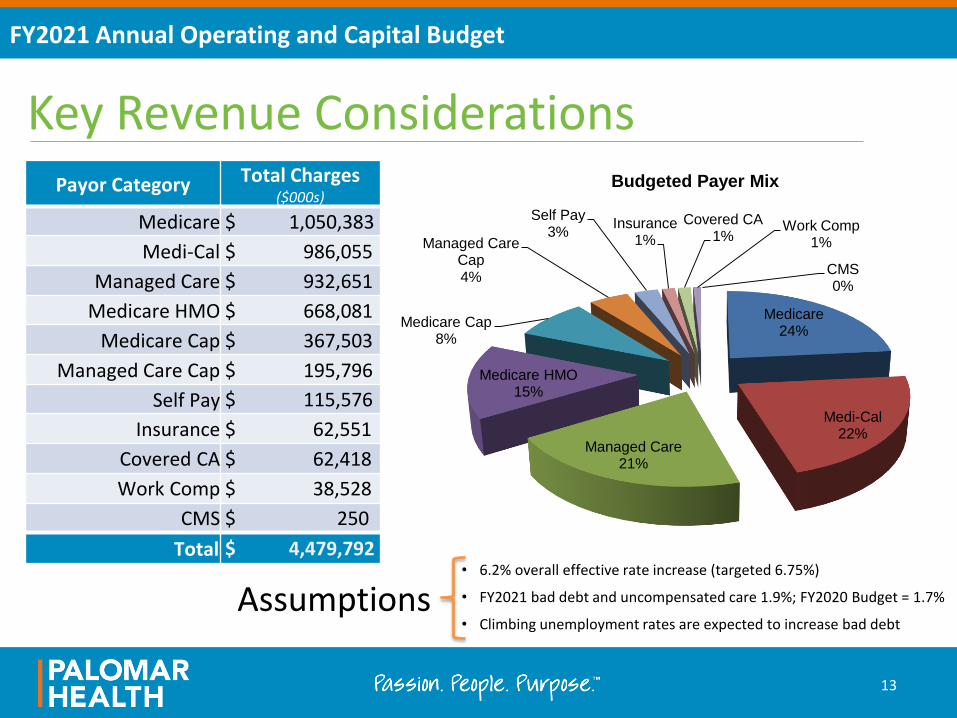
Key Revenue ConsiderationsPayor Category Total Charges
($000s)
Medicare $ 1,050,383
Medi-Cal $ 986,055
Managed Care $ 932,651
Medicare HMO $ 668,081
Medicare Cap $ 367,503
Managed Care Cap $ 195,796
Self Pay $ 115,576
Insurance $ 62,551
Covered CA $ 62,418
Work Comp $ 38,528
CMS $ 250
Total $ 4,479,792
FY2021 Annual Operating and Capital Budget
13
• 6.2% overall effective rate increase (targeted 6.75%)
• FY2021 bad debt and uncompensated care 1.9%; FY2020 Budget = 1.7%
• Climbing unemployment rates are expected to increase bad debt
Medicare24%
Medi-Cal22%
Managed Care21%
Medicare HMO15%
Medicare Cap8%
Managed Care Cap4%
Self Pay3%
Insurance1%
Covered CA1%
Work Comp 1%
CMS0%
Budgeted Payer Mix

$0
$500,000
$1,000,000
$1,500,000
$2,000,000
$2,500,000
$3,000,000
$3,500,000
$4,000,000
$4,500,000
FY17 FY18 FY19 Proj 20* Proj 20** Bud 21
$2,984,323 $3,167,513$3,393,721 $3,578,426 $3,302,881 $3,730,123
$727,927$735,778
$738,007$755,119
$696,974
$749,669
Gross Charges and Net Revenue ($000s)
Net Revenue
Total Deductions
$ 2,984,323 $ 3,167,513 $ 3,393,721 $ 3,578,426 $ 3,302,881 $ 3,730,123 Total Deductions*
$ 727,927 $ 735,778 $ 738,007 $ 755,119 $ 696,974 $ 749,669 Net Revenue
$ 3,712,250 $ 3,903,290 $ 4,131,728 $ 4,333,546 $ 3,999,855 $ 4,479,792 Total Gross Revenue
Net revenue is relatively flat year-over-year
Revenue Trend Analysis
14
FY2021 Annual Operating and Capital Budget
*Deductions include net capitation impact
** Pre-Covid
** Post-Covid

Salaries, Wages, Benefits & FTEs
15

The FY2021 Operational Budget reflects a concerted effort to align labor expenses with revenue projections in a post-COVID-19 environment. Key drivers of labor assumptions:
• Includes the addition of 101 clinical FTEs in key areas to align with current practice, industry standards, and community needs
• Maintains focus on staff education to support operational initiatives around quality improvement, patient satisfaction, and technology implementation
• Restructures support and ancillary services to respond to the expected local volume
• Integrates strategic initiatives to improve patient placement, throughput, and productivity
• Relocates services from the Downtown Campus to Escondido and Poway, preventing interruption of services to the community
• Increases staffing in the Crisis Stabilization Unit and Behavioral Health Units to meet the growing demand for these services in the community
Labor Assumptions
16
FY2021 Annual Operating and Capital Budget

Labor Analysis | FTEsFY2021 Budgeted FTE Roll Forward FTEs
FY2020 Paid FTEs (as of 2/29/2020) 3,676
RIF & Volume-Related Changes (141)
Downtown Campus Closure (72)
Operational Efficiencies 11
Clinical FTE Additions 101
FY2021 Paid FTE’s 3,575
Even with targeted additions, FTEs are relatively flat year over year on a per adjusted discharges basis
FTEs per Adjusted Discharge (Incl. SNF)
17
FY2021 Annual Operating and Capital Budget
27
2928 28 28
20
22
24
26
28
30
FY17 FY18 FY19 Proj 20 Bud 21

22 2221
22
14
16
18
20
22
24
FY18 FY19 Proj 20 Bud 21
Direct Caregiver FTE's / Adj Disch
Labor Analysis | Direct Caregiver FTEs
• Direct caregiver FTEs per adjusted discharge increase over current year projections
• Planned decreases in contract labor, overtime, and premium pay hours are incorporated into the FY2021 Budget
Direct Caregiver FTEs per Adjusted Discharge (Incl. support)
18
FY2021 Annual Operating and Capital Budget
Direct Caregiver FTEs per Adjusted Discharge17 17 17
18
10
12
14
16
18
20
FY18 FY19 Proj 20 Bud 21

Labor Analysis | Salaries, Wages & Benefits• FY2021 total Salaries, Wages, Contract Labor, and Benefits are increasing by $4.2
million or 1%
• Salary and benefit increases are offset by position reductions, as well as improvements in premium pay and contract labor over current year
19
FY2021 Annual Operating and Capital Budget
Total Salaries, Wages & Benefits ($000s)
$-
$50,000
$100,000
$150,000
$200,000
$250,000
$300,000
$350,000
$400,000
$450,000
FY17 FY18 FY19 Proj 20 Bud 21
$400,280 $426,878
$417,529 $420,675 $424,841
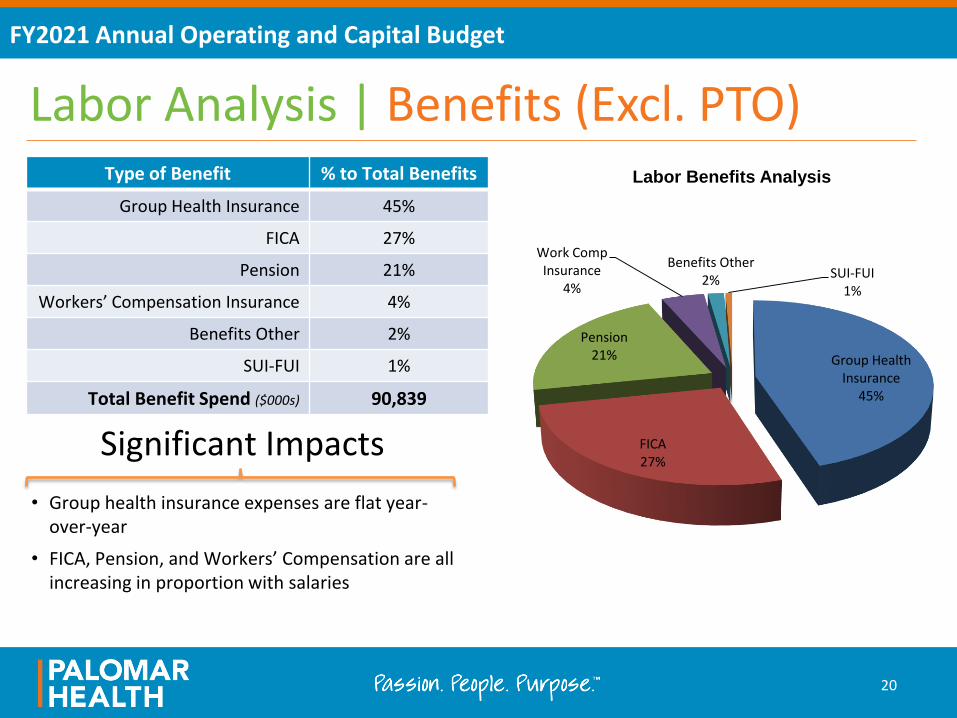
• Group health insurance expenses are flat year-over-year
• FICA, Pension, and Workers’ Compensation are all increasing in proportion with salaries
Significant Impacts
Labor Analysis | Benefits (Excl. PTO)Type of Benefit % to Total Benefits
Group Health Insurance 45%
FICA 27%
Pension 21%
Workers’ Compensation Insurance 4%
Benefits Other 2%
SUI-FUI 1%
Total Benefit Spend ($000s) 90,839
20
FY2021 Annual Operating and Capital Budget
Group Health Insurance
45%
FICA27%
Pension21%
Work Comp Insurance
4%
Benefits Other2% SUI-FUI
1%
Labor Benefits Analysis

Non Labor Analysis
21

$2,094 $2,182 $2,198 $2,175
$2,312
$862
$1,022 $899
$997 $1,006
$1,699 $1,589
$1,736 $1,743 $1,773
$727
$822 $812
$909 $993
$-
$500
$1,000
$1,500
$2,000
$2,500
FY17 FY18 FY19 Proj 20 Bud 21
Trended Non Labor Expense per Adjusted Discharge ($000s)
Supplies Professional Fees Purchased Services Other Direct Expenses
Non Labor Analysis | Summary• FY2021 Non Labor expense is decreasing $3.7 million or 1.1%, due to several
targeted initiatives to reduce overhead expenses
• Despite an overall reduction, Non Labor expense is increasing by 3.9% on a per adjusted discharge basis compared to pre-COVID-19 projections, due to lower adjusted discharges
22
FY2021 Annual Operating and Capital Budget

FY2021 Supply Roll Forward Expense($000s)
FY2020 Supply Expense (Dec 2019 Projection) $105,751
Changes due to Volume and Utilization 586
Inflationary increases due to COVID-19 1,400
Supply Reduction Initiatives (1,400)
FY2021 Budgeted Supply Expense $106,337
Non Labor Analysis | Supplies
Supply management efforts and reduction initiatives totaling $1.4 million are helping to offset projected increases in cost due to COVID-19
Supplies per Adjusted Discharge (Incl. SNF)
23
FY2021 Annual Operating and Capital Budget
579 565 576
402 390 400
408 445
498
405 399 428
404
375
410
250
300
350
400
450
500
550
600
FY19 Proj 20 Bud 21
Implants / Prosthesis
Surgical Supplies
Pharmaceuticals
Other Medical Supplies
Non-Medical / All Other
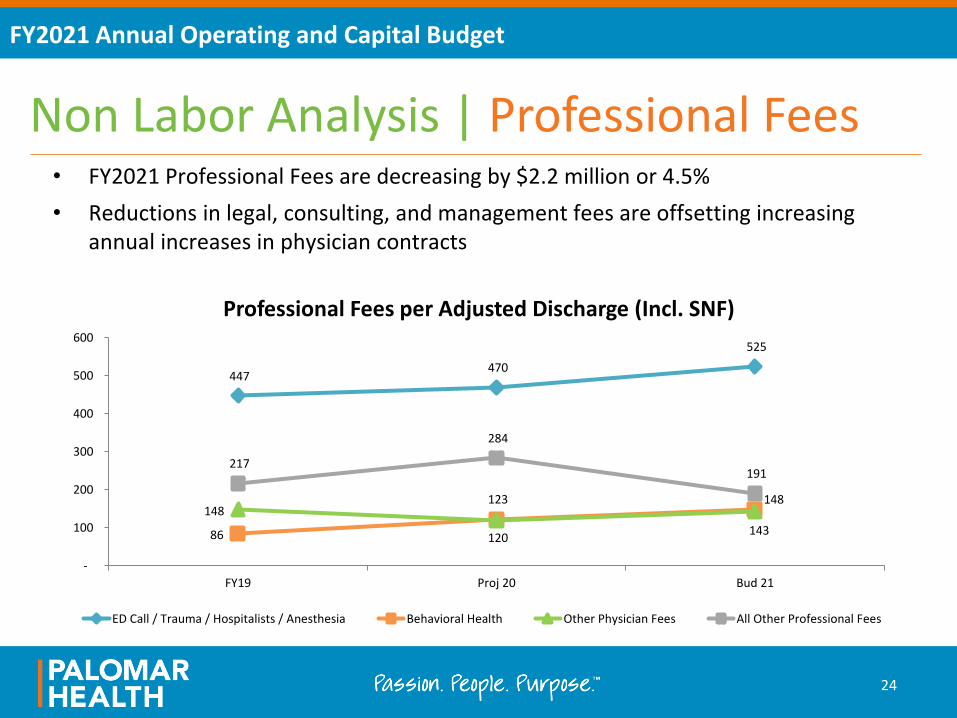
Non Labor Analysis | Professional Fees• FY2021 Professional Fees are decreasing by $2.2 million or 4.5%
• Reductions in legal, consulting, and management fees are offsetting increasing annual increases in physician contracts
24
FY2021 Annual Operating and Capital Budget
447 470
525
86
123 148 148
120 143
217
284
191
-
100
200
300
400
500
600
FY19 Proj 20 Bud 21
Professional Fees per Adjusted Discharge (Incl. SNF)
ED Call / Trauma / Hospitalists / Anesthesia Behavioral Health Other Physician Fees All Other Professional Fees

Non Labor Analysis | Purchased Services• FY2021 Purchased Services are decreasing by $3.2 million or 3.8%, year over year
• Increases in Information Technology are offset by reductions in Revenue Cycle, Facilities, and Marketing
25
FY2021 Annual Operating and Capital Budget
811 800
887
192
235 197
442 493
535
244
216 154 100
300
500
700
900
1,100
FY19 Proj 20 Bud 21
Purchased Services per Adjusted Discharge (Incl. SNF)
Information Technology Plant Maintenance / Biomed All Other Purchased Services Revenue Cycle

Purchased Services | IT Roadmap
John Doe
26
FY2021 Annual Operating and Capital Budget
FY2020 Accomplishments
Cerner Clarity Upgrade to 2018 Code McKesson PACS Upgrade
Physician to Patient systems / Patient to Family tools BD Pyxis Upgrade
ACR Select Radiology Decision Support Phase I (ED) Muse Cardiology System Upgrade
Olive Artificial Intelligence for Revenue Cycle Mobile Device Manager Install
Cerner Power Chart Specimen Collection Install Telecom SIP to VOIP Phone Upgrade
Health Grades Rollout Downtown Campus Move
FY2021 Planned Projects
Patient Safe Implementation @ PMC Poway Physician Results Distribution Standardization
ATT FirstNet Public Safety Call System Viz AI Stroke Program
Enhanced Network Security TeleTracking Upgrade
Network Infrastructure Upgrades Anesthesia Documentation System
Alaris Infusion Smart Pump Integration E-Prescribing of Controlled Substances
Radimetrics Infusion Dosing SMP Sterile Processing System Install

218 225
204
309 322
417
85
129
164
200
233
208
50
100
150
200
250
300
350
400
450
FY19 Proj 20 Bud 21
Other Direct Expense per Adjusted Discharge (Incl. SNF)
Utilities Building and Equipment Rental Insurance Other Direct Expense
Non Labor Analysis | Other Direct Expense• FY2021 Budgeted Other Direct Expense is increasing by $1.5 million or 3.3%
• Increases are primarily driven by rental expenses and insurance, while utilities decrease with the closure of the Downtown Campus
27
FY2021 Annual Operating and Capital Budget

28
$-
$5,000
$10,000
$15,000
$20,000
$25,000
$30,000
$35,000
FY17 FY18 FY19 Proj 20 Bud 21
34,364
31,514
26,523 26,766
28,796
$-
$10,000
$20,000
$30,000
$40,000
$50,000
FY17 FY18 FY19 Proj 20 Bud 21
49,762
43,205 42,340 40,864 40,473
Depreciation and Interest Expense
*Interest expense reflected for Revenue Bonds only
Depreciation Expense ($000s) * Interest Expense ($000s)
FY2021 Annual Operating and Capital Budget

Annual Operating Budget Summary & EBIDA Recap
29

$(20,000)
$(15,000)
$(10,000)
$(5,000)
$-
$5,000
$10,000
$15,000
$20,000
$25,000
FY17 FY18 FY19 Proj 20* Proj 20** Bud 21
$21,707
$10,297
$17,085
$22,072
$(15,862)
$15,154
Income from Operations ($000s)
• Though FY2021 Income from Operations is decreasing by $6.9 million from pre-COVID-19 projections, it represents a $31.0 million improvement from expected FY2020 year-end results
• The increase is driven through significant focus on aligning expenses with volume
Income from Operations
30
FY2021 Annual Operating and Capital Budget
*Pre-Covid**Post-Covid

31
FY2021 Annual Operating and Capital Budget
Annual Operating Budget Summary and Trend FY2019Results
FY2020Projection
(Pre-COVID)
FY2020Projection
(Post-COVID)
FY2021Budget
Revenue:
Net Revenue 738,007,078 755,119,472 696,973,873 749,668,707
Other Operating Revenue 11,477,276 11,666,144 9,980,585 10,660,164
Total Operating Revenue $ 749,484,354 $ 766,785,616 $ 706,954,458 $ 760,328,871
Expenses:
Salaries, Wages, Registry, Benefits 417,529,146 420,675,159 406,439,149 424,841,015
Supplies 106,120,524 105,751,361 101,643,172 106,336,558
Depreciation 42,340,412 40,864,290 41,619,579 40,473,266
Other 166,408,813 177,422,991 173,114,315 173,523,622
Total Operating Expense $ 732,398,895 $ 744,713,801 $ 722,816,215 $ 745,174,461
Operating Income 17,085,459 22,071,815 (15,861,756) 15,154,410
Non-Operating Income (Loss) (1,275,601) 4,045,525 31,038,763 8,117,775
(Interest Expense) (26,523,316) (26,766,313) (27,614,816) (28,795,592)
Unrealized (loss) gain on interest rate swap (6,569,730) - - -
Property Tax Revenue 17,608,947 17,802,717 17,900,001 17,900,000
Income (Loss) $ 325,759 $ 17,153,744 $ 5,462,193 $ 12,376,593
Foundation Support 16,569,000 18,232,012 18,232,012 21,988,000
Net Margin % 0.0% 2.2% 0.8% 1.6%
OEBIDA Margin (Excl. Property Tax Rev) 7.9% 8.2% 3.6% 7.3%
OEBIDA Margin (Incl. Property Tax Rev) 10.3% 10.5% 6.2% 9.7%
EBIDA Margin 10.1% 11.1% 10.6% 10.7%
Total Uncompensated Care & Bad Debt 70,688,405 84,150,504 77,886,208 86,481,710
Total Uncompensated Care as % of Gross 1.71% 1.94% 1.94% 1.93%
32
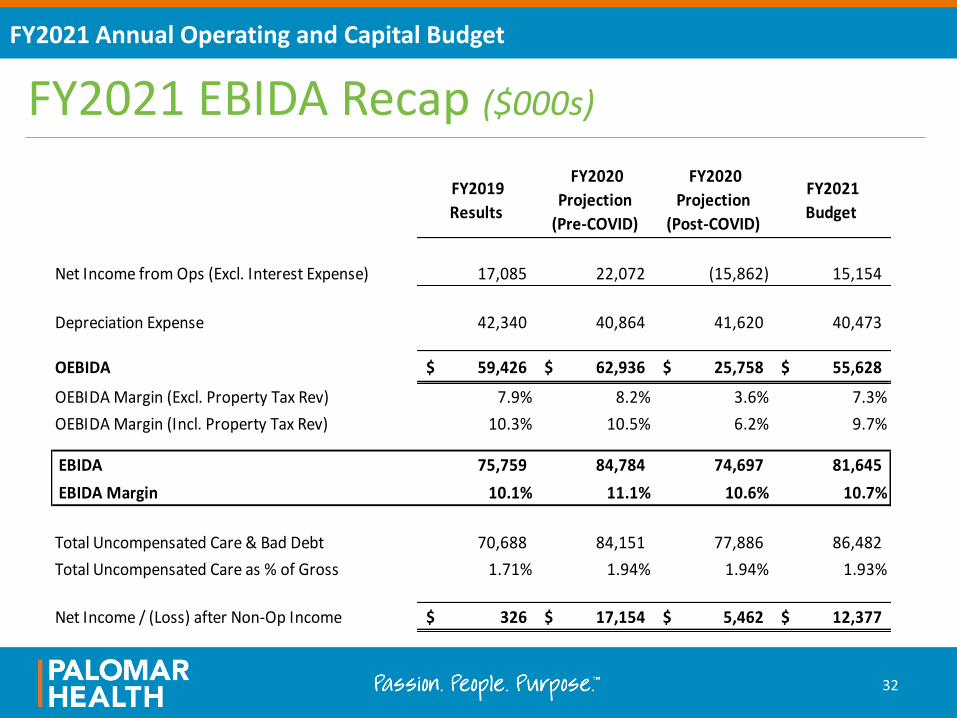
FY2021 EBIDA Recap ($000s)
FY2021 Annual Operating and Capital Budget
FY2019
Results
FY2020
Projection
(Pre-COVID)
FY2020
Projection
(Post-COVID)
FY2021
Budget
Net Income from Ops (Excl. Interest Expense) 17,085 22,072 (15,862) 15,154
Depreciation Expense 42,340 40,864 41,620 40,473
OEBIDA 59,426$ 62,936$ 25,758$ 55,628$
OEBIDA Margin (Excl. Property Tax Rev) 7.9% 8.2% 3.6% 7.3%
OEBIDA Margin (Incl. Property Tax Rev) 10.3% 10.5% 6.2% 9.7%
EBIDA 75,759 84,784 74,697 81,645
EBIDA Margin 10.1% 11.1% 10.6% 10.7%
Total Uncompensated Care & Bad Debt 70,688 84,151 77,886 86,482
Total Uncompensated Care as % of Gross 1.71% 1.94% 1.94% 1.93%
Net Income / (Loss) after Non-Op Income 326$ 17,154$ 5,462$ 12,377$

Capital Plan
33

34
FY2021 Annual Operating and Capital Budget
Capital Plan | Three-Year Planning Process
•Equipment reaching end of useful life
•Organizational strategic initiatives and expansion of services in the community
•Enhancing the IT capabilities of the organization to improve physician, staff, and patient experience
•Deploying capital across the entire district
•Balancing the needs vs. resources of the organization
During the preparation of the three-year plan, capital priorities were based on:
•Proceeds from 2017 Certificates of Participation (COP) issuance
•Cash from operations
•Foundation fundraising
Funding sources for capital projects include:

35
Three-Year Capital Budget Summary ($000s)
FY2021 Annual Operating and Capital Budget
Capital Plan | Three-Year Summary
FY2021 FY2022 FY2023Total
Project Spend
Funded by Operations:
Equipment 1,500 2,500 3,500 7,500
Facilities 3,500 3,500 5,000 12,000
IT 3,165 4,000 4,500 11,665
Strategic Service Line 1,000 2,000 7,500 10,500
Outpatient Strategy 3,000 9,000 - 12,000
Other 1,680 - - 1,680
Subtotal 13,845 21,000 20,500 55,345
Capital from Restricted Funds:
Escondido 9th Floor Build-out 5,000 9,000 6,000 20,000
Poway Renovation 3,550 - - 3,550
NICU Expansion - Escondido 1,250 - - 1,250
Other 3,900 - - 3,900
Subtotal 13,700 9,000 6,000 28,700
Funded by Foundation: 2,500 1,000 - 3,500
Total 30,045 31,000 26,500 87,545
Capital Plan

FY2021 Budget Summary & Key Take-Aways
36

SummaryFY2021 Budget is an achievable plan, given the current assumptions related to the COVID-19 pandemic. It aligns with Palomar Health’s Strategic Financial & Capital Plan and will require success in the following areas:
• Fully reopening the operating rooms and outpatient services to return patient volumes to pre-COVID-19 levels by Q2
• Sale and closure of Palomar Medical Center Downtown Escondido
• Continued focus and implementation of initiatives to manage variable expenses which align with fluctuating volume levels resulting from the COVID-19 pandemic
• Partnership with San Diego County to plan and provide services for the growing Behavioral Health population
Successful Execution will result in:
• Enable Palomar Health to recover from the financial impact of the COVID-19 pandemic and successfully operate in the post-COVID-19 environment
• Deployment of sufficient capital to meet the needs of the organization and continued improvement of liquidity
• Continued improvements in clinical excellence and patient satisfaction
• Net income and EBIDA improvement of $6.9 million over post-COVID-19 FY2020 projections; operating income improvement of $31.0 million; EBIDA of $81.6 million
37

Five-Year Financial Projections
38

Five-Year Financial Projections
39
FY2021 Annual Operating and Capital Budget
Palomar Health needs a sound financial strategy in order to:
• Deploy sufficient capital to support the strategic plan and development / expansion of services
• Adjust capacity to serve the changing needs of the community in a post-COVID-19 environment
• Continue the development of a fully integrated health delivery system
• Fund sufficient capital to replace aging equipment and renovate facilities
• Continue to improve key liquidity ratios and achieve investment level ratings for all the rating agencies
}
2018 2019 2020 2021 2022 2023 2024 2025
• Annual Capital
• Principal
• Working Capital
} STRATEGIC
FINANCIAL
PERFORMANCE
An
nu
al C
ash
Flo
w

Five-Year Financial Projections
40
FY2021 Annual Operating and Capital Budget
Targeted
2018 2019 2020 2021 2022 2023 2024 2025
Total Operating Revenue $794,167 $789,304 $753,732 $846,999 $868,736 $927,153 $942,217 $979,593
Operating EBIDA $32,920 $38,029 $6,889 $35,294 $35,798 $74,381 $72,728 $79,463
Operating Income ($41,709) ($32,221) ($62,999) ($33,383) ($33,306) $5,009 $3,296 $9,835
Operating Income excl. Interest Expense ($11,861) ($5,698) ($36,081) ($7,669) ($8,129) $29,594 $27,254 $33,138
Net Income ($15,280) ($22,507) ($13,450) ($8,707) ($6,113) $33,395 $33,148 $41,186
Unrestricted Cash $200,404 $212,958 $245,707 $221,192 $226,006 $266,704 $307,900 $352,376
Capital Expenditures $21,037 $18,702 $20,000 $30,045 $31,000 $26,500 $27,000 $29,500
Profitability
Operating Margin (5.3%) (4.1%) (8.4%) (3.9%) (3.8%) 0.5% 0.3% 1.0%
Operating Margin excl. interest expense (1.5%) (0.7%) (4.8%) (0.9%) (0.9%) 3.2% 2.9% 3.4%
Excess Margin (1.9%) (2.9%) (1.8%) (1.0%) (0.7%) 3.6% 3.5% 4.2%
Operating EBIDA Margin 4.1% 4.8% 0.9% 4.2% 4.1% 8.0% 7.7% 8.1%
Debt Position (Includes Arch)
Debt Service Coverage (x) 1.3x 1.4x 1.4x 1.5x 1.6x 2.6x 2.6x 2.8x
Total Debt to Capitalization 80.0% 83.7% 85.0% 85.8% 86.3% 81.7% 77.4% 72.4%
Liquidity
Cash to Debt 31.1% 33.9% 39.9% 36.7% 38.4% 46.5% 55.1% 64.9%
Days Cash On Hand (days) 92.5 99.9 115.9 96.4 96.1 111.0 125.8 139.3
Days Cash On Hand (days) - Ex interest 96.1 103.5 120.1 99.5 99.0 114.2 129.3 142.9
Other
Discharges 28,441 29,434 29,423 29,531 29,640 29,011 27,927 28,435
Adjusted Discharges 47,659 48,327 47,041 47,414 47,869 46,164 44,258 45,065
Cost / Adj Discharge $14,567 $14,279 $15,057 $15,109 $15,380 $16,345 $17,390 $17,712
Capital Spending Ratio 47.0% 42.8% 46.5% 69.9% 70.6% 59.2% 59.4% 63.7%
Ratio/Statistic (in thousands)Audit Projection Years