FY 1995 Summary of Recommendations and Economic and ...
64
AI{NUAL BT]DGET F"r 1995 STJMMARY OF RECOMMENDATIONS AND ECONOMIC AI{D RE\¡BN[]E FORECAST Prepared By JOINT LEGISLATTVE BUDGET COMMITTEE SENATOR CAROL SPRINGER Chairman 1994 TED FERRIS Direcûor REPRESENTATTVE ROBERT "BOB' BURNS Chairman 1993 RICHARD STAVNEAK Deputy Director 1716 West Adatns Street Pløenb, Arizona E5æ7 Plto¡æ (û2) 542-5491 FÐ( (Ø2) s42-1616 JLBC
-
Upload
khangminh22 -
Category
Documents
-
view
3 -
download
0
Transcript of FY 1995 Summary of Recommendations and Economic and ...
AI{NUAL BT]DGET
F"r 1995
STJMMARY OF RECOMMENDATIONS
AND
ECONOMIC AI{D RE\¡BN[]E FORECAST
Prepared By
JOINT LEGISLATTVE BUDGET COMMITTEE
SENATOR CAROL SPRINGERChairman 1994
TED FERRISDirecûor
REPRESENTATTVE ROBERT "BOB' BURNSChairman 1993
RICHARD STAVNEAKDeputy Director
1716 West Adatns StreetPløenb, Arizona E5æ7
Plto¡æ (û2) 542-5491FÐ( (Ø2) s42-1616
JLBC
JOII{T LEGISLATTTIE BT]DGEI COMNIITTEE
The Joint Legislative Budget Committee was established in 1966, pursuant to Laws 1966, Chapter 96.ln 1979, a bill was passed to expand and alter the committee membership, which now consists of thefollowing 16 members:
Representative Robert nBobn BurnsChairman 1993
Representative Brenda BurnsRepresentative Carmen CajeroRepresentative Lisa GrahamRepresentative Leslie V/. JohnsonRepresentative Bob MclendonRepresentative Greg PattersonRepresentative Polly Rosenbaum
Senator Carol SpringerChairman 1994
Senator Lela AlstonSenator Gus ArzbergerSenator A. V. "Bill" HardtSenator Bev HermonSenator Matt SalmonSenator John WettawSenator Pat Wright
o
The primary ftowers and duties of the JLBC relate to ascertaining facts and making recommendationsto the Legislanrre regarding all facets of the state budget, state revenues and expenditures, futurefiscal needs, and the organiz¿1is¡ and functions of state government.
JLBC appoints a Director who is responsible for providing staff support and sound technical analysisto the Committee. The objeaives and major products of the staff of the ILBC are:
Analysis and recommendations for the annual state budget, which are presented in lanuaryof each year;
Technic¿I, anal¡ical, and preparatory support in the development of appropriations biltsconsidered by the Legislature;
Periodic economic and state reyenue forecasts;
Periodic analysis of economic activity, state budget conditions, and the relationship of oneto the other;
Preparation of fiscal notes or the bills considered by the Legislature that have a fiscal impacton the state or any of its political subdivisions;
An annual Appropriations Report, which is published shortly after the budget is completedand provides detail on the budget along with an explanation of legislative intent;
Management and fiscal research reports related to state programs and state agencyoperations.
Support to the JLBC with respect to recommendations on business items placed on thecommittee's agenda such as transfers of appropriations pursuant to A.R.S. $ 35-173;
Support to the Joint Committee on Capital Review (JCCR) with respect to all capital outlayissues including land acquisition, new construction, and building renewal projects
Support to the Joint lagislative Tax Committee (JLTC) as directed in firlfilling therequirements of A.R.S. $ 41-1322(D).
a
a
a
a
o
a
a
STATESENATE
CAFOL SPHINGERCHAIRMAN 1994
LELA ALSTONGUS ABZBEFGERA V "BILL" HARDTBEV HËBI\,IONI\¡ATT SALMONJOHN WETTAWPAT WRIGHT
STATE OF ARIZONA
1716 WEST ADAMS
PHOENIX. ARIZONA 85007
PHONE (602) 542-5491
FAX (602)s42-1616
TED FEFBISDIFECTOR
FOBERT "BOB' BUFNScHAtRi/AN 1993
BRENDA BURNSCARMEN CAJEROLISA GRAHAMLESLIE W JOHNSONBOB I\¡CLENDONGREG PATTEFSONPOLLY FOSENBAUM
1 sint Tfegislatíb e Tàuùqet Cummi ttec HOUSE OFREPFESENTATIVES
RICHAFD STAVNEAKDEPUTY DIRECTOR
Jaruary 12,1994
The Honoreble John Gree,ne
President of the Senete
andThe Honoreble Mark KillianSpeaker of the HouseState CspitolSiate of Ariz¡¡.a
Deer President Greene and Speaker Killian:
On behÂlf of Senetor Carol Springer, Representative Bob Burns, and the Steff of the loint Legislative BudgetQsmmittee, it is ny pleasure to transnit to you and the e,ntire 41st I-egislahre of the State of Arizona, ourBudeet Apslvsis end Recomme,nd¿tions for Fiscål Year 1995.
The combination of an $96 million carry-forward from FY 1993, r $l9l million upward revision in the FY1994 revenue forecast, end a further incregse of $265 million in the FY 1995 revenue forpcast provides theI-egislature with a considerable degree of freedom to pursue a number of diffe¡e,nt policy options. The JLBCStaff recommends that the 4lst I-egislatue take several steps that would (l) rnake peyment on past financialobligations, and (2) help ensure the future health of the stete budget. The two most significantrecommendations are the immediate elimination of the K-12 Rollover, at a cost of $142.5 million in FY 1994,and full ñ¡nding of the required deposits to the Budget Stabilization Fr¡nd in both FY 1994 and FY 1995, at acombined cost of $152 million. While these policies will absorb most of the zu¡plus, once imFlemented, theywill e,nzure th¡t we h¡ve the resources to address critical state.spending issues in FY 1996 and beyond in a wayth¡t is more sustainable.
Or¡r recommendationà are contained in three volumes:
This ;An Analvsis and Recomnend¡tions book, which contains recommend¿tions, by agency, and by
PfogÎam;A Non-Aooropriated Funds book, which provides an explanation of those fi¡nds not zubject ûo
legislative appropriation.
The St¡ff of the Joint I-egislative Budget Committep looks forwa¡d to working with you, the Senate and HouseAppropriations Q6rmmi6¡ps, and the entire 41st Anmp8 I-egislature in developing the state budget for FY 1995.
Ted FerrisDirectorTF:lm
(1)
Q>
(3)
--
TABLE OF CONTENTS
Budget ¡n Br¡ef
nBalance Sheettr - General Frmd Revenr¡es and Expenditures, tr"f IJD4 and f"f 1995
tr.f 1993 Revierv and Ef 1994Update
Overvierv of tbe JLBC StaffRecommended G€nera| fbnd BudgeJ for Ff 1995
Tables and Graphs
¡General fìmd Op€rating Budget - Ten Largest AgenciesCmparison with Executive Recommendation and kior Year
¡Total Appnopriated FIE Pæitions - Ten Largest AgenciesCornparison with Execr¡tive Recmrmendation and Prior Year
¡General Fund Srmmary - By Function of GovernnrentrOtùer Appropriated Funds $r¡mrnarT¡ - By Function of Governmmt
Econmic and Revenr¡e Forecast
¡The Arizona Economy
rTheu.S.Economy ......23
1
2
3
t6
I'T
30
1E
20
rGe¡reralFundRevmue ....38
rBudgetStabilizationFund. ......52
r0peratiry Fund Balances . . 55
AII Whiu Paecs Prhtcd o¡t R¿ctcl¿d Paoe¡
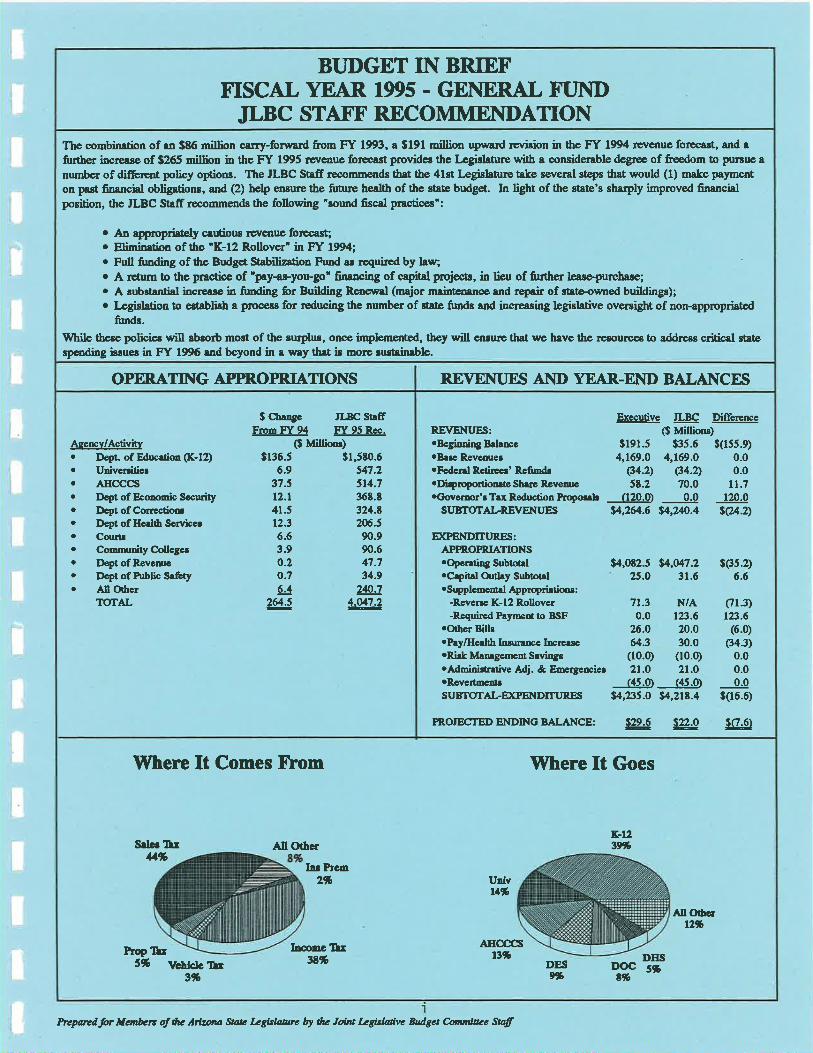
Executive ILBC DifrerenccREVENIJES: ($ Millionr).Begioni¡g Bal¡æe $191.5 $35.6 $(155.9)oBr¡p Rpvcnue¡ 4,169.0 4,169.0 0.0.Fcdcnl R.er¡r€cr' Refi¡nd¡ 84.2) Q4.2> 0.0.Di¡proportio¡ræShrc Reven¡e 5t.2 70.0 ll.7oC¡ovcrmr'¡T¡xReúrctionPnopod¡ JlzLÐ 0.0 l2O.O
St BToTALRE]VENTJES $4,264.6 54,2Æ.4 t(24.2)
Ð(PEIiIDITTJRES:APPROPR,IATIONSropcntiqg Sub¡ot¡loC¡pit¡l orrtlay SubtoteloSuppleme¡¡¡l þproprirtionr:
-Revcne K-12 R.ollover-Requircd lhyrneot to BS¡F
¡Othc¡ Bill¡. hy/Hedth Ins¡nmc Incre¡seoRi¡k M¡n¡gcnpnt Sevingeo¡{dminifntive Adj. & Emergcrcicr.RcvcftmÊntr
SUBTOTALÐ(PENDITI'RES
PRoTEcTEDENDINGBALANCE: ru !å9 ltr)
6.6¡(35.2)
ol.3)t23.6
(6.0)(34.3)
0.00.00.0
¡06.6)
¡4,012.5 ¡4,U7.225.O 3t.6
7t.3 N/A0.0 t23.6
26.0 20.064.3 30.0(10.0) (10.0)2t.o 2t.o(45.0 (45.0)
s4,235.0 $4,21t.4
Where It GoesT9here It Comes trbom
ybDES
t3%AHOOCS
Èop If¡5%
All Othct
Atl O{tctrlh
ß.1:¿3%
U¡lvra%
I¡æmct¡n%Vchtclc lb
3%
S¡lo¡ Il¡$tb
DIISs%DOC
t%
I¡¡ Prcm2'lo
BT]DGET IN BRIEFFISCAL YEAR 1995 - GEI\ERAL FT]ND
JLBC STATT' RECOMMEI\DATIONThe combin¿tion of an S86 million carry-forrvcrd Êom FY 1993, ¡ $191 million upr+ard rcvi¡ion in the FY 1994 rcvenuc forccrrt, and a
fr¡rther incre¡se of $265 million in the Fl 1995 rpve¡rue forccast provides thc Lcgidahrre with a considerable dcgrec of freedom to pursuc a
number of differe¡rt policy options. The JLBC St¡fr recommends th¡t the 41¡t Legisl¿tue take several steps that would (1) make payment
on p¿st fin¡nci¡l obligations, and (2) help eneure the fr¡tr¡rc he¿lth of the state budg€t. In light of the gtate's sharply improved fin¡ncialposition, the JLBC Stafr recommends the following "¡ound fiscsl practices":
o An ¡pprop¡i¡tely c¡r¡tious rsvenr¡e forec¡¡Eo Elimin¿tion of thc "K-12 Rollover" in Ff 199t;o Full fu¡rding of the Budge St¡biliz¡tion Fund ¡¡ rcquired by hw;o A rctum to the przctice of 'poy-as-you-go' 6nancing of cepital prcjects, in licr¡ of further lcasc-purchare;o A ¡ubstar¡ti¡l increa¡p in funding for Building Rcnewd (maþr maintcnance and rcpair of ¡tato.owned buildings);. Legi¡l¡tion to est¡blish a prrcess for roducing the number of stste funds erid increasing legislative oversight of non-appropriated
funds.
lVhile these policies will ¡b¡orö most of the rurplur, once fuiplemented, they will ensuæ th¿t we h¡ve the ¡esources to addre¡s critic¡l staÞspending i¡¡ue¡ in Ff 1996 end beyond in a uny tt¡¡t i¡ more ¡u¡tain¡bþ.
OPER,ATING APPROPRIA'TIONS REYEIYT]ES AI\D YEAR.EI\D BALANCES
Aqeæv/Activiwo Dqlt. of Educrion (K-12)¡ Univer¡itic¡. AIICCCS. IÞpt of Ecooonic Securityo Dept of Corrpctiooro lÞpt of Hc¡lù Scrvice¡. Col¡rtro Com¡unity Collegct. Dqtt of Revcn¡c. Dcpt of Pt¡blic S¡fe¡yr All Other
TOTAL
S Ctaqgc JLBC StetrF¡om FY 94 FY 95 Rec.
$ Millionr)s136.5 $1,5t0.6
6.9 547.2
37.5 5t4.tt2.t 36t.t41.5 324.tt2.3 20É,.5
6.6 90.93-9 90.60.2 47.7o.7 34.96.4 2&.7
264.5 4.M7.2
Prcpannþr Mcnbcrs otthc Arlzøu Sw Lcg,sbnre þ tlu toitx Legislúvc Budga hn nlæe Suf
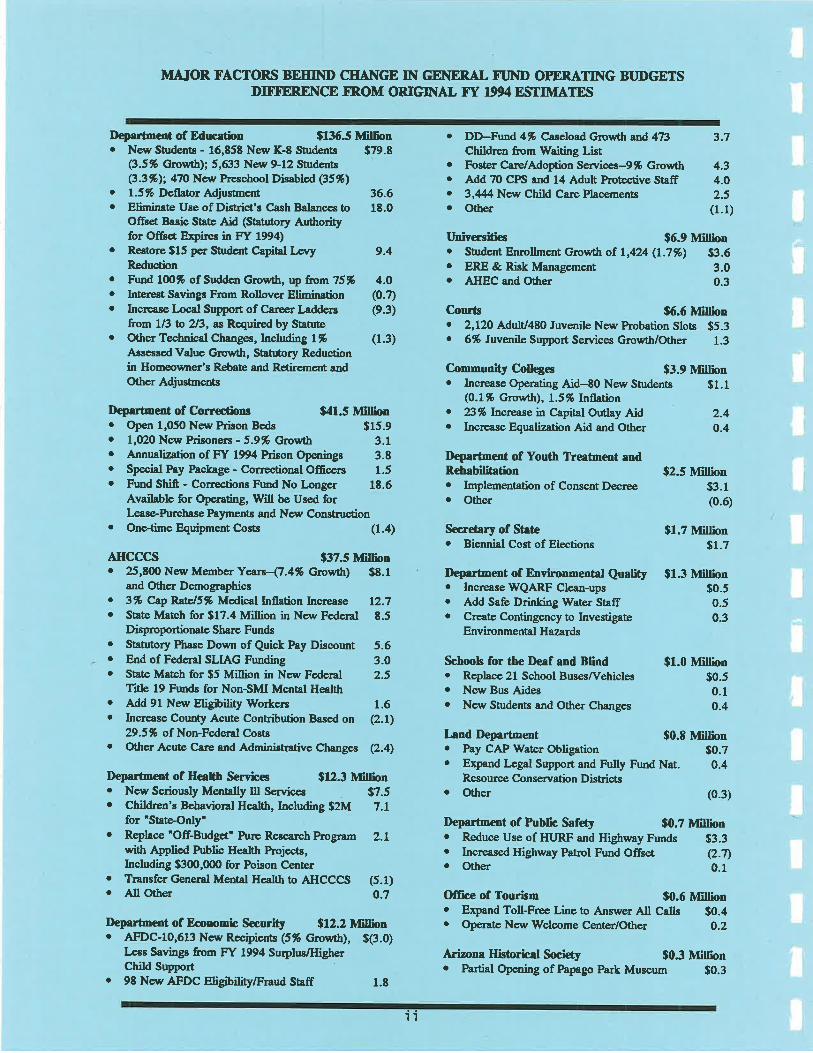
MÀIOR FACÎORS BEHIND CHAI{GE IN GE]IIER,AL FI]ND OTER,ATING BI]DGETSDIFIMENCE IROM ORIGINAL T"T f|94 ESTIMAIES
Deprrtment of Edr¡c¡tbn S136.5 Mill¡ono New Studentr - 16,858 Nerr, K-8 Students 379.8
(3.5% Growth); 5,633 Nen, 9-12 Studerits(3-3%);470 New Preschool Disabled (35%)
o l-5% Defl¿tor Adjustment 36.6o Eliminate Use of District's Cash Bal¿nces to 1t.0
Offs€t Basic Stat€ Aid (Statutory Author$for Offsc* E:çires in Ff 1994)
. Restore $15 per Studer¡t Capitrl l-eny 9.4Reduction
o Fund 1(þ% of Sudden Growth, up from 75% 4.O. Interest Savings From Rollover Elimin¡tion (0.Ðo Incrpase Local Support of C¿reer Ladde¡s (9.3)
from 1/3 to 213, as Required by Statuteo Other Technic¿l Changes, Including 1% (1.3)
Assefrsod Value G¡owth, Ststutory Reductionin Homeowner's Rebate and Reti¡ement andOther Adjustments
Depertment of Corrcc{ions $41.5 Million. Open 1,050 New Prison Bcds $15.9. t,OzO New Prisoners - 59% Growth 3.1o l¡¡¡rr¡liz¡¡ion of FY 1994 Prison Openings 3.8. Special Pay Package - Correction¿l Officers 1.5o Fund Shift - Corrections Fund No Longer 18.6
Avail¡ble for Operating, lVill be Used forI-ease-Purch¿sePayments and New Construction
o Onc-time Equipment Costs (1.4)
AHCCCS $37.5 Millbn. ã,t(X) New Member Yeas-(7.4% Growth) $8.1
and Othcr Demographicso 3% Cap Rate/S% Medicsl Inflation Increase 12.7. State Match for $17.4 Million in New Federal 8.5
Disproportionate Share Fundso Statutorl Ph¿se Dorrrr of Quick Pay Discount 5.6o End of Federal SLLAG Funding 3.0. State Match for $5 Million in New Federal 2.5
Title 19 Funds for Non-SMI Mental Health. Add 91 New Eligùi¡ity \Vorters 1.6o lncræ¿se County Acute Contribution B¿sed on Q.l)
29.5% of Non-Fede¡al Coseo Other Acutc C¿re and Administrative Changes (2.4)
Depertment of Health Servicres $123 ltfiXbno New Seriously Mentally lll Services $7.5o Children's Behavio¡al Health, Including $2M 7.1
for'StateOnly". Repl¡ce "Off-Budget' hrre Reseerch hogram 2.1
with Applicd Pr¡blic Hcalth Projects,Including S3q),q)0 for Poison Cer¡ter
o Transfer General Me¡rtal Health to AHCCCS (5.1)o All Other O.7
Department of Economic Socurþ $12.2 M¡Ilbn. AFDC-10,613 New Recipients (5% Growth), $(3.0)
Iæss Savingr ftrom FÍ 1994 Surplus/HigherChild Support
o 98 New AFDC Eligibility/Fraud St¡ff 1.8
o DD-Fund 4% Caseload Gr,owth and 473Children from S/aiting List
o Foster Care/Adoption Senices-9% Growtl¡. Add 70 CpS and 14 Adult Protoctive St¿ffo J,Q.{ , Neu, Child Care Placements. Othes
Depertment of Youth Treatment andReh¡bilitetbno Implementation of Consent Decreeo Other
Universities $6.9 Millbno Student En¡ollment Growtl¡ of 1,424 (1.7%) $3.6. ERE & Risk Management 3.0. AHEC ¿nd Other 0.3
Courts $6.6 Miübn. 2,L2O Adult/480 Juvenile New Probation Slots $5.3o 6% Juve¡rile Support Sewices Gronthr/Other 1.3
Community Collqes $3.9 Minbno Increase Operating Aid-80 New Students $l.l
(0.1% Growth), 1.5% Inflationo ?3% Increase in Capital Outlay Aid 2.4¡ lnc¡ease Equalization Aid ¿nd Other 0.4
Socretery of St¡tco Bienni¿l Cost of Elections
Depertment of Envircnment¡l Quatiþo Incre¿se WQARF Clean-ups. Add Safe Drinking Water Ståffo Create Contingency to Investigate
Envi¡onmental Hazards
3.7
4.34.02-5
(1.1)
$2.5 Iìlfillbn$3.1(0.6)
$1.7 Million$1.7
$1.3 Millbn$0.50.50.3
Schools for the Deef ¡nd Blind. Repl¿ce 21 School Buses/Vehicles¡ New Bus Aideso New Students and Other Changes
$1.0 Millbn$0.50.10.4
Land Departrnent S0.8 Million. Pay CAP Water Obligation $0.7o Expand Legal Support and Fully Fund Nat. O.4
Resourre Conservation Districtso Other (0.3)
IÞpar{ment of Public Safety $0.7 llfillbno Reduce Use of HURF and Highway Funds $3.3o lncreas€d Highway Patrol Fund Offset Q.7)o Other 0.1
(X[ce of Tourism $0.6 Millbn. Expand Toll-Free Line to Answer Atl Cslls $0.4. Qpraþ New lVelcome Center/Other O-z
Arizone Hisúori¡¡I Socicty $0.3 Mitlbn. Parti¿l Opening of Papago Park Museum $0.3
11
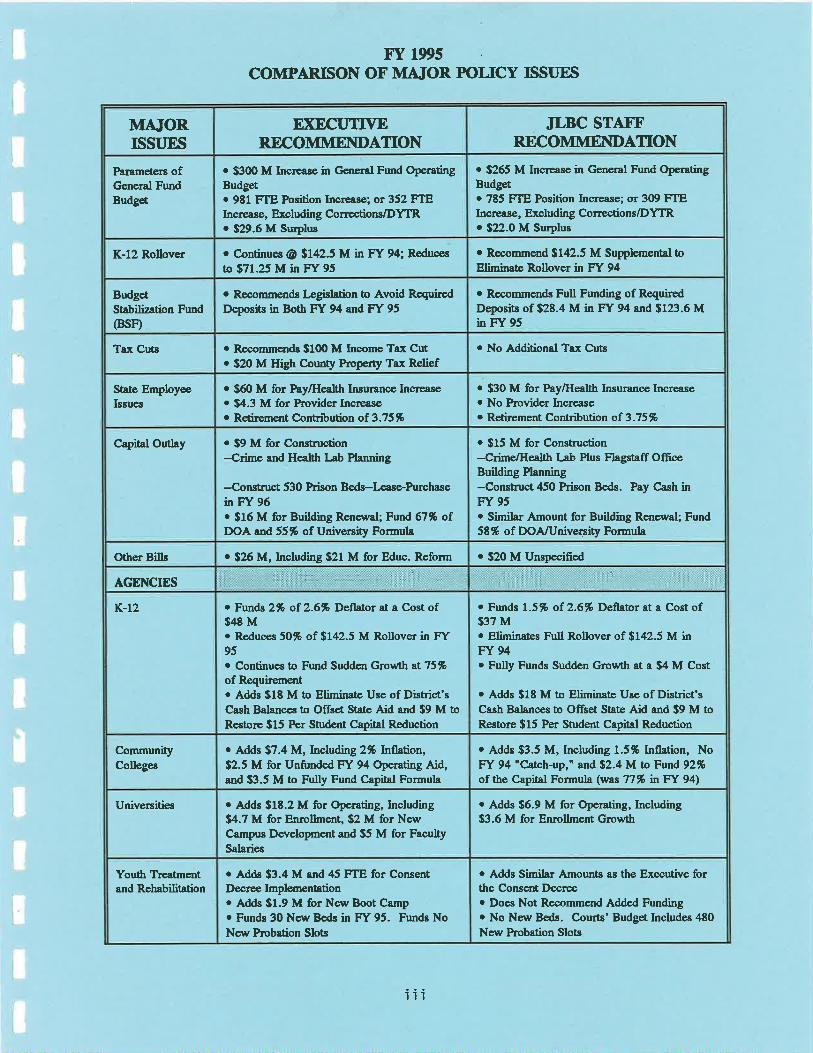
o Adds Simil¿r Amounts as the Executive forthe Conscnt Decreeo Does Not Recommend Added Fundingo No New Beds. Courts' Budget Includes 480New hobation Slots
. $20 M Unspeciñed
o Funds L.57o of 2.6% Defl¡tor at a Cost of$37 Mo Eliminates Full Rollover of $142.5 M inFY 94o Fully Funds Sudden Growth at a $4 M Cost
o Adds $18 M to Eliminatc Use of District'sCash Balances to Offset State Aid and $9 M toRestore $15 Per Studer¡t Capital Reduction
o Adds $3.5 M, Including 1.5% lnflation, NoFY 94 'Catch-up,' and $2.4 M ¡a Fu¡d 92%of the Capital Formul¿ (wts 77% in Ff 94)
o Adds $6.9 M for Operating, Including$3.6 M for Enrollment Growtt¡
o Recommend $1425 M Supplemental toElimin¿Þ Rollover in FY 94
o Recommends Full Funding of RequiredDeposits of $28.4 M in FY 94 and $123.6 Min Ff 95
o No Additional Tax Cuts
. $30 M for Pay/Health Insurance Incre¿se¡ No P¡ovider Increaseo Reti¡ement Conbibution of 3.75%
. $15 M for Conskuction
-Crime/Ilealth L¿b Plus Flagstaff Offic.eBuilding Planning
-Construct 450 Prison Beds. Pay Cash inFY 95. Similar A¡nount for Building Renewal; Fund58% of DOA/University Formul¿
JLBC STAIT'RECOMMEI\DATION
. $265 M lncre¿sein GencralFund OporatingBudget. 785 FTE Position Increase; o¡ 3(Þ FTEIncrease, Excluding Corrections/DYTR. Sn.O M Surplus
o Adds S3.4 M and 45 FTE for ConsentDecrce Implcmentationo Adds $1.9 M for Nenr Boot Campo Funds 30 New Beds in FY 95. Funds NoNerv Probation Slots
o Funds 2% of 2-6% Dell¿tor at a Cost of$48 M. Reduces 5O% of $142.5 M Rollover in FY95o Continues to Fund Sudden Growth at 75%of Requiremento Adds $18 M to Eliminate Use of District'sC¿sh Bal¿nces to Offset Ståte Aid and $9 M ûo
Resûorc $15 Per Student Capial Reduction
o Adds $7.4 M, Including 2% lnflaåon,$2.5 M for Unfunded FY 94 Operating Àid,and $3.5 M to Fully Fund Capital Formula
¡ Adds $1t.2 M for Operating, Including$4.7 M for Enrollment, $2 M for Nen¡Campus Development and $5 M for FacultySal¡ries
o Continues @ Sl42.5 M in FY 94; Reduces
to 57L.25 M in Fr 95
o Recommer¡ds Lcgislation to Avoid RequiredDeposits in Botl¡ FY 94 and FY 95
o Rocommends $100 M Income Tax Cut. $20 M High County Property Tax Relief
o $60 M for Pay/Health InsuranceIncr€ase. $4.3 M for P¡ovider Increaseo Retirerne¡¡t Contribution of 3.75%
. $9 M for Constn¡ction
-Crime and Hcahh l-ab Planning
-Constn¡ct 530 Prison Beds-Lease-h¡¡chasein FY 96. $16 M for Building Renewal; Fund 67% ofDOA and 55% of University Formuls
o $26 M, Including $21 M for Fduc. Reform
ETECUTTVERE|COMMEI{DATION
. $300 M Increase in G€neral Fund OperatingBudger. 981 FTts Position Increase; or 352 FTEIncrcase, Excluding Cor¡ections/DYTR. $29.6 M Surplus
Youth T¡eatme¡rtand Rehabilitation
CommunityColleges
Unive¡sitiqs
BudgetSt¡biliz¡tion Fund(BsÐ
Tax Cuts
Staæ EmployeeIssuqs
Capital Outlay
Other Bills
AGENCIES
K-rz
MÀTORrssrlEs
Parameters ofGeneral FundBudget
K-12 Rollover
Fr 1995COMPARISON OF MATOR FOLICY ßST]ES
ltt
State Paús Board
Agriculturc
Arizona Historic¿lSociety
Veterans'Comm.
DEQ/WQARF
Health Services
EconomicSecurity
AHCCCS
Attorney General
DPS
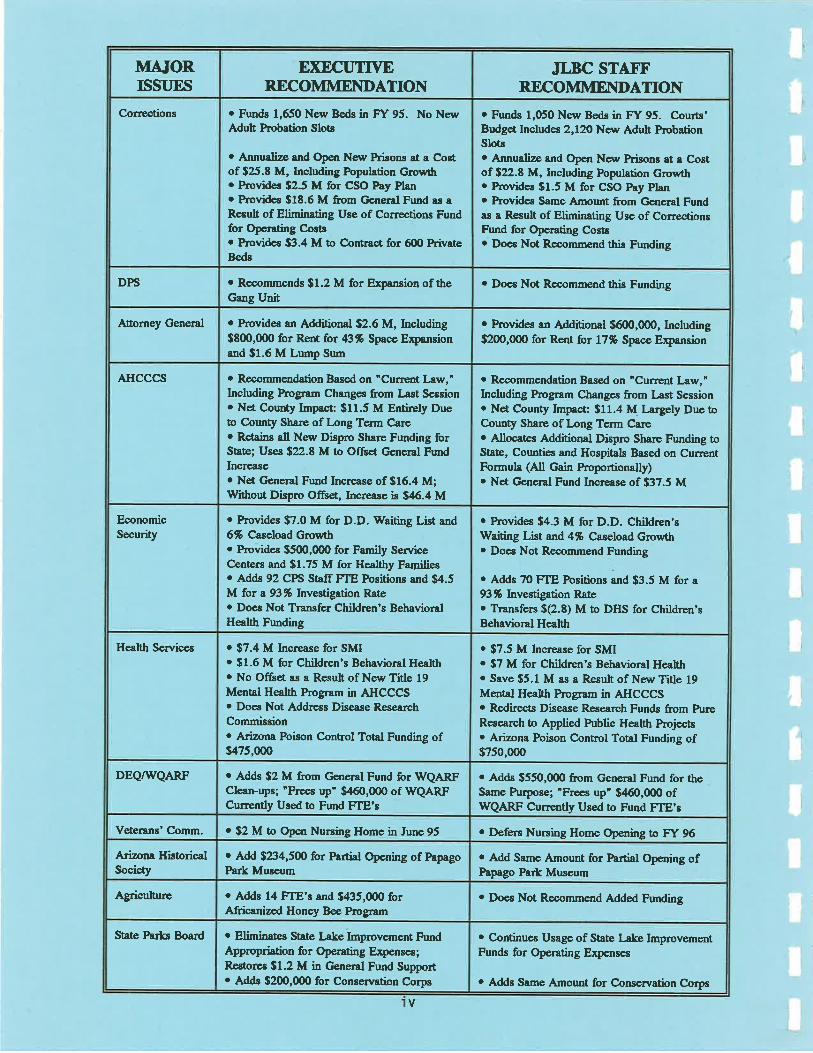
Corrections
MÀTORrssuEs
. Elimin¿tes State l¡ke Improvement FundAppropriation for Operating Expenses;Restor€s $1.2 M in General Fund Supporto Adds $200,ü)0 for Conservation Corps
o Adds 14 FTE'¡ and 9435,üÞ forAfric¡nized Honey Boe Program
o Add $234,5(þ for Parti¡l Opening of PapagoPark Museum
. $2 M ûo Open Nursing Home in June 95
. Adds $2 M from General Fund for V/QARFClean-r¡ps; "Frecs up" $,160,ü)0 of \VQARFCurrently Used to Fund FTE'I
. $7.4 M Increase for SMI
. $1.6 M for Child¡en's Behavioral Health
. No Offset as a Result of New Title 19Mental Health Program in AHCCCSo Does Not Address Disease ResearchCommission. A¡izon& Poison Control Total Funding of$475,000
o Provides $7.0 M for D.D. Waiting List and6% C¿seload Growttro Provides $500,q)O for Family Sen¡iceCenters and $1.75 M for Healthy Familieso Adds 92 CPS Ståff FTE Positions and $4.5M for a 93% Investigation Raæo Does Not Transfer Children's BehavioralHealth Funding
o Recommend¡tion Based on "Current Law,"Including Pr,ognm Changes from L¡st Session. Net County Impacü $11.5 M Entirely Dueto County Share oft ong Term Careo Retains all New Dispro Share Funding forState; Uses $22.8 M to Off8et Gene¡¡l FundIncreaseo Net General Fund Increase of $16.4 M;\Uithout Dispro Ofßet, Increase is $46.4 M
o Provides an Addition¿l $2.6 M, Including$800,q)0 for Rent for 43% Spece Expursionand $1.6 M Lump Sum
o Recommends $1.2 M for Ex¡nnsion of theGang Unit
o Funds 1,650 New Beds in Ff 95. No NewAdult Probation Slots
o fi¡¡¡rr¡lize and Open New Prisong at ¡ Costof $25.8 M, Including Population Growtl¡o Provides $2.5 M for CSO Pay Plano Provides $18.6 M A,om Gcneral Fund as aRe.rult of Eliminating Use of Corrections Fundfor Opcrating Costso Pr,ovides $3.4 M to Contract for 6(þ PrivafeB€ds
EXECT]TTYERECOMMEI{DATION
o Continues Usage of State l-ake ImprovementFunds for Operating Expenses
o Adds Same Amount for Conservation Corps
o Does Not Recommcr¡d Added Funding
o Add Same Arnount for Parti¿l Opening ofPapago Part Museum
o Defers Nursing Home Opening to FY 96
o Adds $550,000 from General Fund for theSame hrrpose; 'Frocs up" $460,(XX) ofU/QARF Currently Used to Fund FTE's
. $7.5 M Increasc for SMI
. $7 M for Children's Behavioral Healtho Save $5.1 M ¿s a Result of New Title 19Mental Health Program in AHCCCS. Redirects Disease Research Funds from h.rreResearch to Applied h¡blic Health Pr,ojects. Arizona Poison Control Total Funding of$750,(x)o
o Provide,s $4.3 M for D.D. Children'sWaiting List a¡rd 4% Caseload G¡owtho Does Not Recommend Funding
¡ Adds 70 FTE Positions and $3.5 M for a93% Investigation Raæo Transfe¡s $(2.8) M to DHS for Children'sBehavioral Health
o Recommendation Based on 'Current Law,nIncluding Program Changes from Last Sessiono Net County Impa.ct: $11.4 M l-argely Due toCounty Share ofLong Term Care. Allocates Additional Dispro Share Funding toState, Counties and Hospitals Based on CurrentFormul¿ (All Gain Proportionally)o Net General Fund Increase of $37.5 M
JLBC STAIT'RE,COMMEI\DAIION
o P¡ovides an Additional $6(X),(X)0, Including$20(),CX)0 for Rent fot 17% Space E:çansion
o Does Not Recommend this Funding
o Funds 1,050 Neu'Beds in F"f 95. Courts'Budget Includes 2,12O New Aduh PnobationSlotso Annualize and Open New Prisons at s Costof $22.t M, Including Population Growtl¡o Provides $1.5 M for CSO Pay Plano Provides Same Amount from General Fundas a Result of Eliminating Use of CorrectionsFund for Operating Costs. Do€s Not Recommend this Funding
V

r"r 1994JLBC STAIT'
$ 96,014,6003,916,730,3æ
(51,100,000)58,219,7æ
5,r29,7û3,789,113,2æ
11,471,9@
11,100,000142,500,00028,386,0()0
000
22,564,9ú(¿10,000,000)
4,956,ooo
$3,974,221,7æ
$ 35,642,900
$ 35,642,9004,169,ù10,300
(34,200,000)69,953,800
04,U7,241,1æ
31,551,400
00
123,603,000-20,000,00030,000,000
(10,000,000)21,000,000
(45,000,000)
0
$4,218,395,500
6 22,0/.r,5û
04,082,454,800
25,000,000
07L,25O,W
026,000,00064,300,000
(10,000,000)21,000,000
(45,000,000)0
$4,235,ü)4,800
$ 29,6@.,200
r.Y 1995
JLBC STAIT' E)ßCUIM
REYEIIT]ES:BEGINNING BALANCEBASE REVENTJESFEDERAL RETIREES' REFTJNDS
DISPROPORTIONATE SHARE REVENTJEGOVERNOR'S TAX REDUCTION
PROPOSALGOVERNOR'S HIGH COI'NTY PROPERTY
TAX RELIEF
SIJBTOTAL.REVENUES
E)GENDITT]RES:APPROPRIATIONS:
oPrior Session AppropriationsoOperating Subûotal.Cepital Outlay Subtotalo Supplemental Appropriations :
-Agency Supplenental Appropriations-Reverse K-12 Rollover-Required Payment to BSF
¡Other BillsoFY 1995 Pay IncreaselHealth Ins. Increase¡Risk Man¡gement Savings
ADMINISTRATIVE ADJ. & EMERGENCIESREVERTMENTSCHG. IN CONTINIJING APPROPRIATIONS
SUBTOTAL-EXPENDITTJRES
PROJBCTED EhIDING BALAITICE:
$ 191,549,0004,169,040,300
(34,200,000)59,219,7æ
0 0 (100,000,000)
0 (20,000,000)
$4,009,964,600 î4,240,437,W $4,264,609,000
GENIER,AL FT]I\D REVENTT]ES AND EXPEI\DITT]RESFISCAL YEARS 1994 AI\D 1995
-1-
r.T 1993 REVIEW AND F"T 1994I]PDATE
In June 1993, the JLBC Staff projected that the st¿te would conclude F.Y 1993 with a$65 million surplus as a result of improving trends in state government finances. As itturned out, the nerrys w¡u¡ even better as the state concluded the year with a $86 millionsurplus. The unexpectedly large surplus w¿ts created by an excess of revenues totalling $103million as compared to the JLBC Staff forecast prior to enactment of the budget. A moredetailed review of that year's revenue forecast is included in the revenue section at the backof this summary book.
A fair portion of the unanticipated revenues were unforeseeable and un¡elated to economicevents. For example, the collective overage of $34 million in the property tax, insurancepremium tax, estate tax, and disproportionate share revenue had little ûo do with the state ofthe economy. The $26 million overage in the sales tax appears to have been driven by asurge in optimism that was unique to Arizona and a handful of other states. The $51 millionoverage in the income tax may have had more to do with the effects of the 1990 Tax ReformAct, which obviousþ generated more revenue for the state than expected from both theindividual and cor¡nrate income taxes.
Forecasting was made even more difficult by the fact that ta:r growth accelerated at year'send, as growth in the final 4 months averaged l3To as compared to the prior year. Thisextraordinary growth came too late in the fiscal year to be reflected in either the revised FY1993 or FY 1994 budget forecasts for revenue. Nonetheless, this hypergrowth was notmaintained as year-to-daæ growth in FY 1994 of roughly 7% is actuatly less than FY 1993'sannual increase of 8.5To.
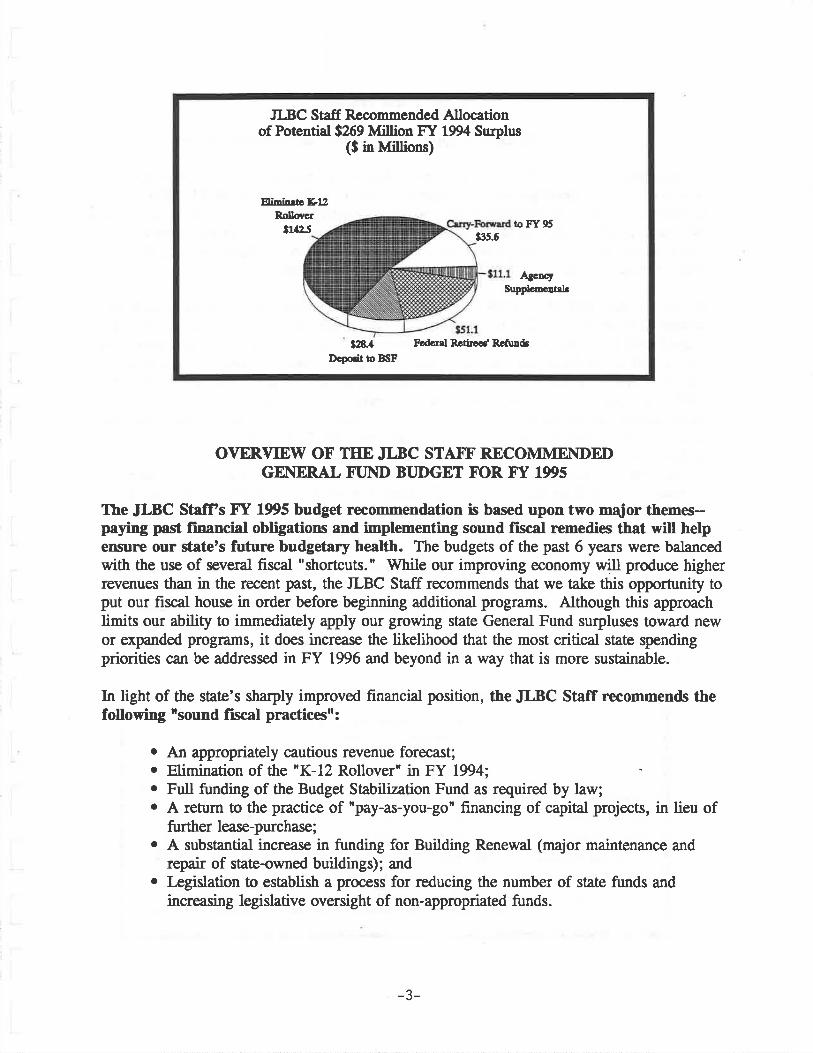
The revised Staff gstimate for Hf 1994 revenue is $190.5 miilion higher than theestimate used at time of enactment of the budget in March 1992. The higher revenues,when combined with the $86 million surplus carried forward from FY 1993 and certain other"balance-sheet" adjustments, would lead to a $268.7 million surplus at the end of FY 1994 ifnot for 4 obligations, including: 1) federal retiree refunds of $51.1 million (alreadyunderway); 2) proposed supplemental appropriations of $11.1 million for state agencies; 3) aproposed supplemental appropriation of $28.4 million to make the estimated required depositinto our Budget Stabilization Fund; 4) a proposed supplemental appropriation of $142.5million in order to eliminate the accounting practice commonly known as the "K-12Rollover" (which is an exception to Generally-Accepted Accounting Principles). lVhen theseobligations are paid, the projected year-end surplus is reduced to $35.6 million (see graph attop of next page).
-2-
JLBC Strff Recommended Allocationof Potential $269 Million FY 1994 Surplus
($ inMllions)
to FY 95
Fodcrd Rr6¡oca' RÊÁ¡Dd¡
¡3s.6
SlpplcnøtrbA¡e¡cy
Elimin¡lc IGfl
328.4Dc"odt b BSF
Rollovcr¡1425
OVERVIEW OF THE JLBC STATT'RECOMMEI\DET)GEI\ER,AL FI]I\D BIJDGET FOR F"T 1995
The JLBC St¿ffs Ff 1995 budget necommendation is based upon two mqior themes--paying past frnancial obligations and implementing sound fiscål rrmedies that will heþensure our fåte's fufure budgetary health. The budgets of the past 6 years were balancedwith the use of several fiscal "shortcuts." 'Whilt our improving economy will prduce higherrevenues than in the recent past, the JLBC Staff recommends that we take this opportunity toput our fiscal house in order before beginning additional progrÍrms. Although this approachlimits our ability to immediately apply our growing state General Fund surpluses toward newor exparided programs, it does increase the likelihood that the most critical state spendingpriorities can be addressed in FY 1996 and beyond in a way that is more sustainable.
In light of the state's sharply improved financial position, the JLBC Ståff recoûrmends thefollowing nsound fiscål practicesr:
. An appropriately cautious revenue forecast;o Elimination of the "K-Iz Rollover" in FY 1994;o Full funding of the Budget Stabilization Fund as required by law;o A return to the practice of 'pay-as-you-go" financing of capital projects, in lieu of
further lease-purchase;o A substantial increase in funding for Building Renewal (major maintenance and
repafu of state-owned buildings); ando Iægislation to establish a process for reducing the number of state funds and
increasing legislative oversight of non-appropriated funds.
-3-

Sound Fiscal Pmctíces
Improving Economy-Appropriately Cautious Revenue Forecest
As described in the FY 1993 Review section, Arizona's improving economy was firstreflected in the surprisingty strong revenue growth of E.SVo achieved in tr.f 1993. Thiscompared favorably with the consensus revenue forecast of 4.7Vo used for that year's budget.\ilhereas, the JLBC Saff forecast for income and job growth in Arizona was quiæ accurate(for example, actual income growth was 7.6% versus 7.2% in the Staff forecast), GeneralFund revenues exceeded the Staff forec¿st by over $100 million.
During the first half of Fy 1994 (through December), General Fund revenue growth hasslowed to rourgþly 7Vo. Due to the skewed impact of last year's tax cuts and this year'sfederal retirees refund progtam, where the associated revenue losses are concentrated in thesecond half of the fiscal year, $re are expecting a further slowing of revenue growth over thenext 6 months on a year-over-year basis. Furthermore, growth during the second half of FY1993 was especially strong and, therefore, wil make the year-over-year compa¡ison lookworse during the second half of the year. For FY 1994 as a whole, rve are forecasting thattotal personal income in Arizona will once again grow by 7.6%. However, due to thefactors cited above, we expect annual revenue growth to abate somewhat to 5.0Vo.Nonetheless, our base revenue forecast of $3,975 million (prior to the federal retiree refunds)is some $190.5 million higher than the Governor's revenue forecast, which was used lastMarch when this year's budget was adopted (and $132.4 million higher than the JLBC Staffrevenue forecast of last March).
The JLBC Ståff F f 1995 forec¿st calls for a modest acceleration in the Arizona personalincome growth rate to 8.2%, to be accompanied by a similar increase in the base revenuegrowth rate to 6.67o. Of course, the Staff estimate reflects the legislated tax changes of1993. Without these effects, the JLBC Saff forecasted increase of base revenue would be7.3Vo instead of 6.6Vo, while the net total revenue increase would be 7.9Vo instead of the7.27o shown below.
FY 1993 FY 1994 16 CHc. FY 1995 % CHG.
Sales Ta¡Income Taxes
Other Revenue
Total Base Revenue
Fed Retiree Reñ¡nds
Total Revenue $3,784.8 î3,923.9 3.7% $4,204.8 7.2%
5.O%
$1,631.41,4:22.6
730.8
$3,784.8 $3,975.0(51.1)
$1,737.1
r,497.9
7N.t
GENERÄL FI]ND RBVEI\T]E(dollars in miiliorc)
6.5%
5.3
1.3
$1,866.5
1,608.5
764-O
$4,239.0(34.2)
7.4%
7.4
3.2
6.6%
(33.1)
-4-
Elimination of the [K-12 Rollovern
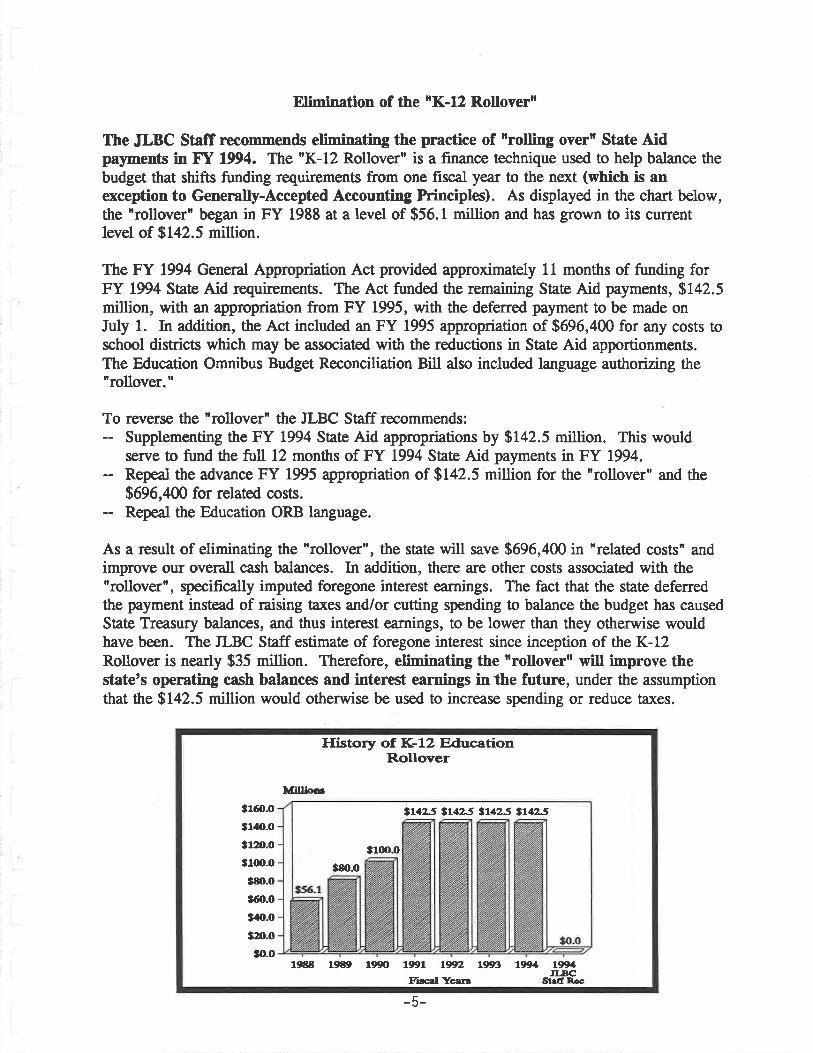
Ihe JLBC St¿ff reconmends eliminating the practice of rrolling overn State AidpaSments in Ef 1994. The "K-12 Rollover" is a finance technique used to help balance thebudget that shiffs funding requirements from one fiscal year to the next (which is enexception to Generally-Accepted Accounting Principtes). As displayed in the cha¡t below,the nrollover' began in FY 1988 at a lwel of $56.1 million and has grown to its currentlevel of $142.5 million.
The FY 1994 General Appropriation Act provided approximately 11 months of funding forFY 1994 State Aid requirements. The Act funded the remaining State Aid payments, $142.5million, with an appropriation from FY 1995, with the deferred payment to be made onIuly 1. In addition, the Act included an FY 1995 appropriation of $696,400 for any costs toschool districs which may be associated with the reductions in State Aid apportionments.The Education Omnibus Budget Reconciliation Bill also included language authorizing the"rollover."
To reverse the "rollover" the JLBC Staff recommends:Supplementing the FY 1994 State Aid appropriations by $142.5 million. This wouldserve to fund the full 12 months of FY 1994 State Aid payments in FY 1994.Repeal the advance FY 1995 appropriation of $142.5 million for the "rollover" and the$696,400 for related costs.Repeal the Education ORB language.
As a result of eliminating the 'rollovern, the state will save $696,400 in "related costs" andimprove our overall cash balances. In addition, there a¡e other costs associated with the"rollover", qpecifica[y imputed foregone interest earnings. The fact that the state deferredthe payment inste¿d of raising taxes and/or cutting spending to balance the budget has causedState Treasury balances, and thus interest earnings, to be lower than they otherwise wouldhave been. The ILBC Staff estimate of foregone interest since inception of the K-12Rollover is nearly $35 million. Therefore, eliminating the "rollover" will improve thestate's operating cash balances and interest earnings in the future, under the assumptionthat the $142.5 million would otherwise be used to increase spending or reduce ta;res.
¡1ó{¡-O
31,1O-O
¡fxr.o¡100-0
Itfr-os60.o
¡40-o
¡zt-ogt.o
¡L12-5 ttl¿S at125 tt4í2.5
¡100.0
fæ.o
lf¡llloo
19ll¡t lçrlr1JI-BC
St¡ff Ræ
lfit 19t!t 1990 19!11 ßXn t9{r3F¡¡c¡l Yc¡¡¡
flistory of fÇL2 EducationRollover
E
Fhll Fbnding of Arizona's Budget Stsbilization Fìrnd
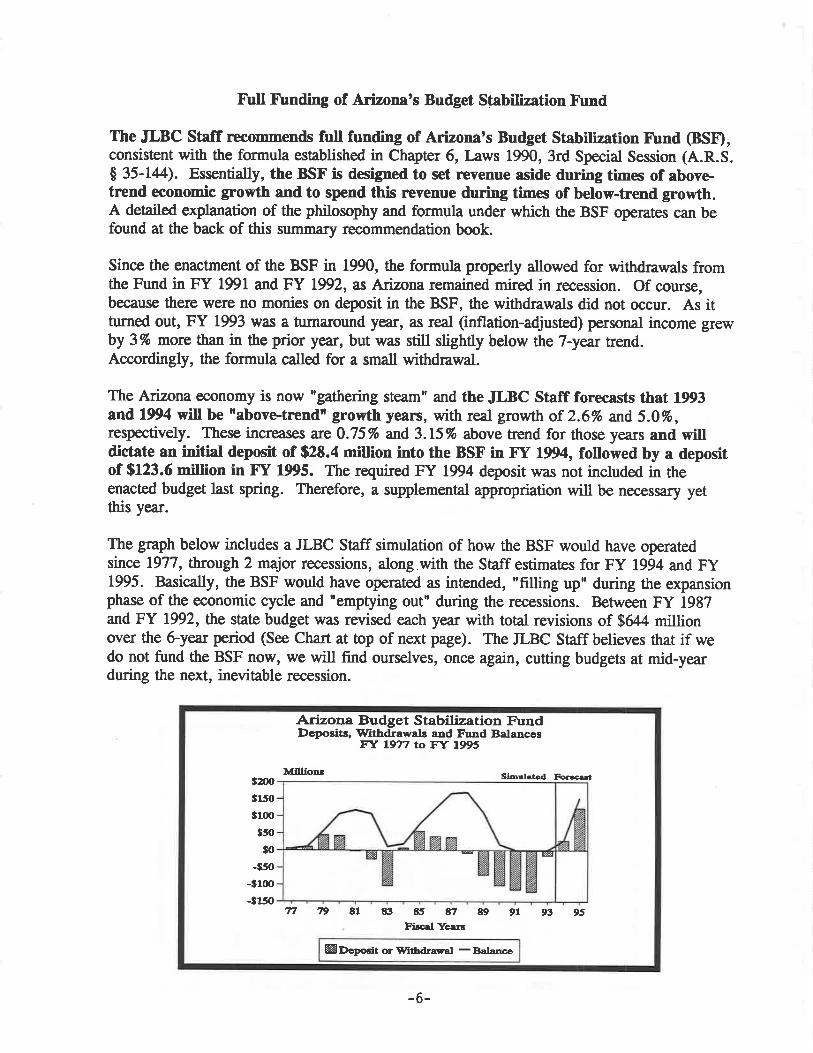
Ihe JLBC Staff recommends full funding of Arizona's Budget Ståbilization Fì¡nd (BSÐ,consistent with the formula established in Chapær 6, I-aws 1990, 3rd Special Session (A.R.S.$ 35-144). Essentially, the BSF is designed to set revenue aside during times of abovetrend economic growth and to spend this revenue during times of below-trend growth.A deailed explanation of the philosophy and formula under which the BSF operates can befound at the back of this summary recommendation book.
Since the enactment of the BSF in 1990, the formula properly allowed for withdrawals fromthe Fund in FY 1991 and BY 1992, as Arizona remained mired in recession. Of course,because there were no monies on deposit in the BSF, the withdrawals did not occur. As itturned out, FY 1993 was a turna¡ound year, as real (inflation-adjusted) personal income grewby 3To more than in the prior year, but was st'rll slightly below the 7-year trend.Accordingly, the formula called for a small withdrawal.
The Arizona economy is now "gathering steam" and the JLBC Staff forecasts that 1993and 1994 will be rabovetrtndtr growth V€N, with real growth of 2.6Vo and 5.0To,respectively. These increases are 0.757o and 3. L5To úove fiend for those years and willdictate an initial deposit of $28.4 million into the BSF in Ff 1994, followed by a depositof $123.6 million in F"f 1995. The required FY 1994 deposit was not included in theenacted budget last spring. Therefore, a supplemental appropriation will be necessary yetthis year.
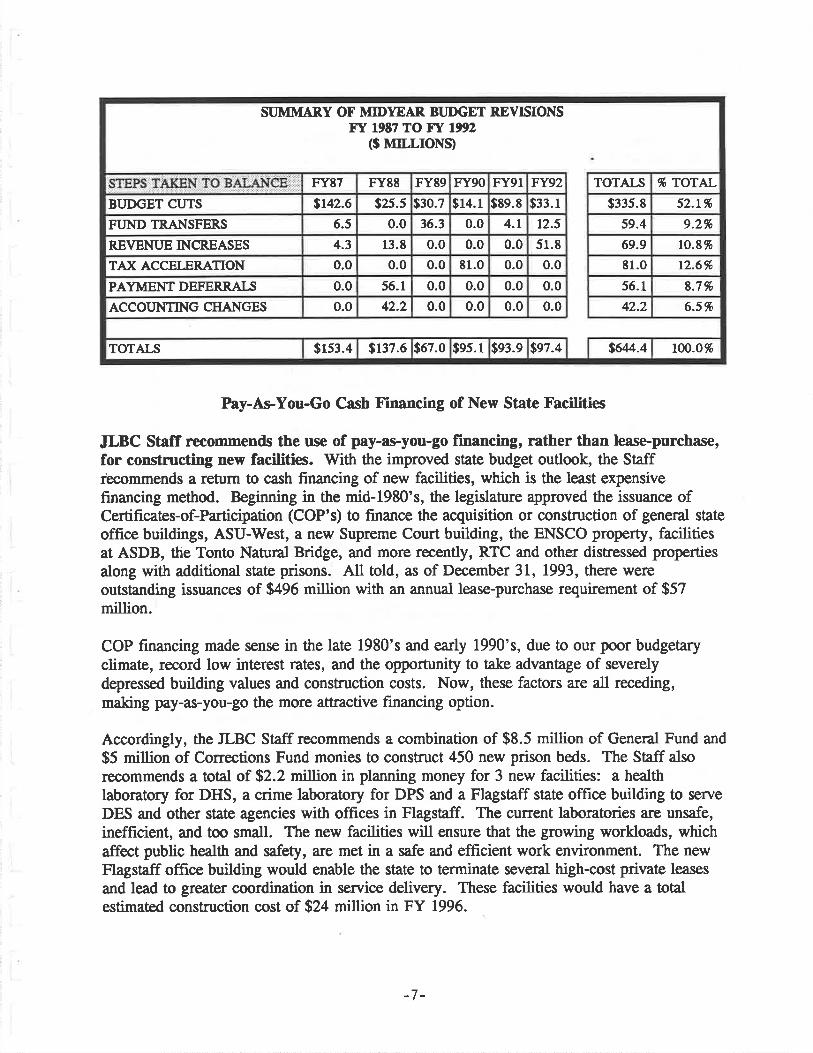
The graph below includes a ILBC Staff simulation of how the BSF would have operatedsince 1977, through 2 major recessions, along,with the Staff estimates for FY 1994 and FY1995. Basically, the BSF would have operated as intended, "filling up" during the expansionphase of the economic cycle and 'emptying out' during the recessions. Between FY 1987and FY 1992, the state budget was revised each year with total revisions of $644 millionover the 6-yea¡ period (See Chart at top of next page). The JLBC Staff believes that if wedo not fund the BSF now, we will find ourselves, once again, cutting budgets at mid-yearduring the next, inevitable recession.
Arizona Budget Stabilization Fr¡ndDc¡rcsits, Srlthdrawals a¡d Fì¡nd Bala¡ces
FX 1977 to FY 1995
izx)¡150
¡1ü)¡50
¡o-¡so
-31(xr
-i150
ØO.-prrdc or Srltbd¡sçal - Balancc
zztØ
Simuhted Fo@tMlllion¡
Tt 7t tl 91 93 9563 8!t tt 89Pi¡cd Yc¡¡¡
-6-
96 TOTAL
52.L%
9.2%
ro.8%
12.6%
8.7%
6.5%
100.0%
TOTALS
$335.8
59-4
69.9
81.0
56.1
42.2
s64./.4
FY92
$33.1
12.5
51.8
0-0
0.0
0.0
$e7.4
0.0
0.0
0.0
0.0
$e3.e
FY9I
$8e.8
4.1
FY90
$14.1
0.0
0.0
t1.0
0.0
0.0
$es.1
FY89
$30.7
36.3
0.0
0.0
0.0
0.0
$67.0
42.2
$137.6
F r88
$2s.5
0.0
13.8
0.0
56.1
4.3
0.0
0.0
0.0
$153.4
FY87
9142.6
6.5
BUDGET CUTS
FI'ND TRANSFERS
REVENUE INCREASES
TAX ACCELERATION
PAYMENT DEFERRALS
ACCOIJNTING CHANGES
SI]MII{AR,Y OF MIDYEAR BI]DGET REVISIONSFr úr ro Fr 1992
($ MILLTONÐ
TOTALS
Pay-As-You-Go Cash Financing of New State Facilities
JLBC Stsff ¡econmends the use of pay-as-you-go financing, rather than leasepurc-hase,for constructing new facilities. V/ith the improved state budget outlook, the Staffiecommends a return to cash financing of new facilities, which is the least expensivefinancing method. Beginning in the mid-1980's, the legislature approved the issuance ofCertifrcaæs-of-Participation (COP's) to finance the acquisition or construction of general stateoffice buildings, ASU-V/est, a new Supreme Court building, the ENSCO propefty, facilitiesat ASDB, the Tonto Natural Bridge, and more recently, RTC and other distressed propertiesalong with additional state prisons. All told, as of December 31, 1993, there wereoutstanding issuances of $496 million with an annual lease-purchase requirement of $57million.
COP frnancing made sense in the late 1980's and early 1990's, due to our poor budgetaryclimate, record low interest rates, and the opporrunity to take advantage of severelydepressed building values and construction costs. Now, these factors a¡e all receding,making pay-as-you-go the more attractive financing option.
Accordingly, the JLBC Staff recommends a combination of $8.5 million of General Fund and
$5 million of Corrections Fund monies to construct 450 new prison beds. The Staff alsorecommends a total of $2.2 millie¡¡ in planning money for 3 new facilities: a healthlaboratory for DHS, a crime laboratory for DPS and a Flagstaff state office building to serve
DES and other state agencies with offrces in Flagstaff. The current laboratories are unsafe,inefficient, and too small. The new facilities will ensure that the growing workloads, whichaffect public health and safety, are met in a safe and efficient work environment. The newFlagstaff office building would enable the state to terminate several high-cost private leases
and lead to greater coordination in service delivery. These facilities would have a totalestimated construction cost of $24 million in FY 1996.
-7-
IVIqior ll{aintenance and Repair of State S¡¡ilrlings
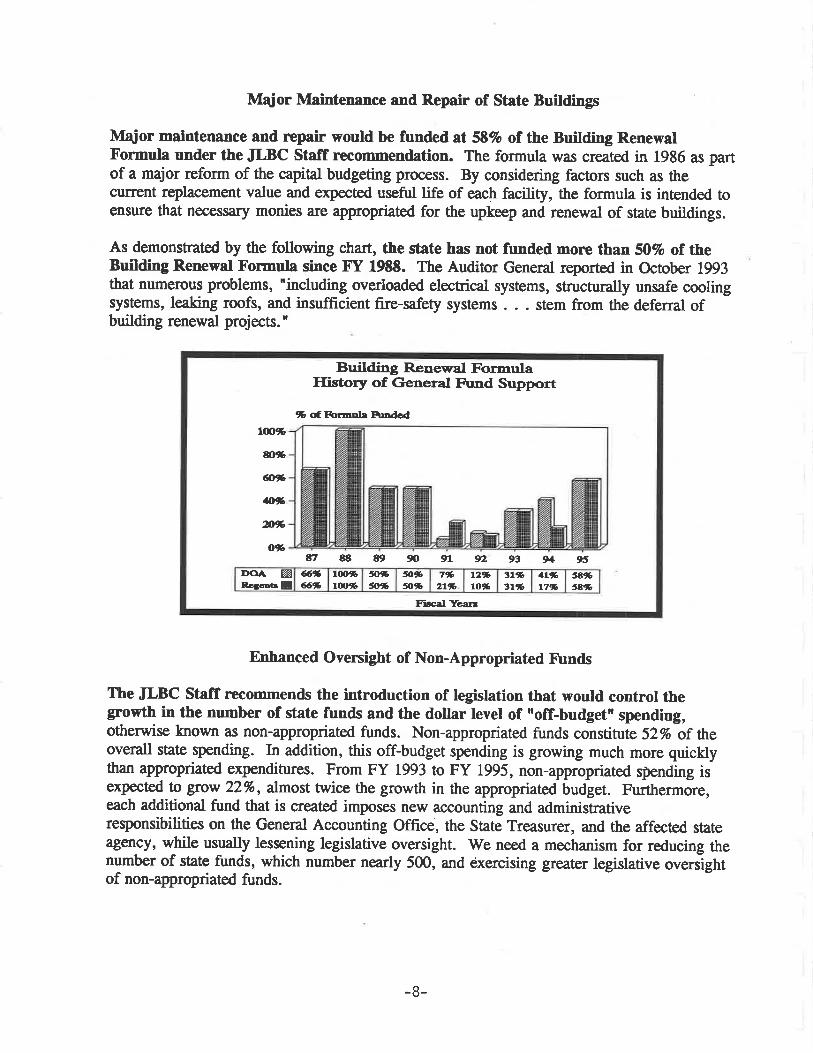
lVlqior maintenance and repair would be funded ú 5E% of the [¡¡flding RenewalFormula under the JLBC ståff recommendation. The formula was created in 19g6 as partof a major reform of the capital budgeting proc€ss. By considering factors such as thecurrent rqilacement value and expected useful life of each facility, the formula is intended toensure that necessary monies are appropriated for the upkeep aoã rene*al of state buildings.
As demonstrated by the following chart, the state has not funded morte than 50Vo of theBuilding Renewal Formula since F.f 198t. The Auditor General reported in October 1993that numerous problems, 'including overloaded electrical systems, structurally unsafe coolingsystems, leaking roofs, and insuffrcient fire-safety systems . . . stem from the deferral ofbuilding renewal projects.'
Enhanced Oversight of Non-Appropriated Fìlnds
The JLBC Stsff ¡ecommends the introduction of legislation that would control thegrowth in the number of fate funds and the dollar level of "off-budget" spending,otherwise known as non-appropriated funds. Non-appropriated funds constitute 52Vo of theoverall state spending. In addition, this off-budget spending is growing much more quicklythan appropriated expenditures. From FY 1993 to FY 1995, non-appropriated sþnding isexpected to grow 22%, almost twice the growth in the appropriated budget. Furthermore,each additional fund that is created imposes new accounting and administrativeresponsibilities on the General Accounting Office, the State Treasurer, and the affected stateagency, while usually lessening legislative oversight. We need a mechanism for reducing thenumber of state funds, which number nearly 500, and exercising greater legislative oversþhtof non-appropriated funds.
Brrilding Renewal FormulaIlistory of General Fund Support
8, Eg 89 90 91 lÍ2 93 9,1 95%nnctaE
I'OA 6*6:ß
lút,6turb
ftbfi1ß
fi%fl%
7.b2t1b
t2tto%
3t%3th
|t%17.ß
tæb5A.ß
% dFornof¡ R¡ndcd
F¡¡cal Yca¡¡
Lü)%
ú%
æ%
M
/v*o%
-8-

Under the propsed legislation, the JLBC Staff would develop an annual recommendation tothe Legislature for reducing the number of all funds and the dollar level of non-appropriatedfunds. fire Staff would be required to prqnse a L0% reduction in the number of funds and
a 5% reduction in non-appropriated qpending. Upon review by the Joint l-egislative Budget
Committee, legislation would be inúoduced to implement the reduction proposal.
Other Budget Issues
State Employees
The state work force of appropriated EIE positions would grow by 785, or 2.2Vo, underthe JLBC Ståff recorlmendation. This growth is largely centered in the criminal justice
agencies. Of the new positions, 62Vo will staff new prisons or help implement theDepartment of Youth Treatment and'Rehabilitation judicial oonsent decree.
JLBC Staff reconrmendation sets aside S30 million for state employee pay and healthbenefit changes. Individual agency budgets already include sufficient dolla¡s to fund theretirement rate at 3.75%, up from 3.t4To last year. Details of the general pay adjustmentwould be deærmined during the appropriations process. Among numerous options, this set
aside could fund: an across-the-board increase, a flat dolla¡ amount per FTE lnsition, orsome combination of the two. University pay adjustments will be calculated on the proratedGeneral Fund share of Personal Sendces, which is approximately 8O%.
ANNUAL INCREASES IN STATE EMPI,OYEES' SALARIESas CoMPARED
1? ffi*tr*s oF INTLATIoN
+ Actr¡¡l increase of $1,000 per employee, effective +L-93, represe,nted a 4.4%increase in the base salary for the average employeeGen'l: General Pay Adjustment; Merit:Performance Pay;
CMR:Classiñcation Mainten¡nce Review; CPI-U Conzumer Price Index
CPI-UFY GEN'L MERTT CMR
3.6%3.24.0
(2.6)(1. 1)(3.2)(0.8)(3.s)1.E
(3.3)
INCREASEAFÏER INFL.
3.9%2.82.24.t4.74.75.53.52.63.3
7.5%6.06.2r.53.61.54.80.0 .
4.40.0
TOTALINCREASE
2.5%1.33.00.00.01.30.00.00.00.0
5.0%4.03.01.53.50.04.50.04.4*0.0
198519861987r98819891990L99ltÐ219931994
o.o%0.7o.20.00.10.30.30.00.00.0
-9-
Education
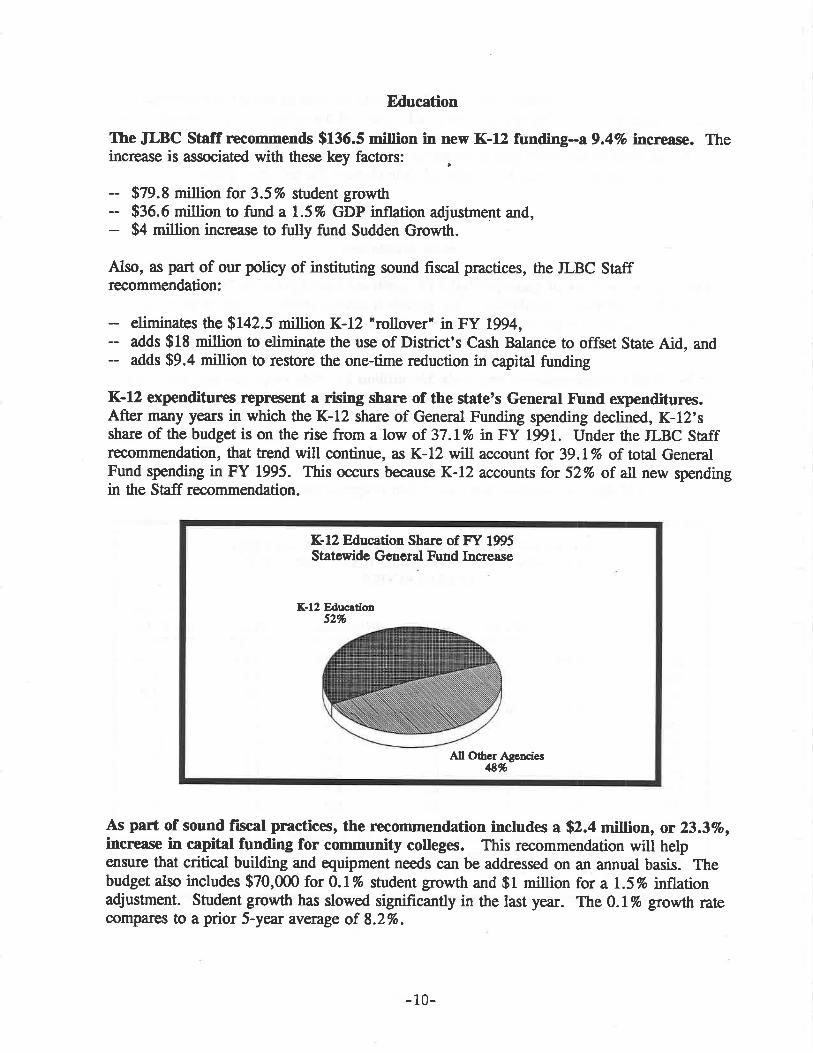
Ihe JLBC Stsff recorrmenals $136.5 million in new K-12 funding-e 9.4Vo increase. Theincrease is associated with these key factorsi ,
$79.8 million for 3.5% student growth$36.6 million to fund a 1.5% GDP inflation adjustment and,$4 million increase to fully fund Sudden Growth.
Also, as part of our policy of instituting sound fiscål practices, the JLBC Staffrecommendation:
eliminates the $142.5 million K-12 "rollover' in FY 1994,adds $18 million to eliminaæ the use of District's Cash Balance to offset State Aid, andadds $9.4 million to restore the one-time reduction in capital funding
K-12 expenditunes repnesent a rising share of the st¡te's General Fìrnd expenditures.After many years in which the K-12 share of General Funding spending declined, K-12'sshare of the budget is on the rise from a low of 37.lVo tnFY f991. Under the JLBC Staffrecommendation, that úend will continue, as K-12 wilt account for 39. LVo of total GeneralFund spending in FY 1995. This occurs because K-12 accounts for 52% of all new spendingin the Staff recommendation.
As part of sound fiscal practices, the rrccommendation includes a 92.4 mittis¡, or 23.3Vo,increase in capital ¡r¡¡rling for community colleges. This recommendation wilt helpensure that critical building and equipment needs can be addressed on an annual basis. Thebudget also includes $70,000 for 0.1% student growth and $1 million for a 1.5% inflationadjustment. Student growth has slowed significantly in the last year. The 0. LTo growth ratecompres to a prior S-year average of 8.2%.
K-12 Educ¡tions2%
All OthcrAgenciesÆ%
K-12 Education Share of FY 1995Staæwide General Fund Increase
- 10-

Under the JLBC Ståff Feconrmendation, the universities would receive a total increase of{2G27.5 million. This amount includes $6.9 million in their operating budgets, $10.4million in capital outlay, and $9-10 million in the Staff recommended general payadjustment, de,pending on the specific design of the pay plan.
Criminal Justice
Ihe JLBC Staff reconmends a tot¡l General Ft¡nd increase of $41.5 miilion, or L4.6To
for the IÞpartuent of Corrections budget. The recommendation includes 922.8 million toannualize the cost of 650 prison beds opened in FY 1994 and to open 1,050 new prison bedsin FY 1995. The recommendation also includes $18.6 million from the General Fund tooffset the loss of the Corrections Fund as a financing source for operating costs. TheCorrections Fund $rilf be used to make lease-purchase payments on the FY 1993 and FY1994 prison construction projects as well as a lease payment to Apache County for theApache Prison and to help construct 450 new beds in Globe and Yuma.
The JLBC Ståff recommendation would reduce the current 11879 bed shortfall to 9E9 bythe end of FY 195. In addition to the 650 new state-run prison beds to be opened in FY1994, an additional 450 private treatment beds will be activated nea¡ Mara¡ra. Incombination with the 1,050 new beds in FY 1995, this expansion will bring the desþnatedbed capacity of the prison system to 18,239, which reduces the bed shortfall toalproximately 1,000 beds.
No other beds will be available until construction of the 768-bed Special Management Unit iscompleted in December of 1995. For FY 1996, the JLBC Staff is recommending opening anadditional450 beds to be constructed at existing sites in Globe (100) and Yuma (350), on apay-as-you-go basis, at a projected cost of $13.5 million in FY 1995. (General Fund,$8.5 million; Corrections Fund, $5.0 million)
z),(m
19,(m
1t,üx)
fi,rxn
16,(XXl
15,üX)
14,üXt
ß,ün
Èo¡.ctâdArtud
B.d C.púity
1/95 6t!r57t93 7t94 7t91lúy l$n to Jtrnc 1995
Department of CorrectionsPrison Population Growth
1lv¿ tt|B
- 11-

Ihe Recommendation would also fund a $1.5 million special pay adjustment forCorrectional Service Officers (CSO) over and above any general pay adjustment. In FY1994, the Iægislature also appropriated $1.5 million to the department to increase CSOsalaries. The increase amounted to a $296 annual increase (roughly 1.5%) for each of the4,480 CSO series employees. Salaries paid by the Arizona state government are below theamounts paid to simila¡ employees of the federal government, surrounding states, andMaricopa and Pima counties. As a result, the department has experienced excessive turnoverrat€s, which in turn impact haining and overtime costs. The new $1.5 million in FY 1995could provide an additional $265 (rougny 1.3%) annual increase.
Ihe JLBC Stâff recommends $3.3 million in total funds in Ff 1995 to implement theDepartment of Youth Treatment and Rehabilitation judicial consent decree, plus Ff1994 zupplementals of $3.4 million. The FY 1995 amount includes $1.1 million for 43new staff and higher sala¡ies and $1.8 million for institutional and community treatmentprograms.
Ïhe JLBC Staff zupplements its criminal justice institutional resourrces by adding$5.3 million for 2,ó00 new probation slots. Any analysis of proposed criminal justiceresources should encompass both the prison beds and community placements of theDepartment of Corrections and Youth Treatment and Rehabilitation as well as the probationslots funded through the Courts budget.
In addition to opening 1,050 new adult prison beds, the JLBC Staff recommends funding for2,120 new adult probation slots. The Staff also recommends 480 new juvenile probationslots.
He¿Ith and Welfare
Ihe AHCCCS recommendation is based on current law and represents the second yearof a 2-year plan. The recommendation continues reforms enacted during the prior year,including the provision of only emergency services to undocumented aliens, establishingcounty contributio¡s at29.5To of total non-federal AHCCCS costs, and reducing privatehospital reimbursement on state-only bills by $10 miflion. The Staff recommendation alsoincludes new funding for the statutorily accelerated phase-down of the 10% quick paydiscount on categorical bills and for the implementation of Title 19 mental health services fornon-Seriously Mentally Ill adults.
'Ihe St¿lPs neconmended General Fund increase for AHCCCS, $32.5 million, reflects alevel of growth well below that of recent yeâns. Increases in the AHCCCS budget fromFY 1990 through FY 1993 averaged $67.7 million per year, while enrollment over that sametime period increased 16.I% on average per year. For FY 1995, we estimate an enrollmentincrease of 7.4%.
-L2-
The JLBC Stsff rocommendation would continue to share increases in DisproportionateSharc Hospital revenue with the counties and private hospitals. Under the Staffspro¡rcsal, counties would receive $6.4 million in additional net payments, private hospitalswould receive $4.6 million more and the state would gain $15.6 million. These amountsreflect increases over the original FY 1994 appropriated amounts.
The JLBC Stsff Fecoilrmends an additional $12 million for the Department of EconomicSecurity. Two particula¡ recommendations focus on improved financial practices - $1.8million for 98 additional welfare eligibility workers to keep our error rate in check and $1.5million to offset a potential loss of federal funds for Deveþmental Disabilities.
Other key Staff recommendations include: no inflation funding for AFDC benefits, an
additional 70 Child Frotective Sen¡ices staff and funding for 473 Developmental Disabilitieschildren currently on the waiting list.
Behavioral health prograÍ¡s in the Deparfuent of Health Services would receive a netincrease of $9.5 million under the JLBC Ståff recommendation. The increases include$7.5 million for the Seriously Mentally Il1, $7 million for Children's Behavioral Heatth and areduction of $5 million to reflect the transfer of some Adult General Mental Health clients toAHCCCS.
The JLBC Ståff rccommendation for DHS would also refocus disease prevention funrlingfrom pure research to public health projects. Each year, $2.9 million of state taxrevenues a¡e diverted for disease control resea¡ch outside of the legislative appropriationsprocess. The recommendation redirects these funds to vital public health efforts, including:the Arizona Poison Control Center (APCC), tuberculosis Eeatment, emergencyenvi¡onmentalhazard abatement (such as the Hanta Virus, or the Maryvale Cancer Cluster),on-going disease research, and the c¿rncer and birth defects registry.
Natural Resources
The JLBC Ståff necommends the continued use of State Lake rmprovement Fì¡nds -watercraft motor fuel taxes - for the operation of water-based state parks. Under statelaw, all SLIF revenues in FY 1995 a¡e scheduled to again be used only for capital projectsand local grants. Since FY 1992, one-fourth of SLIF revenues, approximately $1.2 million,have offset General Fund appropriations. The continued use of SLIF for operating expensesis consistent with the use of parls visitor revenue for operating expenses, in that parks usershelp to fund a portion of the cost of operating state parks. Using a portion of SLIF foroperating expenses instead of parks development also instills an awareness that parks carinotbe built or expanded without funding to operate the park.
Other Issues
As part of sound fiscât practices, the JLBC Ståff recommends improvements to thestate's account¡ng system. This recommendation includes an additional 10 FTE positionsand $737,300 for the Department of Administration to conduct statewide training programs
- 13-
on use of the state's automated financial systems, develop an automated fixed asset trackingsystem, and establish an automated systems security team in order to assure the inægrity andconfidentiality of information.
The JLBC Ståff is recommending privatization of state services where appropriate. Forexample, the Staff recommends that the Southern Arizona Mental Health Center (SAMHC)be privatized by no later than the beginning of FY 1996. Vfith a budget of $3.7 million and81 FTE positions, SAMIIC currently competes with private nonprofit organizations in PimaCounty for the provision of mental healttr sen¡ices. In addition, the JLBC Staff alsorecommends reduced funding for the Oepartment of lVeights and Measures to reflect theclosing of its petroleum laboratory and the contracting for that sen¡ice with the privatesector. This closing will save the lÞpartment approximately $170,000 and 12 FTElnsitions.
-14-

c4ENÈoaÈtal¡lt-¡Ê
eft\
TOTAL
ALL OTHER
DEPT OF PT'BLIC SAFETY
DEPT OF REVENTJE
COMMTJNITY COLLEGES
COI'RTS
DEPT OF HEAXTII SERVICES
DEPT OF CORRECTIONS
DEPT OF ECONOMIC SECT'RITY
AHCCCS
T'NIVERIIITIES
K-12
AGENCY
3,782,715,tæ
214,306,(n0
34,14Á.,2û
47',18t,300
t6,7n,læ
u,x28,5æ
194,17t,2æ
2t3,29E,2æ
356,653,9q)
4n,l9l,tæ
540,320,4N
1,444,175,2æ
rY1994Approprietim
4,(n2,454,t00
254,613,7æ
36,159,ü)o
o,673,tû
94,533,W
u,22E,5æ
205,674,5æ
334,69t,,100
3t0,827,600
493,606,000
55t,474,100
rset,w,2æ
rr 1995Exctúive
Remmend¡lln
4,M7,24t,tæ
2ß,656,8æ
34,t94,(x)o
47,670,4ú
90,57t,500
90,865,700
206,453,6æ
324,7t7,5æ
36t,800,200
514,6tt,400
s47,2O7,ffi
1,5t0,63E,,100
TY T995JLBC S.sff
Ræonmeod¡tion
(35,2t3,700)
(13,956,9m)
(1,265,000)
(3,400)
(3,954,500)
6,637,2æ
TI9,Iæ
(9,910,900)
(12,t27,M)
21,092,4û
(11,266,5(n)
(11,327,t00)
264,525,3N
6,350,800
745,800
t82,100
3,85 I,,000
6,637,2W
n,ns,ffi41,4t9,300
t2,tß,300
37,496,6æ
6,tE7,200
136,4É.3,2û
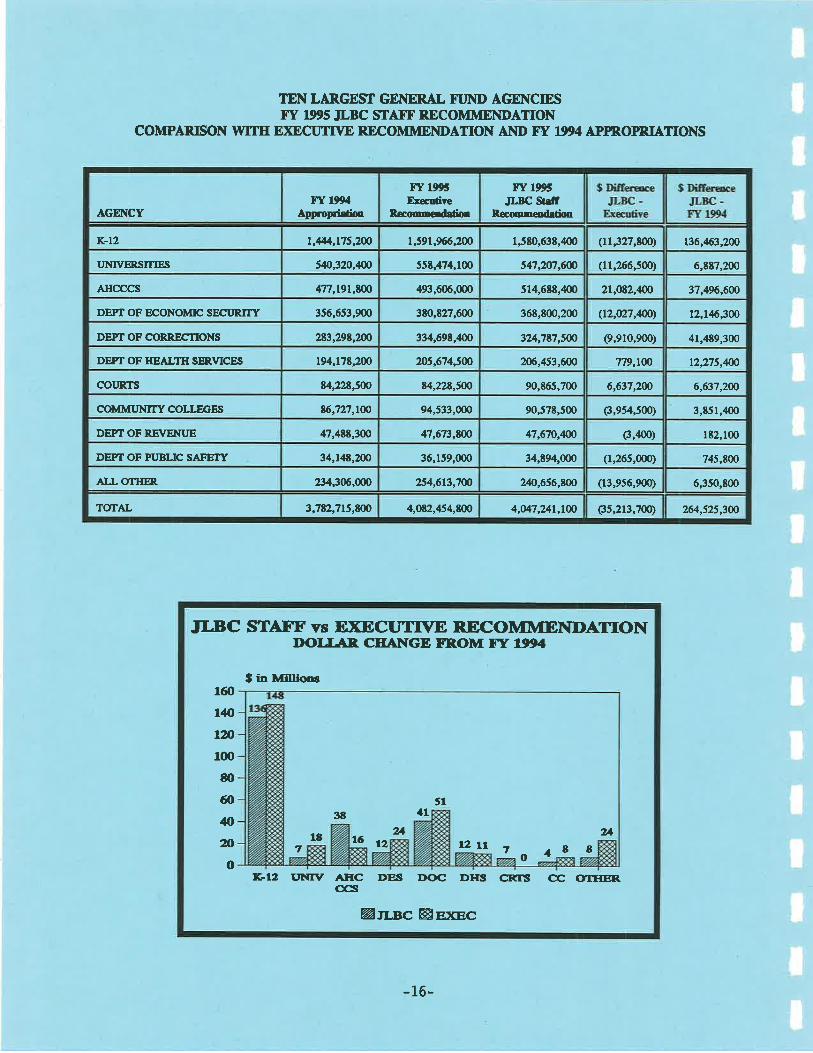
TEN LARGEST GENM,AL FI]ND AGEI{CIEST"g l)95 JLBC STAIT' RECOMME¡{DATION
COMPARXSON IüITH EXECTITTYE RECOMMEIIDATION AIVD FT 1994 APPR,OPRHTIONS
JLBC SIAFI. ys ETCL]TM RECOMMENDATIONIX)IJ.AB. CEAIYGE ER()M f"T 1994
160
IQtm100
80
60
4{t
mo
'ß-L2 I'NTI' .AIIC DES DOC DITS GIìS CC OTFIER,
OG¡
t2 Lt7la
3a
ló a2A
1t51
7o
21
1a t
I in Millions
Øn-nc trlx¡ec
- 16-
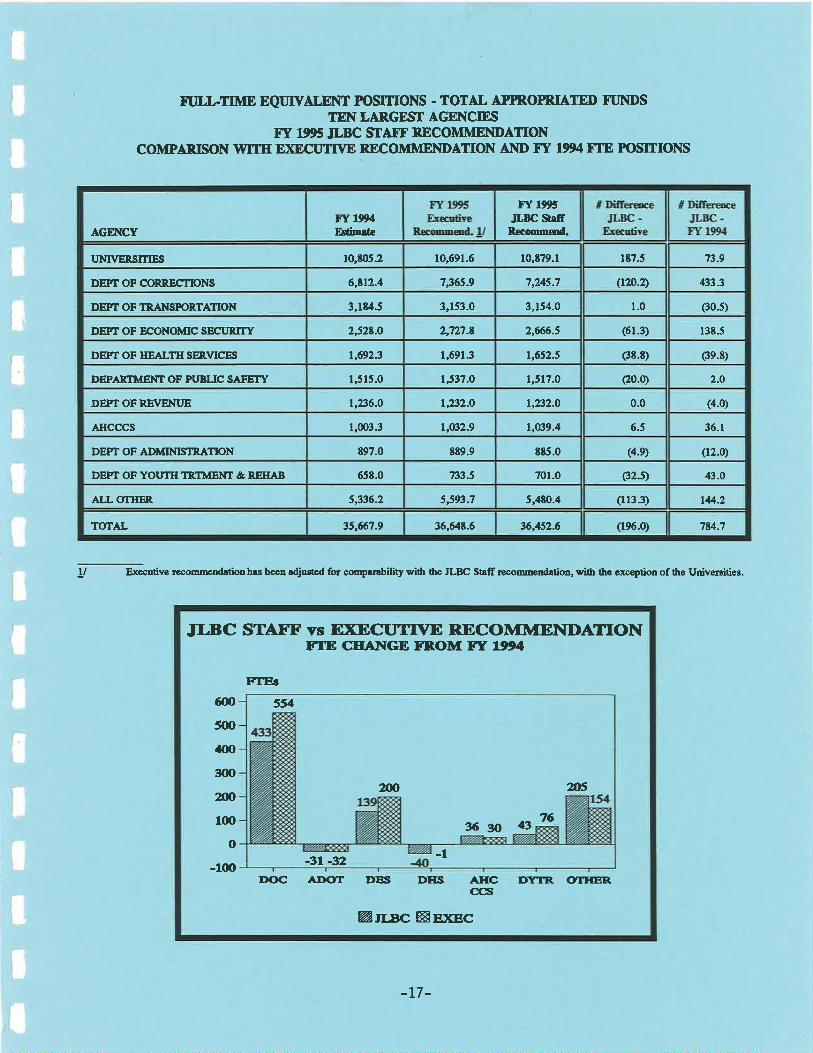
n LLTIME EQITTVAT,ENT FOSTTTONS - ÎOTAL APÌROPRIATED FUNDSTEN LARGEST AGENCIES
r"T 1D5 JLBC STAIT' RECOMMEI{DATIONCOMPARISON WIIH EXECUTIVE RECOMMENDATION AITD T"T 1Ð4 EIE FOSITIONS
!! Executive ¡ecomænd¡tioahas been adju*ed for coryanbility with the ILBC St¡ff ¡ecomærdation, with the cxception of the Univergities.
(12.0)
43.0
tu.2
7t4.7
73.9
433.3
(30.5)
13t.5
(3e.E)
2.O
(4.0)
36.1
1t7.5
(r20.2)
1.0
(61.3)
(38.r)
(20.0)
0.0
6.5
(4.e)
(32.Ð
(113.3)
(196.0)
3,154.0
2,66,6.5
1,652.5
t,5t7.o
r,232.0
l,ct:19.4
EEs.O
70r.0
5,¡180.4
36,452.6
FT 1995
JLBC St¡frRec¡¡nnend.
10,t79.1
7,245.7
10,691.6
7,365.9
3,153.0
2,7n.t
1,691.3
I,537.0
1,232.0
l,ß2.9
tt9.9
733.5
5,593.7
36,ó4E.6
r0,105-2
6,t12.4
3,1t4.5
2,52E.0
t,692.3
1,515.0
1,236.O
1,003.3
t97.0
65t.0
5,336.2
35,67.9
FT1994T..rimqte
AIJ- OTHER
TOTAL
AGENCY
I'NTVER,SITIES
DEPTOF CORRETCTIONS
DEPT OF TR,.ANSPORIATION
DEPT OF ECONOMIC SECTJRITY
DEPT OF HEALTHSER\rICES
DEPARTMENT OF PTJBLIC SAFETY
DEPT OF REìVE¡IT'E
AHCCCS¡
DEPT OF ADMINISTRATION
DETî OF YOUTIITRTMENT &REHAB
JLBC STAI'F vs F.KECUTIVE RECOMMEI{DATIONFTE CEAIYGE FROM ß'T A]X'4
6üt
fx){û}:mm1m
o
-lm -31-32 -1
m5
76
ln
551
36g.g 43
DYTR OTIIIR
FTEs
DOC ADIOT DES DITS
Øtt-sc Bnxsc
AITCccxl
-77 -
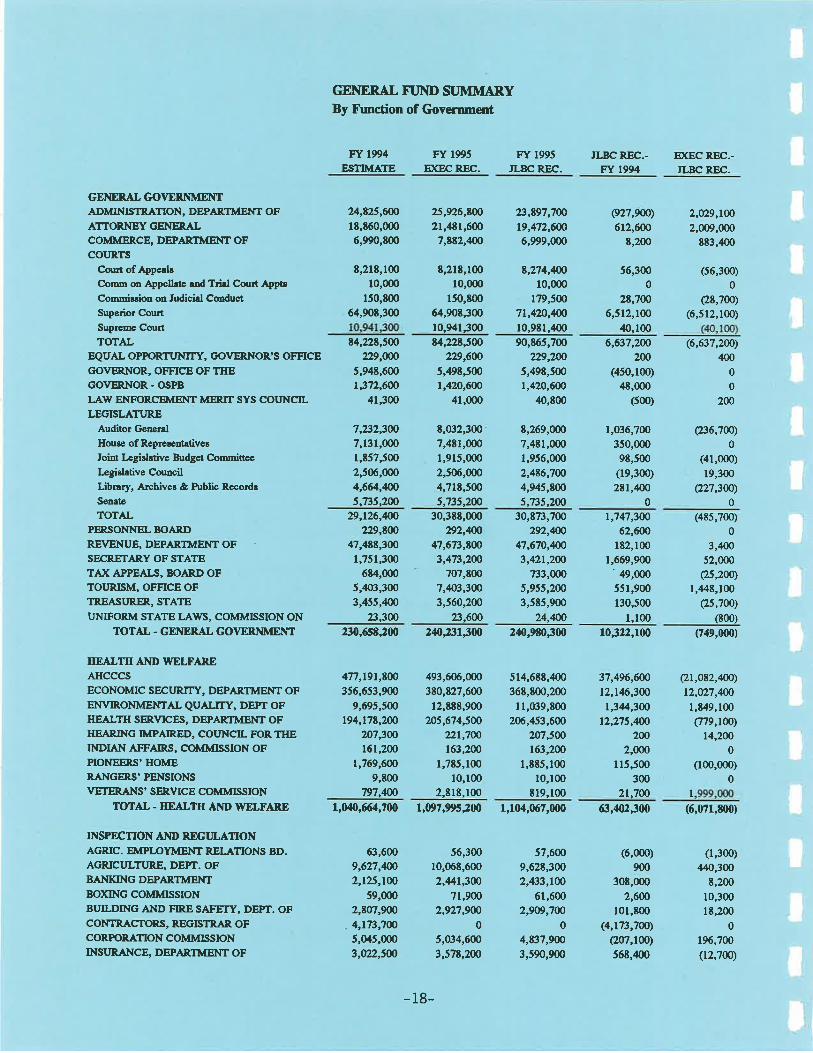
GEI\ERAL FT'ND St]MMAR.YBy Function of Govern¡nent
GENER.AL GOVERNMEIYTADMINIS'TR,.ATION, DEPARTMENT OF
AITORNEY GENER.ALCOMMER,CE, DEPARTMENT OFCOT,IRTS
Corrt of þpeeleComm on þpellaæ üd Trid Court.Appt¡
Commission on ludicial ConductSuperior Court
Supreme Court
TO|TALF,QUAL OPPORTI'NITY, GOVERNOR'S OFFICE
GO\¡ERNOR, OFFICE OF THEGOVERNOR,. OSPB
LAW ENFOR.CEMENT MERIT SYS COUNCILLBGISLATT'R.E,
Auditor Ger¡er¡l
Houee of Representat¡ver
Ioint Legisletive Budget Comminee
Iægislative Cor¡ncilLibrary, Archives & Pr¡blic Rcco¡d¡Sen¡Îe
TOTALPERSONNELBOARI)REVENI E, DEPARTITTENT OFSECRETAR.Y OF STATETAX APPEAI-S, BOARD OFTOIJRISM, OFFICE OFTREASURER., STATE
TJNIFORM STATE LAWS, COMMISSION ONTOTAL . GEI\ER,AL GOVER¡¡MENT
EEALTH AND WELFAREAHCCCSECONOMIC SECTruTY, DEPARTMENT OFE}IVIRONMENTAL QUALITY, DEPT OFHEALTII SERVICES, DEPARTMENT OFHEARING IMPAIR,ED, COT'NCIL FOR THEINDTAN AFFAIR,S, COMMISSION OFPIONEER,S'HOMERANGER,S' PENSIONSVETERá,NS' SERVICE COMMISSION
TOTAL - EEALIH AND WELFARE
INSPDCTION A¡ID RDGT'LATIONAGR,IC. EMPLOYMENT R,ELATIONS BD.AGRICI'LTURE, DETI. OFBANKING DEPARTMENTBOXING COMMISSIONBUILDING AND FIR-E SAFETY, DETT. OFCONTRACTOR,S, REGISTRAR. OFCORPOR,ÄTION COMMISSIONINSTJR,ANCE, DEPARTMENT OF
230,658100 2&23t30i0 2¡10,980¡00 10322,1N (749,000)
FY 1994
ESTIMATE
24,825,6æ
1E,E60,ofi)6,990,t00
t,2lt,l0010,0ü)
150,t0064,90t,300
84,XzE,5æ?29,m
5,94t,6001,372,ffi
41,300
7,232,3æ7,131,0001,t57,5002,506,(n04,664,40A
5,735,2W29,126,ffi
229,tæ47,488,300
1,751,300
6E4,0æ5,,103,300
3,455,4æ23,3û
477,19t,tæ356,653,900
9,695,500t94,t7t,2æ
207,3æt6t,2w
1,769,6æ9,t00
797,ffi
63,6009,627,ffi2,t25,tæ
59,0002,807,900
4,173,7û5,(X5,(no3,V22,5m
FY 1995
Ð(EcREIC.
25,926,tæ2r,,ß1,600
7,8E2,4æ
r,2lE,l0010,(n0
150,t0064,908,3ü)
10,941,300
u,2?ß,5æx¿9,6æ
5,49t,5001,420,6q)
41,m0
r,032,3007,4E1,000
1,915,000
2,506,ooo4,71t,5005,735,2æ
30,3tE,000292,m
47,673,tæ3,473,2æ
707,t007,4t3,3æ3,560,200
23,6û
493,606,000
3E0,E27,600
12,t88,900205,674,5æ
v\r,7út63,2W
1,785,100
10,r002,&E,100
56,30010,06t,6002,4,/.1,3æ
71,9002,927,96
05,034,600
3,57t,2n
FY 1995
JLBC R,EE. 'LBC R.EC.-
Fr 1994
Þ(ECREC.-
'LBC R,EC.
2,029,rû2,009,000
883,¿t00
(56,300)
0(2E,700)
(6,512,100)
(236,7û)0
(4l,oo0)
19,300
Q27,3æ)0
(485,700)
0
3"100
52,000(25,200)
1,,148,100
(25,700)
(800)
Qt,082,ffi)t2,027,mI,t49,100o79,100)
14,2æ0
000,000)0
23,t97,7û19,o2,6æ6,999,000
E,274,M10,000
t79,5æ7r,4¿o,ffil0,9tl,,lO090,t65,700
229,2æ5,49t,5001,420,600
.t0,800
8,269,ffn7,4E1,000
1,956,000
2,4t6,7æ4,945,8005,735,2æ
30,873,7N292,m
47,670,m3,421,2æ
æ3,æ05,955,2003,585,900
24,M
57,6009,62t,3002,433,ræ
61,6002,909,7æ
04,E37,9æ
3,590,900
(927,900)
612,600t,200
56,3000
2E,7æ6,512,100
¡l(),100
6,637,2æ2æ
(450,Im)48,000
(500)
1,036,700
350,0009t,500
(19,300)
2t1,ffi0
(6,637,2æ),+00
0
0
2æ
1,747,3æ62,6æ
It2,l001,669,900'49,0fi)
551,900130,500
I,100
514,688,,100
36E,E00,200
ll,æ9,8002ú,453,6æ
207Jû163,2û
I,tt5,l0010,100
El9,l001,104,067,000
37,496,6æ12,14ó,3æ
1,34/.,3æD,ní,ffi
2æ2,m
I 15,500
300
1,1x0,664,700 1,097,91t5200
21,7û I63,,102¡00 (6,071,t00)
(6,m0)900
308,000
2,6æ10t,800
(4,173,7W)(207,100)
568,,100
o,300)ffi,3æ
t,20010,300
18,200
0
t96,7W(t2,70o)
-18-

GEI{ERAL TT]ITD ST]MMARYBy Function of Govemmmt
LIQUOR LICENSES AND CONTR,OL, DEPT.
MINEINSPECTOR,OSIIA REVIE\V BOARI)RACING, DEPARTMENT OF
R.ÀDIAITON REGT'LATORY AGENCYREAL ESTATE DEPARTMENTWEIGIITS AND MEAST'RES, DEPT. OF
ÎOTAL. INSPPCTION & REGT'LATION
EDUCATIONARTS, COMMISSION ON THECOMMUNITY COLLEGESDEAF AND THE BLIND, SCHOOL FOR, lHEEDUC.ATION, DEPARTMENT OFHISTOR,ICAL SOCIETY, AR,V,ONA
HISTOR,ICAL SOCIETY, PR,ESCOTT
MEDrcAL STT'DENT I¡ANS BOARI)UNTVER,SITIES
A¡izon¡ Stete University - MainArizon¡ Stale University - WertNorthern Arizo¡e UnivenityBoard ofRegentsUnivenity of Arizo¡¡ - M¡inUniversity of A¡izon¡ - Heålth Science CenþrTOTAL
TOTAL - EDUCATION
PROTECTION A¡¡D SAXETYCORRECTIONS, DEPARTMENT OFCRJMINAL ruSTICE COMMISSrcN, ARIZONAEMR.G. &MILITARY AFFAIR,S, DEPT. OF
E (ECUTWE CLEMENCY, BOARD OF
PUBLIC SAFETY, DEPARTMENT OF
YOUTII TREATMEI.IT REHAB., DEPT OF
TOTAL - PR,OTDCTION AND SATETY
1RANSPORTATIONTR,ANSPORTATION, DEPARTMENT OF
NATTJR.AL RESOTJRCES
ENVIRONMENT, COMMISSION ON THE AZGEOI.OGICAL ST'RVEY, ARIZONALANDDEPARTMENTMINES & MINERAL R,ESOURCES, DEPT.OF
PARKS BOARDIVATER, RESOUR.CES, DEPARTMENT OF
ToTAL . NATT'RAL RESOURCES
372tt3ü 34,7(F,800 33,796,000 (3,416,300) 909,800
FY 1994
ESTIMATE
r,900,300541,500
9,(X)0
2,441,1æ969,ü)0
2,547,4æ1.879.t00
1,25t,90086,727,|W15,263,7û
t,44,175,2*3,282,2N
543,7æ
1,0(x)
1E4,324,E00
29,6û2,8W75,531,2æ7,155,400
19t,96t,00044,738,2æ
5.00-320.,000
283,298,2æ1,000,000
4,354,MI,890,600
34,t4t,2æ31.147.900
t9,900613,2û
9,0t3,800607,600
4,642,5ûr r,662,500
26,6Ð,500
FY 1995
Þ(ECREC.
2,052,7æ7U9,4gg
9,0002,475,7æ
97t,9002,t56,(þol.¿145.300
l,¿1t0,200
94,533,00015,633,600
1,591,966,2003,563,r00
55l,l0o105,700
191,991,100
29,74E,Wn,5ot,5æ7,924,tû
2O7,725,6æ43,575,9æ
558.474.100
334,698,,100
1,591,300
4,454,6æ1,724,8æ
36,159,00035.398.700
104,900
610,600
10,049,800
612,0006,1 12,100
I 1,629.100
FY 1995
JLBC REC.
1,976,300575,300
9,0002,¡16t,t00
991,8002,t59,7æ1.396.000
1E6,770,E00
29,t22,2ú75,906,E00
7,417,7æ2Ot,79t,3û45,498,t00
547.207.6n
324,787,5ûl,00(),000
4,461,500
r,7t7,9æ34,894,m033.6t2.2æ
t4,1006r0,700
9,E61,700
650,6004,835,¡100
I I,658.700
IIJC REC..FY 1994
Ð(EC R.EC.-
ILBC RF!.
2,09L,572200 226ú.307,M 22û,L49,7W 14t"577500 26,t573M
1,272,2æ
90,578,50016,189,800
1,5E0,63t,æ03,595,7æ
552,9æ
I 14,600
13,300
3't5l'¡lO0926,100
t36,46.3,2æ313,500
9,2æt 13,600
2,Æ,m219,49¡375,600
262,3û2,E23,3æ
760,6006-t87-200
41,4E9,300
0
107,100
(t72,7æ)745,t00
2.464.3æ
76,m033,E00
027,7æ22,8æ
312,3û1483.800)
(5,E00)
(2,500)
7779æ43,000
192,9æ
€,t00)
76,m134,100
06,900
(12,900)
(3,700)
49-3æ
208,0003,954,500
(s56,200)
11,327,800(32,600)
(1,800)
(E,900)
5,220,3æ
03,300)1,601,700
506,46p5,934,300
(1,9T¿,90O)
l 1 -266-500
9,910,900591,300
(6,90o)
6,9001,265,000
1.7t6.500
20,t00
o00)l8t,l00(38,600)
1,276,7æ(29.600)
355,t39,300 414,02ó,t00 400,473,100 44,ó33,800 ti1553,700
69,600 70,2æ 73,800 4,26 €,6m)
29,11t500 27,7012m, 1,001,700
26/,s2s300
L,4L73M
35Jß.700OPERATING BTJDGET TOTAL' 3,7&¿,715,t00 4,0&¿,454,800 4,047241,1N
. FY 1994 doe¡ not i¡rclude or¡e-time approprietions of tl.8 million for lrrigation Dietrict Relief, $3.5 million for Flood Relief ¡nd $97,400 foru¡¡lloc¡æd riek management charges.
- 19-
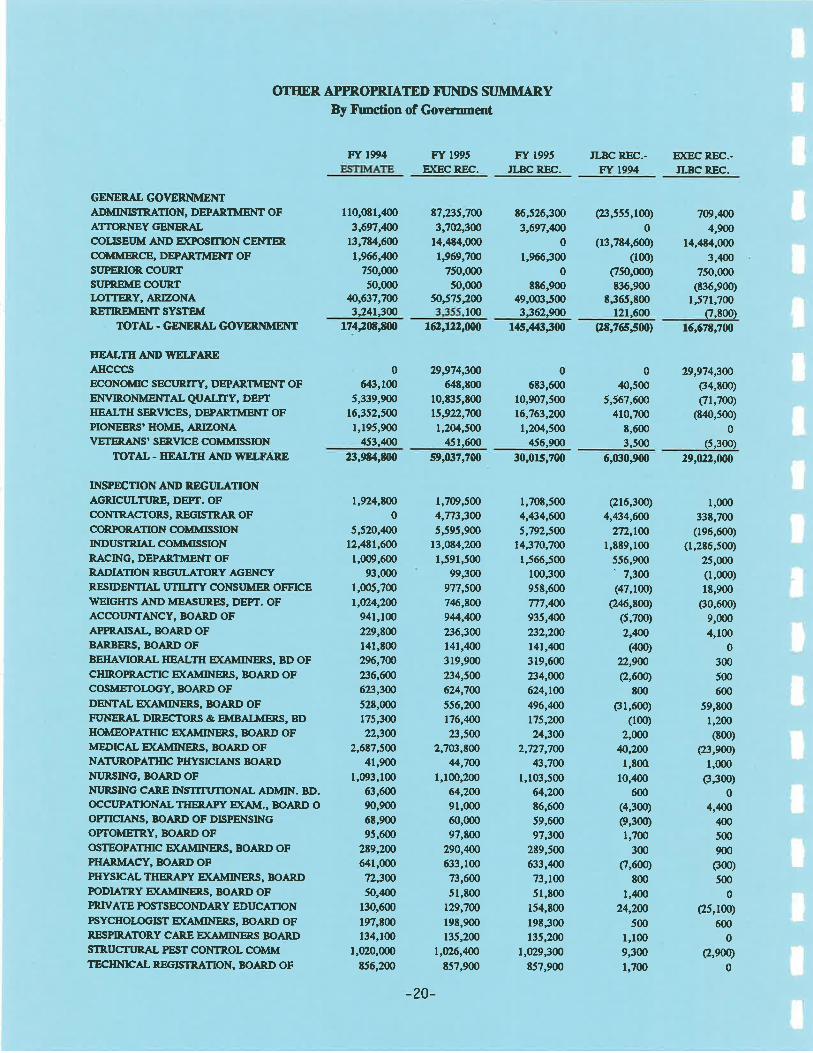
OTHER APPROPRIATED N'NDS SI]MMARYBy trbnction of Gover¡mmt
FY 1994
GENERAL GOVERNMENTADMINISTRAIION, DEPARTMENT OFÂTTORNBY GENER,ALCOIISET'M AND Ð(POSITTON CENTERCOMMERCE, DEPARTMENT OFST'PER,IOR. COT'RÎST'PREME COT'RÎIJOITERY, ARUONARETIREMENT SYSTEM
TOTAL - GENERAL GOVERNMENT
EEAL'TH AND WEI,I'AREAHCCCSBCONOMIC SEg[ruTr, DEPARTMB{T OFENVIRONMENTAL QUALITY, DEPTHE.rr*TII SERVICES, DEPARTMENT OFPIONEER,S' HOME, AR¡ZONAVETER,ANS' SERVICE COMMISSION
IIOTAL - EEAL'TE AIïD WELFARE
INSPDCTION AND RDGT'IÁTIONAGRICTJLTT'RE, DEPT. OFCoNTRå,CTORS, REGiISTRAR OFCORPoRa-TION COMMIS.SIONINDT'STR,IAL COMMISSIONR.ACING, DEPARTMENT OFR.ADIATION R,EIGT'LATORY AGENCYRESIDENTÍAL UTILITY CONSUMER, OFFICEITEIGIITS AND MEASI,'RES, DEPT. OFACCOI'NTANCY, BOARD OFAPPR,AISAL, BOARDOFBAR,BER,S, BOARD OFBEHAVIOR.AL HEALTH Þ(AMINER,S, BD OFCHIROPRACTIC ÐßMINERI¡, BOAR.D OFCOSMETOI¡GY, BOARD OF
DENTAL ÐüMINERI¡, BOARD OFFT'NER,AL DIRECTORI¡ &. EMBALMER.S, BDHOMEOPATIIIC Ð(AI{INERS, BOAR,D OFMEDICAL EGù,ÍINERS, BOARD OFNATT'ROPATIIIC PIÍYSICIANS BOARDNI'RSING, BOARD OFNURSING CARE INSTITUTIONAL ADMIN. BD.OCCT'PATIONAL THER,APY ÐúII,f ., BOARD O
OPTICIANS, BOARD OF DISPENSINGOPTOMETR.Y, BOARD OFOSTEOPATIIIC ÞQ{IvÍINER¡¡, BOARD OFPHARMACY, BOARDOFPHYSICAL THERÂPY E (ÂMINER,S, BOAR.T)
PODIATRY Ð(AI\IÍINER.S¡, BOARD OFPRIVATE POSTSECONDARY EDUCATIONPSYCHOT¡GIST ÞCAMINERS¡, BOARD OFRESPIRATORY CAN,E ÞilT{INERS BOAR.DSTRUCTT'R,ÂL PEST CONIROL COMMTECHNIC.AL REGISTR.ATION, BO^ARD OF
cr,800)174,20t,t00 162,t22,ùN 1¡f5,443r00 (28,765500) 16,67t,700
110,081,400
3,697,ûA13,7t4,6(n1,966,400
750,(n050,ü)0
fi,637,7æ3,24t3æ
0643,Ifl)
5,339,9ü)16,352,500
1,195,900453,M
FY 1995
E (ECREC.
17,235,7û3,792,3æ
14,4t4,000
1,969,700750,m050,000
50,575,2æ100
29,974,3æ64t,too
10,t35,800ls,9?2,7ú1,204,500
451,600
Fr 1995
TLBC REC. 'LBC REC.-
FY 1994
(23,555,100)
0(13,7E4,600)
(100)
050,m0)t36,9oo
E,365,too121,600
040,500
5,567,600410,700
8,6003,500
Ð(ECREC.-ILBC REC.
t6,526,3û3,697,&A
0
1,966,300
0886,900
49,0üt,5003,362,9û
06t3,600
10,907,500
16,763,2W
l,2o4,5oo456,9æ
7@,49p4,900
14,4t4,000
3,400
750,000(836,900)
1,571,7æ
29,974,3æ(34,E00)
Qt,7AO)(8¡10,500)
0(5,300)
23,984,800 59,1N17,700 30,015,700 6,030,900 29,022,M
r,924,E00
0
5,520,49612,,1t1,600
1,009,60093,0ü)
1,005,700
1,0',4,2æ941,100
x¿9,Eæ14t,t00296,7û236,6æ623,3æ
528,000175,3æ
x¿,3æ2,6t7,5æ
41,900
1,093,r0063,60090,900
6t,90095,600
2E9,2æ641,000
72,3æ50,,l{)0
ß0,6(n197,E00
t34,tæI,Cr20,000
E56,200
1,709,5004,T13,3æ5,595,900
13,084,200
1,591,500
99,3ü)gn,5æ7Æ,8æ9&,499236,3æ141,4¡g319,900
234,5æ624,7æ
556,2ût76,M23,5ú
2,703,Eæu,7æ
1,100,2m64,2æ91,(n060,00097,Eoo
290,M633,100
73,6æ51,t00
t29,7æ19t,900t35,2ú
1,t26,ßot57,900
1,70E,500
4,434,6n5,792,5æ
14,370,7ú1,566,500
100,300
95E,6(n
777,499935,4¡p232,2æ141,,t00
319,600
234,W624,1û496,ffin5,2n24,3æ
2,727,7æ43,7æ
1,103,50064,2æt6,60059,60097,300
2E9,5(n633,400
73,100
51,t00154,800
198,300
t35,2æI,V29,3û
t57,9q)
(216,300)
4,434,6æ272,1æ
1,889,100
556,900' 7,300(47,100)
(2,16,t00)(5,700)
2r40o(400)
x¿,9û(2,6m)
8ü)
c31,600)
000)2,W
&,2æl,too
10,469
600(4,300)
(9,300)
1,700
3mct,600)
EMl"m0
24,2æ500
I,1009,300
t,7û
1,000
33E,700
(leó,600)(1,286,500)
25,000(1,000)
1E,900
(30,600)
9,000
4,1000
300
500
600
59,E00
1,200
(E00)
(23,900)
l,(xlo(3,300)
04,4(X)
,100
500
900(300)
500
0(25,100)
600
(2,900)0
0
-20-
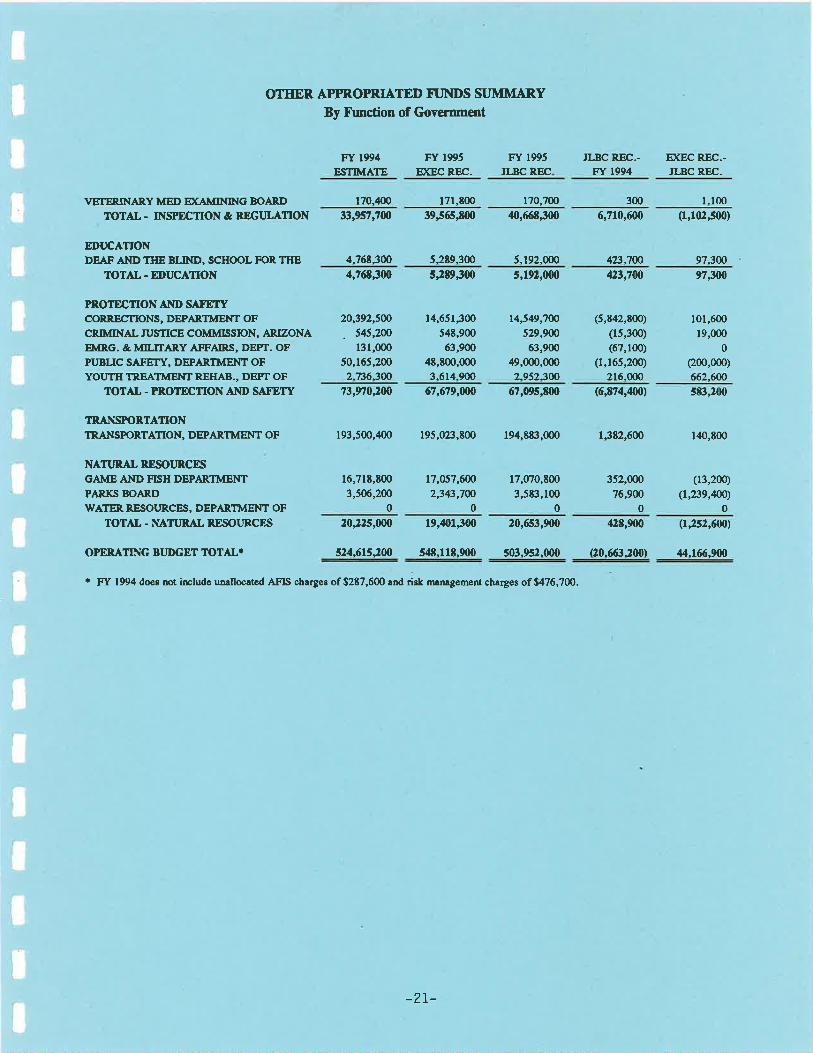
O|IEER APR,OPRIATED FT]NDS ST]MMARYBy Function of Government
VETERINARY MED E (AMINING BOARD
TOTAL - INSPDCTION & RÞGI'LATION
EDUCATIONDEAF AND THE BLIND, SCHOOL FOR. THE
TOTAL. EI'UCATTON
PROTE]CTIONAND SÁ¡ETYCORRECTIONS, DEPARTMENT OF
CRIMINAL ruSTICE COMMISSION, ARTZONA
EMRG. &MILITAR.Y AFFAIRS, DEPT. OF
PUBLIC SAFETY, DEPARTMENT OF
YOUTII TRJgATMENT REIIAB., DET'I OF
TOTÄL - PROTPCTION AND SÄTDTY
TRÂNSPOR,TATION
TR,ANSFORTATION, DEPARTMENT OF
NATTJRÄL RESOIJRCESGAIUE AND FISH DEPARTMENTPARKS BOARDWATER RESOURCES, DEPARTMENT OF
TOTAL . NATTJRAL RDSOURCES
OPERATING BT]DGET TOTÂL'
t70,,100 17r,800 r70,700 l-100
33,957,700 39565,t00 40,668J00 6,710,600 (1,102500)
4.768.300 5.2t9.300 5.192.000 423.7û 9?.300
4,768¡00 5¡t9t00 5,192,000 423,7W 9730/0
FY 1994
ESTIMATE
20,392,5æ
. 545,2û131,000
50,1ó5,2(n2-736.300
16,71E,E00
3,5ú,2û0
20125,000
524.615J00
FY 1995
Ð(EC REC.
14,651,300
54t,90063,900
4E,E00,000
3.6r4.900
17,057,6æ
2,343,7æ0
19'¡101¡00
5¡t8.118.900
FY 1995
ILBC REC
14,549,7@
529,W63,9ü)
49,000,0(n2.952-3æ
17,070,E00
3,5t3,1000
20,653,900
s03.952.m0
JLBC REC.-Fr 1994
Þ(ECREC.-JLBC REC.
300
ß,n0200 67,679,W0 ó7,095,800 (6,874,4¡6¡ s&rroo
193,500,400 195,ø¿:,,E00 194,883,000 1,382,ó00 1,00,E00
(5,E42,800)
(15,300)(67,100)
(1,165,200)
2r6.m0
352,W76,900
0
42t,900
120.663J00)
l0l,60019,000
0
(200,0m)
662,600
(13,200)
(t,B9,m)0
(12s2,fi01
,14.166.900
' FY 1994 does not includc un¡lloc¡æd AFIS charges of$2t7,600 ¡nd risk nr¿nrgement charges of$476,700.
-2L-
ECONOMIC AI,ID REWNAE FORECAST
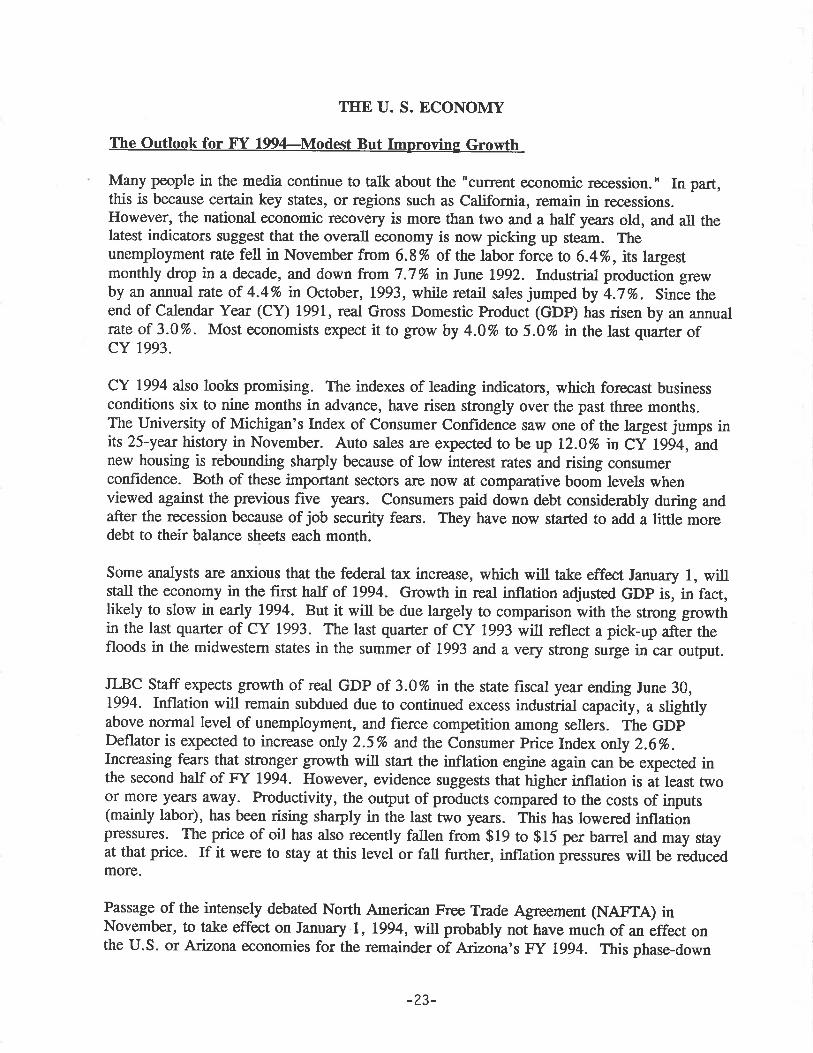
THE U. S. ECONOMY
The Outlook for FY 1994-Modest But Improving Growth
Many people in the media continue to talk about the "current economic recession. " In part,this is because certain key states, or regions such as California, remain in recessions.However, the national economic recovery is more than two and a half years old, and all thelatest indicators suggest that the overall economy is now picking up steam. Theunemployment rate fell in November from 6.8 7o of the labor force to 6.4Vo , its largestmonthly drop in a decade, and down from 7.7% in June 1992. Industrial production grewby an annual rate of 4.4% tn October, 1993, while retail sales jumped by 4.7%. Since theend of Calendar Year (CY) I99I, real Gross Domestic Product (GDP) has risen by an annualrate of 3.0%. Most economists expect it to grow by 4.0% to 5.0% in the last quafer ofcY 1993.
CY 1994 also lools promising. The indexes of leading indicators, which forecast businessconditions six to nine months in advance, have risen strongly over the past three months.The Universtty of Michigan's Index of Consumer Confidence saw one of the largest jumps inits 25-year history in November. Auto sales are expected to be up 12.0% in CY 1994, andnew housing is rebounding sharply because of low interest rates and rising consumerconfidence. Both of these important sectors are now at comparative boom levels whenviewed against the previous five years. Consumers paid down debt considerably during andafter the recession because of job security fea¡s. They have now started to add a little moredebt to their balance sheets each month.
Some analysts a¡e anxious that the federal tax increase, which will take effect January l, willstall the economy in the first half of 1994. Growth in real inflation adjusted GDP is, in fact,likely to slow in early 1994. But it will be due largely to comparison with the strong growthin the last quarter of CY 1993. The last quarter of CY 1993 will reflect a pick-up after thefloods in the midwestern states in the summer of 1993 and a very strong surge in car ouþut.
JLBC Staff expects growth of real GDP of 3.0% n the state fiscal year ending June 30,1994. Inflation will remain subdued due to continued excess industrial capacity, a slightlyabove normal level of unemployment, and fierce competition among sellers. The GDpDeflator is expected to increase only 25% and the Consumer Price Index only 2.6%.Increasing fears that stronger growth will staf the inflation engine again can be expected inthe second half of FY 1994. However, evidence suggests that higher inflation is at least twoor more years away. Productivity, the ouþut of products compared to the costs of inputs(mainly labor), has been rising sharply in the last two years. This has lowered inflatiõnpressures. The price of oil has also recently fallen from $19 to $15 per barrel and may stayat that price. If it were to stay at this level or fall further, inflation pressures will be reducedmore.
Passage of the intensely debated North American Free Trade Agreement (NAFTA) inNovember, to take effect on January -1, 1994, will probably not have much of an effect onthe U.S. or Arizona economies for the remainder of Arizona's FY lgg4. This phase-down
-23-
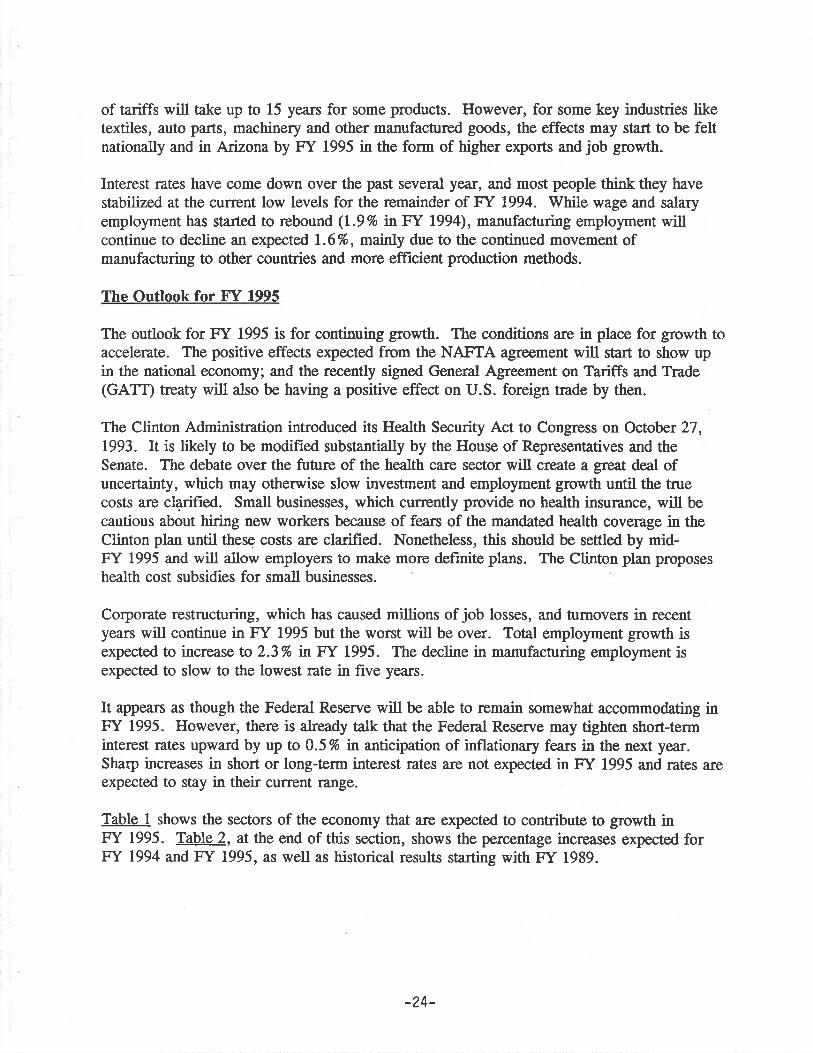
of tariffs will take up to 15 years for sorne products. However, for some key indushies liketextiles, auto parts, machinery and other manufactured goods, the effects may staf to be feltnationally and in Arizona by FY 1995 in the form of higher exports and job growth.
Interest rates have come down over the past several yean, and most people think they havestabilized at the current low levels for the remainder of FY 1994. While wage and salaryemployment has started to rebound (L.9% in F"f 1994), manufacturing employment willcontinue to decline an expected I.6%, mainly due to the continued movement ofmanufacturing to other countries and more efFrcient production methods.
The Outlook for F"f 1995
The outlook for FY 1995 is for continuing growth. The conditions a¡e in place for growth toaccelerate. The positive effects expected from the NAFTA agreement will start to show upin the national economy; and the recently signed General Agreement on Tariffs and Trade(GAT Ð ffeaty will also be having a positive effect on U.S. foreign trade by then.
The Clinton Administration introduced its Health Security Act to Congress on October 27,1993. It is likely to be modified substantially by the House of Rqlresentatives and theSenate. The debate over the future of the health care sectoÍ will create a great deal ofuncertainty, which may otherwise slow investment and employment growth until the truecosts are cl4rified. Small businesses, which currently provide no health insurance, will becautious about hiring new workers because of fea¡s of the mandated health coverage in theClinton plan until these costs are clarifred. Nonetheless, this should be settled by mid-FY 1995 and will allow employers to make more definite plans. The Clinton plan proposeshealth cost subsidies for small businesses.
Corporate restructuring, which has caused millions of job losses, and turnovers in recentyears will continue in FY 1995 but the worst will be over. Total employment growth isexpected to increase to 2.3% lrl.FY 1995. The decline in manufacturing employment isexpected to slow to the lowest rate in five years.
It appears as though the Federal Reserve will be able to remain somewhat accommodating inFY 1995. However, there is already talk that the Federal Reserve may tighten short-terminterest rates upward by up to 0.5 % n anttcipation of inflationary fears in the next year.Sha¡p increases in short or long-term interest rates are not expected in FY 1995 and rates areexpected to stay in their current range.
Table I shows the sectors of the economy that are expected to contribute to growth inFY 1995. Table2, atthe end of this section, shows thepercentage increases expected forFY 1994 and FY 1995, as well as historical results starting with FY 1989.
-24-
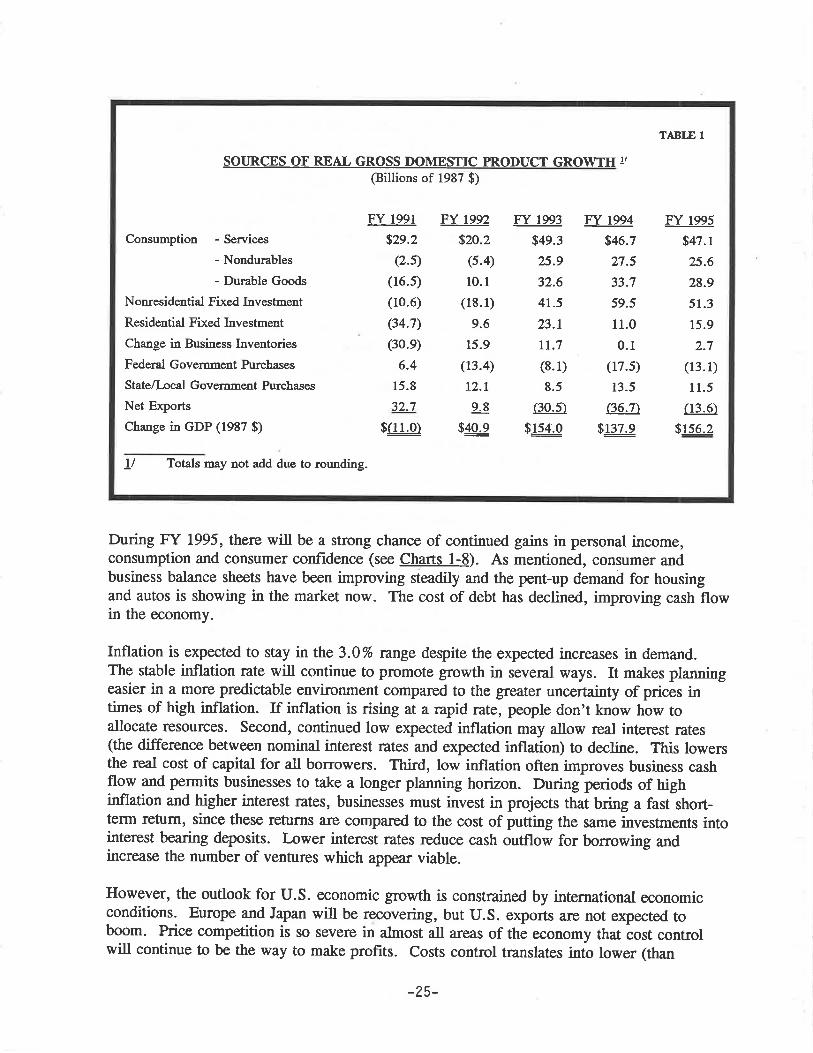
SOURCES OF REAL GROSS DOMESTIC PRODUCT GROWTH !/
@illions of 1987 $)
Consumption - Services
- Nondurables
- Durable Goods
Non¡esidential Fixed Investment
Residential Fixed Investment
Change in Business Inventories
Federal Governnent Purchases
State/I-ocal Government Purchases
Net Exports
Change in cDP (1987 $)
FY 1991
$2e.2
(2.s)
(r6.s)
(10.6)
(34.7)
(30.e)
6.4
15.8
32.7
$ruJ)
FY t992
$20.2
(s.4)
10.1
(18.1)
9.6
15.9
(13.4)
12.t
9.8
$40.9
FY 1993
$49.3
25.9
32.6
41.5
23.1
IT.7
(8.1)
8.5
(30.5)
$!s,1.0
Fr 1994
$46.7
2:7.5
33.7
59.5
11.0
0.1
(17.s)
13.5
ß6-7\
$13æ
FY 1995
$47.1
25.6
28.9
51.3
15.9
2-7
(13.1)
11.5
(13.6)
$156.2
TABLE 1
L/ Totals may not add due to rounding.
During FY 1995, there will be a strong chance of continued gains in personal income,consumption and consumer confidence (see Charts l-8). As mentioned, consumer andbusiness balance sheets have been improving steadily and the pent-up demand for housingand autos is showing in the market now- The cost of debt has declined, improving cash flowin the economy.
Inflation is expected to stay in the 3.0% range deqpite the expected increases in demand.The stable inflation rate will continue to promote growth in several ways. It makes planningeasier in a more predictable environment compared to the greater uncefainty of prices intimes of high inflation. If inflation is rising at a rapid rate, people don't know how toallocate lesources. Second, continued low expected inflation may allow real interest rates(the difference between nominal interest rates and expected inflation) to decline. This lowersthe real cost of capital for all borrowers. Third, low inflation often improves business cashflow and permits businesses to take a longer ptanning horizon. During periods of highinflation and higher interest rates, businesses must invest in projects that bring a fast short-term return, since these returns are compared to the cost of putting the same investments intointerest bearing deposits. Lower interest rates reduce cash outflow for borrowing andincrease the number of ventures which appear viable.
However, the outlook for U.S. economic growth is constrained by international economicconditions. Europe and Japan will be recovering, but U.S. exports are not expected toboom. Price competition is so severe in almost all areas of the economy that cost controlwill continue to be the way to make prohts. Costs control translates into lower (than
-25-
otherwise) business spending. Table 1 shows that the expansion is expected to be consumerled. Quarterþ growth rates between 2.5% and 3.0% appear more likely during FY 1995.
An overall growth rate of 3.0% is predicted for the year.
Commercial banlc will start to add to loans in FY L995, but at a slow rate. Deqpiteencouragement by the Federal Reserve Board, bank credit has barely grown for severalyears. Banks have taken advantage of lower interest rates to earn a large qpread between thecost of thei¡ funds and rates available on investments in U.S. Treasury and mortgage bonds.The improved economy may increase business loan demand.
It will also remain to be seen whether employment will continue to increase sharply.Incomes will improve in the economy though. Manufacturing employment, typically one ofthe highest paying sectors, is expected to slow its decline in FY 1995. Most large U.S.corporations Ívill continue to reduce middle management though. It is often diffrcult forthese employees, now numbering in the millions, to f,rnd comparable jobs. Many workersare now at smaller frrms earning lower salaries.
Overall, FY 1995 should see a steady rate of growth in a low inflation environment, whichshould set the foundation for continued expansion. However, at the time of this writing, ifthe trends of the last few months of calendar 1993 continue, the "alternative scenario" favorseven faster improvement for the U.S. economy.
Risks.to the Forecast
Positive AlternativeStroneer Growth Than Anticipated
I-ooking at FY 1995, the higher growth alternative would depend on a continued strongrebound in hiring caused by continued increases in housing and a sooner than anticipatedturnaround in Europe and Japan, which would help U.S. exporters. There could be a sharpreduction in unemployment as employers see that the recovery is stronger than anticipated.Fixed business investments would be higher than anticipated and manufacturing would alsorebound.
The Clinton Administration loses credibility in some way, which cannot be foreseen at this ,
time, such as a foreign crisis or the debate on the health care program becomes toopolitically divisive and time consuming for politicians and business alike. This is more thana remote possibility and could reduce confidence. Inventory restocking and business fixedinvestment would not increase as expected because of lower sales forecasts.
-26-
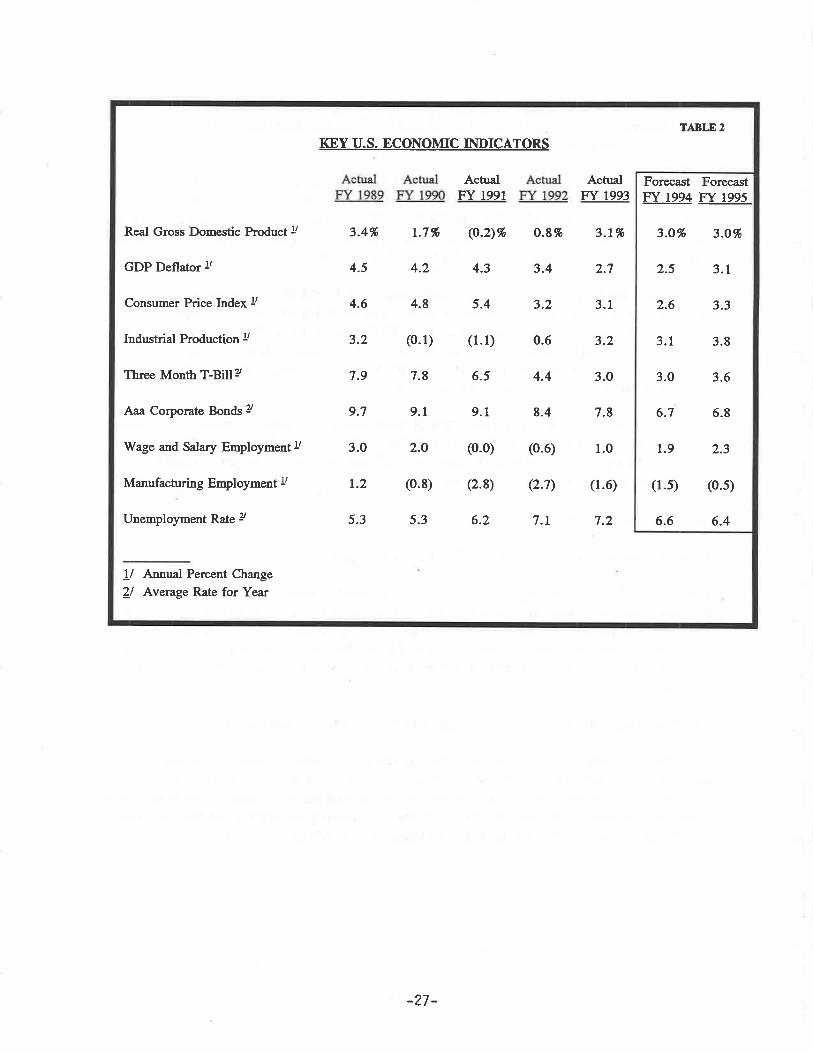
Fo¡ecast ForecastFY 1994 FY 1995
3.1 3.8
3.0 3.6
6.7 6.8
1.9 2.3
(r.5) (0.5)
6.6 6.4
3.3
3.1
3.0963.O%
2.5
2.6
TABLE 2
KEY U.S. ECONOMIC INDICATORS
ActualFY 1991
ActualFY 1993
Real Gross Domestic Product !/ 3.4%
4.5
4.6
3.2
7.9
9.7
1.7% (o.2)% o.8% 3.t%
GDP Deflator ! 4.2 4.3 3.4 2.7
Consumer Price Index ! 4.8 5.4 3.2 3.1
Industrial Production ! (0.1) (1.1) 0.6 3.2
Th¡ee Month T-Bill? 7.8 6.5 4.4 3.0
Aaa Corporate Bonds ? 9.1 9.1 8.4 7.8
V/age and Salary Employment JJ Z.O 2.o (0.0) (0.6) 1.0
Manufacturing Employment ! 1.2 (0.8) (2.8) Q.7) (1.6)
Unemployment Rate -z 5.3 5.3 6.2 7.1 7.2
l/ Annual Percent Change
ll Average Rate for Year
-27 -
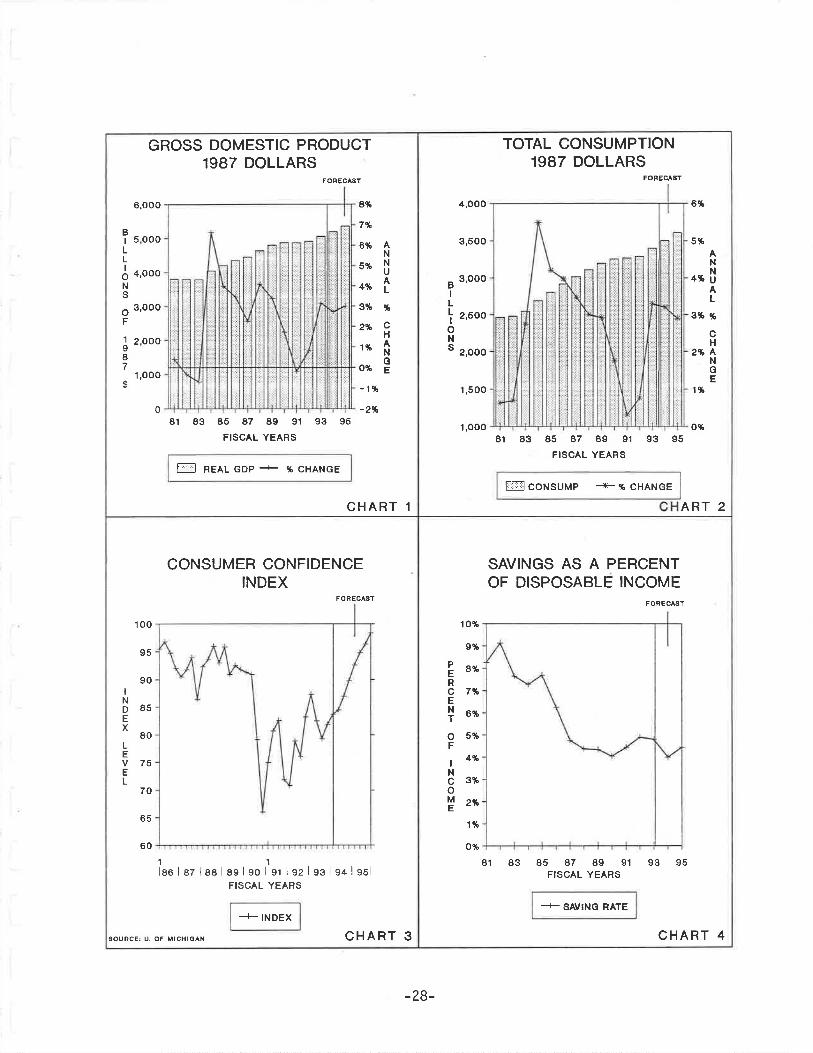
TOTAL CONSUMPTION1987 DOLLARS
4,OOO 6%
3,500 5%ANN
4%uAL
3,OOOBILLIoNS
2,5 oo 3%
2%
%
cHANGE
2,OOO
1,500 1 %
1,ooo o*81 83 85 87 89 91 93 95
FISCAL YEARS
ART 2l"r-ìllç6¡g¡yp +% CHANGE
SAVINGS AS A PERCENTOF DISPOSABLE INCOME
PERcENT
oF
INcoME
10%
9%
8%
7%
6%
5%
4%
3%
2%
1%
o%
85 87 89 91
FISCAL YEARS93 95
+ SAVING RATE
81 83
CHART 4
GROSS DOMESTIC PRODUCT1987 DOLLARS
6,OOO 8%
7%
6%
5%
4%
3*
2%
1*
o%
-1%
-2%
BI
LLI
oNs
oF
5 oooANNUAL
%
cHANGE
4,O
3,0
oo
oo
12II7
ooo
1,OOOa
o81 83 85 A7 89 91 93 95
FISCAL YEARS
F-:ì Re¡lcDP+ %çHANGE
CHART 1
CONSUMER CONFIDENCEINDEX
FORECASI
INDEX
LEvEL
100
95
90
85
80
75
70
65
60
11lao I az I aa I as I go I sr I sz I sg I g¿ I ssl
FISCAL YEARS
+ INDEX
CHART 3SOURCE: U. OF l,llCHloAN
-28-
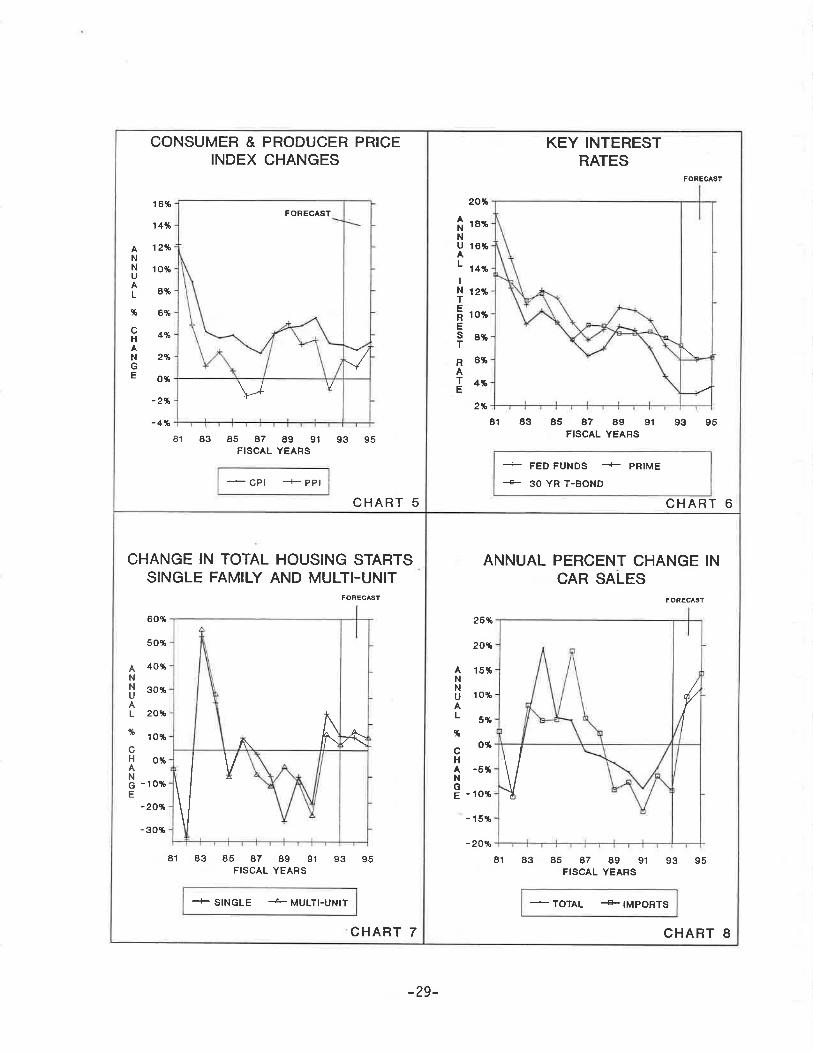
CHANGE IN TOTAL HOUSING STARTSSINGLE FAMILY AND MULTI-UNIT
ANNUAL
%
cHANGE
60%
50%
40%
30%
20%
10%
0%
- 10%
-20jf
-30%
85 A7 89 91FISCAL YEARS
93 95
-I_ SINGLE --å- MULTI-UNIT
CHART 7
VA. AZ\
81 83
VY
FORECAST
1
CONSUMER & PRODUCER PRICEINDEX CHANGES
ANNUAL
%
cHANGE
16%
14%
12%
10%
8%
6%
4%
2%
o%
-2%
-4%
81 83 85 A7 89 91FISCAL YEARS
93 95
- cPt --r- PPt
CHART 5
ANNUAL PERCENT CHANGE INCAR SALES
ANNUAL
%
cHANoE
25%
20%
15%
10s
5%
o*
-5%
- 10%
- 15%
-20%
85 87 89 91FISCAL YEARS
93 95
_ TOTAL : IMPORTS
V
(
81 83
CHART 8
KEY INTERESTRATES
FORECAST
ANNUAL
INTEREsT
RATE
20*
18%
16S
14*
12*
10%
8S
6%
4eh
2%
81 A3 85 A7 89 91
FISCAL YEARS93 95
-{-+
FED FUNDS T_ PRIME
30 YR T-BOND
CHART 6
-29-

TFTF' ARIZONA ECONOÙÍY
The Arizona economic outlook for FY 1994 and FY 1995 has brightened considerably. LastJanuary, we aptly described the economy as suffering from a "creeping rccovery." But sincethen, the economy has exceeded the expectations of most state forecasters on the ArizonaBlue Chip Panel. Now, the economy seems poised for accelerating growth during ourforecast period.
Vital Statistics From Ff ú93
FY 1993 key Arizona economic indicators show the economy is gathering momentum andreversing two negative trends that started in the eighties (see Table 5):
. Job growth rose 2.7%. This is the highest wage & salary employment increase in fiveyears and a nice rebound from the ne,al zelo growth in FY 1992. Moreover, the goodsproducing sector, driven by a7.4% growth in constnrction, gained L.4%-the first gainsince FY 1986, weathering six consecutive years of job losses (see Table 3).
. Personal income in current dollars grew a strong 7.5% and4.7% in real or inflationadjusted dollars. This reverses a trend of declining income growth since FY 1984 (see
Chart l1). But, the exciting story is the real per capita income growth of 2.3%-the firstpositive outcome in five years (see Chart l2).
. Population grew at2.4%, the same rate as in FY 1992. This was 91,500 newArizonans. Although slower than its average 3% anntnl growth of the 1980s, Arizona isstill far above the L.0% national rate and ranked in the top ten states for populationgrowth.
o Retail Sales recorded a robust 7S% gain, led by auto and building material purchases,which sþrocketed 14.2% artd I4.4%, reqpectively.
. The unemployment rate dropped to 5.9 %, a sharp improvement from the 7.0% rate inFY 1992.
The Outlook for F"f 1994
The encouraging results from FY 1993 should springboard the Arizona economy to evenbetter health in FY 1994. We forecast jobs to increase by 3.0% and personal income toaccelerate by 7.6%. In fact, employment in both the goods producing and service sectors isexpected to expand faster in FY 1994 than in FY 1993. FY 1994 may turn in the bestperformance since F"Y 1986, a year when Arizona experienced a double digit personalincome increase and over 6% job growth.
-30-

(Besed on Average Employment)
FY 1986 FY 1987 Fy 1988 Fy 1989 Fy 1990 Fy 1991 Fy t992 Fy 1993
Total Waee/Salsrv Emplovment Ø% U% Ð% 4% 4% t.3% O.7% 2.7%
TABLE 3
RECENT
Service Producine
Goods Producine
2.t%Q.e)8.94.1
2.2%
Q.7)(5.e)(1.0)
r.o%5.9
(e.1)(2.4)
(o.r)%3.1
(8.6)
Q.7')
6.12.r1.04.64.33.6
(o.7)%r.7
(6.6)(2.4)
(2.e)%6.5
(4.4'
Q.e)
(1.3)0.9
(0.4)2.63.3t-7
(4.8)%0.8
4.7>(4.0)
(1.0)(3.1)7.4L.4
Transportation/C ommunication& Public Utilities
TradeFin¿nce/Insurance/Real EstateServicesGovernment
Tot¿l Sen¡ices Producing
ManufacurringMiningConstn¡ction
Total Goods hoducing
4.66.0
12.49.84.L7.2
7.34.7'1.5
6.L3.05.2
6.73.83.77.33.L4.9
2.43.7
a.7)5.92.73-6
2.60.8
(0.3)2.45.42.4
2.12.02.23.83.42.9
ARIZONA WAGE AND SALARY EMPLOYMENTPERCENT GRO}VTH OVER PRIOR YEAR
A closer examination of our employment forecast, as shown on Table 4, reveals a continuingimprovement in the Goods Producing vsector, .which is predicted to grow 2.8%. This is duemainly to our expectations that manufacturing will post a gain for the first time in six years,albeit a meager I.0%. Also, mining employment should stabilizs as falling copper pricesmoderate. Meanwhile, construction should continue its strong expansion in residentialhousing as jobs nse 7.0%, which is slightly slower than the 7.4% growth in F"f ß92.Interest rates, which recently have turned higher, may restrain rising demand for housingtemporarily.
The Service Producing 2/ sector is expected to show greater job growth in all industriesexcept for a) Government and b) Transportation, Communication and Public Utilities. A3.0% ncrø;se in service jobs may seem small compared to the 8.0% growth during the mid-eighties, but it would still be the best in four years.
1/ Manufacturing, Construction, and Mining2/ Transportation, Communications, Public Utilities (TCPU); Trade; Finance, fnsurance,
Real Estate (FIRE); Services; and Government
-31-
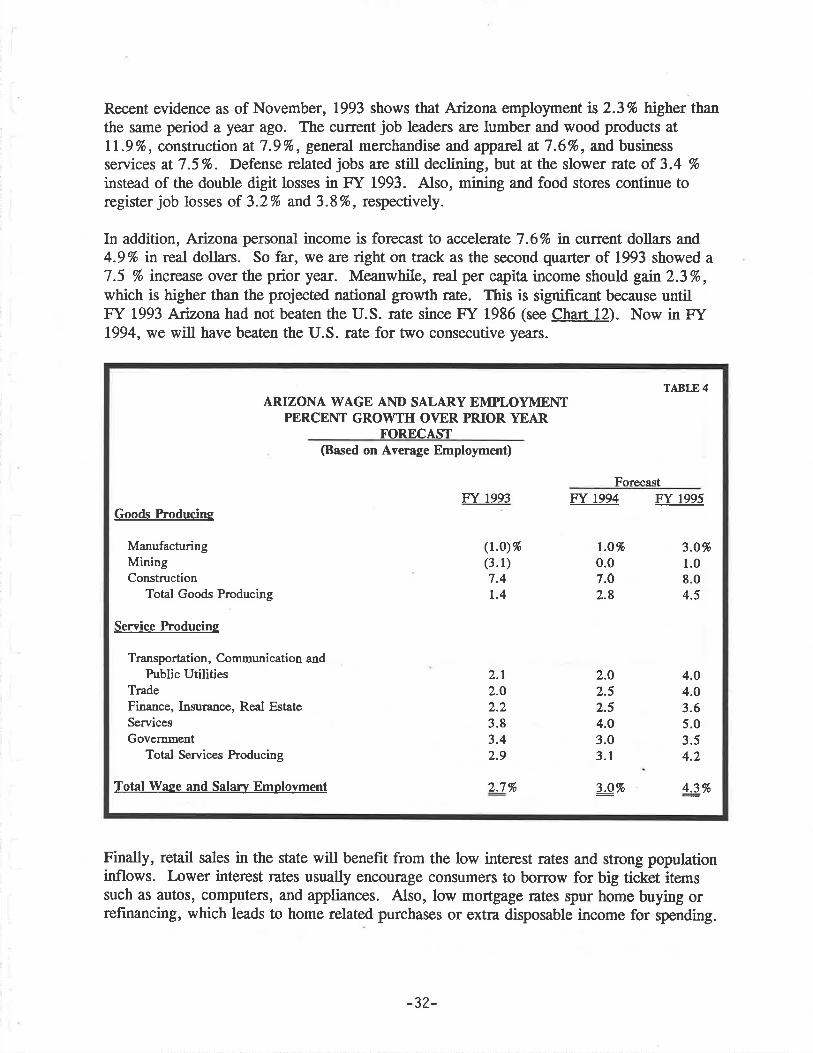
Recent evidence as of November, 1993 shows that Ar2ona employment is 2.3% higher thanthe same period a year ago. The current job leaders a¡e lumber and wood products atll9%, constructionatT.9%, general merchandise and apparel at7.6%, and businessservices at 7 .5%. Defense related jobs are still declining, but at the slower rate of 3.4 %
instead of the double digit losses in FY 1993. Also, mining and food stores continue toregister job losses of 3.2% and 3.8%, respectively.
In addition, Arizona personal income is forecast to accelerate 7.6Vo in current dollars and4.9% n real dollars. So far, we are right on track as the second quarter of 1993 showed a7 .5 % increase over the prior year. Meanwhile, real per capita income should gan 2.3%,which is higher than the projected national growth rate. This is signifrcant because untilFY 1993 Arizona had not beaten the U.S. rate since FY 1986 (see Chart 12). Now in FY1994, we will have beaten the U.S. rate for two consecutive years.
Finally, retail sales in the state will benefit from the low interest rates and strong populationinflows. Lower interest rates usually encourage consumers to borrow for big ticket itemssuch as autos, computers, and appliances. Also, low mortgage rates qpur home buying orrefinancing, which leads to home related purchases or extra disposable income for qpending.
TABLE 4
ARIZONA WAGE AND SALARY EMPLOYMENTPERCENT GROWTH OVER PRIOR YEAR
F'ORECAST(Based on Average Employment)
Fnren¡sf
FY 1993 FY 1994 FY 1995Goods Producins
ManufacturingMiningConstruction
Total Goods Producing
(t.o)%(3.1)7.4t.4
r.o%0.07.02.8
3.O%1.08.04.5
Service Producine
Transportation, Communication andPublic Utilities
TradeFinance, Insurance, Real EstateServicesGovernment
Total Services Produciag
2.12.O).,3.83.42.9
2.O
2.52.54.03.03.1
4.O
4.O
3.65.03.54.2
Total Wage and Salarv Emplovment 2.7% 3.O% 4.3%
-32-
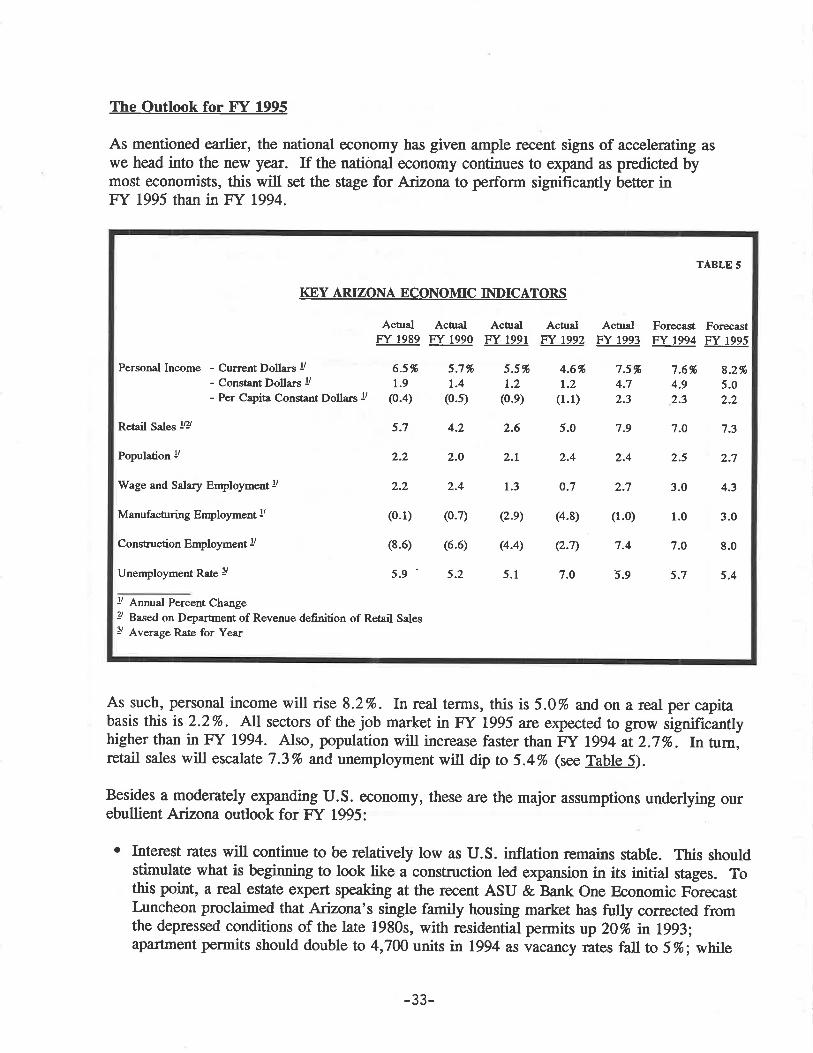
The Outlook for FY 1995
As mentioned earlier, the national economy has given ample recent signs of accelerating aswe head into the new ye¡u. If the national economy continues to expand as predicted bymost economists, this will set the stage for Arizona to perform significantly better inFY 1995 than in FY 1994.
As such, personal income will rise 8.2%. In real terms, this is 5.0% and on a real per capitabasis this is 2.2%. All sectors of the job market in FY 1995 are expected to grow significantlyhigher than in FY 1994. Also, population will increase faster than FY 1994 at2.7%. fn turn,retail sales will escalate 7.3% and unemployment will dip to 5.4% (see Table 5).
Besides a moderately expanding U.S. economy, these are the major assumptions underþing ourebullient Arizona outlook for FY 1995:
o Interest rates will continue to be relatively low as U.S. inflation remains stable. This shouldstimulate what is beginning to look like a construction led expansion in its initial stages. Tothis point, a real estate expert speaking at the recent ASU & Bank One Economic ForecastLuncheon proclaimed that Arizon¿'s singlê family housing market has fully corrected fromthe depressed conditions of the late 1980s, with residential permits up 20% in 1993;apartmentpermits should double to 4,7A0 units in 1994 as vacancy rates fall to 5%; while
KEY ARIZONA ECONOMIC INDICATORS
TABLE 5
Forecast ForecastFY t994 FY 1995
Personal Income - Current Dollars I'- Constant Dolla¡s U
- Per Capita Constant Dolla¡s !
Acû¡al Acû¡alF"r 1989 FY 1990
6.5% 5.7%1.9 L.4(0.4) (0.5)
4.2
2.O
2.4
(0.7)
(6.6)
5.2
Ach¡alFr 1991
ActualFY t992
AcanlFY 1993
7.5%4.72.3
7.9
2.4
2.7
(1.0)
7.4
5.9
s.5%L.2
(0.e)
2.6
2.t
t.3
Q.e)
(4.4)
5.1
4.6%r.2
(1.1)
5.0
2.4
o.7
(4.8)
4.7)
7.O
7.O
2.5
3.0
1.0
7.O
5.7
8.2%5.02.2
7.3
2.7
4.3
3.0
8.0
5.4
7.6%4.92.3
Retail Salqs !? 5.7
Population !! Z.Z
Wage and Salary Employment !! 2.2
Manufachrring Enployment ! (0.1)
Construction Employmentl/ (8.6)
Unemployment Rate 1 5.9 '
!/ Annual Percent Change? Based on Deparùnent of Revenue definition of Retail SalesI Average Rate for Year
-33-

the office, retail and industrial markets will return to normal as vacancy rates at theseproperties drop to around L0% or lower by the end of 1995 or soon therea.fter.
o The passage of the North American Free Trade Agreement (NAFTA) will benefit Arizonamore than most states due to our proximity to Mexico's border. As a result, the exporttrade boom will broaden, encouraging business investments and more hiring.
. Population flows into Arizona will be strong as our better than the national average jobmarket attract new residents. Also, Arizona will be the recipient of significant numbers ofbusinesses and people migrating out of California due to an eroding business climate and thecurrent recession in the Golden State, which is projected by many California economists tocontinue tn 1994.
o Economic development effofs of the past few years begin to bear fruition. In particular,Hughes Missile Systems, which relocated to Tlrcson from California in 1993, has onlybrought in about 800 jobs as of September. This means that the remaining 3,200 jobsannounced by Hughes will have a big impact when they are fltnally transferred, hopefully bythe end of 1994.
Risks to the Forecasts
The recent spate of upbeat economic news on the state and national level suggests there is moreupside than downside risk to our Arizona outlook for both FY 1994 and FY 1995. However, afew cautionary winds are looming on the nea¡ ho¡izon. Whether these winds turn into storms isdifficult for anyone to predict, but they are important in providing balance to the forecasts.They are listed below for the reader's awareness:
. Health care reform is casting a large cloud of uncertainty over many businesses, especiallysmall businesses. Since A¡izona is distinctly a small business state, with 95% of all businessestablishments having fewer than 50 employees, a substantial rise in heatth care costs willconstrain job growth.
o Higher fedenl taxes in 1994, resulting in lower disposable income than otherwise possible,could dampen consumer spending. However, a study by the WEFA group, a nationalforecasting firm, estimates that taxes will have only a small drag on the economy due tooffsetting lower interest rates from def,rcit reduction.
o Further defense cuts announced by the Clinton Administration in September may affectArizona more than expected. Even though we believe Arizona will receive a larger share offederal monies than other states to help in the post-Cold Wa¡ transition, Arizona is stillvulnerable to Depafment of Defense spending cuts.
o California's plight is benefiting Arizona in the short term through a structural shift ofbusinesses and people, but Arizona employment would have been even higher if not forCalifornia's woes. So continued decay of Arizona's largest trading partner will restrainArizona's upbeat job proqpects.
-34-
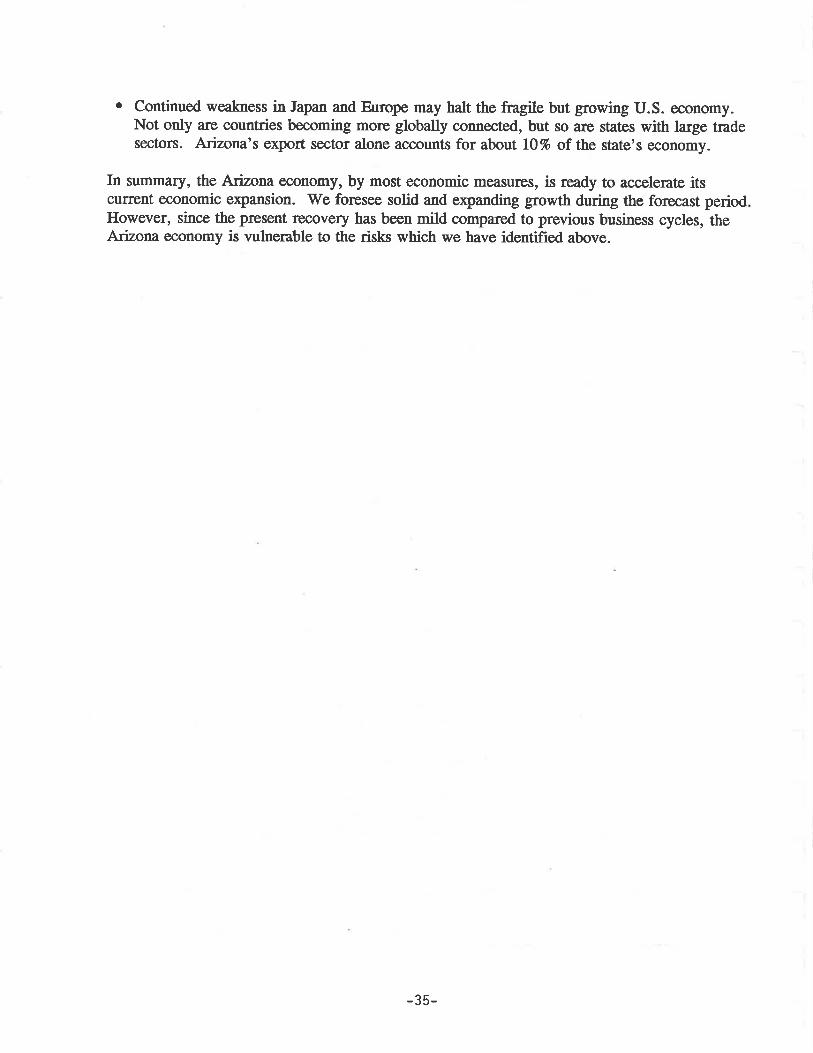
. Continued weakness in Japan and Europe may halt the fragile but growing U.S. economy.Not only a¡e countries becoming more globally connected, but so are states with large tradesectors. A¡izona's export sector alone accounts for about l0% of the state's economy.
In summary, the Arizona economy, by most economic measures, is ready to accelerate itscurrent economic expansion. We fo¡esee solid and expanding gfowth during the forecast periodHowever, since the present recovery has been mild compa¡ed to previous business cycles, theArizona economy is vulnemble to the risks which we have identifred above.
-35-
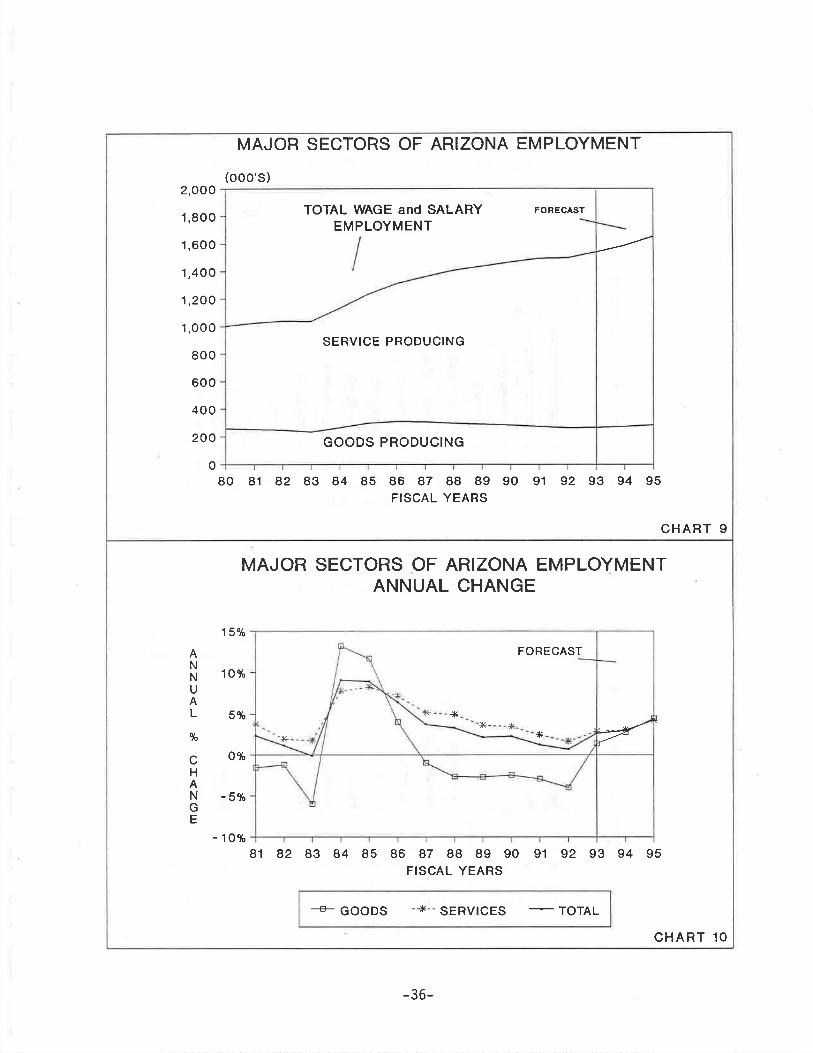
MAJOR SECTORS OF ARIZONA EMPLOYMENTANNUAL CHANGE
15%
ANNUAL
%
cHANt1E
10%
5%
o%
-5%
- 10%81 82 83 84 85 86 87 88 89 90 91 92 93 94 95
FISCAL YEARS
---g_ GOODS -+--SERVICES -
TOTAL
FORECAST
l(* *ì(-
'l(
JK
CHART 10
MAJOR SECTORS OF ARIZONA EMPLOYMENT
(o00's)2,OO0
1,800
1,600
1,400
1,200
1,000
800
600
400
200
080 8'r 82 83 84 85 86 87 88 89 90 91 92 93 94 9s
FISCAL YEARS
CHART 9
FOBECASTTOTAL WAGE and SALARYEMPLOYMENT
SERV!CE PRODUCING
GOODS PRODUCING
-36-
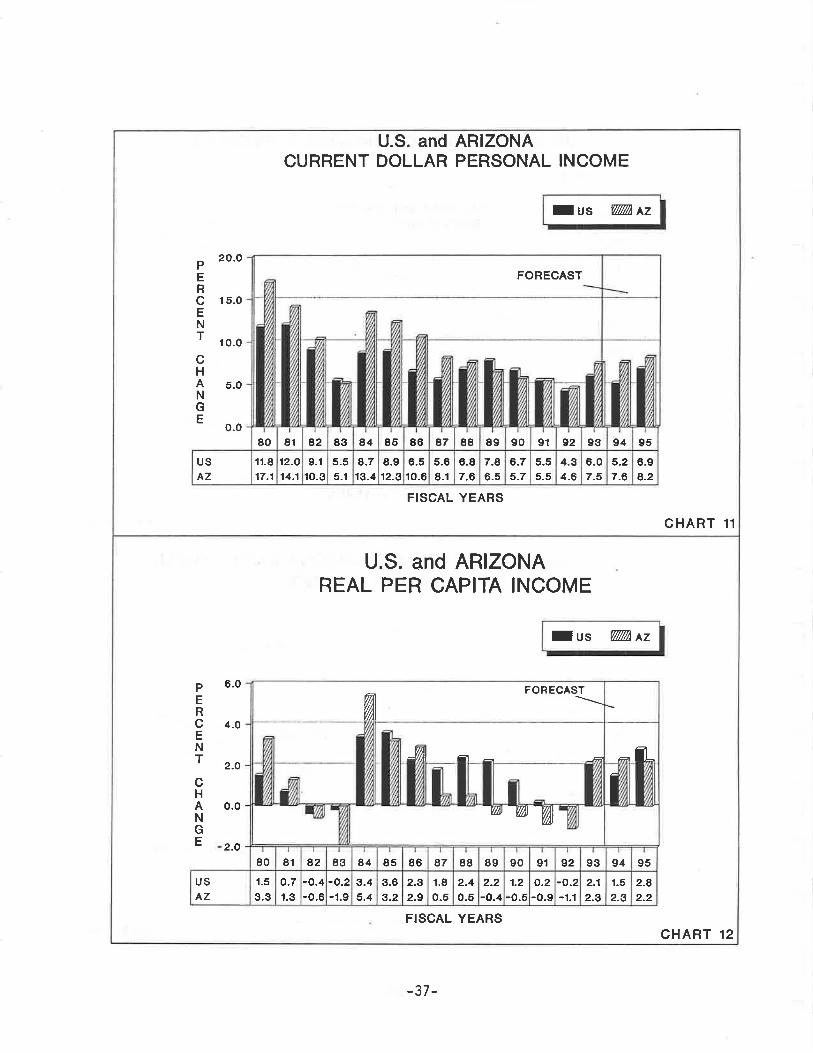
U.S. and ARIZONAREAL PER CAPITA INCOME
PERcENT
cHANGE
6.0
4.0
2.O
0.0
2 .0
FISCAL YEARS
I us VlVI7À tz
USAZ
1.5
3.3
80
o.7't.3
8r
-o.4-0.8
82
-o.2-1.9
83
3.45.4
84
3.63.2
85
2.32.9
86
1.8
0.5
a7
2.40.5
88
2.2-o-4
89
1.2
-0.5
90
o.2-0.9
91
-o.2-1.1
92
-wm
m -1
m
FORECAST---.\
2.1
2.3
9S
¡
1.5
2.3
94
2.82.2
95
a a_
CHART 12
U.S. and ARIZONACURRENT DOLLAR PERSONAL INCOME
I us VTIUÀ tz
PERcENT
cHANGE
20.o
l5.o
r 0.0
5.0
o.0
FISCAL YEARS
CHART 11
USAZ
r1.8
17.1
80
12.O
14.1
81
9.fr0.3
82
5.55.1
83
8.713.4
84
8.9't2.3
85
9.510.6
86
5.68.1
a7
6.87.6
88
7.8ô.5
89
6.75-7
90
5.55.5
91
4.34.6
92
FOREGAST
6.07.5
93
5.27.6
94
ô.98-2
95
-37 -
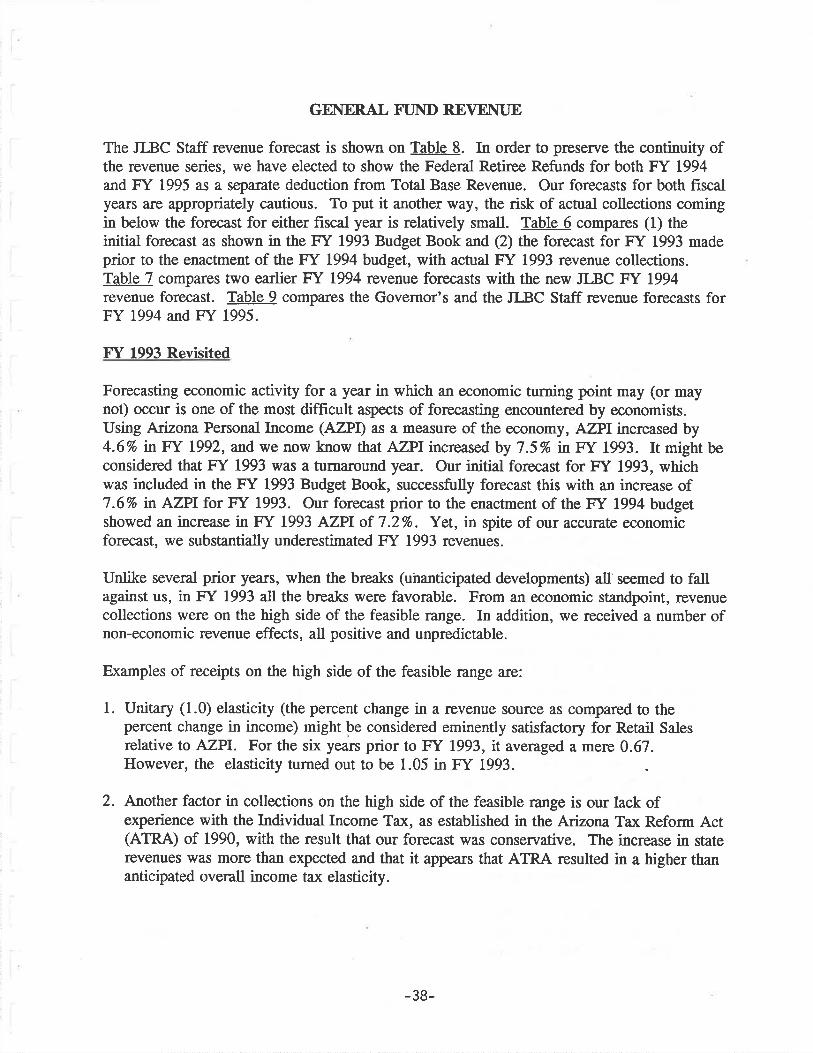
GFÀIER,AL FT]ND REVEIII]E
The JLBC Staff revenue forecast is shown on Table 8. In order to preserve the continuity ofthe revenue series, we have elected to show the Federal Retiree Refunds for both FY 1994and FY 1995 as a separate deduction from Tot¿l Base Revenue. Our forecasts for both frscalyears are appropriately cautious. To put it another way, the risk of actual collections comingin below the forecast for either frscal year is relatively small. Table 6 compares (1) theinitial forecast as shown in the FY 1993 Budget Book and (2) the forecast for FY 1993 madeprior to the enactment of the FY 1994 budget, with actual FY 1993 revenue collections.Table 7 compares two ea¡lier FY 1994 revenue forecasts with the new JLBC FY 1994revenue forecast. Table 9 compares the Governor's and the JLBC Staff revenue forecasts forFY 1994 and FY 1995.
F"f ú93 Revisited
Forecasting economic activity for a year in which an economic turning point may (or maynot) occur is one of the most difflrcult aspects of forecasting encountered by economists.Using Arizona Personal Income (AZPD as a measure of the economy, AZPI increased by4.6% lmFY 1992, and we now know that AZPI increased by 7.5% lr'Fy 1993. It might beconsidered that FY 1993 was a turnaround year. Our initial forecast for FY 1993, whichwas included in the FY 1993 Budget Book, successfully forecast this with an increase of7.6% n AZPI for FY 1993. Our forecast prior to the enactment of the FY 1994 budgetshowed an increase in FY 1993 AZPI of 7.2%. Yet, in qpite of our accurate economicforecast, we substantially underestimated FY 1993 revenues.
Unlike several prior years, when the breaks (unanticipated developments) all'seemed to fatlagainst us, in FY 1993 all the breaks were favorable. From an economic standpoint, revenuecollections were on the high side of the feasible range. In addition, we received a number ofnon-economic revenue effects, all positive and unpredictable.
Examples of receipts on the high side of the feasible range are:
l. Unitary (1.0) elasticity (the percent change in a revenue source as compared to thepercent change in income) might be considered eminently satisfactory for Retail Salesrelative to AZPI. For the six years prior to FY 1993, it averaged a mere 0.67.However, the elasticity turned out to be 1.05 in FY 1993.
2. Another factor in collections on the high side of the feasible range is our lack ofexperience with the Individual Income Tax, as established in the Arizona Tær Reform Act(ATRA) of 1990, with the result that our forecast was conseryative. The increase in staterevenues was more than expected and that it appears that ATRA resulted in a higher thananticipated overall income tax elasticity.
-38-
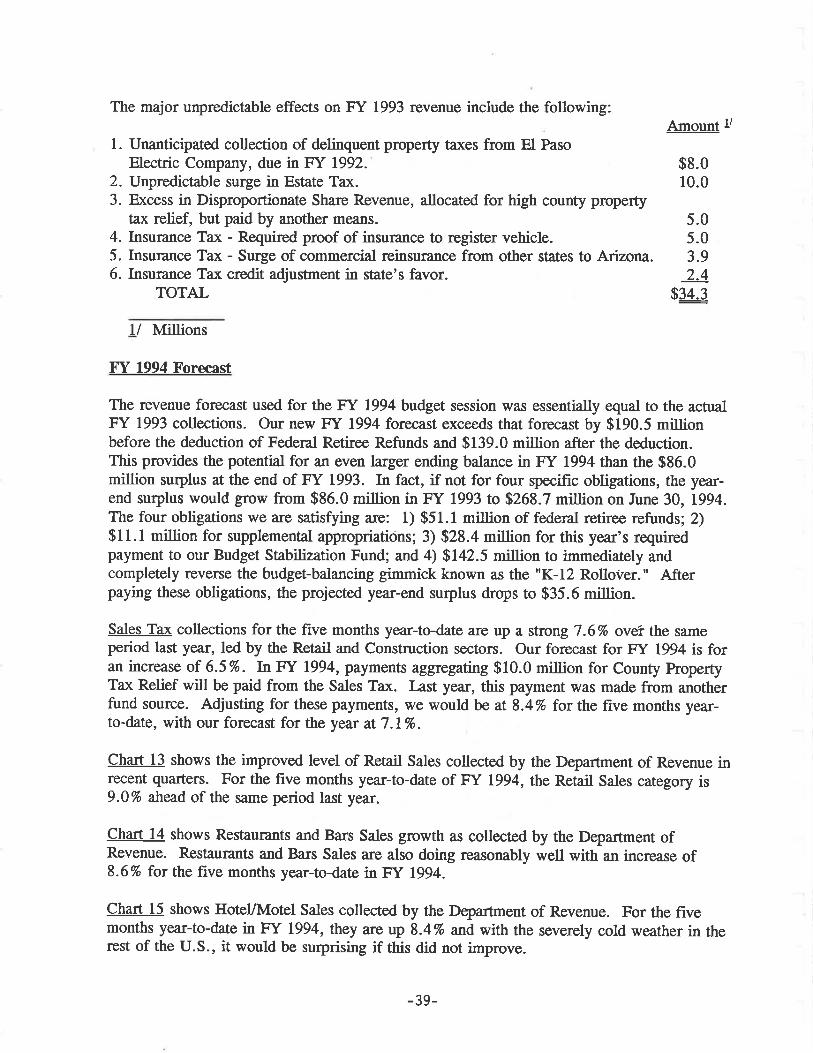
The major unpredictable effects on FY 1993 revenue include the following:
1. Unanticipated collection of delinquent property taxes from E[ PasoElectric Company, due in FY 1992.
2. Unpredict¿ble surge in Estate Tax.3. Excess in Disproportionate Share Revenue, allocated for high county property
tax relief, but paid by another means.4. Insurance Tax - Required proof of insurance to register vehicle.5. Insurance Tax - Surge of commercial reinsurance from other states to Arizona.6. Insurance Tax credit adjustment in state's favor.
TOTAL
Amount !i
$8.010.0
5.05.03.92.4
$34.3
1/ Millions
F"f ú94 Forecast
The revenue forecast used for the FY 1994 budget session was essentiatly equal to the actualFY 1993 collections. Our new FY 1994 forecast exceeds that forecast by $190.5 millionbefore the deduction of Federal Retiree Refunds and $139.0 million after the deduction.This provides the potential for an even larger ending balance in FY 1994 than the $86.0million surplus at the end of FY 1993. In fact, if not for four specific obligations, the year-end surplus would grow from $86.0 million in FY 1993 to $268.7 million on June 30, 1994.The four obligations we are satisfying are: 1) $51.1 million of federal retiree refunds; 2)$ll.l million for supplemental appropriations; 3) $28.4 million for this year's requiredpayment to our Budget St¿bilization Fund; and 4) $142.5 million to immediately andcompletely reverse the budget-balancing gimmick known as the "K-12 RolloVer." Afterpaying these obligations, the projected year-end surplus drops to $35.6 million.
Sales Tax collections for the five months year-to-date are up a strong 7.6% ovei the sameperiod last year, led by the Retail and Constmction sectors. Our forecast for FY 1994 is foran increase of 65%. In FY 1994, payments aggregating $10.0 million for County PropertyTax Relief will be paid from the Sales Tax. Last year, this payment was made from anotherfund source. Adjusting for these payments, we would be at 8.4% for the five months year-to-date, with our forecast for the year at 7.1%.
Chart 13 shows the improved level of Retail Sales collected by the Department of Revenue inrecent quarters. For the five months year-to-date of FY 1994, the Retail Sales category is9.0% ahead of the same period last year.
Chart 14 shows Restaurants and Bars Sales growth as collected by the Department ofRevenue. Restaurants and Bars Sales are also doing reasonably well with an increase of8.6% for the five months year-to-date in FY 1994.
Chart 15 shows HotellMotel Sales collected by the Department of Revenue. For the fivemonths year-to-date in FY 1994, they are up 8.4% and with the severely cold weather in therest of the U.S., it would be surprising if this did not improve.
-39-
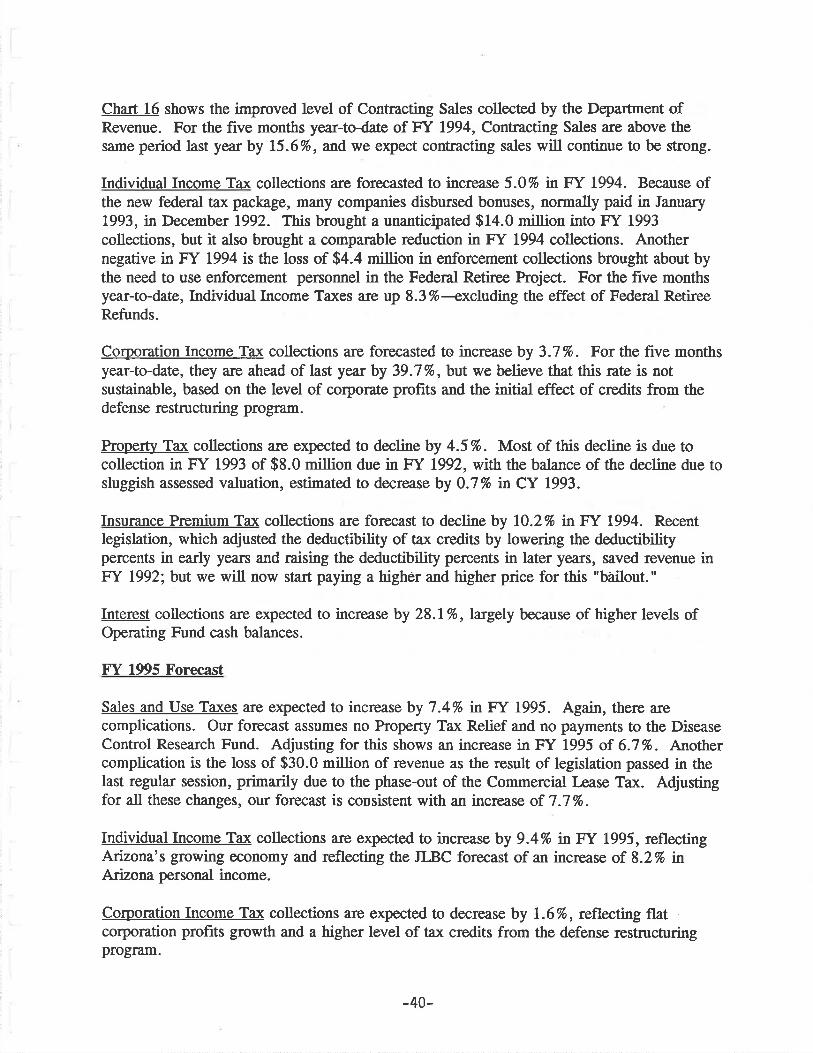
Chart 16 shows the improved level of Contracting Sales collected by the Department ofRevenue. For the five months year-to-date of FY L994, Contracting Sales are above thesame period last year by 15.6%, and we expect contracting sales will continue to be strong.
Individual Income Tax collections are forecasted to increase 5.0% in FY 1994. Because ofthe new federal tar package, many companies disbursed bonuses, normally paid in January1993, in December 1992. This brought a unanticipated $14.0 million into F"Y 1993
collections, but it also brought a comparable reduction in FY 1994 collections. Anothernegative in FY 1994 is the loss of $4.4 million in enforcement collections brought about bythe need to use enforcement personnel in the Federal Retiree Project. For the five monthsyear-to-date, Individual Income Taxes are up 8.3%<xcluding the effect of Federal RetireeRefunds.
Corporation Income Tax collections are forecasted to increase by 3.7%. For the five monthsyear-to-date, they a¡e ahead of last year by 39.7%, but we believe that this rate is notsustainable, based on the level of corporate profits and the initial effect of credits from thedefense restmcturing program.
Property Tax collections are expected to declineby 4.5%. Most of this decline is due tocollection in FY 1993 of $8.0 million due in FY 1992, with the balance of the decline due tosluggish assessed valuation, estimated to decrease by 0.7Vo in CY 1993.
Insurance Premium Tax collections are forecast to decline by I0.27o in F"f ß94. Recentlegislation, which adjusted the deductibility of ta¡r credits by lowering the deductibilitypercents in early years and raising the deductibility percents in later years, saved revenue inFY 1992; but we will now staf paying a higher and higher price for this "bailout."
Interest collections are expected to increase by 28.I%, Lalgely because of higher levels ofOperating Fund cash balances.
F"f 1995 Forecast
Sales and Use Taxes are expected to increase by 7.4% in FY 1995. Again, there arecomplications. Our forecast assumes no Property Tax Relief and no payments to the DiseaseControl Research Fund. Adjusting forthis shows an increase in FY 1995 of 6.7%. Anothercomplication is the loss of $30.0 millis¡¡ of revenue as the result of legislation passed in thelast regular session, primarily due to the phase-out of the Commercial I-ease Tax. Adjustingfor all these changes, our forecast is consistent with an increase of 7 .7 %.
Individual lncome Tax collections are expected to increase by 9.4% in Fft L995, reflectingArizona's growing economy and reflecting the JLBC forecast of an increase of 8.2% nArizona personal income.
Corporation Income Tax collections are expected to decrease by 1.6%, reflecting flatcorporation profits growth and a higher level of ta>r credits from the defense restnrcturingprogram.
-40-

Proper8 Tax collections will increase by 1.6%, reflecting a very modest increase of 1.0% nassessed valuation in CY 1994 compared to the threæ previous consecutive years of decline.
Insurance Premium Tax collections call for a reduction of 3.9 %, the result of raisingdeductibility of tax credits in later years, described previously.
Chatt L7 shows, for the 10 years, starting in Ff 1986, dollars of General Fund revenue as abar chaf and percent change as a line gr¿ph. Also shown a¡e "underlying growth rates"(after elimination of legislative changes) for FY 1989 through FY 1994. Amounts shown forFY 1994 and FY 1995 are before deduction for the Federal Reti¡ee Refunds.
Chart 18 shows, as a line chart, Sales and Use Ta>r collections for the period Ff 1986through FY 1995.
Chart 19 shows, as a line chart, Individual Income Tax collections for the period FY 1986through FY f995. The effect of Federal Retiree Refunds is excluded from FY 1994 andFY 1995.
Chart 20 shows, as a line chart, Corporation Income Tax collections for the period FY 1986through FY 1995.
Chat 2l shows, as a line chart, Total General Fund Revenue collections for the periodFY 1986 through FY 1995.
Chat 22 shows, in graphic form, the percent and dollar growth in FY 1995 over FY 1994for significant categories of General Fund revenue based on JLBC Staff estimates. TheIndividual Income Tax excludes the effect of Federal Reti¡ee Refunds.
Chat 23 shows major General Fund tax sources as a percent of total General Fund baserevenue, based on the JLBC Staff FY 1995 forecast, but excluding Federal Reti¡ee Refunds.
-4r-

STATE OF ARIZONAGENERÀL FI]ND REVENT]E
SELECTED FORECASTS - T"T 1993COMPARED WITH ACTUAL FT 1993
(Ihousands)
ABInitial Forecast kior to
F f 1993 !/ EnsctmentBudget Book FY 1994 Budeet
cF"r 1993RevenueActual
Table 6
DifTerences
c-a c-B
TaxesSales and UseIncome - Individual
- Corporation- Urban Revenue Sharing
hopertyLuxuryInsuranceMotor Vehicle LicensePari-Muû¡alEstateOther Taxes
Subtotal - Taxes
Other Non-Tax RevenueLotleryLicenses, Fees, Permits/Sales & ServiceInterestOther Miscellaneous
Subtotal - Other Non-Tax Revenue
Total Base Revenue BeforeOther Revenue Sources
Other Revenue SourcesTransfers and ReimbursementsDisproportionate Share
Subtotal - Other Revenue Source
3.619.636.9 3.602.785.9 3.713.477.9 93.851.0 110.692.00
$L,597,399.9L,376,[email protected]
207,000.0(183,700.0)
192,867.O71,100.089,600.0
107,100.04,900.0
25,(X)O.0
1.850.03.489.416.9
$1,605,399.9L,347,900.0
207,000.0(183,700.0)
L93,257.069,800.090,300.0
107,100.05,100.0
28,000.01.904.5
3.472.061.4
$t,63L,354.41,367,097.L
239,208.0(t83,667.2)2O3,240.473,069.9
103,002.5103,103.8
4,929.O39,7L4.3
1.832.83.582.885.0
s33,954.5(9,202.9)32,208.0
32.810,383.4
1,969.913,402.5
Q,996.2)29.O
14,714.3(r7.2\
93.478.1
$?5,954.5L9,197.L32,208.O
32.89,983.43,269.9
12,702.5
Q,996.2)(171.0)
tL,7L4.301.'D
110.823.6
(683.3)(13e.e)
(6,106.2)7.302.3
372.9
(12,54t-L) (t2,552-L)5.000.0 5.000.00.541.11 0.552.11
TOTAL BASE REVENTJE
f/ Adjusted for bills passed with revenue impact.
$1 2J $3-SttggzJ 53,13!ß22ß $9599¿ $193;13.2l
-42-
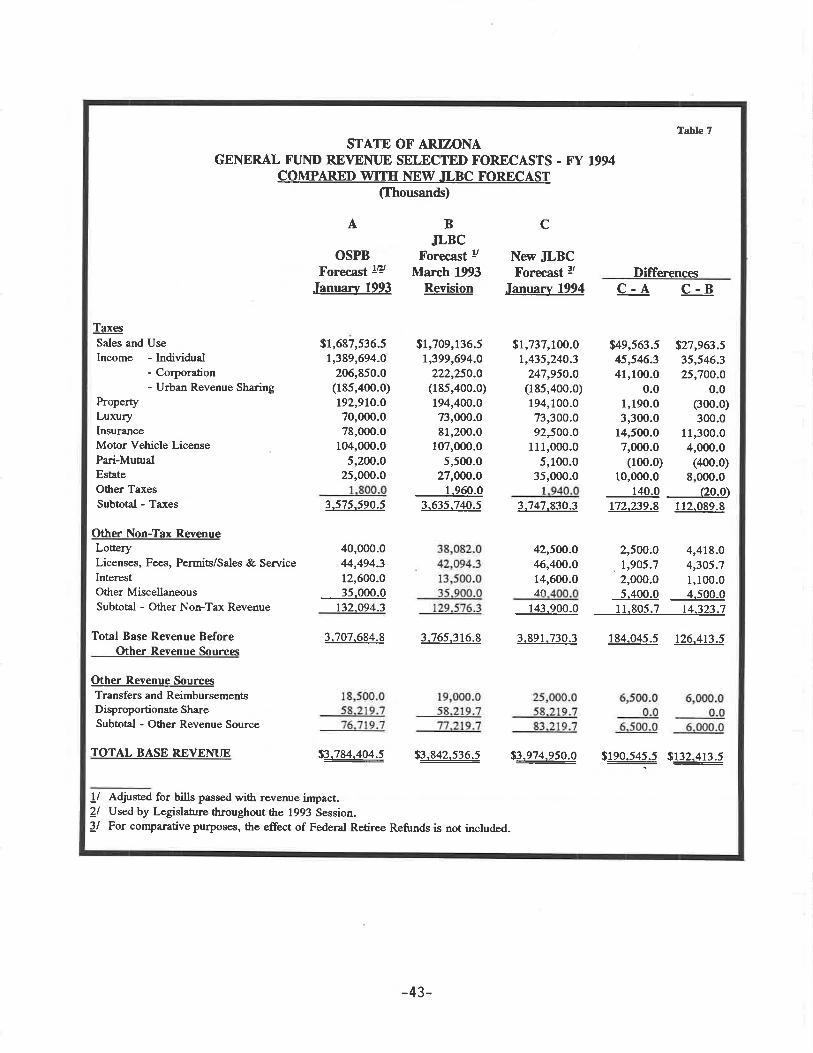
STATE OF ARTZONAGENERAL FI]IV) RE\TEIYI]E SELECTED FORECASTS . FT 1994
COMPARED WTIH NEW.ILBC FORECAST(Ihousands)
A
OSPBForec¡st !Z
January 1993
BJLBC
Forccast !March 1993
Revision
c
New JLBCForec¿st /
Januarv 1994
Table 7
Differencesc-a c-B
TaxesSales and UseIncome - Individual
- Corporation- Urban Revenue Sharing
PropertyLuxuryInsuranceMotor Vehicle LicensePari-Muf¡alEst¿te
OÉrer TaxesSubtotal - Ta¡res
Other Non-Tax RevenueLoneryLicenses, Fees, Permits/Sales & ServiceInterestOther MiscellaneousSubtotal - Other Non-Tax Revenue
Total Base Revenue BeforeOther Revenue Sources
Other Revenue SourcesTransfers and ReimbursementsDisproportionaæ ShareSubtotal - Other Revenue Source
TOTAL BASE REVENTJE
$49,563.5 527,963.545,546.3 35,546-341,100.0 25,7O0.O
0.0 0.01,190.0 (300.0)3,300.0 300.0
14,500.0 11,300.07,000.0 4,000.0(100.0) (400.0)
10,000.0 8,000.0140.0 (20.o\
172.239.8 112.089.8
$1,687,536.51,389,694.0
206,850.0(185,400.0)
L92,9LO.O70,000.078,OOO.o
104,000.05,2OO.O
25,000.0
$1,709,136.5r,399,694.0
222,250.0(185,400.0)
194,400.073,000.081,200.0
107,000.05,500.0
27,OOO.O
1.960.03.635.740.5
$1,737,100.0L,435,240.3
247,95O.O(185,400.0)194,100.073,3OO.O
92,5OO.O
111,0q).05,100.0
35,000.01
3.?07.684.8 3.765.316.8
2,5q).0 4,4L8.0
. 1,905.7 4,305.72,q)o.o 1,100.05.400.0 4.500.0
11.805.1 14.323.7
184.045.5 126.413.5
3.575.590.5
40,000.04,494.3L2,6OO.O
35.000.0132.094.3
1
3.747.830.3
42,5OO.O
46,400.014,600.04î
143.900.0
3.891.730.3
$3.784.404.5 $3.842.536.5 $3.974.950.0 $190.545.5 Sr32-413.5
!/ Adjusted for bills passed with revenue impact.
ll UseÀ by Legislaturethroughoutthe 1993 Session.
f/ For comparative purposqs, the effect of Federal Reti¡ee Refunds is not included.
-43-

STATE OF ARTZONAGENERAL FI]ND
STATEMENT OF' PROJECTED BASE REVEI\I]B.ILBC STAF'F'ESTIMATE
(Thousands)
Actuel f'Y 1993
$L,631,354.4L,367,O97.I
239,2O8.0(t83,667.2)203,240.473,069.9
103,002.5103,103.8
4,g2g.o39,714.3
1.832.83.582.885.0
$1,737,100.0L,435,240.3
247,950.0(185,400.0)194,100.073,300.092,500-0
1 1 1,000.05,100.0
35,000.01.940.0
3;147.830.3
Table 8
5.93.06.8
(6.2)t.7
1.220.214.5
Amount % Chanse Amount Vo Chs¡se Amount Vo ChanzeForecrst FY 1994 Foreccsf F"f f 99-5
7.4%9.4
(1.6)10.9
1.61.0
(3.e)8.1
2.O
0.05.26.7
TaxesSales and UseIncome - Individual
- Corporation- Urban Revenue Sharing
Prop"rtyLuxuryInsurance PremiumMotor Vehicle LicensePari-Muû¡elEstate
Other TaxesSubøtal - Taxes
Other Non-Tax RevenuesLotæryLicense, Fees & Permits/Sales & ServiceInterestOther Miscellaneous
Subtotal - Other Non-Tax Revenues
Tot¿l Base Revenue beforef}fher Revenrrc Snrrrnm
Other Revenue SourcesTransfers and ReimbursementsDisproportionete Share
Subtotal - Other Revenue Sources
6.5% $1,866,500.05.0 1,570,000.03.7 244,LOO.O
0.9 (205,600.0)(4.5) 197,300.00.3 74,000.0
(10.2) 88,900.07.7 120,000.03.5 5,200.0
(11.9) 35,000.05.8 2.040.04.6 3.997.440.0
8.5%10.513.1
4.313.0
1.1
2.43.3
(0.1)54.82.69.9
(2.0)r 1.8
(27.4)(5.6)(2.0)
(85.Ð54.8
Q4.6)
23.23.2
28.1r.7
to.2
226.4(8.6)16.6
3;713.477.9 9.4 3.891.730.3 4.8 4.143.740.0 6.5
TOTAL BASE REVENTJE 3.784.822.0 8.5 3.974.950.0 5.0 4.238.994.1 6.6
(51,100.0) (34,200.0)Federal Retiree Refunds
ApJUSTEp TOTAL BASE REVENUE $3.784.822.0 gé%. $3,923,9594 3.7% 54.204.794.1 7.2%
-44-

STATE OF ARIZONAGEI\ERAL FI]ND
STATEMENT OF PROJECTED BASE REVENT]ECOMPARISON OF GOYERNOR'S AND.ILBC STAFF ESTIMATES
(Thousands)
Governor's JLBC StsffEstimate Estimate Difference
Table 9
F"r 1995Governor's JLBC StaffEstimate Estimate Difference
TaxesSales and UseIncome - Individual
- Corporation- Urban Revenue Sharing
PropertyLuxuryInsurance PremiumMo¡or Vehicle LicensesPari Muû¡elEstate
Other TaxesSubtotal - Taxes
Other Revenue SourcesTransfers & ReimbursementsDisproportionate Share Revenue
Subtot¿I - Other Revenue Sources
TOTAL BASE REVENI.JE
Adjustnent to ConsensusFederal Reti¡ee Refunds
$1,732,900.0 $1,737,100.01,461,500.0 1,435,24O.3
259,800.0 247,950.0(185,400.0) (185,400.0)188,700.0 194,100.073,470.0 73,300.089,200.0 92,5OO.0
108,200.0 111,000.04,490.0 5,100.0
30,000.0 35,000.01.850.0 1.940.0
3.764.7t0.0 3.747.830.3
$1,841,400.0 $1,866,500.01,582,000.0 1,570,000.0
261,300.0 244,IOO.O(205,610.0) (205,600.0)189,400.0 197,300.074,470.0 74,000.082,400.0 89,900..0
111,450.0 120,000.04,7OO.O 5,2q).0
29,000.0 35,000.01.900.0 2.o40.o
3.972.4t0.0 3.997.440.0
$ 4,2oo.o
Q6,259.7)(11,850.0)
0.05,400.0
(170.0)3,300.02,80O.0
610.05,000.0
90.0(16.879.Tt
$25,100.0(12,000.0)(17,200.0)
10.07,900.0
(470.0)6,500.08,550.0
500.06,000.0
140.025.030.0
Other Non-Tax RevenuesLottery 42,890.0Licenses, Fees & Permits/Sales & Service 42,230.0Interest 11,000.0Miscellaneous 32.500.0
Subtotal - Other Non-Tær Revenues L28.620.O
Total Base Revenue BeforeOther Revenue Sources 3.893.330.0 3.891.730.3 (1.599.7\ 4.110.290.0 4.143.740.0 33.450.0
(0.0)4,42O.03,600.0
400.08.420.0
25,300.3 2,900.369.953.8 11.733.895.254.t 14.534.t
ADJUSTED TOTAL BASE REVENT]E $3.923.950.0 $3.923.850.0
3,975,050.0 3,974,950.0
0.0 0.0(51.100.0ì (51.100.0)
4,191,010.0 4,239,994.1 47,994.L
36,250.0 0.0 Q6,25O.O)ß4.200.0) (34.200.0) 0.0
$419! é0.0 $!ø! Je4 J $11,73,1J
-45-
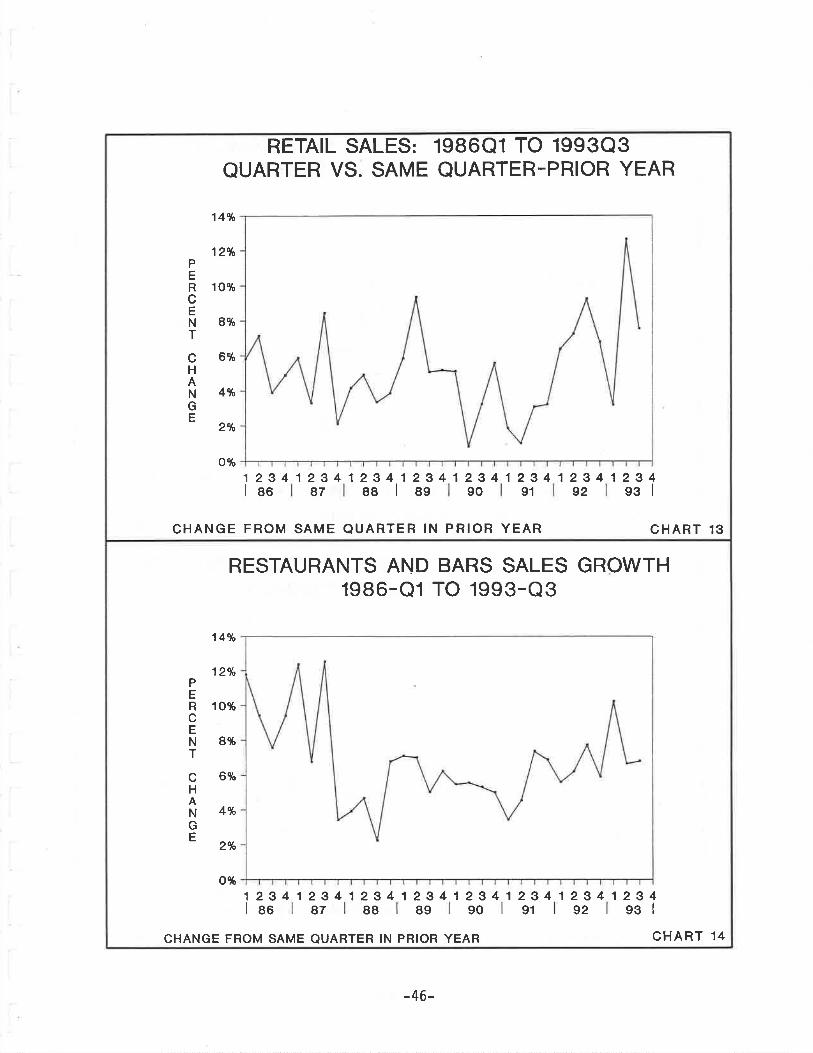
RESTAURANTS AND BARS SALES GROWTH1986-Q1 TO 1993-Q3
PERcENT
cHANGE
14%
12%
10%
8%
6%
4%
2%
o%1
I
23 4 1 23 4 1 23 4 1 23 4 1 23 4 1 23 4 12341234s2 s3l86 87 88 89 90
CHANGE FROM SAME QUARTER IN PRIOR YEAR
91
CHART 14
RETAIL SALES: 1986Q1 TO 1993Q3QUARTER VS. SAME QUARTER-PRIOR YEAR
14%
12%PERcENT
cHANGE
10%
8%
6%
4%
2%
o%1
I
2I
36
4 't234123487 88
1234 123490
12341234 1234esIlag 91 92
CHANGE FROM SAME QUARTER IN PRIOR YEAR CHART 13
-46-
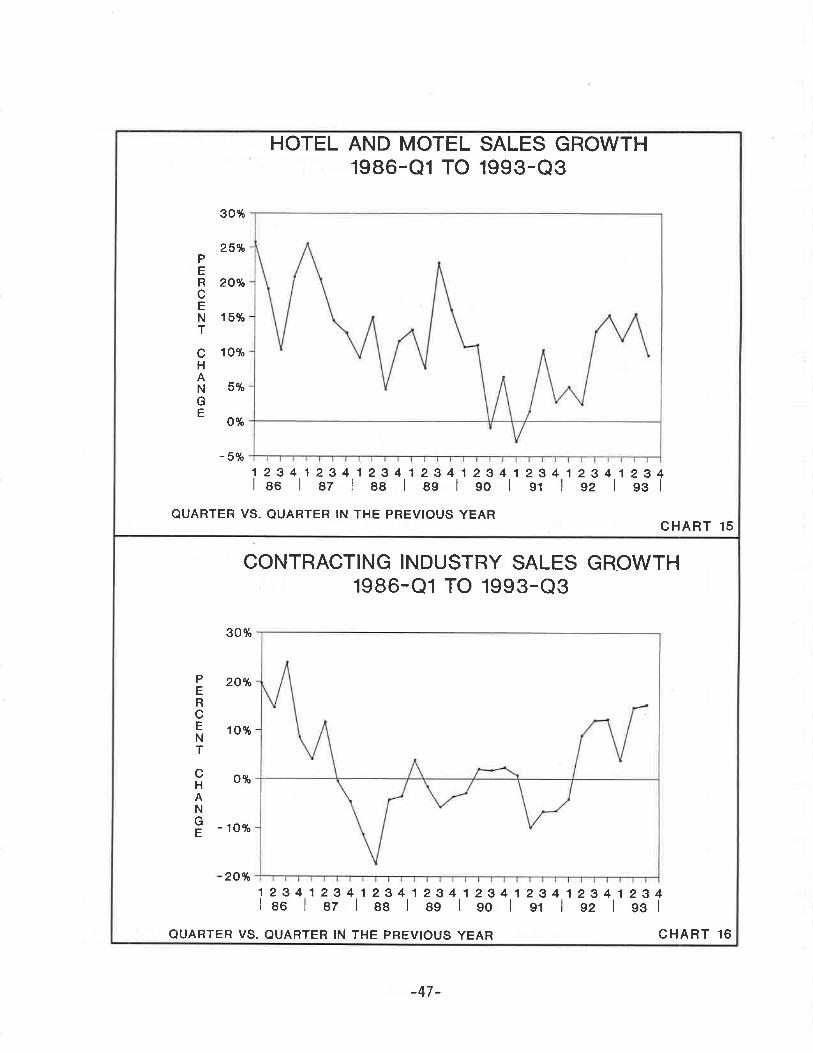
CONTRACTING INDUSTRY SALES GROWTH1986-Q1 TO 1993-Q3
30%
PERcENT
cHANGE
20%
10%
o%
- 10%
20 %
1 23 4 1 23 4 1 23 4',1 23 4 1 23 4't 23 4 1 23 4 1 23 4leo I w I ee I eg I go I gr I gz I gel
QUARTER VS- QUARTER IN THE PREVIOUS YEAR CHART 16
HOTEL AND MOTEL SALES GROWTH1986-Q1 TO 1993-Q3
PERcENT
cHANGE
30%
25%
20%
15%
10%
5%
0%
-5%1 23 4 1 23 4'l 23 4 1 23 4 1 23 4't 23 4 1 23 4 1 23 4leo I az I aa I ag I go I gr I gz I ssl
QUARTER VS. QUARTER IN THE PREVIOUS YEARCHART 15
-47 -
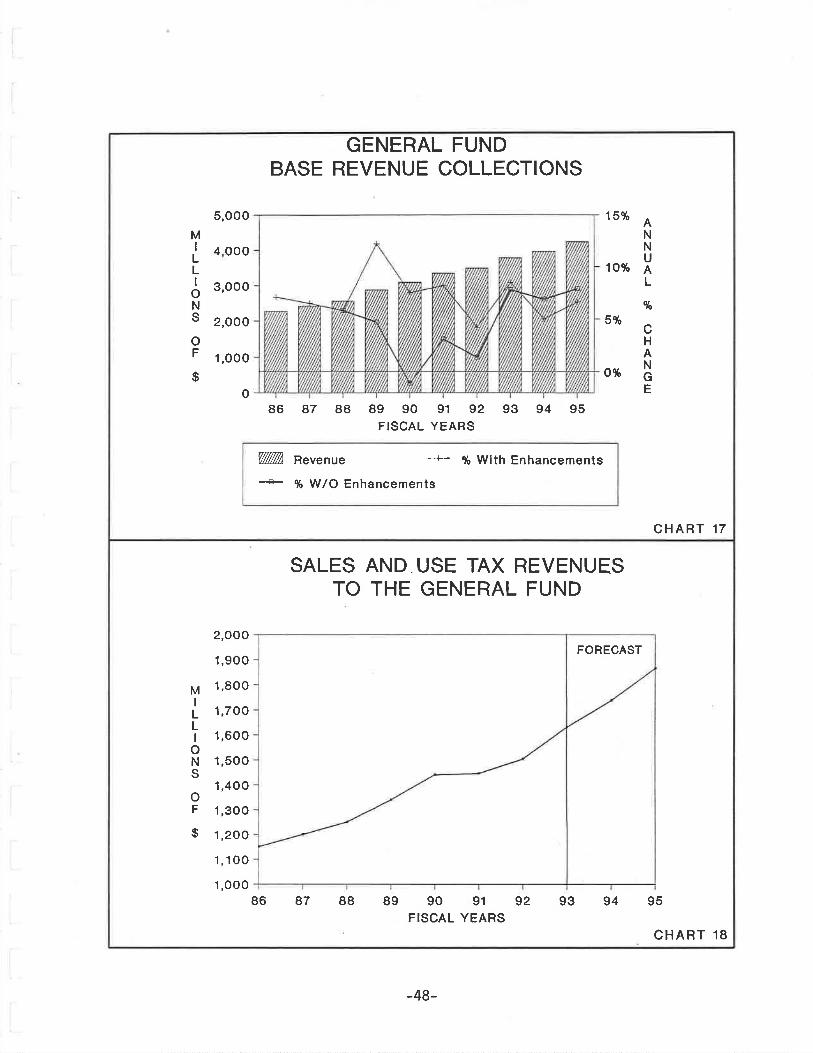
GENERAL FUNDBASE REVENUE COLLECTIONS
5,O00 1 5%ANNUAL
%
cHANGE
M¡
LLI
oNS
oF
$
4 00 010%
3,000
2,000 5%
o%1,000
086 87 88 89 90 91 92 93 94
FISCAL YEARS95
YWffii Revenue ---f- % with Enhancements
-{r- % W/O Enhancements
CHART 17
SALES AND USE TAX REVENUESTO THE GENERAL FUND
MI
LLI
oNS
oF
$
2,O00
1,900
1,800
1,700
1,600
1,500
1,400
1,300
1,200
1,100
1,00089 90 91
FISCAL YEARS92 93 94 95
FORECAST
86 A7 88
CHART 18
-48-
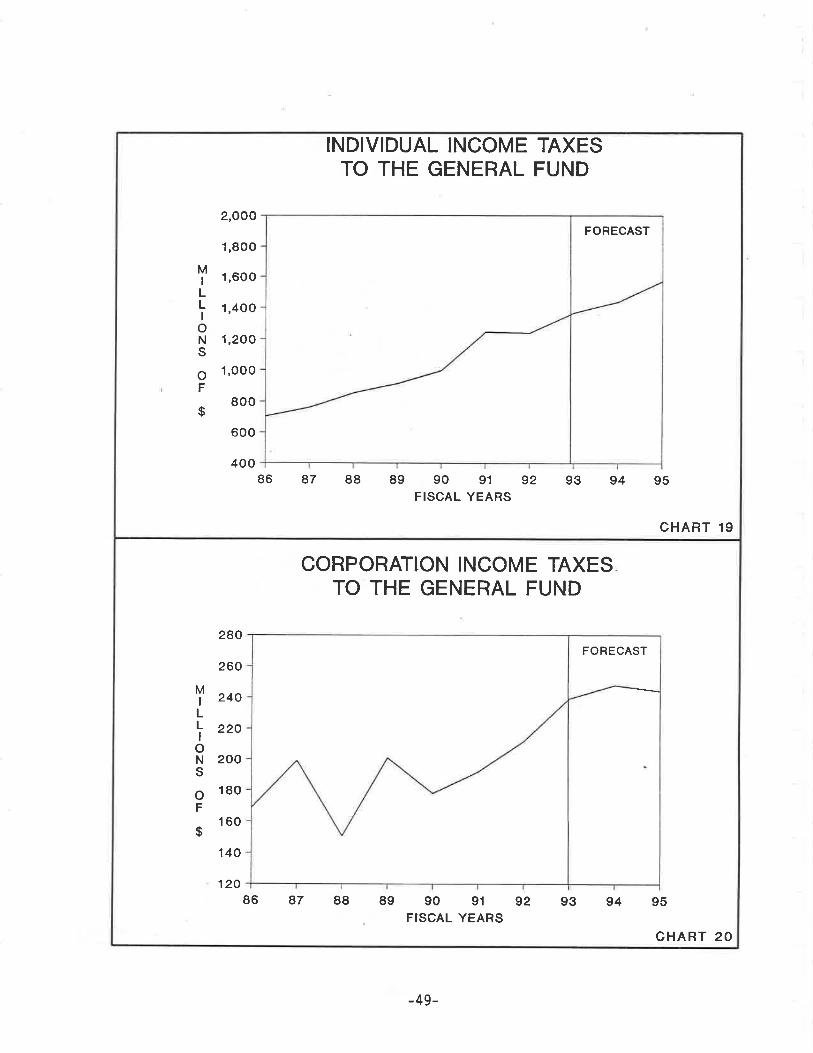
CORPORAT]ON INCOME TAXESTO THE GENERAL FUND
MI
LLI
oNs
oF
$
280
260
240
220
200
180
160
140
12090 91
FISCAL YEARS92 93 94 95
FORECAST
86 87 88 89
CHART 20
INDIVIDUAL INCOME TAXESTO THE GENERAL FUND
MI
LLI
oNs
oF
$
2,OOO
1,800
1,600
1,400
1,200
1,OO0
800
600
40086 87 88 89 90 91
FISCAL YEARS92 93 94 95
CHART 19
FORECAST
-49-
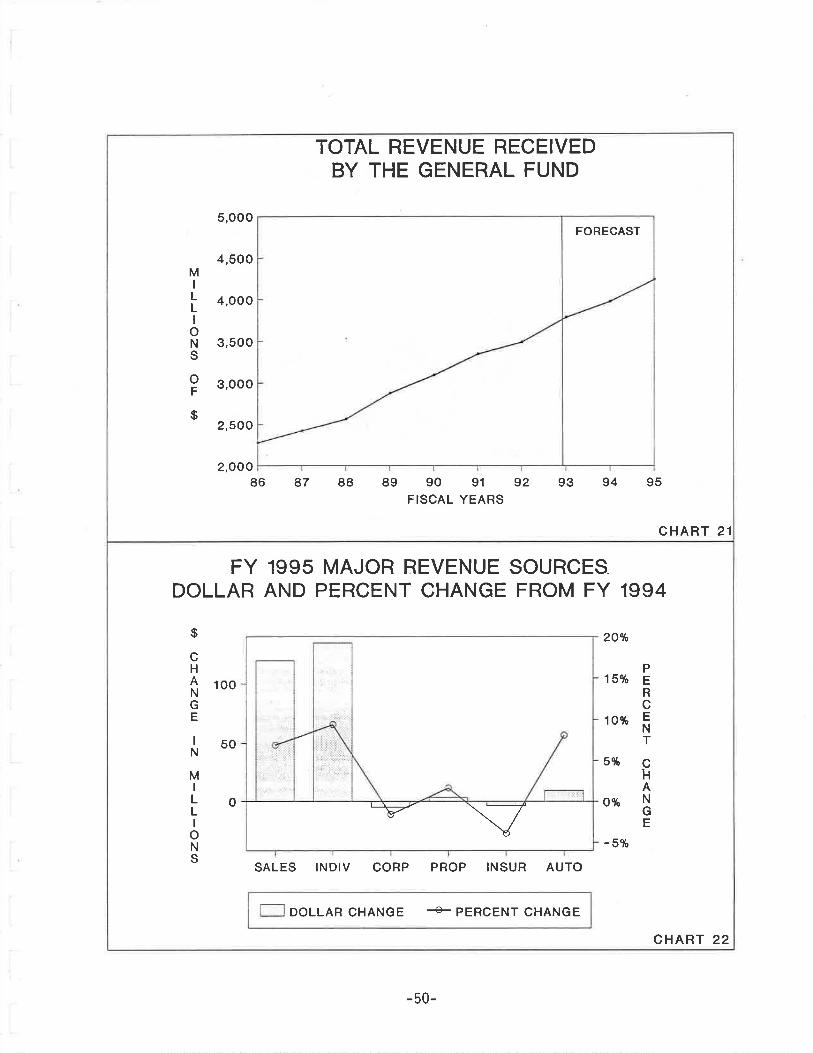
TOTAL REVENUE RECEIVEDBY THE GENERAL FUND
5,000
4,500MI
LLI
oNS
oF
$
4,000
3,500
3,000
2,500
2,00086 87 88 89 90 91
FISCAL YEARS92 93 94 95
CHART 21
FORECAST
FY 1995 MAJOR REVENUE SOURCESDOLLAR AND PERCENT CHANGE FROM FY 1994
$
cHANGE
I
N
MI
LLI
oNS
20%
100 15%PERcENT
cHANGE
10%
50
0
5%
0%
-5%
SALES INDIV CORP PROP ¡NSUR AUTO
DOLLAR CHANGE + PERCENT CHANGE
.iiii,iiliiii;.i.:\
vÈ"
CHART 22
-50-
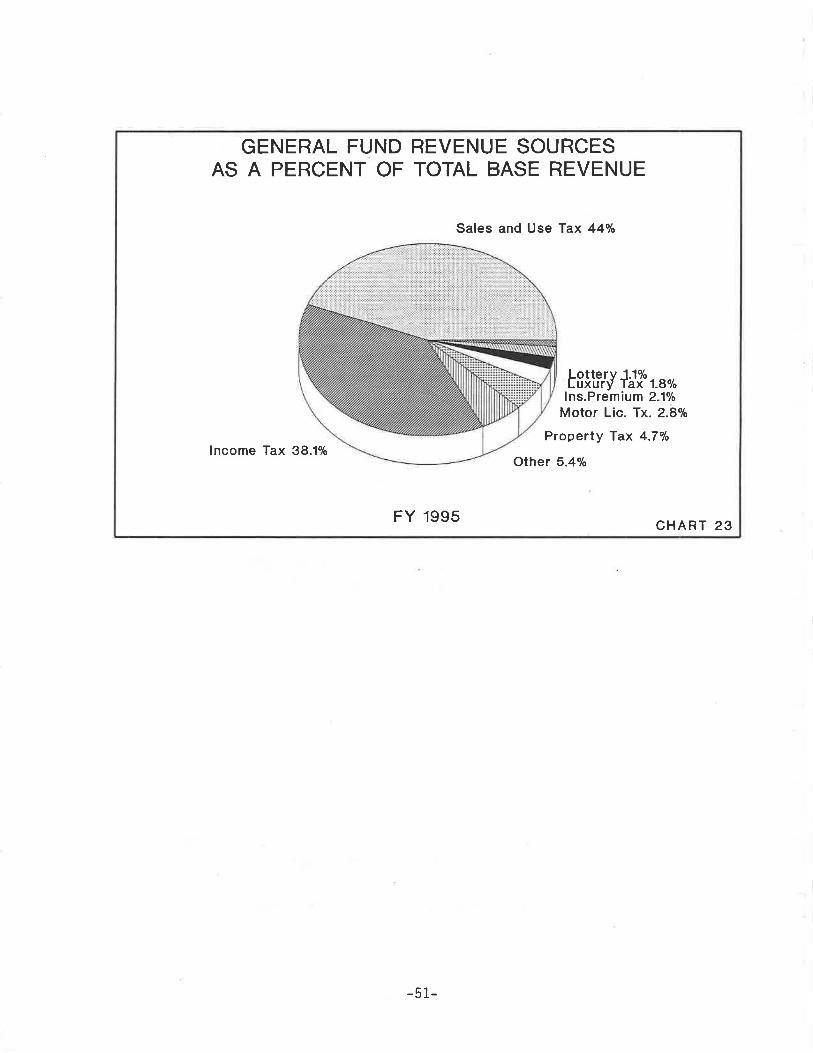
GENERAL FUND REVENUE SOURCESAS A PERCENT OF TOTAL BASE REVENUE
Sales and Use Tax 44olo
Lotterv 1.1oloLuxurj Tax 1.8%lns.Premium 2.1%
Motor Lic. Tx. 2.8%
Property Tax 4.7o/olncome Tax 38.1%
Other 5.49o
FY 1995 CHART 23
-51-

ARIZONA'S BUDGET STABILIZATION FI]I\D
Background
Arizona is one of the most recent states to join the majority of states (roughly 40) toimplement some form of a "Rainy Day Fund." Ttre Budget Stabilization Fund @SF) forArizona was passed during the 1990 Third Special Session (A.R.S. $ 35-1¿14). The fund is aseparate account administered by the State Treasurer, who is reqponsible for transferringGeneral Fund money into and out of the BSF as required by law. The BSF is designed to setrevenue aside during times of above-trend economic growth and to qpend this revenue duringtimes of below-trend growth. It is designed to provide revenue stabilization across a tlpicalbusiness cycle. Under the economic formula which drives the Budget Stabilization Fund, thefirst payment into the fund is required in the current frscal year (FY 1994).
The Arizona BSF is not intended to finance the state during a major national recession, but isintended to dampen the "stop-go" or "tax-qpend-cut" cycle that has become a recurringphenomena in the Arizona state budget p¡ocess like many other states. This occurs when anational or regional recession, or even a slowing in the state economy reduces annualrevenues below projections or drives expenditures above appropriations. This causes eithermid-year budget cuts and/or certain state tax increases in the following legislative session.After the economy improves and state revenue starts growing at a faster rate, new programsare initiated or taxes are cut. This, in turn, exacerbates the budgetary shortfall during thenext downfurn.
The principle behind Arizona's formula-driven budget stabilization fund is to mirror changesin the growth cycle of the Arizona economy. State economic history has shown that whenthe Arizona economy has expanded rapidly, the tot¿l state personal income was one of thebest measures of that growth.
The Formula
The determination of the amount to be appropriated to (deposit) or transferred out(withdrawal) of the Budget Stabitization Fund is made using a formula based upon annualpersonal income (excluding transfer payments) and adjusted for inflation. Essentially, whenannual growth is above trend monies are deposited into the BSF, whereas, when growth isbelow trend monies are withdrawn from the BSF.
The Arizona Economic Estimates Commission (EEC) determines the annual growth rate ofinflation-adjusted total state personal income, the trend growth rate over the past 7 years, andthe required appropriation to or transfer from the BSF. The EEC reports this calculation forthe prior calenda¡ year in the April-May timeframe.
Key features of the Arizona BSF can be summa¡ized as follows:
o The deposit into the BSF (or withdrawal from the BSF) for a given fiscal year isdetermined by comparing the annual growth rate of inflation adjusted Arizona PersonalIncome (AZPD for the calendar year ending in the fiscal year to the trend growth rate ofinflation adjusted AZPI for the most recent 7 years (see Chart 24).
-52-

o If the annual gowth rate exceeds the trend growth rate, the excess multþlied by GeneralFund revenue of the prior f,rscal year would equal the amount to be deposited into the BSF(see Chart 25).
o If the annual growth rate is less than the trend growth rate, the deficiency when multþliedby the General Fund revenue of the prior fiscal year would equal the amount to bewithdrawn from the BSF (see Chart 25).
. By a two-thirds majority, the I-egislature, with the concurrence of the Governor, candecrease a deposit or increase a withdrawal.
Simulated Results
Chart 24 shows the growth of real Arizona Personal Income over a l8-year period. Theannual changes are compared to the trend-growth using a moving 7-year average. Usingactual data for the growth of personal income until CY 1992 and fo¡ecasts thereafter, thisBudget St¿bilization Fund simulation shows what would have occurred and what can beexpected.
Deposits to the BSF (would have) occurred when the growth rate was above the 7-yearmoving average of real personal income growth (the unshaded areas). Withdrawals happenwhen real annual personal income growth is less than the 7-yea average (the shaded areas).
The results of the simulation are shown in the chart below. Not surprisingly, periods ofdeclining personal income growth were also periods when the state revenue growth ratedeclined and demands for state services soared. The availability of a BSF at these timeswould have made a positive contribution to state revenue until more normal economic growthresumed. The simulation suggests that the BSF will work as intended if the'formula isadhered to by the Iægislature and Governor.
As of this date, the A¡izona economy is "gathering steam" and the JLBC Staff forecasts thatCY 1993 and CY 1994 wilt be "above-trend" growth years, with real growth of 2.45% and4.89Vo, reqpectively. These increases arc 0.75% and3.I5% above trend for those years andwill dictate an initial deposit into the BSF in FY 1994 of $28.4 million, followed by adeposit of $123.6 million in FY 1995. The required FY 1994 deposit was not included inthe enacted budget last spring. Therefore, a supplemental appropriation will be necessaÐ/.
For calendaryear ending in fiscel year (e.g. - CY 1993 for Fy 1994)For prior fiscal year, excluding beginning balance.Average for 1987 through 1993.Average for 1988 through 1994.
TABLE 10
YearFiscal
$4-$l.l
Balance
19941995
InterestEarnines
R.eal Adju*ed A¡rnual 7-Year Average Excess GrorvthAZPI* Growth Growth or Shorrfall
F,STIMATED DEPOSITS TO BSF'FT Ú94 AND F'Y 1995
($ Mi[ions)
$3,784.8$3,923.9
Actuel FiscalRevenues**
$ 28.4$læ.6
Deposits/Withdrewals
$ 28.4$153.1
$45,7Æv7,975
2.45%4.89%
l.7o%+**1..14%+*+*
o.75%3.t5%
:¡*
***+
-53-
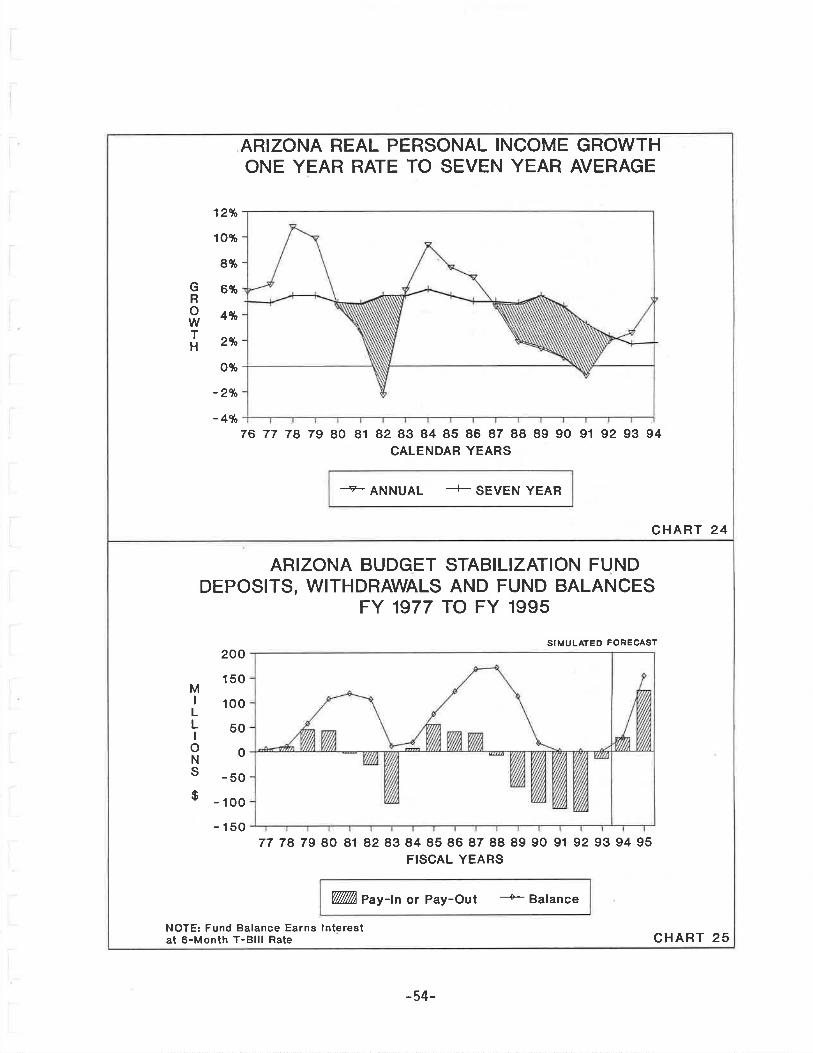
ARIZONA BUDGET STABILIZATION FUNDDEPOSITS, WITHDRAWALS AND FUND BALANCES
FY 1977 TO FY 1995
SIMULATÊD FORECAST
MI
LLI
oNS
$
200
150
100
50
0
-50
- 100
- 15077 78 79 80 81 82 83 84 85 86 87 88 89 90 91 92 93 94 95
FISCAL YEARS
V77V7Àeay-ln or Pay-Out + Balance
NOTE: Fund Balance Earns lnterestat 6-Month T-Blll Rate CHART 25
ARIZONA REAL PERSONAL INCOME GROWTHONE YEAR RATE TO SEVEN YEAR AVERAGE
GRoWTH
12%
10%
8%
6%
4%
2%
o%
-2%
-4%76 77 78 79 80 81 82 83 84 85 86 87 88 89 90 91 92 93 94
CALENDAR YEARS
+ ANNUAL +- SEVEN YEAR
CHART 24
-54-
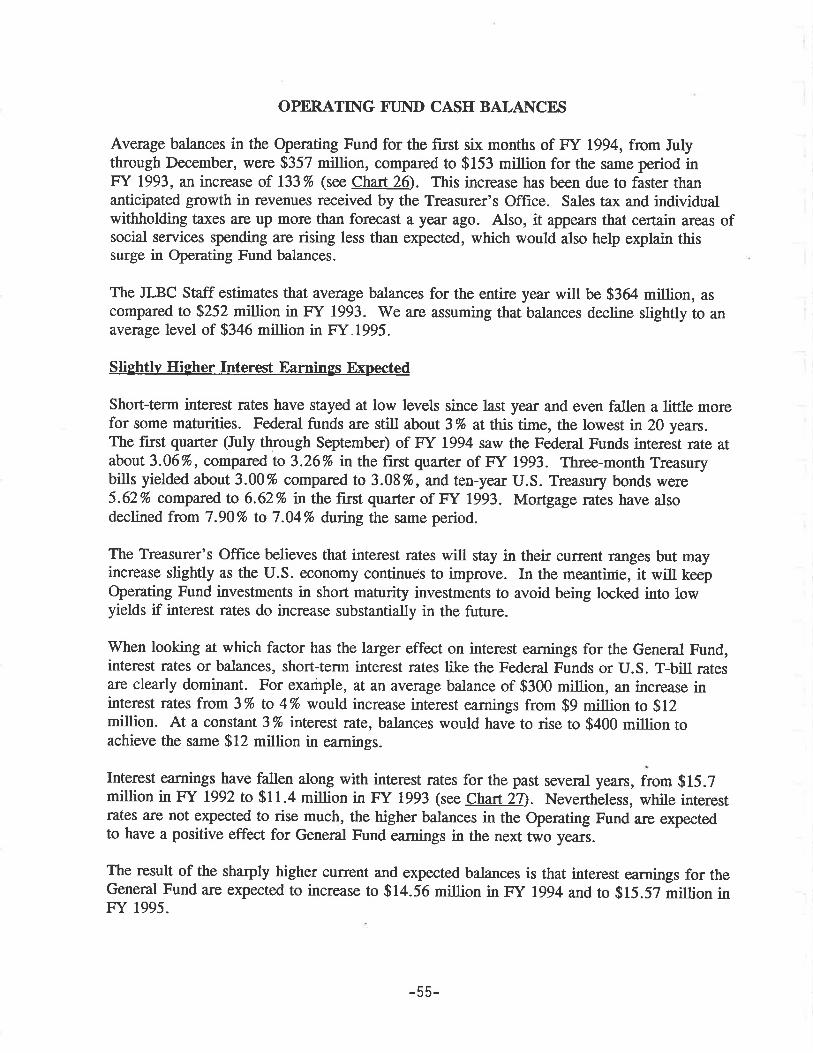
OPERATING FT]I\D CASH BALANCES
Average balances in the Operating Fund for the fust six months of FY 1994, from Julythrough December, were $357 millie¡, compared to $153 million for the same period inFY 1993, an increase of 133% (sen Chart 2ô. This increase has been due to faster thananticipated growth in revenues received by the Treasurer's Office. Sales tax and individualwithholding taxes ¿ue up more than forecast a year ago. Also, it appears that certain areas ofsocial services spending are rising less than expected, which would also help explain thissurge in Operating Fund balances.
The JLBC Staff estimates that average balances for the entire year will be $364 million, ascompared to $252 million in F"f 1993. We are assuming that balances decline slightly to anaverage level of $346 million in FY.1995.
Slightly Higher Interest Earnings Expected
Short-term interest rates have stayed at low levels since last year and even fallen a little morefor some maturities. Federal funds are still about 3% at this time, the lowest :rr-20 years.The first quarter (July through September) of F:Y 1994 saw the Federat Funds interest rate atabout 3.06%, compared to 3.26% in the first quarter of FY 1993. Three-month Treasurybills yielded about 3.00% compared to 3.08 %, and ten-year U.S. Treasury bonds were5.62% compared to 6.62% n the first quarter of FY 1993. Mortgage rates have alsodeclined from 7.90% to 7.04% during the same period.
The Treasurer's Office believes that interest rates will stay in their current ranges but mayincrease slightly as the U.S. economy continues to improve. In the meantinie, it will keepOperating Fund investments in short maturity investments to avoid being locked into lowyields if interest rates do increase substantially in the future.
When looking at which factor has the larger effect on interest earnings for the General Fund,interest rates or balances, short-term interest rates like the Federal Funds or U.S. T-bill ratesare clearly dominant. For example, at an average balance of $300 million, an increase ininterest rates from 3% to 4% would increase interest earnings from $9 millisn to $12million. At a constant 3% tnterest rate, balances would have to rise to $400 million toachieve the same $12 million in earnings.
Interest earnings have fallen along with interest rates for the past several years, from $15.7million in FY L992 to $11.4 millis¡ in FY 1993 (see Chaft27). Nevertheless, while interestrates a¡e not expected to rise much, the higher balances in the Operating Fund are expectedto have a positive effect for General Fund earnings in the next two years.
The result of the sharply higher current and expected balances is that interest earnings for theGeneral Fund are expected to increase to $14.56 million in FY 1994 and to $15.57 million inFY 1995.
-55-

INTEREST EARNINGS AND THE FEDERAL FUNDSRATE
40 10%
8%
6%
4%
2%
0%
MI
LLI
oNs
of
$
30
FED
FUNDs
RATE
20
10
01987 1988 1989 1990 1991 1992 1993 1994E1995E
FISCAL YEAR
N e¡nrulxes + FED FUNDS
FORECAST
CHART 27
OPERATING FUNDAVERAGE MONTHLY INVESTED BALANCES
FY 1992 through FY 1994 YTD
MI
LLI
oNs
oF
$
500
4 00
30
20
o
0
100
o
Í-l gttgz VllTnh gztgs, I ggrg¿
CHART 26
Avg
223252357
June
213
416
May
177
373
Apr
170
312
Mar
225350
Feb
283359
Jan
274304
I
Dec
230182467
Nov
209127
383
Oct
168
116
339
Sept
234139
341
Aug
259171
284
liì
July
236185
329
91/9292t9393194
-56-