Fusion of hyperspectral and panchromatic images using multiresolution analysis and nonlinear PCA...
17
Licciardi et al. EURASIP Journal on Advances in Signal Processing 2012, 2012:207 http://asp.eurasipjournals.com/content/2012/1/207 RESEARCH Open Access Fusion of hyperspectral and panchromatic images using multiresolution analysis and nonlinear PCA band reduction Giorgio Antonino Licciardi 1* , Muhammad Murtaza Khan 2 , Jocelyn Chanussot 1 , Annick Montanvert 1 , Laurent Condat 1 and Christian Jutten 1 Abstract This article presents a novel method for the enhancement of the spatial quality of hyperspectral (HS) images through the use of a high resolution panchromatic (PAN) image. Due to the high number of bands, the application of a pan-sharpening technique to HS images may result in an increase of the computational load and complexity. Thus a dimensionality reduction preprocess, compressing the original number of measurements into a lower dimensional space, becomes mandatory. To solve this problem, we propose a pan-sharpening technique combining both dimensionality reduction and fusion, making use of non-linear principal component analysis (NLPCA) and Indusion, respectively, to enhance the spatial resolution of a HS image. We have tested the proposed algorithm on HS images obtained from CHRIS-Proba sensor and PAN image obtained from World view 2 and demonstrated that a reduction using NLPCA does not result in any significant degradation in the pan-sharpening results. Introduction Generally, for satellite images, the highest spatial res- olution is captured by the panchromatic (PAN) image. However the drawback of the PAN image is that it has no spectral information beyond that which is averaged within the bandpass of the PAN image. Unlike a PAN image, multispectral (MS) and in particular hyperspec- tral (HS) satellite images cover a wider spectral range with moderate to high resolution. However, as compared to MS images, HS images have a better spectral resolution, that may result in a very high number of bands having low spatial resolution. For better utilization and interpre- tation, HS images having both high spectral and spatial resolution are desired. This can be achieved by making use of a high spatial resolution PAN image along with low resolution HS images in the context of pan-sharpening. Pan-sharpening, or image fusion, is the process of improving the spatial quality of a low spatial resolution image (HS or MS) by fusing it with a high resolution PAN image [1,2]. One of the main challenges in image fusion is to improve the spatial resolution i.e. spatial details, while *Correspondence: [email protected] 1 GIPSA-lab, CNRS, University of Grenoble, Grenoble, France Full list of author information is available at the end of the article preserving the original spectral information. This requires addition of spatial details to each band of the image. Due to the high number of bands the pan-sharpening of HS images results in an increased computational load and complexity. Thus a dimensionality reduction prepro- cess, compressing the original number of measurements into a lower dimensional space, becomes mandatory [3]. Among image fusion methods, the most popular are those based on the substitution approach, such as intensity-hue- saturation transformation (IHS) and principal component analysis (PCA) [4]. Among these, PCA approaches are commonly applied to HS images. PCA approaches are based on the assumption that the first principal compo- nent PC collects the information that is common to all the bands. The fusion is achieved by substituting the first PC band with the PAN image, whose histogram has pre- viously been matched with that of PC band. In this way the spatial information is encapsulated in the histogram matched PAN image, while the spectral information that is specific to each spectral band is contained in the other principal components. In this case the dimensionality reduction is performed discarding the less relevant princi- pal components. This means that the image resulting from © 2012 Licciardi et al; licensee Springer. This is an Open Access article distributed under the terms of the Creative Commons Attribution License (http://creativecommons.org/licenses/by/2.0), which permits unrestricted use, distribution, and reproduction in any medium, provided the original work is properly cited.
-
Upload
grenoble-inp -
Category
Documents
-
view
1 -
download
0
Transcript of Fusion of hyperspectral and panchromatic images using multiresolution analysis and nonlinear PCA...

Licciardi et al. EURASIP Journal on Advances in Signal Processing 2012, 2012:207http://asp.eurasipjournals.com/content/2012/1/207
RESEARCH Open Access
Fusion of hyperspectral and panchromaticimages using multiresolution analysis andnonlinear PCA band reductionGiorgio Antonino Licciardi1*, Muhammad Murtaza Khan2, Jocelyn Chanussot1, Annick Montanvert1,Laurent Condat1 and Christian Jutten1
Abstract
This article presents a novel method for the enhancement of the spatial quality of hyperspectral (HS) images throughthe use of a high resolution panchromatic (PAN) image. Due to the high number of bands, the application of apan-sharpening technique to HS images may result in an increase of the computational load and complexity. Thus adimensionality reduction preprocess, compressing the original number of measurements into a lower dimensionalspace, becomes mandatory. To solve this problem, we propose a pan-sharpening technique combining bothdimensionality reduction and fusion, making use of non-linear principal component analysis (NLPCA) and Indusion,respectively, to enhance the spatial resolution of a HS image. We have tested the proposed algorithm on HS imagesobtained from CHRIS-Proba sensor and PAN image obtained from World view 2 and demonstrated that a reductionusing NLPCA does not result in any significant degradation in the pan-sharpening results.
IntroductionGenerally, for satellite images, the highest spatial res-olution is captured by the panchromatic (PAN) image.However the drawback of the PAN image is that it hasno spectral information beyond that which is averagedwithin the bandpass of the PAN image. Unlike a PANimage, multispectral (MS) and in particular hyperspec-tral (HS) satellite images cover a wider spectral range withmoderate to high resolution. However, as compared toMS images, HS images have a better spectral resolution,that may result in a very high number of bands havinglow spatial resolution. For better utilization and interpre-tation, HS images having both high spectral and spatialresolution are desired. This can be achieved by makinguse of a high spatial resolution PAN image along with lowresolution HS images in the context of pan-sharpening.Pan-sharpening, or image fusion, is the process of
improving the spatial quality of a low spatial resolutionimage (HS or MS) by fusing it with a high resolution PANimage [1,2]. One of the main challenges in image fusion isto improve the spatial resolution i.e. spatial details, while
*Correspondence: [email protected], CNRS, University of Grenoble, Grenoble, FranceFull list of author information is available at the end of the article
preserving the original spectral information. This requiresaddition of spatial details to each band of the image.Due to the high number of bands the pan-sharpeningof HS images results in an increased computational loadand complexity. Thus a dimensionality reduction prepro-cess, compressing the original number of measurementsinto a lower dimensional space, becomes mandatory [3].Among image fusion methods, the most popular are thosebased on the substitution approach, such as intensity-hue-saturation transformation (IHS) and principal componentanalysis (PCA) [4]. Among these, PCA approaches arecommonly applied to HS images. PCA approaches arebased on the assumption that the first principal compo-nent PC collects the information that is common to allthe bands. The fusion is achieved by substituting the firstPC band with the PAN image, whose histogram has pre-viously been matched with that of PC band. In this waythe spatial information is encapsulated in the histogrammatched PAN image, while the spectral information thatis specific to each spectral band is contained in the otherprincipal components. In this case the dimensionalityreduction is performed discarding the less relevant princi-pal components. This means that the image resulting from
© 2012 Licciardi et al; licensee Springer. This is an Open Access article distributed under the terms of the Creative CommonsAttribution License (http://creativecommons.org/licenses/by/2.0), which permits unrestricted use, distribution, and reproductionin any medium, provided the original work is properly cited.

Licciardi et al. EURASIP Journal on Advances in Signal Processing 2012, 2012:207 Page 2 of 17http://asp.eurasipjournals.com/content/2012/1/207
the inverse transformation will not have the same infor-mation of the original one, resulting in a strong spectraldistortion. In this article, we propose a new approach toenhance the spatial resolution of a HS image combiningboth non-linear principal component analysis (NLPCA)and Indusion for dimensionality reduction and fusion,respectively. In particular NLPCA is applied to reprojectthe original data into a lower space, thus the derived non-linear principal components are then enhanced accord-ing to the Indusion process. Finally, the inverse NLPCAreprojects the enhanced components back to the originaldimensionality, resulting in a spatially enhanced HS imagehaving a similar spectral characteristic of the original one.The article is organized as follows. In Sections
“Dimensionality reduction” and “Image fusion” theNLPCA and Indusion are described, respectively. Section“Experimental results” presents experimental resultsobtained by applying the proposed approach to three dif-ferent datasets, while conclusions are drawn in Section“Conclusion”.
Dimensionality reductionThe main difficulty in processing HS images is that thenumber of bands can vary from several tens to sev-eral hundreds. Applying a pan-sharpening technique toeach band of the HS image, can lead to a dramaticincrease of the computational time of the entire pro-cess. Hence, while enhancing the spatial resolution of aHS image, it is generally desirable to reduce the num-ber of bands. Another important property is that thereduction method should allow a complete reconstruc-tion of the original spectral information content. Conse-quently, the dimensionality reduction should seek to avoidloosing relevant spectral information from the originaldataset.In the literature, many methods have been developed
to tackle the issue of high dimensionality of HS data[5]. Summarizing, we may say that dimensionality reduc-tion methods can be grouped into two classes: “feature-selection” algorithms (which suitably select a sub-optimalsubset of the original set of features while discarding theremaining ones) and “feature extraction” by data trans-formation (which projects the original feature space ontoa lower dimensional subspace that preserves most of theinformation) [6].Feature selection techniques can be generally consid-
ered as a combination of both a search algorithm and acriterion function [7-11]. The solution to the feature selec-tion problem is offered by the search algorithm, whichgenerates a subset of features and compares them on thebasis of the criterion function. On the other hand, featureextraction techniques seek to reduce the dimensionality ofthe data by mapping the feature space onto a new lower-dimensional space. While feature selection is a more
simple and direct approach, feature extraction methodscan be more effective in representing the informationcontent in a lower dimensionality domain. Neverthelessthe loss of information derived from a feature selectionapproach does not allow a good reconstruction of theoriginal dataset. For this reason it is not recommended tointegrate feature selection methods into pan-sharpeningprocesses.The most common techniques to reduce the number
of bands are the minimum noise fraction (MNF) trans-form, where an operator calculates a set of transformedfeatures according to a signal-to-noise ratio optimizationcriterion, PCA, where a set of uncorrelated transformedfeatures is generated and also independent componentanalysis (ICA), where a computational method for sepa-rating a multivariate signal into additive subcomponentssupposing the mutual statistical independence of the non-Gaussian source signals [12,13]. For these techniques, thedimensionality reduction is performed by discarding thecomponents with the lowest information content. Also,for these techniques, the components obtained are lin-early uncorrelated but the physical representation of theimage may be lost. Moreover, being linear methods, ICA,PCA and MNF assume that the observed data set is com-posed of linear combinations of certain basis. In [14,15], ithas been demonstrated that the nonlinear version of thecommon PCA, namely kernel PCA (KPCA) is capable ofcapturing part of the high order statistics, thus providingmore information from the original data set than the PCA.In this case, the dimensionality reduction is once againperformed by discarding the less relevant components.Other approaches, are based upon the characteristic of HSimages having adjacent bands that are spectrally highlycorrelated [7,8].In this article, we propose to perform the dimensional-
ity reduction by using NLPCA, commonly referred to asnonlinear generalization of standard PCA.Non-linear principal component analysis, originally
introduced by Kramer [16], is based on multi-layer per-ceptrons (MLP) commonly referred to as autoassociativeneural network (AANN) or as autoencoder [17,18]. TheAANNs areNNs of a conventional type, i.e. featuring feed-forward connections and sigmoidal nodal transfer func-tions, trained by backpropagation or similar algorithms.The particular network architecture used employs threehidden layers, including an internal bottleneck layer ofsmaller dimension than either the input or the output(Figure 1). The network is trained to perform identitymapping, where the input x has to be equal to the out-put x̂. Training an AANN is not an easy task because ofthe bottleneck layer where the data have to be projectedor compressed into a lower dimensional space Z. Sincethere are fewer units in the bottleneck layer than the out-put, the bottleneck nodes must represent or encode the

Licciardi et al. EURASIP Journal on Advances in Signal Processing 2012, 2012:207 Page 3 of 17http://asp.eurasipjournals.com/content/2012/1/207
Figure 1 Auto-associative neural networks scheme used for feature reduction.
information obtained from the inputs for the subsequentlayers to reconstruct the input.The AANN, as shown in Figure 2, can be divided into
two parts: the first part represents the encoding or extrac-tion function Fencode : X → Z, while the second partrepresents the inverse function, called decoding functionFdecode : Z → X̂. After the training of the AANN theNLPCs can be extracted from the extraction subnet, whilethe reconstruction can be performed by the decodingsubnet. A topology with three hidden layers enables theAANN to perform non-linear mapping functions. In fact,if we design an AANN with only one hidden layer of lin-ear nodes, the projection into the Z-dimensional subspacewould correspond exactly to linear PCA. Also if the acti-vation functions in the bottleneck nodes were sigmoidal,the projection into the sub-space would still be severelyconstrained; only linear combinations of the inputs com-pressed by the sigmoid into the range [−1, 1] could berepresented. Therefore the performance of an AANNwithonly one internal layer of sigmoidal nodes is often no bet-ter than linear PCA [81]. The proposed AANN algorithmscan be trained by minimizing the sum-of-squares error ofthe form:
E = 12
N∑
n=1
d∑
k=1{yk(xn) − xnk}2 (1)
where yk(k = 1, 2, . . . , d) is the output vector. The non-linear activation function σ(x) can be any continuous andmonotonically increasing function with σ(x) → 1 as x →+∞ and u(x) → 0 as x → −∞. In this article the chosenfunction is the sigmoid and is applied elementwise:
σ(x) = 11 + e−x (2)
One of the main tasks designing the AANN is the selec-tion of the number of nodes in the hidden layers and inparticular in the bottleneck layer that minimizes the lossof information of the entire network. This problem hasbeen solved by a grid search algorithm that varies recur-sively the number of nodes and evaluates the respectiveerror. The topology with the lowest error is then selected.A general evaluation of the performance of this method, interms of time and memory, cannot be addressed becauseit is mainly dependent on the number of nodes of the net-work considered in each iteration. However usually eachiteration of the grid search required an average time that isless than a minute, resulting in a computational time thatwas less than 10min for each of the experiments describedin the following sections.Compared to linear reduction techniques, NLPCA has
many advantages. First of all, while PCA and MNF candetect and discard linear correlations among spectral

Licciardi et al. EURASIP Journal on Advances in Signal Processing 2012, 2012:207 Page 4 of 17http://asp.eurasipjournals.com/content/2012/1/207
Figure 2 The two subnets performing the encode (left) and the decode (right) functions.

Licciardi et al. EURASIP Journal on Advances in Signal Processing 2012, 2012:207 Page 5 of 17http://asp.eurasipjournals.com/content/2012/1/207
bands, NLPCA detects both linear and nonlinear cor-relations. In this case the dimensionality reduction isperformed by discarding the less relevant components,meaning that the reconstruction of the original imagewould be extremely affected in terms of loss of informa-tion. Moreover the first PCA usually retains informationfrom all the original spectral bands, meaning that it mayinclude features within the spectral bandpass of the PANimage and will thus result in strong spectral distortions.On the other hand, the information content in the NLPCsis somehow focused on relevant spectral signatures. Forinstance, in a HS image acquired on a landscape withwater, vegetation and manmade structures, one of thederived NLPCs will contain all the information relatedto the vegetation, while another one will have only infor-mation about water surfaces. This allows NLPCA to besignificantly more effective than PCA or MNF in theinverse operation of reconstruction of the original spec-tral information [19]. Results similar to NLPCA can beobtained through the use of KPCA, however, as for thelinear approaches, also in this case the dimensionalityreduction is performed by discarding less relevant com-ponents. This let the NLPCA to be preferred for thedimensionality reduction processing [15].In this article we propose the use of NLPCA for dimen-
sionality reduction. The NLPCs obtained from the extrac-tion function will be used as input for the pan-sharpeningtask. After enhancing the NLPCs, the enhanced HSimage is eventually obtained with the decoding subnet ofthe AANN.
Image fusionThe fusion of HS and PAN images is a useful techniquefor enhancing the spatial quality of low-resolution HSimages. Generally, the fusion process can be subdividedinto two steps. In the first step, the low resolution imageis scaled up to the same size as the PAN image. Next,fusion is achieved by adding high-frequency content of thePAN image to theHS image. Literature on pan-sharpeningmethods is rich with diversity, encompassing methodsbased upon the use of discrete wavelet transform (DWT)[20,21], Laplacian Pyramids [22], PCA transform [4], andIHS transform [23]. The latter two methods fall in thecategory of component substitution method and result infused images having high spatial quality but suffering fromspectral distortions [24,25]. The images fused using DWTor Laplacian Pyramid based methods are not as sharp ascomponent substitution methods but they are spectrallyconsistent [24].In this article, we propose to use Indusion for pan-
sharpening. Introduced in [26], Indusion is a pan-sharpening approach derived from the Induction scalingtechnique. The Induction technique, considers enlarge-ment as the inverse problem of reduction. This yields the
condition that an enlarged image should, when reduced,give the initial image back. This condition is called thereduction constraint. Assuming I as the original image andR the reduction filter, with a reduction ratio a so that theupscaled image is I1/a, the reduction constraint can bewritten as:
[I1/a ∗ R
] ↓ a = I. (3)
For a given image and a reduction filter, there is a set ofenlarged images, called the induced set, that verifies thereduction constraint, and is defined as:
�I = {X |[X ∗ R]↓ a = I}. (4)
Induction, initially developed for image magnification[27], simply consists of projecting an upscaled image J,not adhering to the reduction constraint, onto the inducedset � so as to obtain an induced image K that belongs tothe induced set. Indusion process, deriving its name fromInduction and Fusion, defines the induced image as:
K = J−[ J ∗ R]↓ a ↑ a ∗ A+[ I]↑ a ∗ A. (5)
Where R and A are the Cohen–Daubechies–Fauveau(CDF) 9/7 tap bi-orthogonal filter pair, respectively [28],and J is the upscaled version of the initial image I that doesnot adhere to the reduction constraint.Applied to remote sensing, the concept of image fusion
consists in the extraction of the high-frequency informa-tion from the PAN image and adding it to the upscaledlow-resolution image. The idea of Indusion is to replacethe unconstrained upscaled image by the PAN imagesince, we want the high-frequency information of the PANimage to be added to the upscaled NLPCA image obtainedfrom the original HS dataset.
K = PAN−[ [ PAN ∗ R]↓ a]↑ a ∗ A+[ I]↑ a ∗ A. (6)
The Indusion algorithm has been successfully testedon true and simulated images [26]. The main intent ofthis article is to evaluate the effectiveness of the Indu-sion approach combined with a NLPCA dimensionalityreduction applied to HS images. In particular the origi-nal HS image is reduced in dimensionality by means ofNLPCA, resulting in few nonlinear principal components.Then according to the above described Indusion methodthe high resolution spatial details contained in the PANimage are injected into the nonlinear components. Finallythe spatially enhanced components are reprojected backto the original space using the inverse NLPCA. The resultis a spatially enhanced HS image having the same spectralcharacteristics as the original one.The implementation of the proposed algorithm is as
follows.
1. Design/training of the AANN (selection of thebest topology);

Licciardi et al. EURASIP Journal on Advances in Signal Processing 2012, 2012:207 Page 6 of 17http://asp.eurasipjournals.com/content/2012/1/207
2. Extraction of the NLPCs through the encodingfunction;
3. Downscaling of the PAN image using CDF9 filter tofit the size of the NLPCs;
4. Perform histogram matching between thedownscaled PAN and the NLPCs;
5. Upscale the NLPCs and the histogram matchedPAN using CDF7 filter;
6. Perform histogram matching between the originalPAN and the upscaled NLPCs;
7. Obtain the difference between histogram matchedoriginal PAN and the histogram matched upscaledPAN;
8. Add the previously obtained difference to theupscaled NLPCs;
9. Reconstruction of the original spectral bandsthrough the decoding function.
A complete scheme of the method is depicted in Figure 3.
Experimental resultsIn this article the proposed method was applied to threedifferent images having increasing complexity. In Section“WorldView-2 dataset”, we discuss the results of apply-ing the Indusion approach to a WorldView-2 dataset to
assess the accuracy of the fusion method. In Section“CHRIS-Proba dataset”, the NLPCA+ Indusion approachis discussed in the context of the fusion of a CHRIS-Probadataset and a QuickBird PAN image. The last sectionevaluates the reduction-fusion algorithm on a Hyperionimage. While the enlargement of a MS image such asprovided by WorldView-2 satellite, can be an easy task,pan-sharpening of HS imagery can be more complex notonly because of the huge number of HS bands, but alsobecause the spectral coverage of the PAN image does notmatch the wavelength acquisition range of the HS bands.Moreover a difference between the WorldView-2 datasetand the CHRIS-proba and Hyperion datasets is that forthe latter two datasets the PAN image has been acquiredby a different satellite sensor i.e. QuickBird, having differ-ent acquisition dates and geometry. A test of the spectralfidelity of the fusion process is introduced using PANimages not covering the spectral range of the HS bands,and this is verified by pan-sharpening CHRIS-proba andHyperion images using a PAN image from the QuickBirdsensor.Once the pansharpened images have been obtained, the
next phase is their quality assessment. Evaluating the qual-ity of a fusion process is not a trivial task. For the quanti-tative quality assessment, it is generally recommended to
Figure 3 Complete flowchart of the fusion process.

Licciardi et al. EURASIP Journal on Advances in Signal Processing 2012, 2012:207 Page 7 of 17http://asp.eurasipjournals.com/content/2012/1/207
make use of the synthesis property as proposed by Wald[1]. This means that both the HS and the PAN images aredegraded to a lower resolution and then pan-sharpeningis performed. This is done so that the resultant pansharp-ened image is at the same resolution as the starting refer-ence and hence statistical analysis can be made betweenthe reference and the pansharpened images. If the refer-ence image is at the same resolution as the fused image,we can perform universal image quality index (UIQI), rel-ative dimensional global error (ERGAS) and spectral anglemapper (SAM) calculations between the pansharpenedand the reference image [1,29]. UIQI can be seen as a ratiobetween the original image and the enhanced one, where1 is the ideal value. ERGAS and SAM will both producepositive values with an ideal value of 0. However, valuesthat are around 3 are referred to a good image enhance-ment. SAM is a useful measure of the spectral qualityintroduced by the fusion process, while ERGAS and UIQImeasure both spectral and spatial quality. On the otherhand, if we reduce our images to a lower resolution therewill be no significant information left in the images andhence the pansharpened images would not be at a goodresolution. For this reason a qualitative analysis, throughvisual inspection, will also be discussed without reduc-ing the spatial resolution of the images before the fusionprocess.
WorldView-2 datasetWorldView-2, launched October 2009, is a high-resolution 8-band MS satellite. WorldView-2 providesPAN and MS images at 50 cm and 2m spatial resolution,respectively. The spectral coverages are 450–800 nm forthe PAN images and 400–1,040 nm for the MS image.The image used in this experiment was collected overTor Vergata area, in the south-east part of Rome, Italy, onFebruary 2010. The landscape represented is diverse, withlarge pastures, industrial and dense urban areas.In this first experiment, we evaluate the quality of
the fusion method without any dimensionality reduction.This experiment aims to validate the ability of the Indu-sion technique for image enhancement and also to providea benchmark for the following experiments. Followingthe processing steps proposed in [26], the PAN image(Figure 4) is downscaled from 0.5 to 1m, and then from1 to 2m using CDF9 filter coefficient. In the same way,the reduced MS (Figure 5) is upscaled from 2 to 1m andagain from 1 to 0.5m pixel size with a CDF7 filter. Thenthe histogram of the PAN downscaled at 2m is matched tothe MS at 2m, resulting in eight histogram matched PANimages at 2m resolution. The same procedure is appliedbetween the PAN at 0.5m and the MS at 0.5m, producingeight histogram matched PAN images at 0.5m resolution.The set of eight histogram matched PAN images at 2m isthen upscaled back to 1m and then to 0.5m using CDF7
Figure 4WorldView-2 PAN band.
filter. Finally the difference between the two series of eighthistogram matched PAN images is added to the upscaledMS image.On a visual analysis, the fused images obtained from
the Indusion approach appear to be very sharp, as can beobserved comparing Figures 5 and 6. As for the quanti-tative analysis, the indices UIQI, ERGAS and SAM werecalculated and reported in Table 1. The results appear tobe very appreciable with values close to the optimum.
Figure 5 False color composite obtained combining NIR1, REDand GREEN bands of the original WorldView-2 image.

Licciardi et al. EURASIP Journal on Advances in Signal Processing 2012, 2012:207 Page 8 of 17http://asp.eurasipjournals.com/content/2012/1/207
Figure 6 False color composite obtained combining NIR1, REDand GREEN bands of the fusedWorldView-2 image.
CHRIS-Proba datasetIn the second test a CHRIS-Proba dataset and aQuickBirdPAN image at 1m have been used for testing the proposedfusion technique. The two datasets were acquired duringdifferent periods of 2006 over the Tor Vergata area, south-east of Rome, Italy.The PRoject for On Board Autonomy (PROBA) space-
craft is a mini-satellite operated by the European SpaceAgency. Themain payload of PROBA is the Compact HighResolution Imaging s Spectrometer (CHRIS) sensor whichcan acquire up to 63 spectral bands (400–1,050 nm) withnominal spatial resolutions of 17 or 34m at nadir, depend-ing on the acquisition mode. The CHRIS sensor acquiresdata in five different modes (aerosol, land cover, vegeta-tion and coastal zones), varying the number and locationof spectral bands, the spatial resolution and the width ofthe swath. Thus, the CHRIS-PROBA system acquires HSimages of the same scene with five different view anglesduring a single overpass: +55°, +36°, 0°, -36° and -55°. Totest the proposed approach a 0° image, acquired in Land-Cover mode (18 bands), was used. The spectral ranges ofthe two images are very similar, 438–1,035 nm for CHRISand 405–1,053 nm for the QuickBird-PAN, respectively.
Table 1 Quality indexes for the fusion process applied onWorldView-2
UIQI ERGAS SAM
Reference 1 0 0
Indusion 0.9891 2.6298 2.0500
Figure 7 False color composite of the original CHRIS-Probaimage obtained combining the 709nm 697nm and 668nmbands for R, G and B, respectively.
Also the angles of view of the two images are very simi-lar, thus avoiding any geometric or registration distortionsbetween the two images. The CHRIS image was atmo-spherically corrected and accurately co-registered to thePAN image for testing. In particular, the atmosphericcorrection consists of estimating the contribution of theatmospheric effects in terms of the total irradiance, thedirect and diffuse transmittance, and the radiance due to
Figure 8 PAN image used in the fusion process with theCHRIS-Proba image.

Licciardi et al. EURASIP Journal on Advances in Signal Processing 2012, 2012:207 Page 9 of 17http://asp.eurasipjournals.com/content/2012/1/207
Figure 9 False color composite of the fusion process obtainedcombining the 709nm 697nm and 668nm bands for R, G and B,respectively.
the scattering. The estimations have been produced start-ing from simulations carried out with the suite of librarieslibRadtran for the simulation of the radiative transfer bal-ance [30]. A subset of 216×216 pixels for the CHRIS imageand 864×864 for the PAN image was selected according tothe overlapping areas of the two acquisitions. To obtain anenlargement ratio of 4, that, respect to the description of
Figure 10 RGB composite obtained using the three originalNLPCs obtained from the CHRIS-Proba data.
Figure 11 RGB composite obtained using the three fused NLPCs.
the Indusionmethod, offers the best tradeoff between spa-tial enhancement and spectral distortion [26], the CHRISimage and the PAN image have been degraded to the spa-tial resolutions of 20 and 5m, respectively adhering to theconsistency criteria of quality assessment as proposed byWald [1].The dimensionality reduction phase was performed by
extracting the nonlinear principal components. To detectthe best topology configuration for the AANN, a grid-search approach is performed. The best solution wasfound with 18 inputs/output, 9 nodes both in the outerhidden layers and 3 nodes in the bottleneck. The meansquare error (MSE) obtained after 500 training cycles was0.003. The three NLPCs are then enhanced with a ratioof 4, following the Indusion approach, fusing them withthe PAN image. Figures 7, 8 and 9 report a false color
Table 2 Quality indexes for the proposed fusion processapplied on the entire CHRIS-Proba image (completeimage) and on three different land cover types (pasture,industrial and dense urban fabric)
UIQI ERGAS SAM
Reference 1 0 0
Indusion 0.9627 1.6798 2.3751
complete image 0.9229 2.6797 2.7413
Pasture 0.9373 2.2180 2.1511
Industrial 0.9313 2.2978 2.3871
Dense Urban fabric 0.8616 4.1971 3.9812
For sake of comparison, the quality indexes have been evaluated to the imageenhanced only by means of the Indusion approach, without any dimensionalityreduction preprocessing.

Licciardi et al. EURASIP Journal on Advances in Signal Processing 2012, 2012:207 Page 10 of 17http://asp.eurasipjournals.com/content/2012/1/207
Table 3 Quality indexes values for the reconstruction ofthe CHRIS-Proba image obtained by PCA and NLPCA,respectively
UIQI ERGAS SAM
Reference 1 0 0
NLPCA 0.9945 0.7953 0.8317
PCA 0.9903 1.0487 0.7467
representation of the original image, the panchromaticimage and of the fused image, respectively. Figures 10and 11 show a RGB composite obtained combining thethree NLPC from the original CHRIS-Proba image andthe result of the Indusion process applied to the threeNLPCs, respectively. The pansharpened image shown inFigure 9 is obtained by performing an inverse NLPCAprocess on the results shown in Figure 11.Also in this experiment, the qualitative analysis was
evaluated by visual inspection.While to better understandthe effectiveness of the proposed method, the quantita-tive analysis is carried out in three different ways. Firstlythe quality indexes are calculated to evaluate the ability ofAANN to reconstruct the original spectral bands after the
Figure 12 Detail of the false color composites of the originalimage and the enhanced one, obtained combining the 709nm697nm and 668nm bands for R, G and B, respectively.
reduction into three NLPCs. This means that the evalua-tion is performed between the original spectral bands andthe bands reconstructed considering the complete AANNtopology. A secondmeasurement is performed to evaluatethe accuracy of the fusion phase, comparing the originalNLPCs with the enhanced ones. Finally the quality indexesare calculated on the complete end-to-end process. Asreported in Table 2, the quality indexes are derived notonly for the entire scene but also for the different areas inthe image representing three main types (industrial build-ings, dense residential areas and pastures). For the sakeof comparison, Table 3 reports the quality index valuesfor a dimensionality reduction performed using the firstthree components of the PCA. The table clearly showsthat a comparison of pansharpened images with the ref-erence HS image reveals that all three SAM, ERGAS andUIQI values for the NLPCA and Indusion method are bet-ter than PCA based and Indusionmethod pan-sharpeningmethods.From a qualitative visual analysis, the fused image
obtained with the proposed approach appears to be verysharp and spectrally consistent with the original image.Also the quantitative analysis shows very good values forthe pan-sharpening image. It is important to notice that,despite having an overall good quality, the index valuesfor the Pasture and Industrial areas are very good, whilethe worst result was obtained on the dense urban fabric.This effect can be explained because of the different geom-etry of acquisition of the two images. In particular, thevery high reflectance values of industrial buildings, underdifferent illumination conditions, may result in spectral
Figure 13 Quality assessment areas noted in yellow, green andcyan for pasture, industrial and dense urban fabric, respectively.

Licciardi et al. EURASIP Journal on Advances in Signal Processing 2012, 2012:207 Page 11 of 17http://asp.eurasipjournals.com/content/2012/1/207
Table 4 RMSE, mean difference and Standard deviationcomputed between the values of original and enhancedspectra for three different test areas (Grassland: 20samples; Industrial: 8 samples; Residential: 12 samples)
Grassland Industrial Residential
RMSE 0.0539 0.1084 0.1474
Mean 0.1613 0.4193 0.2137
Std. Dev. 0.1437 0.0166 0.1658
distortions in the enlarged image. Another source of dis-tortion came from objects that are present only in oneof the two images due to different dates of acquisition.This is particularly clear for the burned areas and the carsin the parking lots, as depicted on Figure 12. Aside fromthe expected distortions introduced by errors in the reg-istration phase and differences in terms of angles of view,there are also other negative contributions introduced byobjects that are detected by the PAN image but not in theHS image and result in mixed spectral signatures. In this
case, even if the spectral signatures of small objects canbe identified in the low resolution HS image, it is still notpossible to determine their spatial distribution. A possiblesolution to this problem has been proposed in [31].A further quality assessment of the proposed approach
evaluates the spectral distortion introduced by the entireprocess. In particular, a comparison of the enhanced spec-tra with the original spectra has been made. In this casethe comparison was set up on three different areas rep-resenting, respectively an industrial building, a residentialbuilding and a grassland area, as reported on Figure 13.Analyzing the original and the enhanced spectra relatedto the grassland pixel, it can be noted that the pro-cess produced a spectrum very close to the original one.This accuracy can be quantified by the value of the rootmean square error (RMSE), the mean difference and thestandard deviation computed between the values of theoriginal and the enhanced spectra reported in Table 4.A similar result is obtained with the industrial buildingpixel. As for the residential building pixel, the comparison
Figure 14 Spectra of three different test areas: Grassland original spectrum (a) and enhanced spectrum (b), Industrial building originalspectrum (c) and enhanced spectrum (d), residential building spectrum (e) and enhanced spectrum (f).

Licciardi et al. EURASIP Journal on Advances in Signal Processing 2012, 2012:207 Page 12 of 17http://asp.eurasipjournals.com/content/2012/1/207
of the original and enhanced spectra shows a non perfectreconstruction (Figure 14). These spectral distortions canbe explained by the presence in the PAN image of fea-tures that are not detected by the HS image. In particular,the spectral signature of the grassland is almost the sameover the entire field, independently from the spatial reso-lution of the sensor, while for the buildings, the signatureis more heterogeneous. In this case the PAN image doesnot introduce further information content and the spec-tral signature of the grassland, on the other hand manyfeatures detected only by the PAN image influenced theenhanced spectrum. Also, the spectral signature of theindustrial building can be considered almost uniform overthe entire surface, non generating any significant distor-tions. On the other hand, during the fusion process, thehigh resolution image introduced a great amount of spa-tial information that produced spectral distortions thatare particularly evident on buildings pixels, as reported inTable 4.
Hyperion datasetThe last experiment shows the results of the proposedtechnique applied to a Hyperion dataset acquired in 2002.Hyperion is a grating imaging spectrometer providing 220HS bands (from 0.4 to 2.5μm) with a 30m spatial reso-lution. Each image covers a 7.5 km by 100 km land areaand provides detailed spectral mapping across all 220channels with high radiometric accuracy. The test areawas selected over the Rome city centre, with a landscapecharacterizedmainly by dense urban areas and sparse veg-etation. Before the extraction of the NLPCs, noisy bands
Figure 15 Quickbird PAN image used in the fusion process withthe Hyperion image.
Figure 16 False color composite of the original Hyperion imageobtained combining the 925, 823 and 721 nm bands for R, G andB respectively.
not containing relevant information were discarded fromthe original dataset, resulting in 168 spectrally unique andgood quality bands [32]. In this experiment, two differentPAN images were used to evaluate the spectral distortionintroduced by these images. In a first attempt, we fusedthe Hyperion image with a QuickBird PAN image.
Figure 17 False color composite of the fusion process obtainedcombining the 925, 823 and 721 nm bands of Hyperion for R, Gand B, respectively.

Licciardi et al. EURASIP Journal on Advances in Signal Processing 2012, 2012:207 Page 13 of 17http://asp.eurasipjournals.com/content/2012/1/207
The ratio between the spatial resolution of the twoimages has to be 4. Consequently the QuickBird imagewas downscaled to the 7.5m spatial resolution. As for theprevious experiment, the dimensionality reduction phaseis performed by a grid search of the best AANN topology.TheMSE is found to be 0.012, and is obtained with the fol-lowing topology: 168 input/output nodes, 3 nodes in thebottleneck layer and 75 in the other hidden layers, result-ing in 3 NLPCs. Following the Indusion approach thethree NLPCs are fused with the PAN image and the threefused NLPCs are then reprojected back into the original168 spectral bands. The PAN image, original Hyperionimage, the three NLPCs before and after the fusion phaseand the enlarged Hyperion image resulting from the entireprocess are featured on In Figures 15, 16, 17, 18 and 19.From a visual analysis, the resulting image appears to be
sharper than the original and it can also be noted that theroad network, that was not visible in the original image,is now clearly defined. Analyzing the values of qualityindexes in Table 5, it can be noted that the dimension-ality reduction phase, performed through the NLPCA,does not produced any relevant distortion. On the other
Figure 18 RGB composite obtained using the three originalNLPCs obtained from the Hyperion data.
Figure 19 RGB composite obtained using the three fused NLPCsderived from Hyperion image.
hand, evaluation of the quality of the enhanced NLPCsobtained by the Indusion process returned unacceptablevalues. These results are generated mainly by the differentacquisition angles and the consequent imperfect registra-tion betweenHS and PAN images. An enhancement of theoverall quality of the enlarged image can be obtained usinga different PAN image.The best case scenario requires a PAN image acquired
by the same satellite at the same moment. For this reasonwe choose a PAN image acquired by ALI instrument in2002, onboard the EO1 satellite (Figure 20). The spectralcoverage of the ALI-PAN image covers the visible range
Table 5 Quality indexes for the fusion process applied onHyperion
UIQI ERGAS SAM
Reference 1 0 0
NLPCA 0.9759 3.0622 1.3400
Indusion 0.9627 1.6798 2.3751
Hyperion +QuickBird 0.7941 4.7472 6.3233
Hyperion +ALI-PAN 0.9001 3.6562 1.4861
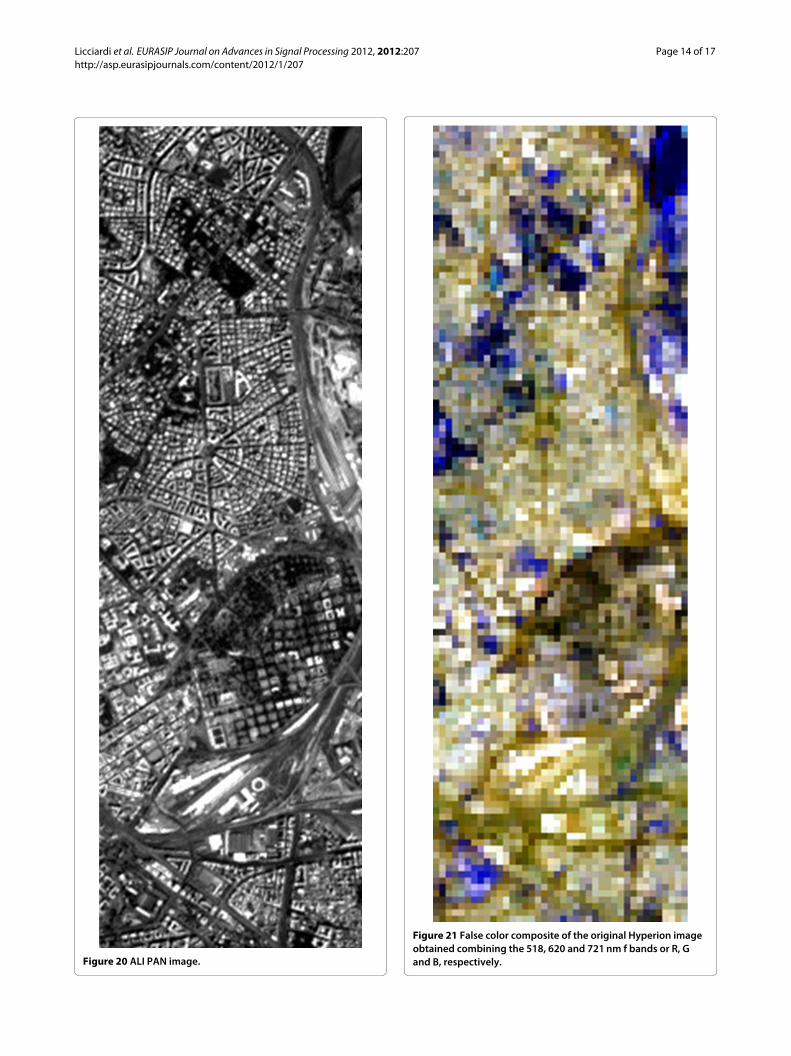
Licciardi et al. EURASIP Journal on Advances in Signal Processing 2012, 2012:207 Page 14 of 17http://asp.eurasipjournals.com/content/2012/1/207
Figure 20 ALI PAN image.
Figure 21 False color composite of the original Hyperion imageobtained combining the 518, 620 and 721 nm f bands or R, Gand B, respectively.

Licciardi et al. EURASIP Journal on Advances in Signal Processing 2012, 2012:207 Page 15 of 17http://asp.eurasipjournals.com/content/2012/1/207
Figure 22 False color composite of the fusion process obtainedcombining the 518, 620 and 721 nm bands for R, G and B,respectively.
(0.48–0.69μm), with a spatial resolution of 10m. Sincethis PAN image was acquired on a different date than theHS image, there are isolated clouds that are not present inthe HS image. This does not allow to select the same refer-ence area. Only a subset of the area is selected as depictedin Figure 21. Moreover, to respect the algorithm require-ment to have a ratio of 4, we have degraded the HS imageresolution to 40m.The dimensionality reduction was performed using the
same AANN of the previous case, while the fusion ofthe three NLPCs with the new PAN image was obtainedwith the Indusion approach. From the Table 5 it can benoted that the use of a new PAN image, acquired bythe same satellite, provides better values for the qualityindexes, demonstrating the effectiveness of the proposedapproach. Also from a visual analysis, the pansharpenedimage obtained with ALI-PAN (Figure 22) seems to besharper than when a QuickBird-PAN image was used forpan-sharpening. As for the dimensionality reduction, itcan be noted that the quality of the transformed imageis very similar to the previous one. In Figure 23a-f is alsoreported a comparison of the enhanced spectra with theoriginal spectra. Also in this case the comparison was setup on three different areas representing respectively anresidential building, a industrial building and a vegeta-tion area. Apart from distortions introduced by featuresdetected by the PAN image and not present in the lowresolution one, it is possible to note also some spectraldistortions in the vegetation area. The selected vegeta-tion area is mainly composed of sparse deciduous trees,so the spectral distortion can be explained by the differ-ent seasonal growth cycle of the trees spotted by the twosensors.
ConclusionIn this, we have presented a novel approach combiningdimensionality reduction and a pan-sharpening techniquefor spatial quality improvement of HS images while pre-serving the spectral quality of the original HS image.The proposed method introduces dimensionality reduc-tion of HS images based on the nonlinear generalizationof standard PCA. The nonlinear principal componentswere obtained by an AANN. The use of the Indusiontechnique has been investigated in the framework of pan-sharpening. The innovation proposed by this techniquerelies in fusing NLPCs with the PAN images instead ofthe spectral bands to reduce the computational load ofthe pan-sharpening process. In the experimental sectionthe Indusion was first tested on a WorldView-2 imageto assess the performance of the fusion algorithm, whileIndusion combined with NLPCA was tested on a two HSimages, a CHRIS-Proba and a Hyperion dataset, respec-tively. These two latter experiments were carried out

Licciardi et al. EURASIP Journal on Advances in Signal Processing 2012, 2012:207 Page 16 of 17http://asp.eurasipjournals.com/content/2012/1/207
Figure 23 Spectra of three different test areas: residential building spectrum (a) and enhanced spectrum (b), industrial building originalspectrum (c) and enhanced spectrum (d) and vegetation original spectrum (e) and enhanced spectrum (f).
fusing NLPCs with PAN images collected under differ-ent geometries and for images acquired at different dates.Moreover in both cases the PAN image does not cover thesame spectral range as covered by the original HS bands.A further experiment has been made fusing a Hyperionimage with a PAN image acquired by the same satelliteand having the same geometry as the HS image. Beingthe proposed method applied to real data, it is importantto consider that many sources of spectral distortion areintroduced, such as error in the registration phase anddifferences in terms of angles of view. Moreover, it hasto be considered that there are also other negative con-tributions introduced by objects that are detected by thePAN image but not in the HS image where their spectralsignature results to be mixed with the signatures of thesurrounding objects. Finally there are also some objectsin one image that are not present in the other due to thedifferent dates of acquisition. However, apart from thesenegative contributions, the results demonstrated a goodbehavior of the proposed method in mitigating the spec-tral distortions. Aside from the benefits of using Indusion
for image fusion, the use of NLPCA for dimensionalityreduction results in a better reconstruction of the originalHS image. However, one main drawback on the use of thistechnique relies on the necessity to perform a grid searchto find the neural network topology that may lead to thebest performances. In any case, the UIQI and ERGASquality indexes quantitatively demonstrate the good per-formance of the proposed method on CHRIS-Proba and aHyperion images. Visually, Indusion produced sharp andspectrally consistent images while NLPCA reduced theoriginal dataset dimensionality minimizing the introduc-tion of further spectral distortions while speeding up thepan-sharpening process.
Competing interestsThe authors declare that they have no competing interests.
Author details1GIPSA-lab, CNRS, University of Grenoble, Grenoble, France. 2SEECS, NationalUniversity of Sciences and Technology, Islamabad, Pakistan.
Received: 15 July 2011 Accepted: 26 August 2012Published: 25 September 2012

Licciardi et al. EURASIP Journal on Advances in Signal Processing 2012, 2012:207 Page 17 of 17http://asp.eurasipjournals.com/content/2012/1/207
References1. L Wald, Data Fusion. Definitions and Architectures—Fusion of Images of
Different Spatial Resolutions. (Presses de l’Ecole, Ecole des Mines de Paris,Paris, France,2002)
2. F Palsson, JR Sveinsson, J Benediktsson, H Aanaes, Classification ofPansharpened Urban Satellite Images. IEEE J. Sel. Topics Appl. EarthObservations and Remote Sens. 5, 281–297 (2012)
3. MT Eismann, RC Hardie, Hyperspectral resolution enhancement usinghigh resolution multispectral imagery with arbitrary response function.IEEE Trans. Geosci. Remote Sens. 43(3) (2005)
4. PS Chavez, SC Sides, JA Anderson, Comparison of three different methodsto merge multiresolution and multispectral data: landsat TM and SPOTpanchromatic. Photogram. Eng. Remote Sens. 57(3), 295–303 (1991)
5. B Serpico, M D’Inca, F Melgani, G Moser, Comparison of feature reductiontechniques for classification of hyperspectral remote sensing datauniversal image quality index. Proc. SPIE Image Signal Process RemoteSens. 4885(8), 347–358 (2003)
6. C Lee, DA Landgrebe, Feature extraction based on decision boundaries.IEEE Trans. Pattern Anal. Mach. Intell. 15(4), 388–400 (1993)
7. P Mitra, CA Murthy, SK Pal, Unsupervised feature selection using featuresimilarity. IEEE Trans. Pattern Anal. Mach. Intell. 24(3), 301–312 (2002)
8. A Plaza, P Martinez, J Plaza, R Perez, Dimensionality reduction andclassification of hyperspectral image data using sequences of extendedmorphological transformations. IEEE Trans. Geosci. Remote Sens.43(3), 466–479 (2005)
9. Y He, Q Du, G Chen, Unsupervised Hyperspectral Band Selection UsingGraphics Processing Units. IEEE J. Selected Topics in Appl. EarthObservations and Remote Sens. 4, 660–668 (2011)
10. J Sen, J Zhen, Q Yuntao, S Linlin, Unsupervised Band Selection forHyperspectral Imagery Classification Without Manual Band Removal. IEEEJ. Selected Topics Appl. Earth Observations and Remote Sens.5, 531–543 (2012)
11. C Chein-I, W Su, L Keng-Hao, C Mann-Li, L Chinsu, Progressive BandDimensionality Expansion and Reduction Via Band Prioritization forHyperspectral Imagery. IEEE J. Selected Topics Appl. Earth Observationsand Remote Sens. 4, 591–614 (2011)
12. C Jutten, J Herault, Blind separation of sources, part I: an adaptivealgorithm based on neuromimetic architecture. Signal Process.24, 1–10 (1991)
13. AA Green, M Berman, RP Switze, MD Craig, A transformation for orderingmultispectral data in terms of image quality with implications for noiseremoval. IEEE Trans. Geosci. Remote Sens. 26, 65–74 (1988)
14. M Fauvel, J Chanussot, JA Benediktsson, Kernel principal componentanalysis for the classification of hyperspectral remote sensing data overurban areas. EURASIP J. Adv. Signal Process. 2009, 1–14 (2009)
15. G Licciardi, PR Marpu, J Chanussot, JA Benediktsson, Linear versusnonlinear PCA for the classification of hyperspectral data based on theextended morphological profiles. IEEE Geosci. Remote Sens. Lett.9, 447–451 (2012)
16. MA Kramer, Nonlinear principal component analysis usingautoassociative neural networks. AIChE J. 37, 233–243 (1991)
17. C Bishop, Neural Networks for Pattern Recognition. (Oxford University Press,London, 1995)
18. M Scholz, F Kaplan, L Guy, J Kopka, J Selbig, Non-linear PCA: a missingdata approach. Bioinformatics. 21, 3887–3895 (2005)
19. G Licciardi, FD Frate, Pixel unmixing in hyperspectral data by means ofneural networks. IEEE Trans. Geosci. Remote Sens. 49, 4163–4172 (2011)
20. J Nunez, X Otazu, O Fors, A Prades, V Pala, R Arbiol, Multiresolution-basedimage fusion with additive wavelet decomposition. Trans. Geosci.Remote Sens. 37(3), 1204–1211 (1999)
21. T Ranchin, L Wald, Fusion of high spatial and spectral resolution images:the ARSIS concept and its implementation. Photogramm. Eng. RemoteSens. 66, 49–61 (2000)
22. B Aiazzi, L Alparone, S Baronti, A Garzelli, Context-driven fusion of highspatial and spectral resolution images based on oversampledmultiresolution analysis. IEEE Trans. Geosci. Remote Sens.40, 2300–2312 (2002)
23. TM Tu, PS Huang, CL Hung, CP Chang, A fast intensity-hue-saturationfusion technique with spectral adjustment for IKONOS imagery. IEEEGeosci. Remote Sens. Lett. 1(4), 309–312 (2004)
24. L Alparone, L Wald, J Chanussot, C Thomas, P Gamba, LM Bruce,Comparison of pansharpening algorithms: Outcome of the 2006 GRS-Sdata fusion contest. IEEE Trans. Geosci. Remote Sens.45(10), 3012–3021 (2007)
25. C Thomas, T Ranchin, L Wald, J Chanussot, Synthesis of MultispectralImages to High Spatial Resolution: A Critical Review of Fusion MethodsBased on Remote Sensing Physics. IEEE Trans Geoscience and RemoteSens. 46, 1301–1312 (2008)
26. MM Khan, J Chanussot, L Condat, A Montanvert, Indusion: fusion ofmultispectral and panchromatic images using the induction scalingtechnique. IEEE Geosci. Remote Sens. Lett. 5, 98–102 (2008)
27. L Condat, A Montanvert, in ICASSP. A framework for image magnification:induction revisited, (2005) pp. 845–848
28. A Cohen, I Daubechies, JC Feauveau, Biorthogonal bases of compactlysupported wavelets. Commun. Pure Appl. Math. 45(5), 485–560 (1992)
29. Z Wang, AC Boviki, A universal image quality index. IEEE Signal Process.Lett. 9(3), 81–84 (2002)
30. B Mayer, A Kylling, Technical note: the libRadtran software package forradiative transfer calculations—description and example of use. Atmos.Chem. Phys. 5, 1855–1877 (2005)
31. A Villa, J Chanussot, J Benediktsson, C Jutten, Spectral unmixing for theclassification of hyperspectral images at a finer spatial resolution. IEEE J.Sel. Top. Signal Process. 5(3), 521–533 (2011)
32. B Datt, TR McVicar, TG Van Niel, DLB Jupp, JS Pearlman, Preprocessing EO-1 hyperion hyperspectral data to support the application of agriculturalindexes. IEEE Trans. Geosci. Remote Sens. 41(6), 1246–1259 (2003)
doi:10.1186/1687-6180-2012-207Cite this article as: Licciardi et al.: Fusion of hyperspectral and panchro-matic images using multiresolution analysis and nonlinear PCA bandreduction. EURASIP Journal on Advances in Signal Processing 2012 2012:207.
Submit your manuscript to a journal and benefi t from:
7 Convenient online submission
7 Rigorous peer review
7 Immediate publication on acceptance
7 Open access: articles freely available online
7 High visibility within the fi eld
7 Retaining the copyright to your article
Submit your next manuscript at 7 springeropen.com