Funding R&D Activities in Russia and Abroad
14
Funding R&D activities in Russia and abroad Russian-French Seminar, Moscow, January, 20-25th, 2014 Julien Vercueil, INALCO, CEMI-EHESS (Paris)
Transcript of Funding R&D Activities in Russia and Abroad

Funding R&D activities in Russia and
abroad
Russian-French Seminar, Moscow, January, 20-25th,
2014
Julien Vercueil, INALCO, CEMI-EHESS (Paris)
Russian-French Seminar, Moscow, January, 20-25th,
2014
J. Vercueil, INALCO, CEMI-EHESS (Paris)
1. INPUTS AND OUTPUTS OF R&D ACTIVITIES
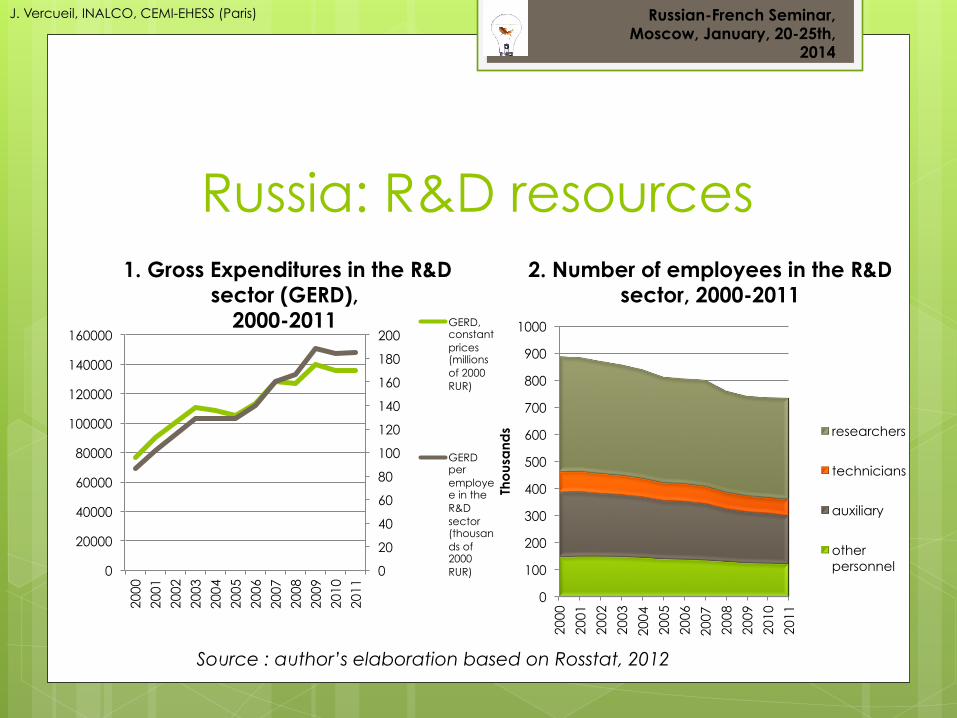
Russia: R&D resources
0
20
40
60
80
100
120
140
160
180
200
0
20000
40000
60000
80000
100000
120000
140000
160000
2000
2001
2002
2003
2004
2005
2006
2007
2008
2009
2010
2011
1. Gross Expenditures in the R&D sector (GERD),
2000-2011 GERD, constant prices (millions of 2000 RUR)
GERD per employee in the R&D sector (thousands of 2000 RUR)
0
100
200
300
400
500
600
700
800
900
1000
2000
2001
2002
2003
2004
2005
2006
2007
2008
2009
2010
2011
Tho
usa
nds
2. Number of employees in the R&D sector, 2000-2011
researchers
technicians
auxiliary
other personnel
Russian-French Seminar, Moscow, January, 20-25th,
2014
Source : author’s elaboration based on Rosstat, 2012
J. Vercueil, INALCO, CEMI-EHESS (Paris)
Russian-French Seminar, Moscow, January, 20-25th,
2014
Source : « 2014 Global R&D Funding Forecast ». Battelle, December 2013
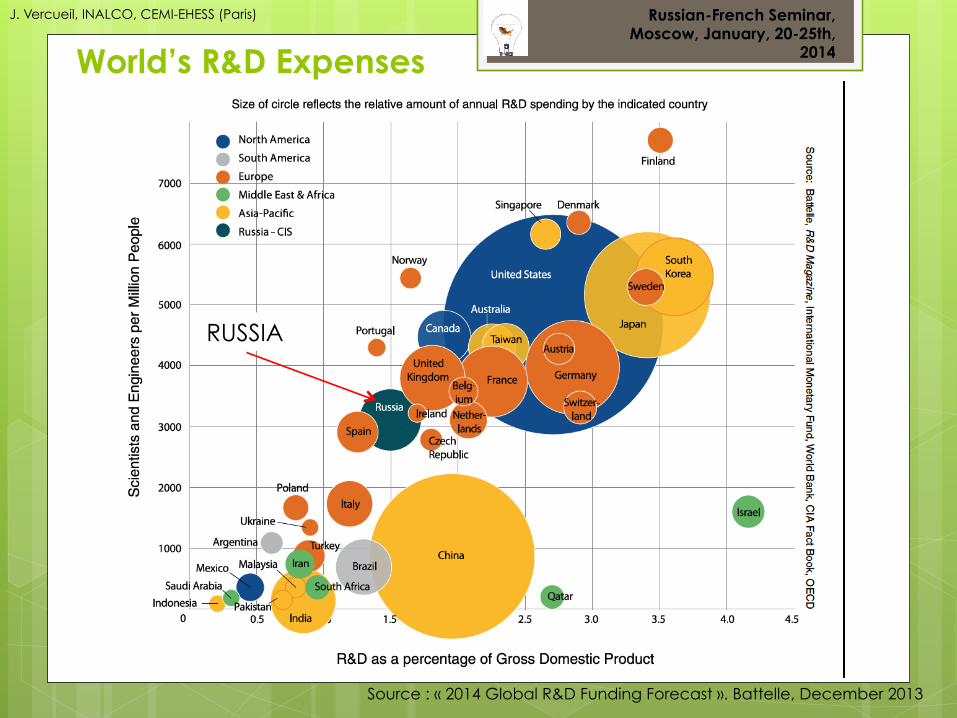
World’s R&D Expenses
RUSSIA
J. Vercueil, INALCO, CEMI-EHESS (Paris)

Russian-French Seminar, Moscow, January, 20-25th,
2014
Source : « 2014 Global R&D Funding Forecast ». Battelle, December 2013
J. Vercueil, INALCO, CEMI-EHESS (Paris)
Comparing distributions of R&D expenses accross countries
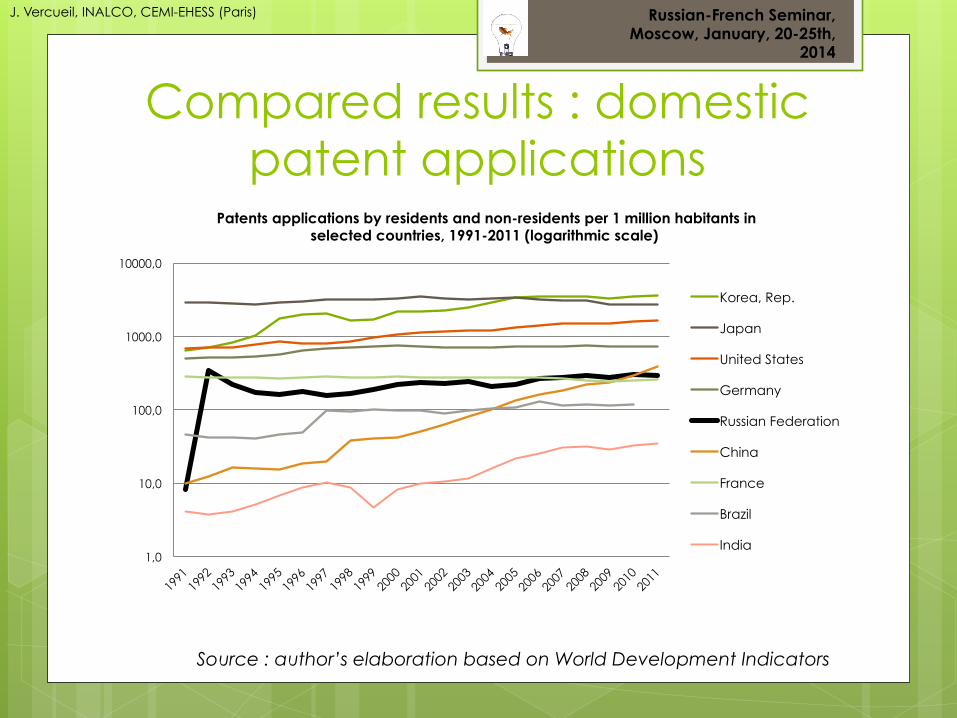
Compared results : domestic patent applications
Russian-French Seminar, Moscow, January, 20-25th,
2014
J. Vercueil, INALCO, CEMI-EHESS (Paris)
Source : author’s elaboration based on World Development Indicators
1,0
10,0
100,0
1000,0
10000,0
Patents applications by residents and non-residents per 1 million habitants in selected countries, 1991-2011 (logarithmic scale)
Korea, Rep.
Japan
United States
Germany
Russian Federation
China
France
Brazil
India

Compared results : high tech exports
Russian-French Seminar, Moscow, January, 20-25th,
2014
J. Vercueil, INALCO, CEMI-EHESS (Paris)
Source : author’s elaboration based World Development Indicators, 2013
0,00%
5,00%
10,00%
15,00%
20,00%
25,00%
30,00%
2005 2006 2007 2008 2009 2010 2011
1. Share of high-tech exports in total exports for selected countries, 2005-2011
China
Korea, Rep.
Japan
France
Germany
United States
India
Brazil
Russian Federation
0,00%
2,00%
4,00%
6,00%
8,00%
10,00%
12,00%
14,00%
1996
19
97
1998
19
99
2000
20
01
2002
20
03
2004
20
05
2006
20
07
2008
20
09
2010
20
11
2. High-Tech Export Intensity relative to GDP for selected countries, 1996-2011
Korea, Rep.
China
Germany
France
Japan
United States
India
Brazil
Russian Federation
Russian-French Seminar, Moscow, January, 20-25th,
2014
2. HOW TO FUND R&D ACTIVITIES ?
(focusing on start-ups)
J. Vercueil, INALCO, CEMI-EHESS (Paris)

Russian-French Seminar, Moscow, January, 20-25th,
2014
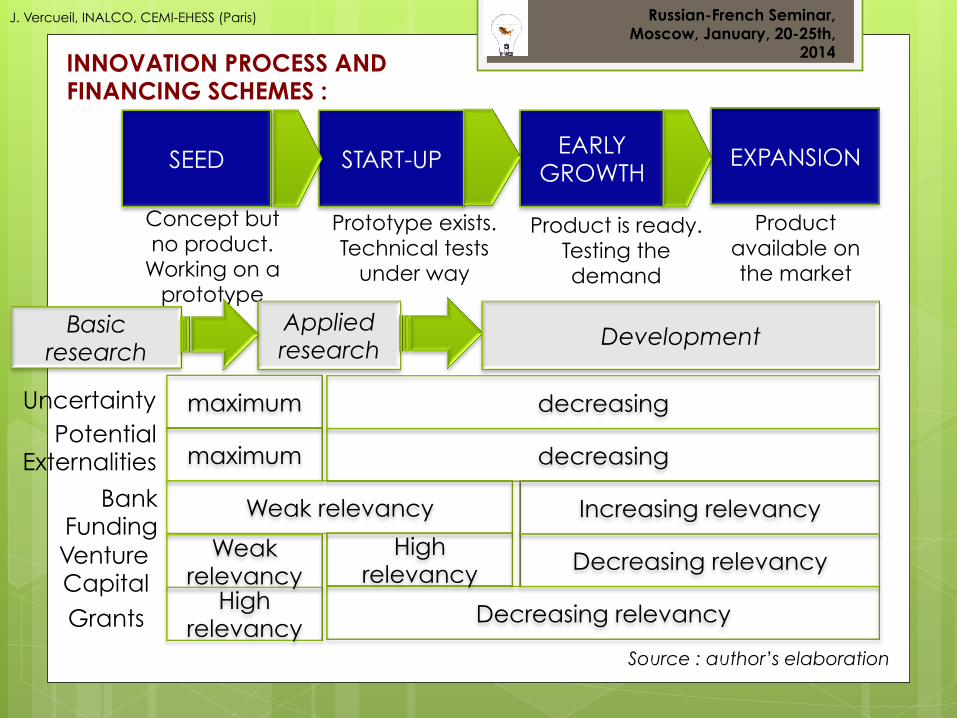
SEED START-UP EARLY
GROWTH EXPANSION
INNOVATION PROCESS AND FINANCING SCHEMES :
Concept but no product.
Working on a prototype
Prototype exists. Technical tests
under way
Product is ready. Testing the demand
Product available on the market
Basic research
Applied research Development
Source : author’s elaboration based on Osawa and Myiazaki, 2006
J. Vercueil, INALCO, CEMI-EHESS (Paris)
Ne
t C
ash
flo
ws
time « Valley of death »
Initial funding : « 3F » : family, friends & fools
Russian-French Seminar, Moscow, January, 20-25th,
2014
SEED START-UP EARLY
GROWTH EXPANSION
INNOVATION PROCESS AND FINANCING SCHEMES :
Concept but no product.
Working on a prototype
Prototype exists. Technical tests
under way
Product is ready. Testing the demand
Product available on the market
Potential Externalities
maximum decreasing
Grants High
relevancy Decreasing relevancy
Venture Capital
High relevancy Decreasing relevancy
Bank Funding
Weak relevancy Increasing relevancy
Uncertainty
maximum decreasing
Basic research
Applied research Development
Source : author’s elaboration
Weak relevancy
J. Vercueil, INALCO, CEMI-EHESS (Paris)

Levels and means of public involvement in R&D support
J. Vercueil, INALCO, CEMI-EHESS (Paris) Russian-French Seminar, Moscow, January, 20-25th,
2014
Levels of public action
Institutional framework
Infrastruc-tures
Public agencies
Public funding
Central level
Local levels
- IPR laws
- Incentives to spin-offs
- Tax system
- Incentives to localization
- Technolo-gical special zones
- University and PRI incubators
- Agencies supporting research projects
- Venture funds
Idem
- Grants - Low-rate loans
- Venture capital
Idem
Source : author’s elaboration

Venture capital investment, %GDP, 2012
Source : OECD S&T Database, 2013
0,00
0,05
0,10
0,15
0,20
0,25
0,30
0,35
0,40
% Breakdown not available Later stage Early stage
0,000 0,005 0,010 0,015 0,020 0,025 0,030 0,035
Magnified
Russian-French Seminar, Moscow, January, 20-25th,
2014
J. Vercueil, INALCO, CEMI-EHESS (Paris)

Public financing of first stages of high-tech SME development : four examples
Russian-French Seminar, Moscow, January, 20-25th,
2014
J. Vercueil, INALCO, CEMI-EHESS (Paris)
SBIR (United States)
2,5 years
Phase1 : feasibility studies Phase 2 : commercialisation Process
Open competition - 14% applicants eligible for phase 1 - 60% projects eligible for phase 2
Commercialisation Australia
2 to 3 years
1. « Skills & Knowledge » : up to 45000 US$ 2. « Experienced executives » : up to 300000 US$ 3. « Proof of concept » : 45 to 220000 US$ 4. « Early stage commercialisation » : 50000 to 1,7 Mns US$
Open competition 1 : 80/20 financing 2 : 50/50 3 : 50/50 4 : 50/50
Program & Country
Maximum duration
Stages Conditions & Selectivity
EXIST (Germany)
3 years
Phase 1. Proof of technological feasibility : up to 60000 € Phase 2. Prototype realisation : up to 150000 €.
Open competititon Phase 2 : coverage of 75% of costs
START (Russia)
3 years
Year 1. up to 40000 US$ / convincing investors Year 2. technological and industrial development Year 3. commercial development
Open competition Year 1 : 26 % applicants eligible Year 2 : 25/30 % eligible (if 50/50 with private investors) Year 3 : 70 % eligible (if first sales)
Source : author’s elaboration
Спасибо за
внимание
Russian-French Seminar, Moscow, January, 20-25th,
2014