Funding Higher Education in Tight Fiscal Times: Is Performance ...
61
Performance Funding: The Role of Higher Education Boards Illinois Board of Higher Education August 16, 2011 Chicago, Illinois Brenda Norman Albright
-
Upload
khangminh22 -
Category
Documents
-
view
0 -
download
0
Transcript of Funding Higher Education in Tight Fiscal Times: Is Performance ...
Performance Funding: The
Role of Higher Education
Boards
Illinois Board of Higher Education
August 16, 2011
Chicago, Illinois
Brenda Norman Albright

Performance Funding
Discussion Outline:
Why are States Adopting Performance
Funding Focused on Student Success?
What Approaches are States using?
What can Board Members do?
Environmental Factors Influencing Higher
Education Funding
The most significant changes in higher
education have resulted from external
forces
-- Clark Kerr
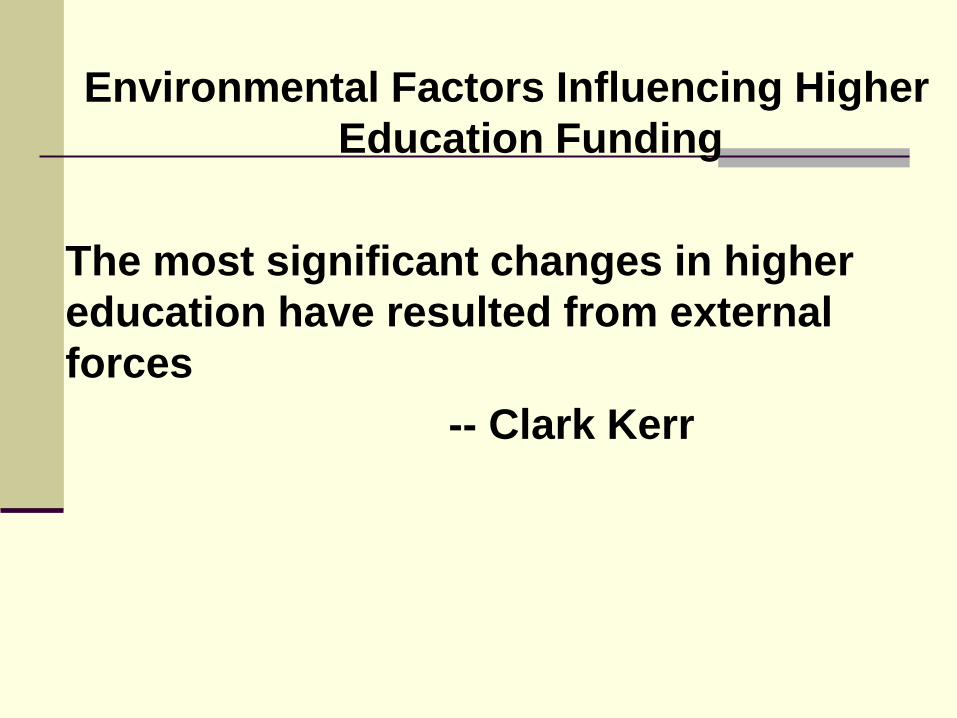
Four External Trends
1. Shifting Demographics
2. New Public Management (Focus on Outputs,
concern about costs)
3. Higher education – from a public good to a
private good
4. State governments have adopted the human
capital theory Source: Financial Planning: Strategies and Lessons Learned
by Paul T. Brinkman and Anthony W. Morgan
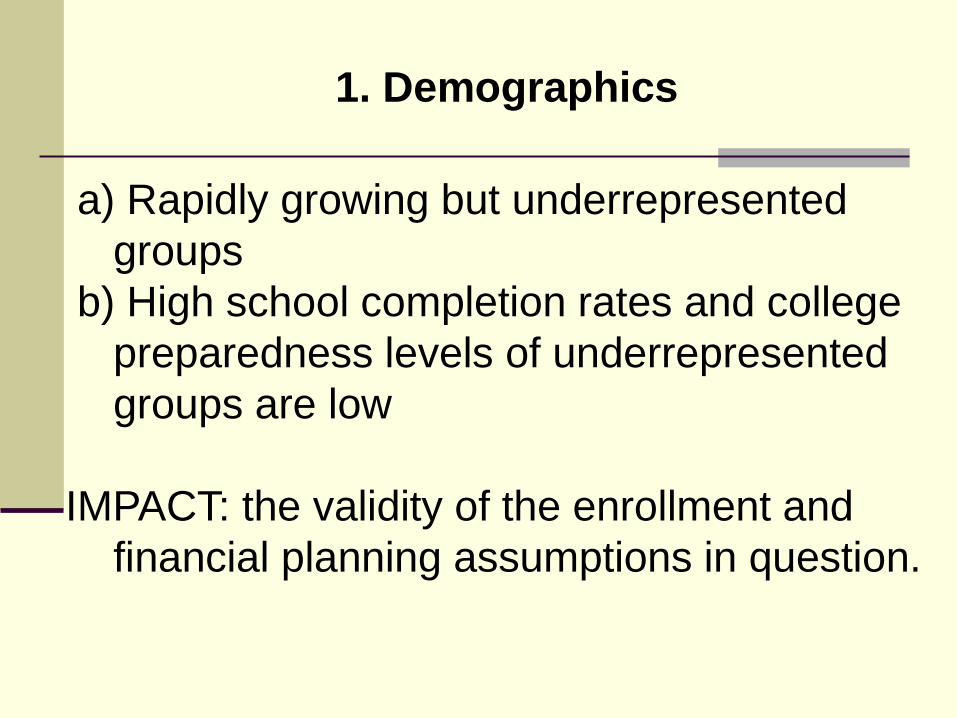
1. Demographics
a) Rapidly growing but underrepresented
groups
b) High school completion rates and college
preparedness levels of underrepresented
groups are low
IMPACT: the validity of the enrollment and
financial planning assumptions in question.
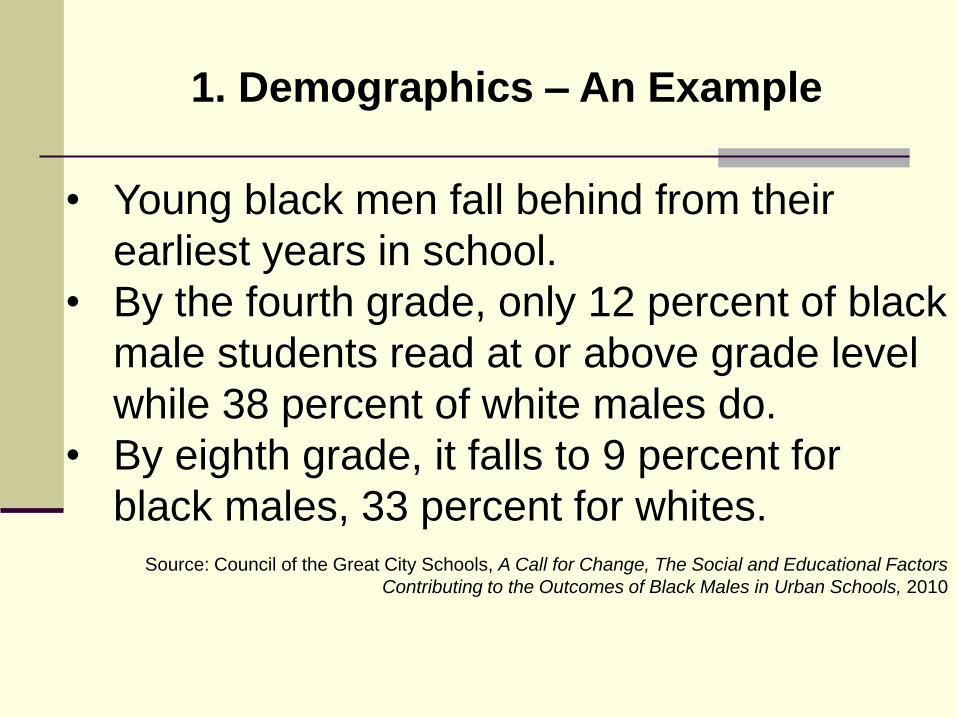
1. Demographics – An Example
• Young black men fall behind from their
earliest years in school.
• By the fourth grade, only 12 percent of black
male students read at or above grade level
while 38 percent of white males do.
• By eighth grade, it falls to 9 percent for
black males, 33 percent for whites.
Source: Council of the Great City Schools, A Call for Change, The Social and Educational Factors
Contributing to the Outcomes of Black Males in Urban Schools, 2010

2. New Public Management
The system of financing higher education is
dysfunctional. In addition to the lack of
transparency regarding pricing, there is a lack of
the incentives necessary to affect institutional
behavior so as to reward innovation and
improvement in productivity. Financial systems of
higher education instead focus on and reward
increasing revenues—a top line structure with no
real bottom line.
-Charles Miller , Chairperson of the 2006 Spellings Commission on the Future of Higher Education

2. New Public Management
IMPACT: States and colleges must develop
new funding and communication strategies
responsive to demands for greater
productivity and innovation
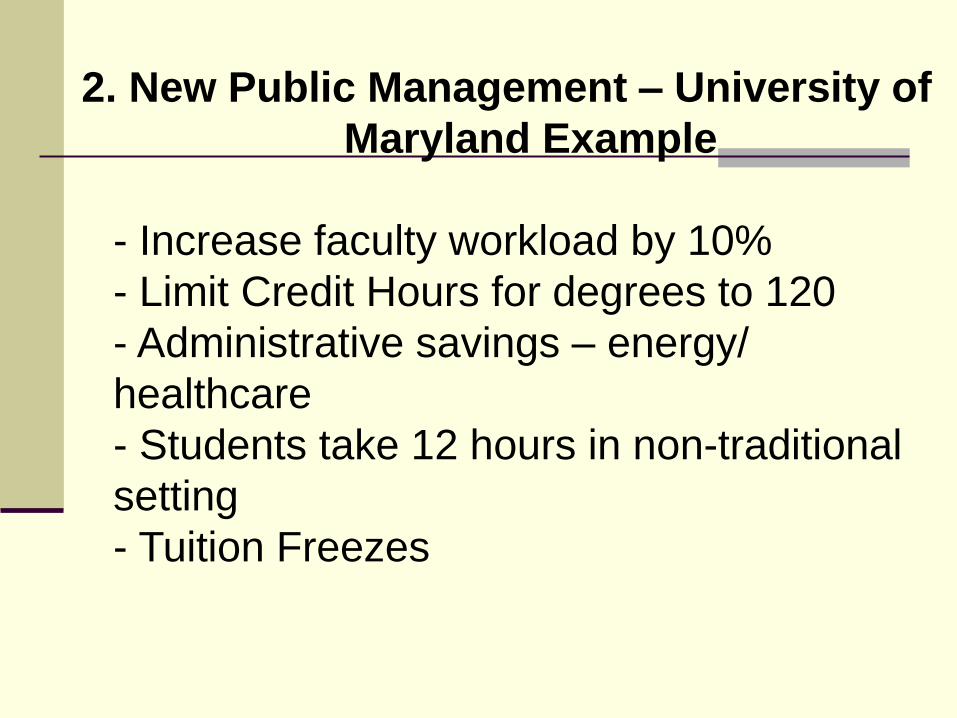
2. New Public Management – University of
Maryland Example
- Increase faculty workload by 10%
- Limit Credit Hours for degrees to 120
- Administrative savings – energy/
healthcare
- Students take 12 hours in non-traditional
setting
- Tuition Freezes
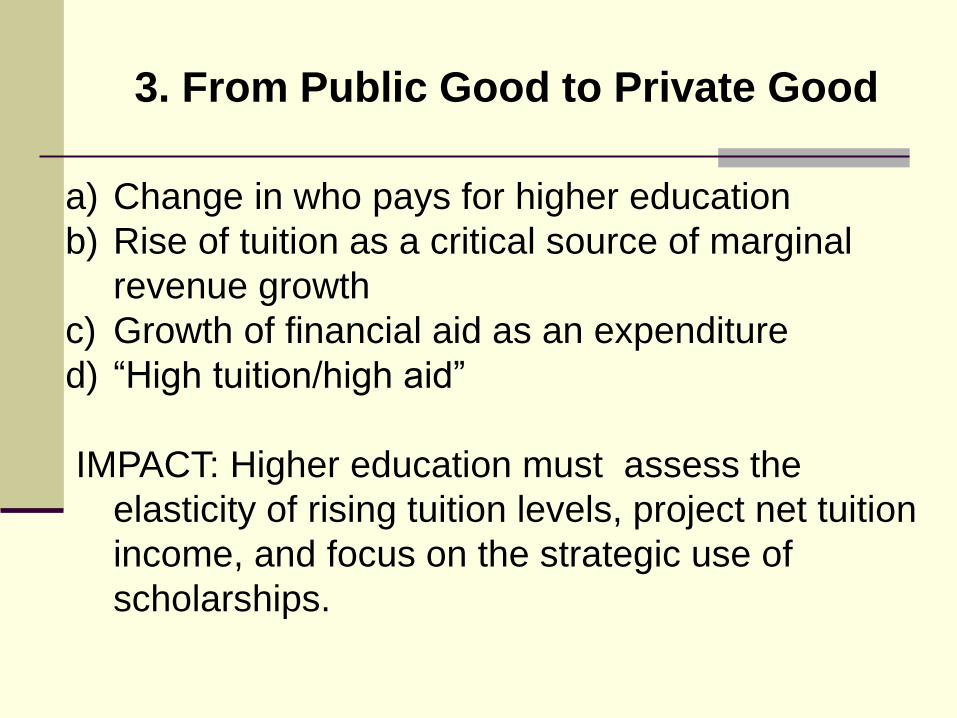
3. From Public Good to Private Good
a) Change in who pays for higher education
b) Rise of tuition as a critical source of marginal
revenue growth
c) Growth of financial aid as an expenditure
d) ―High tuition/high aid‖
IMPACT: Higher education must assess the
elasticity of rising tuition levels, project net tuition
income, and focus on the strategic use of
scholarships.
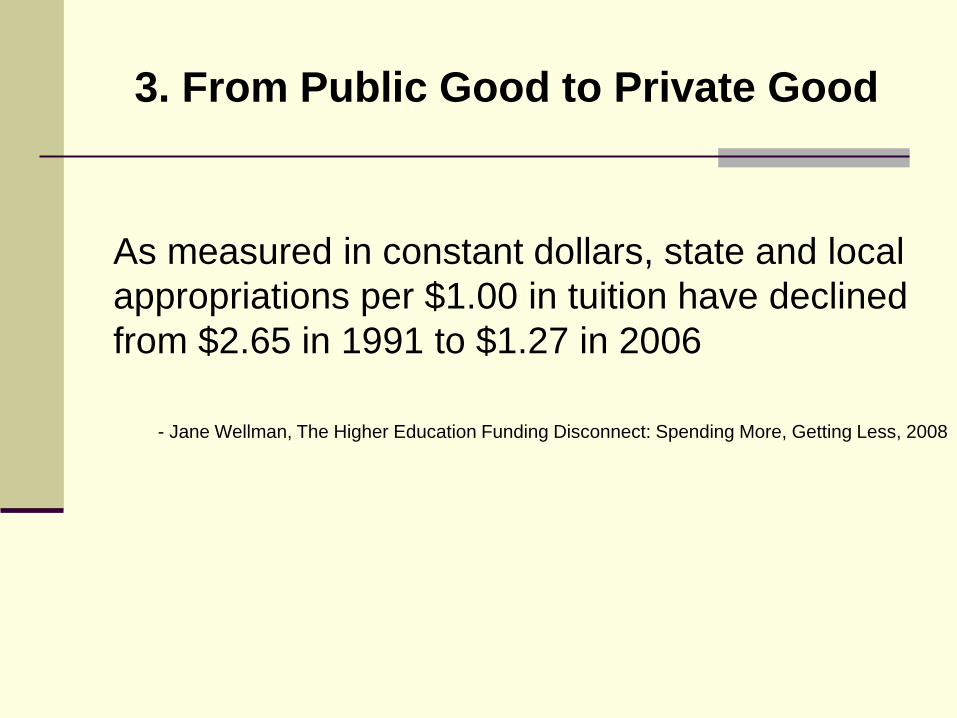
3. From Public Good to Private Good
As measured in constant dollars, state and local
appropriations per $1.00 in tuition have declined
from $2.65 in 1991 to $1.27 in 2006
- Jane Wellman, The Higher Education Funding Disconnect: Spending More, Getting Less, 2008

State Fiscal Outlook
Austere state budgets for at least the next several years
States will look for creative financing and revenue
opportunities to meet these spending demands
Opportunities for reform, restructuring, examining priorities
Scott Pattison, NASBO

4. Human Capital Theory
• State governments have pressured colleges and
universities to increase participation and
completion rates as a base for state economic
development
• Typically without commensurate state funding.
4. Human Capital Theory
IMPACT: States and colleges must develop new
ways to fund higher education that focus on
degrees and other outcomes.
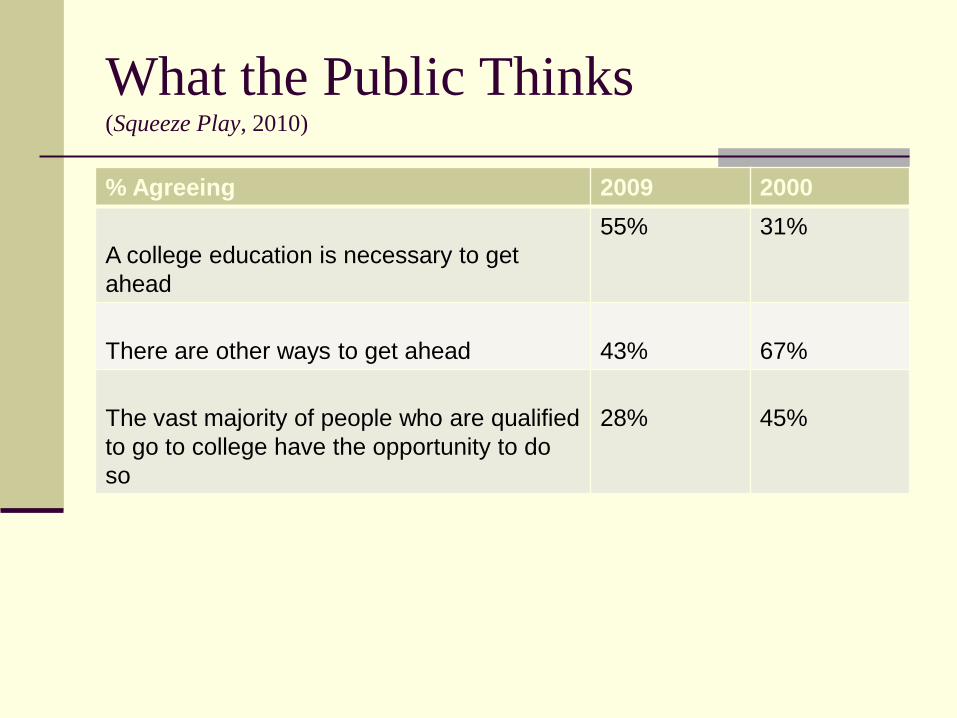
What the Public Thinks (Squeeze Play, 2010)
% Agreeing 2009 2000
A college education is necessary to get
ahead
55% 31%
There are other ways to get ahead
43%
67%
The vast majority of people who are qualified
to go to college have the opportunity to do
so
28%
45%
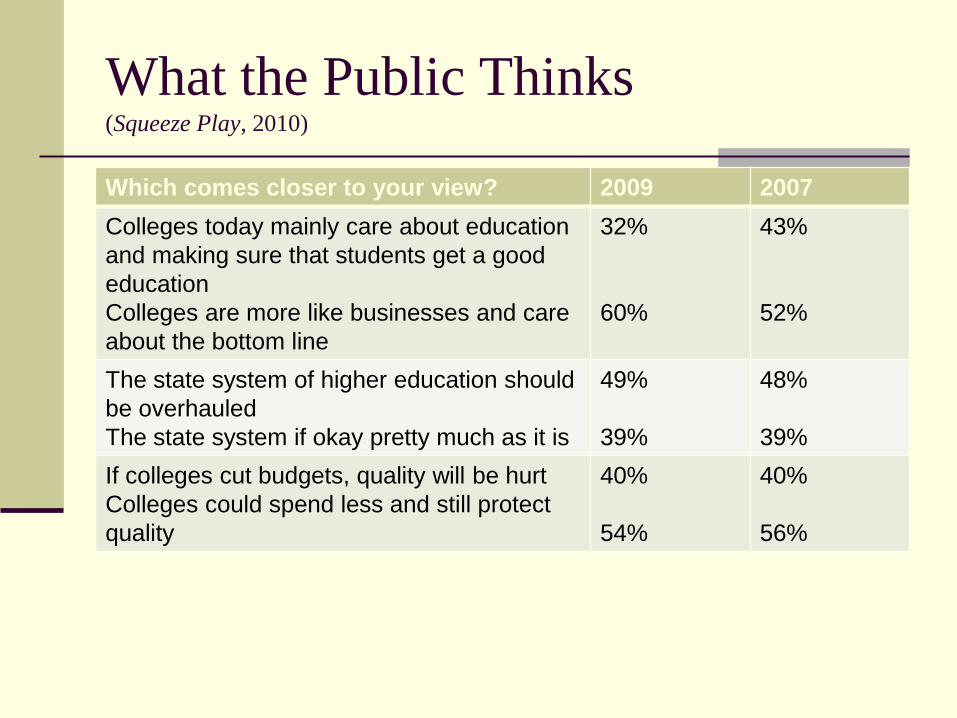
What the Public Thinks (Squeeze Play, 2010)
Which comes closer to your view? 2009 2007
Colleges today mainly care about education
and making sure that students get a good
education
Colleges are more like businesses and care
about the bottom line
32%
60%
43%
52%
The state system of higher education should
be overhauled
The state system if okay pretty much as it is
49%
39%
48%
39%
If colleges cut budgets, quality will be hurt
Colleges could spend less and still protect
quality
40%
54%
40%
56%

Bill Gates says
Where are the greatest opportunities and why?
Increase and Reward Completion.
Educate and Train in Affordable Ways
- Technology
- Use best teachers
- Maintain Quality
Focus on measurement

Bill Gates says
―We need to measure what matters. We need to know what the students learn, and what jobs they get. We need to know why students of some community colleges do better in the job market than others. Why minority students at some colleges take longer to earn a degree than similar students elsewhere. We don’t know the answers. We’re not even asking the questions.‖
Bill Gates, 2009
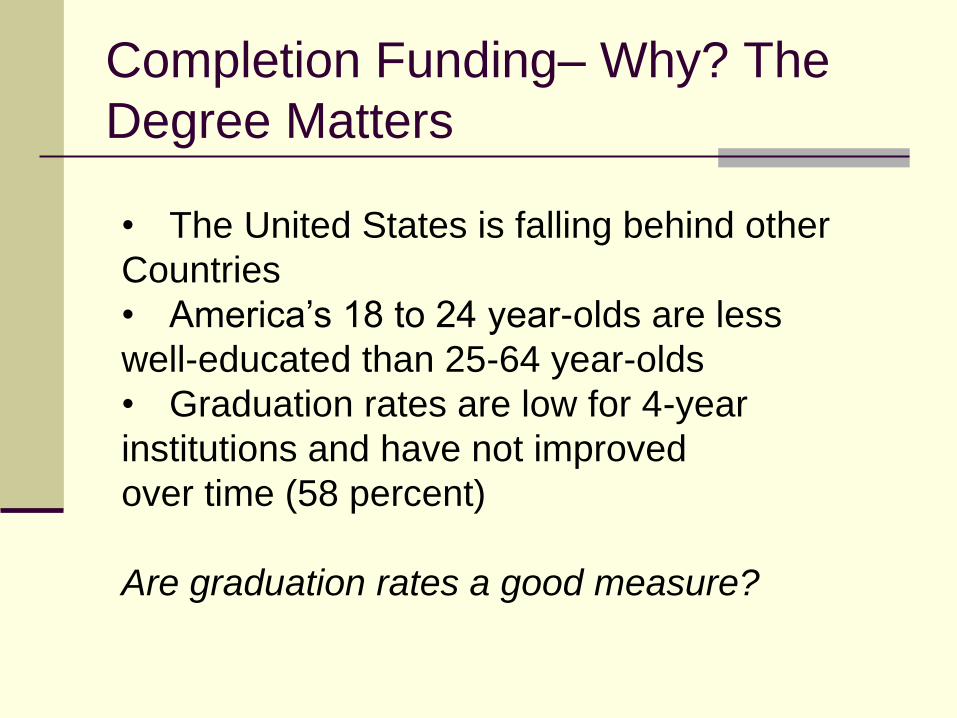
• The United States is falling behind other
Countries
• America’s 18 to 24 year-olds are less
well-educated than 25-64 year-olds
• Graduation rates are low for 4-year
institutions and have not improved
over time (58 percent)
Are graduation rates a good measure?
Completion Funding– Why? The
Degree Matters
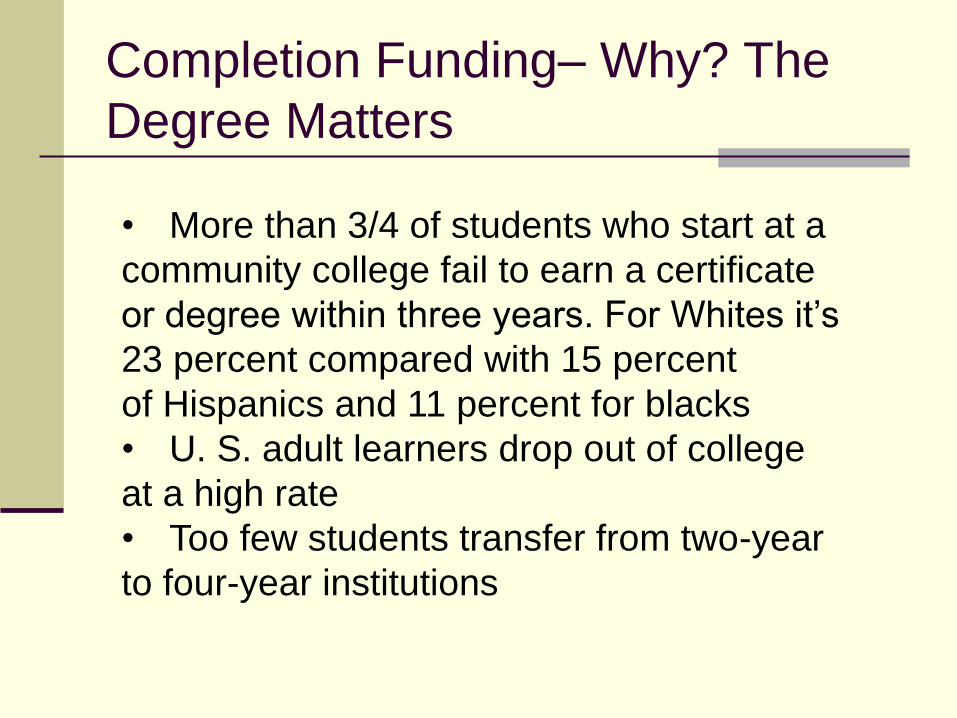
• More than 3/4 of students who start at a
community college fail to earn a certificate
or degree within three years. For Whites it’s
23 percent compared with 15 percent
of Hispanics and 11 percent for blacks
• U. S. adult learners drop out of college
at a high rate
• Too few students transfer from two-year
to four-year institutions
Completion Funding– Why? The
Degree Matters

Completion Funding – Promoted by
Policymakers
Foundations
Federal Leadership
State Leadership
National Governor’s Association
National Conference of State Legislators

Performance Funding History
Performance funding has been tried in several
states – with success in some and
abandoned in others
Performance Funding 2.0 focuses on course
and degree completion

Formula/Performance Funding 2.0
Some examples:
Ohio (initiated in 2010 fiscal year)
Indiana (initiated in 2010 fiscal year)
Washington Community Technical Colleges
Tennessee (2010 Legislation)
Louisiana (2010 Legislation)
Oklahoma, Pennsylvania, Texas
Illinois, Arizona, Kentucky
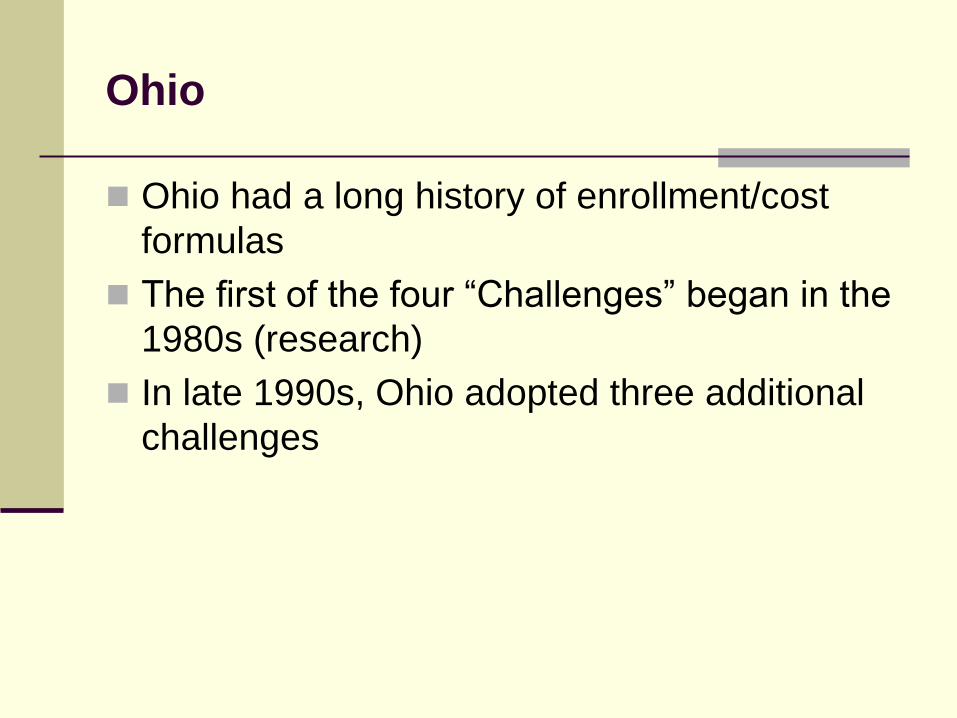
Ohio
Ohio had a long history of enrollment/cost
formulas
The first of the four ―Challenges‖ began in the
1980s (research)
In late 1990s, Ohio adopted three additional
challenges

Performance Funding – Ohio’s
Challenges
Research - Increase third-party sponsored
research, Public university main campuses;
some private universities ($10 - $12 million
per year)
Access - Lower tuition to increase
enrollments at access campuses, Public
community colleges and selected 4-year
access campuses ($65 million per year)
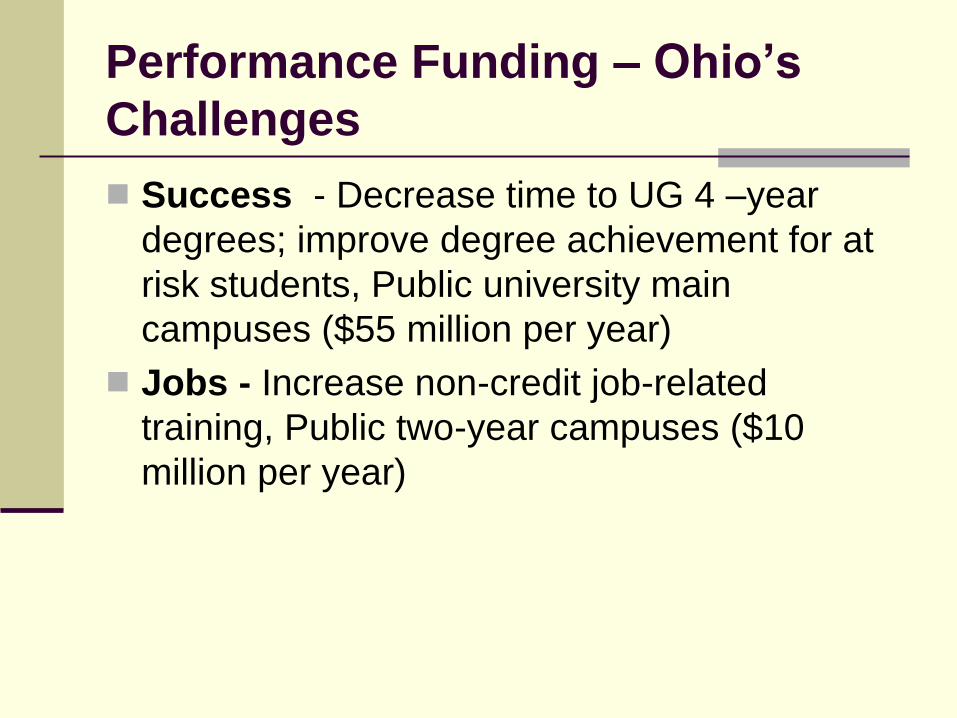
Performance Funding – Ohio’s
Challenges
Success - Decrease time to UG 4 –year
degrees; improve degree achievement for at
risk students, Public university main
campuses ($55 million per year)
Jobs - Increase non-credit job-related
training, Public two-year campuses ($10
million per year)
Formula Funding - Ohio
Total funding for the Challenges equaled
about 10% of total state operating subsidy for
campuses by late 1990s
The past successful implementation of
performance funding helped set the stage for
significant changes in FY 2010 and FY 2011
Performance Funding 2.0 - Ohio
In 2009-10, Ohio shifted to funding:
Degrees
Course Completions
Extra incentives for at-risk students
Goals aligned with Strategic Plan
Additional changes are planned
Ohio has also minimized fee increases
For 2-year and open access institutions,
―success points‖

Performance Funding 2.0 – Ohio
Strategic plan mandated by the legislature
Explicit goals for the new public agenda:
Enroll and graduate more Ohioans.
Increase state aid, improve efficiency, and lower
out of pocket expenses for undergraduates.
Increase participation and success by first-
generation students.
Increase participation and success by adult
students.
Each goal has a specific metric by which progress
toward the plan is assessed annually.
Performance Funding 2.0 – Ohio
Major shift to success-based formulas
Creation of three new formulas:
University main campuses
University regional campuses
Community colleges
Endorsed by the Governor and
approved by the General Assembly in
H.B. 1 for 2009-11
Performance Funding 2.0 – Ohio’s
University Main Campuses
Shift from enrollment-based to course- and degree-completion
based formula
Cost-based course and degree allocations
Empirically-based adjustment (extra weighting) for at-risk
students
Degree-completion component to be phased in slowly
Set asides for doctoral and medical funding
Doctoral and medical funding to become more dynamic and
performance-based
Effects phased in over time
99% stop loss in FY 2010
98% stop loss in FY 2011
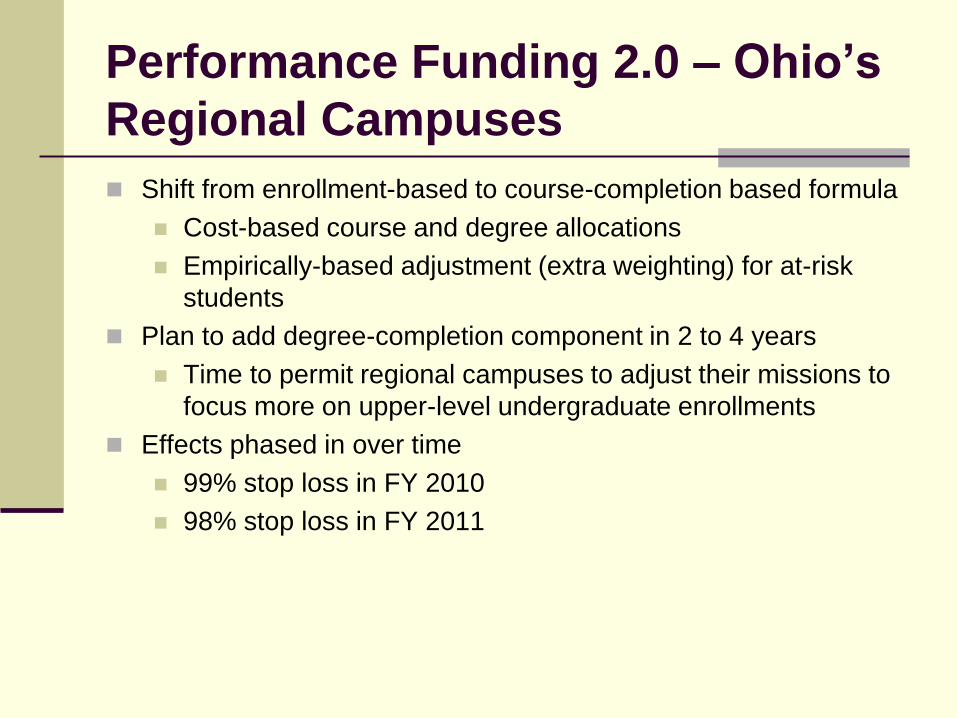
Performance Funding 2.0 – Ohio’s
Regional Campuses
Shift from enrollment-based to course-completion based formula
Cost-based course and degree allocations
Empirically-based adjustment (extra weighting) for at-risk
students
Plan to add degree-completion component in 2 to 4 years
Time to permit regional campuses to adjust their missions to
focus more on upper-level undergraduate enrollments
Effects phased in over time
99% stop loss in FY 2010
98% stop loss in FY 2011
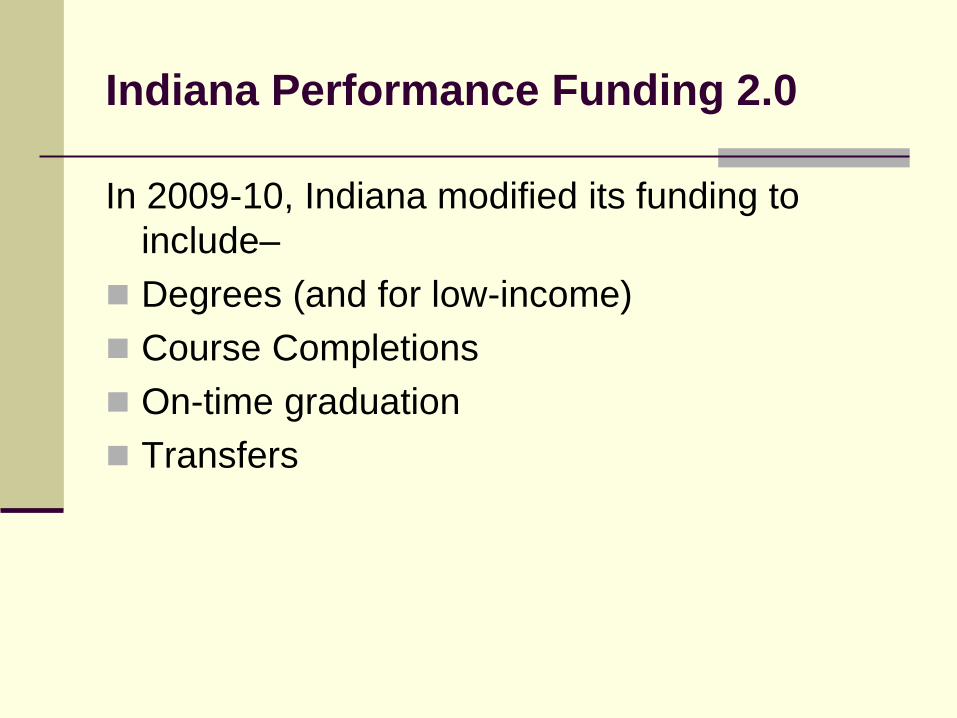
Indiana Performance Funding 2.0
In 2009-10, Indiana modified its funding to
include–
Degrees (and for low-income)
Course Completions
On-time graduation
Transfers

Performance Funding 2.0 –
Washington, Design Principles
Washington Community/technical colleges –
The Board Established a Student Success Goal
Guided by system advisory group
Planning phase involved Community College
Research Center (CCRC) and other experts
Recognize students in all mission areas (including
adult basic education and developmental education),
reflect diverse communities served by colleges

Performance Funding 2.0 -
Washington
Measures are simple, understandable, and
relevant to institution, the student and policy
makers
Measures can be influenced by the colleges
on timely basis
Colleges and the system can use the points
as evidence for promising practices and to
support and develop strategies for improving
achievement

Performance Funding 2.0 –
Washington, Achievement Measures
Measures are critical benchmarks that move students
forward towards degrees and certificates
Four categories of measures:
1. Achievement points that build towards
college-level skills
Significant adult literacy or English language
proficiency test score gains
Earning GED or high school diploma
Passing pre-college writing or math courses
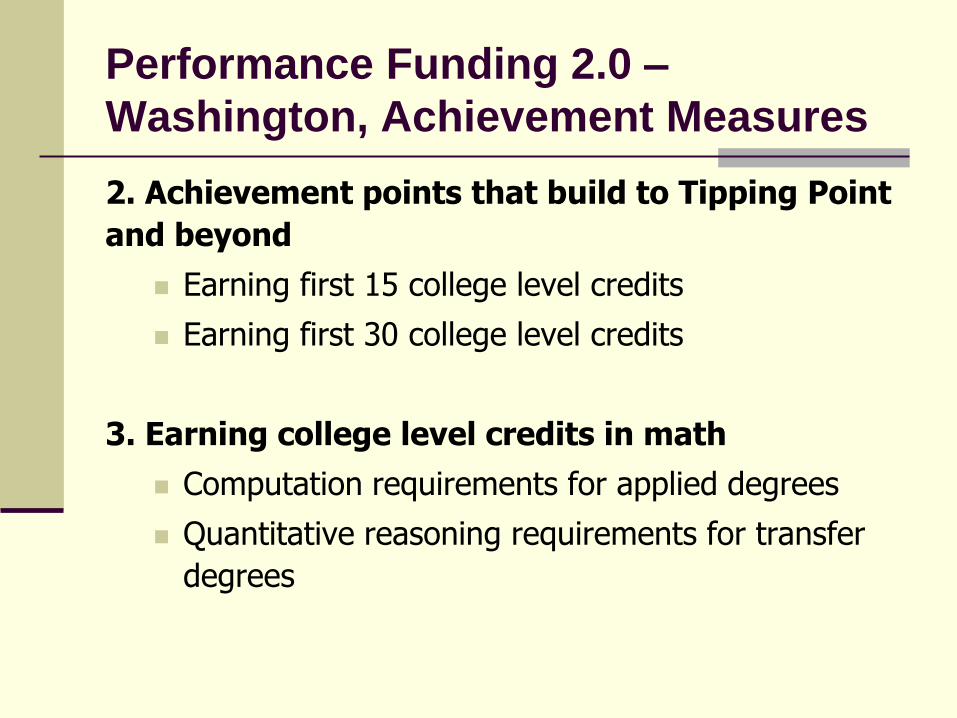
Performance Funding 2.0 –
Washington, Achievement Measures
2. Achievement points that build to Tipping Point
and beyond
Earning first 15 college level credits
Earning first 30 college level credits
3. Earning college level credits in math
Computation requirements for applied degrees
Quantitative reasoning requirements for transfer
degrees
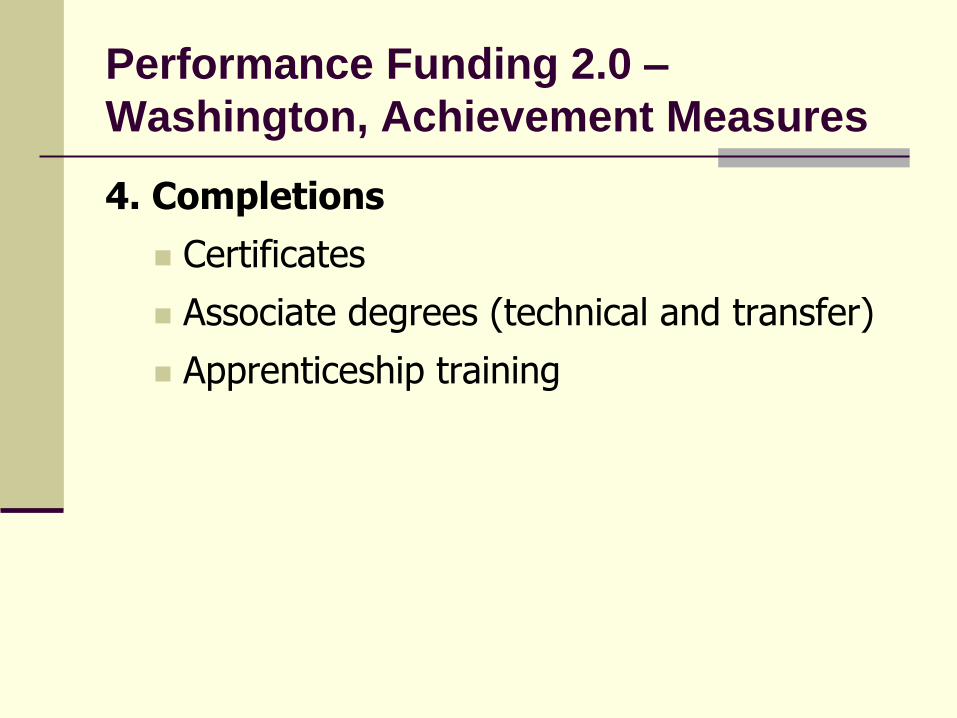
Performance Funding 2.0 –
Washington, Achievement Measures
4. Completions
Certificates
Associate degrees (technical and transfer)
Apprenticeship training

Performance Funding 2.0 -
Washington
First performance year was 2009.
Each college was measured for total point
gain compared to their baseline year- 2007.
Subsequent improvement will measure total
point gain compared to highest year.

Performance Funding 2.0 - Tennessee
Current Formula is primarily enrollment based with component for peers
Tennessee implemented performance funding in the 1980’s focusing on undergraduate education – institutions could earn up to 5.45 percent based on performance
New performance funding formula is to be implemented in 2011-12 (and phased-in)
Performance Funding 2.0 - Tennessee
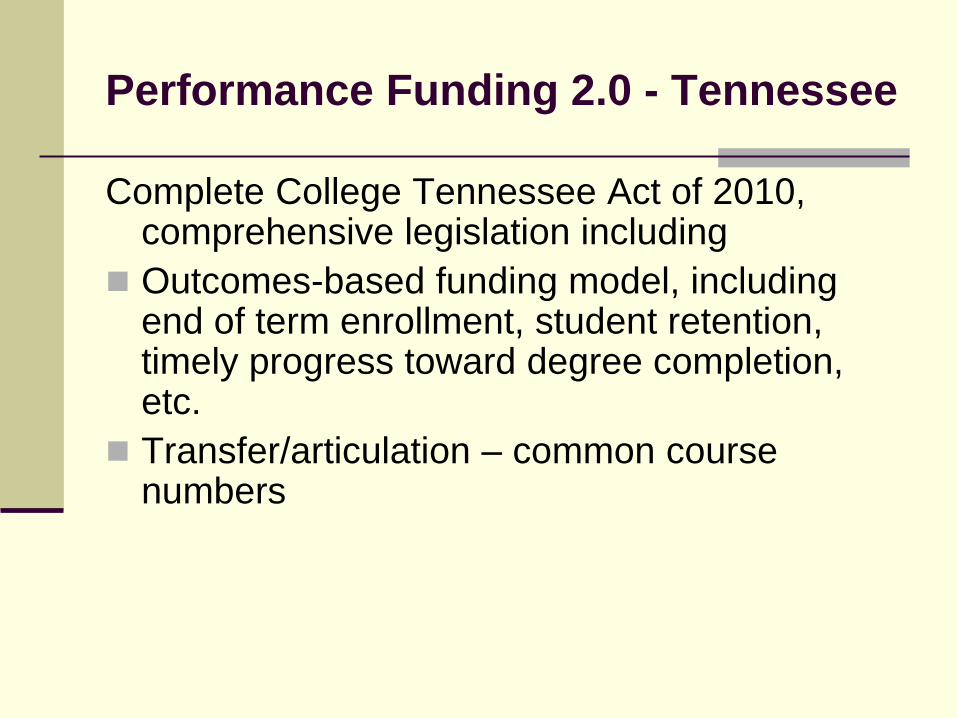
Complete College Tennessee Act of 2010, comprehensive legislation including
Outcomes-based funding model, including end of term enrollment, student retention, timely progress toward degree completion, etc.
Transfer/articulation – common course numbers

Tennessee Current Proposal
• Identify an outcome (degree attainment,
transfer activity, student retention, etc.)
• Award ―points‖
• Weight the outcome based on an institution’s
mission
• Use Average Faculty Salary based on Mission
• Add fixed costs (m/o, utilities, etc.)
• Add Performance Funding

Tennessee University Factors
• Students accumulating 24 hours
• Students accumulating 48 hours
• Students accumulating 72 hours
• Bachelors and Associate Degrees
• Masters/Ed Specialists Degrees
• Doctoral/Law Degrees
• Research and Service
• Transfers Out with 12 Hours
• Degrees per 100 FTE
• Six-year Graduation Rate

Tennessee - Community College Factors
• Students accumulating 12 hours
• Students accumulating 24 hours
• Students accumulating 36 hours
• Dual Enrollment
• Associate Degrees
• Certificates
• Job Placement
• Remedial and Developmental Success
• Transfers Out with 12 Hours
• Workforce Training (contact hours)
• Awards per FTE
Louisiana
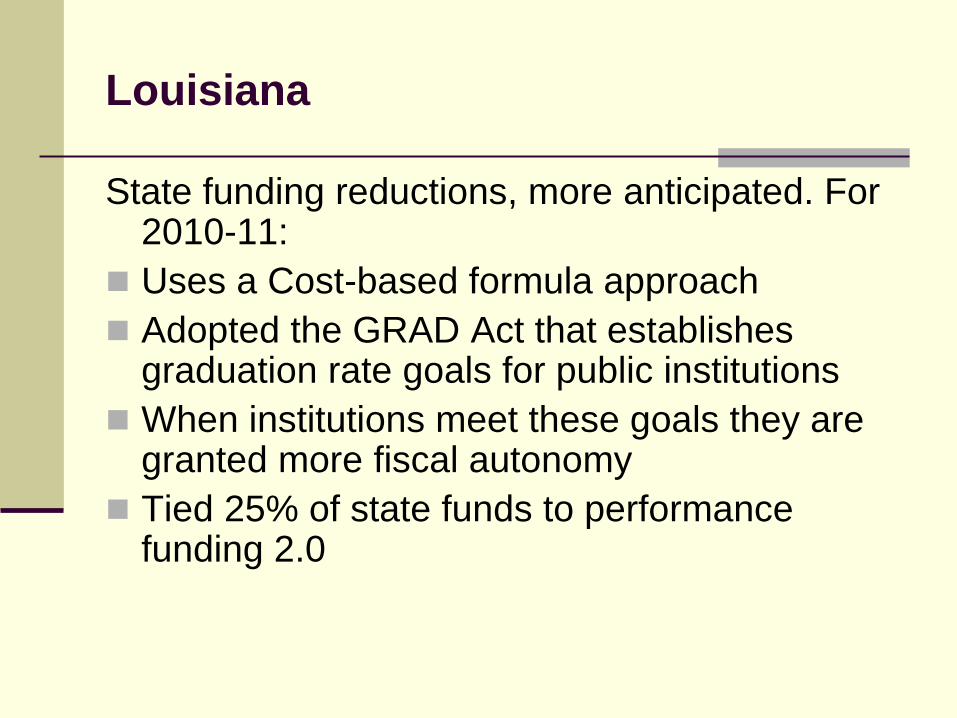
State funding reductions, more anticipated. For 2010-11:
Uses a Cost-based formula approach
Adopted the GRAD Act that establishes graduation rate goals for public institutions
When institutions meet these goals they are granted more fiscal autonomy
Tied 25% of state funds to performance funding 2.0
Performance Funding 2.0 - Louisiana
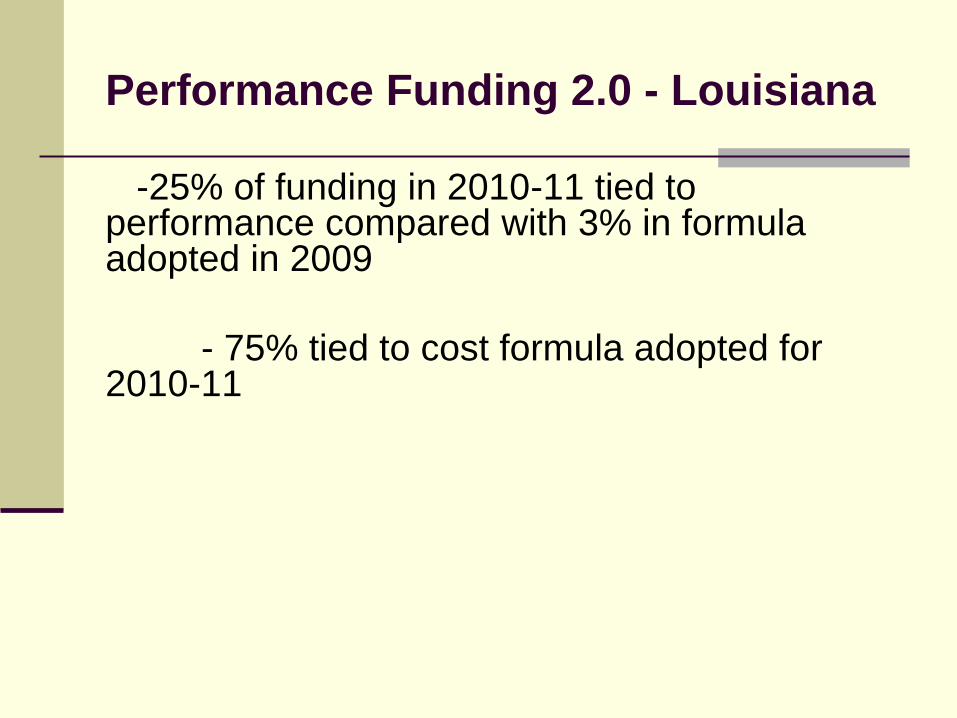
-25% of funding in 2010-11 tied to performance compared with 3% in formula adopted in 2009
- 75% tied to cost formula adopted for 2010-11
Performance Funding 2.0 - Louisiana
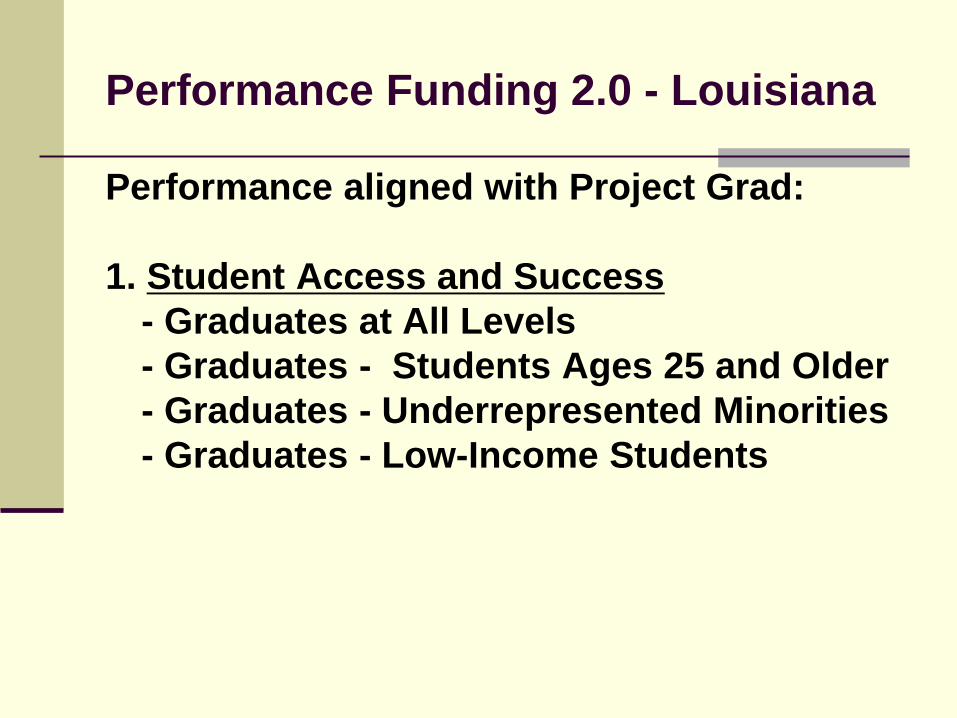
Performance aligned with Project Grad:
1. Student Access and Success
- Graduates at All Levels
- Graduates - Students Ages 25 and Older
- Graduates - Underrepresented Minorities
- Graduates - Low-Income Students
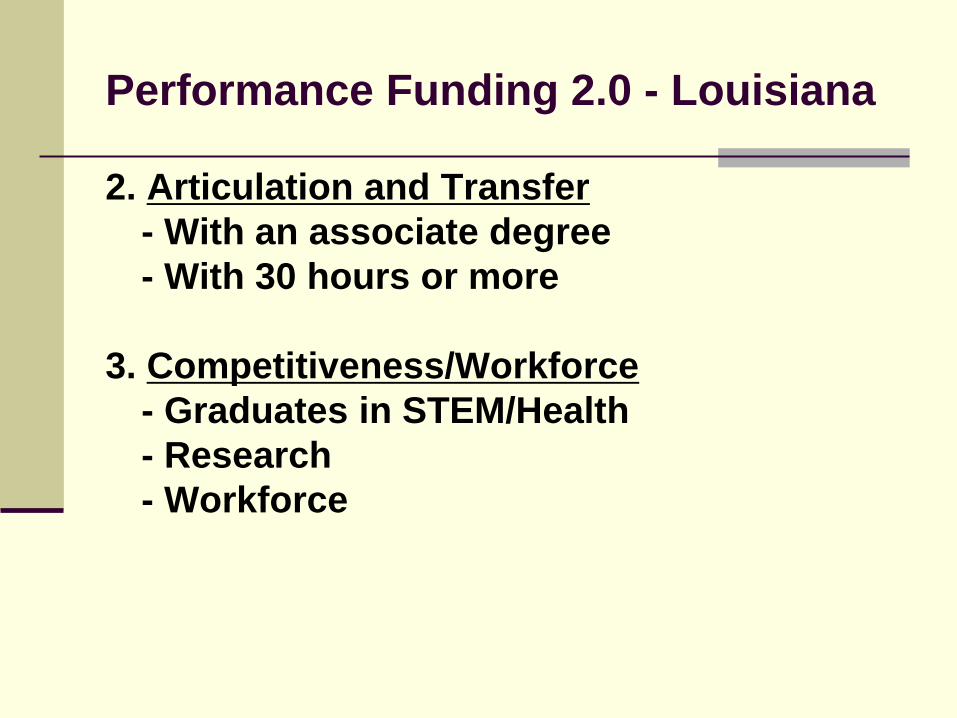
Performance Funding 2.0 - Louisiana
2. Articulation and Transfer
- With an associate degree
- With 30 hours or more
3. Competitiveness/Workforce
- Graduates in STEM/Health
- Research
- Workforce
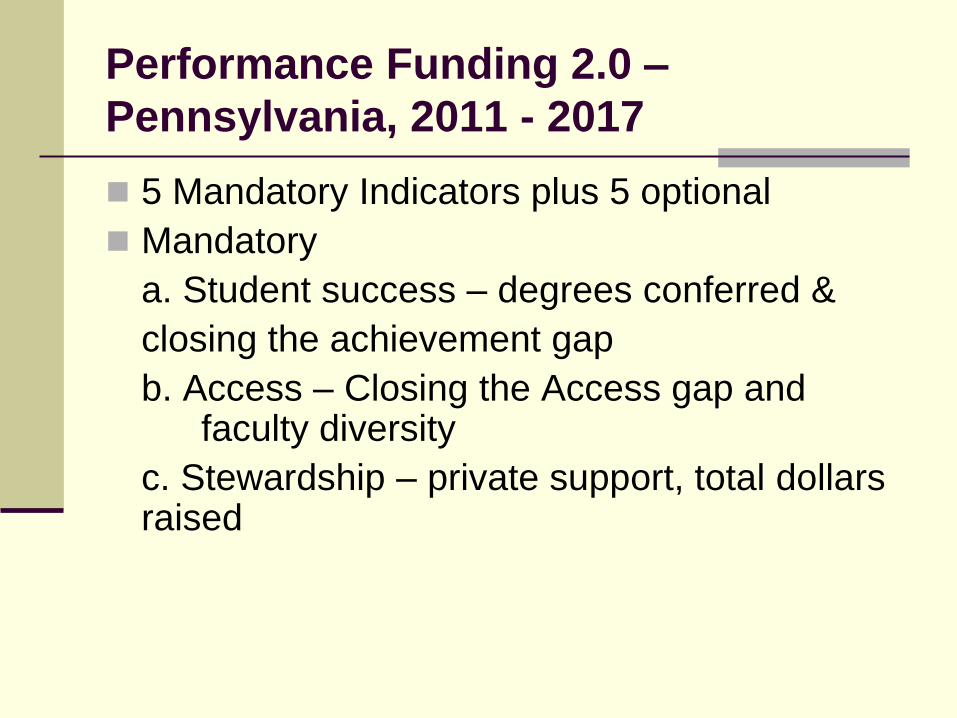
Performance Funding 2.0 –
Pennsylvania, 2011 - 2017
5 Mandatory Indicators plus 5 optional
Mandatory
a. Student success – degrees conferred &
closing the achievement gap
b. Access – Closing the Access gap and faculty diversity
c. Stewardship – private support, total dollars raised
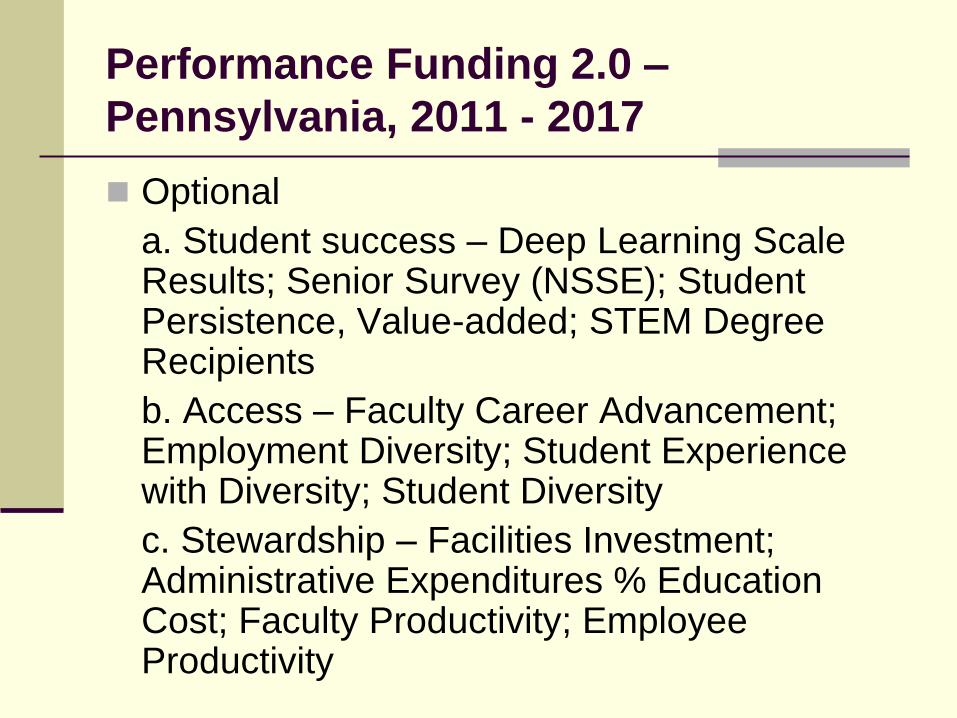
Performance Funding 2.0 –
Pennsylvania, 2011 - 2017
Optional
a. Student success – Deep Learning Scale Results; Senior Survey (NSSE); Student Persistence, Value-added; STEM Degree Recipients
b. Access – Faculty Career Advancement; Employment Diversity; Student Experience with Diversity; Student Diversity
c. Stewardship – Facilities Investment; Administrative Expenditures % Education Cost; Faculty Productivity; Employee Productivity
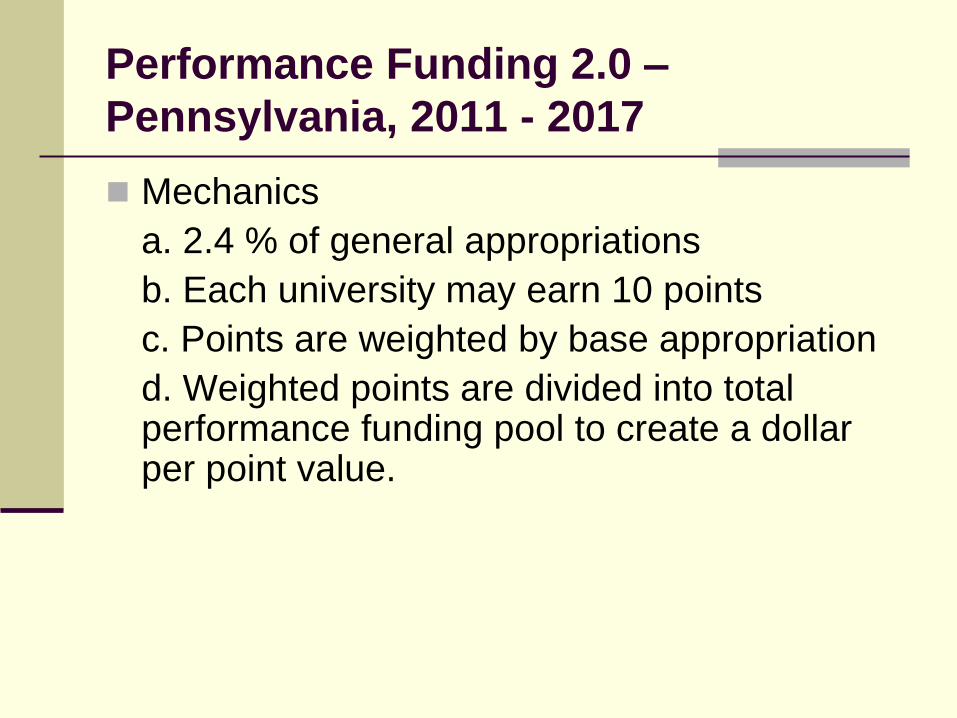
Performance Funding 2.0 –
Pennsylvania, 2011 - 2017
Mechanics
a. 2.4 % of general appropriations
b. Each university may earn 10 points
c. Points are weighted by base appropriation
d. Weighted points are divided into total performance funding pool to create a dollar per point value.

Performance Funding 2.0 – Arizona
Universities, Proposed FY 2013
Base + Adjustments to Base (COL, benefits, utilities, new campuses) + Performance Funding
Performance Funding – 3 components
a) Increases in numbers of degrees, weighted by level and costs
b) Increased in completed student credit hours, weighted by cost and level
c) Increases in outside funding for research/public service
Use of 3-year average
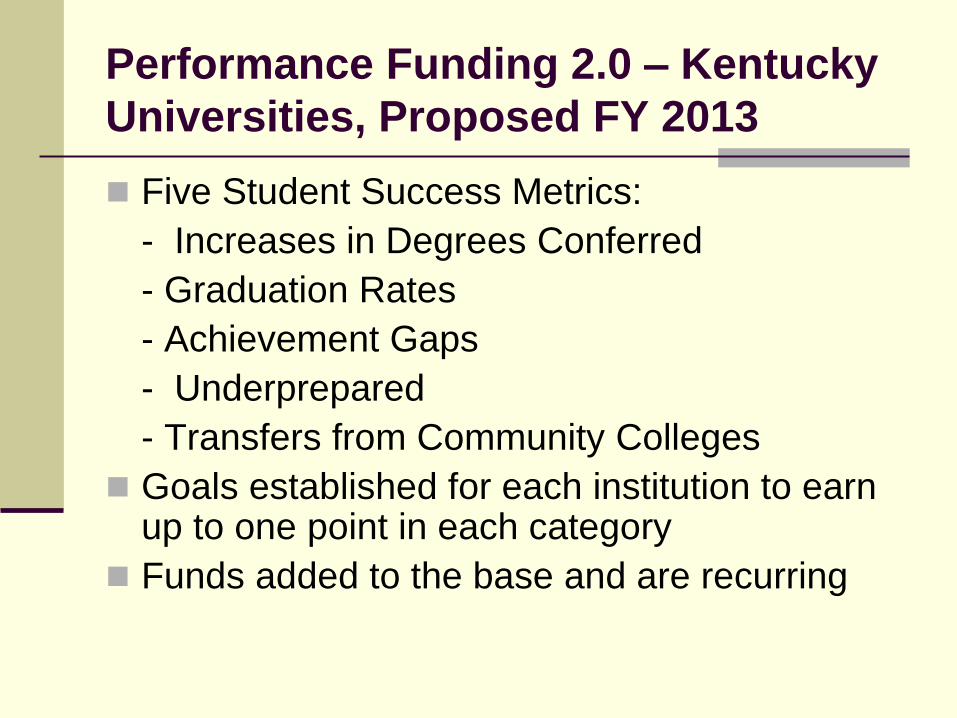
Performance Funding 2.0 – Kentucky
Universities, Proposed FY 2013
Five Student Success Metrics:
- Increases in Degrees Conferred
- Graduation Rates
- Achievement Gaps
- Underprepared
- Transfers from Community Colleges
Goals established for each institution to earn up to one point in each category
Funds added to the base and are recurring

Performance Funding 2.0 – Other
States
Oklahoma
Texas

Pros and Cons of Performance
Funding Advantages Disadvantages
Align state goals with
results
- Institutions
- Students
Focus on Quality
Difficult to Design and take
into account mission
Could it lead to grade
inflation?
Does Performance Funding Make a
Difference?
Tennessee
Florida
Ohio

What Can Policy Makers Do?
Ask Questions
Create High Expectations
Focus on Key Issues and Establish a Clearly
Stated Purpose with Simple, Measurable
Benchmarks
Understand What Factors Affect Results
Involve Higher Education in Goal Setting
Recognize that One Size Does Not Fit All
Promote Collaboration

Questions For Board Members to Ask
About Performance Funding
1) Does it link to Illinois’ Agenda for College and
Career Success?
2) Does it recognize differences in institutional
mission and students served?
3) Does it provide incentives for success of at-
risk students?
4) Does it encourages improvement for all
institutions?

Questions For Board Members to Ask
About Performance Funding
5) Does it recognize Illinois’ needs?
6) Does it have the commitment of and
credibility with political and higher education
leaders?
7) Is it supported by institutions who ―speak with
one voice‖?

Questions For Board Members to Ask
About Performance Funding
8) Does it promote access, success, and quality?
9) Does it rely on valid, consistent information?
10) Does it includes an implementation or
transition strategy?
What Can Policy Makers Do?
Ask Questions
Create High Expectations
Focus on Key Issues and Establish a Clearly
Stated Purpose with Simple, Measurable
Benchmarks
Understand What Factors Affect Results
Involve Higher Education in Goal Setting
Recognize that One Size Does Not Fit All
Promote Collaboration