
A Proposed Program to Predict the Performance of Steam Power Plants
Upload
independentCategory
view
4download
0
1
FUNDAMENTALS OF
POWER PLANTS
Asko Vuorinen

2
Engine cycles
� Carnot Cycle� Otto Cycle� Diesel Cycle� Brayton Cycle� Rankine Cycle� Combined Cycles
3
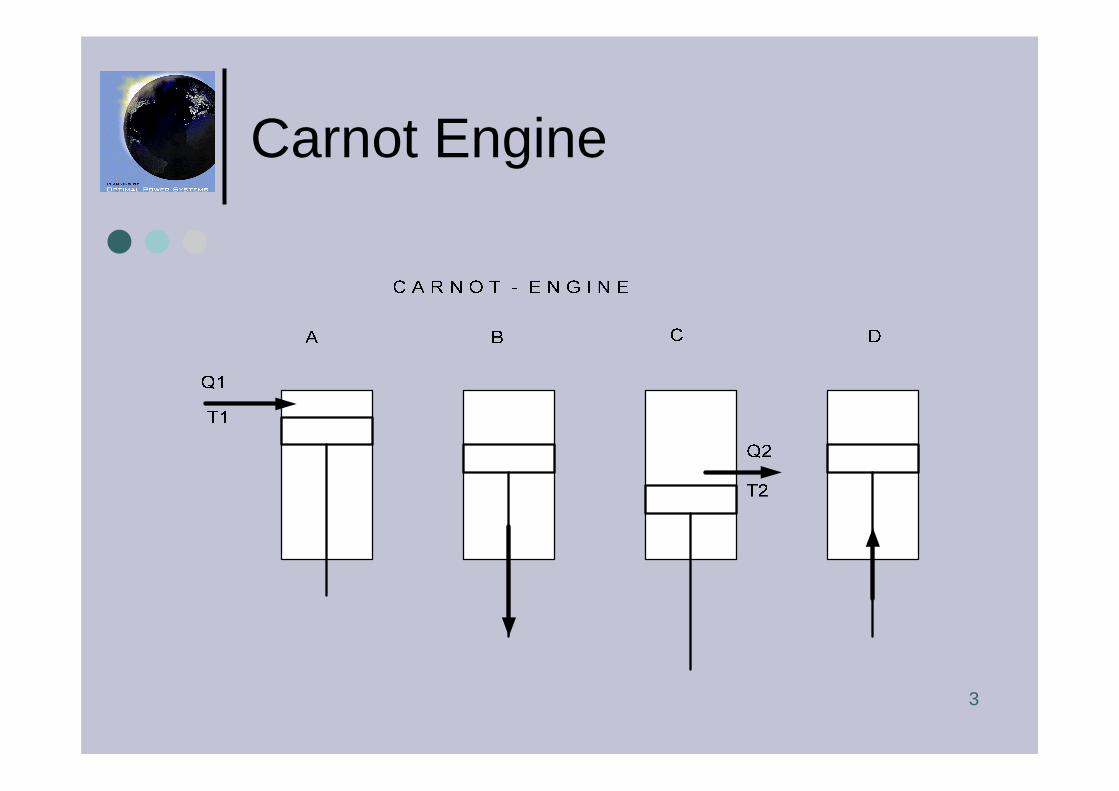
Carnot Engine
4
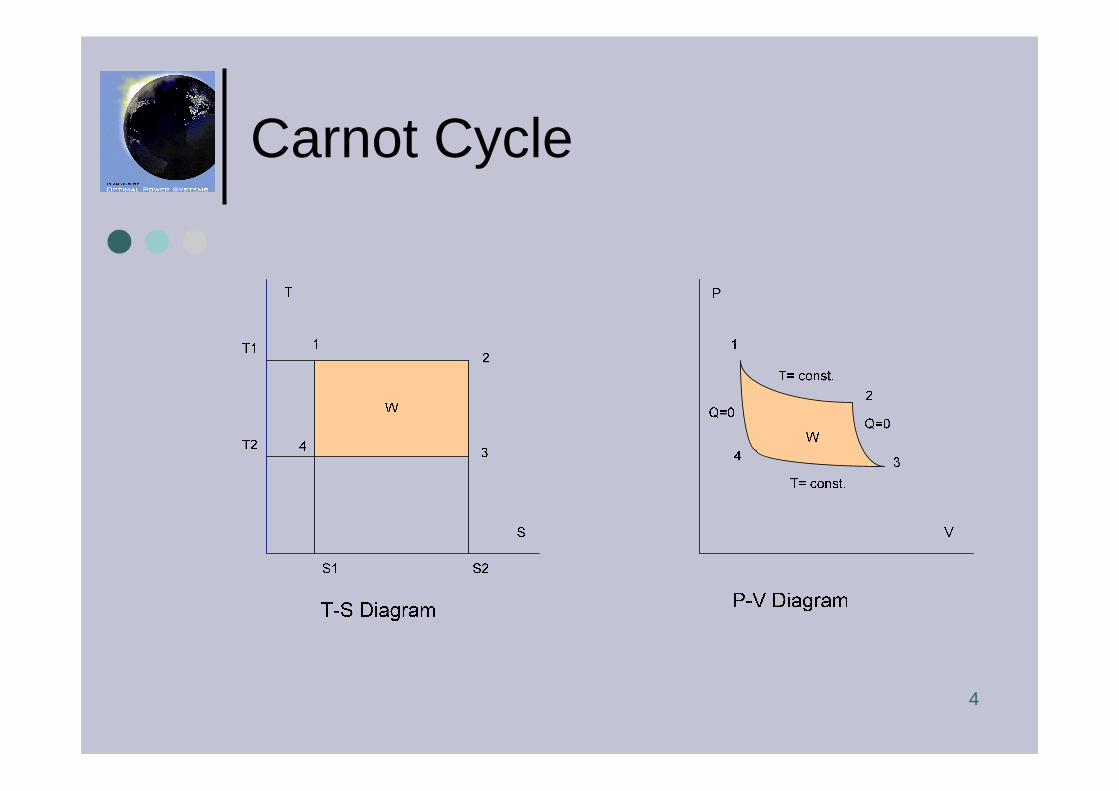
Carnot Cycle
5
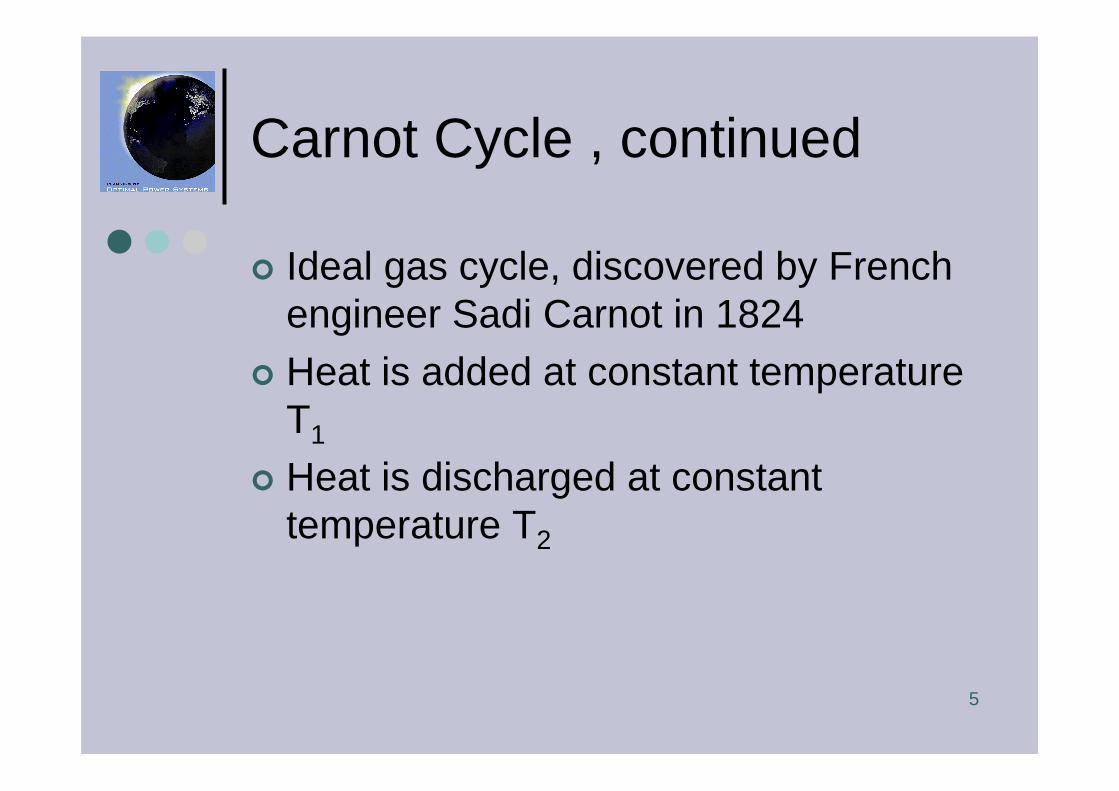
Carnot Cycle , continued
� Ideal gas cycle, discovered by Frenchengineer Sadi Carnot in 1824
� Heat is added at constant temperatureT1
� Heat is discharged at constanttemperature T2

6
Carnot Cycle , continued
Efficiencyη = 1 – T2/T1
The work done is area W in diagram
Higher the T1 and lower T2 more workcan be done by the Carnot engine
7
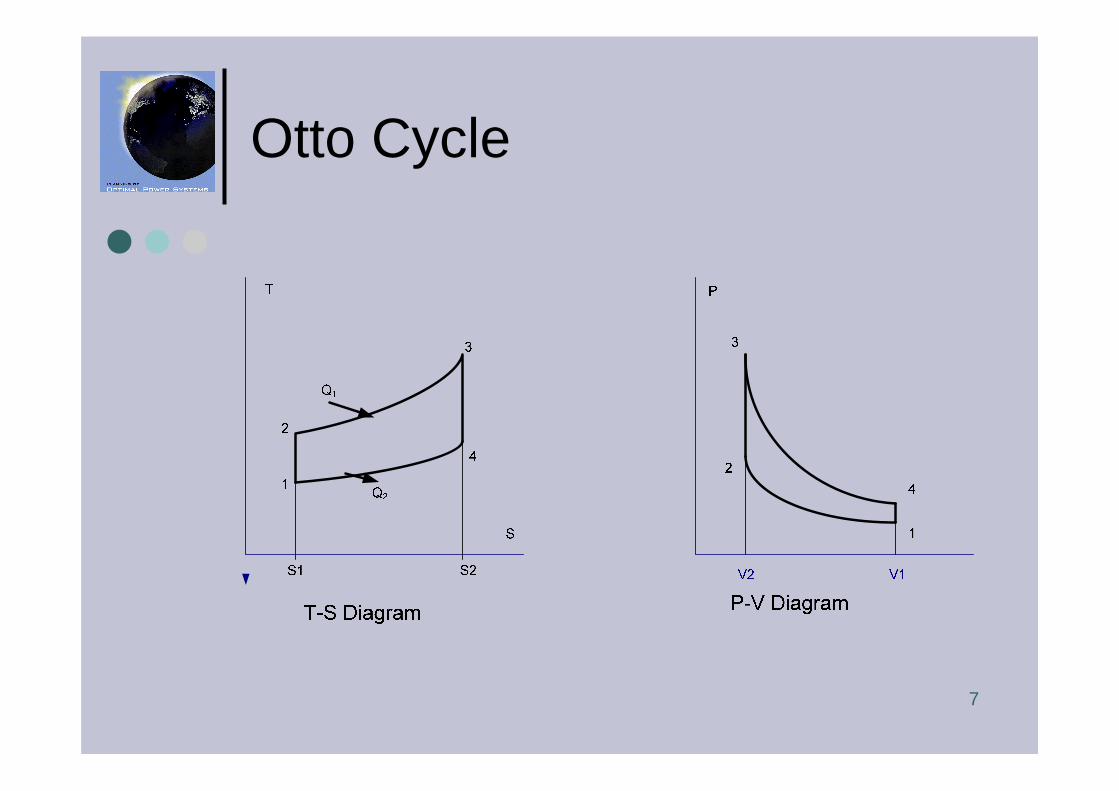
Otto Cycle
8
Otto Cycle, continued
� Nicolaus Otto discoverd spark ignition(SI) four stroke gas engine 1876
� Heat is added in constant volume V1at top dead center (TDC) by ignitinggas air mixture by spark
� Heat is discharged at constant volumeV2 at botton dead center (BDC)
9
Otto Cycle, continued
Efficiency of Otto Engine
η = 1 – 1/ r k-1
wherer = compression ratio= V2/V1
k= gas constant
10
Otto Cycle, continued
� Spark ignition (SI) engines are mostbuilt engines in the world
� About 40 million engines/a for cars(200 000 MW)
� About 4000 engines/a for powerplants (4000 MW/a)
11
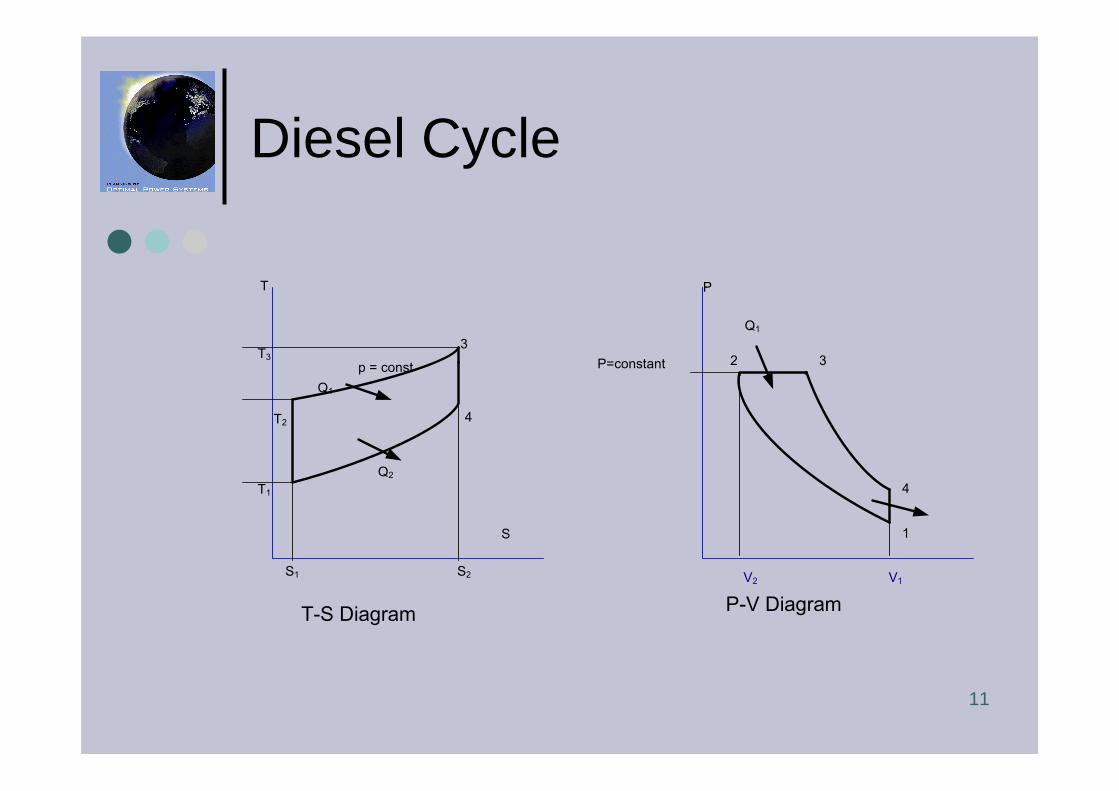
Diesel Cycle
V2 V1
T
S
T1
T2
S1 S2
P
T-S DiagramP-V Diagram
3
4
3
4
1
Q1
Q2
p = const
Q1
P=constant 2T3
12
Diesel Cycle, continued
� Rudolf Diesel outlined Diesel enginein 1892 in his patent
� Heat is added at constant pressureand discharged at constant volume
� Ignition happens by self ignition byinjecting fuel at top dead center
� Some call Diesel engines as compression ignion (CI) engines

13
Diesel Cycle, continued
Efficiencyη = 1 – 1 /r k-1 (rc
k – 1)/(k(rc-1)where
r = comperssion ratio = V2/V1
rc = cut off ratio = V3/V2
noteIf r is the same, Diesel cycle has lowerefficiency than Otto cycle

14
Diesel Cycle, continued
� Diesel engines are most built energyconversion machines after SI-engines
� Car industry builds about 20 million/a diesel cars and trucks (200000 MW/a)
� > 90 % market share in large ships� Power plant orders are 30 000 MW/a

15
Brayton Cycle
V2 V1 V4
T
S
T1
T2
S1
S2
P
V
T-S DiagramP-V Diagram
2
3
4
1
3
4
1
Q1
Q2
p = const
Q1
Q2
P2=constant 2
P1=constantp = const
T3

16
Brayton Cycle
17
Brayton Cycle
� Developed by Georg Brayton (1832 -1890)
� Heat is added and discharged at constant pressure
� Applied in Gas Turbines (GT) (Combustion Turbines in US)
18
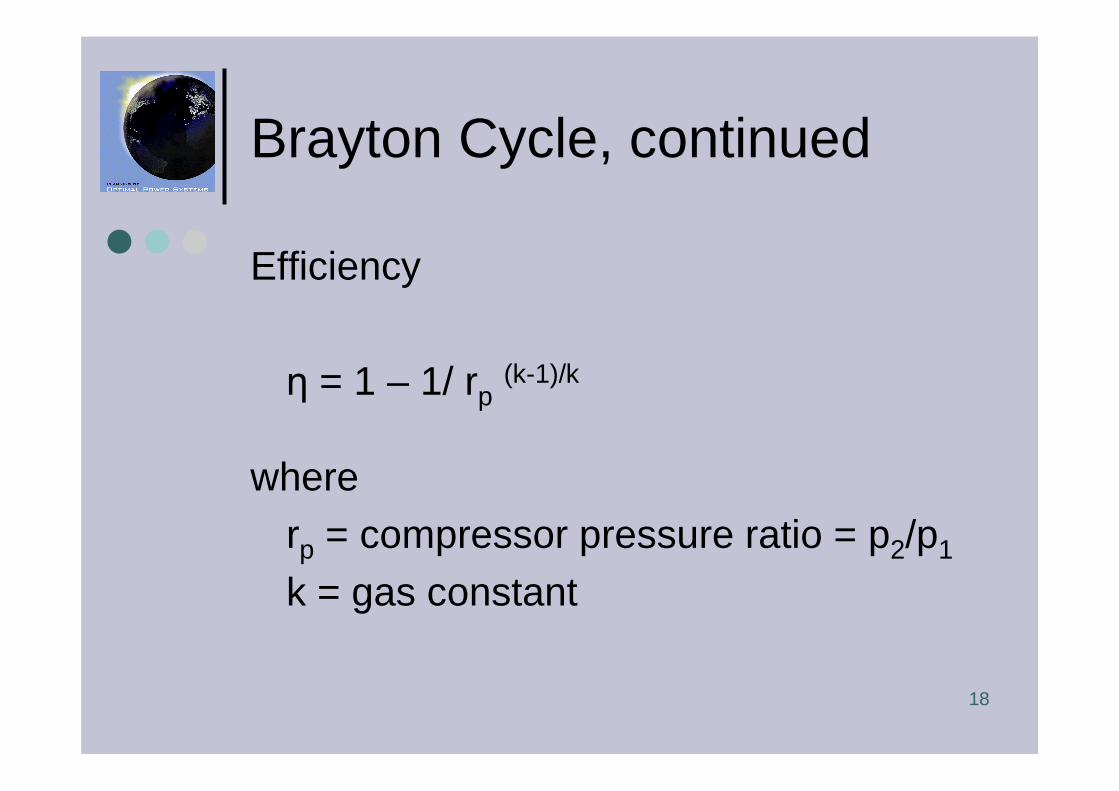
Brayton Cycle, continued
Efficiency
η = 1 – 1/ rp(k-1)/k
whererp = compressor pressure ratio = p2/p1
k = gas constant
19
Brayton cycle, continued
� Gas turbines are number third powerconversion machines after SI- and CI-engines
� > 90 % market share in largeairplanes
� Power plant orders are 40 000 MW/a
20
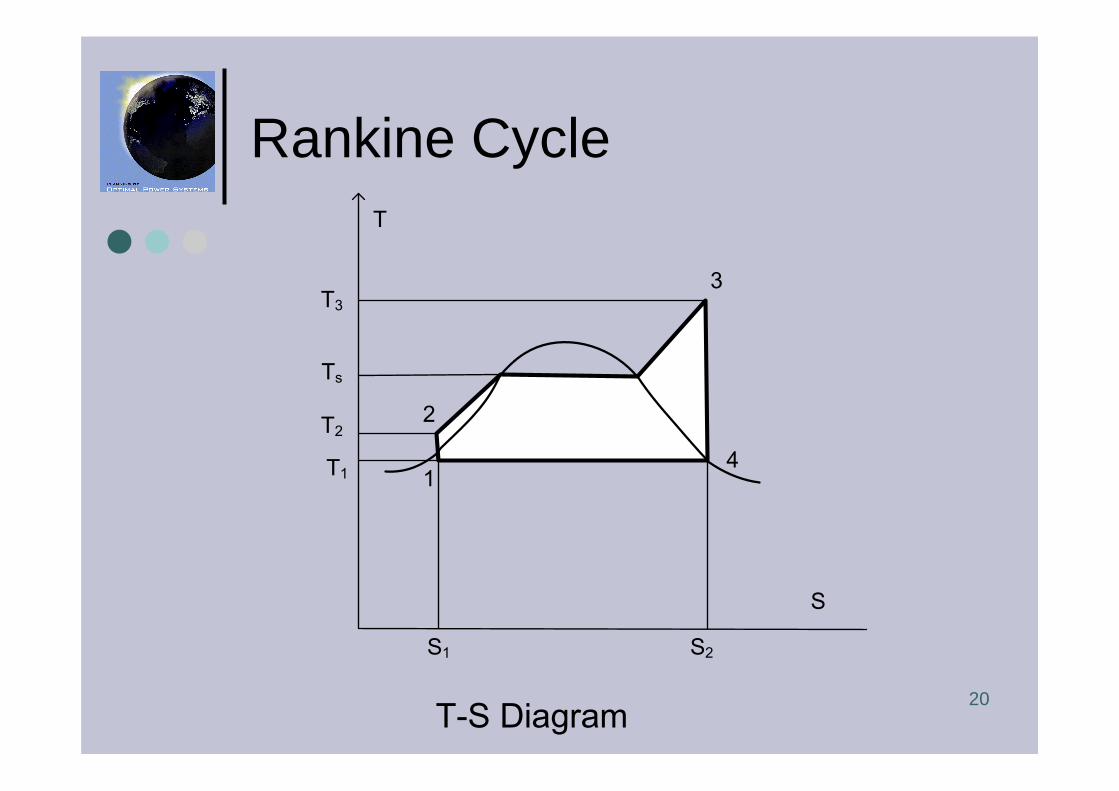
Rankine CycleT
T1
T2
S1 S2
T-S Diagram
2
3
41
T3
S
Ts
21
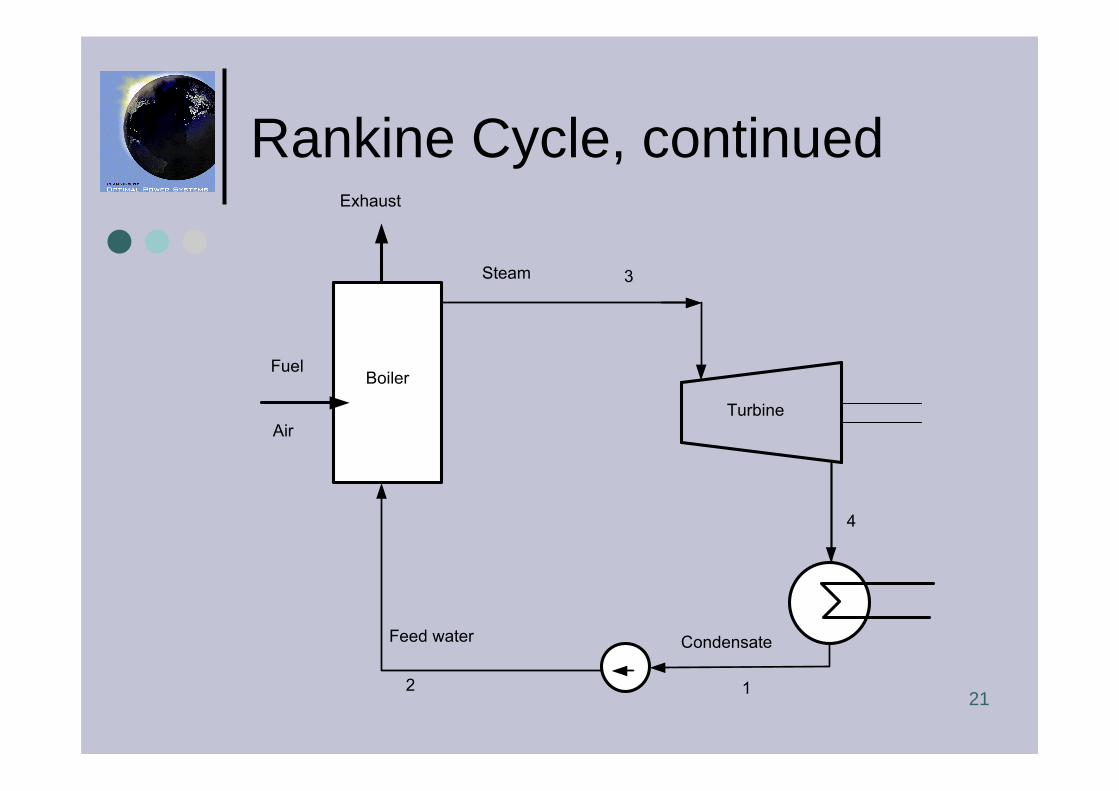
Rankine Cycle, continued
Turbine
3
4
Boiler
Steam
Feed water
12
Condensate
Fuel
Exhaust
Air
22
Rankine Cycle, continued
� Scottish engineer William Rankine (1820-1872) developed a theory of steam cycles
� Heat is added in a water boiler, where the water becomes steam
� Steam is fed to a steam turbine, whichgenerates mechanical energy
� After turbine the steam becomes water againin a condenser
23
Rankine cycle, continued
� The efficiency varies from 20 % in small subcritical steam turbines to 45 % in large double reaheat supercriticalsteam turbines
� The rankine cycle is ideal for solid fuel(coal, wood) power plants
24
Rankine cycle, continued
� Steam turbines are most soldmachines for power plants as measured in output (100 000 MW/a)
� They are used in coal fired, nuclearand combined cycle power plants
� Coal and nuclear plants generateabout 50 % of world electricity
25
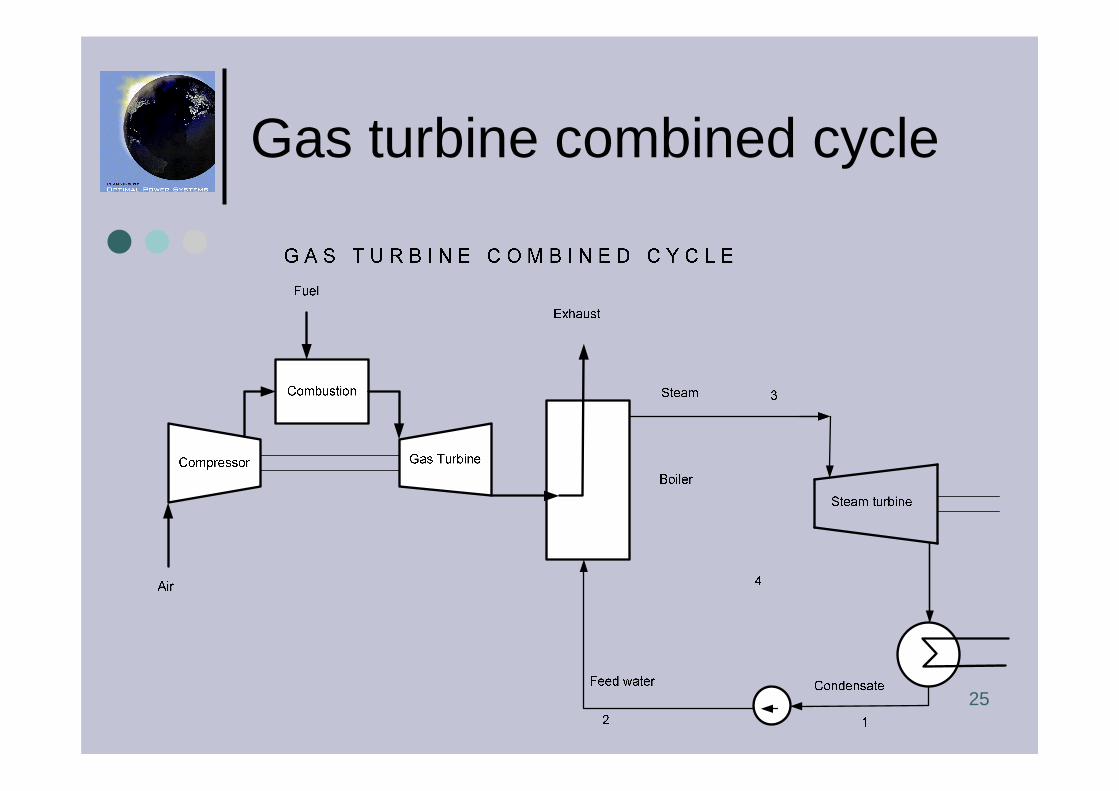
Gas turbine combined cycle
26
Gas Turbine Combined Cycle
� Combines a gas turbine (Brayton cycle) and steam turbine (Rankine Cycle)
� About 66 % of power is generated in gas turbine and 34 % in steam turbine
� Efficiency of GTCC plant is typically1.5 times the efficiency of the single cycle gas turbine plant

27
IC Engine Combined Cycle
28
IC Engine Combined Cycle
� Combines a Internal combustionEngine (Diesel or Otto cycle) and steam turbine (Rankine Cycle)
� About 90 % of power is generated in gas turbine and 10 % in steam turbine
� Efficiency of GTCC plant is typically1.1 times the efficiency of the single cycle IC engine plant

29
Electrical efficiency
Efficiency η = (P- Paux)/Q x Kt x Kl
whereP = electrical outputPaux = auxiliary power consumptionQ = heat outputKt = temperature correction factorKl = part load correction factor
30
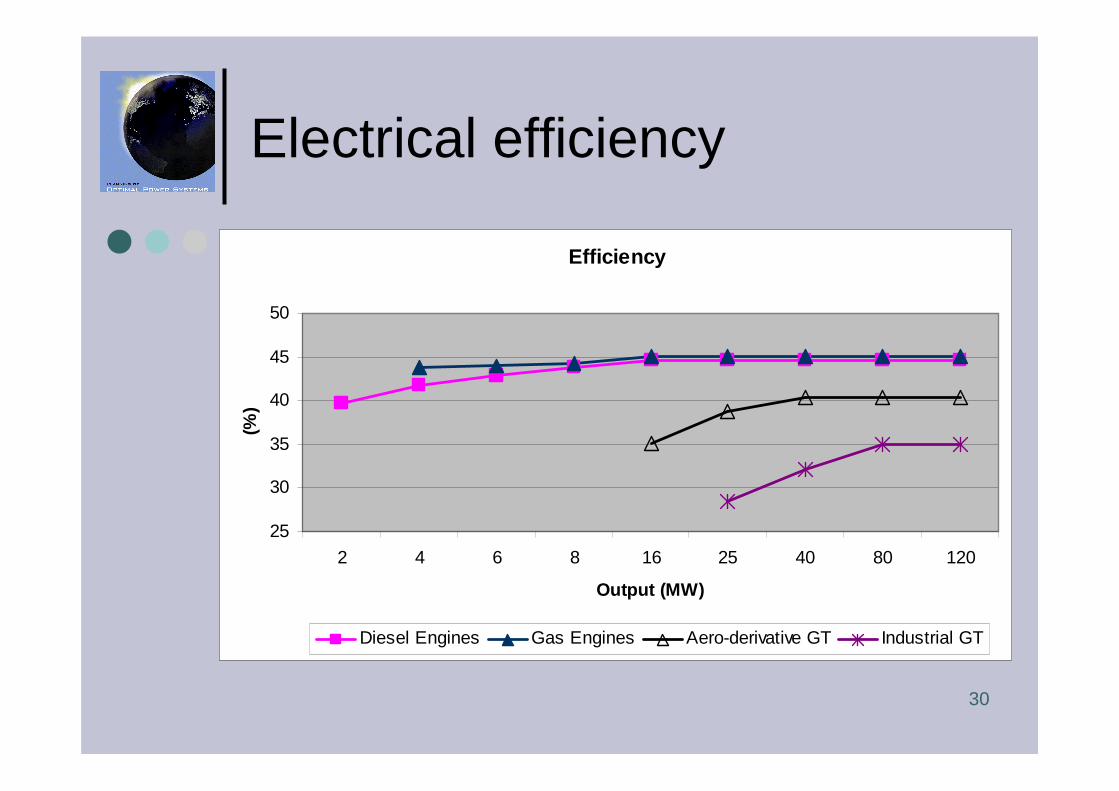
Electrical efficiency
Efficiency
25
30
35
40
45
50
2 4 6 8 16 25 40 80 120
Output (MW)
(%)
Diesel Engines Gas Engines Aero-derivative GT Industrial GT

31
Efficiency correction factorfor ambient temperature
Efficiency correction factor for ambient temperatur e
0,85
0,90
0,95
1,00
1,05
1,10
1,15
-30 -20 -10 0 10 20 30 40 50
Ambien temperature (oC)
IC- Engine Gas Turbine
32
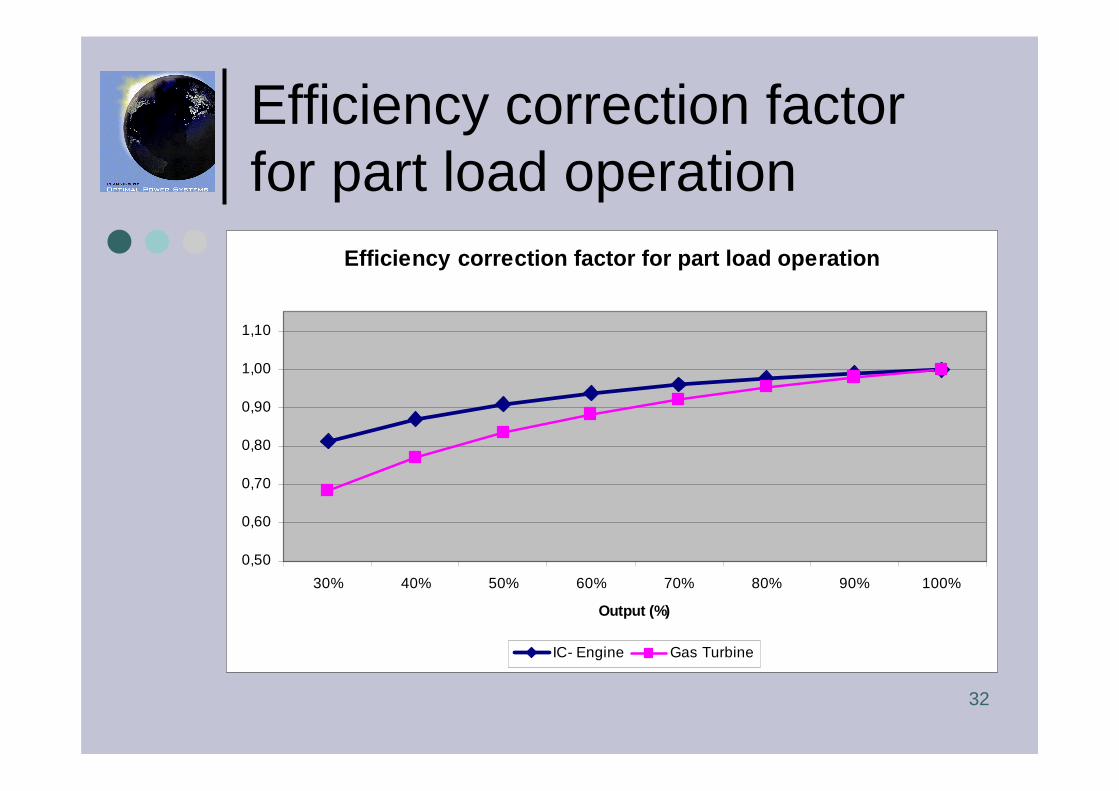
Efficiency correction factorfor part load operation
Efficiency correction factor for part load operatio n
0,50
0,60
0,70
0,80
0,90
1,00
1,10
30% 40% 50% 60% 70% 80% 90% 100%
Output (%)
IC- Engine Gas Turbine

33
Classification of power plantsby place of combustion
� Internal combustion engines� Diesel engines� Gas engines� Dual-fuel engines
� External combustion engines� Steam engines� Stirling engines� Gas turbines� Steam turbines
34
Classification of internalcombustion engines
� By speed or rotation� Low speed < 300 r/min (ship engines)� Medium speed 300 - 1000 r/min (power
plants)� High speed > 1000 r/min (Standby power
plants and cars)
� By number of strokes� 2 - stroke (large ships) � 4 - stroke (power plants and cars)

35
Classification of internalcombustion engines, continued
� By type of combustion� Lean burn (lambda > 1.2 -2.2)� Stoichiometric (lambda = 1)
� By combustion chamber� Open chamber� Pre-chamber

36
Classification of internalcombustion engines, continued
By fuel� Heavy fuel oil (HFO)� Light fuel oil (LFO) � Liquid bio fuel (LBF)� Natural gas (NG)� Dual-fuel (NG/LFO)� Tri-fuel (NG/LFO/HFO)� Multi-fuel (NG/LFO/HFO/LBF)
37
Classification of gas turbines
� By type� Industrial (single shaft)� Aeroderivative (two shaft)� Microturbines (50 – 200 kW)
� By fuel� Light fuel oil (LFO)� Natural gas (NG)� Dual-fuel (NG/LFO)

38
Classification of steamturbine power plants
� By steam parameters� Subcritical (400 - 540 oC, 10 -150 bar)� Supercritical (600 oC, 240 bar)
� By fuel� Coal, lignite, biomass� Heavy fuel oil (HFO)
� Dual-fuel (gas/HFO)

39
Classification of nuclearpower plants
� By type of nuclear reaction� Fission (splitting U235 atoms)� Fusion (fusion of deuterium and
tritium)
� By energy of neutrons in chainreaction� Fast reactors (fast neutrons)
� Thermal reactors (”slow neutrons”)
40
Classification of thermalreactors
� By moderator (slow down of neutrons)� Water� Graphite
� By cooling media � Water� Helium
41
Classification of watercooled reactors
� Pressurised water� Toshiba (Westinghouse), Mitsubishi
(Japan), Areva (France), Rosatom (Russia)
� Boiling water� General Electric (USA)
� Heavy water� AECL (Canada)
42
Operating parameters
� Start-up time (minute)� Maximum step change (%/5-30 s)� Ramp rate (change in minute)� Emissions

43
Start-up time
� Diesel engines 1 - 5 min� Gas engines 5 - 10 min� Aeroderivative GT 5 - 10 min� Industrial GT 10 - 20 min� GT Combined Cycle 30 – 60 min� Steam turbine plants 60 – 600 min

44
Maximum change in 30 s
� Diesel engines 60 - 100%� Gas engines 20 - 30 %� Aeroderivative GT 20 - 30 %� Industrial GT 20 - 30 %� GT Combined Cycle 10 - 20 %� Steam turbine plants 5 - 10 %� Nuclear plant 5 - 10 %
45
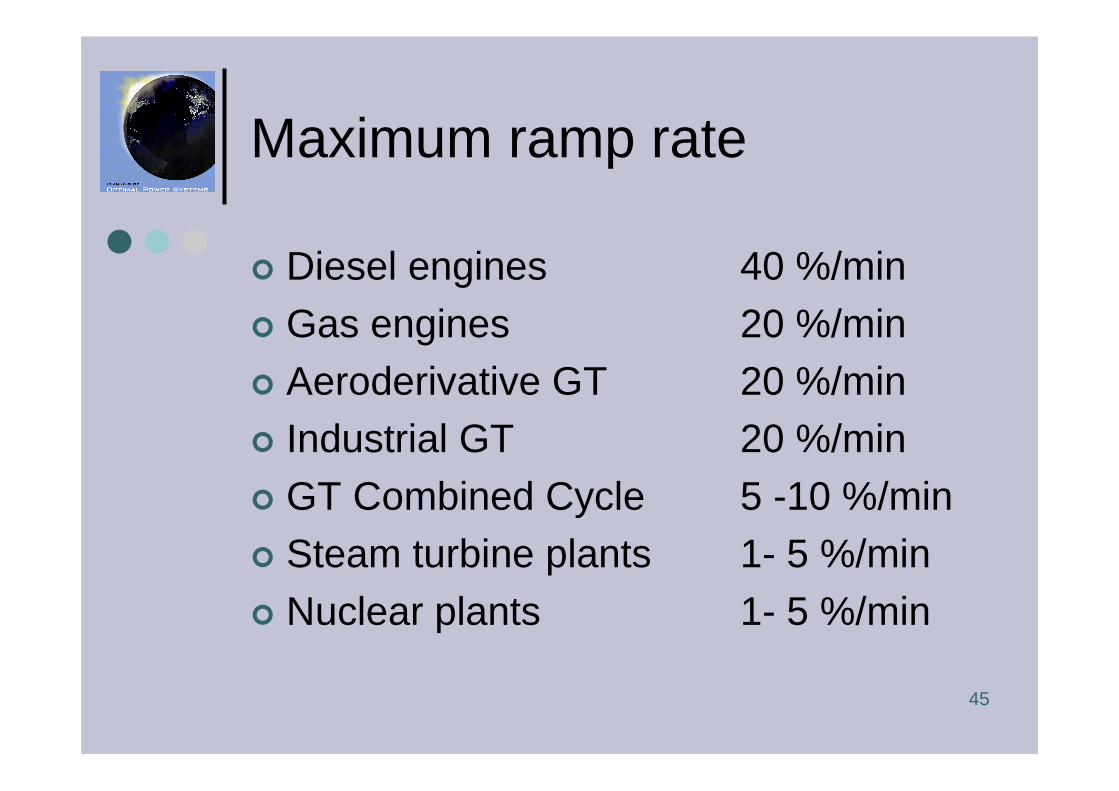
Maximum ramp rate
� Diesel engines 40 %/min� Gas engines 20 %/min� Aeroderivative GT 20 %/min� Industrial GT 20 %/min� GT Combined Cycle 5 -10 %/min� Steam turbine plants 1- 5 %/min� Nuclear plants 1- 5 %/min

46
CO2 emissions
� Gas fired plants g/kWh� CHP 90 % efficiency 224� GTCC 55 % efficiency 367� Gas Engine 45 % efficiency 449� Gas Turbine 33 % efficiency 612
� Coal fired plants� Supercritical 45 % efficiency 757� Subcritical 38 % efficiency 896
47
Summary
� Power plants have differentefficiencies, emissions and operational characteristics
� You should know the alternativesbefore start to plan of optimal powersystems

48
For details see reference text book”Planning of Optimal Power Systems”
www.optimalpowersystems.com
Author:Asko Vuorinen
Publisher:Ekoenergo Oy
Printed:2007 in Finland
Further details andinternet orders see:
Copyright © 2022 FDOKUMEN