Does proximity to coal-fired power plants influence fish tissue mercury?
11
Does proximity to coal-fired power plants influence fish tissue mercury? Dana K. Sackett • D. Derek Aday • James A. Rice • W. Gregory Cope • David Buchwalter Accepted: 4 September 2010 Ó Springer Science+Business Media, LLC 2010 Abstract Much of the mercury contamination in aquatic biota originates from coal-fired power plants, point sources that release mercury into the atmosphere. Understanding mercury dynamics is primarily important because of the toxic threat mercury poses to wildlife and humans through the consumption of contaminated fish. In this study, we quantified the relative importance of proximity to coal-fired power plants on mercury accumulation in two fish species of different trophic positions. Fish, water and sediment were collected and analyzed from 14 lakes, seven near to ( \ 10 km) and seven far from ( [ 30 km) coal-fired power plants. Lower tissue mercury and higher tissue selenium concentrations were measured in fish collected near power plants. Moreover, mercury accumulation in fish was driven by biotic characteristics (e.g., trophic position, total length, age), waterbody characteristics (e.g., pH, dissolved organic carbon and sulfate) and distance from power plants. Proximity to an atmospheric point-source of mercury and selenium, such as a coal-fired power plant, affects the quantities of mercury and selenium accumulated in fish tissue. Differences in accumulation are hypothesized to be driven in part by selenium-mitigated reductions in fish tissue mercury near power plants. Although reduced fish tissue mercury in systems near power plants may decrease mercury-specific risks to human consumers, these benefits are highly localized and the relatively high selenium associated with these tissues may compromise ecological health. Keywords Mercury Selenium Point-source Coal-fired power plant Fish Introduction Anthropogenic sources of mercury (Hg) comprise approxi- mately 70% of total global emissions (Schuster et al. 2002). In particular, coal-fired power plants are responsible for the majority of emissions (Pacyna et al. 2006), releasing par- ticulate, oxidized (or reactive gaseous Hg), and elemental Hg into the atmosphere. The particulate and oxidized forms are deposited near the point source (Carpi 1997; Pacyna and Pacyna 2002). Elemental Hg, conversely, is persistent in the atmosphere, potentially traveling great distances before being oxidized and deposited. Due to the relatively large amounts of particulate and oxidized Hg released from coal- fired power plants and their rapid local deposition rates, waterbodies close to coal-fired power plants are expected to receive greater atmospheric Hg deposition than systems farther away (Carpi 1997; Keeler et al. 2006; NCDENR 2005). Interestingly, however, high Hg deposition rates may not always result in high Hg accumulation in biota (e.g. Chen et al. 2005). Following wet and dry deposition, Hg is methylated by sulfur- and iron-reducing bacteria into the organic, biologically available and toxic form, methylmer- cury (MeHg; Gilmour et al. 1992; Lin and Jay 2007; Ullrich et al. 2001). Rates of methylation can vary substantially due to a variety of abiotic factors including water pH (e.g. Chen et al. 2005; Lange et al. 1993), dissolved organic carbon (DOC; e.g. Ravichandran 2004), geographic region (e.g. Sackett et al. 2009), and chlorophyll a (e.g. Lange et al. D. K. Sackett (&) D. D. Aday J. A. Rice Department of Biology, North Carolina State University, Raleigh, NC 27695-7617, USA e-mail: [email protected] W. G. Cope D. Buchwalter Department of Environmental and Molecular Toxicology, North Carolina State University, Raleigh, NC 27695-7633, USA 123 Ecotoxicology DOI 10.1007/s10646-010-0545-5
Transcript of Does proximity to coal-fired power plants influence fish tissue mercury?
Does proximity to coal-fired power plants influencefish tissue mercury?
Dana K. Sackett • D. Derek Aday • James A. Rice •
W. Gregory Cope • David Buchwalter
Accepted: 4 September 2010
� Springer Science+Business Media, LLC 2010
Abstract Much of the mercury contamination in aquatic
biota originates from coal-fired power plants, point sources
that release mercury into the atmosphere. Understanding
mercury dynamics is primarily important because of the
toxic threat mercury poses to wildlife and humans through
the consumption of contaminated fish. In this study, we
quantified the relative importance of proximity to coal-fired
power plants on mercury accumulation in two fish species
of different trophic positions. Fish, water and sediment
were collected and analyzed from 14 lakes, seven near to
(\10 km) and seven far from ([30 km) coal-fired power
plants. Lower tissue mercury and higher tissue selenium
concentrations were measured in fish collected near power
plants. Moreover, mercury accumulation in fish was driven
by biotic characteristics (e.g., trophic position, total length,
age), waterbody characteristics (e.g., pH, dissolved organic
carbon and sulfate) and distance from power plants.
Proximity to an atmospheric point-source of mercury and
selenium, such as a coal-fired power plant, affects the
quantities of mercury and selenium accumulated in fish
tissue. Differences in accumulation are hypothesized to be
driven in part by selenium-mitigated reductions in fish
tissue mercury near power plants. Although reduced fish
tissue mercury in systems near power plants may decrease
mercury-specific risks to human consumers, these benefits
are highly localized and the relatively high selenium
associated with these tissues may compromise ecological
health.
Keywords Mercury � Selenium � Point-source �Coal-fired power plant � Fish
Introduction
Anthropogenic sources of mercury (Hg) comprise approxi-
mately 70% of total global emissions (Schuster et al. 2002).
In particular, coal-fired power plants are responsible for the
majority of emissions (Pacyna et al. 2006), releasing par-
ticulate, oxidized (or reactive gaseous Hg), and elemental
Hg into the atmosphere. The particulate and oxidized forms
are deposited near the point source (Carpi 1997; Pacyna and
Pacyna 2002). Elemental Hg, conversely, is persistent in the
atmosphere, potentially traveling great distances before
being oxidized and deposited. Due to the relatively large
amounts of particulate and oxidized Hg released from coal-
fired power plants and their rapid local deposition rates,
waterbodies close to coal-fired power plants are expected to
receive greater atmospheric Hg deposition than systems
farther away (Carpi 1997; Keeler et al. 2006; NCDENR
2005). Interestingly, however, high Hg deposition rates may
not always result in high Hg accumulation in biota (e.g.
Chen et al. 2005). Following wet and dry deposition, Hg is
methylated by sulfur- and iron-reducing bacteria into the
organic, biologically available and toxic form, methylmer-
cury (MeHg; Gilmour et al. 1992; Lin and Jay 2007; Ullrich
et al. 2001). Rates of methylation can vary substantially due
to a variety of abiotic factors including water pH (e.g. Chen
et al. 2005; Lange et al. 1993), dissolved organic carbon
(DOC; e.g. Ravichandran 2004), geographic region (e.g.
Sackett et al. 2009), and chlorophyll a (e.g. Lange et al.
D. K. Sackett (&) � D. D. Aday � J. A. Rice
Department of Biology, North Carolina State University,
Raleigh, NC 27695-7617, USA
e-mail: [email protected]
W. G. Cope � D. Buchwalter
Department of Environmental and Molecular Toxicology,
North Carolina State University, Raleigh, NC 27695-7633, USA
123
Ecotoxicology
DOI 10.1007/s10646-010-0545-5
1993). Further, because MeHg biomagnifies as it moves
through aquatic foodwebs (Hall et al. 1997), larger and older
fish typically have higher body burdens of Hg than smaller
and younger fish, both within and among species (Simonin
et al. 2008; Trudel and Rasmussen 2006). Despite all of this
environmental variation, many studies have linked Hg
accumulation in biota directly to atmospheric Hg loading
(Hammerschmidt and Fitzgerald 2006; Hutcheson et al.
2008).
The primary importance of understanding Hg dynamics
relates to the toxic threat MeHg poses to wildlife and
humans through the consumption of contaminated fish, the
main pathway for exposure to MeHg (Clarkson 2002;
Scheuhammer et al. 2007); MeHg typically accounts for
95–99% of Hg in fish tissue (Bloom 1992). Recent inves-
tigations have indicated associations between human con-
sumption of Hg contaminated fish and poor neurologic
status, developmental delays, and cardiovascular problems
(Mergler et al. 2007; Virtanen et al. 2005), even at rela-
tively low levels of exposure. For wildlife, studies have
linked elevated Hg in fish, birds, and mammals to reduced
reproductive success, hormonal changes, and neurochemi-
cal, behavioral, and motor skill impairment (Crump and
Trudeau 2009; Scheuhammer et al. 2007).
Quantifying the relative risk of Hg exposure through fish
consumption can be complicated by the presence of sele-
nium (Se), an element also released in emissions from coal-
fired power plants that interacts dynamically with Hg
(Yang et al. 2008). Selenium is an essential dietary trace
element for many animals, including humans, but is toxic
at high concentrations, particularly for fish and wildlife
(Eisler 1985; Saiki et al. 1992). Though often toxic, ele-
vated levels of Se in fish have been linked to reduced fish
tissue Hg (Arribere et al. 2008; Chen et al. 2001; South-
worth et al. 2000). For example, laboratory experiments
with rainbow trout, Oncorhynchus mykiss, indicated that
fish fed selenium-rich diets had enhanced elimination rates
of MeHg and inorganic Hg from tissues (Bjerregaard et al.
1999). Though previous research suggests that Se may
decrease Hg concentrations in fish tissue, not enough is
known to make predictions regarding fish tissue Hg accu-
mulation near power plants.
Despite the prevalence of coal-fired power plants, both
in the U.S. and globally, little is known about the local
impacts of their mercury and selenium emissions on fish
and wildlife. Our objectives were to quantify the impor-
tance of proximity to coal-fired power plants to Hg accu-
mulation in fish tissue, and to determine the relative
importance of point-source deposition versus known driv-
ers of Hg accumulation for two common species of fish at
different trophic levels. This was accomplished by exam-
ining Hg levels in largemouth bass Micropterus salmoides,
and bluegill Lepomis macrochirus, from lakes with dif-
ferent abiotic characteristics located near to and far from
coal-fired power plants.
Materials and methods
Selection of sampling sites
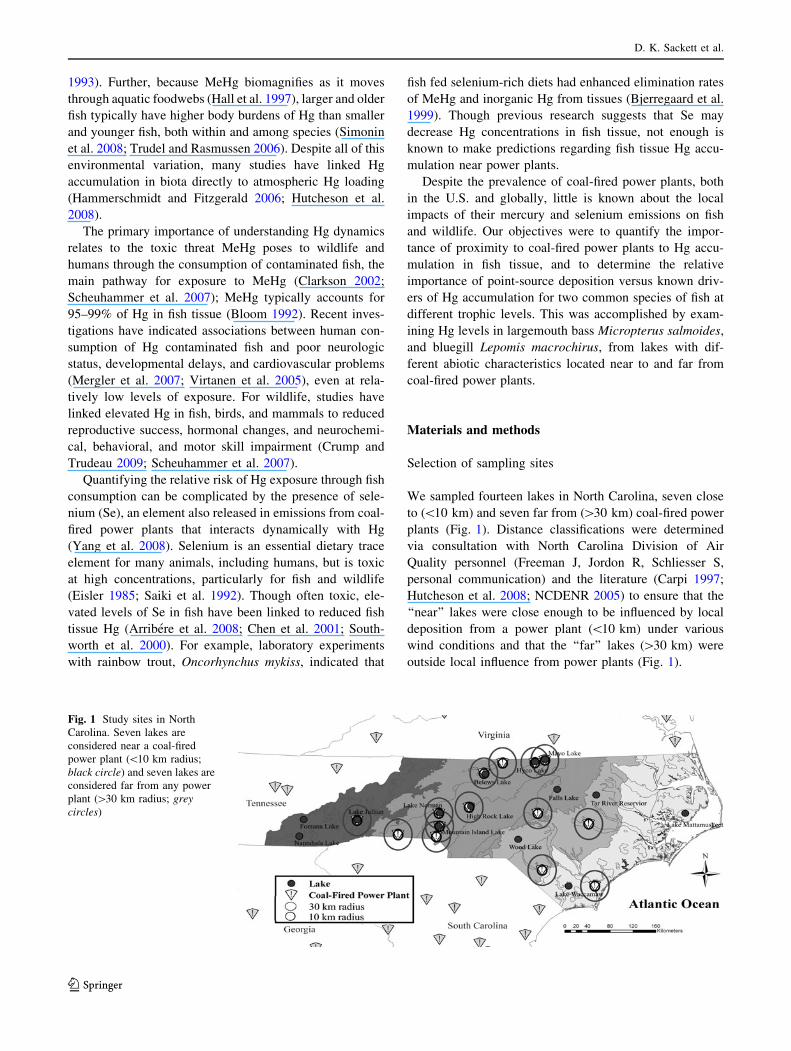
We sampled fourteen lakes in North Carolina, seven close
to (\10 km) and seven far from ([30 km) coal-fired power
plants (Fig. 1). Distance classifications were determined
via consultation with North Carolina Division of Air
Quality personnel (Freeman J, Jordon R, Schliesser S,
personal communication) and the literature (Carpi 1997;
Hutcheson et al. 2008; NCDENR 2005) to ensure that the
‘‘near’’ lakes were close enough to be influenced by local
deposition from a power plant (\10 km) under various
wind conditions and that the ‘‘far’’ lakes ([30 km) were
outside local influence from power plants (Fig. 1).
Fig. 1 Study sites in North
Carolina. Seven lakes are
considered near a coal-fired
power plant (\10 km radius;
black circle) and seven lakes are
considered far from any power
plant ([30 km radius; greycircles)
D. K. Sackett et al.
123
Fish collection and ancillary environmental sampling
At each lake, we collected largemouth bass and bluegill.
These species are widely distributed, often consumed by
humans and wildlife, and typically represent distinct tro-
phic levels. Largemouth bass are common apex predators
that feed primarily on fish but also on benthic invertebrates.
Bluegill exist at the intermediate trophic level, foraging on
a mix of zooplankton, plant material, and benthic inverte-
brates (Werner and Hall 1988). Power analyses based on a
previous dataset (Sackett et al. 2009) suggested that col-
lections of five individuals of a restricted size range per
species (i.e., 10 fish per system) would be sufficient to
confidently quantify differences in fish tissue Hg among
lakes. Largemouth bass collections were limited to indi-
viduals that were 300–400 mm total length (TL) and
bluegill collections were limited to 150–200 mm TL.
These represent the most commonly caught sizes of both
species in North Carolina. Fish were collected via elec-
trofishing from September 2 to October 2, 2008 to limit
effects of seasonal variation.
To assess the importance of local environmental factors
in determining Hg accumulation in fish tissues, we sampled
and analyzed water for pH, alkalinity (mg/l as CaCO3),
nitrogen (NO3, mg/l), phosphorus (mg/l), sulfur (SO4, mg/l),
chlorophyll a (lg/l), and DOC (mg/l) using standard
methods (APHA 1995). Water samples were collected by
opening and resealing a 1-l acid washed container sub-
mersed 0.5–1.0 m beneath the water surface at each of the
study lakes. Specifically, pH was measured using a
hydrogen electrode and conductivity meter (Thermo Fisher
Scientific), alkalinity was measured by titration using
phenolphthalein and methyl orange as endpoint indicators
(AOAC 1990), and nitrogen was determined by modified
EPA Methods 353.1 (Kempers and Luft 1988; Krom 1980),
with an auto-flow spectrophotometric analyzer (4001
Sanplus Segmented Flow Analyzer, Skalar Instruments).
Phosphorus and sulfate were determined using inductively
coupled plasma (ICP) spectrometry (Donohue and Aho
1992; Optima 3300 DV ICP emission spectrometer).
Chlorophyll a samples were collected in brown Nalgene
bottles and kept on ice until stored in total darkness at 4�C.
Samples were filtered in duplicate or triplicate within 24 h
of collection. Chlorophyll a was extracted using a 90%
acetone solution, homogenized, centrifuged and analyzed
on a Turner 10-AU fluorometer using EPA Method 445.0
(Rev 1.2 September 1997). Dissolved organic carbon
analysis followed Method 5310B (APHA/AWWA/WEF
2005) using a Shimadzu model TOC-5050 analyzer fitted
with an autosampler ASI-5000.
A composite of three surficial (top 5 cm) sediment
samples at each lake from the area of fish collection was
analyzed to determine sediment concentrations of Hg, Se
and percent total carbon. Sediment samples were dried,
crushed and sieved to \2 mm with an agate mortar and
digested (as below) for determination of Hg content. For
sediment Se analysis, 1–2 g of thoroughly mixed \2 mm
sediment (or standard reference material, SRM) was
weighed and digested using 1:1 nitric acid:30% sulfuric
acid (HNO3 and 30% H2SO4) concentration. Analyses
followed USEPA Method EPA SW846, 3050B for ICP-
mass spectometry (MS). Analyses were performed with
appropriate quality assurance/quality control (QA/QC)
protocols, including reagent blanks, SRM, standard curves
with linearity 0.999 or greater, and calibration verification
throughout analysis of samples. The SRM for Se was
within 3.33% of the expected range of the SRM mean
value. Total carbon was measured by combustion with a
Perkin-Elmer Corporation’s 2400 CHN Elemental Ana-
lyzer. Twenty-five grams of sediment from each lake were
ground to \250 lm and combusted at 925�C for 30 s in a
pure oxygen environment. The resultant gas was passed
through a detector column that read and calculated the
percent carbon in the sediment sample.
Fish tissue analyses
Collected fish were measured (TL; mm), sealed in plastic
bags, and stored frozen (-20�C) until processing. A trace-
metal free dissection technique was used to process fish
(USEPA 2000). Specifically, each fish was thawed and
weighed, then skinned and filleted with a cleaned stainless
steel knife on fresh aluminum foil with fresh nitrile gloves.
A 5–40 g sample of the right anterior dorsal musculature
was sectioned and weighed (Piraino and Taylor 2009).
Because MeHg constitutes [95% of total mercury (Bloom
1992) in fish, we analyzed total Hg, which is much more
cost effective than analyzing MeHg. Total Hg was mea-
sured using 100- to 300-mg samples of dried and digested
tissue (3:1 Omnitrace� HNO3:H2SO4 in Teflon bombs in a
MARS Xpress microwave digester). These sample digests
were analyzed for total Hg by cold vapor atomic fluores-
cence spectroscopy (USEPA method 1631) with a HYDRA
AF Gold Plus (Teledyne/Leeman Labs). Each run of 20–30
tissue sample analyses was accompanied by appropriate
quality assurance protocols, including blanks, Se-spiked
samples, duplicates, and National Institute of Standards
and Technology (NIST) certified reference material (2976
Mussel tissue). Recoveries of certified reference material
ranged from 93 to 111%, with an overall mean recovery of
101.3 ± 4.8% standard deviation. Quality control was also
conducted by separately analyzing duplicates for 14 (10%)
of our freeze-dried tissue samples and five (*4%) of our
whole wet weight fillets. Duplicates were processed by the
North Carolina Division of Water Quality (NCDWQ).
Results indicated close agreement; the mean relative
Does proximity to coal-fired power plants influence fish tissue mercury?
123
standard deviation (RSD) for 13 of 14 samples was 12%.
For four of five whole fillets, the mean RSD was 19%.
Fish tissue samples were analyzed for Se using ICP-MS
following USEPA method EPA 6010C. Analyses were
performed with appropriate quality assurance protocols,
including blanks, Se-spiked samples and duplicates. All
blanks, spiked samples and duplicates were within
acceptable limits.
Nitrogen isotope analysis was conducted to determine
the relative trophic position of fish collected in each lake.
Benthic invertebrates were collected from each system to
establish a baseline nitrogen isotopic signature (Post 2002).
Benthic invertebrates were sieved from a sediment sample
taken at each lake, identified to class, order or family,
and preserved in ethanol (Kaehler and Pakhomov 2001).
Each lake had a composite of benthic invertebrates that
included chironomidae, trichoptera, ephemeroptera, uniono-
ida, ceratopogonidae, oligochaeta, and ostracoda. In the
laboratory, dried invertebrate and freeze-dried fish tissue
samples were analyzed for nitrogen isotopes using com-
bustion (1020�C) and an isotope ratioing mass spectrom-
eter. Each batch of samples contained lab standards
calibrated to NIST primary standards. Trophic position was
determined for each fish using the Vander Zanden and
Rasmussen (2001) equation: fish trophic position = (fish
d15N - baseline d15N)/3.4% ? 2, where the baseline
d15N was the invertebrate d15N measured in each lake,
3.4% represents the nitrogen isotope fractionation constant
(Minagawa and Wada 1984), and ‘? 2’ accounts for the
two trophic levels (primary producer and consumer)
beneath the invertebrates used as the baseline (Peterson and
Fry 1987).
Statistical analyses
Fish tissue Hg and Se concentrations were log transformed,
and the percent total carbon in sediment was arcsine
square-root transformed to meet assumptions of normality.
Analysis of variance was used to determine differences in
variables (fish tissue Hg and Se, pH, alkalinity, nitrogen,
phosphorus, sulfur, DOC, chlorophyll a, sediment Hg,
sediment Se, sediment total carbon) between systems near
to and far from coal-fired power plants.
We created regression models based on previous expe-
rience with Hg dynamics in similar systems in North
Carolina (Sackett et al. 2009) and a review of pertinent
literature. First, we grouped individual variables thought to
affect different aspects of Hg dynamics (deposition, bio-
accumulation and methylation) into categories, including
biotic factors, water characteristics, sediment characteris-
tics, proximity to coal-fired power plants, and fish tissue
Se, to create ‘component models’ for analysis (Table 1a).
Combinations of component models were then created to
assess interactions among important biotic and abiotic
variables (Table 1b). Variance inflation factors (VIF) were
calculated for each candidate model; all were B10, which
indicates little or no multicollinearity of independent
variables (Neter et al. 1996). We also created a ‘‘reduced
global model’’, which contained the maximum number of
variable combinations without introducing unacceptable
(i.e., VIF [ 10) multicollinearity. Akaike’s Information
Criterion (adjusted for small sample size, AICc, Burnham
and Anderson 1998) was used to rank the regression
models (for each species separately and for both combined)
to determine which model(s) best described variation in
fish tissue Hg. Following model ranking the relative
importance of individual variables was determined via
parameter estimates, which were calculated by summing
the model weights (Wi) for all of the models in which the
variable of interest occurred (Burnham and Anderson
1998). Finally, we also ran individual correlations between
fish tissue Hg and each of the variables identified in the
highest ranked AICc model.
Results
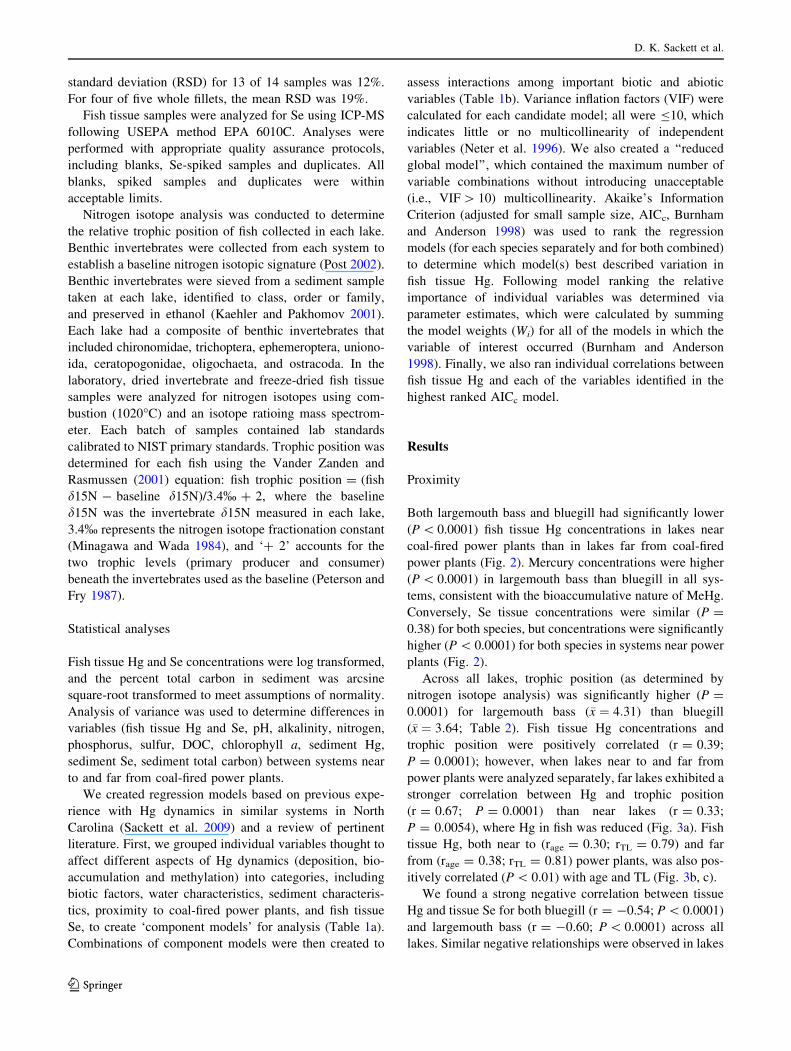
Proximity
Both largemouth bass and bluegill had significantly lower
(P \ 0.0001) fish tissue Hg concentrations in lakes near
coal-fired power plants than in lakes far from coal-fired
power plants (Fig. 2). Mercury concentrations were higher
(P \ 0.0001) in largemouth bass than bluegill in all sys-
tems, consistent with the bioaccumulative nature of MeHg.
Conversely, Se tissue concentrations were similar (P =
0.38) for both species, but concentrations were significantly
higher (P \ 0.0001) for both species in systems near power
plants (Fig. 2).
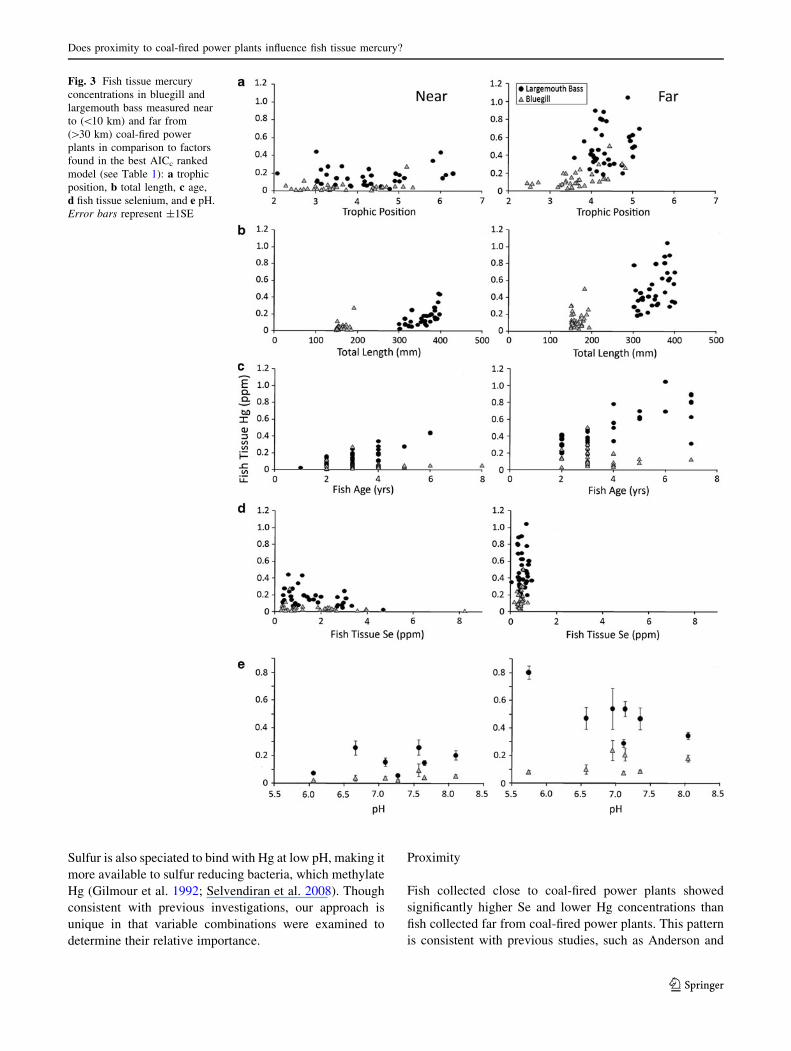
Across all lakes, trophic position (as determined by
nitrogen isotope analysis) was significantly higher (P =
0.0001) for largemouth bass (�x ¼ 4:31) than bluegill
(�x ¼ 3:64; Table 2). Fish tissue Hg concentrations and
trophic position were positively correlated (r = 0.39;
P = 0.0001); however, when lakes near to and far from
power plants were analyzed separately, far lakes exhibited a
stronger correlation between Hg and trophic position
(r = 0.67; P = 0.0001) than near lakes (r = 0.33;
P = 0.0054), where Hg in fish was reduced (Fig. 3a). Fish
tissue Hg, both near to (rage = 0.30; rTL = 0.79) and far
from (rage = 0.38; rTL = 0.81) power plants, was also pos-
itively correlated (P \ 0.01) with age and TL (Fig. 3b, c).
We found a strong negative correlation between tissue
Hg and tissue Se for both bluegill (r = -0.54; P \ 0.0001)
and largemouth bass (r = -0.60; P \ 0.0001) across all
lakes. Similar negative relationships were observed in lakes
D. K. Sackett et al.
123
close to power plants where tissue Se concentrations were
much greater (bluegill r = -0.33, P = 0.05; largemouth
bass r = -0.44, P = 0.0089), but far from power plants Se
was so reduced that no correlation with tissue Hg was
observed for either species (Fig. 3d).
Average concentrations of water and sediment charac-
teristics were not statistically different between lakes near
to and far from coal-fired power plants (Table 2). The
only exception was DOC, which was marginally higher
(P = 0.08) in lakes far from power plants than in lakes near
them. Though mean sediment Se was twice as high (0.52 vs.
0.27 lg/g) in near lakes as in far lakes, relatively high vari-
ance in these estimates resulted in a lack of statistically
significant difference between the two groups. The variance
was a result of a single outlier in each group (outliers were
four times the median of each group and approximately
2.5 times the next highest value); when these outliers were
excluded, we found a significant difference (P = 0.05)
between sediment Se levels in lakes near and far from power
plants. The only variable among the water and sediment
characteristics that was in the top ranked AICc model was
pH. A negative relationship between largemouth bass tissue
Hg and pH (r = -0.52, P = 0.0013) was found far from
power plants though not in systems close to power plants,
where Hg in fish was reduced (Fig. 3e).
Model comparison
Results of the AICc analysis indicated that the best models
and variables for predicting fish tissue Hg were similar for
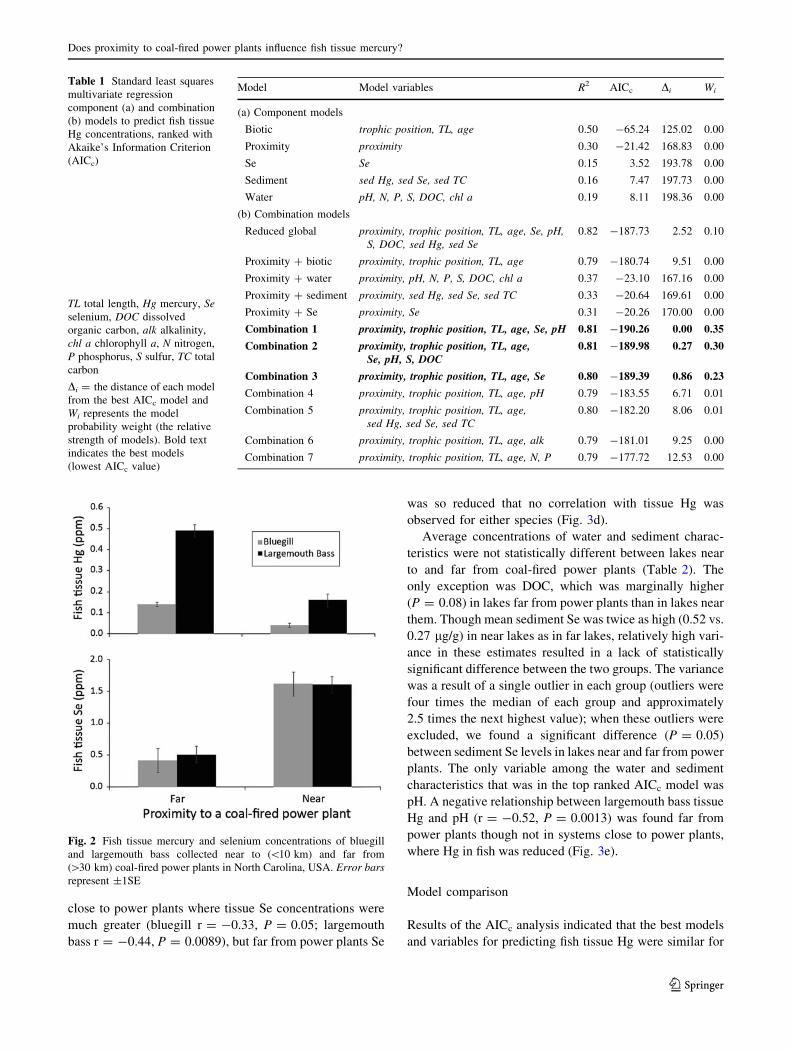
Table 1 Standard least squares
multivariate regression
component (a) and combination
(b) models to predict fish tissue
Hg concentrations, ranked with
Akaike’s Information Criterion
(AICc)
TL total length, Hg mercury, Seselenium, DOC dissolved
organic carbon, alk alkalinity,
chl a chlorophyll a, N nitrogen,
P phosphorus, S sulfur, TC total
carbon
Di = the distance of each model
from the best AICc model and
Wi represents the model
probability weight (the relative
strength of models). Bold text
indicates the best models
(lowest AICc value)
Model Model variables R2 AICc Di Wi
(a) Component models
Biotic trophic position, TL, age 0.50 -65.24 125.02 0.00
Proximity proximity 0.30 -21.42 168.83 0.00
Se Se 0.15 3.52 193.78 0.00
Sediment sed Hg, sed Se, sed TC 0.16 7.47 197.73 0.00
Water pH, N, P, S, DOC, chl a 0.19 8.11 198.36 0.00
(b) Combination models
Reduced global proximity, trophic position, TL, age, Se, pH,S, DOC, sed Hg, sed Se
0.82 -187.73 2.52 0.10
Proximity ? biotic proximity, trophic position, TL, age 0.79 -180.74 9.51 0.00
Proximity ? water proximity, pH, N, P, S, DOC, chl a 0.37 -23.10 167.16 0.00
Proximity ? sediment proximity, sed Hg, sed Se, sed TC 0.33 -20.64 169.61 0.00
Proximity ? Se proximity, Se 0.31 -20.26 170.00 0.00
Combination 1 proximity, trophic position, TL, age, Se, pH 0.81 -190.26 0.00 0.35
Combination 2 proximity, trophic position, TL, age,Se, pH, S, DOC
0.81 -189.98 0.27 0.30
Combination 3 proximity, trophic position, TL, age, Se 0.80 -189.39 0.86 0.23
Combination 4 proximity, trophic position, TL, age, pH 0.79 -183.55 6.71 0.01
Combination 5 proximity, trophic position, TL, age,sed Hg, sed Se, sed TC
0.80 -182.20 8.06 0.01
Combination 6 proximity, trophic position, TL, age, alk 0.79 -181.01 9.25 0.00
Combination 7 proximity, trophic position, TL, age, N, P 0.79 -177.72 12.53 0.00
Fig. 2 Fish tissue mercury and selenium concentrations of bluegill
and largemouth bass collected near to (\10 km) and far from
([30 km) coal-fired power plants in North Carolina, USA. Error barsrepresent ±1SE
Does proximity to coal-fired power plants influence fish tissue mercury?
123
bluegill and largemouth bass, therefore data for both spe-
cies were combined. The best overall model for predicting
fish tissue Hg included biotic factors (fish age, length and
trophic position), proximity to power plants, fish tissue Se
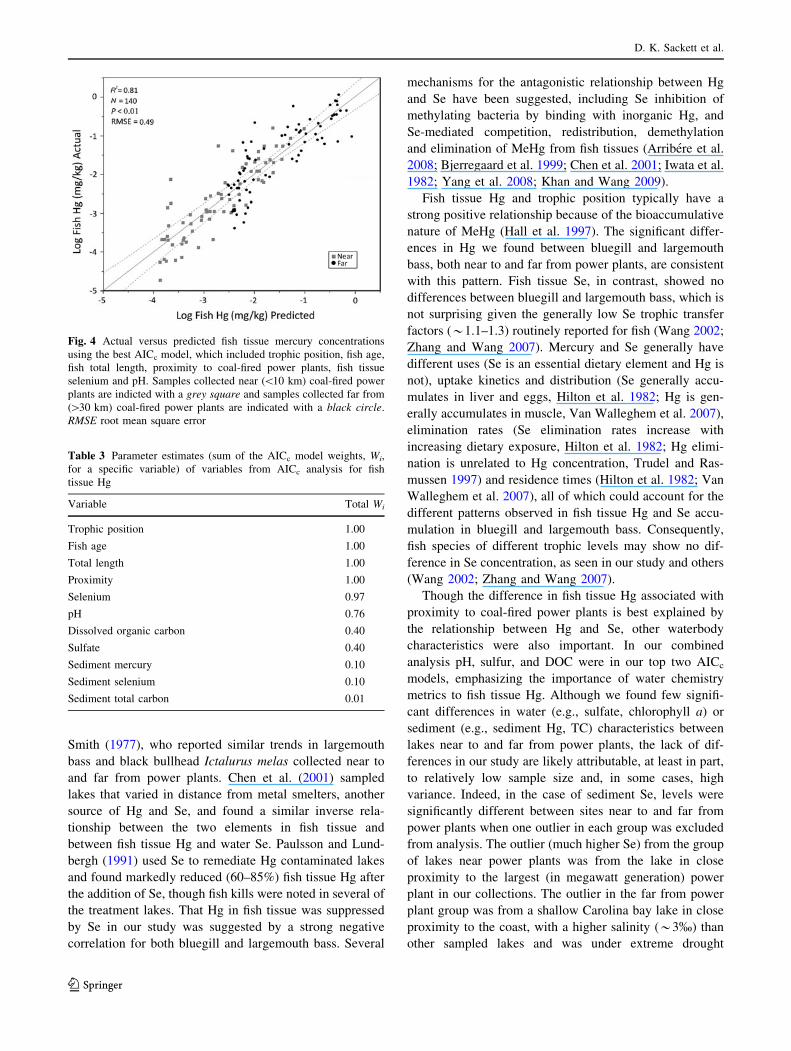
and pH (R2 = 0.81; Table 1b; Fig. 4). The second best
model included the same factors as well as DOC and sul-
fate. All factors in the top two models were the most
influential variables measured by parameter estimates (Wi;
Table 3). Of the component models (Table 1a), the biotic
model was the best in explaining tissue Hg; however, it was
substantially less effective than the best combination
models (Table 1b).
Discussion
Mercury models
The best model for explaining fish tissue Hg in our analysis
included trophic position, fish size, fish age, fish tissue Se,
pH and proximity to coal-fired power plants, indicating
greater Hg contamination risk in larger, older, higher trophic
level fish with low Se body burdens in low pH systems far
from power plants. Additionally, sulfate and DOC were
important in explaining the variability in tissue Hg. Indi-
vidually, these factors have been similarly linked to Hg in
other studies. Fish tissue Hg was positively related to fish
age, fish size and trophic position through bioaccumulation
and the long residence time of Hg in fish tissue (Hall et al.
1997; Van Walleghem et al. 2007). Dissolved organic car-
bon, pH and sulfate have been associated with Hg transport,
availability, and methylation rates (Chen et al. 2005;
Greenfield et al. 2001; Simonin et al. 2008). Lange et al.
(1993) suggested that low pH may increase methylation rate
and Chen et al. (2001) noted that the bioavailable speciation
of Hg, and factors that bind with Hg (i.e., sulfur and DOC),
depend on pH (DiGuilio and Hinton 2008). Specifically,
DOC can bind strongly with Hg and inhibit methylation,
however, the affinity between Hg and DOC can be weak-
ened in low pH waters (through competition with hydrogen
ions for binding sites on DOC and because DOC is less
negatively charged at low pH), allowing Hg to disassociate
from DOC and become available for methylation (Barkay
et al. 1997; Miskimmin et al. 1992; Ravichandran 2004).
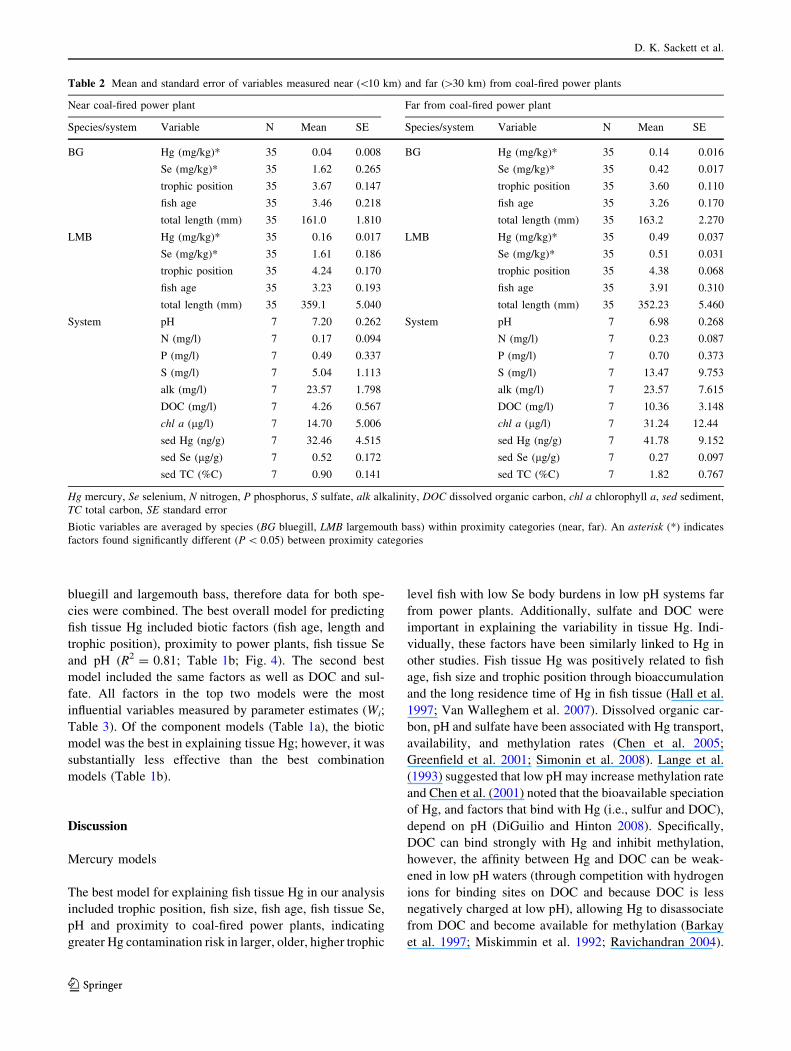
Table 2 Mean and standard error of variables measured near (\10 km) and far ([30 km) from coal-fired power plants
Near coal-fired power plant Far from coal-fired power plant
Species/system Variable N Mean SE Species/system Variable N Mean SE
BG Hg (mg/kg)* 35 0.04 0.008 BG Hg (mg/kg)* 35 0.14 0.016
Se (mg/kg)* 35 1.62 0.265 Se (mg/kg)* 35 0.42 0.017
trophic position 35 3.67 0.147 trophic position 35 3.60 0.110
fish age 35 3.46 0.218 fish age 35 3.26 0.170
total length (mm) 35 161.0 1.810 total length (mm) 35 163.2 2.270
LMB Hg (mg/kg)* 35 0.16 0.017 LMB Hg (mg/kg)* 35 0.49 0.037
Se (mg/kg)* 35 1.61 0.186 Se (mg/kg)* 35 0.51 0.031
trophic position 35 4.24 0.170 trophic position 35 4.38 0.068
fish age 35 3.23 0.193 fish age 35 3.91 0.310
total length (mm) 35 359.1 5.040 total length (mm) 35 352.23 5.460
System pH 7 7.20 0.262 System pH 7 6.98 0.268
N (mg/l) 7 0.17 0.094 N (mg/l) 7 0.23 0.087
P (mg/l) 7 0.49 0.337 P (mg/l) 7 0.70 0.373
S (mg/l) 7 5.04 1.113 S (mg/l) 7 13.47 9.753
alk (mg/l) 7 23.57 1.798 alk (mg/l) 7 23.57 7.615
DOC (mg/l) 7 4.26 0.567 DOC (mg/l) 7 10.36 3.148
chl a (lg/l) 7 14.70 5.006 chl a (lg/l) 7 31.24 12.44
sed Hg (ng/g) 7 32.46 4.515 sed Hg (ng/g) 7 41.78 9.152
sed Se (lg/g) 7 0.52 0.172 sed Se (lg/g) 7 0.27 0.097
sed TC (%C) 7 0.90 0.141 sed TC (%C) 7 1.82 0.767
Hg mercury, Se selenium, N nitrogen, P phosphorus, S sulfate, alk alkalinity, DOC dissolved organic carbon, chl a chlorophyll a, sed sediment,
TC total carbon, SE standard error
Biotic variables are averaged by species (BG bluegill, LMB largemouth bass) within proximity categories (near, far). An asterisk (*) indicates
factors found significantly different (P \ 0.05) between proximity categories
D. K. Sackett et al.
123
Sulfur is also speciated to bind with Hg at low pH, making it
more available to sulfur reducing bacteria, which methylate
Hg (Gilmour et al. 1992; Selvendiran et al. 2008). Though
consistent with previous investigations, our approach is
unique in that variable combinations were examined to
determine their relative importance.
Proximity
Fish collected close to coal-fired power plants showed
significantly higher Se and lower Hg concentrations than
fish collected far from coal-fired power plants. This pattern
is consistent with previous studies, such as Anderson and
Fig. 3 Fish tissue mercury
concentrations in bluegill and
largemouth bass measured near
to (\10 km) and far from
([30 km) coal-fired power
plants in comparison to factors
found in the best AICc ranked
model (see Table 1): a trophic
position, b total length, c age,
d fish tissue selenium, and e pH.
Error bars represent ±1SE
Does proximity to coal-fired power plants influence fish tissue mercury?
123
Smith (1977), who reported similar trends in largemouth
bass and black bullhead Ictalurus melas collected near to
and far from power plants. Chen et al. (2001) sampled
lakes that varied in distance from metal smelters, another
source of Hg and Se, and found a similar inverse rela-
tionship between the two elements in fish tissue and
between fish tissue Hg and water Se. Paulsson and Lund-
bergh (1991) used Se to remediate Hg contaminated lakes
and found markedly reduced (60–85%) fish tissue Hg after
the addition of Se, though fish kills were noted in several of
the treatment lakes. That Hg in fish tissue was suppressed
by Se in our study was suggested by a strong negative
correlation for both bluegill and largemouth bass. Several
mechanisms for the antagonistic relationship between Hg
and Se have been suggested, including Se inhibition of
methylating bacteria by binding with inorganic Hg, and
Se-mediated competition, redistribution, demethylation
and elimination of MeHg from fish tissues (Arribere et al.
2008; Bjerregaard et al. 1999; Chen et al. 2001; Iwata et al.
1982; Yang et al. 2008; Khan and Wang 2009).
Fish tissue Hg and trophic position typically have a
strong positive relationship because of the bioaccumulative
nature of MeHg (Hall et al. 1997). The significant differ-
ences in Hg we found between bluegill and largemouth
bass, both near to and far from power plants, are consistent
with this pattern. Fish tissue Se, in contrast, showed no
differences between bluegill and largemouth bass, which is
not surprising given the generally low Se trophic transfer
factors (*1.1–1.3) routinely reported for fish (Wang 2002;
Zhang and Wang 2007). Mercury and Se generally have
different uses (Se is an essential dietary element and Hg is
not), uptake kinetics and distribution (Se generally accu-
mulates in liver and eggs, Hilton et al. 1982; Hg is gen-
erally accumulates in muscle, Van Walleghem et al. 2007),
elimination rates (Se elimination rates increase with
increasing dietary exposure, Hilton et al. 1982; Hg elimi-
nation is unrelated to Hg concentration, Trudel and Ras-
mussen 1997) and residence times (Hilton et al. 1982; Van
Walleghem et al. 2007), all of which could account for the
different patterns observed in fish tissue Hg and Se accu-
mulation in bluegill and largemouth bass. Consequently,
fish species of different trophic levels may show no dif-
ference in Se concentration, as seen in our study and others
(Wang 2002; Zhang and Wang 2007).
Though the difference in fish tissue Hg associated with
proximity to coal-fired power plants is best explained by
the relationship between Hg and Se, other waterbody
characteristics were also important. In our combined
analysis pH, sulfur, and DOC were in our top two AICc
models, emphasizing the importance of water chemistry
metrics to fish tissue Hg. Although we found few signifi-
cant differences in water (e.g., sulfate, chlorophyll a) or
sediment (e.g., sediment Hg, TC) characteristics between
lakes near to and far from power plants, the lack of dif-
ferences in our study are likely attributable, at least in part,
to relatively low sample size and, in some cases, high
variance. Indeed, in the case of sediment Se, levels were
significantly different between sites near to and far from
power plants when one outlier in each group was excluded
from analysis. The outlier (much higher Se) from the group
of lakes near power plants was from the lake in close
proximity to the largest (in megawatt generation) power
plant in our collections. The outlier in the far from power
plant group was from a shallow Carolina bay lake in close
proximity to the coast, with a higher salinity (*3%) than
other sampled lakes and was under extreme drought
Fig. 4 Actual versus predicted fish tissue mercury concentrations
using the best AICc model, which included trophic position, fish age,
fish total length, proximity to coal-fired power plants, fish tissue
selenium and pH. Samples collected near (\10 km) coal-fired power
plants are indicted with a grey square and samples collected far from
([30 km) coal-fired power plants are indicated with a black circle.
RMSE root mean square error
Table 3 Parameter estimates (sum of the AICc model weights, Wi,
for a specific variable) of variables from AICc analysis for fish
tissue Hg
Variable Total Wi
Trophic position 1.00
Fish age 1.00
Total length 1.00
Proximity 1.00
Selenium 0.97
pH 0.76
Dissolved organic carbon 0.40
Sulfate 0.40
Sediment mercury 0.10
Sediment selenium 0.10
Sediment total carbon 0.01
D. K. Sackett et al.
123
conditions at the time of sampling. Even when those points
were included, sediment Se was two times higher in the
near lakes than in the far lakes.
Trends in our data indicated that systems near coal-fired
power plants were generally clearer and less productive
than our study systems far from power plants. One poten-
tial reason for the low productivity is that power plants
require large volumes of cold water to operate and thus are
typically located on large, deep reservoirs with a high
volume of cool water. Large, deep waterbodies also tend to
be clearer and less productive than small, shallow systems.
In addition, these systems tended to have lower DOC and
total sediment carbon. Lower productivity and higher
clarity may influence Hg by allowing more solar radiation
to enter surface waters to photodegrade MeHg and photo-
reduce oxidized Hg into the insoluble, elemental form that
is subsequently re-emitted into the atmosphere rather than
sequestered in the sediment (Amyot et al. 1997a, b; Morel
et al. 1998; Watras et al. 1998; Sellers et al. 2001). This
would explain the lower than expected sediment Hg found
in lakes near coal-fired power plants, where higher depo-
sition would presumably result in higher sediment Hg.
Further, because DOC has been noted to absorb and block
solar radiation (Amyot et al. 1997a, b), lower DOC in lakes
near power plants suggests that Hg in these systems is
removed by photodegradation and photoreduction (Sellers
et al. 2001).
In sum, our results suggest water quality characteristics
such as pH, sulfate, and DOC play an important role in Hg
accumulation in aquatic systems and fish tissue. We were
unable to measure concentrations of Hg and Se in the water
column of these systems. It is plausible that those data and
other biotic and abiotic variables (e.g., community struc-
ture, system hydrology) would be useful in explaining
some of the variation seen in fish tissue Hg and Se
(Brumbaugh et al. 2001).
Conclusions
Much of the Hg contamination in aquatic biota originates
from coal-fired power plants, point sources that release Hg
and Se into the atmosphere. In this study we quantified the
relative importance of proximity to coal-fired power plants,
versus biotic and abiotic factors known to influence Hg
dynamics, on Hg accumulation in two common species of
fish. Lower tissue Hg and higher tissue Se concentrations
were found in fish collected near power plants. Moreover,
though studies indicate higher Hg deposition in systems
near power plants (Carpi 1997; Keeler et al. 2006;
NCDENR 2005; Pacyna and Pacyna 2002) our study
demonstrated that this did not result in high fish tissue Hg.
Our results suggest that this is due, at least in part, to higher
Se concentrations in these systems. Other biotic and
waterbody characteristics also contributed to this pattern.
Our results have important implications for both human
and ecological health. While lower fish tissue Hg concen-
trations in systems close to coal-fired power plants is a
welcome result for human health, these benefits are highly
localized, attenuating\30 km from point sources and thus
affecting only a small fraction of the landscape. The con-
comitant high Se concentrations in these systems may have
adverse consequences for piscivorous fish and wildlife.
Reproductive abnormalities and failure, anemia, growth
retardation and population declines have been observed in
fish with muscle concentrations of 4 mg/kg of Se, and to
1–2 mg/kg of Se for sensitive fish (Burger et al. 2001;
Eisler 1985). Wildlife dietary exposures of 1 mg/kg have
been reported to cause toxic effects (Arribere et al. 2008;
Burger et al. 2001). More than half of the fish collected
near coal-fired power plants in our study had tissue Se
above 1.0 mg/kg, and four fish had Se above the 4 mg/kg
threshold. Though localized accumulation of Hg in fish
tissue near power plants seems to be mitigated by the
deposition and accumulation of Se, the fact still remains
that the majority of Hg contamination around the world
originates from these atmospheric point sources. Emissions
of the persistent, elemental form of Hg will need to be
reduced to decrease the global pool of Hg that deposits and
accumulates in aquatic biota far from any source of Hg,
particularly in remote Hg sensitive environments where
physical and chemical conditions favor Hg methylation and
biomagnification.
Acknowledgments We thank the Water Resources Research Insti-
tute (WRRI) of The University of North Carolina for providing the
funds for this project. Thanks to the following for assistance with data
collection and analyses: North Carolina Wildlife Resources Com-
mission (fish collections); Lingtian Xie and Peter Lazaro from NCSU
Department of Toxicology (fish tissue analyses); NCSU Soil Science
Department (DOC and sediment analyses); NCSU Center for Applied
Aquatic Ecology (chlorophyll a); Department of Biology, Kansas
State University (stable isotope analyses); Plant Waste and Solution
Section of North Carolina Department of Agriculture and Consumer
Services, Agronomic Division (general water chemistry analyses).
Thanks also to Steve Schliesser and Reginald Jordon, NC Division of
Air Quality, for their assistance.
References
Amyot M, Lean D, Mierle G (1997a) Photochemical formation of
volatile mercury in high Arctic lakes. Environ Toxicol Chem
16:2054–2063
Amyot M, Mierle G, Lean D, McQueen DJ (1997b) Effect of solar
radiation on the formation of dissolved gaseous mercury in
temperate lakes. Geochim Cosmochim Acta 61:975–987
Anderson WL, Smith KE (1977) Dynamics of mercury at coal-fired
power plants and adjacent cooling lakes. Environ Sci Technol
11:75–80
Does proximity to coal-fired power plants influence fish tissue mercury?
123
AOAC (Association of Official Analytical Chemists) (1990) Official
methods of analysis of the association of official analytical
chemists, 15th edn. Arlington, VA
APHA (American Public Health Association, American Water Works
Association, Water Pollution Control Federation) (1995) Stan-
dard methods for the examination of water and wastewater, 19th
edn. American Public Health Association, American Water
Works Association and Water Pollution Control Federation,
Washington, DC
APHA/AWWA/WEF (American Public Health Association, Ameri-
can Water Works Association, Water Environment Federation)
(2005) Standard methods for the examination of water and
wastewater, 21st edn. APHA, Washington, DC
Arribere MA, Ribeiro Guevara S, Bubach DF, Arcagni M, Vigliano
PH (2008) Selenium and mercury in native and introduced fish
species of Patagonian Lakes, Argentina. Biol Trace Elem Res
122: 42–63
Barkay T, Gillman M, Turner RR (1997) Effects of dissolved organic
carbon and salinity on bioavailability of mercury. Appl Environ
Microbiol 63:4267–4271
Bjerregaard P, Andersen D, Rankin JJ (1999) Retention of methyl-
mercury in rainbow trout, Oncorhynchus mykiss: effect of
dietary selenium. Aquat Toxicol 45:171–180
Bloom NS (1992) On the chemical form of mercury in edible fish and
marine invertebrate tissue. Can J Fish Aquat Sci 49:1010–1017
Brumbaugh WG, Krabbenhoft DP, Helsel DR, Wiener JG, Echols KR
(2001) A national pilot study of mercury contamination of
aquatic ecosystems along multiple gradients: bioaccumulation in
fish. Biological Science Report USGS/BRD/BSR/-2001-0009:25
Burger J, Gaines KF, Boring CS, Stephens WL Jr, Snodgrass J,
Gochfeld M (2001) Mercury and selenium in fish from the
Savannah River: species, trophic level, and locational differ-
ences. Environ Res 87:108–118
Burnham KP, Anderson DR (1998) Model selection and inference—a
practical information-theoretic approach. Springer-Verlag, New
York
Carpi A (1997) Mercury from combustion sources: a review of the
chemical species emitted and their transport in the atmosphere.
Water Air Soil Pollut 98:241–254
Chen YW, Belzile N, Gunn JM (2001) Antagonistic effect of
selenium on mercury assimilation by fish populations near
sudbury metal smelters? Limnol Oceanogr 46:1814–1818
Chen CY, Stemberger RS, Kamman NC, Mayes BM, Folt CL (2005)
Patterns of mercury bioaccumulation and transfer in aquatic food
webs across multi-lake studies in the northeast US. Ecotoxico-
logy 14:135–147
Clarkson TW (2002) The three modern faces of mercury. Environ
Health Perspect 110:11–23
Crump KL, Trudeau VL (2009) Mercury-induced reproductive
impairment in fish. Environ Toxicol Chem 28:895–907
DiGuilio RT, Hinton DE (2008) The toxicology of fishes. CRC Press,
Boca Raton, FL
Donohue SJ, Aho DW (1992) Determination of P, K, Ca, Mg, Mn, Fe,
Al, B, Cu, and Zn in plant tissue by Inductively Coupled Plasma
(ICP) emission spectroscopy. In: Plank CO (ed) Plant analysis
reference procedures for the southern region of the United States.
South Cooper Ser Bull 368:34–37
Eisler R (1985) Selenium hazards to fish, wildlife, and invertebrates: a
synoptic review. U.S. Fish and Wildlife Service Rep 85(1.5),
Washington, DC
Gilmour CC, Henry EA, Mitchell R (1992) Sulfate stimulation of
mercury methylation in fresh-water sediments. Environ Sci
Technol 26:2281–2287
Greenfield BK, Hrabik TR, Harvey CJ, Carpenter SR (2001)
Predicting mercury levels in yellow perch: Use of water
chemistry, trophic ecology, and spatial traits. Can J Fish Aquat
Sci 58:1419–1429
Hall BD, Bodaly RA, Fudge RJP, Rudd JWM, Rosenberg DM (1997)
Food as the dominant pathway of methylmercury uptake by fish.
Water Air Soil Pollut 100:13–24
Hammerschmidt CR, Fitzgerald WF (2006) Methylmercury in
freshwater fish linked to atmospheric mercury deposition.
Environ Sci Technol 40:4562–4573
Hilton JW, Hodson PV, Slinger SJ (1982) Absorption, distribution,
half-life and possible routes of elimination of dietary selenium in
juvenile rainbow trout (Salmo gairdneri). Comp Biochem Physiol
71C:49–55
Hutcheson MS, Smith CM, Wallace GT, Rose J, Eddy B, Sullivan J,
Pancorbo O, West CR (2008) Freshwater fish mercury concen-
trations in a regionally high mercury deposition area. Water Air
Soil Pollut 199:15–31
Iwata H, Masukawa T, Kito H (1982) Degradation of methylmercury
by selenium. Life Sci 31:859–866
Kaehler S, Pakhomov EA (2001) Effects of storage and preservation
on the 13C and 15N signatures of selected marine organisms.
Mar Ecol Prog Ser 219:299–304
Keeler GJ, Landis MS, Norris GA, Christianson EM, Dvonch JT
(2006) Sources of mercury wet deposition in Eastern Ohio, USA.
Environ Sci Technol 40:5874
Kempers AJ, Luft AG (1988) Re-examination of the determination of
environmental nitrate as nitrite by reduction with hydrazine.
Analyst 113:1117–1120
Khan MAK, Wang F (2009) Mercury–selenium compounds and their
toxicological significance: toward a molecular understanding of
the mercury–selenium antagonism. Environ Toxicol Chem 28:
1567–1577
Krom MD (1980) Spectrophotometric determination of ammonia: a
study of a modified Berthelot reaction using salicylate and
dichloroisocyanurate. Analyst 105:305–316
Lange TR, Royals HE, Connor LL (1993) Influence of water
chemistry on mercury concentration in largemouth bass from
Florida lakes. TAFS 122:74
Lin CC, Jay JA (2007) Mercury methylation by planktonic and
biofilm cultures of Desulfovibrio desulfuricans. Environ Sci
Technol 41:6691–6697
Mergler D, Anderson HA, Hing Man Chan L, Mahaffey KR, Murray
M, Sakamoto M, Stern AH (2007) Methylmercury exposure and
health effects in humans: a worldwide concern. Ambio 36:3–11
Minagawa M, Wada E (1984) Stepwise enrichment of 15N along food
chains: further evidence and the relation between 15N and
animal age. Geochim Cosmochim Acta 48:1135–1140
Miskimmin BM, Rudd JWM, Kelly CA (1992) Influence of DOC,
pH, and microbial respiration rates on mercury methylation and
demethylation in lake water. Can J Fish Aquat Sci 49:17–22
Morel FMM, Kraepiel AML, Amyot M (1998) The chemical cycle
and bioaccumulation of mercury. Annu Rev Ecol Syst 29:
543–566
NCDENR (North Carolina Department of Environmental and Natural
Resources) (2005) Mercury emissions and mercury controls for
coal-fired electrical utility boilers
Neter J, Kutner MH, Nachtsheim CJ, Wasserman W (1996) Applied
linear statistical models, 4th edn. Irwin, Chicago
Pacyna EG, Pacyna JM (2002) Global emission of mercury from
anthropogenic sources in 1995. Water Air Soil Pollut 137:
149–165
Pacyna EG, Pacyna JM, Steenhuisen F, Wilson S (2006) Global
anthropogenic mercury emission inventory for 2000. Atmos
Environ 40:4048–4063
Paulsson K, Lundbergh K (1991) Treatment of mercury contaminated
fish by selenium addition. Water Air Soil Pollut 56:833–841
D. K. Sackett et al.
123
Peterson BJ, Fry B (1987) Stable isotopes in ecosystem studies. Ann
Rev Ecol Syst 18:293–320
Piraino MN, Taylor DL (2009) Bioaccumulation and trophic transfer
of mercury in striped bass (Morone saxatilis) and tautog
(Tautoga onitis) from the Narragansett Bay (Rhode Island,
USA). Marine Environ Res 67:117–128
Post DM (2002) Using stable isotopes to estimate trophic position:
models, methods, and assumptions. Ecology 83:703–718
Ravichandran M (2004) Interactions between mercury and dissolved
organic matter–a review. Chemospere 55:319–331
Sackett DK, Aday DD, Rice JA, Cope WG (2009) A statewide
assessment of mercury dynamics in North Carolina water bodies
and fish. TAFS 138:1328–1341
Saiki MK, Jennings MR, Ma TW (1992) Selenium and other elements
in freshwater fishes from the irrigated San Joaquin Valley,
California. Sci Total Environ 126:109–137
Scheuhammer AM, Meyer MW, Sandheinrich MB, Murray MW
(2007) Effects of environmental methylmercury on the health of
wild birds, mammals, and fish. Ambio 36:12–18
Schuster PF, Krabbenhoft DP, Naftz DL, Cecil LD, Olson ML,
DeWild JF, Susong DD, Green J, Abbott ML (2002) Atmo-
spheric mercury deposition during the last 270 years: a glacial
ice core record of natural and anthropogenic sources. Environ
Sci Technol 36:2303–2310
Sellers P, Kelly CA, Rudd JWM (2001) Fluxes of methylmercury to
the water column of a drainage lake: the relative importance of
internal and external sources. Limnol Oceanogr 46:623–631
Selvendiran P, Driscoll CT, Bushey JT, Montesdeoca MR (2008)
Wetland influence on mercury fate and transport in a temperate
forested watershed. Environ Pollut 154:46–55
Simonin HA, Loukmas JJ, Skinner LC, Roy KM (2008) Lake
variability: key factors controlling mercury concentrations in
New York State fish. Environ Pollut 154:107–115
Southworth GR, Peterson MJ, Ryon MG (2000) Long-term increased
bioaccumulation of mercury in largemouth bass follows reduc-
tion of waterborne selenium. Chemosphere 41:1101–1105
Trudel MR, Rasmussen JB (1997) Modeling the elimination of
mercury by fish. Environ Sci Technol 31:1716–1722
Trudel MR, Rasmussen JB (2006) Bioenergetics and mercury
dynamics in fish: a modeling perspective. Can J Fish Aquat
Sci 63:1890–1902
Ullrich SM, Tanton TW, Abdrashitova SA (2001) Mercury in the
aquatic environment: a review of factors affecting methylation.
Crit Rev Environ Sci Technol 31:241
USEPA (United States Environmental Protection Agency) (2000)
Guidance for assessing chemical contaminant data for use in fish
advisories. Office of Water, vol 1: fish sampling and analysis,
3rd edn. EPA 823-B-00-007. USEPA, Washington, DC
Van Walleghem JLA, Blanchfield PJ, Hintelmann H (2007) Elimi-
nation of mercury by yellow perch in the wild. Environ Sci
Technol 41:5895–5901
Vander Zanden MJ, Rasmussen JB (2001) Variation in delta15N and
delta13C trophic fractionation: Implications for aquatic food
web studies. Limnol Oceanogr 46:2061–2066
Virtanen JK, Voutilainen S, Rissanen TH, Mursu J, Tuomainen T,
Korhonen MJ, Valkonen V, Seppanen K, Laukkanen JA,
Salonen JT (2005) Mercury, fish oils, and risk of acute coronary
events and cardiovascular disease, coronary heart disease, and
all-cause mortality in men in eastern Finland. Arterioscler
Thromb Vasc Biol 25:228–233
Wang WX (2002) Interactions of trace metals and different marine
food chains. Mar Ecol Prog Ser 243:295–309
Watras CJ, Backa RC, Halvorsena S, Hudson RJM, Morrisona KA,
Wente SP (1998) Bioaccumulation of mercury in pelagic
freshwater food webs. Sci Total Environ 219:183–208
Werner EE, Hall DJ (1988) Ontogenetic habitat shifts in bluegill: the
foraging rate-predation risk trade-off. Ecology 69:1352–1366
Yang D, Chen Y, Gunn JM, Belzile N (2008) Selenium and mercury
in organisms: interactions and mechanisms. Environ Rev 16:
71–92
Zhang L, Wang WX (2007) Size-dependence of the potential for
metal biomagnification in early life stages of marine fish.
Environ Toxicol Chem 26:787–794
Does proximity to coal-fired power plants influence fish tissue mercury?
123