Functional neuroanatomy of auditory scene analysis in Alzheimer's disease
10
UNCORRECTED PROOF 1 Q1 Functional neuroanatomy of auditory scene analysis in 2 Alzheimer3s disease 3 Hannah L. Golden a , Jennifer L. Agustus a , Johanna C. Goll a , Laura E. Downey a , Catherine J. Mummery a , 4 Jonathan M. Schott a , Sebastian J. Crutch a , Jason D. Warren a, * 5 a Dementia Research Centre, UCL Institute of Neurology, University College London, London, UK abstract 6 article info 7 Article history: 8 Received 20 October 2014 9 Received in revised form 16 January 2015 10 Accepted 24 February 2015 11 Available online xxxx 12 Keywords: 13 Auditory scene analysis 14 Cocktail party effect 15 Alzheimer3s disease 16 fMRI 17 Auditory scene analysis is a demanding computational process that is performed automatically and efficiently by 18 the healthy brain but vulnerable to the neurodegenerative pathology of Alzheimer3s disease. Here we assessed 19 the functional neuroanatomy of auditory scene analysis in Alzheimer3s disease using the well-known ‘cocktail 20 party effect’ as a model paradigm whereby stored templates for auditory objects (e.g., hearing one3s spoken 21 name) are used to segregate auditory ‘foreground’ and ‘background’. Patients with typical amnestic Alzheimer3s 22 disease (n = 13) and age-matched healthy individuals (n = 17) underwent functional 3 T-MRI using a sparse 23 acquisition protocol with passive listening to auditory stimulus conditions comprising the participant3s own 24 name interleaved with or superimposed on multi-talker babble, and spectrally rotated (unrecognisable) ana- 25 logues of these conditions. Name identification (conditions containing the participant3s own name contrasted 26 with spectrally rotated analogues) produced extensive bilateral activation involving superior temporal cortex 27 in both the AD and healthy control groups, with no significant differences between groups. Auditory object 28 segregation (conditions with interleaved name sounds contrasted with superimposed name sounds) produced 29 activation of right posterior superior temporal cortex in both groups, again with no differences between groups. 30 However, the cocktail party effect (interaction of own name identification with auditory object segregation 31 processing) produced activation of right supramarginal gyrus in the AD group that was significantly enhanced 32 compared with the healthy control group. The findings delineate an altered functional neuroanatomical profile 33 of auditory scene analysis in Alzheimer3s disease that may constitute a novel computational signature of this neu- 34 rodegenerative pathology. 35 © 2015 Published by Elsevier Inc. This is an open access article under the CC BY-NC-ND license 36 (http://creativecommons.org/licenses/by-nc-nd/4.0/). 37 38 39 40 41 1. Introduction 42 Decoding the auditory world poses a formidable problem of neural 43 computation. Our brains normally solve this problem efficiently and 44 automatically but the neural basis of ‘auditory scene analysis’ remains 45 incompletely understood. The disambiguation of sound sources within 46 the complex mixture that generally arrives at our ears is an essential 47 prerequisite for identification of those sources and a fundamental task 48 of auditory scene analysis (Bregman, 1994). One of the best known in- 49 stances of this process in action is the so-called ‘cocktail party effect’ 50 whereby our own name spoken across a noisy room captures attention 51 and may even lead to successful tracking of the relevant conversation 52 against the surrounding babble (Cherry, 1953; Moray, 1959). The cock- 53 tail party effect is a celebrated example of a much wider category of 54 auditory phenomena that depend on generic computational processes 55 that together segregate an acoustic target or ‘foreground’ sound from 56 the acoustic ‘background’: these processes are likely to include repre- 57 sentation of spectral and temporal regularities in the sound mixture 58 and matching to previously stored auditory ‘templates’ (for example, 59 specific speech or vocal sounds) prior to engagement of attentional 60 resources (Billig et al., 2013; Griffiths and Warren, 2002; Kumar et al., 61 2007). Functional neuroimaging studies to define neuroanatomical 62 substrates of auditory scene analysis in the healthy brain have implicat- 63 ed a distributed, dorsally directed cortical network including planum 64 temporale and posterior superior temporal gyrus, supramarginal 65 gyrus, intraparietal sulcus and prefrontal projection targets (Dykstra 66 et al., 2011; Gutschalk et al., 2007; Hill and Miller, 2010; Kondo and 67 Kashino, 2009; Kong et al., 2014; Linden et al., 1999; Overath et al., 68 2010; Wilson et al., 2007; Wong et al., 2009). While frontal cortex is 69 thought to drive top-down attentional processes (Hill and Miller, 70 2010; Obleser et al., 2007; Schönwiesner et al., 2007), the precise role 71 of parietal cortex in auditory scene analysis is more contentious 72 and might include primary labelling of salient events (Cohen, 2009; 73 Downar et al., 2000), integration of signal representations for program- 74 ming behavioural responses (Cusack, 2005; Lee et al., 2014) or NeuroImage: Clinical xxx (2015) xxx–xxx * Corresponding author. Tel.: +44 203 448 4773; fax: +44 203 448 3104. E-mail address: [email protected] (J.D. Warren). YNICL-00452; No. of pages: 10; 4C: http://dx.doi.org/10.1016/j.nicl.2015.02.019 2213-1582/© 2015 Published by Elsevier Inc. This is an open access article under the CC BY-NC-ND license (http://creativecommons.org/licenses/by-nc-nd/4.0/). Contents lists available at ScienceDirect NeuroImage: Clinical journal homepage: www.elsevier.com/locate/ynicl Please cite this article as: Golden, H.L., et al., Functional neuroanatomy of auditory scene analysis in Alzheimer3s disease, NeuroImage: Clinical (2015), http://dx.doi.org/10.1016/j.nicl.2015.02.019
-
Upload
independent -
Category
Documents
-
view
4 -
download
0
Transcript of Functional neuroanatomy of auditory scene analysis in Alzheimer's disease

UNCO
RRECTED P
RO
OF
1Q1 Functional neuroanatomy of auditory scene analysis in
2 Alzheimer3s disease
3 Hannah L. Golden a, Jennifer L. Agustus a, Johanna C. Goll a, Laura E. Downey a, Catherine J. Mummery a,4 Jonathan M. Schott a, Sebastian J. Crutch a, Jason D. Warren a,*
5aDementia Research Centre, UCL Institute of Neurology, University College London, London, UK
a b s t r a c t6 a r t i c l e i n f o
7 Article history:
8 Received 20 October 2014
9 Received in revised form 16 January 2015
10 Accepted 24 February 2015
11 Available online xxxx
12 Keywords:
13 Auditory scene analysis
14 Cocktail party effect
15 Alzheimer3s disease
16 fMRI
17Auditory scene analysis is a demanding computational process that is performed automatically and efficiently by
18the healthy brain but vulnerable to the neurodegenerative pathology of Alzheimer3s disease. Here we assessed
19the functional neuroanatomy of auditory scene analysis in Alzheimer3s disease using the well-known ‘cocktail
20party effect’ as a model paradigm whereby stored templates for auditory objects (e.g., hearing one3s spoken
21name) are used to segregate auditory ‘foreground’ and ‘background’. Patients with typical amnestic Alzheimer3s
22disease (n = 13) and age-matched healthy individuals (n = 17) underwent functional 3 T-MRI using a sparse
23acquisition protocol with passive listening to auditory stimulus conditions comprising the participant3s own
24name interleaved with or superimposed on multi-talker babble, and spectrally rotated (unrecognisable) ana-
25logues of these conditions. Name identification (conditions containing the participant3s own name contrasted
26with spectrally rotated analogues) produced extensive bilateral activation involving superior temporal cortex
27in both the AD and healthy control groups, with no significant differences between groups. Auditory object
28segregation (conditions with interleaved name sounds contrasted with superimposed name sounds) produced
29activation of right posterior superior temporal cortex in both groups, again with no differences between groups.
30However, the cocktail party effect (interaction of own name identification with auditory object segregation
31processing) produced activation of right supramarginal gyrus in the AD group that was significantly enhanced
32compared with the healthy control group. The findings delineate an altered functional neuroanatomical profile
33of auditory scene analysis in Alzheimer3s disease thatmay constitute a novel computational signature of this neu-
34rodegenerative pathology.
35 © 2015 Published by Elsevier Inc. This is an open access article under the CC BY-NC-ND license
36 (http://creativecommons.org/licenses/by-nc-nd/4.0/).
3738
39
40
41 1. Introduction
42 Decoding the auditory world poses a formidable problem of neural
43 computation. Our brains normally solve this problem efficiently and
44 automatically but the neural basis of ‘auditory scene analysis’ remains
45 incompletely understood. The disambiguation of sound sources within
46 the complex mixture that generally arrives at our ears is an essential
47 prerequisite for identification of those sources and a fundamental task
48 of auditory scene analysis (Bregman, 1994). One of the best known in-
49 stances of this process in action is the so-called ‘cocktail party effect’
50 whereby our own name spoken across a noisy room captures attention
51 and may even lead to successful tracking of the relevant conversation
52 against the surrounding babble (Cherry, 1953; Moray, 1959). The cock-
53 tail party effect is a celebrated example of a much wider category of
54 auditory phenomena that depend on generic computational processes
55 that together segregate an acoustic target or ‘foreground’ sound from
56the acoustic ‘background’: these processes are likely to include repre-
57sentation of spectral and temporal regularities in the sound mixture
58and matching to previously stored auditory ‘templates’ (for example,
59specific speech or vocal sounds) prior to engagement of attentional
60resources (Billig et al., 2013; Griffiths and Warren, 2002; Kumar et al.,
612007). Functional neuroimaging studies to define neuroanatomical
62substrates of auditory scene analysis in the healthy brain have implicat-
63ed a distributed, dorsally directed cortical network including planum
64temporale and posterior superior temporal gyrus, supramarginal
65gyrus, intraparietal sulcus and prefrontal projection targets (Dykstra
66et al., 2011; Gutschalk et al., 2007; Hill and Miller, 2010; Kondo and
67Kashino, 2009; Kong et al., 2014; Linden et al., 1999; Overath et al.,
682010; Wilson et al., 2007; Wong et al., 2009). While frontal cortex is
69thought to drive top-down attentional processes (Hill and Miller,
702010; Obleser et al., 2007; Schönwiesner et al., 2007), the precise role
71of parietal cortex in auditory scene analysis is more contentious
72and might include primary labelling of salient events (Cohen, 2009;
73Downar et al., 2000), integration of signal representations for program-
74ming behavioural responses (Cusack, 2005; Lee et al., 2014) or
NeuroImage: Clinical xxx (2015) xxx–xxx
* Corresponding author. Tel.: +44 203 448 4773; fax: +44 203 448 3104.
E-mail address: [email protected] (J.D. Warren).
YNICL-00452; No. of pages: 10; 4C:
http://dx.doi.org/10.1016/j.nicl.2015.02.019
2213-1582/© 2015 Published by Elsevier Inc. This is an open access article under the CC BY-NC-ND license (http://creativecommons.org/licenses/by-nc-nd/4.0/).
Contents lists available at ScienceDirect
NeuroImage: Clinical
j ourna l homepage: www.e lsev ie r .com/ locate /yn ic l
Please cite this article as: Golden, H.L., et al., Functional neuroanatomy of auditory scene analysis in Alzheimer3s disease, NeuroImage: Clinical
(2015), http://dx.doi.org/10.1016/j.nicl.2015.02.019

UNCO
RRECTED P
RO
OF
75 attentional modulation (Hill and Miller, 2010; Nakai et al., 2005). With
76 particular reference to the cocktail party effect, speech intelligibility has
77 been shown to engagemore ventral and anterior superior temporal cor-
78 tex in the dominant hemisphere (Scott et al., 2000), but is influenced by
79 the nature of the backgroundmasker (speech versus non-speech: Scott
80 and McGettigan, 2013; Scott et al., 2009). Lexical processes may modu-
81 late auditory scene analysis, perhaps via template matching algorithms
82 (Billig et al., 2013; Griffiths and Warren, 2002) as well as additional
83 parietal and prefrontal mechanisms engaging in speech in noise pro-
84 cessing, particularly under conditions of increased attentional demand
85 (Binder et al., 2004; Davis et al., 2011; Nakai et al., 2005; Scott et al.,
86 2004; Scott and McGettigan, 2013).
87 Onbehavioural aswell as neuroanatomical grounds, the computation-
88 al processing required for auditory scene analysis is likely to be particular-
89 ly vulnerable to the neurodegenerative disease process in Alzheimer3s
90 disease (AD). Patients with AD commonly experience difficulties in fol-
91 lowing conversations under degraded listening conditions such as a
92 busy room or noisy telephone line. Both generic deficits of central audito-
93 ry processing and specific deficits of auditory scene analysis have been
94 demonstrated in AD (Gates et al., 1996, 2008, 2011; Golden et al., 2015;
95 Goll et al., 2011, 2012; Golob et al., 2007, 2009; Kurylo et al., 1993;
96 Strouse et al., 1995); these develop early in the course of disease and
97 are likely to interact with impairments of attention andworkingmemory
98 (Conway et al., 2001; Goll et al., 2012; Stopford et al., 2012). Deficits of au-
99 ditory scene analysis are in accord with the neuroanatomy of AD, which
100 blights a large-scale, functionally coherent brain network linking mesial
101 temporal lobe structures with retrosplenial, temporo-parietal andmedial
102 prefrontal cortices (Buckner et al., 2008; Greicius and Menon, 2004;
103 Raichle et al., 2001; Seeley et al., 2009). Regional deposition of pathogenic
104 proteins, hypometabolism and atrophy within this network in AD closely
105 overlaps regions implicated in auditory scene analysis and speech-
106 in-noise processing in the healthy brain, and involvement of temporo-
107 parietal cortical junction zones is likely to be particularly pertinent
108 (Herholz et al., 2002; Scahill et al., 2002; Warren et al., 2012). Indeed,
109 modulation of activity in these areas has been linked to the efficiency of
110 speech-in-noise processing even in apparently healthy older individuals
111 (Wong et al., 2009). However, the pathophysiology of this culprit brain
112 network in AD remains to be worked out in detail. While involvement
113 of this network is relatively selective in AD, it is unlikely that the network
114 behaves as an amorphous unit (Warren et al., 2012); moreover its core
115 function or functions have not been defined. Although it has been desig-
116 nated the ‘default mode network’, showing correlated activity in the
117 healthy ‘resting’ brain and deactivation with certain tasks (Buckner
118 et al., 2008; Raichle et al., 2001; Shulman et al., 1997), this network has
119 also been implicated in various ‘active’ processes including maintenance
120 of internal sensory representations (Buckner et al., 2008; Buckner and
121 Carroll, 2007; Spreng and Grady, 2010; Zvyagintsev et al., 2013) and
122 more specifically in aspects of auditory scene analysis, both in the healthy
123 brain (Salvi et al., 2002;Wong et al., 2009; Zündorf et al., 2013) and in pa-
124 tients with AD (Goll et al., 2012).125 Here we used the cocktail party effect to delineate the functional
126 neuroanatomy of auditory scene analysis in a cohort of patients with
127 AD in relation to healthy older individuals. Previous work in AD has ad-
128 dressed psychophysical deficits of auditory scene analysis using rela-
129 tively simple paradigms and structural neuroanatomical correlation
130 (Gates et al., 2008, 2011; Goll et al., 2012). In this study we set out to
131 use a realistic auditory scene analysis paradigm in the context of fMRI,
132 in order to probe functional brain mechanisms directly. This paradigm
133 was motivated by a cognitive model of the cocktail party effect accord-
134 ing to which stored templates for auditory objects (e.g., spoken words)
135 are used to disambiguate those objects from other sounds in the envi-
136 ronment during parsing of the auditory scene (segregation of auditory
137 ‘foreground’ and ‘background’: Griffiths and Warren, 2002). We used
138 participant3s own names as salient acoustic targets (Moray, 1959;
139 Wood and Cowan, 1995) against naturalistic multi-talker babble; a
140 sparse fMRI acquisition protocol to minimise confounding effects
141engendered by streaming auditory stimuli against scanner noise (Hall
142et al., 1999); and a passive-listening design to minimise any confound-
143ing effects from output task in these cognitively impaired patients.
144Based on previous neuroanatomical work in the healthy brain and
145in AD,we hypothesised that patientswith AD and healthy older individ-
146uals would show similar profiles of auditory cortex activation by sound
147and representation of name identity per se; but that AD would have a
148distinct pathophysiological signature during auditory scene analysis,
149in temporo-parietal cortical regions separable frommore anterior supe-
150rior temporal cortex engaged by name identity coding (Dykstra et al.,
1512011; Goll et al., 2012; Overath et al., 2010; Scott et al., 2000, 2009;
152Wong et al., 2009). In particular, we hypothesised that AD would pro-
153duce an altered interaction of auditory name template matching with
154object segregation underpinning the cocktail party effect.
1552. Methods
1562.1. Participants
157Thirteen consecutive patients (mean (standard deviation) age
15866 (5.8) years; five female) fulfilling consensus clinical criteria for
159early to moderately severe, typical Alzheimer3s disease (AD) led by
160predominant episodic memory loss with additional cognitive dysfunc-
161tion (Dubois et al., 2007) and 17 age-matched healthy individuals (68
162(3.9) years; seven female) with no history of neurological or psychiatric
163illness participated in the study. All participants were right-handed and
164no participant had a clinical history of peripheral hearing loss; nonewas
165a professional musician. Detailed general neuropsychological assess-
166ment in the AD group corroborated the clinical diagnosis in all cases;
167demographic, clinical and neuropsychological details for the experi-
168mental groups are summarised in Table 1. At the time of participation,
16912 patients were receiving symptomatic treatment with an acetylcho-
170linesterase inhibitor (onewas also receivingmemantine). CSF examina-
171tion was undertaken in six patients with AD and revealed a total tau:
172beta-amyloid ratio N1 (compatible with underlying AD pathology) in
173all cases. All participants gave informed consent in accordance with
174the Declaration of Helsinki.
1752.2. Assessment of peripheral hearing
176All participants had pure-tone audiometry using a procedure
177adapted from a commercial screening audiometry software package
178(AUDIO-CDTM®, http://www.digital-recordings.com/audiocd/audio.
179html). The testwas administered via headphones froma notebook com-
180puter in a quiet room. Five frequency levels (500, 1000, 2000, 3000,
1814000Hz)were assessed: at each frequency, participantswere presented
182with a continuous tone that slowly and linearly increased in intensi-
183ty. Participants were instructed to indicate as soon as they were sure
184they could detect the tone; this response time was measured and
185stored for offline analysis. Hearing was assessed in the right ear in
186each participant.
1872.3. Experimental design and stimuli
188In designing the experimental paradigm we manipulated two key
189components of the cocktail party effect: separation of a particular ‘fore-
190ground’ auditory object (a spokenword) froma complex soundmixture
191or acoustic ‘background’; and matching of foreground object (own
192name) identity with a previously stored ‘template’. In order to isolate
193the neural processes involved in these computations, we created two
194closely matched auditory baseline conditions: by presenting ‘foreground’
195sounds interleaved with (rather than superimposed on) the acoustic
196background; and by spectral rotation of participants3 spoken names to
197generate acoustically similar but unfamiliar (and unintelligible) sound
198objects. Under this design, the cocktail party effect (detection of own
2 H.L. Golden et al. / NeuroImage: Clinical xxx (2015) xxx–xxx
Please cite this article as: Golden, H.L., et al., Functional neuroanatomy of auditory scene analysis in Alzheimer3s disease, NeuroImage: Clinical
(2015), http://dx.doi.org/10.1016/j.nicl.2015.02.019

UNCO
RRECTED P
RO
OF
199 name in a busy auditory scene) represents the interaction of processes
200 that mediate auditory object segregation and template matching.
201 Stimuli were created as digital wave files and edited in Matlab7.0®
202 (http://www.mathworks.co.uk); examples of stimuli are available in
203 Supplementary Material on-line. Each participant3s own first name was
204 recorded in a sound-proof room, by the same young adult female speaker
205 using a Standard Southern English accent. Recorded name sounds were
206 spectrally rotated using a previously described procedure that preserves
207 spectral and temporal complexity but renders speech content unintel-
208 ligible (Blesser, 1972). An acoustic ‘background’ of speech babblewas cre-
209 ated by superimposing recordings of 16 different female speakers reading
210 passages of English from the EUROM database of English speech (Chan
211 et al., 1995) using a previously described method (Rosen et al., 2013);
212 no words were intelligible from the sound mixture. Babble samples
213were spectrally rotated in order to provide an acoustic background for
214the spectrally rotated name sounds that reduced any spectral ‘pop-out’
215effects. The signal-to-noise ratio of names to background babble was
216fixed at 17 dB, corresponding to a moderately noisy (e.g., cocktail party)
217environment (International Telecommunication Union, 1986).
218To create experimental trials, name and spectrally rotated name
219sounds were added to corresponding (raw or spectrally rotated) babble
220samples by either superimposing on or interleaving with babble; name
221soundswere repeated four timeswithin a single trial and the total dura-
222tion of each trialwasfixed at 8 s (duration of individual nameexemplars
2230.6–0.9 s; experimental trials schematised in Fig. 1). Concatenated
224sound samples were windowed with 20 ms onset–offset temporal
225ramps to prevent click artefacts, and all wave files were digitally
226sampled at 44,100 Hz with fixed mean (root-mean-square) intensity
227over all trials. These procedures yielded four experimental conditions
228in a factorial relation: own natural name superimposed on babble, NS;
229own natural name interleaved with babble, NI; spectrally rotated
230name superimposed on (spectrally rotated) babble, RS; spectrally rotat-
231ed name interleavedwith (spectrally rotated) babble, RI. Twenty unique
232trialswere created for each condition, by randomly varying the onsets of
233the four name sounds within the 8 s trial interval. An additional rest
234baseline condition comprising 8-s silent intervals was also included.
2352.4. Experimental procedures
2362.4.1. Stimulus presentation
237In the fMRI session, experimental trials were presented from a note-
238book computer running the Cogent v1.25 extension of MatLab (Vision
239Lab, University College London, UK), each triggered by the MR scanner
240on completion of the previous image acquisition in a ‘sparse’ acquisition
241protocol. Sounds were delivered binaurally via electrodynamic head-
242phones (http://www.mr-confon.de) at a comfortable listening level
243(at least 70 dB) that was fixed for all participants; two identical scan-
244ning runs were administered, each comprising 20 trials for each sound
245condition plus 10 silence trials, yielding a total of 180 trials for the ex-
246periment. Participants were instructed to listen to the sound stimuli
247with their eyes open; there was no in-scanner output task and no be-
248havioural responses were collected.
t1:1 Table 1
t1:2 General demographic, clinical and behavioural data for participant groups.
t1:3 Characteristics Healthy controls AD
t1:4 General
t1:5 No (m:f). 17 (8:9) 13 (8:5)
t1:6 Age (years) 68.3 (3.9) 65.7 (5.6)
t1:7 Education (years) 15.8 (3.0) 13.4 (3.2)a
t1:8 Musical training (years) 1.7 (2.7) 3.0 (2.7)
t1:9 MMSE 28.8 (0.9) 19.7 (6.5)a
t1:10 Symptom duration (years) − 4.9 (1.7)
t1:11
t1:12 Neuropsychological assessment
t1:13 General intellect: IQ
t1:14 WASI verbal IQ 118.6 (8.1) 87.1 (22.3)a
t1:15 WASI performance IQ 118.1 (15.1) 83.5 (17.4)a
t1:16 NART estimated premorbid IQ 119.7 (5.7) 103.9 (16.5)a
t1:17
t1:18 Episodic memory
t1:19 RMT words (/50) 46.2 (2.8) 30.6 (6.9)a
t1:20 RMT faces (/50) 43.1 (4.6) 33.5 (7.1)a
t1:21
t1:22 Executive skills
t1:23 WASI block design (/71) 42.4 (16.6) 12.6 (13.7)a
t1:24 WASI matrices (/32) 29.4 (14.9) 12.8 (9.6)a
t1:25 WMS-R digit span forward (/12) 8.6 (1.8) 6.1 (2.1)a
t1:26 WMS-R digit span backward (/12) 6.6 (2.2) 4.5 (2.8)a
t1:27 D-KEFS Stroopb colour (s) 33.0 (7.1) 53.3 (18.0)a
t1:28 D-KEFS Stroopb word (s) 22.4 (4.5) 41.4 (25.6)a
t1:29 D-KEFS Stroopb interference (s) 62.2 (16.7) 102.1 (32.9)a
t1:30
t1:31 Verbal skills
t1:32 WASI vocabulary (/80) 68.1 (4.5) 45.2 (20.2)a
t1:33 WASI similarities (/48) 41.1 (9.0) 23.1 (12.8)a
t1:34 GNT (/30) 24.9 (3.2) 12.9 (8.5)a
t1:35 BPVS (/150) 146.8 (3.0) 123.8 (28.8)a
t1:36 NARTc (/50) 41.2 (4.6) 30.2 (12.2)a
t1:37
t1:38 Posterior cortical skills
t1:39 GDAd (/24) 15.6 (3.5) 6.4 (4.9)a
t1:40 VOSP object decision (/20) 18.2 (1.5) 14.8 (2.9)a
t1:41
t1:42 Post-scan behavioural tasks
t1:43 Name detection (/20) 19.9 (0.3) 19.0 (1.5)
t1:44 Segregation detection (/20)c 17.1 (2.7) 12.2 (4.1)a
t1:45 Values aremean (standarddeviation, std) unless otherwise stated. Rawdata are shown for
t1:46 neuropsychological tests (maximumscore in parentheses); bold indicatesmean raw score
t1:47 b5th percentile based on published norms.
t1:48 AD, patient group with typical Alzheimer3s disease; BPVS, British Picture Vocabulary Scale
t1:49 (Dunn et al., 1982); D-KEFS, Delis Kaplan Executive System (Delis et al., 2001); GDA,
t1:50 Graded Difficulty Arithmetic (Jackson and Warrington, 1986); GNT, Graded Naming Test
t1:51 (McKenna and Warrington, 1983); L, left; MMSE, Mini-Mental State Examination score;
t1:52 NART, National Adult Reading Test (Nelson, 1982); R, right; RMT, Recognition Memory
t1:53 Test (Warrington, 1984); VOSP, Visual Object and Spatial Perception Battery (Warrington
t1:54 and James, 1991); WASI, Wechsler Abbreviated Scale of Intelligence (Wechsler, 1999);
t1:55 WMS-R, Wechsler Memory Scale, Revised (Wechsler, 1987).
t1:56a Significantly different to healthy control group.
t1:57b Three patients did not complete all sub-sections of this task.
t1:58c One patient did not complete this task.
t1:59d Four patients were unable to complete this task.
Fig. 1. Schematic representation of fMRI stimulus conditions, showing representative trials.
Dark grey boxes signify presentations of participant3s ownname, in either natural or spectral-
ly rotated (inverted) form; light grey boxes represent the acoustic background (multi-talker
babble). Onsets of nameexemplarswere varied randomlybetween trials; each trialwas 8 s in
total duration. NS, ownnatural name sounds superimposed on babble; NI, ownnatural name
sounds interleaved with babble; RS, spectrally rotated name sounds superimposed on
babble; RI, spectrally rotated name sounds interleaved with babble.
3H.L. Golden et al. / NeuroImage: Clinical xxx (2015) xxx–xxx
Please cite this article as: Golden, H.L., et al., Functional neuroanatomy of auditory scene analysis in Alzheimer3s disease, NeuroImage: Clinical
(2015), http://dx.doi.org/10.1016/j.nicl.2015.02.019
UNCO
RRECTED P
RO
OF
249 2.4.2. Brain image acquisition
250 Brain images were acquired on a 3 Tesla TIM Trio MRI scanner
251 (Siemens Healthcare, Erlangen, Germany) using a 12-channel RF receive
252 head coil. For each of the two functional runs, 92 single-shot gradient-
253 echo planar image (EPI) volumes were acquired each with 48 oblique
254 transverse slices covering the whole brain (slice thickness 2 mm, inter-
255 slice gap 1 and 3 mm in-plane resolution, TR/TE 70/30 ms, echo spacing
256 0.5 ms, matrix size 64 × 64 pixels, FoV 192 × 192 mm, phase encoding
257 (PE) direction anterior–posterior). A slice tilt of−30° (T N C), z-shim gra-
258 dient moment of +0.6 mT/m ms and positive PE gradient polarity were
259 used to minimise susceptibility-related loss of signal and blood-oxygen-
260 level-dependent (BOLD) functional sensitivity in the temporal lobes,
261 following optimisation procedures described previously (Weiskopf
262 et al., 2006). Sparse-sampling EPI acquisition with repetition time
263 11.36 s (corresponding to an inter-scan gap of 8 s) was used to reduce
264 any interaction between scanner acoustic noise and auditory stimulus
265 presentations. The initial two brain volumes in each run were performed
266 to allow equilibrium of longitudinal T1magnetisation but discarded from
267 further analysis. A B0 field-map was acquired using a gradient
268 double-echo FLASH sequence (TE1 = 10 ms, TE2 = 12.46 ms, 3 ×
269 3 × 2 mm resolution, 1 mm gap; matrix size = 64 × 64 pixels; FoV =
270 192×192mm) to allowpost-processing geometric distortion corrections
271 of EPI data due to B0 field inhomogeneities.
272 Volumetric brain MR images were also obtained in each participant
273 to allow coregistration of structural with functional neuroanatomical
274 data. The structural acquisition was based on a multi-parameter map-
275 ping protocol (Weiskopf et al., 2011; Weiskopf and Helms, 2008),
276 including a 3D multi-echo FLASH sequence with predominant T1 (TR
277 18.7 ms, flip angle 20°) weighting, six alternating gradient echoes at
278 equidistant echo times and 1 mm isotropic voxels.
279 2.4.3. Behavioural assessment
280 Following the scanning session, each participant3s ability to perceive
281 and discriminate the experimental conditions presented during scan-
282 ning was assessed using a two alternative forced choice psychoacoustic
283 procedure. Twenty auditory stimuli representing all sound conditions
284 (five NS, five NI, five RS, five RI) were derived from trials presented in
285 the scanner and administered in randomised order in two short tests.
286Q2In the first test, the task (name detection) was to determine whether
287or not the participant3s own name was present (discrimination of NS/
288NI from RS/RI conditions); in the second test, the task (segregation de-
289tection) was to determine whether the two kinds of sounds (name
290and babble) were superimposed or interleaved (‘Are the sounds over
291the top or in-between?’; discrimination of NS/RS fromNI/RI conditions),
292assistedby avisual guide (see Inline Supplementary Fig. S1 in Supplemen-
293tary Material on-line). It was established that all participants understood
294the tasks prior to commencing the tests; during the tests, no feedback
295about performance was given and no time limits were imposed. Partici-
296pant responses were recorded for off-line analysis.
297Inline Supplementary Fig. S1 can be found online at http://dx.doi.
298org/10.1016/j.nicl.2015.02.019.
2992.5. Data analyses
3002.5.1. fMRI data analysis
301Brain imaging data were analysed using statistical parametric
302mapping software (SPM8; http://www.fil.ion.ucl.ac.uk/spm). In initial
303image pre-processing, the EPI functional series for each participant
304was realigned using the first image as a reference and images were
305unwarped incorporating field-map distortion information (Hutton et al.,
3062002). The DARTEL toolbox (Ashburner, 2007) was used to spatially nor-
307malise all individual functional images to a groupmean template image in
308Montreal Neurological Institute (MNI) standard stereotactic space; to
309construct this group brain template, each individual3s T1 weighted MR
310image was first co-registered to their EPI series and segmented using
311DARTEL tools (New Segment) and this segment was then used to esti-
312mate a group template that was aligned to MNI space. Functional images
313were smoothed using a 6 mm full-width-at-half-maximum Gaussian
314smoothing kernel. For the purpose of rendering statistical parametric
315functional maps, a study-specific mean structural brain image template
316was created by warping all bias-corrected native space whole-brain
317images to the final DARTEL template and calculating the average of the
318warped brain images.
319Pre-processed functional images were entered into a first-level de-
320sign matrix incorporating the five experimental conditions (NS, NI, RS,
321RI and the baseline silence condition) modelled as separate regressors
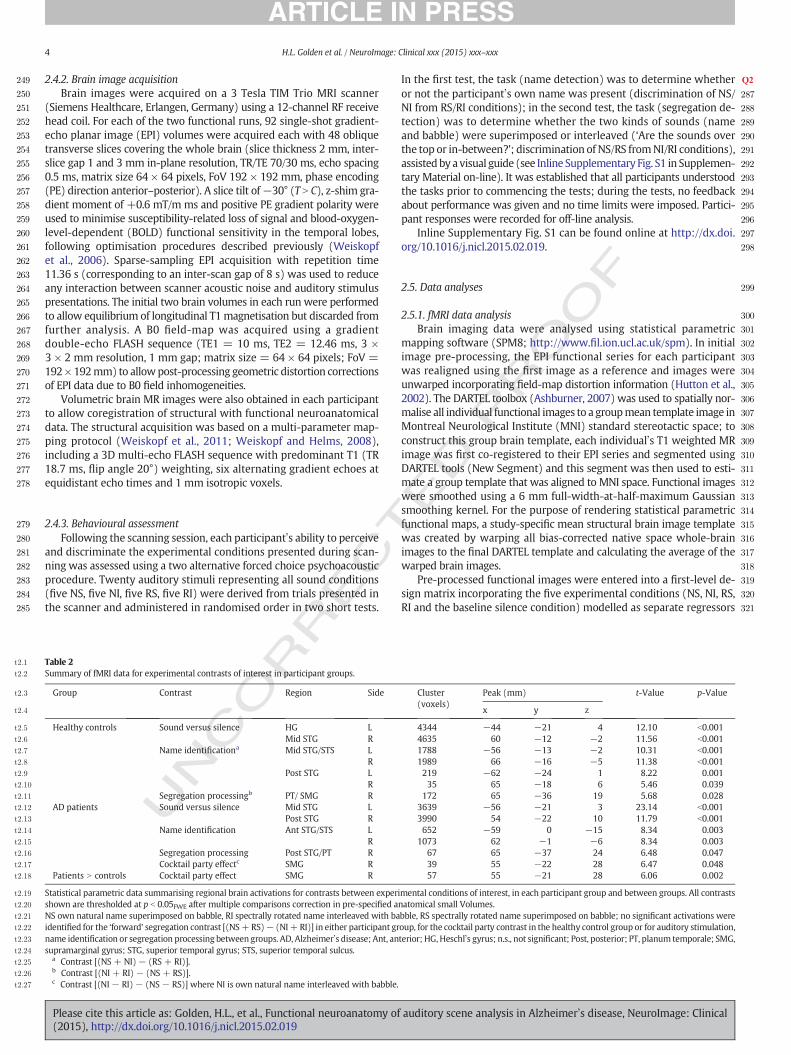
t2:1 Table 2
t2:2 Summary of fMRI data for experimental contrasts of interest in participant groups.
t2:3 Group Contrast Region Side Cluster
(voxels)
Peak (mm) t-Value p-Value
t2:4 x y z
t2:5 Healthy controls Sound versus silence HG L 4344 −44 −21 4 12.10 b0.001
t2:6 Mid STG R 4635 60 −12 −2 11.56 b0.001
t2:7 Name identificationa Mid STG/STS L 1788 −56 −13 −2 10.31 b0.001
t2:8 R 1989 66 −16 −5 11.38 b0.001
t2:9 Post STG L 219 −62 −24 1 8.22 0.001
t2:10 R 35 65 −18 6 5.46 0.039
t2:11 Segregation processingb PT/ SMG R 172 65 −36 19 5.68 0.028
t2:12 AD patients Sound versus silence Mid STG L 3639 −56 −21 3 23.14 b0.001
t2:13 Post STG R 3990 54 −22 10 11.79 b0.001
t2:14 Name identification Ant STG/STS L 652 −59 0 −15 8.34 0.003
t2:15 R 1073 62 −1 −6 8.34 0.003
t2:16 Segregation processing Post STG/PT R 67 65 −37 24 6.48 0.047
t2:17 Cocktail party effectc SMG R 39 55 −22 28 6.47 0.048
t2:18 Patients N controls Cocktail party effect SMG R 57 55 −21 28 6.06 0.002
t2:19 Statistical parametric data summarising regional brain activations for contrasts between experimental conditions of interest, in each participant group and between groups. All contrasts
t2:20 shown are thresholded at p b 0.05FWE after multiple comparisons correction in pre-specified anatomical small Volumes.
t2:21 NS own natural name superimposed on babble, RI spectrally rotated name interleaved with babble, RS spectrally rotated name superimposed on babble; no significant activations were
t2:22 identified for the ‘forward’ segregation contrast [(NS+RS)− (NI+ RI)] in either participant group, for the cocktail party contrast in the healthy control group or for auditory stimulation,
t2:23 name identification or segregation processing between groups. AD, Alzheimer3s disease; Ant, anterior; HG, Heschl3s gyrus; n.s., not significant; Post, posterior; PT, planum temporale; SMG,
t2:24 supramarginal gyrus; STG, superior temporal gyrus; STS, superior temporal sulcus.
t2:25a Contrast [(NS + NI)− (RS + RI)].
t2:26b Contrast [(NI + RI)− (NS + RS)].
t2:27c Contrast [(NI− RI)− (NS− RS)] where NI is own natural name interleaved with babble.
4 H.L. Golden et al. / NeuroImage: Clinical xxx (2015) xxx–xxx
Please cite this article as: Golden, H.L., et al., Functional neuroanatomy of auditory scene analysis in Alzheimer3s disease, NeuroImage: Clinical
(2015), http://dx.doi.org/10.1016/j.nicl.2015.02.019

UNCO
RRECTED P
RO
OF
322 convolved with the standard haemodynamic response function, and
323 also including six head movement regressors generated from the
324 realignment process.Q3 For each participant, first-level t-test contrast
325 images were generated for the main effects of auditory stimulation
326 [(NS + NI + RS + RI) − silence], identification of own name
327 [(NS+NI)− (RS+ RI)] (in the absence of a specific output task during
328 scanning, we use ‘identification’ here to indicate specific processing of
329 own-name identity in relation to an acoustically similar perceptual
330 baseline), and segregation of auditory foreground from background
331 [(NS + RS)− (NI + RI)]. In addition, contrast images were generated
332 for the interaction of identification and segregation processes [(NS−
333 RS)− (NI− RI)]: we argue that this interaction captures the computa-
334 tional process that supports the cocktail party effect proper. Both ‘for-
335 ward’ and ‘reverse’ contrasts were assessed in each case. Contrast
336 images for each participant were entered into a second-level random-
337 effects analysis in which effects within each experimental group and
338 between the healthy control and AD groups were assessed using
339 voxel-wise t-test contrasts.
340 Contrastswere assessed at peak voxel statistical significance threshold
341 p b 0.05 after family-wise error (FWE) correction for multiple voxel-wise
342 comparisons in twoanatomical small volumes of interest, specifiedby our
343 prior hypotheses (Dykstra et al., 2011; Goll et al., 2012; Overath et al.,
344 2010; Scott et al., 2000, 2009;Wong et al., 2009). These regional volumes
345 were created using MRICron® (http://www.mccauslandcenter.sc.edu/
346 mricro/mricron/) and comprised temporo-parietal junction (including
347 superior temporal and adjacent inferior parietal cortex posterior to
348 Heschl3s gyrus and supramarginal gyrus; the putative substrate for
349 auditory scene analysis) and superior temporal gyrus anterior and
350 lateral to Heschl3s gyrus (the putative substrate for name identity cod-
351 ing). For the purpose of assessing overall auditory stimulation, a com-
352 bined regional volume with addition of Heschl3s gyrus was used for the
353 contrast [(NS + NI + RS + RI)− silence].
354 2.5.2. Voxel-based morphometry of structural MR images
355 Structural brain images were compared between the patient and
356 healthy control groups in a voxel-based morphometric (VBM) analysis
357to obtain an AD-associated regional atrophy map: normalisation, seg-
358mentation and modulation of grey and white matter images were per-
359formed using default parameter settings in SPM8, with a Gaussian
360smoothing kernel of 6 mm full-width-at-half-maximum. Groups were
361compared using voxel-wise two-sample t-tests, including covariates of
362age, gender, and total intracranial volume. Statistical parametric maps
363of brain atrophy were thresholded leniently (p b 0.01 uncorrected
364over the whole brain volume) in order to capture any significant grey
365matter structural changes in relation to functional activation profiles
366from the fMRI analysis.
3672.5.3. Demographic and behavioural data analyses
368Demographic data were compared between the healthy control and
369AD groups using two sample t-tests (gender differences were assessed
370using a Pearson3s chi-square test of distribution); neuropsychological
371data were compared using non-parametric Wilcoxon rank-sum tests.
372Tone detection thresholds on audiometry screening and performance
373on post-scan behavioural tasks on experimental stimuli were analysed
374using linear regression models with clustered, robust standard error
375due to themodel residuals holding non-normal distributions. In the au-
376diometry analysis, the main effect of patient group was assessed while
377controlling for age and frequency type, aswell as assessing for any inter-
378action between group and frequency.
379In the analysis of post-scan behavioural data, a ‘cocktail party effect’
380measure was generated as the d-prime of name detection in the
381superimposed and interleaved conditions; the main effect of group
382and any interactions between test type and group were assessed for
383all test measures (name detection score/segregation detection score/
384cocktail party d-prime). In the AD group, correlations between individ-
385ual post-scan test performance measures and peak effect sizes (beta es-
386timates) for fMRI contrasts of interest were assessed using linear
387regression: name detection performance was correlatedwith peak acti-
388vation in the name identification contrast; segregation detection perfor-
389mance with the segregation contrast; and d-prime with the cocktail
390party effect contrast.
Fig. 2. Statistical parametric maps (panels top row, bottom left) of regional brain activation for contrasts of interest in the Alzheimer3s disease (AD) and healthy control groups and the
between-group ‘cocktail party’ interaction; effect sizes (group mean ±1 standard error peak voxel beta parameter estimates) for each experimental condition at the right supramarginal
gyrus peak from the cocktail party contrast are also shown (panel bottom right; * indicates significant difference in effect size between conditions, p b 0.01). Statistical parametric maps are
rendered on coronal and sagittal sections of the study-specific groupmean T1-weighted structuralMR image inMNI space; the coordinate of each section plane is indicated and the right hemi-
sphere is shown on the right in all coronal sections. Maps have been thresholded at p b 0.001 uncorrected over whole brain for display purposes; activations shownwere significant at p b 0.05
after family-wise error correction for multiple comparisons over anatomical small volume of interest (see also Table 2). Contrasts were composed as follows: name identification (cyan),
[(NS + NI)− (RS + RI)]; auditory object segregation processing (magenta), [(NI + RI)− (NS + RS)]; cocktail party effect (red), [(NI− RI)− (NS− RS)] where NI is own natural name
interleaved with babble, NS own natural name superimposed on babble, RI spectrally rotated name interleaved with babble, RS spectrally rotated name superimposed on babble.
5H.L. Golden et al. / NeuroImage: Clinical xxx (2015) xxx–xxx
Please cite this article as: Golden, H.L., et al., Functional neuroanatomy of auditory scene analysis in Alzheimer3s disease, NeuroImage: Clinical
(2015), http://dx.doi.org/10.1016/j.nicl.2015.02.019

UNCO
RRECTED P
RO
OF
391 For all tests, the threshold for statistical significance was p b 0.05;
392 Wald tests were used to assess the significance of interaction effects.
393 3. Results
394 3.1. General characteristics of experimental groups
395 The patient and healthy control groups did not differ significantly in
396 age (t(28)=1.51, p=0.14), gender distribution (χ2(1)=0.62, p=0.43)
397 or years ofmusical training (t(27)=1.60, p=0.12); the healthy control
398 group had on average significantly more years of education (t(28) =
399 2.08, p = 0.048), though participants in both groups overall were
400 relatively highly educated (see Table 1). Tone detection thresholds on
401 audiometry testing revealed that groupmembership did not have a sig-
402 nificant effect on detection time in ms (beta = 3420, CI−673 to 7514,
403 p = 0.10). There was a significant interaction between group and fre-
404 quency [F(4,30) = 3.14, p = 0.03] driven by the effect of frequency
405 type within group rather than any differences between groups.
406 3.2. Post-scan behavioural data
407 Group performance data for the post-scan behavioural tests are pre-
408 sented in Table 1. There was a significant main effect of test type (name
409 detection/segregation detection: beta = −2.82, CI −4.24 to −1.41,
410 p b 0.001) and a strong trend to a main effect of group (beta =−0.88,
411 CI−1.77 to 0.003, p = 0.051). There was a significant interaction be-
412 tween group and test type (F(1,29) = 9.29, p = 0.005): these results
413 were driven by poorer performance of the AD group than the healthy
414 control group on the auditory segregation detection task (t = 3.61,
415 p=0.001). Wald tests also revealed significantly superior performance
416 on name than segregation detection in both healthy individuals (t =
417 4.09, p b 0.001) and patients (t= 6.11, p b 0.001). There was no signif-
418 icant interaction between group and ‘cocktail party’ d-prime (F(1,29) =
419 2.75, p = 0.11).
420 3.3. Structural neuroanatomical data
421 Comparison of the AD and healthy control groups in the VBM analysis
422 revealed the anticipated profile of AD-associated regional grey matter at-
423 rophy involving hippocampi, temporal and retrosplenial cortices; statisti-
424 cal parametric maps are presented in Inline Supplementary Fig. S2 and
425 significant regions of AD-associated greymatter atrophy are summarised
426 in Inline Supplementary Table S1 in Supplementary Material on-line.
427 Inline Supplementary Fig. S2 and Table S1 can be found online at
428 http://dx.doi.org/10.1016/j.nicl.2015.02.019.
429 3.4. Functional neuroanatomical data
430 Significant neuroanatomical findings from the fMRI analysis
431 are summarised in Table 2 and statistical parametric maps and beta
432 parameter estimates for key contrasts and conditions are presented in
433 Fig. 2. All reported contrasts were significant at threshold p b 0.05FWE,
434 corrected for multiple voxel-wise comparisons within anatomical re-
435 gions of interest specified by our prior experimental hypotheses. Audi-
436 tory stimulation (the contrast of all sound conditions versus silence)
437 was associated, as anticipated, with extensive bilateral activation in-
438 volving the superior temporal gyri in both the AD and healthy control
439 groups; no significant differences between groups were identified and
440 there was no significant activation associated with the ‘reverse’ con-
441 trast. Identification of own name compared with spectrally rotated ana-
442 logues produced extensive bilateral activation of superior temporal
443 gyrus and superior temporal sulcus in both the AD and the healthy con-
444 trol groups; again, no significant differences between groupswere iden-
445 tified and there were no significant areas of activation for the ‘reverse’
446 contrast.Q4 In the contrast assessing auditory object segregation process-
447 ing, right planum temporale and posterior superior temporal gyrus
448were more activated in the interleaved than superimposed sound con-
449ditions (i.e., in the ‘reverse’ contrast: [(NI + RI)− (NS + RS)]) in both
450the AD and the healthy control groups; healthy individuals showed ad-
451ditional activation in an inferior parietal junctional area (supramarginal
452gyrus), however there were no significant differences between partici-
453pant groups nor any significant activations associatedwith the ‘forward’
454contrast. The contrast to assess the interaction of own name identifica-
455tion with auditory segregation processing (the cocktail party effect)
456produced no significant activations in the healthy control group but sig-
457nificant activation of right supramarginal gyrus in the AD group. There
458was a significant difference between groups for this contrast in right
459supramarginal gyrus.
460To further investigate this disease-associated modulation of cocktail
461party processing in supramarginal gyrus, we conducted an exploratory
462post hoc analysis of condition effects for both the AD andhealthy control
463groups. Beta parameter estimates in each sound condition relative to
464the baseline silence condition were compared using pair-wise t-tests
465(Bonferroni corrected, significance threshold p b 0.05) at the peak
466voxel of activation for the cocktail party contrast. In the AD group,
467activation in the RS condition was significantly greater than both the
468NS condition (t(12)=3.01, p=0.03) and the RS condition in the healthy
469control group (t(28) = 3.47, p = 0.02); there were no other significant
470sound condition differences within or between groups.
471The correlation analysis of peak-voxel beta contrast estimates and
472post-scan behavioural performance in the AD group revealed no signif-
473icant relation for name identification (left anterior superior temporal
474gyrus r = −0.23, p = 0.45; right anterior superior temporal gyrus
475r=0.22, p=0.48) but a near-significant trend for segregation process-
476ing (right posterior superior temporal gyrus r=−0.56, p=0.06). Beta
477estimates for the cocktail party contrast were significantly correlated
478with ‘cocktail party’ d-prime (r =−0.66, p = 0.01).
4794 . Discussion
480Here we have shown that the functional neuroanatomy of auditory
481scene analysis is altered in AD compared to healthy older individuals.
482This alteration was localised to inferior parietal cortex, a brain region
483previously implicated as playing a key part both in auditory scene anal-
484ysis in the healthy brain (Dykstra et al., 2011; Kondo and Kashino, 2009;
485Kong et al., 2014; Linden et al., 1999) and in the pathogenesis of AD
486(Seeley et al., 2009; Warren et al., 2012). Our findings build on the
487growing body of evidence for specific and significant impairments of
488central auditory function in AD (Gates et al., 1996, 2008, 2011; Golden
489et al., 2015; Goll et al., 2011, 2012; Golob et al., 2007, 2009; Kurylo
490et al., 1993; Strouse et al., 1995). The findings show that processes of
491auditory scene analysis can delineate functional as well as structural
492neural network alterations in AD based on a relatively naturalistic stimu-
493lus that simulates the kind of listening conditions in which these patients
494commonly report difficulties in daily life. The data further suggest that AD
495may have a specific computational signature arising from an interaction
496of cognitive operations that mediate the ‘cocktail party effect’.
497The activation profiles of name identification were similar in both
498the healthy control andAD groups and in accordwith previous evidence
499showing that processing of intelligible speech signals engages distribut-
500ed superior temporal cortical areas extending beyond auditory cortex
501(Davis et al., 2011; Meyer et al., 2005; Obleser et al., 2008; Scott et al.,
5022000). Inclusion of conditions in which namewas presented over back-
503ground babble aligns the present work with previous studies of masked
504speech processing, which has been shown to engage bihemispheric
505mechanisms that analyse dynamic spectrotemporal as well as lexical
506properties of this complex acoustic signal (Scott and McGettigan,
5072013). Both patients and healthy individuals were able reliably to dis-
508criminate their own names from spectrally rotated versions in post-
509scan behavioural testing, suggesting that the activation produced by
510this contrast here indexed name identification per se aswell asmore ge-
511neric spectrotemporal template matching and object analysis processes
6 H.L. Golden et al. / NeuroImage: Clinical xxx (2015) xxx–xxx
Please cite this article as: Golden, H.L., et al., Functional neuroanatomy of auditory scene analysis in Alzheimer3s disease, NeuroImage: Clinical
(2015), http://dx.doi.org/10.1016/j.nicl.2015.02.019

UNCO
RRECTED P
RO
OF
512 (Billig et al., 2013; Davis et al., 2011; Griffiths and Warren, 2002). It
513 should be noted that the name identification contrast here spanned a
514 change in the spectrotemporal composition of the acoustic background
515 (natural versus spectrally rotated babble) as well as the foreground
516 name sounds: while the use of a spectrally rotated background was
517 intended to reduce spectral ‘pop-out’ of rotated name sounds, future
518 work might dissect the effects of spectral rotation per se from and
519 template-matching processes using alternative speechdegradation pro-
520 cedures and different auditory target objects.
521 Auditory object segregation processing was associated with activa-
522 tion of more posterior superior temporal and inferior parietal cortex
523 in both the healthy control and AD groups: again, this broadly corrobo-
524 rates previouswork in the healthy brain (Dykstra et al., 2011; Gutschalk
525 et al., 2007; Hill andMiller, 2010; Kondo and Kashino, 2009; Kong et al.,
526 2014; Linden et al., 1999; Overath et al., 2010;Wilson et al., 2007;Wong
527 et al., 2009). While the direction of this effect here might seem some-
528 what counter-intuitive (on the basis that segregation of superimposed
529 sounds should require ‘more’ computational processing than resolved
530 interleaved sounds: Deike et al., 2004, 2010; Gutschalk et al., 2007;
531 Nakai et al., 2005; Wilson et al., 2007), it is consistent with certain pre-
532 vious observations (Hwang et al., 2006; Mustovic et al., 2003; Scott and
533 McGettigan, 2013; Voisin et al., 2006). Speech in noise has been associ-
534 atedwith reduced activation of posterior superior temporal cortex com-
535 paredwith clear speech (Hwang et al., 2006): this might reflect reduced
536 intelligibility of the superimposed speech conditions (Scott and
537 McGettigan, 2013) or (more plausibly, in the present case) enhanced
538 engagement of the putative cortical templatematching algorithmby in-
539 termittent ‘glimpses’ of the salient name sounds (Griffiths and Warren,
540 2002). Such ‘glimpses’ may have facilitated neural template matching
541 by establishing expectancies over the course of a trial, a process that
542 would be more efficient if name sounds are presented clearly (inter-
543 leaved) rather than superimposed on background noise. Posterior tem-
544 poral and temporo-parietal cortex may be particularly sensitive to
545 expectancies of this kind in sound scenes (Mustovic et al., 2003;
546 Voisin et al., 2006). Although this study was not designed to assess
547 lateralised cerebral processing mechanisms explicitly and apparent
548 laterality effects should therefore be interpreted with caution, it is of in-
549 terest that auditory segregation processing produced peak activation in
550 the right hemisphere in both the healthy control and AD groups here.
551 The correlation with behavioural performance in our AD group further
552 suggested that activity in this region may be required for successful au-
553 ditory object segregation. Taken together, these findings are consistent
554 with previous evidence that right (non-dominant) temporo-parietal
555 cortex may play a critical role in auditory spatial analysis (Arnott et al.,
556 2004; Krumbholz et al., 2005; Zimmer et al., 2003). This role may be
557 modulated by stimulus characteristics, such as the use of spectrally ro-
558 tated speech here (Scott et al., 2004).
559 Arguably more surprising was the lack of significant neuroanatomi-
560 cal differences between the present AD and healthy control groups for
561 the main effect of auditory segregation processing, particularly given
562 that (as anticipated) the AD group showed clearly reduced ability to
563 discriminate superimposed from interleaved sound conditions in the
564 post-scan behavioural test. This may at least in part reflect power to de-
565 tect effects: functional neuroanatomical differences might emerge with
566 larger patient cohorts. However, stimulus and task factors may also be
567 relevant. In this initial study, we set out to use a paradigm simulating
568 relatively realistic, everyday listening conditions that expose difficulties
569 in patients with AD relative to healthy older people. The use of a babble
570 background is likely to have entailed elements of both energetic and
571 informational masking of superimposed speech sounds (Scott and
572 McGettigan, 2013): it may be that cortical computations associated
573 with disambiguating particular maskers are differentially vulnerable in
574 AD (and of course, in a ‘real’ cocktail party scenario the relative propor-
575 tion of energetic and informational masking effects is likely to vary un-
576 predictably). Furthermore, it is known that masker level has complex
577 effects on brain activation profiles during auditory scene analysis,
578particularly in the ageing brain (Scott and McGettigan, 2013; Wong
579et al., 2009): use of more demanding, reduced signal to noise ratios
580might amplify any functional neuroanatomical alterations associated
581with AD. Moreover, as our interest here was in perceptual processing
582mechanisms that eschew task strategy or difficulty effects, our para-
583digm did not employ an output task: an active segregation task require-
584ment (as in the post-scan behavioural test here) might well reveal an
585AD-associated functional anatomical signature.
586The interaction of template matching and object segregation in infe-
587rior parietal cortex during auditory scene analysis — the cocktail party
588effect — emerged as the key processing signature differentiating AD
589from the healthy older brain in this study. This is in line with evidence
590from previous work that this core computation is particularly vulnera-
591ble to cortical network dysfunction in AD (Goll et al., 2012; Warren
592et al., 2012). The anatomical locus of the effect in supramarginal gyrus
593further corroborates previous work implicating this area both in audito-
594ry scene analysis in the healthy brain and in the network pathophysiol-
595ogy of AD. In the healthy auditory brain, supramarginal gyrus has been
596linked to auditory target detection, spatial attention and streaming
597(Dykstra et al., 2011; Kondo and Kashino, 2009; Kong et al., 2014;
598Linden et al., 1999; Nakai et al., 2005; Scott andMcGettigan, 2013), sug-
599gesting this region is involved in preparation of orienting and other be-
600havioural responses to the auditory environment (Hickok and Poeppel,
6012007;Warren et al., 2005). In AD, dysfunction of temporo-parietal junc-
602tion is well documented as a hub of the critical, so-called ‘default mode
603network’ (Buckner et al., 2008; Greicius andMenon, 2004; Raichle et al.,
6042001; Seeley et al., 2009; Warren et al., 2012). Deconstruction of the
605complex ‘cocktail party’ interaction here (Fig. 2) revealed that this effect
606in supramarginal gyrus arose from increased differential activation in
607the AD group for processing spectrally rotated name versus own natural
608name sounds superimposed on the acoustic background: activationwas
609enhanced in the AD group compared with healthy controls. Together
610these profiles suggest that ADmay lead to abnormally enhanced activa-
611tion (or failed deactivation) of inferior parietal cortex during analysis of
612the incoming sound stream. Dynamic activity shifts in inferior parietal
613components of the default mode network may normally act to maxi-
614mise processing efficiency; such shifts might maintain sensitivity to ab-
615errant sensory stimuli that are more difficult to match against stored
616templates (Chiang et al., 2013; Newman and Twieg, 2001), whereas
617this sensitivity may be blunted in AD. Modulation of inferior parietal
618cortex activity could facilitate overall network responsivity to salient
619auditory and other environmental events, consistent with the proposed
620‘sentinel’ function of the default mode network in the healthy brain and
621its blighting in AD (Buckner et al., 2008; Gilbert et al., 2007).
622The present paradigm employed a highly salient, self-referential
623stimulus (own name): the default mode network including inferior pa-
624rietal cortex is likely to play a fundamental role in integrating inward
625representations of self with the world at large, and this process may
626be disrupted in AD (Molnar-Szakacs and Uddin, 2013). Hearing one3s
627own name may therefore constitute a particularly potent probe of the
628defaultmodenetwork and evolving network dysfunction during the de-
629velopment of AD. The key disease interaction here is unlikely to be sim-
630ply a manifestation of the regional brain atrophy that accompanies AD.
631With the caveat that structural and functional neuroimagingmodalities
632are generally difficult to compare directly, the location of the functional
633alteration in supramarginal gyrus lays beyond the zone of significant
634grey matter atrophy identified in a leniently-thresholded VBM analysis
635on the same participant groups (see Fig. S2). It is well established that
636regional brain dysfunction in AD occurs early in the disease course
637and may lead to structural brain damage (Herholz et al., 2002; Scahill
638et al., 2002): while it is of course unlikely that inferior parietal cortex
639in the AD group here was structurally entirely normal, the function-
640al and structural profiles together imply that volume loss alone did
641not entirely account for the AD-associated functional alteration ob-
642served. The direction and selectivity of the functional effect here
643also speak to this issue: patients with AD showed abnormally
7H.L. Golden et al. / NeuroImage: Clinical xxx (2015) xxx–xxx
Please cite this article as: Golden, H.L., et al., Functional neuroanatomy of auditory scene analysis in Alzheimer3s disease, NeuroImage: Clinical
(2015), http://dx.doi.org/10.1016/j.nicl.2015.02.019

UNCO
RRECTED P
RO
OF
644 enhanced regional cortical activation under particular auditory con-
645 ditions relative to healthy individuals, rather than simply uniformly
646 attenuated activation as one might anticipate were this wholly de-
647 pendent on regional grey matter volume. Detection of such aberrant
648 activity increases is an important motivation for employing func-
649 tional alongside structural neuroimaging techniques in the charac-
650 terisation of AD and other neurodegenerative diseases (Warren
651 et al., 2012).
652 The correlation of inferior parietal activity with a behavioural mea-
653 sure of successful cocktail party processing in our AD patients suggests
654 that enhanced activation of this region may help maintain some com-
655 pensatory function in AD, albeit at the expense of processing inefficien-
656 cy. However, the present paradigm does not resolve the nature of any
657 relation between activation profiles and behavioural output, since this
658 can only be directly assessed using in-scanner behavioural tasks. The
659 disambiguation of compensatory from aberrantly increased cerebral
660 activity is a key issue in the interpretation of functional neuroimag-
661 ing changes in neurodegenerative disease (Elman et al., 2014) and a
662 clear priority for future work. Our focus here was to assess AD ef-
663 fects on computational brain mechanisms that might be regarded
664 as obligatory, prior to any modulatory effect from task demands.
665 Ultimately, however, direct assessment of task effects on brain acti-
666 vation profiles will be required both to delineate the network path-
667 ophysiology of AD and to evaluate the potential of fMRI as a disease
668 biomarker.
669 This study has several limitations that suggest directions for further
670 work. Case numbers here were relatively small; in future, it will be im-
671 portant to study larger patient cohorts representing a broader pheno-
672 typic spectrum of AD. This is particularly relevant to the delineation of
673 functional profiles that may distinguish typical amnestic AD from
674 major variant syndromes, notably posterior cortical atrophy which is
675 associated with disproportionately prominent impairment of spatial
676 analysis (Warren et al., 2012); and separate AD fromother neurodegen-
677 erative diseases. Related to this, the AD group here was relatively
678 young: while this will have tended to minimise confounding effects
679 from vascular and other comorbidities, therefore yielding a purer
680 index of functional alterations associated with AD pathology, future
681 work should extend recruitment to include older individuals who rep-
682 resent the major burden of AD in the wider community. Indeed, the
683 brain mechanisms that support auditory scene analysis even in the
684 healthy ageing brain need to be more completely defined. The present
685 auditory paradigm raises unresolved issues that should be investigated
686 inmore detail: these includeperceptual difficulty effects on the process-
687 ing of sound conditions within healthy control and patient cohorts; tar-
688 get, masking stimulus, and signal-to-noise effects; and the impact of
689 explicit task requirements. The clinical relevance of functional alter-
690 ations will ultimately only be established by studying patients at differ-
691 ent disease stages and by correlating brain signatures with daily life
692 symptoms, for which more serviceable indices of impaired auditory
693 scene analysis are ideally also required. From a neuroanatomical per-
694 spective, in this study we have adopted a directed, region-of-interest
695 approach to assess the neural substrates of auditory scene analysis,
696 informed by the study of the healthy younger brain. Larger cohorts
697 would provide greater power to delineate neuroanatomical correlates
698 beyond these canonical regions, both in the healthy ageing brain and
699 in AD; this may in turn require multi-centre studies to assess the
700 generalisability of findings. In addition, regional functional alterations
701 occur within distributed brain networks and will only be fully defined
702 using connectivity-based techniques, an issue of special pertinence to
703 neurodegenerative diseases underpinned by large-scale neural network
704 disintegration (Seeley et al., 2009; Warren et al., 2012). Acknowledging
705 these various limitations, the present study suggests that auditory scene
706 analysis may constitute a novel and useful paradigm for identifying
707 novel computational signatures of AD and provides a rationale for fur-
708 ther systematic investigation with coordinated behavioural and neuro-
709 anatomical approaches.
710Uncited references
711The following references were note cited: Gutschalk and Dykstra
712(2014).
713Acknowledgments
714We are grateful to all patients and healthy participants for their in-
715volvement. We thank the radiographers of the Wellcome Trust Centre
716for Neuroimaging for assistance with scan acquisition, Stephen Nevard
717for assistance with sound recordings, Dr Stuart Rosen for assistance
718with stimuli preparation, Dr. Nikolas Weiskopf for assistance with
719scanning protocols, and Dr. Gill Livingston and Dr. Alberto Cifelli for re-
720ferring researchpatients. TheDementia ResearchCentre is supported by
721Alzheimer3s Research UK, the Brain Research Trust and the Wolfson
722Foundation. This workwas funded by theWellcome Trust Q5, the UKMed-
723ical Research Council and the NIHR Queen Square Dementia Biomedical
724Research Unit. HLG holds an Alzheimer Research, UK PhD Fellowship.
725SJC is supported by an Alzheimer Research, UK Senior Research Fellow-
726ship and an ESRC/NIHR (grant no ES/K006711/1). JDWholds aWellcome
727Trust Senior Clinical fellowship (grant No 091673/Z/10/Z).
728Appendix A. Supplementary data
729Supplementary data to this article can be found online at http://dx.
730doi.org/10.1016/j.nicl.2015.02.019.
731References
732Arnott, S.R., Binns, M.A., Grady, C.L., Alain, C., 2004. Assessing the auditory dual-
733pathway model in humans. Neuroimage 22 (1), 401–408. http://dx.doi.org/10.7341016/j.neuroimage.2004.01.01415110033.
735Ashburner, J., 2007. A fast diffeomorphic image registration algorithm. Neuroimage 38736(1), 95–113. http://dx.doi.org/10.1016/j.neuroimage.2007.07.00717761438.
737Billig, A.J., Davis, M.H., Deeks, J.M., Monstrey, J., Carlyon, R.P., 2013. Lexical influences on
738auditory streaming. Curr. Biol. 23 (16), 1585–1589. http://dx.doi.org/10.1016/j.cub.7392013.06.04223891107.
740Binder, J.R., Liebenthal, E., Possing, E.T., Medler, D.A., Ward, B.D., 2004. Neural correlates of741sensory and decision processes in auditory object identification. Nat. Neurosci. 7 (3),
742295–301. http://dx.doi.org/10.1038/nn119814966525.743Blesser, B., 1972. Speech perception under conditions of spectral transformation. I. Pho-
744netic characteristics. J. Speech Hear. Res. 15 (1), 5–41. http://dx.doi.org/10.1044/
745jshr.1501.055012812.746Bregman, A.S., 1994. Auditory Scene Analysis: The Perceptual Organization of Sound. MIT
747Press http://dx.doi.org/10.1121/1.408434.748Buckner, R.L., Andrews-Hanna, J.R., Schacter, D.L., 2008. The brain3s default network:
749anatomy, function, and relevance to disease. Ann. N. Y. Acad. Sci. 1124, 1–38.
750http://dx.doi.org/10.1196/annals.1440.01118400922.751Buckner, R.L., Carroll, D.C., 2007. Self-projection and the brain. Trends Cogn. Sci. 11 (2),
75249–57. http://dx.doi.org/10.1016/j.tics.2006.11.00417188554.753Chan, D., Fourcin, A., Gibbon, D., Granstrom, B., Huckvale, M., Kokkinakis, G., et al., 1995.
754EUROM—a spoken language resource for the EU. Eurospeech395: Proceedings of the7554th European Conference on Speech Communication and and Speech Technology 1,
756867–870.
757Cherry, E.C., 1953. Some experiments on the recognition of speech, with one and with758two ears. J. Acoust. Soc. Am. 25 (5), 975–979. http://dx.doi.org/10.1121/1.1907229.
759Chiang, T.C., Liang, K.C., Chen, J.H., Hsieh, C.H., Huang, Y.A., 2013. Brain deactivation in the760outperformance in bimodal tasks: an fMRI study. PLOS One 8 (10), e77408. http://dx.
761doi.org/10.1371/journal.pone.007740824155952.
762Cohen, Y.E., 2009. Multimodal activity in the parietal cortex. Hear. Res. 258 (1–2),763100–105. http://dx.doi.org/10.1016/j.heares.2009.01.01119450431.
764Conway, A.R., Cowan, N., Bunting, M.F., 2001. The cocktail party phenomenon revisited:765the importance of working memory capacity. Psychon. Bull. Rev. 8 (2), 331–335.
766http://dx.doi.org/10.3758/BF0319616911495122.
767Cusack, R., 2005. The intraparietal sulcus and perceptual organization. J. Cogn. Neurosci.76817 (4), 641–651. http://dx.doi.org/10.1162/089892905346754115829084.
769Davis, M.H., Ford, M.A., Kherif, F., Johnsrude, I.S., 2011. Does semantic context benefit770speech understanding through “top-down” processes? Evidence from time-
771resolved sparse fMRI. J. Cogn. Neurosci. 23 (12), 3914–3932. http://dx.doi.org/10.7721162/jocn_a_0008421745006.
773Deike, S., Gaschler-Markefski, B., Brechmann, A., Scheich, H., 2004. Auditory stream
774segregation relying on timbre involves left auditory cortex. Neuroreport 15 (9),7751511–1514. http://dx.doi.org/10.1097/01.wnr.0000132919.12990.3415194885.
776Deike, S., Scheich, H., Brechmann, A., 2010. Active stream segregation specifically involves777the left human auditory cortex. Hear. Res. 265 (1–2), 30–37. http://dx.doi.org/10.
7781016/j.heares.2010.03.00520233603.
8 H.L. Golden et al. / NeuroImage: Clinical xxx (2015) xxx–xxx
Please cite this article as: Golden, H.L., et al., Functional neuroanatomy of auditory scene analysis in Alzheimer3s disease, NeuroImage: Clinical
(2015), http://dx.doi.org/10.1016/j.nicl.2015.02.019

UNCO
RRECTED P
RO
OF
779 Delis, D.C., Kaplan, E., Kramer, J.H., 2001. Delis-Kaplan Executive Function System. The
780 Psychological Corporation, San Antonio, TX.781 Downar, J., Crawley, A.P., Mikulis, D.J., Davis, K.D., 2000. A multimodal cortical network for
782 the detection of changes in the sensory environment. Nat. Neurosci. 3 (3), 277–283.783 http://dx.doi.org/10.1038/7299110700261.
784 Dubois, B., Feldman, H.H., Jacova, C., Dekosky, S.T., Barberger-Gateau, P., Cummings, J., et785 al., 2007. Research criteria for the diagnosis of Alzheimer3s disease: revising the
786 NINCDS–ADRDA criteria. The Lancet Neurology 6 (8), 734–746. http://dx.doi.org/10.
787 1016/S1474-4422(07)70178-3.788 Dunn, L.M., Dunn, P.Q., Whetton, C., 1982. British Picture Vocabulary Scale. NFER-Nelson,
789 Windsor.790 Dykstra, A.R., Halgren, E., Thesen, T., Carlson, C.E., Doyle, W., Madsen, J.R., Eskandar, E.N.,
791 Cash, S.S., 2011. Widespread brain areas engaged during a classical auditory streaming
792 task revealed by intracranial EEG. Front. Hum. Neurosci. 5, 74. http://dx.doi.org/10.793 3389/fnhum.2011.0007421886615.
794 Elman, J.A., Oh, H., Madison, C.M., Baker, S.L., Vogel, J.W., Marks, S.M., Crowley, S., O3Neil,795 J.P., Jagust, W.J., 2014. Neural compensation in older people with brain amyloid-β
796 deposition. Nat. Neurosci. 17 (10), 1316–1318. http://dx.doi.org/10.1038/nn.
797 380625217827.798 Gates, G.A., Anderson, M.L., Feeney, M.P., McCurry, S.M., Larson, E.B., 2008. Central audito-
799 ry dysfunction in older persons with memory impairment or Alzheimer dementia.800 Arch. Otolaryngol. Head Neck Surg. 134 (7), 771–777. http://dx.doi.org/10.1001/
801 archotol.134.7.771.802 Gates, G.A., Anderson, M.L., McCurry, S.M., Feeney, M.P., Larson, E.B., 2011. Central
803 auditory dysfunction as a harbinger of Alzheimer dementia. Arch. Otolaryngol.
804 Head Neck Surg. 137 (4), 390–395. http://dx.doi.org/10.1001/archoto.2011.805 2821502479.
806 Gates, G.A., Cobb, J.L., Linn, R.T., Rees, T., Wolf, P.A., D3Agostino, R.B., 1996. Central807 auditory dysfunction, cognitive dysfunction, and dementia in older people. Arch.
808 Otolaryngol. Head Neck Surg. 122 (2), 161–167. http://dx.doi.org/10.1001/archotol.
809 1996.018901400470108630210.810 Gilbert, S.J., Dumontheil, I., Simons, J.S., Frith, C.D., Burgess, P.W., 2007. Comment on
811 “Wanderingminds: the default network and stimulus-independent thought”. Science812 317 (5834), 43. http://dx.doi.org/10.1126/science.114080117615325.
813 Golden, H.L., Nicholas, J.M., Yong, K.X., Downey, L.E., Schott, J.M., Mummery, C.J., et al.,814 2015. Auditory spatial processing in Alzheimer3s disease. Brain 138 (1), 189–202.
815 http://dx.doi.org/10.1093/brain/awu33725468732.
816 Goll, J.C., Kim, L.G., Hailstone, J.C., Lehmann, M., Buckley, A., Crutch, S.J., Warren, J.D., 2011.817 Auditory object cognition in dementia. Neuropsychologia 49 (9), 2755–2765. http://
818 dx.doi.org/10.1016/j.neuropsychologia.2011.06.00421689671.819 Goll, J.C., Kim, L.G., Ridgway, G.R., Hailstone, J.C., Lehmann, M., Buckley, A.H., et al., 2012.
820 Impairments of auditory scene analysis in Alzheimer3s disease. Brain 135 (1),
821 190–200. http://dx.doi.org/10.1093/brain/awr26022036957.822 Golob, E.J., Irimajiri, R., Starr, A., 2007. Auditory cortical activity in amnestic mild cognitive
823 impairment: relationship to subtype and conversion to dementia. Brain 130 (3),824 740–752. http://dx.doi.org/10.1093/brain/awl37517293359.
825 Golob, E.J., Ringman, J.M., Irimajiri, R., Bright, S., Schaffer, B., Medina, L.D., Starr, A., 2009.826 Cortical event-related potentials in preclinical familial Alzheimer disease. Neurology
827 73 (20), 1649–1655. http://dx.doi.org/10.1212/WNL.0b013e3181c1de7719917987.
828 Greicius, M.D., Menon, V., 2004. Default-mode activity during a passive sensory task:829 uncoupled from deactivation but impacting activation. J. Cogn. Neurosci. 16 (9),
830 1484–1492. http://dx.doi.org/10.1162/089892904256853215601513.831 Griffiths, T.D., Warren, J.D., 2002. The planum temporale as a computational hub.
832 Trends Neurosci. 25 (7), 348–353. http://dx.doi.org/10.1016/S0166-2236(02)02191-
833 412079762.834Q10 Gutschalk, A., Dykstra, A.R., 2014. Functional imaging of auditory scene analysis. Hear. Res.
835 307, 98–110. http://dx.doi.org/10.1016/j.heares.2013.08.00323968821.836 Gutschalk, A., Oxenham, A.J., Micheyl, C., Wilson, E.C., Melcher, J.R., 2007. Human cortical
837 activity during streaming without spectral cues suggests a general neural substrate
838 for auditory stream segregation. J. Neurosci. 27 (48), 13074–13081. http://dx.doi.839 org/10.1523/jneurosci.2299-07.200718045901.
840 Hall, D.A., Haggard, M.P., Akeroyd, M.A., Palmer, A.R., Summerfield, A.Q., Elliott, M.R., et al.,841 1999. “Sparse” temporal sampling in auditory fMRI. Hum. Brain Mapp. 7 (3),
842 213–223. http://dx.doi.org/10.1002/(SICI)1097-0193(1999)7:3b213::AID-HBM5N3.843 0.CO;2-N10194620.
844 Herholz, K., Salmon, E., Perani, D., Baron, J.C., Holthoff, V., Frölich, L., et al., 2002. Discrim-
845 ination between Alzheimer dementia and controls by automated analysis of multi-846 center FDG PET. Neuroimage 17 (1), 302–316. http://dx.doi.org/10.1006/nimg.2002.
847 120812482085.848 Hickok, G., Poeppel, D., 2007. The cortical organization of speech processing. Nat. Rev.
849 Neurosci. 8 (5), 393–402. http://dx.doi.org/10.1038/nrn211317431404.
850 Hill, K.T., Miller, L.M., 2010. Auditory attentional control and selection during cocktail851 party listening. Cereb. Cortex 20 (3), 583–590. http://dx.doi.org/10.1093/cercor/
852 bhp12419574393.853 Hutton, C., Bork, A., Josephs, O., Deichmann, R., Ashburner, J., Turner, R., 2002. Image dis-
854 tortion correction in fMRI: a quantitative evaluation. Neuroimage 16 (1), 217–240.855 http://dx.doi.org/10.1006/nimg.2001.105411969330.
856 Hwang, J.-H., Wu, C.-W., Chen, J.-H., Liu, T.-C., 2006. The effects of masking on the activation
857 of auditory-associated cortex during speech listening in white noise. Acta Otolaryngol.858 126 (9), 916–920. http://dx.doi.org/10.1080/0001648050054637516864487.
859 International Telecommunication Union, 1986. Report BS.1058-0: Minimum AF and RF860 signal-to-noise ratio required for broadcasting in band 7 (HF). Retrieved from
861 http://www.itu.int/pub/R-REP-BS.1058, last accessed 16/01/2015.
862 Jackson, M., Warrington, E.K., 1986. Arithmetic skills in patients with unilateral cerebral863 lesions. Cortex 22 (4), 611–620. http://dx.doi.org/10.1016/S0010-9452(86)80020-
864 X3816245.
865Kondo, H.M., Kashino, M., 2009. Involvement of the thalamocortical loop in the spontane-
866ous switching of percepts in auditory streaming. J. Neurosci. 29 (40), 12695–12701.867http://dx.doi.org/10.1523/JNEUROSCI.1549-09.200919812344.
868Kong, L., Michalka, S.W., Rosen, M.L., Sheremata, S.L., Swisher, J.D., Shinn-Cunningham,869B.G., Somers, D.C., 2014. Auditory spatial attention representations in the human ce-
870rebral cortex. Cereb. Cortex 24 (3), 773–784. http://dx.doi.org/10.1093/cercor/871bhs35923180753.
872Krumbholz, K., Schönwiesner, M., von Cramon, D.Y., Rübsamen, R., Shah, N.J., Zilles, K., et
873al., 2005. Representation of interaural temporal information from left and right audi-874tory space in the human planum temporale and inferior parietal lobe. Cereb. Cortex
87515 (3), 317–324. http://dx.doi.org/10.1093/cercor/bhh13315297367.876Kumar, S., Stephan, K.E., Warren, J.D., Friston, K.J., Griffiths, T.D., 2007. Hierarchical pro-
877cessing of auditory objects in humans. PLoS Comput. Biol. 3, e100. http://dx.doi.org/
87810.1371/journal.pcbi.003010017542641.879Kurylo, D.D., Corkin, S., Allard, T., Zatorre, R.J., Growdon, J.H., 1993. Auditory function
880in Alzheimer3s disease. Neurology 43 (10), 1893–1899. http://dx.doi.org/10.1212/881WNL.43.10.18938413944.
882Lee, A.K., Larson, E., Maddox, R.K., Shinn-Cunningham, B.G., 2014. Using neuroimaging to
883understand the cortical mechanisms of auditory selective attention. Hear. Res. 307,884111–120. http://dx.doi.org/10.1016/j.heares.2013.06.01023850664.
885Linden, D.E., Prvulovic, D., Formisano, E., Völlinger, M., Zanella, F.E., Goebel, R., Dierks, T.,8861999. The functional neuroanatomy of target detection: an fMRI study of visual and
887auditory oddball tasks. Cereb. Cortex 9 (8), 815–823. http://dx.doi.org/10.1093/888cercor/9.8.81510601000.
889McKenna, P., Warrington, E., 1983. Graded Naming Test. NFER-Nelson, Windsor.
890Meyer, M., Zysset, S., von Cramon, D.Y., Alter, K., 2005. Distinct fMRI responses to laughter,891speech, and sounds along the human peri-sylvian cortex. Brain Res Cogn Brain Res 24
892(2), 291–306. http://dx.doi.org/10.1016/j.cogbrainres.2005.02.00815993767.893Molnar-Szakacs, I., Uddin, L.Q., 2013. Self-processing and the default mode network: in-
894teractions with the mirror neuron system. Front. Hum. Neurosci. 7, 571. http://dx.
895doi.org/10.3389/fnhum.2013.0057124062671.896Moray, N., 1959. Attention in dichotic listening: affective cues and the influence of instruc-
897tions. Q. J. Exp. Psychol. 11 (1), 56–60. http://dx.doi.org/10.1080/17470215908416289.898Mustovic, H., Scheffler, K., Di Salle, F., Esposito, F., Neuhoff, J.G., Hennig, J., Seifritz, E., 2003.
899Temporal integration of sequential auditory events: silent period in sound pattern ac-900tivates human planum temporale. Neuroimage 20 (1), 429–434. http://dx.doi.org/10.
9011016/S1053-8119(03)00293-314527603.
902Nakai, T., Kato, C., Matsuo, K., 2005. An fMRI study to investigate auditory attention: a903model of the cocktail party phenomenon. Magn Reson Med Sci 4 (2), 75–82. http://
904dx.doi.org/10.2463/mrms.4.7516340161.905Nelson, H.E., 1982. National Adult Reading Test. NFER-Nelson, Windsor.
906Newman, S.D., Twieg, D., 2001. Differences in auditory processing of words and
907pseudowords: an fMRI Study. Hum. Brain Mapp. 14 (1), 39–47. http://dx.doi.org/90810.1002/hbm11500989.
909Obleser, J., Eisner, F., Kotz, S.A., 2008. Bilateral speech comprehension reflects differential910sensitivity to spectral and temporal features. J. Neurosci. 28 (32), 8116–8123. http://
911dx.doi.org/10.1523/JNEUROSCI.1290-08.200818685036.912Obleser, J., Wise, R.J., Dresner, M.A., Scott, S.K., 2007. Functional integration across
913brain regions improves speech perception under adverse listening conditions.
914J. Neurosci. 27 (9), 2283–2289. http://dx.doi.org/10.1523/JNEUROSCI.4663-06.915200717329425.
916Overath, T., Kumar, S., Stewart, L., von Kriegstein, K., Cusack, R., Rees, A., Griffiths, T.D.,9172010. Cortical mechanisms for the segregation and representation of acoustic tex-
918tures. J. Neurosci. 30 (6), 2070–2076. http://dx.doi.org/10.1523/JNEUROSCI.5378-09.
9192010.Cortical20147535.920Raichle, M.E., MacLeod, A.M., Snyder, A.Z., Powers, W.J., Gusnard, D.A., Shulman, G.L.,
9212001. A default mode of brain function. Proc. Natl. Acad. Sci. U. S. A. 98 (2),922676–682. http://dx.doi.org/10.1073/pnas.98.2.67611209064.
923Rosen, S., Souza, P., Ekelund, C., Majeed, A.A., 2013. Listening to speech in a background of
924other talkers: effects of talker number and noise vocoding. J. Acoust. Soc. Am. 133 (4),9252431–2443. http://dx.doi.org/10.1121/1.479437923556608.
926Salvi, R.J., Lockwood, A.H., Frisina, R.D., Coad, M.L., Wack, D.S., Frisina, D.R., 2002. PET im-927aging of the normal human auditory system: responses to speech in quiet and in
928background noise. Hear. Res. 170 (1–2), 96–106. http://dx.doi.org/10.1016/S0378-9295955(02)00386-612208544.
930Scahill, R.I., Schott, J.M., Stevens, J.M., Rossor, M.N., Fox, N.C., 2002. Mapping the evolution
931of regional atrophy in Alzheimer3s disease: unbiased analysis of fluid-registered serial932MRI. Proc. Natl. Acad. Sci. U. S. A. 99 (7), 4703–4707. http://dx.doi.org/10.1073/pnas.
93305258739911930016.934Schönwiesner, M., Novitski, N., Pakarinen, S., Carlson, S., Tervaniemi, M., Näätänen, R., 2007.
935Heschl3s gyrus, posterior superior temporal gyrus, and mid-ventrolateral prefrontal cor-
936tex have different roles in the detection of acoustic changes. J. Neurophysiol. 97 (3),9372075–2082. http://dx.doi.org/10.1152/jn.01083.200617182905.
938Scott, S.K., Blank, C.C., Rosen, S., Wise, R.J., 2000. Identification of a pathway for intelligible939speech in the left temporal lobe. Brain 123 (12), 2400–2406. http://dx.doi.org/10.
9401093/brain/123.12.240011099443.941Scott, S.K., McGettigan, C., 2013. The neural processing of masked speech. Hear. Res. 303,
94258–66. http://dx.doi.org/10.1016/j.heares.2013.05.00123685149.
943Scott, S.K., Rosen, S., Beaman, C.P., Davis, J.P., Wise, R.J., 2009. The neural processing944of masked speech: evidence for different mechanisms in the left and right tem-
945poral lobes. J. Acoust. Soc. Am. 125 (3), 1737–1743. http://dx.doi.org/10.1121/9461.305025519275330.
947Scott, S.K., Rosen, S., Wickham, L., Wise, R.J., 2004. A positron emission tomography
948study of the neural basis of informational and energetic masking effects in949speech perception. J. Acoust. Soc. Am. 115 (2), 813–821. http://dx.doi.org/10.
9501121/1.163933615000192.
9H.L. Golden et al. / NeuroImage: Clinical xxx (2015) xxx–xxx
Please cite this article as: Golden, H.L., et al., Functional neuroanatomy of auditory scene analysis in Alzheimer3s disease, NeuroImage: Clinical
(2015), http://dx.doi.org/10.1016/j.nicl.2015.02.019

UNCO
RRECTED P
RO
OF
951 Seeley, W.W., Crawford, R.K., Zhou, J., Miller, B.L., Greicius, M.D., 2009. Neurodegenerative
952 diseases target large-scale human brain networks. Neuron 62 (1), 42–52. http://dx.953 doi.org/10.1016/j.neuron.2009.03.02419376066.
954 Shulman, G.L., Fiez, J.A., Corbetta, M., Buckner, R.L., Miezin, F.M., Raichle, M.E., Petersen,955 S.E., 1997. Common blood flow changes across visual tasks: II. Decreases in cerebral
956 cortex. J. Cogn. Neurosci. 9 (5), 648–663. http://dx.doi.org/10.1162/jocn.1997.9.5.957 64823965122.
958 Spreng, R.N., Grady, C.L., 2010. Patterns of brain activity supporting autobiographical
959 memory, prospection, and theory of mind, and their relationship to the default960 mode network. J. Cogn. Neurosci. 22 (6), 1112–1123. http://dx.doi.org/10.1162/
961 jocn.2009.2128219580387.962 Stopford, C.L., Thompson, J.C., Neary, D., Richardson, A.M., Snowden, J.S., 2012. Work-
963 ing memory, attention, and executive function in Alzheimer3s disease and
964 frontotemporal dementia. Cortex 48 (4), 429–446. http://dx.doi.org/10.1016/j.965 cortex.2010.12.00221237452.
966 Strouse, A.L., Hall, J.W., Burger, M.C., 1995. Central auditory processing in Alzheimer3s dis-967 ease. Ear Hear. 16 (2), 230–238. http://dx.doi.org/10.1097/00003446-199504000-
968 000107789674.
969 Voisin, J., Bidet-Caulet, A., Bertrand, O., Fonlupt, P., 2006. Listening in silence activates au-970 ditory areas: a functional magnetic resonance imaging study. J. Neurosci. 26 (1),
971 273–278. http://dx.doi.org/10.1523/JNEUROSCI.2967-05.200616399697.972 Warren, J.D., Fletcher, P.D., Golden, H.L., 2012. The paradox of syndromic diversity in
973 Alzheimer disease. Nat. Rev. Neurol. 8 (8), 451–464. http://dx.doi.org/10.1038/974 nrneurol.2012.13522801974.
975 Warren, J.E., Wise, R.J., Warren, J.D., 2005. Sounds do-able: auditory-motor transforma-
976 tions and the posterior temporal plane. Trends Neurosci. 28 (12), 636–643. http://977 dx.doi.org/10.1016/j.tins.2005.09.01016216346.
978 Warrington, E.K., 1984. Recognition Memory Test. NFER-Nelson, Windsor.979 Warrington, E.K., James, M., 1991. The Visual Object and Space Perception Battery.
980 Thames Valley Test Company, Bury St Edmunds.
981 Wechsler, D., 1987. Wechsler Memory Scale: Revised. The Psychological Corporation, San982 Antonio, TX.
983Wechsler, D., 1999. Wechsler Abbreviated Scale of Intelligence: WASI. The Psychological
984Corporation, Harcourt Brace, San Antonio, TX.985Weiskopf, N., Helms, G., 2008. Multi-parameter mapping of the human brain at 1 mm
986resolution in less than 20minutes Proceedings of the 16th Scientific Meeting.987ISMRM, Toronto, Canada.
988Weiskopf, N., Hutton, C., Josephs, O., Deichmann, R., 2006. Optimal Epi parameters for re-989duction of susceptibility-induced BOLD sensitivity losses: a whole-brain analysis at
9903 T and 1.5 T. Neuroimage 33 (2), 493–504. http://dx.doi.org/10.1016/j.neuroimage.
9912006.07.02916959495.992Weiskopf, N., Lutti, A., Helms, G., Novak, M., Ashburner, J., Hutton, C., 2011. Unified segmen-
993tation based correction of R1 brain maps for RF transmit field inhomogeneities994(UNICORT). Neuroimage 54 (3), 2116–2124. http://dx.doi.org/10.1016/j.neuroimage.
9952010.10.02320965260.
996Wilson, E.C., Melcher, J.R., Micheyl, C., Gutschalk, A., Oxenham, A.J., 2007. Cortical fMRI997activation to sequences of tones alternating in frequency: relationship to perceived
998rate and streaming. J. Neurophysiol. 97 (3), 2230–2238. http://dx.doi.org/10.1152/999jn.00788.200617202231.
1000Wong, P.C., Jin, J.X., Gunasekera, G.M., Abel, R., Lee, E.R., Dhar, S., 2009. Aging and cortical
1001mechanisms of speech perception in noise. Neuropsychologia 47 (3), 693–703.1002http://dx.doi.org/10.1016/j.neuropsychologia.2008.11.03219124032.
1003Wood, N., Cowan, N., 1995. The cocktail party phenomenon revisited: how frequent are1004attention shifts to one3s name in an irrelevant auditory channel? J. Exp. Psychol.
1005Learn. Mem. Cogn. 21, 255–260.1006Zimmer, U., Lewald, J., Karnath, H.-O., 2003. Disturbed sound lateralization in patients
1007with spatial neglect. J. Cogn. Neurosci. 15 (5), 694–703. http://dx.doi.org/10.1162/
100808989290332230741012965043.1009Zündorf, I.C., Lewald, J., Karnath, H.O., 2013. Neural correlates of sound localization in
1010complex acoustic environments. PLOS One 8 (5), e64259. http://dx.doi.org/10.1371/1011journal.pone.006425923691185.
1012Zvyagintsev,M., Clemens, B., Chechko, N., Mathiak, K.A., Sack, A.T., Mathiak, K., 2013. Brain
1013networks underlying mental imagery of auditory and visual information. Eur.1014J. Neurosci. 37 (9), 1421–1434. http://dx.doi.org/10.1111/ejn.1214023383863.
1015
10 H.L. Golden et al. / NeuroImage: Clinical xxx (2015) xxx–xxx
Please cite this article as: Golden, H.L., et al., Functional neuroanatomy of auditory scene analysis in Alzheimer3s disease, NeuroImage: Clinical
(2015), http://dx.doi.org/10.1016/j.nicl.2015.02.019