Late-life depression, mild cognitive impairment, and dementia: possible continuum?

FUNCTIONAL AND COGNITIVE CRITERIA PRODUCE DIFFERENTRATES OF MCI AND CONVERSION TO DEMENTIA
Judith Saxton†, Beth E. Snitz†, Oscar L. Lopez†, Diane G. Ives†, Leslie O. Dunn†, AnnetteFitzpatrick††, Michelle C. Carlson†††, Steven T. DeKosky††††, and the GEM StudyInvestigators†University of Pittsburgh, Pittsburgh, PA, USA
††University of Washington, Seattle, WA, USA
†††Johns Hopkins Medical Institutions, Baltimore, MD, USA
††††University of Virginia, Charlottesville, VA, USA
AbstractObjective—To compare rates of Mild Cognitive Impairment (MCI) and rates of progression todementia, using different MCI diagnostic systems
Methods—MCI was investigated at baseline in 3063 community-dwelling non-demented elderlyin the Ginkgo Evaluation of Memory (GEM) study who were evaluated every six months to identifypresence of dementia. Overall MCI frequency was determined using (1) Clinical Dementia Rating(CDR) score of 0.5 and (2) neuropsychological (NP) criteria, defined by impairment on standardcognitive tests.
Results—40.2% of participants met CDR MCI criteria and 28.2% met NP MCI criteria (amnestic-MCI=16.6%). 15.7% were classified as MCI by both criteria and 47.4% as Normal by both.Discordant diagnoses were observed in 24.5% who met NP Normal/CDR MCI; and 12.4% who metNP MCI/CDR Normal. Factors associated with CDR MCI among NP Normal included, lowereducation, lower NP scores, more IADL impairment, greater symptoms of depression and subjectivehealth problems. Individuals meeting NP MCI/CDR normal were significantly more likely to developdementia over the median follow up of 6.1 years than those meeting NP Normal/CDR MCI.
Conclusions—Different criteria produce different MCI rates and different conversion rates todementia. Although a higher percentage of MCI was identified by CDR than NP, a higher percentageof NP MCI progressed to dementia. These findings suggest that the CDR is sensitive to subtle changesin cognition not identified by NP algorithm but is also sensitive to demographic and clinical factorsprobably leading to a greater number of false positives. These results suggest that identifying allindividuals with CDR scores of 0.5 as Alzheimer's disease is not advisable.
KeywordsClinical Dementia Rating Scale; Neuropsychological tests
Correspondence to: Judith Saxton Ph.D. Department of Neurology University of Pittsburgh 3471 Fifth Avenue, Suite 811 PittsburghPA 15213 Phone: 412 692 2885 Fax: 412 692 4031 E-mail: [email protected] Corresponding Author has the right to grant on behalf of all authors and does grant on behalf of all authors, an exclusive licence (ornon exclusive for government employees) on a worldwide basis to the BMJ Publishing Group Ltd and its Licensees to permit this article(if accepted) to be published in the Journal of Neurology, Neurosurgery & Psychiatry editions and any other BMJPGL products to exploitall subsidiary rights, as set out in our licence (http://jnnp.bmjjournals.com/ifora/licence.pdf).
NIH Public AccessAuthor ManuscriptJ Neurol Neurosurg Psychiatry. Author manuscript; available in PMC 2010 July 1.
Published in final edited form as:J Neurol Neurosurg Psychiatry. 2009 July ; 80(7): 737–743. doi:10.1136/jnnp.2008.160705.
NIH
-PA Author Manuscript
NIH
-PA Author Manuscript
NIH
-PA Author Manuscript

INTRODUCTIONMild Cognitive Impairment (MCI) describes a state between normal aging and dementia.[1]The identification of individuals with MCI that leads to Alzheimer's disease (AD) has becomeincreasingly important as new therapies have become available. Current diagnostic criteria forMCI highlight the need for evidence of cognitive decline which has been documented usingeither direct performance-based measures or clinical interview-based measures, or in somecase, both approaches. Petersen's original criteria[1,2] used neuropsychological testperformance, as a direct performance-based measure of cognitive functioning, andoperationalized MCI as a score more than 1.5 standard deviations below that of age-appropriatenorms on a measure of episodic memory with performance within the normal range on non-memory tests. Using a similar approach, the International Working Group on MCI [3] hasrecently adapted Petersen's criteria to take into account differing presenting patterns ofcognitive test performance and allowing the possibility of either memory or nonmemoryimpairment and focal (i.e. single cognitive domain) or multiple impaired domains. Interview-based assessments have also been used to identify MCI. The Clinical Dementia Rating (CDR)is a highly validated clinically-based interview that stages cognitive and functional declineacross the spectrum of AD and a Global CDR score of 0.5 is often used to indicate the presenceof MCI.[4-6]
The goal of this study was to compare two different approaches to the classification of MCIwithin the same cohort in order to (1) investigate the factors associated with baselineclassification using one method over another and (2) compare the rates of progression todementia using the two systems. We hypothesized that a significantly higher percentage ofindividuals would meet CDR criteria for MCI than cognitive criteria. Furthermore, wehypothesized that individuals diagnosed with MCI by CDR criteria would have morecomplaints of everyday memory loss and a greater number of health related disorders comparedto individuals identified as MCI by cognitive criteria. In contrast, individuals meeting cognitivecriteria for MCI would be older and less educated and therefore more likely than those withCDR MCI, to develop dementia over time.
MATERIALS AND METHODSVolunteers aged 75 years or older were recruited from 4 communities in the United States:Hagerstown, Maryland; Pittsburgh, Pennsylvania; Sacramento, California; Winston-Salemand Greensboro, North Carolina. The study was approved by the Institutional Review Boardsof each of the participating sites and was conducted in accordance with the Helsinki Declaration(http://www.wma.net/e/policy/17-c_e/html). A variety of recruitment methods were used.[7]The vast majority of participants were recruited via mass mailings based on voter registrationlists, commercially purchased mailing lists and university lists. Less than 8% of participantsresponded to media advertisements. The recruitment procedures for the GEM Study have beendescribed elsewhere.[8] Persons meeting any of the following criteria were excluded: 1)currently taking the anti-coagulant warfarin (Coumadin); 2) taking cholinesterase inhibitorsfor cognitive problems or dementia; 3) unwilling to discontinue taking over-thecounter G.biloba for the duration of the study; 4) currently treated with tricyclic antidepressants,antipsychotics or other medications with significant psychotropic effects; 5) daily use of >400IU vitamin E; 6) history of bleeding disorders; 7) hospitalization for depression within the lastyear or Electroconvulsive Therapy within last 10 years; 8) history of Parkinson's disease ortaking anti-Parkinson's medications; 9) abnormal thyroid tests, serum creatinine > 2.0 mg/dL,or liver function tests > 2X upper limit of normal at baseline; 10) baseline vitamin B12 levels≥ 210 pg/mL; 11) hematocrit < 30%; 12) platelet count < 100,000 K/cm; 13) disease-relatedlife expectancy < 5 years; 14) known allergy to G. biloba.
Saxton et al. Page 2
J Neurol Neurosurg Psychiatry. Author manuscript; available in PMC 2010 July 1.
NIH
-PA Author Manuscript
NIH
-PA Author Manuscript
NIH
-PA Author Manuscript

All participants were required to identify a proxy willing to be interviewed every 6 months ateach study visit. At baseline and every 6 months participants completed a broad range ofassessment scales/questionnaires that have been described previously [9] including self-reportsof medical history and medications, ratings of health problems, mobility, instrumental activitiesof daily living (IADL) [10], the Telephone Interview for Cognitive Status[11], the ModifiedMini Mental State examination (3MSE)[12], the Alzheimer's Disease Assessment Scale(ADAS-Cog) [13] and the Center for Epidemiological Studies Depression (CES-D) scale[14] and the CDR [4-6], completed by the participant and his/her informant. Persons withprevalent dementia (meeting DSM-IV criteria for dementia [15], a 3MSE score of less than80, or a score the Clinical Dementia Rating scale [5] (CDR) > 0.5 were excluded fromparticipation. The remaining individuals completed the baseline comprehensiveneuropsychological test battery (described below). Those individuals scoring within the rangeof dementia on this battery were also excluded from the study. Cut-off scores for each test weredetermined based on data from cognitively normal subjects taking part in the CardiovascularHealth Study (CHS) [7,9,16,17]. Sixty-four participants who passed the 3MSE and CDRcriteria were subsequently excluded based on their neuropsychological test scores (mean age79.8 years, mean education 13.8 years).
The screening visit also included blood drawn for laboratory screening as well as DNA storagefor subsequent apolipoprotein E (ApoE) genotyping. DNA was extracted with a Puregene Kit(QUIAGEN; Valencia, CA) and ApoE genotyping was performed utilizing the TaqMangenotyping assays (Applied Biosystems; Foster City, CA) by Dr. M. Ilyas Kamboh, Universityof Pittsburgh. Of note, 16 participants refused phlebotomy consent, 425 samples hadinsufficient volume for DNA extraction and 174 did not have sufficient blood drawn for otherreasons, resulting in a subset of 2454 of total baseline participants with ApoE data available.
A total of 3,072 participants were recruited into the GEM study. Three participants weresubsequently excluded because of protocol violations not detected at baseline. An additionalsix subjects were excluded from these analyses: 4 had missing CDR data and two had a CDRscore of 1.0 indicating dementia. The final N was 3,063.
Neuropsychological test battery and NP criteria for MCIThe remaining participants completed the comprehensive neuropsychological battery, whichincluded tests within five cognitive domains (see Table 1) and two tests to estimate premorbidintellectual functioning, the National Adult Reading Test - American Version;[18] and Raven'sColoured Progressive Matrices.[19] Tenth percentile cut-off scores were located on eachneuropsychological test based on normative data from the Cardiovascular Health Study (CHS)[20] for 2 age (< 80 vs. ≥ 80 years) and 3 education (≤ 12; 13-16; > 16 years) subgroups reportedpreviously.[7,9] A tenth percentile cut-off is close to the commonly used cut-off of 1.5 SDbelow the normative mean (corresponding to approximately the 7th percentile on a theoreticallynormal curve). We used this somewhat higher, more sensitive, cut-off because this cohort hadalready been screened for dementia.[9] In addition, many of the cognitive test scores were notnormally distributed and percentile rank cut-offs are therefore more appropriate.[21] Also,tenth percentile cut-offs have been used in other MCI studies.[22-24] The number of subjectswith missing neuropsychological measures in this healthy cohort screened for dementia wasvery low: only 9 participants (0.4 %) were missing 2 - 4 measures for physical reasons (sensoryor motor impairment).
We applied a neuropsychological (NP) algorithm to classify each individual as Normal (NPNormal) or MCI (NP MCI). In order to meet NP criteria for MCI, at least two of the cognitivetests had to fall at or below the 10th percentile of the normative data. A minimum of two outof ten impaired tests was chosen to minimize MCI cases that “revert to normal” on follow-upprimarily because of measurement error, regression to the mean, etc.[9] Using these criteria
Saxton et al. Page 3
J Neurol Neurosurg Psychiatry. Author manuscript; available in PMC 2010 July 1.
NIH
-PA Author Manuscript
NIH
-PA Author Manuscript
NIH
-PA Author Manuscript

individuals with a single score falling below the 10th percentile for age and education wereclassified as normal based on the assumption that this represents normal variability. We alsoidentified individuals with the major clinical subtypes of MCI: amnestic and nonamnestic.Individuals with impaired performance on one or more memory tests were classified as NPamnestic MCI (NP a-MCI). Individuals with both impaired tests in non-memory domains wereidentified as NP nonamnestic MCI (NP na-MCI).
Clinical Dementia Rating Scale and CDR criteria for MCIAll GEMS interviewers completed a standardized training program for administration andscoring for the CDR including use of videotapes.[25] In addition, interviewers participated inannual reliability training including observation of GEMS interviews conducted by a studyauthor (LOD). Based on information obtained from both the subject and informant, CDRratings are given for six domains: memory, orientation, home and hobbies, judgment andproblem solving, community affairs and personal care. Each CDR subscale can be rated on ascale of 0-3 where 0 indicates no impairment and 3 indicates the need for maximal assistance.A global CDR score is calculated using an algorithm that takes into account each subscalescore, with an additional weighting for the memory section. The overall possible range ofGlobal CDR scores is 0 (indicating a normal healthy individual with no cognitive or functionaldeficits), 0.5 (a normal healthy individual but with questionable cognitive and/or functionalabilities indicating MCI), 1 (mild dementia), 2 (moderate dementia) and 3 (severe dementia).Subjects in this study obtained Global CDR scores of either 0 or 0.5. A score of 0.5 is used todenote mild cognitive and functional impairment consistent with MCI (CDR MCI) and a GlobalCDR score of 0 indicates no functional deficits (CDR Normal).
MCI subgroupsUsing the above criteria, four subgroups were identified:
Group 1: participants classified as Normal by both NP and CDR criteria (i.e. congruent:Normal/Normal)
Group 2: participants classified as Normal by NP but MCI by CDR (i.e. incongruent: NPNormal/CDR MCI)
Group 3: participants classified as MCI by NP but Normal by CDR (i.e. incongruent: NP MCI/CDR Normal)
Group 4: participants classified as MCI by both NP and CDR criteria (i.e. congruent: MCI/MCI)
Dementia criteriaThe GEM study began in September 2000 and assessed subjects every six months until April2008. The median follow-up period for 6.1 years and the primary end point was a diagnosis ofdementia by DSM-IV criteria.[15] This was determined by an expert panel of clinicians usingan adjudication process validated on a similar population [16] and described previously [17]that involved a comprehensive review of all available clinical and cognitive assessments overmultiple years. Neuropsychological criteria for dementia end-point were operationalized asfollows:
1. Incident abnormal scores on 5 or more cognitive tests, and at least 1 abnormal scorewas on a memory test.
2. Incident abnormal scores on 4 tests, at least 1 on a memory test, and the participantfailed to complete 1 or more of the other tests.
Saxton et al. Page 4
J Neurol Neurosurg Psychiatry. Author manuscript; available in PMC 2010 July 1.
NIH
-PA Author Manuscript
NIH
-PA Author Manuscript
NIH
-PA Author Manuscript

3. Incident abnormality on 2 or more cognitive domains (impaired scores on both testsof that domain) and 1 domain was memory.
Statistical AnalysesTo determine differences among diagnostic sub-groups on demographic, clinical and cognitivevariables, omnibus ANOVAs were performed for continuous variables and chi-square tests forcategorical variables. Student-Neuman-Keuls procedure for continuous variables and modifiedKeppel Bonferroni adjustment for categorical variables were used to determine post-hoc pair-wise differences among subgroups to control for Type I error. To account for differencesbetween study sites in frequency of MCI groups (see below) we included site as a covariate inthe ANOVAS for continuous variables and performed a series of multinomial logisticregressions (predicting MCI sub-group) including site as a covariate for categorical variables.
RESULTSThe mean age of the overall cohort was 78.5 (SD 3.3) and the mean education level was 14.3(SD 3.0) years. The proportion of women was 46.2% and the proportion of individuals reportingthemselves as white was 95.5% (see DeKosky et al. [7] for full description of the GEMScohort).
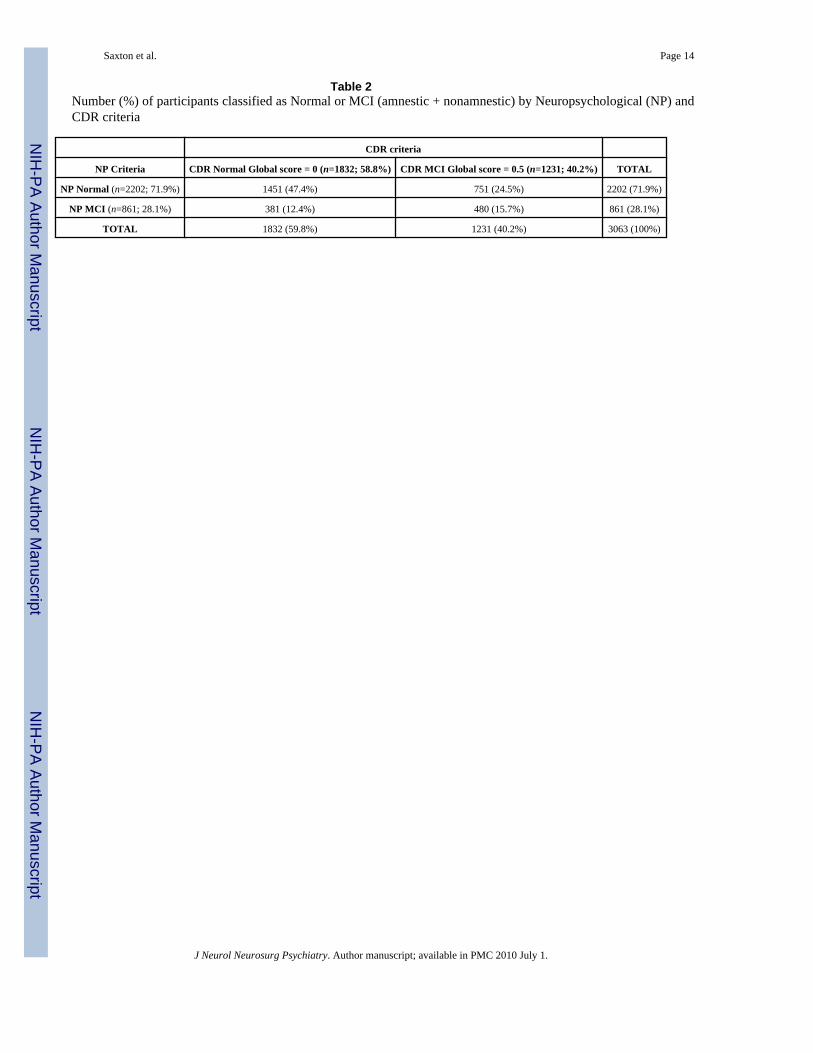
Comparison of overall MCI rates using CDR and NP criteriaTable 2 shows the frequency of MCI for the two different diagnostic methods. The overallfrequency of MCI using CDR criteria was 40.2% (n=1232) and using NP criteria was 28.1%(n = 861). 47.4% of participants (n=1451) were identified as “normal” and 15.7% (n=480) asMCI by both CDR and NP criteria for an overall agreement of 63%. However, 24.5% ofparticipants (n=751) met NP criteria for Normal but were classified as MCI by CDR criteriaand 12.4% (n=381) met NP criteria for MCI but were classified as Normal by CDR.
The majority of individuals classified by CDR criteria as MCI were impaired on the CDRmemory subscale (n=1180; 95.9%; overall frequency = 38.5%) Only 4.1% (n=52) of the CDR0.5 participants were impaired on non-memory CDR subscales and met criteria for CDR na-MCI (overall frequency = 1.7%). The overall frequency of NP a-MCI subtype was 16.6 % (n=508) and na-MCI subtype was 11.5% (n = 353).
We also examined differences across the four GEM sites in the overall frequency of MCI. Theproportion of MCI cases by CDR was higher at Wake Forest University (WFU) (60.7%) thanat the other clinical centers (ranging from 27.5% to 42.7%; X2= 218.8 p < .001). With regardto NP criteria, the UC-Davis site had the lowest proportion of MCI cases (22.6%) comparedto comparable frequencies at the other 3 sites (28.6% - 31.6%; X2 = 21.12, p < .001).
Descriptive StatisticsTable 3 summarizes descriptive statistics for demographic and clinical variables for the fourdiagnostic subgroups. Overall differences between the four subgroups were significant on alldemographic variables and most clinical variables.
Post hoc analyses showed that individuals diagnosed as MCI by both systems (Subgroup 4)were older, had poorer scores on mental status tests and tests of premorbid IQ, endorsed moresymptoms of depression and more health problems, had greater IADL impairment and poorermobility than individuals diagnosed as Normal by both systems (Subgroup 1). There was nodifference in the reported number of medications across all groups. Of note, there was astatistical trend toward higher ApoE4 allele proportion in Subgroup 4 compared to Subgroup1 (p = .08). When site was included as a covariate in the multinomial regression analyses the
Saxton et al. Page 5
J Neurol Neurosurg Psychiatry. Author manuscript; available in PMC 2010 July 1.
NIH
-PA Author Manuscript
NIH
-PA Author Manuscript
NIH
-PA Author Manuscript

only difference was that the gender distribution was no longer significantly different amongMCI subgroups. All other results were unchanged.
Neuropsychological test performanceTable 4 summarizes the neuropsychological test scores for the four diagnostic subgroups. Afteradjusting for age, education, race and depression score, the majority of cognitive test scoresremained significantly worse across subgroups with individuals in subgroup 1 (congruentNormal/Normal) performing better on all NP tests (except Digits forwards and Rey copy andrecall) than individuals in subgroup 2 (incongruent NP Normal/CDR MCI) who performedbetter on all tests than individuals in subgroup 3 (incongruent NP MCI/CDR Normal); whoperformed better on all NP tests (except Digits forwards and Rey copy) than individuals insubgroup 4 (congruent MCI/MCI).
Factors that influence a diagnosis of MCI by CDR among individuals with normal cognitionby NP criteria (comparison groups 1 and 2)
Significant differences in individuals meeting NP criteria for normal cognition who receiveda CDR classification of MCI included fewer years of education, poorer scores on mental statustests and tests of premorbid IQ, more depressive symptoms, more reported health problems,and more IADL impairment than individuals who received a CDR classification of Normal.Additionally, individuals with CDR diagnosis of MCI had significantly poorer NP test scores(except digits forwards, Rey copy and recall) than individuals classified as CDR Normal, eventhough both groups met NP criteria for Normal.
Factors that influence a diagnosis of MCI by NP among individuals diagnosed as Normal byCDR (comparison groups 1 and 3)
Significant differences in individuals meeting NP classification of MCI (and CDR Normal)included more years of education, poorer scores on mental status tests and tests of premorbidIQ, and more reported IADL difficulty than individuals who received a NP classification ofNormal. However, there were no differences between these groups in reported symptoms ofdepression or health problems.
Factors that influence a diagnosis of Normal by CDR among individuals classified as MCI byNP criteria (comparison groups 3 and 4)
Individuals classified as MCI by NP performance and Normal by CDR were younger, hadsignificantly more years of education, higher scores on mental status tests and tests ofpremorbid IQ, less depressive symptoms, less IADL impairment and better mobility thanindividuals who were diagnosed as MCI by CDR. These individuals also had significantlybetter scores on all NP tests (except digits forwards and Rey copy), even though they met NPcriteria for MCI.
Participant/Informant characteristicsWe examined the baseline characteristics of the participant/informant relationship because ofthe potential impact this may have had on CDR ratings. 59.6% of informants reported livingwith the participants. Of those informants who did not live with a participant, 78% reportedvisiting with the participant at least once a week and 88.8% reported phone or e-mail contactwith participants at least once a week. There were no differences in the proportions of CDRratings between informants who reported living with the participant and those who did not.Among those who live with the participant, 60.1% of participants were rated as CDR 0 and39.9% as CDR 0.5, and among those who did not live with the participant, 59.9% were ratedas CDR 0 and 40.1% were rated as CDR 0.5. Similar proportions of CDR ratings were observedamong informants not living with the participant who reported visiting with the participant
Saxton et al. Page 6
J Neurol Neurosurg Psychiatry. Author manuscript; available in PMC 2010 July 1.
NIH
-PA Author Manuscript
NIH
-PA Author Manuscript
NIH
-PA Author Manuscript

more than once a week (62.2% CDR 0; 37.7% CDR 0.5) and those who reported visiting oncea week or less (57.8% CDR 0; 42.2% CDR 0.5).
Rates of death, drop out and progression to dementiaThe GEM study began in September 2000 and assessed subjects every six months until April2008, median follow-up was 6.1 years. During this time 194 participants were either lost tofollow-up or withdrew consent. There were no differences between the participants whodeclined to continue the study and the 2,874 who remained in the study by age, gender, minorityrace, baseline disease categories (e.g. myocardial infarction, stroke, heart failure, and cancer)or smoking status. However, a difference in MCI status at baseline was found with 22.6% ofdrop-outs lost to follow-up compared to 15.2% of those who completed the study (p=.01).Individuals who met both MCI criteria were more likely to drop out than in the other threesubgroups. There were 383 deaths from any cause and no differences in rates of death acrosssubgroups.
Cognitive status was known for 93.6% of all participants at study end point. 522 participantswere diagnosed with dementia during the follow-up period. There were significant differencesacross the four subgroups in rates of dementia. The lowest rates were observed in individualsmeeting both CDR and NP criteria for Normal (subgroup 1 = 7.4%) and the highest rates wereobserved in individuals who met both CDR and NP criteria for MCI (subgroup 4 = 41.5%).17.2% of individuals with CDR MCI/NP Normal (subgroup 2); and 22.8% of individuals withCDR Normal/NP MCI (subgroup 3) developed dementia. Taking study site into account as acovariate in multinomial regression did not alter the pattern of results.
DISCUSSIONThe goals of this paper were to compare baseline rates of MCI and rates of progression todementia over six years, using different MCI diagnostic systems. 40.2% of individuals wereidentified as MCI using a CDR score of 0.5 and 28.2% using NP criteria (amnestic andnonamnestic combined). There was agreement between the two diagnostic methods in over63% of cases, 47.4% were classified as Normal by both criteria (NP Normal/CDR Normal)and 15.7% were classified as MCI by both criteria (NP MCI/CDR MCI). There were nosignificant differences between the four subgroups (congruent and incongruent) in the numberof medications reported and the number of deaths but there were a higher number of drop-outsin the group meeting both sets of MCI criteria. The percentage of ApoE4 carriers also did notdiffer between subgroups and is similar to that reported in other community studies (CHS,24.1%) [33] although lower than observed in some clinical samples [34]. Not surprisingly,individuals diagnosed as MCI by both methods were older, sicker, and more functionally andcognitively impaired.
Our overall rate of amnestic MCI (16.6%) as determined by neuropsychological algorithm iscomparable with other studies, although comparison is difficult because different criteria wereused. [20,35,36] However, our rate of MCI using CDR criteria (40.2%) is higher than otherstudies, for example, Meguro and colleagues [37] who reported an overall frequency of CDR0.5 of 30.2%. The main purpose of this study, however, was not to compare rates of MCI inthe GEM study to other population studies but rather to compare the rates of MCI using thetwo approaches within the same cohort. We found that the two diagnostic methods were largelyconcordant for the identification of Normal individuals but there was lower agreement for theidentification of MCI and, furthermore, there were a surprisingly high number of individualswho either had normal test performance but CDR scores of 0.5 or impaired test performanceand CDR scores were 0. Similar rates of MCI were reported in patients attending a memoryclinic [38] using a Global Deterioration Scale [39] score of 2 or 3 as the measure of subjectivecognitive complaints and a NP definition of a-MCI.
Saxton et al. Page 7
J Neurol Neurosurg Psychiatry. Author manuscript; available in PMC 2010 July 1.
NIH
-PA Author Manuscript
NIH
-PA Author Manuscript
NIH
-PA Author Manuscript

Our results suggest that individuals with normal cognition but CDR-measured deficits are morelikely to have lower education; endorse a higher number of health, and report symptoms ofdepression (but not meet formal criteria for a diagnosis of depression) than those without CDR-measured deficits. Depression is common in preclinical AD and can be an early sign of aneurodegenerative disorder [38,40]. Our results also suggest that the CDR is sensitive to verysubtle differences in cognition. Thus, among individuals who were classified as Normal by theNP algorithm, the CDR classified, on average, those with higher test scores as CDR Normaland those with poorer scores as CDR MCI and, similarly, among individuals classified as MCIby the neuropsychological algorithm, the CDR classified those with higher test scores as CDRNormal those with lower scores as CDR MCI.
In this study the majority of individuals with MCI did not progress to dementia over the follow-up period. This finding is consistent with other studies of community-dwelling elderly [41][42] and also clinic populations [38]. The rates of dementia identified by different MCIdiagnostic criteria are also consistent with other studies which show that a slightly higherpercentage of individuals convert to dementia using cognitive test scores as a predictor thanusing functional criteria [38]. Reported conversion rates based on a CDR 0.5 definition of MCIvary across studies [6,43] and may be related to the broad range of functional disability thatfalls within the CDR 0.5 category. For example, a CDR 0.5 sum of box score of 2.0 or higherhas been shown to accurately predict 50% or higher conversion rate to AD over 3 yearscompared to a 10% conversion rate for individuals with a CDR 0.5 sum of box score of 1.0[43]. The specific clinical subtype of CDR 0.5, as determined by clinical impression, has alsobeen shown to predict conversion rates to dementia with 60.5% of individuals classified as“CDR 0.5 Dementia of the Alzheimer's Type” (DAT) and 35.7% of individuals classified as“CDR 0.5 Incipient DAT” progressing to dementia over 5 years [6]. Our findings showsignificantly higher rates of conversion to dementia (41.5%) when individuals meet both MCIcriteria compared to individuals who meet both Normal criteria (7.5%). Significant differenceswere also observed in the two incongruent groups. Although the rates are similar, a higherpercentage of those classified as NP MCI/CDR Normal progressed to dementia (22.8%) thanthose classified as CDR MCI/NP Normal (17.2%), suggesting that poor performance onneuropsychological tests is a slightly better indicator of future progression to dementia thanfunctional impairment.
Several factors may contribute to our findings. First, these data were gathered as part of aclinical trial and it is possible that G. biloba had an effect on the progression to dementia inone group over another. However, we have previously reported that G. biloba was not effectivein lowering either the overall incidence rate of dementia or AD incidence in normal elderly orpersons with MCI; nor was there any effect of G. biloba on mortality, stroke or myocardialinfarction [17] and as a randomized trial it is unlikely there was a disproportionate effect ofG. biloba.
Second, different findings may occur across studies if the CDR is administered differently.GEM study interviewers completed standardized training procedures and were certified by oneof the co-authors (LOD) who has had more than ten year's experience as a CDR trainer. Wealso considered the possibility that community informants are not as reliable as informants inclinical settings but the majority of GEM informants lived with the participant and of thoseinformants who did not, most reported visiting at least once a week. Furthermore, we foundlittle difference in CDR classification based on informant characteristics suggesting thatinformation obtained from GEM informants was reliable. There is also the possibility ofcircularity in our diagnosis of MCI and dementia, both of which used performance on theneuropsychological battery. However, the dementia diagnosis was not limited to theneuropsychological battery but involved a comprehensive review of clinical assessmentsacross multiple years and included performance on screening tests (3MSE and the ADAS-Cog)
Saxton et al. Page 8
J Neurol Neurosurg Psychiatry. Author manuscript; available in PMC 2010 July 1.
NIH
-PA Author Manuscript
NIH
-PA Author Manuscript
NIH
-PA Author Manuscript

not used in the MCI or dementia algorithm. Finally, although the participants in this study weredrawn from the community they are a unique hybrid of a representative community samplebut with a clinical trial selection bias. This sample may not be typical of the referral populationseen in most clinical trials but also is not an epidemiological community cohort and this mayalso contribute to our findings. However, having said this, the critical finding in this study isnot the overall rates of MCI compared to other studies, but the comparison of the twoclassification methods within the same cohort. Nevertheless, the sample may include largenumbers of so-called, “worried well” who have more subjective complaints of memory loss,depression and poor health and this may contribute to higher rates of CDR 0.5.
Finally, proponents of the CDR have suggested that, when followed longitudinally, themajority of individuals with CDR 0.5 progress to AD and, based on this finding, they suggestthat a CDR of 0.5 more correctly represents early mild AD rather than MCI.[6,44] Theimplications of this suggestion are potentially enormous, especially considering that more than40% of individuals in this study received a CDR of 0.5 at baseline. Our findings confirm thatthe CDR picks up subtle cognitive loss but also suggests that the CDR is sensitive to subtlepsychiatric and clinical factors and that these also influence the likelihood that an individualwill be classified as MCI by the CDR. In one of the few studies addressing this issue, theHelsinki Aging Study[44] administered the CDR as part of a dementia work-up for 900individuals between the ages of 75 and 80 living in the city of Helsinki. The CDR wascompleted by community physicians who, contrary to standard guidelines, were instructed torecord CDR deficits related to any reason, not only cognition. Thirty-two individuals scored1.0 on the CDR, indicating the presence of dementia, but in a follow-up neurological evaluationwere assessed by a neurologist as not suffering from dementia. As in our study, discordantdiagnoses were associated with the presence of psychiatric symptoms (37%), especiallydepression (28%), and medical disorders (47%).
In conclusion, using different MCI criteria, we identified different rates of MCI at baseline anddifferent rates of progression to dementia over time. CDR ratings of MCI were influenced bya number of demographic, cognitive and clinical factors some of which may be more relevantto the identification of MCI within community cohorts than in memory clinics where patientspresent with existing memory complaints. Slightly more individuals meeting NP MCI criteriaprogressed to dementia over the follow-up than individuals identified as MCI by the CDR.These results suggest that identifying all individuals with CDR scores of 0.5 as AD is notadvisable.
AcknowledgmentsFunding/Support: This study was supported by grant U01 AT000162 from the National Center for Complementaryand Alternative Medicine (NCCAM) and the Office of Dietary Supplements and National Institute on Aging; NationalHeart, Lung, and Blood Institute; University of Pittsburgh Alzheimer's Disease Research Center (P50AG05133);Roena Kulynych Center for Memory and Cognition Research; Wake Forest University School of Medicine; andNational Institute of Neurological Disorders and Stroke. Schwabe Pharmaceuticals, Karlsruhe, Germany, donated theGbiloba tablets and identical placebos in blister packs for the study.
Appendix
APPENDIXThe Ginkgo Evaluation of Memory (GEM) Study Investigators:
Project Office, NCCAM: Richard Nahin, PhD, MPH; Barbara Sorkin, PhD.
Clinical Centers: Michelle C. Carlson, PhD; Linda P. Fried, MD, MPH; Pat Crowley, MS;Claudia Kawas, MD; Paulo Chaves, MD; Sevil Yasar, PhD; Patricia Smith; Joyce Chabot;
Saxton et al. Page 9
J Neurol Neurosurg Psychiatry. Author manuscript; available in PMC 2010 July 1.
NIH
-PA Author Manuscript
NIH
-PA Author Manuscript
NIH
-PA Author Manuscript
Johns Hopkins University; John A. Robbins, MD, MHS; Katherine Gundling, MD, FACP;Sharene Theroux, CCRP; Linly Kwong, CCRP; Lisa Pastore, CCRP; University of California-Davis; Lewis Kuller, MD, DrPH; Roberta Moyer, CMA; Cheryl Albig, CMA; University ofPittsburgh; Gregory Burke, MD; Steve Rapp, PhD; Dee Posey; Margie Lamb, RN; Wake ForestUniversity School of Medicine.
Schwabe Pharmaceuticals: Robert Hörr, MD; Thorsten Schmeller, PhD; Joachim Herrmann,PhD.
Data Coordinating Center: Richard A. Kronmal, PhD; Annette L. Fitzpatrick, PhD; FumeiLin, PhD; Cam Solomon, PhD; Alice Arnold, PhD; University of Washington.
Cognitive Diagnostic Center: Steven DeKosky, MD*, Judith Saxton, PhD, Oscar Lopez, MD,Beth Snitz PhD, M. Ilyas Kamboh PhD, Diane Ives, MPH, Leslie Dunn, MPH, University ofPittsburgh(* now at University of Virginia)
Clinical Coordinating Center: Jeff D. Williamson, MD, MHS; Curt D. Furberg, MD, PhD;Nancy Woolard; Kathryn Bender, PharmD; Susan Margitic, MS; Wake Forest UniversitySchool of Medicine.
Central Laboratory: Russell P. Tracy, PhD; Elaine Cornell, BA; University of Vermont.
MRI Reading Center: William Rothfus MD, Charles Lee MD, Rose Jarosz, University ofPittsburgh
Data Safety Monitoring Board: Richard Grimm, MD, PhD (chair), University of Minnesota;Jonathan Berman, MD, PhD (executive secretary), NCCAM; Hannah Bradford, MAc, LAc,MBA; Carlo Calabrese, ND, MPH; Bastyr University Research Institute; Rick Chappell, PhD,University of Wisconsin Medical School; Kathryn Connor, MD, Duke University MedicalCenter; Gail Geller, ScD, Johns Hopkins Medical Institute; Boris Iglewicz, PhD, TempleUniversity; Richard S. Panush, MD, Saint Barnabas Medical Center; Richard Shader, PhD,Tufts University.
AbbreviationsGEM, Ginkgo Evaluation of Memory study; CHS, Cardiovascular Health Study; MCI, MildCognitive Impairment; a-MCI, amnestic MCI; na-MCI, nonamnestic MCI; CDR, ClinicalDementia Rating scale; 3MSE, Modified Mini Mental State Examination; CVLT, CaliforniaVerbal Learning Test; R-O figure, Rey-Osterrieth Complex Figure; Ravens CPM, RavensColoured Progressive Matrices.
REFERENCES1. Petersen RC, Smith GE, Waring SC, et al. Mild cognitive impairment: clinical characterization and
outcome. Archives of Neurology 1999;56(3):303–8. [PubMed: 10190820]2. Petersen, R. Mild cognitive impairment: Aging to Alzheimer's disease. Oxford University Press; New
York: 2003.3. Winblad B, Palmer K, Kivipelto M, et al. Mild cognitive impairment - beyond controversies, towards
a consensus: report of the International Working Group of mild cognitive impairment. Journal ofInternal Medicine 2004;256:240–6. [PubMed: 15324367]
4. Hughes CP, Berg L, Danziger WL, et al. A new clinical scale for the staging of dementia. BritishJournal of Psychiatry 1982;140:566–72. [PubMed: 7104545]
5. Morris JC. The Clinical Dementia Rating (CDR): Current version and scoring rules. Neurology1993;43:2411–3. [PubMed: 8232970]
Saxton et al. Page 10
J Neurol Neurosurg Psychiatry. Author manuscript; available in PMC 2010 July 1.
NIH
-PA Author Manuscript
NIH
-PA Author Manuscript
NIH
-PA Author Manuscript

6. Morris JC, Storandt M, Miller JP, et al. Mild cognitive impairment represents early-stage Alzheimerdisease. Archives of Neurology 2001;58(3):397–405. [PubMed: 11255443]
7. DeKosky ST, Fitzpatrick A, Ives DG, et al. The Gingko Evaluation of Memory (GEM) Study: Designand baseline data of a randomized trial of Gingko biloba extract in prevention of dementia.Contemporary Clinical Trials 2006;27(3):238–53. [PubMed: 16627007]
8. Fitzpatrick AL, Fried LP, Williamson J, et al. Recruitment of the elderly into a pharmarcologicprevention trial: The Gingko Evaluation of Memory Study experience. Contemporary Clinical Trials2006;27:541–53. [PubMed: 16949348]
9. Snitz BE, Saxton J, Lopez OL, et al. Identifying Mild Cognitive Impairment at Baseline in the GingkoEvaluation of Memory (GEM) Study. Aging and Mental Health. In Press
10. Katz S. Assessing self maintenance: Activites of daily living, mobility, and instrumental activities ofdaily living. Journal of the American Geriatrics Society 1983;31:721–7. [PubMed: 6418786]
11. Brandt J, Spencer M, Folstein M. The telephone interview for cognitive status. Neuropsychiatry,Neuropsychology and Behavioral Neurology 1988;1:111–7.
12. Teng EL, Chui HC. The Modified Mini-Mental State (3MS) examination. Journal of ClinicalPsychiatry 1987;48(8):314–8. [PubMed: 3611032]
13. Rosen WG, Mohs RC, K.L. D. A new rating scale for Alzheimer's disease. American Journal ofPsychiatry 1984;141:1356–64. [PubMed: 6496779]
14. Radloff LS. The CES-D Scale: A self-report depression scale for research in the general population.Applied Psychological Measurement 1977;1:385–401.
15. American Psychiatric Association. Diagnostic and statistical manual of mental disorders. Vol. 4thedition. American Psychiatric Association; Washington DC: 1994.
16. Lopez OL, Kuller LH, Fitzpatrick A, et al. Evaluation of dementia in the cardiovascular healthcognition study. Neuroepidemiology 2003;22(1):1–12. [PubMed: 12566948]
17. DeKosky ST, Williamson JD, Fitzpatrick AL, et al. Ginkgo biloba for prevention of Dementia: Arandomized controlled trial. Journal of the American Medical Association 2008;300(19):2253–62.[PubMed: 19017911]
18. Grober E, Sliwinski M. Development and Validation of a Model for Estimating Premorbid VerbalIntelligence in the Elderly. Journal of Clinical & Experimental Neuropsychology: Official Journalof the International Neuropsychological Society 1991;13(6):933–49.
19. Raven, JC. Guide to Using the Coloured Progressive Matrices. HK Lewis; London: 1956.20. Lopez OL, Jagust WJ, DeKosky ST, et al. Prevalence and classification of mild cognitive impairment
in the Cardiovascular Health Study Cognition Study: part 1. Archives of Neurology 2003;60(10):1385–9. [PubMed: 14568808]
21. Mitrushina, M.; Boon, KB.; Razani, J., et al. Handbook of Normative Data for NeuropsychologicalAssessment. Oxford University Press; New York: 2005.
22. Alladi S, Arnold A, Mitchell J, et al. Mild Cognitive Impairment: Applicability of research criteriain a memory clinic and characterization of cognitive profile. Psychological Medicine 2006;36(4):507–15. [PubMed: 16426486]
23. Schoonenboom SNM, Visser PJ, Mulder C, et al. Biomarker profiles and their relation to clinicalvariables in mild cognitive impairment. Neurocase 2005;11(1):8–13. [PubMed: 15804919]
24. Solfrizzi V, Panza F, Colacicco AM, et al. Vascular risk factors, incidence of MCI and rates ofprogression to dementia. Neurology 2004;63(10):1882–91. [PubMed: 15557506]
25. Morris JC, Ernesto C, Schafer K, et al. Clinical Dementia Rating Training and Reliability inMulticenter Studies: The Alzheimer's Disease Cooperative Study experience. Neurology1997;48:1508–10. [PubMed: 9191756]
26. Wechsler, D. Wechsler Adult Intelligence Scale-Revised Manual. The Psychological Corporation;New York: 1981.
27. Reitan RM. Validity of the Trail-Making Tests as an indication of organic brain damage. Perceptualand Motor Skills 1958;8:271–6.
28. Delis, DC. California Verbal Learning Test. Psychological Corporation; New York: 1987.29. Becker JT, Boller F, Saxton J, et al. Normal rates of forgetting of verbal and non-verbal material in
Alzheimer's disease. Cortex 1987;23(1):59–72. [PubMed: 3568706]
Saxton et al. Page 11
J Neurol Neurosurg Psychiatry. Author manuscript; available in PMC 2010 July 1.
NIH
-PA Author Manuscript
NIH
-PA Author Manuscript
NIH
-PA Author Manuscript

30. Saxton J, Ratcliff G, Munro CA, et al. Normative data on the Boston Naming Test and two equivalent30-item short forms. Clinical Neuropsychologist 2000;14(4):526–34. [PubMed: 11262721]
31. Spreen, O.; Strauss, E. A Compendium of Neuropsychological Tests. Oxford University Press; NewYork: 1991.
32. Trenerry, MR.; Crosson, B.; DeBoe, J., et al. STROOP neuropsychological screening test.Psychological Assessment Resources; Odessa, FL: 1989.
33. Podewils LJ, Gualler E, Kuller LH, et al. Physical activity, APOE genotype, and dementia risk:Findings from the Cardiovascular Health Cognition Study. American Journal of Epidemiology2005;161(7):639–51. [PubMed: 15781953]
34. Whitwell JL, Petersen RC, Negash S, et al. Patterns of atrophy differ among specific subtypes of mildcognitive impairment. Archives of Neurology 2007;64:1130–8. [PubMed: 17698703]
35. Busse A, Bischkopf J, Riedel-Heller SG, et al. Subclassifications For Mild Cognitive Impairment:Prevalence and predictive validity. Psychological Medicine 2003;33(6):1029–38. [PubMed:12946087]
36. Zanetti M, Ballabio C, et al. Mild cognitive impairment subtypes and vascular dementia incommunity-dwelling elderly people: 1 3-year follow-up study [see comment]. Journal of theAmerican Geriatrics Society 2006;54(4):580–6. [PubMed: 16686866]
37. Meguro K, Shimada M, Yamaguchi S, et al. Neuropsychological features of very mild Alzheimer'sDisease (CDR 0.5) and progression to dementia in a community: The Tajiri project. Journal ofGeriatric Psychiatry and Neurology 2004;17(4):183–9. [PubMed: 15533988]
38. Visser PJ, Kester A, Jolles J, et al. Ten-year risk of dementia in subjects with mild cognitiveimpairment. Neurology 2006;67:1201–7. [PubMed: 17030753]
39. Reisberg B, Ferris SH, de Leon MJ, et al. The Global Deterioration Scale for assessment of primarydegenerative dementia. American Journal of Psychiatry 1982;139(9):1136–9. [PubMed: 7114305]
40. Visser PJ, Verhey FRJ, Ponds RWHM, et al. Distinction between preclinical dementia and depression.Journal of the American Geriatrics Society 2000;48:479–84. [PubMed: 10811539]
41. Ganguli M, Dodge HH, Shen C, et al. Mild cognitive impairment, amnestic type: an epidemiologicstudy. Neurology 2004;63:115–21. [PubMed: 15249620]
42. Grober E, Lipton RB, Hall C, et al. Memory impairment on free and cued selective reminding predictsdementia. Neurology 2000;54:827–32. [PubMed: 10690971]
43. Daly E, Zaitchik D, Copeland M, et al. Predicting Conversation to Alzheimer Disease UsingStandardized Clinical Information. Archives of Neurology 2000;57:675–80. [PubMed: 10815133]
44. Morris JC. Mild Cognitive Impairment is Early-Stage Alzheimer's Disease, Time to Revise DiagnosticCriteria. Archives of Neurology 2006;63:15–6. [PubMed: 16401731]
Saxton et al. Page 12
J Neurol Neurosurg Psychiatry. Author manuscript; available in PMC 2010 July 1.
NIH
-PA Author Manuscript
NIH
-PA Author Manuscript
NIH
-PA Author Manuscript

NIH
-PA Author Manuscript
NIH
-PA Author Manuscript
NIH
-PA Author Manuscript
Saxton et al. Page 13
Table 1Cognitive test variables and domains included in MCI case identification
Domain Test variable
Estimated premorbid IQ AMNART[26]
Ravens CPM[27]
Memory - verbal California Verbal Learning Test (CVLT) - long delayed free recall[28]
- visual 24-point modified Rey Osterrieth figure (R-O figure) - delayed recall[29]
Construction 24-point modified Rey Osterrieth figure (R-O figure) - copy condition[29]
24-point modified WAIS-R Block Design[7]
Language 30-item Boston Naming Test[30]
Animal fluency[31]
Attention/Psychomotor Speed WAIS-R Digit Span forward - total score[26]
Trail Making Test A - time in sec.[27]
Executive Functions Trail Making Test B - time in sec.[27]
Stroop color/ word test - interference condition, number of colors named[32]
J Neurol Neurosurg Psychiatry. Author manuscript; available in PMC 2010 July 1.
NIH
-PA Author Manuscript
NIH
-PA Author Manuscript
NIH
-PA Author Manuscript
Saxton et al. Page 14
Table 2Number (%) of participants classified as Normal or MCI (amnestic + nonamnestic) by Neuropsychological (NP) andCDR criteria
CDR criteria
NP Criteria CDR Normal Global score = 0 (n=1832; 58.8%) CDR MCI Global score = 0.5 (n=1231; 40.2%) TOTAL
NP Normal (n=2202; 71.9%) 1451 (47.4%) 751 (24.5%) 2202 (71.9%)
NP MCI (n=861; 28.1%) 381 (12.4%) 480 (15.7%) 861 (28.1%)
TOTAL 1832 (59.8%) 1231 (40.2%) 3063 (100%)
J Neurol Neurosurg Psychiatry. Author manuscript; available in PMC 2010 July 1.

NIH
-PA Author Manuscript
NIH
-PA Author Manuscript
NIH
-PA Author Manuscript
Saxton et al. Page 15Ta
ble
3D
emog
raph
ic, c
linic
al a
nd h
ealth
var
iabl
es (m
ean
+/- S
D, o
r n /
%) b
y su
bgro
up
NP
Nor
mal
/ CD
R N
orm
al(n
= 1
451)
Sub
grou
p 1
NP
Nor
mal
/ CD
R M
CI (
n =
751)
Sub
grou
p 2
NP
MC
I/ C
DR
Nor
mal
(n =
381)
Sub
grou
p 3
NP
MC
I/ C
DR
MC
I (n
=48
0) S
ubgr
oup
4A
NO
VA
F o
r C
hi-s
quar
e
Dem
ogra
phic
var
iabl
es
Age
78.0
(2.9
)a78
.7 (3
.4)b
78.7
(3.5
)c79
.6 (3
.7)d
31.6
2***
Educ
atio
n (y
ears
)14
.5 (2
.8)a
13.8
(2.8
)b15
.0 (3
.1)c
14.2
(3.3
)a19
.72**
*
Gen
der (
% fe
mal
e)69
0 (4
7.6%
)a31
7 (4
2.2%
)b17
2 (4
5.1%
)a ,b23
7 (4
9.4%
)aC
hi-s
quar
e =
7.99
*
Men
tal S
tatu
s Tes
ts
AD
AS
5.6
(2.1
)a6.
7 (2
.6)b
7.1
(2.7
)c8.
4 (3
.2)d
159.
73**
*
3MSE
95.0
(3.8
)a93
.1 (4
.4)b
92.2
(4.4
)c89
.7 (5
.4)b
189.
28**
*
Prem
orbi
d Fu
nctio
ning
AM
NA
RT
IQ11
8.3
(7.8
)a11
5.7
(8.1
)b11
6.1
(8.7
)b11
3.7
(9.2
)c41
.29**
*
Rav
ens C
PM29
.7 (4
.1)a
28.9
(4.0
)b26
.5 (4
.9)c
25.7
(4.9
)d12
9.29
***
Clin
ical
/hea
lth v
aria
bles
Apo
E 4
alle
le (%
car
riers
)†23
7 (2
0.0%
)13
3 (2
2.3%
)64
(21.
3%)
88 (2
4.2%
)C
hi sq
uare
= 3
.39
CES
D d
epre
ssio
n sc
ale
3.2
(3.1
)a3.
9 (3
.7)b
3.4
(3.4
)a4.
6 (4
.1)c
24.1
3***
Sum
end
orse
d he
alth
pro
blem
s (ou
t of 2
4)1.
8 (1
.6)a
2.1
(1.8
)b1.
9 (1
.8)a ,b
2.1
(1.8
)b7.
31**
*
Diff
icul
ty w
ith IA
DLs
(% y
es)
383
(26.
4%)a
239
(31.
8%)b
119
(31.
3%)b
177
(36.
9%)b
Chi
squa
re =
21.
29**
*
# m
edic
atio
ns (R
x an
d O
TC)
7.1
(3.9
)7.
5 (4
.2)
7.0
(3.8
)7.
2 (3
.9)
0.54
Mob
ility
: Diff
icul
ty w
alki
ng h
alf m
ile ‡ (%
yes
)27
7 (1
9.2%
)a16
7 (2
2.4%
)a85
(22.
7%)a
143
(30.
2%)b
Chi
squa
re =
24.
09**
*
Out
com
es
Dea
ths
177
(12.
2%)
104
(13.
8%)
43 (1
2.3%
)59
(12.
3%)
Chi
-squ
are
= 1.
90
Dro
pout
s77
(5.3
%)a
47 (6
.3%
)a ,b26
(6.8
%)a
,b44
(9.2
%)b
Chi
-squ
are
= 9.
28*
Dem
entia
107
(7.4
%)a
129
(17.
2%)b
87 (2
2.8%
)c19
9 (4
1.5%
)dC
hi-s
quar
e =
307.
40**
*
AD
AS
= A
lzhe
imer
's D
isea
se A
sses
smen
t Sca
le; 3
MSE
= M
odifi
ed M
ini M
enta
l Sta
te E
xam
inat
ion;
AM
NA
RT
= N
atio
nal A
dult
Rea
ding
Tes
t - A
mer
ican
Ver
sion
; Rav
en C
PM =
Rav
en's
Col
oure
dPr
ogre
ssiv
e M
atric
es. C
ESD
= C
ente
r for
Epi
dem
iolo
gica
l Stu
dies
Dep
ress
ion
Scal
e.
Not
es. M
eans
or p
ropo
rtion
s with
in a
giv
en ro
w w
ith d
iffer
ent s
uper
scrip
ts a
re st
atis
tical
ly d
iffer
ent b
y St
uden
t-Neu
man
-Keu
ls p
roce
dure
or m
odifi
ed K
eppe
l-Bon
fero
nni c
orre
ctio
n, re
spec
tivel
y.Si
te in
clud
ed a
s cov
aria
tes i
n om
nibu
s AN
OV
As
*** p<
.001
* p<.0
5
J Neurol Neurosurg Psychiatry. Author manuscript; available in PMC 2010 July 1.

NIH
-PA Author Manuscript
NIH
-PA Author Manuscript
NIH
-PA Author Manuscript
Saxton et al. Page 16† R
educ
ed sa
mpl
e w
ith A
poE
geno
typi
ng, t
otal
n =
244
5 (s
ee M
etho
ds)
‡ Self-
repo
rt
J Neurol Neurosurg Psychiatry. Author manuscript; available in PMC 2010 July 1.

NIH
-PA Author Manuscript
NIH
-PA Author Manuscript
NIH
-PA Author Manuscript
Saxton et al. Page 17Ta
ble
4N
euro
psyc
holo
gica
l var
iabl
es (m
ean
+/- S
D) b
y su
bgro
up
NP
Nor
mal
/ CD
R N
orm
al (n
=14
51) S
ubgr
oup
1N
P N
orm
al/C
DR
MC
I (n
= 75
1)Su
bgro
up 2
NP
MC
I/C
DR
Nor
mal
(n =
381
)Su
bgro
up 3
NP
MC
I/ C
DR
MC
I (n
= 48
0)Su
bgro
up 4
AN
OV
A F
Epis
odic
mem
ory
CV
LT lo
ng-d
elay
reca
ll9.
9 (2
.8)a
8.8
(2.9
)b7.
9 (3
.2)c
6.3
(2.9
)d17
3.79
***
R-O
del
ayed
reca
ll17
.3 (4
.0)a
16.9
(4.0
)a13
.2 (5
.2)b
11.9
(5.2
)c23
4.65
***
Atte
ntio
n/pe
rcep
tual
spee
d
Dig
it sp
an fo
rwar
d6.
3 (1
.3)a
6.1
(1.3
)a5.
9 (1
.3)b
5.8
(1.3
)b14
.83**
*
Trai
ls A
(sec
)39
.5 (1
1.8)
a42
.6 (1
2.1)
b50
.0 (1
8.5)
c54
.8 (2
4.3)
d11
3.06
**
Visu
ospa
tial c
onst
ruct
ion
R-O
cop
y (2
4 po
ints
)22
.6 (1
.7)a
22.7
(1.6
)a20
.6 (3
.0)b
20.6
(3.2
)b17
6.00
**
Blo
ck d
esig
n (2
4 pt
s)13
.2 (3
.8)a
12.1
(3.8
)b9.
7 (4
.6)c
8.7
(4.3
)16
8.91
***
Lang
uage
30-p
oint
BN
T27
.4 (2
.2)a
27.0
(2.5
)b25
.6 (3
.4)c
24.5
(3.9
)d13
4.11
***
Cat
egor
y flu
ency
17.1
(4.2
)a16
.3 (3
.9)b
14.2
(4.2
)c13
.0 (3
.6)d
133.
49**
*
Exec
utiv
e fu
nctio
ns
Trai
ls B
(sec
)95
.0 (3
3.0)
a11
1.1
(40.
3)b
127.
9 (4
9.6)
c14
8.7
(55.
1)d
192.
70**
*
Stro
op in
terf
eren
ce83
.2 (1
9.9)
a76
.9 (1
9.5)
b66
.1 (2
3.1)
c59
.8 (2
2.0)
d15
1.20
***
Not
e: O
vera
ll Fs
repo
rted
for A
NC
OV
AS
with
age
, edu
catio
n, ra
ce a
nd C
ES-D
scor
e in
clud
ed a
s cov
aria
tes.
Mea
ns w
ithin
a g
iven
row
with
diff
eren
t sup
ersc
ripts
are
stat
istic
ally
diff
eren
t at p
< .
05 b
y St
uden
t-Neu
man
-Keu
ls p
roce
dure
*** p
< .0
01
J Neurol Neurosurg Psychiatry. Author manuscript; available in PMC 2010 July 1.
Copyright © 2022 FDOKUMEN