From the Cover: A global perspective of the richness and evenness of traditional crop-variety...
6
A global perspective of the richness and evenness of traditional crop-variety diversity maintained by farming communities Devra I. Jarvis a,b , Anthony H. D. Brown c , Pham Hung Cuong d , Luis Collado-Panduro e , Luis Latournerie-Moreno f , Sanjaya Gyawali g , Tesema Tanto h , Mahamadou Sawadogo i , Istvan Mar j , Mohammed Sadiki k , Nguyen Thi-Ngoc Hue l , Luis Arias-Reyes m , Didier Balma n , Jwala Bajracharya o , Fernando Castillo p , Deepak Rijal g , Loubna Belqadi k , Ram Rana g , Seddik Saidi q , Jeremy Ouedraogo r , Roger Zangre s , Keltoum Rhrib q , Jose Luis Chavez t , Daniel Schoen u , Bhuwon Sthapit v , Paola De Santis a , Carlo Fadda a , and Toby Hodgkin a a Bioversity International, 00057 Maccarese, Italy; c Australia Centre for Plant Biodiversity Research, CSIRO Plant Industry, Canberra ACT 2601, Australia; d Agricultural Science Institute of Northern Central Vietnam, Vinh City, Nghe An Province, Vietnam; e Aconsorcio para el Desarrollo Sostenible de Ucayali, Pucallpa, Peru; f Instituto Tecnolo ´ gico Agropecuario No. 2. Km, 16.3 Antigua Carretera Me ´ rida-Motul, Conkal, Yucata ´ n, CP 97345, Mexico; g Local Initiatives for Biodiversity Research and Development, Pokhara, Nepal; h Institute of Biodiversity Conservation and Research, Addis Ababa, Ethiopia; i Universite ´ de Ouagadougou, Ouagadougou, Burkina Faso; j U ´ jszilva ´ s Ko ¨ zse ´ gi O ¨ nkorma ´ nyzat, H-2768, U ´ jszilva ´ s, Hungary; k Institut Agronomique et Ve ´ te ´ rinaire Hassan II, Rabat, Morocco; l Plant Resources Center, Vietnam Academy of Agricultural Science Institute, Hanoi, Vietnam; m Centro Interdisciplinario de Investicacio ´n para el Desarrollo Integral Regional–Instituto Polite ´ cnico National Unidad Me ´ rida, 97310 Me ´ rida, Yucata ´ n, Mexico; n Institut de l’Environnement et de Recherches Agricoles, Ouagadougou, Burkina Faso; o Agriculture Botany Division, Nepalese Agricultural Research Council, Khumaltar, Nepal; p Instituto de Recursos Gene ´ ticos y Productividad, Colegio de Postgraduados, Montecillo Edo. de Me ´ xico, C.P. 56230, Mexico; q Institut National de la Recherche Agronomique, Rabat, Morocco; r 2 Institut de l’Environnement et de Recherches Agricoles, Ouagadougou, Burkina Faso; s Agence Nationale pour la Valorisation des Acquis de la Recherche, Ouagadougou, Burkina Faso; t Centro de Investigacio ´ n y de Estudios Ayanzados del Instituto Nacional Polite ´ cnico Unidad Oaxaca, Santa Cruz Xoxocotla ´ n, 71230 Oaxaca, Mexico; u McGill University, Quebec, QC, Canada H9X 3V9; and v Bioversity International, Regional Office Asia, Pacific and Oceania, Serdang, 43400 Selangor Darul Ehsan, Malaysia Communicated by Hans R. Herren, Millennium Institute, Arlington, VA, January 26, 2008 (received for review July 18, 2007) Varietal data from 27 crop species from five continents were drawn together to determine overall trends in crop varietal diversity on farm. Measurements of richness, evenness, and divergence showed that considerable crop genetic diversity continues to be maintained on farm, in the form of traditional crop varieties. Major staples had higher richness and evenness than nonstaples. Variety richness for clonal species was much higher than that of other breeding systems. A close linear relationship between traditional variety richness and evenness (both transformed), empirically derived from data spanning a wide range of crops and countries, was found both at household and community levels. Fitting a neutral ‘‘function’’ to traditional variety diversity relationships, comparable to a species abundance distribution of ‘‘neutral ecol- ogy,’’ provided a benchmark to assess the standing diversity on farm. In some cases, high dominance occurred, with much of the variety richness held at low frequencies. This suggested that diversity may be maintained as an insurance to meet future environmental changes or social and economic needs. In other cases, a more even frequency distribution of varieties was found, possibly implying that farmers are selecting varieties to service a diversity of current needs and purposes. Divergence estimates, measured as the proportion of community evenness displayed among farmers, underscore the importance of a large number of small farms adopting distinctly diverse varietal strategies as a major force that maintains crop genetic diversity on farm. conservation on farm diversity estimates traditional varieties C rop genetic resources have long been crucial to agricultural production, and the second half of the last century saw considerable effort in collecting, characterizing, and conserving this diversity in seed banks (ex situ conservation). Although these efforts have led to a worldwide network of ex situ gene banks and botanical gardens, these facilities cannot accommodate the full range of useful diversity in economically useful plant species, nor can they conserve the dynamic processes of crop evolution and farmers’ knowledge of crop selection and management inherent in the development and evolution of local cultivars (1, 2). Over the last two decades, the conservation of genetic resources on farm has received increasing attention (3, 4). In many parts of the world, traditional crop varieties [‘‘landraces’’ in the sense of Harlan (5)] are still grown in traditional farming systems (6, 7) and constitute important elements of the production systems and of the farmers’ livelihood strategies. Although an accurate gauge of the diversity present on farms at a global scale is still lacking, there is a consensus of the erosion of the genetic diversity that supports world food production (8). The evidence for this comes largely from individual short-term, single-country, or single-species studies (4), and often diversity information is captured only as a list of variety names. Furthermore, indices that could scale up or monitor these studies over time and space are unformulated. Richness and evenness are two key notions of biological diversity (9, 10). Richness refers to the number of different kinds of individuals regardless of their frequencies. Evenness, however, measures how similar the frequencies of the different variants are, with low evenness indicating dominance by one or a few types. Applying these concepts at the scale of traditional varieties requires prior determination of the identity of the varieties. These simple but powerful concepts of diversity are often forgotten when small-scale or single-crop studies are conducted. Over the last 10 years, a coordinated global partnership of researchers in eight countries and on five continents has measured the amount and distribution of genetic diversity present in farmers’ fields of 27 crop species (11) (Fig. 1). Through this partnership, countries worked together to collate biologically and culturally diverse datasets into a small number of globally applicable diversity indices to compare across farmer households and communities. This paper: (i) synthesizes the total body of diversity data gathered in the study, (ii) demonstrates that considerable crop genetic Author contributions: D.I.J., A.H.D.B., P.H.C., L.C.-P., L.L.-M., M. Sawadogo, I.M., M. Sadiki, N.T.N.H., L.A.-R., D.B., J.B., F.C., B.S., and T.H. designed research; D.I.J., P.H.C., L.C.-P., L.L.-M., S.G., T.T., M. Sawadogo, I.M., M. Sadiki, N.T.-N.H., L.A.-R., D.B., J.B., D.R., L.B., R.R., S.S., J.O., R.Z., K.R., and J.L.C. performed research; D.I.J., A.H.D.B., D.S., and T.H. contributed new reagents/analytic tools; D.I.J., A.H.D.B., P.H.C., L.C.-P., L.L.-M., S.G., T.T., M. Sawadogo, I.M., M. Sadiki, N.T.-N.H., J.B., F.C., L.B., J.L.C., B.S., P.D.S., and C.F. analyzed data; and D.I.J., A.H.D.B., D.S., P.D.S., C.F., and T.H. wrote the paper. The authors declare no conflict of interest. b To whom correspondence should be addressed. E-mail: [email protected]. This article contains supporting information online at www.pnas.org/cgi/content/full/ 0800607105/DC1. © 2008 by The National Academy of Sciences of the USA www.pnas.orgcgidoi10.1073pnas.0800607105 PNAS Early Edition 1 of 6 AGRICULTURAL SCIENCES
-
Upload
independent -
Category
Documents
-
view
0 -
download
0
Transcript of From the Cover: A global perspective of the richness and evenness of traditional crop-variety...
A global perspective of the richness and evennessof traditional crop-variety diversity maintainedby farming communitiesDevra I. Jarvisa,b, Anthony H. D. Brownc, Pham Hung Cuongd, Luis Collado-Panduroe, Luis Latournerie-Morenof,Sanjaya Gyawalig, Tesema Tantoh, Mahamadou Sawadogoi, Istvan Marj, Mohammed Sadikik, Nguyen Thi-Ngoc Huel,Luis Arias-Reyesm, Didier Balman, Jwala Bajracharyao, Fernando Castillop, Deepak Rijalg, Loubna Belqadik, Ram Ranag,Seddik Saidiq, Jeremy Ouedraogor, Roger Zangres, Keltoum Rhribq, Jose Luis Chavezt, Daniel Schoenu, Bhuwon Sthapitv,Paola De Santisa, Carlo Faddaa, and Toby Hodgkina
aBioversity International, 00057 Maccarese, Italy; cAustralia Centre for Plant Biodiversity Research, CSIRO Plant Industry, Canberra ACT 2601, Australia;dAgricultural Science Institute of Northern Central Vietnam, Vinh City, Nghe An Province, Vietnam; eAconsorcio para el Desarrollo Sostenible de Ucayali,Pucallpa, Peru; fInstituto Tecnologico Agropecuario No. 2. Km, 16.3 Antigua Carretera Merida-Motul, Conkal, Yucatan, CP 97345, Mexico; gLocal Initiativesfor Biodiversity Research and Development, Pokhara, Nepal; hInstitute of Biodiversity Conservation and Research, Addis Ababa, Ethiopia; iUniversite deOuagadougou, Ouagadougou, Burkina Faso; jUjszilvas Kozsegi Onkormanyzat, H-2768, Ujszilvas, Hungary; kInstitut Agronomique et Veterinaire Hassan II,Rabat, Morocco; lPlant Resources Center, Vietnam Academy of Agricultural Science Institute, Hanoi, Vietnam; mCentro Interdisciplinario de Investicacionpara el Desarrollo Integral Regional–Instituto Politecnico National Unidad Merida, 97310 Merida, Yucatan, Mexico; nInstitut de l’Environnement et deRecherches Agricoles, Ouagadougou, Burkina Faso; oAgriculture Botany Division, Nepalese Agricultural Research Council, Khumaltar, Nepal; pInstituto deRecursos Geneticos y Productividad, Colegio de Postgraduados, Montecillo Edo. de Mexico, C.P. 56230, Mexico; qInstitut National de la RechercheAgronomique, Rabat, Morocco; r2 Institut de l’Environnement et de Recherches Agricoles, Ouagadougou, Burkina Faso; sAgence Nationale pour laValorisation des Acquis de la Recherche, Ouagadougou, Burkina Faso; tCentro de Investigacion y de Estudios Ayanzados del Instituto Nacional PolitecnicoUnidad Oaxaca, Santa Cruz Xoxocotlan, 71230 Oaxaca, Mexico; uMcGill University, Quebec, QC, Canada H9X 3V9; and vBioversity International, RegionalOffice Asia, Pacific and Oceania, Serdang, 43400 Selangor Darul Ehsan, Malaysia
Communicated by Hans R. Herren, Millennium Institute, Arlington, VA, January 26, 2008 (received for review July 18, 2007)
Varietal data from 27 crop species from five continents were drawntogether to determine overall trends in crop varietal diversity onfarm. Measurements of richness, evenness, and divergenceshowed that considerable crop genetic diversity continues to bemaintained on farm, in the form of traditional crop varieties. Majorstaples had higher richness and evenness than nonstaples. Varietyrichness for clonal species was much higher than that of otherbreeding systems. A close linear relationship between traditionalvariety richness and evenness (both transformed), empiricallyderived from data spanning a wide range of crops and countries,was found both at household and community levels. Fitting aneutral ‘‘function’’ to traditional variety diversity relationships,comparable to a species abundance distribution of ‘‘neutral ecol-ogy,’’ provided a benchmark to assess the standing diversity onfarm. In some cases, high dominance occurred, with much of thevariety richness held at low frequencies. This suggested thatdiversity may be maintained as an insurance to meet futureenvironmental changes or social and economic needs. In othercases, a more even frequency distribution of varieties was found,possibly implying that farmers are selecting varieties to service adiversity of current needs and purposes. Divergence estimates,measured as the proportion of community evenness displayedamong farmers, underscore the importance of a large number ofsmall farms adopting distinctly diverse varietal strategies as amajor force that maintains crop genetic diversity on farm.
conservation on farm � diversity estimates � traditional varieties
Crop genetic resources have long been crucial to agriculturalproduction, and the second half of the last century saw
considerable effort in collecting, characterizing, and conservingthis diversity in seed banks (ex situ conservation). Although theseefforts have led to a worldwide network of ex situ gene banks andbotanical gardens, these facilities cannot accommodate the fullrange of useful diversity in economically useful plant species, norcan they conserve the dynamic processes of crop evolution andfarmers’ knowledge of crop selection and management inherentin the development and evolution of local cultivars (1, 2).
Over the last two decades, the conservation of genetic resourceson farm has received increasing attention (3, 4). In many parts ofthe world, traditional crop varieties [‘‘landraces’’ in the sense of
Harlan (5)] are still grown in traditional farming systems (6, 7) andconstitute important elements of the production systems and of thefarmers’ livelihood strategies. Although an accurate gauge of thediversity present on farms at a global scale is still lacking, there isa consensus of the erosion of the genetic diversity that supportsworld food production (8). The evidence for this comes largely fromindividual short-term, single-country, or single-species studies (4),and often diversity information is captured only as a list of varietynames. Furthermore, indices that could scale up or monitor thesestudies over time and space are unformulated.
Richness and evenness are two key notions of biological diversity(9, 10). Richness refers to the number of different kinds ofindividuals regardless of their frequencies. Evenness, however,measures how similar the frequencies of the different variants are,with low evenness indicating dominance by one or a few types.Applying these concepts at the scale of traditional varieties requiresprior determination of the identity of the varieties. These simple butpowerful concepts of diversity are often forgotten when small-scaleor single-crop studies are conducted.
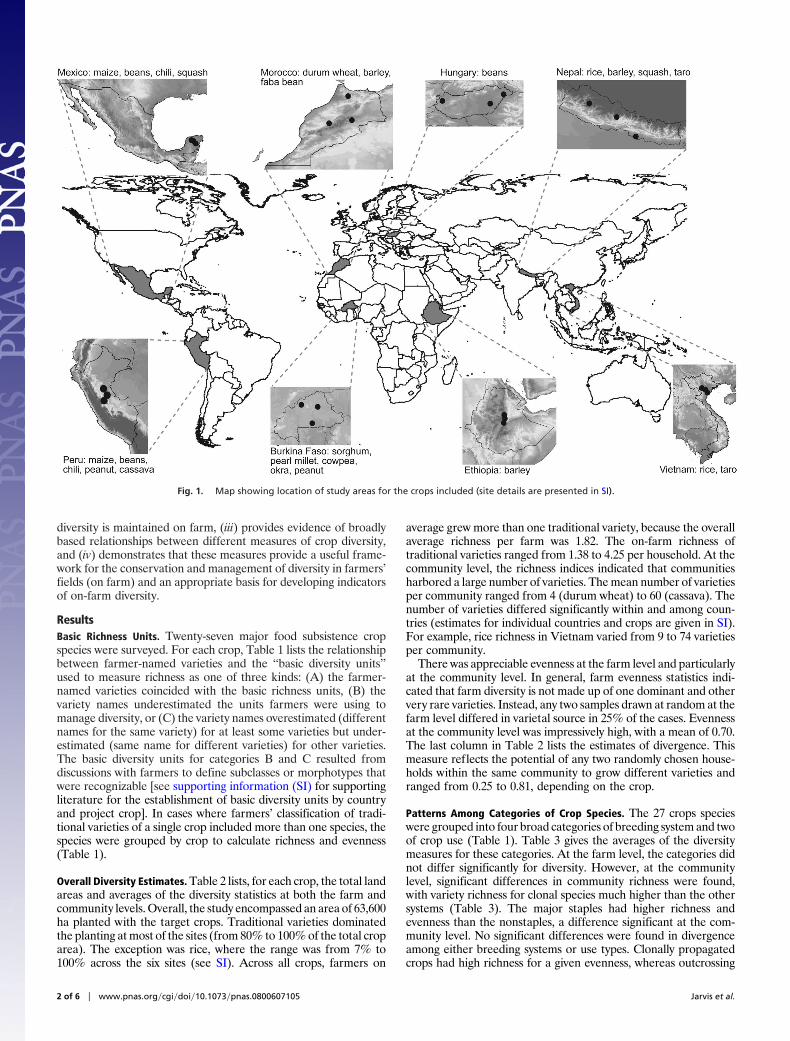
Over the last 10 years, a coordinated global partnership ofresearchers in eight countries and on five continents has measuredthe amount and distribution of genetic diversity present in farmers’fields of 27 crop species (11) (Fig. 1). Through this partnership,countries worked together to collate biologically and culturallydiverse datasets into a small number of globally applicable diversityindices to compare across farmer households and communities.This paper: (i) synthesizes the total body of diversity data gatheredin the study, (ii) demonstrates that considerable crop genetic
Author contributions: D.I.J., A.H.D.B., P.H.C., L.C.-P., L.L.-M., M. Sawadogo, I.M., M. Sadiki,N.T.N.H., L.A.-R., D.B., J.B., F.C., B.S., and T.H. designed research; D.I.J., P.H.C., L.C.-P., L.L.-M.,S.G., T.T., M. Sawadogo, I.M., M. Sadiki, N.T.-N.H., L.A.-R., D.B., J.B., D.R., L.B., R.R., S.S., J.O.,R.Z., K.R., and J.L.C. performed research; D.I.J., A.H.D.B., D.S., and T.H. contributed newreagents/analytic tools; D.I.J., A.H.D.B., P.H.C., L.C.-P., L.L.-M., S.G., T.T., M. Sawadogo, I.M.,M. Sadiki, N.T.-N.H., J.B., F.C., L.B., J.L.C., B.S., P.D.S., and C.F. analyzed data; and D.I.J.,A.H.D.B., D.S., P.D.S., C.F., and T.H. wrote the paper.
The authors declare no conflict of interest.
bTo whom correspondence should be addressed. E-mail: [email protected].
This article contains supporting information online at www.pnas.org/cgi/content/full/0800607105/DC1.
© 2008 by The National Academy of Sciences of the USA
www.pnas.org�cgi�doi�10.1073�pnas.0800607105 PNAS Early Edition � 1 of 6
AG
RICU
LTU
RAL
SCIE
NCE
S
diversity is maintained on farm, (iii) provides evidence of broadlybased relationships between different measures of crop diversity,and (iv) demonstrates that these measures provide a useful frame-work for the conservation and management of diversity in farmers’fields (on farm) and an appropriate basis for developing indicatorsof on-farm diversity.
ResultsBasic Richness Units. Twenty-seven major food subsistence cropspecies were surveyed. For each crop, Table 1 lists the relationshipbetween farmer-named varieties and the ‘‘basic diversity units’’used to measure richness as one of three kinds: (A) the farmer-named varieties coincided with the basic richness units, (B) thevariety names underestimated the units farmers were using tomanage diversity, or (C) the variety names overestimated (differentnames for the same variety) for at least some varieties but under-estimated (same name for different varieties) for other varieties.The basic diversity units for categories B and C resulted fromdiscussions with farmers to define subclasses or morphotypes thatwere recognizable [see supporting information (SI) for supportingliterature for the establishment of basic diversity units by countryand project crop]. In cases where farmers’ classification of tradi-tional varieties of a single crop included more than one species, thespecies were grouped by crop to calculate richness and evenness(Table 1).
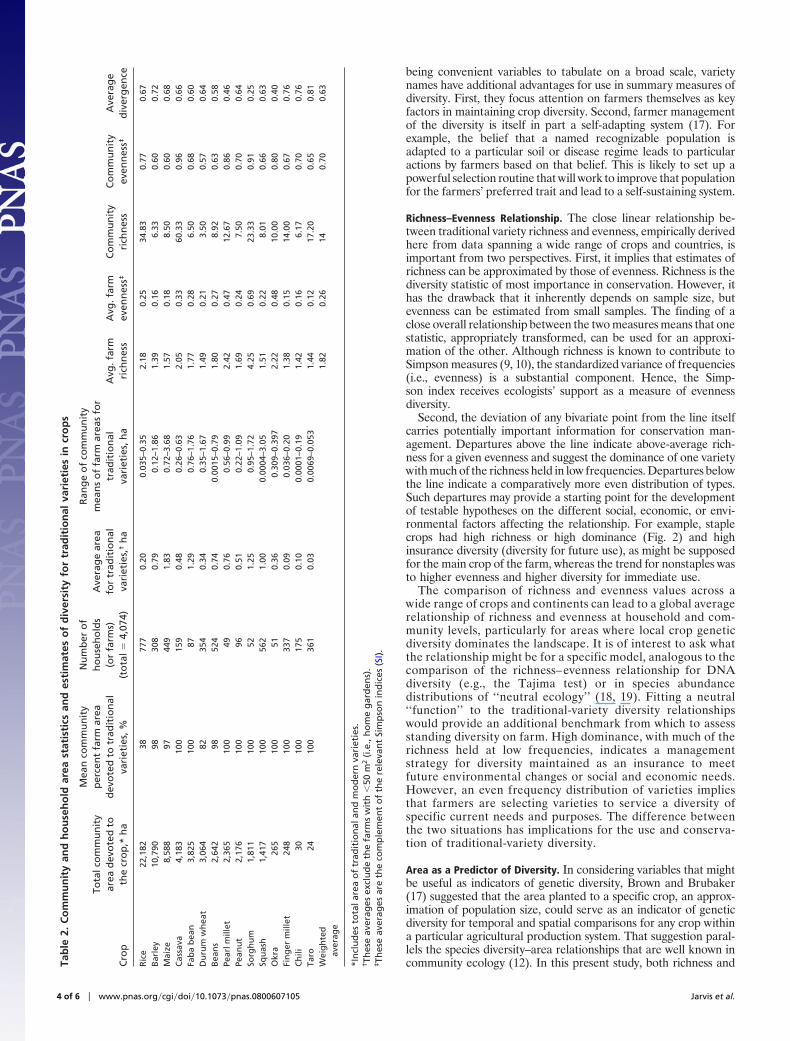
Overall Diversity Estimates. Table 2 lists, for each crop, the total landareas and averages of the diversity statistics at both the farm andcommunity levels. Overall, the study encompassed an area of 63,600ha planted with the target crops. Traditional varieties dominatedthe planting at most of the sites (from 80% to 100% of the total croparea). The exception was rice, where the range was from 7% to100% across the six sites (see SI). Across all crops, farmers on
average grew more than one traditional variety, because the overallaverage richness per farm was 1.82. The on-farm richness oftraditional varieties ranged from 1.38 to 4.25 per household. At thecommunity level, the richness indices indicated that communitiesharbored a large number of varieties. The mean number of varietiesper community ranged from 4 (durum wheat) to 60 (cassava). Thenumber of varieties differed significantly within and among coun-tries (estimates for individual countries and crops are given in SI).For example, rice richness in Vietnam varied from 9 to 74 varietiesper community.
There was appreciable evenness at the farm level and particularlyat the community level. In general, farm evenness statistics indi-cated that farm diversity is not made up of one dominant and othervery rare varieties. Instead, any two samples drawn at random at thefarm level differed in varietal source in 25% of the cases. Evennessat the community level was impressively high, with a mean of 0.70.The last column in Table 2 lists the estimates of divergence. Thismeasure reflects the potential of any two randomly chosen house-holds within the same community to grow different varieties andranged from 0.25 to 0.81, depending on the crop.
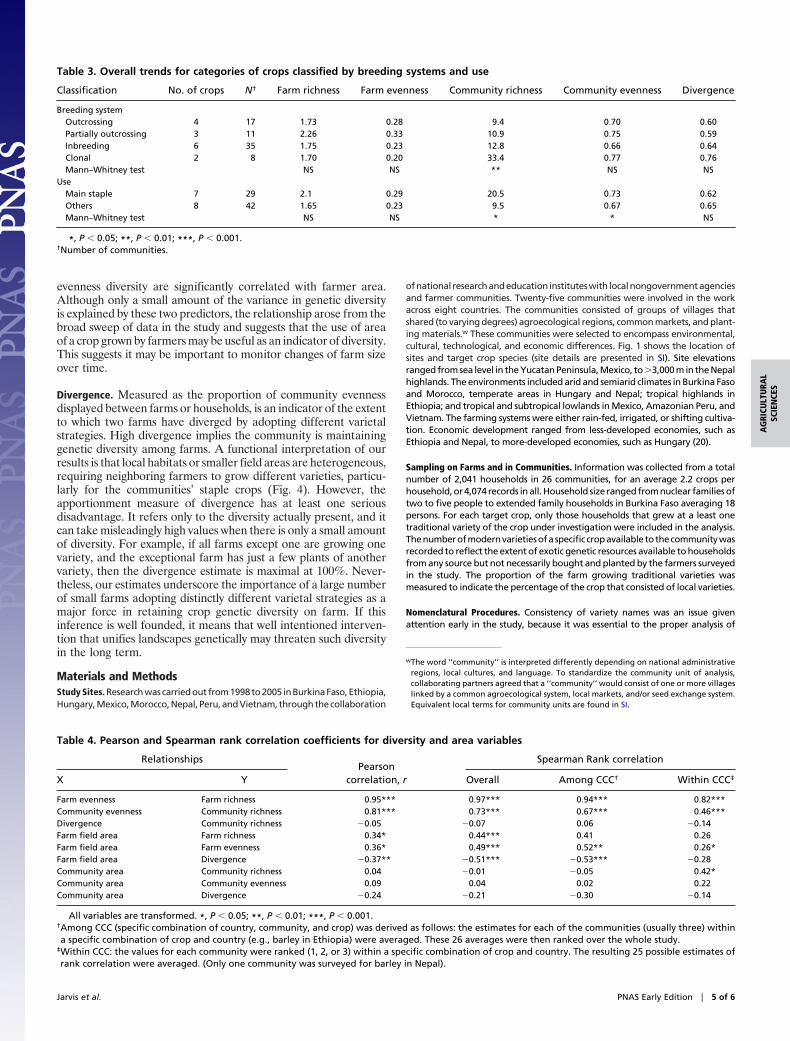
Patterns Among Categories of Crop Species. The 27 crops specieswere grouped into four broad categories of breeding system and twoof crop use (Table 1). Table 3 gives the averages of the diversitymeasures for these categories. At the farm level, the categories didnot differ significantly for diversity. However, at the communitylevel, significant differences in community richness were found,with variety richness for clonal species much higher than the othersystems (Table 3). The major staples had higher richness andevenness than the nonstaples, a difference significant at the com-munity level. No significant differences were found in divergenceamong either breeding systems or use types. Clonally propagatedcrops had high richness for a given evenness, whereas outcrossing
Fig. 1. Map showing location of study areas for the crops included (site details are presented in SI).
2 of 6 � www.pnas.org�cgi�doi�10.1073�pnas.0800607105 Jarvis et al.

and partially outcrossing crops tended to have more even frequen-cies across communities.
Relationships Among Diversity Measures. Table 4 summarizes therelationships among the three measures of diversity (richness,evenness, and divergence) inter se and their relationship with croparea. Figs. 2–4 display three of these relationships. Richness andevenness were highly correlated at both the farm and communitylevels (Table 4; Figs. 2 and 3). Over the whole study, the correlationbetween farm richness and evenness accounted for �94% of thevariance, although it was closer at the farm than at the communitylevel. The richness–evenness relationship was also mirrored in theSpearman rank correlation coefficients (12), computed for theoverall data, for among and within the 26 combinations of individ-ual crops in each country. Figs. 2 and 3 plot the regression ofrichness on evenness at the farm and community levels, bothvariables transformed to a logarithm scale. The fit is linear (P �0.0001 and P � 0.1000, respectively). The implications of this majorresult are discussed below.
Fig. 2 graphs the data points coded whether the crop is typed asa staple or nonstaple species (Table 1). A contingency �2 testrevealed that staples were significantly (P � 0.0012) more oftenlocated above the line (i.e., had excess richness for a given Simpsonvalue) compared with nonstaple crops. There was no such patternamong breeding systems at the farm level. In contrast, Fig. 3displays the data points according to breeding system. Crops withan open breeding system (partial to complete outcrossing) weresignificantly (P � 0.028) more often located below the line thaninbreeders and clonals, implying the latter crops had higher richnessfor a given Simpson index. At the community level, there was nosignificant effect on use type.
Field-Size Effects. In biodiversity assessment in general, area vari-ables have been proposed as surrogate indicators of diversity (13).Table 4 gives the overall correlations between the area growing a
particular crop on a farm and the diversity measures. Althoughlarger fields tended on average to have higher varietal diversity, therelationship between area and divergence was negative (Fig. 4).Communities having smaller farm-field areas showed more differ-entiation in varietal composition than those with larger areas. Fig.4 codes the data points for breeding systems and shows the trendfor field size to be larger for crops with more open breeding. As well,staples were significantly (P � 0.024) more likely to lie above thefitted regression of richness on area.
DiscussionLandrace Diversity on Farm. This study is based on a wide range ofcrops species growing in traditional agroecosystems. The farmswere sampled to represent a broad picture of the varietal diversityon �63,600 ha. Perhaps the most remarkable finding is that farmerswho chose to grow traditional varieties more often than not aregrowing more than one variety of crop, presumably a deliberatechoice for diversity. Moreover, the average Simpson index diversityat the farm level is 0.26, equivalent in a two-varietal system to afrequency for the dominant type of �0.85. In addition, communityrichness (omitting cassava) is 8-fold that of farm richness, a resultthat underscores the importance of the divergence between farmswithin the local community.
There has been serious debate about the variety names as a basisfor arriving at estimates at variety numbers and richness values (4,14). In part, the issues resemble the problems associated with usingspecies occurrences and density in conservation decisions fornatural communities (15). Two issues are that the reliability ofnames as indicators of population ancestry is likely to decrease asthe geographic scale of sampling increases, and that pairs ofpopulations of a crop differing in name are not equally divergentgenetically. The hierarchical approach adopted here (i.e., surveyingfarms within communities) gives a framework for testing thecorrespondence between named varieties and actual genetic diver-gence for specific crop–country situations (16). Yet, apart from
Table 1. Rational and procedure defining units of diversity in 27 crops species by eight countries
Crop Country
Variety name – units ofdiversity relationship
(A, B, C)*Breeding system
Cl, In, Po, Oc†
Major starchsource
Barley (Hordeum vulgare) Nepal A In YesRice (Oryza sativa) Nepal, Vietnam A In YesFinger millet (Eleusine coracana) Nepal A InBean‡ (Phaseolus vulgaris, Phaseolus lunatis, Vigna
unguiculata)Burkina Faso,
Mexico, PeruA In
Peanut (Arachis hypogaea) Burkina Faso, Peru A InOkra (Abelmoschus esculentus) Burkina Faso A OcSquash (Cucurbita maxima, Cucurbita mixta, Cucurbita
moschata, Cucurbita pepo, Luffa cylindrica)Mexico, Nepal§ A Oc
Chili (Capsicum annuum, Cucurbita chinense,Cucurbita baccatum, Cucurbita pubescens,Cucurbita frutescens)
Peru*, Mexico A Po
Taro (Colocasia esculenta, Xanthosoma spp.) Nepal, Vietnam A ClBarley (Hordeum vulgare) Ethiopia, Morocco B In YesDurum wheat (Triticum durum) Morocco B In YesPearl millet (Pennisetum glaucum) Burkina Faso B Oc YesBean (Phaseolus vulgaris) Hungary§ B InMaize (Zea mays) Mexico, Peru C Oc YesSorghum (Sorgum bicolor) Burkina Faso C Po YesFaba bean (Vicia faba) Morocco C PoCassava (Manihot esculenta) Peru C Cl Yes
*A, variety names (names used direction as the units farmers manage); B, variety names underestimate the units farmers are using to manage diversity; C, varietynames both overestimated (different names for the same variety) for some varieties and underestimated (same name for different varieties) for other varieties.See Sadiki et al. (14) and SI for further details of variety names and units of diversity relationships.
†Cl, clonal; In, inbreeding; Po, partially outcrossing; Oc, outcrossing.‡Beans (common bean, lima bean, and cowpea), chili, squash. and taro are managed as crop complexes. Each of these crop complexes occupy the same ecologicaland cultural niche, respectively, and are considered by farmers as a single crop types.
§Average household area planted to traditional varieties of the crop is �50 m2 (i.e., crop managed as few plants in home gardens).
Jarvis et al. PNAS Early Edition � 3 of 6
AG
RICU
LTU
RAL
SCIE
NCE
S
being convenient variables to tabulate on a broad scale, varietynames have additional advantages for use in summary measures ofdiversity. First, they focus attention on farmers themselves as keyfactors in maintaining crop diversity. Second, farmer managementof the diversity is itself in part a self-adapting system (17). Forexample, the belief that a named recognizable population isadapted to a particular soil or disease regime leads to particularactions by farmers based on that belief. This is likely to set up apowerful selection routine that will work to improve that populationfor the farmers’ preferred trait and lead to a self-sustaining system.
Richness–Evenness Relationship. The close linear relationship be-tween traditional variety richness and evenness, empirically derivedhere from data spanning a wide range of crops and countries, isimportant from two perspectives. First, it implies that estimates ofrichness can be approximated by those of evenness. Richness is thediversity statistic of most importance in conservation. However, ithas the drawback that it inherently depends on sample size, butevenness can be estimated from small samples. The finding of aclose overall relationship between the two measures means that onestatistic, appropriately transformed, can be used for an approxi-mation of the other. Although richness is known to contribute toSimpson measures (9, 10), the standardized variance of frequencies(i.e., evenness) is a substantial component. Hence, the Simp-son index receives ecologists’ support as a measure of evennessdiversity.
Second, the deviation of any bivariate point from the line itselfcarries potentially important information for conservation man-agement. Departures above the line indicate above-average rich-ness for a given evenness and suggest the dominance of one varietywith much of the richness held in low frequencies. Departures belowthe line indicate a comparatively more even distribution of types.Such departures may provide a starting point for the developmentof testable hypotheses on the different social, economic, or envi-ronmental factors affecting the relationship. For example, staplecrops had high richness or high dominance (Fig. 2) and highinsurance diversity (diversity for future use), as might be supposedfor the main crop of the farm, whereas the trend for nonstaples wasto higher evenness and higher diversity for immediate use.
The comparison of richness and evenness values across awide range of crops and continents can lead to a global averagerelationship of richness and evenness at household and com-munity levels, particularly for areas where local crop geneticdiversity dominates the landscape. It is of interest to ask whatthe relationship might be for a specific model, analogous to thecomparison of the richness–evenness relationship for DNAdiversity (e.g., the Tajima test) or in species abundancedistributions of ‘‘neutral ecology’’ (18, 19). Fitting a neutral‘‘function’’ to the traditional-variety diversity relationshipswould provide an additional benchmark from which to assessstanding diversity on farm. High dominance, with much of therichness held at low frequencies, indicates a managementstrategy for diversity maintained as an insurance to meetfuture environmental changes or social and economic needs.However, an even frequency distribution of varieties impliesthat farmers are selecting varieties to service a diversity ofspecific current needs and purposes. The difference betweenthe two situations has implications for the use and conserva-tion of traditional-variety diversity.
Area as a Predictor of Diversity. In considering variables that mightbe useful as indicators of genetic diversity, Brown and Brubaker(17) suggested that the area planted to a specific crop, an approx-imation of population size, could serve as an indicator of geneticdiversity for temporal and spatial comparisons for any crop withina particular agricultural production system. That suggestion paral-lels the species diversity–area relationships that are well known incommunity ecology (12). In this present study, both richness andTa
ble
2.C
om
mu
nit
yan
dh
ou
seh
old
area
stat
isti
csan
des
tim
ates
of
div
ersi
tyfo
rtr
adit
ion
alva
riet
ies
incr
op
s
Cro
p
Tota
lco
mm
un
ity
area
dev
ote
dto
the
cro
p,*
ha
Mea
nco
mm
un
ity
per
cen
tfa
rmar
ead
evo
ted
totr
adit
ion
alva
riet
ies,
%
Nu
mb
ero
fh
ou
seh
old
s(o
rfa
rms)
(to
tal�
4,07
4)
Ave
rag
ear
eafo
rtr
adit
ion
alva
riet
ies,
†h
a
Ran
ge
of
com
mu
nit
ym
ean
so
ffa
rmar
eas
for
trad
itio
nal
vari
etie
s,h
aA
vg.f
arm
rich
nes
sA
vg.f
arm
even
nes
s‡C
om
mu
nit
yri
chn
ess
Co
mm
un
ity
even
nes
s‡A
vera
ge
div
erg
ence
Ric
e22
,182
3877
70.
200.
035–
0.35
2.18
0.25
34.8
30.
770.
67B
arle
y10
,790
9830
80.
790.
12–1
.86
1.39
0.16
6.33
0.60
0.72
Mai
ze8,
588
9744
91.
830.
72–3
.68
1.57
0.18
8.50
0.60
0.68
Cas
sava
4,18
310
015
90.
480.
26–0
.63
2.05
0.33
60.3
30.
960.
66Fa
ba
bea
n3,
825
100
871.
290.
76–1
.76
1.77
0.28
6.50
0.68
0.60
Du
rum
wh
eat
3,06
482
354
0.34
0.35
–1.6
71.
490.
213.
500.
570.
64B
ean
s2,
642
9852
40.
740.
0015
–0.7
91.
800.
278.
920.
630.
58Pe
arlm
illet
2,36
510
049
0.76
0.56
–0.9
92.
420.
4712
.67
0.86
0.46
Pean
ut
2,17
610
096
0.51
0.22
–1.0
91.
690.
247.
500.
700.
64So
rgh
um
1,81
110
052
1.25
0.95
–1.7
24.
250.
6923
.33
0.91
0.25
Squ
ash
1,41
710
056
21.
000.
0004
–3.0
51.
510.
228.
010.
660.
63O
kra
265
100
510.
360.
309–
0.39
72.
220.
4810
.00
0.80
0.40
Fin
ger
mill
et24
810
033
70.
090.
036–
0.20
1.38
0.15
14.0
00.
670.
76C
hili
3010
017
50.
100.
0001
–0.1
91.
420.
166.
170.
700.
76Ta
ro24
100
361
0.03
0.00
69–0
.053
1.44
0.12
17.2
00.
650.
81W
eig
hte
dav
erag
e1.
820.
2614
0.70
0.63
*In
clu
des
tota
lare
ao
ftr
adit
ion
alan
dm
od
ern
vari
etie
s.† T
hes
eav
erag
esex
clu
de
the
farm
sw
ith
�50
m2
(i.e
.,h
om
eg
ard
ens)
.‡ T
hes
eav
erag
esar
eth
eco
mp
lem
ent
of
the
rele
van
tSi
mp
son
ind
ices
(SI)
.
4 of 6 � www.pnas.org�cgi�doi�10.1073�pnas.0800607105 Jarvis et al.
evenness diversity are significantly correlated with farmer area.Although only a small amount of the variance in genetic diversityis explained by these two predictors, the relationship arose from thebroad sweep of data in the study and suggests that the use of areaof a crop grown by farmers may be useful as an indicator of diversity.This suggests it may be important to monitor changes of farm sizeover time.
Divergence. Measured as the proportion of community evennessdisplayed between farms or households, is an indicator of the extentto which two farms have diverged by adopting different varietalstrategies. High divergence implies the community is maintaininggenetic diversity among farms. A functional interpretation of ourresults is that local habitats or smaller field areas are heterogeneous,requiring neighboring farmers to grow different varieties, particu-larly for the communities’ staple crops (Fig. 4). However, theapportionment measure of divergence has at least one seriousdisadvantage. It refers only to the diversity actually present, and itcan take misleadingly high values when there is only a small amountof diversity. For example, if all farms except one are growing onevariety, and the exceptional farm has just a few plants of anothervariety, then the divergence estimate is maximal at 100%. Never-theless, our estimates underscore the importance of a large numberof small farms adopting distinctly different varietal strategies as amajor force in retaining crop genetic diversity on farm. If thisinference is well founded, it means that well intentioned interven-tion that unifies landscapes genetically may threaten such diversityin the long term.
Materials and MethodsStudy Sites. Researchwascarriedout from1998to2005 inBurkinaFaso,Ethiopia,Hungary, Mexico, Morocco, Nepal, Peru, and Vietnam, through the collaboration
ofnational researchandeducation instituteswith localnongovernmentagenciesand farmer communities. Twenty-five communities were involved in the workacross eight countries. The communities consisted of groups of villages thatshared (to varying degrees) agroecological regions, common markets, and plant-ing materials.w These communities were selected to encompass environmental,cultural, technological, and economic differences. Fig. 1 shows the location ofsites and target crop species (site details are presented in SI). Site elevationsranged from sea level in the Yucatan Peninsula, Mexico, to �3,000 m in the Nepalhighlands. The environments included arid and semiarid climates in Burkina Fasoand Morocco, temperate areas in Hungary and Nepal; tropical highlands inEthiopia; and tropical and subtropical lowlands in Mexico, Amazonian Peru, andVietnam. The farming systems were either rain-fed, irrigated, or shifting cultiva-tion. Economic development ranged from less-developed economies, such asEthiopia and Nepal, to more-developed economies, such as Hungary (20).
Sampling on Farms and in Communities. Information was collected from a totalnumber of 2,041 households in 26 communities, for an average 2.2 crops perhousehold, or 4,074 records in all. Household size ranged from nuclear families oftwo to five people to extended family households in Burkina Faso averaging 18persons. For each target crop, only those households that grew at a least onetraditional variety of the crop under investigation were included in the analysis.Thenumberofmodernvarietiesofaspecificcropavailable tothecommunitywasrecorded to reflect the extent of exotic genetic resources available to householdsfrom any source but not necessarily bought and planted by the farmers surveyedin the study. The proportion of the farm growing traditional varieties wasmeasured to indicate the percentage of the crop that consisted of local varieties.
Nomenclatural Procedures. Consistency of variety names was an issue givenattention early in the study, because it was essential to the proper analysis of
wThe word ‘‘community’’ is interpreted differently depending on national administrativeregions, local cultures, and language. To standardize the community unit of analysis,collaborating partners agreed that a ‘‘community’’ would consist of one or more villageslinked by a common agroecological system, local markets, and/or seed exchange system.Equivalent local terms for community units are found in SI.
Table 3. Overall trends for categories of crops classified by breeding systems and use
Classification No. of crops N† Farm richness Farm evenness Community richness Community evenness Divergence
Breeding systemOutcrossing 4 17 1.73 0.28 9.4 0.70 0.60Partially outcrossing 3 11 2.26 0.33 10.9 0.75 0.59Inbreeding 6 35 1.75 0.23 12.8 0.66 0.64Clonal 2 8 1.70 0.20 33.4 0.77 0.76Mann–Whitney test NS NS ** NS NS
UseMain staple 7 29 2.1 0.29 20.5 0.73 0.62Others 8 42 1.65 0.23 9.5 0.67 0.65Mann–Whitney test NS NS * * NS
*, P � 0.05; **, P � 0.01; ***, P � 0.001.†Number of communities.
Table 4. Pearson and Spearman rank correlation coefficients for diversity and area variables
RelationshipsPearson
correlation, r
Spearman Rank correlation
X Y Overall Among CCC† Within CCC‡
Farm evenness Farm richness 0.95*** 0.97*** 0.94*** 0.82***Community evenness Community richness 0.81*** 0.73*** 0.67*** 0.46***Divergence Community richness �0.05 �0.07 0.06 �0.14Farm field area Farm richness 0.34* 0.44*** 0.41 0.26Farm field area Farm evenness 0.36* 0.49*** 0.52** 0.26*Farm field area Divergence �0.37** �0.51*** �0.53*** �0.28Community area Community richness 0.04 �0.01 �0.05 0.42*Community area Community evenness 0.09 0.04 0.02 0.22Community area Divergence �0.24 �0.21 �0.30 �0.14
All variables are transformed. *, P � 0.05; **, P � 0.01; ***, P � 0.001.†Among CCC (specific combination of country, community, and crop) was derived as follows: the estimates for each of the communities (usually three) withina specific combination of crop and country (e.g., barley in Ethiopia) were averaged. These 26 averages were then ranked over the whole study.
‡Within CCC: the values for each community were ranked (1, 2, or 3) within a specific combination of crop and country. The resulting 25 possible estimates ofrank correlation were averaged. (Only one community was surveyed for barley in Nepal).
Jarvis et al. PNAS Early Edition � 5 of 6
AG
RICU
LTU
RAL
SCIE
NCE
S

diversity data. Thus, we recorded the name each farmer gave to each variety,togetherwiththedescriptors thefarmerusedtorecognizethevariety inquestionand distinguish it from others (21). These sets of traits, together with the namesand traits used by different farmers, photos of varieties, and, in some cases,common garden plots of all local varieties, were used to arrive at the ‘‘basicdiversity units’’ for each crop. The diversity units were based on agreementamong farmers that the units at hand were different. The process of arriving atdistinguishable units included the removal of duplicates (i.e., two varieties withdifferent names that the farmers agreed were actually the same items) andseparating larger units into discrete units (i.e., two varieties referred to with thesame name by two or more different farmers but recognized as different units).Sadiki et al. (16) give specific details, and Jarvis and Campilan (22) provideguidelines on how this was done for different crops (see SI for supportingliterature for the establishment of basic diversity units by country and projectcrop). These ‘‘basic diversity units’’ were used in this study to calculate richness.
Area Planted. The area planted with each variety was estimated by using localarea measurements, converted to square meters and hectares. The area growingboth modern and traditional varieties was noted to calculate the total areaplanted with the crop and the proportion of the farm growing traditionalvarieties (data are presented in SI). Farms with no traditional varieties wereexcluded from averages. Although this biases some measures of diversity, theareas chosen for the studies were already those where such traditional varieties
wereprevalent.However, farmsthathavenotraditionalvarietiesofacropdonotcontribute information about levels and patterns of traditional variety diversity.The time period of the sample was the standing crop over 1 year. For cases wherethere were two cropping seasons, the land area was doubled. The area of homegarden crops, such as chili and squash in Nepal, for which farmers grew �10plants, was estimated by using leaf area covered (canopy) and was multiplied bythe number of plants grown on the farm. Following Magurran (10), we measuredevenness as the complement of d (� 1-D), where D is the Simpson measure ofdominance.x
Diversity Estimates. Averagefarmrichnesswascalculatedas theaveragenumberof traditional varieties per household, excluding households that grew no tradi-tional varieties. TheSimpson index itself is ameasureofdominance,and it ismoreconvenienttotabulate itscomplement(1-SI)as theestimateofevennessdiversity,including only farms that grew at least one traditional variety. The index isrelatively insensitive to the correct identification of rare varieties but assumes thecommoner varieties are reliably identified. Total community richness was calcu-lated by summing the number of distinct traditional varieties found acrossvillages in the community. Percentage divergence (i.e., the partition of diversitybetween and within farms) was calculated as the difference between communityandfarmindexvaluesdividedbythecommunitySimpsonindex[analogoustothegenetic divergence measures used by Hamrick and Godt (23)].
xSuppose the inverse of the coefficient of variation of variety frequencies is the basicconcept of evenness; then, the Simpson index of diversity includes a richness-diversitycomponent (9).
ACKNOWLEDGMENTS. This work was made possible through the input ofnumerousscientistsworldwide.WethankDr.StephenBrushforassistanceduringthe formulation stage of the work and Drs. Paul Hattersley, Brad Murray, andanonymousreviewers forcomments.Thisworkwassupportedbygrants fromtheSwiss Agency for Development and Cooperation (SDC), the Netherlands Direc-torate-General for International Cooperation (DGIS), the Bundesministerium furWirtschaftliche Zusammenarbeit/Deutsche Gesellschaft fur Technische Zusam-menarbeit (BMZ/GTZ), the Japanese International Cooperation Agency (JICA),the International Development and Research Center (IDRC) Canada, and thegovernments of Spain and Peru.
1. Bellon M, Pham J-L, Jackson MT (1997) in Plant Genetic Conservation: The In Situ Approach,eds Maxted, N, Ford-Lloyd BV, Hawkes, JG (Chapman and Hall, London), pp 261–289,
2. Fowler C, Hodgkin T (2005) Plant genetic resources for food and agriculture: assessingglobal availability. Annu Rev Env Resour 29:10.1–10.37.
3. BrushS(1995) Insituconservationoflandracesincentersofcropdiversity.CropSci35:346–354.4. Bretting PK, Duvick DN (1997) Dynamic conservation of plant genetic resources. Adv
Agron 61:1–51.5. Harlan JR (1975) Crops and Man (American Society of Agronomy and Crop Science Society
of America, Madison, WI), 1st Ed.6. Brush S (2004) Farmers’ Bounty: Locating Crop Diversity in the Contemporary World (Yale
Univ Press, New Haven, CT).7. Teshome A, Brown AHD, Hodgkin T (2001) Diversity in landraces of cereal and legume
crops. Plant Breed Rev 21:221–261.8. FoodandAgricultureOrganizationoftheUnitedNations(1998)TheStateoftheWorlds’Plant
Genetic Resources for Food and Agriculture (Food and Agriculture Organization, Rome).9. Frankel OH., Brown AHD, Burdon JJ (1995) The Conservation of Plant Biodiversity (Cam-
bridge Univ Press, Cambridge, UK).10. Magurran AE (2003) Measuring Biological Diversity (Blackwell, Oxford, UK).11. JarvisDI, T.HodgkinT (2000) in Genes in theField:On-FarmConservationofCropDiversity,
ed Brush SB (Lewis, Boca Raton, FL), pp 261–278.
12. Siegel S (1956) Nonparametric Statistics (McGraw–Hill, New York).13. MacArthur RH, Wilson EO (1967) The Theory of Island Biogeography (Princeton Univ Press,
Princeton, NJ).14. Perales HR, Benz BF, Brush SB (2005) Maize diversity and ethnolinguistic diversity in
Chiapas, Mexico. Proc Natl Acad Sci USA 102:949–954.15. Rieseberg LH, Wood TE, Baack EJ (2006) The nature of plant species. Nature 440:524–527.16. Sadiki M, et al. (2007) in Managing Biodiversity in Agricultural Ecosystems, eds Jarvis DI,
Padoch C, Cooper HD (Columbia Univ Press, New York), pp 34–76.17. Brown AHD, Brubaker CL (2001) in Managing Plant Genetic Diversity, eds Engels J, Brown
AHD, Jackson MT, Rao VR (CABI, Wallingford, UK), pp 249–262.18. McGill BJ (2003) A test of the unified neutral theory of biodiversity. Nature 422:881–885.19. Bell G (2001) Neutral macroecology. Science 293:2413–2418.20. Smale M (2006) Valuing Crop Biodiversity: On-Farm Genetic Resources and Economic
Change (CABI, Oxfordshire, UK).21. Jarvis DI, et al. (2000) A Training Guide for in Situ Conservation On-Farm (International
Plant Genetic Resources Institute, Rome), Ver 1.22. Jarvis DI, Campilan DM (2006) Crop Genetic Diversity to Reduce Pests and Diseases
On-Farm: Participatory Diagnosis Guidelines (Bioversity International, Rome), Ver 1.23. Hamrick JL, Godt MJW (1997) Allozyme diversity in cultivated crops. Crop Sci 37:26–30.
LN Farm Area (>50sqm) (=X)
4 6 8 10
0
1
2
3
4
5
Y = 3.87 - 3.22 * X
Fig. 4. Relationship between farm area and divergence, both on a logarithmscale. White, outcrossing; semifilled, partial outcrossing; gray, inbreeding; black,clonal.Thegraphexcludesfarmswith�50m2 perhousehold(i.e.,homegardens).
-LN Farm Simpson index (=X)
0.0 0.5 1.0 1.5 2.0
0.0
0.5
1.0
1.5
2.0
Y = 0.13 + 1.19 * X
Fig. 2. Relationship between farm evenness and farm richness, both on alogarithm scale. Black, main staple; gray, nonmain staple; 2 � 2 contingency� (P � 0.03).
-LN Community Simpson index (=X)
0 1 2 3 4 5
0
1
2
3
4
5
Y = 1.04 + 0.88 * X
Fig. 3. Relationship between community evenness and community richness,both on a logarithm scale. White, outcrossing; semifilled, partial outcrossing;gray, inbreeding; black, clonal.
6 of 6 � www.pnas.org�cgi�doi�10.1073�pnas.0800607105 Jarvis et al.