A QTL for flowering time in Arabidopsis reveals a novel allele of CRY2
Upload
independentCategory
view
2download
0
Fa(
Ma
b
c
a
ARRA
KACKHPPSS
1
g(mapfnabcabaot(
0d
Annals of Anatomy 194 (2012) 74– 81
Contents lists available at SciVerse ScienceDirect
Annals of Anatomy
journa l h o mepage: www.elsev ier .de /aanat
rom genes to phenotypes – Evaluation of two methods for the SNP analysis inrchaeological remains: Pyrosequencing and competitive allele specific PCRKASPar)
elanie Pruvosta,b,∗, Monika Reissmannc, Norbert Beneckeb, Arne Ludwiga
Leibniz-Institute for Zoo and Wildlife Research, RG Evolutionary Genetics, 10252 Berlin, GermanyGerman Archaeological Institute, Im Dol 4-6, 14165 Berlin, GermanyHumboldt University Berlin, Department for Crop and Animal Sciences, Invalidenstraße 42, 10115 Berlin, Germany
r t i c l e i n f o
rticle history:eceived 14 January 2011eceived in revised form 7 October 2011ccepted 8 October 2011
eywords:ncient DNA
a b s t r a c t
The amplification length of the DNA fragments is one major limitation of most paleogenetic analy-ses. Routinely, only fragments below 200 bp can be amplified, significantly reducing the content ofgenetic information. Although overlapping PCR strategies and next generation sequencing techniqueshave strongly improved data mining recently, these methods are still expensive and time consuming. Incontrast, SNP analyses are easy to handle, fast and cheap. In this study, we compare two methods of SNPdetection as to efficiency, cost and reliability for their use in ancient DNA applications: pyrosequenc-ing and competitive allele specific PCR (KASPar). Our sample set consisted of 16 horse bones from two
oat colorASParorsealeogeneticsyrosequencingingle nucleotide polymorphisms
Scythian graves (600–800 BC). In conclusion, both approaches produced reliable results for most allelicpatterns. But an indel of 11 bp (ASIP) could not be detected in the KASPar approach and produced prob-lems in the pyrosequencing method (70% success rate). In such cases, we recommend checking allelicdistribution using a gel approach or capillary sequencing. Overall, in comparison with the traditionalmode of ancient DNA investigations (PCR, cloning, capillary sequencing), both approaches are superiorfor SNP analyses especially of large sample sets.
NP
. Introduction
Originally, mitochondrial (mt) DNA was the predilection tar-et of ancient DNA studies from their beginning in the eightiesHiguchi et al., 1987) because multi copy mtDNA is highly variable,
aternally inherited, neutrally selected and often better preserveds single copy nuclear DNA. In particular the high copy numberer cell simplifies the analysis of mtDNA in small quantities, oftenound in degraded endogenous DNA (Pääbo et al., 2004). However,early all selective traits which are responsible for phenotypic vari-tion are coded in the nuclear genome. Shifts in trait markers cane valuable indicators for alterations in both natural selection (e.g.limatic shifts causing changes of forest coverage or nutrition) orrtificial selection (e.g. domestication). Consequently, evolutionaryiologists, archaeologists and historians are very interested in thenalysis of trait markers. The rapid development in molecular biol-
gy techniques during the last 10 years put the analysis of selectiverait markers within the range of possibility for ancient DNA studiesRömpler et al., 2006a; Lalueza-Fox et al., 2007; Ludwig et al., 2009).∗ Corresponding author.E-mail address: [email protected] (M. Pruvost).
940-9602/$ – see front matter © 2011 Elsevier GmbH. All rights reserved.oi:10.1016/j.aanat.2011.10.007
© 2011 Elsevier GmbH. All rights reserved.
Besides other traits, coat color is a major characteristic of eachphenotypic expression. Coat colors are of manifold importancefor animals; e.g. for camouflage, UV-protection, parasite defense,mate choice under natural conditions as well as in the case ofdomesticated animals for religious, cultural and monetary reasons.Although more than 300 genes and associated loci have been iden-tified so far, often point mutations or short indels of a few base pairsare responsible for the expression of specific phenotypes (Rieder,2009; Cieslak et al., 2011) and therefore they are particularly suit-able for ancient DNA analyses based on SNPs.
Here we evaluate the pros and cons of the two methods -pyrosequencing and KASPar for the detection of coat-color poly-morphisms in archaeological remains for six coat color associatedgenes. The archaeological bones used in this evaluation are from 16horse skeletons buried in the graves Arzan 1 and Arzan 2 from theTuva region, South Siberia, dated from 800 BC and 600 BC (Table 1).
2. Material and methods
2.1. Samples
We genotyped 16 domesticated horses from Arzan 1 (n = 2;Samples ARZ1-2 and ARZ1-3) and Arzan 2 (n = 14) (Table 1). Both
M. Pruvost et al. / Annals of Anatomy 194 (2012) 74– 81 75
Table 1Results and efficiency of pyrosequencing and KASPar for the detection of coat-color SNPs. The genotype and the corresponding phenotype are described for each samplesanalyzed. Below each SNP, success rates are indicated for both the methods using the automatic and manual genotyping detection system.
Samples Date Phenotype Genotype
Color Spottingpattern
Dilution ASIP KIT-I16 MATP MC1R SILV11 SLC36A1
ARZ1-2 800BC Chestnut No No A/a sb1/sb1 C/C e/e z/z Ch/ChARZ1-3 800BC Black No Silver a/a sb1/sb1 C/C E/e Z/z Ch/ChARZ1 600BC Bay No No A/a sb1/sb1 C/C E/E z/z Ch/ChARZ2 600BC Black No No a/a sb1/sb1 C/C E/e z/z Ch/ChARZ3 600BC Chestnut No No A/A sb1/sb1 C/C e/e z/z Ch/ChARZ5 600BC Chestnut No No A/a sb1/sb1 C/C e/e z/z Ch/ChARZ6 600BC Bay No No A/a sb1/sb1 C/C E/e z/z Ch/ChARZ7 600BC Black No No a/a sb1/sb1 C/C E/e z/z Ch/ChARZ8 600BC Bay No Cream A/a sb1/sb1 C/cr E/e z/z Ch/ChARZ9 600BC Bay No Cream A/a sb1/sb1 C/cr E/e z/z Ch/ChARZ10 600BC Chestnut No No A/a sb1/sb1 C/C e/e z/z Ch/ChARZ12 600BC Chestnut No No A/a sb1/sb1 C/C e/e z/z Ch/ChARZ13 600BC Chestnut No No A/a sb1/sb1 C/C e/e z/z Ch/ChARZ14 600BC Bay No No A/A sb1/sb1 C/C E/e z/z Ch/Ch
Success rate KASPar detection Auto None 0% 0% 98,3% 100% 0%l
l
lsiob2teeSBeTfAbouC
2
Mi(t(
2
n
plex PCR was then realized under different conditions regarding
TVb
ManuaPyrosequencing Auto
Manua
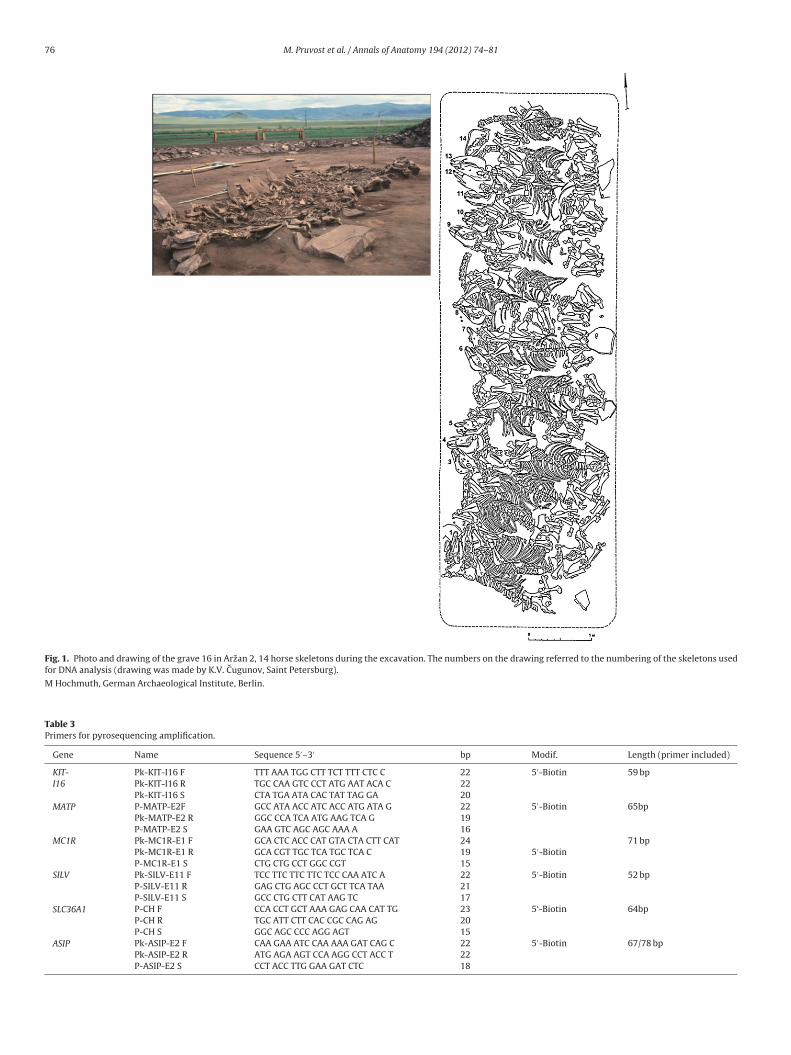
ocations are 3 km apart and present complete well preservedkeletons buried side by side (Fig. 1). Both locations are locatedn the Tuva region (South Siberia). The Kurgan Arzan 2 consistedf a platform built from stone slabs which we now assume aseing typical for the early Scythian period. The tumulus at Arzan
had a diameter of nearly 80 m and was more than 2 m high,hus being slightly smaller than Arzan 1. Arzan is famous for thearliest Scythian remains in Eurasia (Kurgan Arzan 1). This sitenabled archaeologists to define a whole new horizon of the earliestcythian phase which dates to the late 9th and early 8th centuryC and can be linked to the latest Bronze Age contexts in West-rn Siberia and the North Pontic steppe region (Parzinger, 2010).he skeletons of the 14 horses from Arzan 2 were complete there-ore we can assure that each bone corresponds to one individual.ll of them were morphologically and genetically determined toe as male (Benecke et al., 2010). The quality of DNA preservationf the samples was assessed by mtDNA amplification (PCR prod-cts including primers varied in length between 178 bp and 108 bp,ieslak et al., 2010).
.2. Coat color genes
We selected six coat color mutations located in six genes (ASIP,C1R, SILV, SLC36A1, MATP, KIT) for detecting the phenotypes
ncluding the basic coloration (bay, black or chestnut), dilutionssilver, champagne and cream) as well as one spotting pheno-ype (sabino). Mutations and primers were previously publishedLudwig et al., 2009).
.3. Ancient DNA extraction
DNA was extracted using 250–400 mg bone tissue. Exter-al surfaces of bones were removed by abrasion to minimize
able 2alidation of KASPar assays. The table shows the different fluorescence levels observedackground for each allele and the average level of the negative control.
Gene SNP Allele 1 Allele 2
Allele background Allele
MC1R C/T 0.68–1.06 0.5 0.58–0.82MATP G/A 0.82–0.88 0.35 0.64–0.87KIT-I16 A/T – 0.24 0.58–0.82SILV C/T 0.78–1.14 0.27 0.53–0.58SLC36A1 C/G 0.89–1.08 – –
None 100% 100% 98,3% 100% 100%70% 100% 100% 100% 100% 100%100% 100% 100% 100% 100% 100%
environmental contaminations. Each sample was ground to pow-der with a freezer mill and incubated in 0.45 M EDTA (pH 8.0) and0.25 mg/ml Proteinase K overnight at room temperature underrotation. After centrifugation for 5 min at 4000 rpm in a Universal320 centrifuge (Hettich), DNA was purified from the supernatantusing a silica based method as previously described (Rohland andHofreiter, 2007).
2.4. SNP analysis
SNP amplifications were performed using multiplex PCR (Krauseet al., 2006; Römpler et al., 2006b). PCR products for SNPs var-ied in length between 52 bp and 93 bp (including primers; seeTables 3 and 4, Ludwig et al., 2009). Four microliters of extract wereused for each multiplex PCR. The initial multiplex PCR was per-formed in a 20 �l reaction volume containing 1× AmpliTaq GoldPCR buffer II (ABI), 4 mM MgCl2, 1 mg/ml Bovine Serum Albumin(BSA), 250 �M of dATP, dCTP and dGTP, 500 �M of dUTP, 150 nMof each primer and 2 U of AmpliTaq Gold (ABI). For each sample,one PCR was performed by adding 1 U of heat-labile Uracil-DNAGlycosylase (USB) and an initial incubation step of 15 min at 37 ◦Cto minimize the risk of carry-over contamination. PCR productswere diluted 1/30 and 5 �l (total reaction volume 20 �l) wereused for the next step. PCR was run under the following condi-tions: denaturation and Taq activation at 94 ◦C for 9 min; 30 upto 35 cycles at 95 ◦C 20 s; at annealing temperature of 57 ◦C for30 s; 72 ◦C for 30 s and final extension 4 min for 72 ◦C. A single-
the SNP detection methods used as described below and in Fig. 2.Negative extraction controls and negative PCR controls were usedin each PCR. Amplification products were visualized on agarosegels.
for each SNP: the range for each allele, the maximum fluorescence value of the
H2O Valid
background A1 A2
0.37 0.01 0.15 Ok 0.26 −0.03 0.7 No specificity – −0.05 0.07 Ok 0.14 −0.05 0 Ok
0.43 0.1 0.0 Ok
76 M. Pruvost et al. / Annals of Anatomy 194 (2012) 74– 81
Fig. 1. Photo and drawing of the grave 16 in Arzan 2, 14 horse skeletons during the excavation. The numbers on the drawing referred to the numbering of the skeletons usedfor DNA analysis (drawing was made by K.V. Cugunov, Saint Petersburg).
M Hochmuth, German Archaeological Institute, Berlin.
Table 3Primers for pyrosequencing amplification.
Gene Name Sequence 5′–3′ bp Modif. Length (primer included)
KIT-I16
Pk-KIT-I16 F TTT AAA TGG CTT TCT TTT CTC C 22 5′-Biotin 59 bpPk-KIT-I16 R TGC CAA GTC CCT ATG AAT ACA C 22Pk-KIT-I16 S CTA TGA ATA CAC TAT TAG GA 20
MATP P-MATP-E2F GCC ATA ACC ATC ACC ATG ATA G 22 5′-Biotin 65bpPk-MATP-E2 R GGC CCA TCA ATG AAG TCA G 19P-MATP-E2 S GAA GTC AGC AGC AAA A 16
MC1R Pk-MC1R-E1 F GCA CTC ACC CAT GTA CTA CTT CAT 24 71 bpPk-MC1R-E1 R GCA CGT TGC TCA TGC TCA C 19 5′-BiotinP-MC1R-E1 S CTG CTG CCT GGC CGT 15
SILV Pk-SILV-E11 F TCC TTC TTC TTC TCC CAA ATC A 22 5′-Biotin 52 bpP-SILV-E11 R GAG CTG AGC CCT GCT TCA TAA 21P-SILV-E11 S GCC CTG CTT CAT AAG TC 17
SLC36A1 P-CH F CCA CCT GCT AAA GAG CAA CAT TG 23 5‘-Biotin 64bpP-CH R TGC ATT CTT CAC CGC CAG AG 20P-CH S GGC AGC CCC AGG AGT 15
ASIP Pk-ASIP-E2 F CAA GAA ATC CAA AAA GAT CAG C 22 5′-Biotin 67/78 bpPk-ASIP-E2 R ATG AGA AGT CCA AGG CCT ACC T 22P-ASIP-E2 S CCT ACC TTG GAA GAT CTC 18
M. Pruvost et al. / Annals of Anatomy 194 (2012) 74– 81 77
Table 4Primers for KASPar assay.
Gene Name Sequence 5′–3′ bp Pur Length sequence Length fragment
KIT-I16 SB1-A1 GAAGGTGACCAAGTTCATGCTATTTAAATGGCTTTCTTTTCTCCCCCA 48 HPLC 72 bp 93 bpSB1-A2 GAAGGTCGGAGTCAACGGATTTAAATGGCTTTCTTTTCTCCCCCT 45 HPLCSB1-C GATATTTCTGGCTGCCAAGTCCCTA 25 HPLC
SLC36A1 CH-A1 GAAGGTGACCAAGTTCATGCTGCTAAAGAGCAACATTGGCAC 42 HPLC 57 bp 80 bpCH-A2 GAAGGTCGGAGTCAACGGATTCTGCTAAAGAGCAACATTGGCAG 44 HPLCCH-C GCATTCTTCACCGCCAGAGGCA 22 HPLC
MATP MATP-A1 GAAGGTGACCAAGTTCATGCTCACCATGATAGGTGTGGTTCTCTTTA 47 HPLC 64bp 86 bpMATP-A2 GAAGGTCGGAGTCAACGGATTACCATGATAGGTGTGGTTCTCTTTG 46 HPLCMATP-C GCCCATCAATGAAGTCAGCAGCAAA 25 HPLC
MC1R MC1R-A1 GAAGGTGACCAAGTTCATGCTCTGCTGCCTGGCCGTGTC 39 HPLC 43 bp 67 bpMC1R-A2 GAAGGTCGGAGTCAACGGATTCATCTGCTGCCTGGCCGTGTT 42 HPLCMC1R-C GTTGCTCATGCTCACCAGCAGGT 23 HPLC
SILV SILV-A1 GAAGGTGACCAAGTTCATGCTAGCCCTGCTTCATAAGTCTGCG 43 HPLC 63 bp 85 bpSILV-A2 GAAGGTCGGAGTCAACGGATTGAGCCCTGCTTCATAAGTCTGCA 44 HPLC
2
MaAcua
SILV-C TCCATTGCTTACCAGTTTCCTTCTTCTT
.5. Pyrosequencing (primers see Table 4)
Singleplex PCRs contained 1× AmpliTaq Gold PCR Buffer II, 4 mMgCl2, 1 mg/ml bovine serum albumin (BSA), 250 �M of dATP, dCTP
nd dGTP, 500 �M of dUTP, 1.5 �M of each primer and 0.5 U of
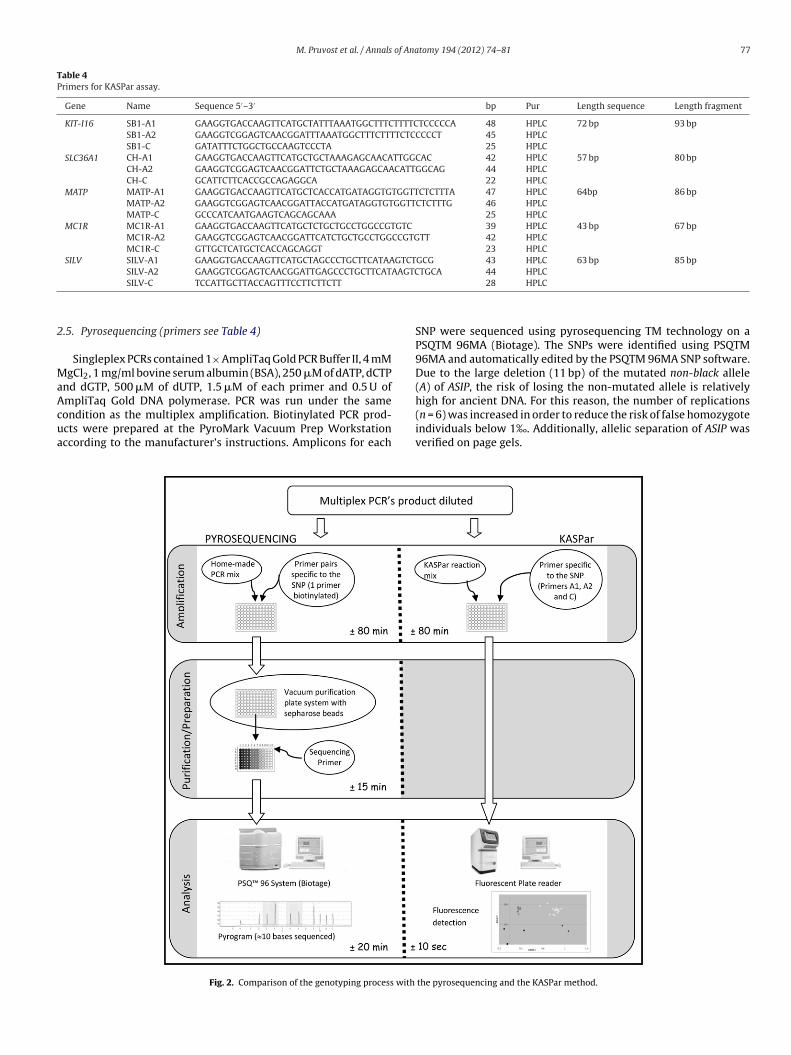
mpliTaq Gold DNA polymerase. PCR was run under the sameondition as the multiplex amplification. Biotinylated PCR prod-cts were prepared at the PyroMark Vacuum Prep Workstationccording to the manufacturer’s instructions. Amplicons for eachFig. 2. Comparison of the genotyping process with
28 HPLC
SNP were sequenced using pyrosequencing TM technology on aPSQTM 96MA (Biotage). The SNPs were identified using PSQTM96MA and automatically edited by the PSQTM 96MA SNP software.Due to the large deletion (11 bp) of the mutated non-black allele(A) of ASIP, the risk of losing the non-mutated allele is relatively
high for ancient DNA. For this reason, the number of replications(n = 6) was increased in order to reduce the risk of false homozygoteindividuals below 1‰. Additionally, allelic separation of ASIP wasverified on page gels.the pyrosequencing and the KASPar method.
7 of Ana
2
iACtcAtdriwcoonsS
2
rssdpal
ei
f
FaSc
8 M. Pruvost et al. / Annals
.6. KASPar (primers see Table 4)
The method uses an innovative fluorescent genotyping systemn assay mix that comprises two allele specific unlabeled primers1 and A2 (forward) and a complementary common reverse primer
(primers described in Table 4). Primer design was achieved usinghe Kbioscience service (www.kbioscience.co.uk). Primers (100 �Moncentration) are mixed together as a SNP specific assay mix (12 �l1 + 12 �l A2 + 30 �l C + 46 �l of water). Each SNP was typed in a
otal volume of 6 �l in the following reaction mixture: 5 �l of driediluted PCR product from the first step, 22 mM MgCl2, 3 �l 2× KASPeaction mix including KTaq, 0,1 �l SNP specific assay mix accord-ng to the manufacturer‘s guidelines (KBiosciences). Amplification
as performed in Applied Biosystems GeneAmp 9700 thermocy-lers running the following program: 94 ◦C for 15 min then 20 cyclesf 94 ◦C for 10 s, 57 ◦C for 5 s and 72 ◦C for 10 s, followed by 18 cyclesf 94 ◦C for 10 s, 57 ◦C for 20 s and 72 ◦C for 40 s. Fluorescence scan-ing of the reactions was done in a StepOnePlus Real Time PCRystem (Applied Biosystems) and the results were interpreted bytepOne Software v2.1 (Applied biosystems).
.7. Authentication
DNA sampling, extractions and pre-PCR preparations were car-ied out in a laboratory dedicated to ancient DNA following thetandard procedures to avoid contamination. All the multiplex andingleplex PCRs were set up in the ancient DNA laboratory but theilution of PCR products following the multiplex and their incor-oration to the singleplex were done in a dedicated room in annnexed building. Post-PCR analyses were carried out in a differentaboratory.
All results were replicated at least three times for each method
xcept for the ASIP SNPs from which the number of replications wasncreased to six times (see pyrosequencing section).Two negative PCR controls and a blank extraction were per-ormed every eight samples. Due to the small size of the amplified
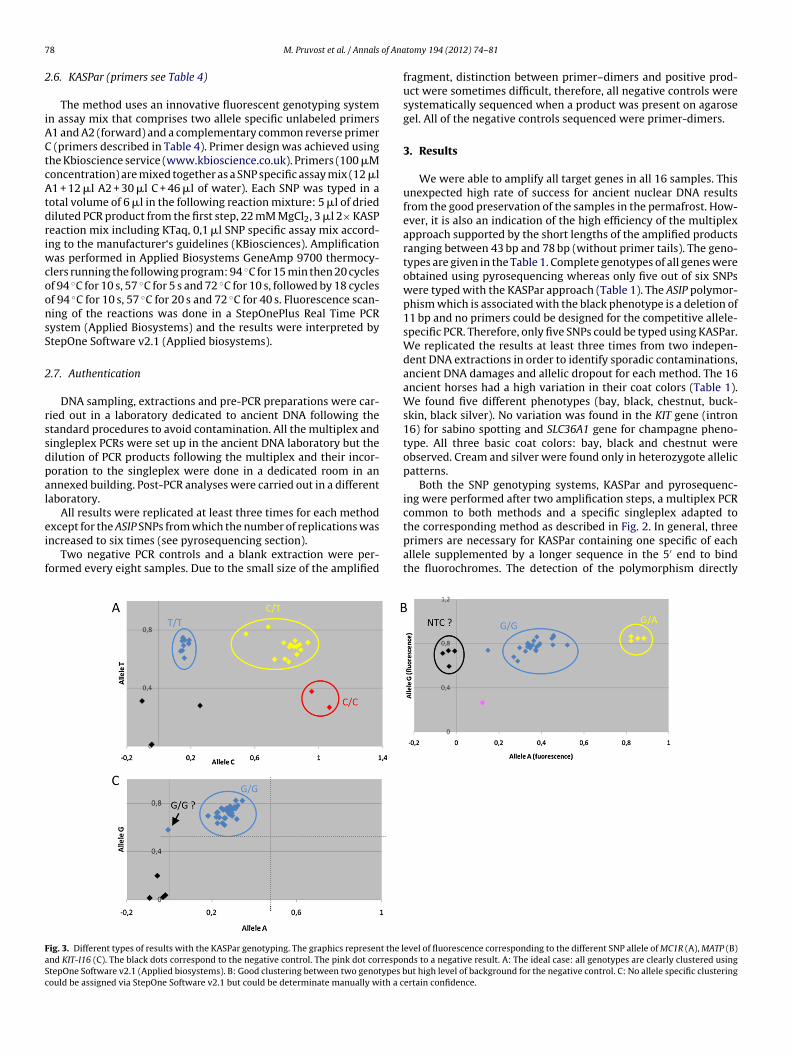
ig. 3. Different types of results with the KASPar genotyping. The graphics represent the lnd KIT-I16 (C). The black dots correspond to the negative control. The pink dot correspotepOne Software v2.1 (Applied biosystems). B: Good clustering between two genotypes bould be assigned via StepOne Software v2.1 but could be determinate manually with a c
tomy 194 (2012) 74– 81
fragment, distinction between primer–dimers and positive prod-uct were sometimes difficult, therefore, all negative controls weresystematically sequenced when a product was present on agarosegel. All of the negative controls sequenced were primer-dimers.
3. Results
We were able to amplify all target genes in all 16 samples. Thisunexpected high rate of success for ancient nuclear DNA resultsfrom the good preservation of the samples in the permafrost. How-ever, it is also an indication of the high efficiency of the multiplexapproach supported by the short lengths of the amplified productsranging between 43 bp and 78 bp (without primer tails). The geno-types are given in the Table 1. Complete genotypes of all genes wereobtained using pyrosequencing whereas only five out of six SNPswere typed with the KASPar approach (Table 1). The ASIP polymor-phism which is associated with the black phenotype is a deletion of11 bp and no primers could be designed for the competitive allele-specific PCR. Therefore, only five SNPs could be typed using KASPar.We replicated the results at least three times from two indepen-dent DNA extractions in order to identify sporadic contaminations,ancient DNA damages and allelic dropout for each method. The 16ancient horses had a high variation in their coat colors (Table 1).We found five different phenotypes (bay, black, chestnut, buck-skin, black silver). No variation was found in the KIT gene (intron16) for sabino spotting and SLC36A1 gene for champagne pheno-type. All three basic coat colors: bay, black and chestnut wereobserved. Cream and silver were found only in heterozygote allelicpatterns.
Both the SNP genotyping systems, KASPar and pyrosequenc-ing were performed after two amplification steps, a multiplex PCRcommon to both methods and a specific singleplex adapted to
the corresponding method as described in Fig. 2. In general, threeprimers are necessary for KASPar containing one specific of eachallele supplemented by a longer sequence in the 5′ end to bindthe fluorochromes. The detection of the polymorphism directlyevel of fluorescence corresponding to the different SNP allele of MC1R (A), MATP (B)nds to a negative result. A: The ideal case: all genotypes are clearly clustered usingut high level of background for the negative control. C: No allele specific clustering
ertain confidence.
M. Pruvost et al. / Annals of Anatomy 194 (2012) 74– 81 79
F f three( ). B: PA
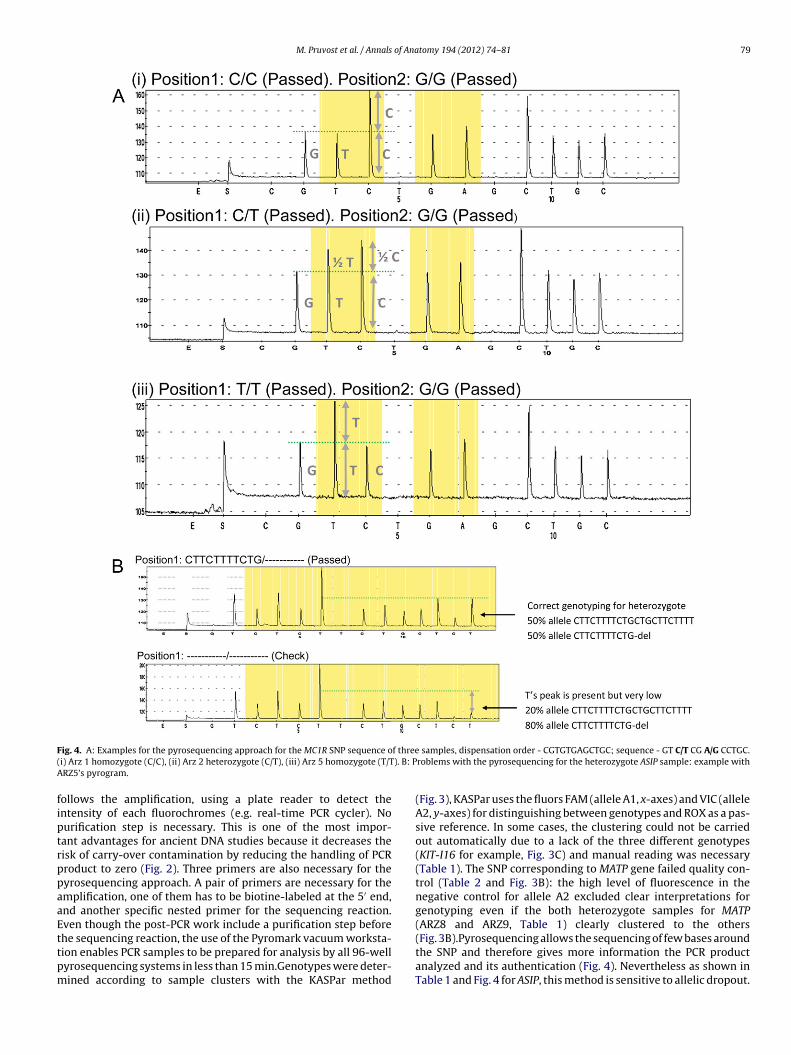
fiptrppaaEttpm
ig. 4. A: Examples for the pyrosequencing approach for the MC1R SNP sequence oi) Arz 1 homozygote (C/C), (ii) Arz 2 heterozygote (C/T), (iii) Arz 5 homozygote (T/TRZ5’s pyrogram.
ollows the amplification, using a plate reader to detect thentensity of each fluorochromes (e.g. real-time PCR cycler). Nourification step is necessary. This is one of the most impor-ant advantages for ancient DNA studies because it decreases theisk of carry-over contamination by reducing the handling of PCRroduct to zero (Fig. 2). Three primers are also necessary for theyrosequencing approach. A pair of primers are necessary for themplification, one of them has to be biotine-labeled at the 5′ end,nd another specific nested primer for the sequencing reaction.ven though the post-PCR work include a purification step before
he sequencing reaction, the use of the Pyromark vacuum worksta-ion enables PCR samples to be prepared for analysis by all 96-wellyrosequencing systems in less than 15 min.Genotypes were deter-ined according to sample clusters with the KASPar methodsamples, dispensation order - CGTGTGAGCTGC; sequence - GT C/T CG A/G CCTGC.roblems with the pyrosequencing for the heterozygote ASIP sample: example with
(Fig. 3), KASPar uses the fluors FAM (allele A1, x-axes) and VIC (alleleA2, y-axes) for distinguishing between genotypes and ROX as a pas-sive reference. In some cases, the clustering could not be carriedout automatically due to a lack of the three different genotypes(KIT-I16 for example, Fig. 3C) and manual reading was necessary(Table 1). The SNP corresponding to MATP gene failed quality con-trol (Table 2 and Fig. 3B): the high level of fluorescence in thenegative control for allele A2 excluded clear interpretations forgenotyping even if the both heterozygote samples for MATP(ARZ8 and ARZ9, Table 1) clearly clustered to the others
(Fig. 3B).Pyrosequencing allows the sequencing of few bases aroundthe SNP and therefore gives more information the PCR productanalyzed and its authentication (Fig. 4). Nevertheless as shown inTable 1 and Fig. 4 for ASIP, this method is sensitive to allelic dropout.
8 of Ana
4
aemNotsBt(
oepisgfdStaps5Str2
ootabdAdwastgMFbtarogrswaTffgdpcc
0 M. Pruvost et al. / Annals
. Discussion
Although there have been several nuclear ancient DNA studiesddressing population genetics during the last few years (Buncet al., 2003; Jaenicke-Després et al., 2003; Ludwig et al., 2008), theost recent technical developments including pyrosequencing andext Generation Sequencing have significantly improved this fieldf research. For example, multiplex PCR and shotgun sequencingechniques allowed the analysis of complete genomes from extinctpecies (Krause et al., 2006; Noonan et al., 2005; Green et al., 2010).esides genomic approaches, candidate gene approaches of selec-ive trait markers became feasible through these improvementsLudwig et al., 2009).
In palaeogenetics, the fragment length of endogeneous DNA isne of the most important limitations of genetic studies (Pääbot al., 2004). Normally, short overlapping PCR products are used inaleogenetics for the analysis of genes. Due to the large investments
n time and money, they are of limited value for the analysis of largeample sets. An alternative approach is the analysis of SNPs. Theenomes of vertebrates contain millions of SNPs which are oftenound in non-coding regions. But in coding sequences some of themo cause phenotypic variation. The major advantage addressingNPs is that only very short fragments have to be amplified. Indeedhe possibility of reducing the length of the amplification product to
few nucleotides around the polymorphism greatly increases therobability of retrieval of ancient nuclear DNA. It has been demon-trated that nuclear DNA in ancient samples ranges mainly between2 bp and 69 bp (Noonan et al., 2006). Therefore, the research ofNPs associated with specific traits is becoming a promising wayo identify selection and phenotypic adaptation in archaeologicalemains (Svensson et al., 2007; Ludwig et al., 2009; Workman et al.,011).
Today, several genotyping approaches exist for the detectionf SNPs. We chose two methods based on different premises:n the one hand the pyrosequencing of a few base pairs aroundhe polymorphic site and on the other hand an allele specificmplification followed by fluorescence detection (KASPar). Foroth methods, results are analyzed by specific software whichefines the genotypes and the reliability of their determination.lternatively, it is also possible to analyze them manually. Manualetermination was particularly valuable for the KASPar systemhen only one or two of the three character states (homozygote
a or bb; heterozygote ab) were present. In such cases, the KASParoftware is unable to build clusters for the different genotypes ando define them. In our study, this was the case in four out of fiveenes (no primer design was possible for ASIP using KASPar). OnlyC1R was present in all possible allelic combinations (Table 1;
ig. 3A). The manual determination of genotypes was realizedy fixing a lower limit for the fluorescence level decreasing thehreshold of the background (Fig. 3C). Taking this modificationnd repeating the experiments three times, it was possible toeach the same results as found with the pyrosequencing. Anotherption would be to create artificial positive control for the missingenotype in order to improve the clustering. However we stronglyecommend carrying out the genotyping with all or at least 24amples to ensure correct clustering. The second problem observedith the KASPar approach in our study was that some SNPs had
high level of background for one allele in their negative control.hus the four negative controls for MATP have a fluorescence levelor the allele G comparable to the level of the samples homozygoteor allele G (see Fig. 3B and Table 2) even if they form a separateroup. However, no contamination in the negative control was
etected for the SNPs either for MATP with the pyrosequencing. Itrobably results from the formation of primer-dimers or an unspe-ific fixation of the primers rather than from a contamination in theontrols.tomy 194 (2012) 74– 81
The pyrosequencing results are given in the form of sequencepeaks corresponding to the nucleotide incorporated. The height ofeach peak is proportional to the nucleotide quantity (see Fig. 4)allowing the reading of a short DNA sequence around the polymor-phism. Both manual and automatic detection of genotypes were inagreement. The only exception was for ASIP. The mutation respon-sible for the black phenotype in horses is a deletion of 11 bp inexon 2 (ADEx2) (Rieder et al., 2001). The length of the amplifi-cation product in our system varied between 67 bp for the blackallele (a) and 78 bp for the non-black allele (A). The efficiency ofancient DNA amplification decreases rapidly with the length of thetarget sequence. Thus we observed a ratio difference between bothalleles for the heterozygote samples in favor of the short allele (a)which leads to a detection problem by the PSQTM96MA SNP soft-ware (Fig. 4). To confirm our assessment, we sequenced sampleswhich presented an ambiguous result with the pyrosequencing andfound in all of them both alleles at an average proportion of 20–30%for the long allele (A). Therefore we recommend an additional pg-gel detection of the ASIP alleles taking under consideration theirlength differences or, alternatively, traditional cloning and capil-lary (Sanger) sequencing to avoid false homozygote individuals forthe black allele.
Finally, regarding the cost, the one-step amplification and typingas well as the use of unlabeled primers in the KASPar are par-ticularly advantageous, being about ten times cheaper than thepyrosequencing approach. An additional advantage of the KASParis the compatibility with most of the conventional plate readers.
5. Conclusion
Both approaches are cheap, easy to handle and fast. They areboth very valuable for the detection of point mutations (SNPs).In detail, KBiosciences’ PCR SNP genotyping system (KASPar®), ahomogeneous fluorescent endpoint genotyping system, is a veryattractive and cost-effective platform for SNP detection especiallyfor the investigation of large sample sets. This technology utilizesa unique form of competitive allele specific PCR to determinethe allele at a specific locus for SNP genotyping. In the case ofancient DNA studies, many precautions must be taken regardingthe interpretation of the results: PCR’s inhibitors and damaged PCRtemplates will affect the competitive allele specific amplification.Moreover as found for ASIP, some polymorphisms cannot bedetected via this system. Although pyrosequencing is a more infor-mative and reliable approach for ancient DNA analyses because afew base pairs around the polymorphism are sequenced, comple-mentary analyses are still recommended for the detection of largerindels. Both KASPar and pyrosequencing were not able to producereliable results for an indel of 11 bp. However, in comparison withthe traditional mode of investigation (PCR, cloning, sequencing),both approaches are superior for the SNP analysis of large samplesets.
Acknowledgements
Our research was supported by grants from the DFG (LU 852/6-2; AL 287/6-2; LU 852/7-3) and from the German ArchaeologicalInstitute.
References
Benecke, N., Pruvost, M., Weber, C., 2010. Die Pferdeskelette aus dem skythis-chen Fürstengrabhügel von Arzan 2 (Tuva, Westsibirien) - Archäozoologie undMolekulargenetik. In: Cugunov, K.V., Parzinger, H., Nagler, A. (Eds.), Der skythen-zeitliche Furstenkurgan Arzan 2 in Tuva. Archaologie in Eurasien 26 (Mainz2010). , pp. 249–255.
of Ana
B
C
C
G
H
J
K
L
L
L
N
383.Workman, C., Dalen, L., Vartanyan, S., Shapiro, B., Kosintsev, P., Sher, A.,
M. Pruvost et al. / Annals
unce, M., Worthy, T.H., Ford, T., Hoppitt, W., Willerslev, E., Drummond, A., Cooper,A., 2003. Extreme reversed sexual size dimorphism in the extinct New Zealandmoa Dinornis. Nature 425 (6954), 172–175.
ieslak, M., Reissmann, M., Hofreiter, M., Ludwig, A., 2011. Colours of domestication.Biol. Rev. 86, doi:10.1111/j.1469-185X.2011.00177.x.
ieslak, M., Pruvost, M., Benecke, N., Hofreiter, M., Morales, A., Reißmann, M., Ludwig,A., 2010. Origin and history of mitochondrial DNA lineages in domestic horses.PLoS ONE 5, 12.
reen, R.E., Krause, J., Briggs, A.W., Maricic, T., et al., 2010. A draft sequence of theNeandertal genome. Science 328 (5979), 710–722.
iguchi, R.G., Wrischnik, L.A., Oakes, E., George, M., Tong, B., Wilson, A.C., 1987.Mitochondrial DNA of the extinct quagga: relatedness and extent of postmortemchange. J. Mol. Evol. 25 (4), 283–287.
aenicke-Després, V., Buckler, E.S., Smith, B.D., Gilbert, M.T., Cooper, A., Doebley,J., Pääbo, S., 2003. Early allelic selection in maize as revealed by ancient DNA.Science 302 (5648), 1206–1208.
rause, J., Dear, P.H., Pollack, J.L., Slatkin, M., Spriggs, H., Barnes, I., Lister, A.M., Ebers-berger, I., Pääbo, S., Hofreiter, M., 2006. Multiplex amplification of the mammothmitochondrial genome and the evolution of Elephantidae. Nature 439 (7077),724–727.
alueza-Fox, C., Römpler, H., Caramelli, D., Stäubert, C., Catalano, G., Hughes,D., Rohland, N., Pilli, E., Longo, L., Condemi, S., de la Rasilla, M., Fortea, J.,Rosas, A., Stoneking, M., Schöneberg, T., Bertranpetit, J., Hofreiter, M., 2007. Amelanocortin 1 receptor allele suggests varying pigmentation among Nean-derthals. Science 318 (5855), 1453–1455.
udwig, A., Arndt, U., Lippold, S., Benecke, N., Debus, L., King, T.L., Matsumura, S.,2008. Tracing the first steps of American sturgeon pioneers in Europe. BMC Evol.Biol. 8, 221.
udwig, A., Pruvost, M., Reissmann, M., Benecke, N., Brockmann, G.A., Castanos, P.,Cieslak, M., Lippold, S., Llorente, L., Malaspinas, A.S., Slatkin, M., Hofreiter, M.,
2009. Coat color variation at the beginning of horse domestication. Science 324(5926), 485.oonan, J.P., Hofreiter, M., Smith, D., Priest, J.R., Rohland, N., Rabeder, G., Krause, J.,Detter, J.C., Pääbo, S., Rubin, E.M., 2005. Genomic sequencing of Pleistocene cavebears. Science 309 (5734), 597–599.
tomy 194 (2012) 74– 81 81
Noonan, J.P., Coop, G., Kudaravalli, S., Smith, D., Krause, J., Alessi, J., Chen, F., Platt,D., Pääbo, S., Pritchard, J.K., Rubin, E.M., 2006. Sequencing and analysis of Nean-derthal genomic DNA. Science 314 (5802), 1113–1118.
Pääbo, S., Poinar, H., Serre, D., Jaenicke-Despres, V., Hebler, J., Rohland, N., Kuch, M.,Krause, J., Vigilant, L., Hofreiter, M., 2004. Genetic analyses from ancient DNA.Annu. Rev. Genet. 38, 645–679.
Parzinger, H., 2010. Der skythenzeitliche Fürstenkurgan Arzan 2 in Tuva–Ergebnisseund weiterführende Betrachtungen. In: Cugunov, K.V., Parzinger, H., Nagler,A. (Eds.) Der skythenzeitliche Fürstenkurgan Arzan 2 in Tuva. Archäologie inEurasien 26 (Mainz 2010), 303–329.
Rieder, S., Taourit, S., Mariat, D., Langlois, B., Guérin, G., 2001. Mutations in the agouti(ASIP), the extension (MC1R), and the brown (TYRP1) loci and their associationto coat color phenotypes in horses (Equus caballus). Mamm. Genome 12 (6),450–455.
Rieder, S., 2009. Molecular tests for coat colours in horses. J. Anim. Breed. Genet. 126(6), 415–424.
Rohland, N., Hofreiter, M., 2007. Ancient DNA extraction from bones and teeth. Nat.Protoc. 2, 1756–1762.
Römpler, H., Rohland, N., Lalueza-Fox, C., Willerslev, E., Kuznetsova, T.,Rabeder, G., Bertranpetit, J., Schöneberg, T., Hofreiter, M., 2006a. Nucleargene indicates coat-color polymorphism in mammoths. Science 311, 392–394.
Römpler, H., Dear, P.H., Krause, J., Meyer, M., Rohland, N., Schöneberg, T., Spriggs,H., Stiller, M., Hofreiter, M., 2006b. Multiplex amplification of ancient DNA. Nat.Protoc. 1, 720–728.
Svensson, E.M., Anderung, C., Baubliene, J., Persson, P., Malmstrom, H., Smith, C.,Vretemark, M., Daugnora, L., Gotherstrom, A., 2007. Tracing genetic change overtime using nuclear SNPs in ancient and modern cattle. Anim. Genet. 38, 378–
Gotherstrom, A., Barnes, I., 2011. Population-level genotyping of coat colourpolymorphism in woolly mammoth (Mammuthus primigenius). Quat. Sci. Rev.,doi:10.1016/j.quascirev.2010.08.020.
Copyright © 2022 FDOKUMEN