Molecular Strain Typing of Brucella abortus Isolates from Italy by Two VNTR Allele Sizing...
10
RESEARCH Molecular Strain Typing of Brucella abortus Isolates from Italy by Two VNTR Allele Sizing Technologies Riccardo De Santis • Massimo Ancora • Fabrizio De Massis • Andrea Ciammaruconi • Katiuscia Zilli • Elisabetta Di Giannatale • Valentina Pittiglio • Silvia Fillo • Florigio Lista Ó Springer Science+Business Media New York 2013 Abstract Brucellosis, one of the most important re- emerging zoonoses in many countries, is caused by bacteria belonging to the genus Brucella. Furthermore these bac- teria represent potential biological warfare agents and the identification of species and biovars of field strains may be crucial for tracing back source of infection, allowing to discriminate naturally occurring outbreaks instead of biot- errorist events. In the last years, multiple-locus variable- number tandem repeat analysis (MLVA) has been proposed as complement of the classical biotyping methods and it has been applied for genotyping large collections of Bru- cella spp. At present, the MLVA band profiles may be resolved by automated or manual procedures. The Lab on a chip technology represents a valid alternative to standard genotyping techniques (as agarose gel electrophoresis) and it has been previously used for Brucella genotyping. Recently, a new high-throughput genotyping analysis sys- tem based on capillary gel electrophoresis, the QIAxcel, has been described. The aim of the study was to evaluate the ability of two DNA sizing equipments, the QIAxcel System and the Lab chip GX, to correctly call alleles at the sixteen loci including one frequently used MLVA assay for Brucella genotyping. The results confirmed that these technologies represent a meaningful advancement in high- throughput Brucella genotyping. Considering the accuracy required to confidently resolve loci discrimination, QIAx- cel shows a better ability to measure VNTR allele sizes compared to LabChip GX. Keywords Brucella Á QIAxcel Á Lab chip GX Á MLVA Á UPGMA Background The genus Brucella comprises Gram-negative bacteria responsible of brucellosis, a worldwide zoonosis disease resulting in significant economic losses due to abortion and infertility in livestock (cattle, goats, and sheep) [1, 2]. The disease can be transmitted to humans directly by contact with infected animals or indirectly by contaminated dairy products. Brucellosis occurs as a sub-acute or chronic ill- ness, that is generally not lethal in previously healthy patients, and can result in a wide variety of manifestations and significant morbidity if the diagnosis is unobserved and treatment is not rapidly started [2]. Ten species are rec- ognized within the genus Brucella [3]: B. abortus (7 bio- vars) which preferentially infects cattle; B. melitensis (3 biovars) infecting sheep and goats; B. suis (5 biovars) preferentially infecting pigs; B. canis the dog; B. ovis, sheep and goats; B. neotomae the desert wood rat, B. microti the common vole [4], B. ceti, cetaceans, B. pinni- pedialis, seals [5] and B. inopinata sp., isolated from a human breast implant infection [6]. Each species has dis- tinctive host preferences, pathogenicity, and epidemiology. Brucellosis is recognized as public health problem in many countries around the world although the surveillance plans, and the animal vaccination programs have been conducted. Currently, the disease is considered to be endemic in the Eastern Mediterranean basin, the Middle R. De Santis Á A. Ciammaruconi Á V. Pittiglio Á S. Fillo Á F. Lista (&) Histology and Molecular Biology Section, Army Medical and Veterinary Research Center, Via Santo Stefano Rotondo 4, 00184 Rome, Italy e-mail: [email protected] M. Ancora Á F. De Massis Á K. Zilli Á E. Di Giannatale Istituto Zooprofilattico Sperimentale dell’Abruzzo e del Molise ‘‘G. Caporale’’, (Istituto G. Caporale), Teramo, Italy 123 Mol Biotechnol DOI 10.1007/s12033-013-9659-3
-
Upload
independent -
Category
Documents
-
view
3 -
download
0
Transcript of Molecular Strain Typing of Brucella abortus Isolates from Italy by Two VNTR Allele Sizing...

RESEARCH
Molecular Strain Typing of Brucella abortus Isolates from Italyby Two VNTR Allele Sizing Technologies
Riccardo De Santis • Massimo Ancora • Fabrizio De Massis •
Andrea Ciammaruconi • Katiuscia Zilli • Elisabetta Di Giannatale •
Valentina Pittiglio • Silvia Fillo • Florigio Lista
� Springer Science+Business Media New York 2013
Abstract Brucellosis, one of the most important re-
emerging zoonoses in many countries, is caused by bacteria
belonging to the genus Brucella. Furthermore these bac-
teria represent potential biological warfare agents and the
identification of species and biovars of field strains may be
crucial for tracing back source of infection, allowing to
discriminate naturally occurring outbreaks instead of biot-
errorist events. In the last years, multiple-locus variable-
number tandem repeat analysis (MLVA) has been proposed
as complement of the classical biotyping methods and it
has been applied for genotyping large collections of Bru-
cella spp. At present, the MLVA band profiles may be
resolved by automated or manual procedures. The Lab on a
chip technology represents a valid alternative to standard
genotyping techniques (as agarose gel electrophoresis) and
it has been previously used for Brucella genotyping.
Recently, a new high-throughput genotyping analysis sys-
tem based on capillary gel electrophoresis, the QIAxcel,
has been described. The aim of the study was to evaluate
the ability of two DNA sizing equipments, the QIAxcel
System and the Lab chip GX, to correctly call alleles at the
sixteen loci including one frequently used MLVA assay for
Brucella genotyping. The results confirmed that these
technologies represent a meaningful advancement in high-
throughput Brucella genotyping. Considering the accuracy
required to confidently resolve loci discrimination, QIAx-
cel shows a better ability to measure VNTR allele sizes
compared to LabChip GX.
Keywords Brucella � QIAxcel � Lab chip GX � MLVA �UPGMA
Background
The genus Brucella comprises Gram-negative bacteria
responsible of brucellosis, a worldwide zoonosis disease
resulting in significant economic losses due to abortion and
infertility in livestock (cattle, goats, and sheep) [1, 2]. The
disease can be transmitted to humans directly by contact
with infected animals or indirectly by contaminated dairy
products. Brucellosis occurs as a sub-acute or chronic ill-
ness, that is generally not lethal in previously healthy
patients, and can result in a wide variety of manifestations
and significant morbidity if the diagnosis is unobserved and
treatment is not rapidly started [2]. Ten species are rec-
ognized within the genus Brucella [3]: B. abortus (7 bio-
vars) which preferentially infects cattle; B. melitensis (3
biovars) infecting sheep and goats; B. suis (5 biovars)
preferentially infecting pigs; B. canis the dog; B. ovis,
sheep and goats; B. neotomae the desert wood rat, B.
microti the common vole [4], B. ceti, cetaceans, B. pinni-
pedialis, seals [5] and B. inopinata sp., isolated from a
human breast implant infection [6]. Each species has dis-
tinctive host preferences, pathogenicity, and epidemiology.
Brucellosis is recognized as public health problem in
many countries around the world although the surveillance
plans, and the animal vaccination programs have been
conducted. Currently, the disease is considered to be
endemic in the Eastern Mediterranean basin, the Middle
R. De Santis � A. Ciammaruconi � V. Pittiglio � S. Fillo �F. Lista (&)
Histology and Molecular Biology Section, Army Medical and
Veterinary Research Center, Via Santo Stefano Rotondo 4,
00184 Rome, Italy
e-mail: [email protected]
M. Ancora � F. De Massis � K. Zilli � E. Di Giannatale
Istituto Zooprofilattico Sperimentale dell’Abruzzo e del Molise
‘‘G. Caporale’’, (Istituto G. Caporale), Teramo, Italy
123
Mol Biotechnol
DOI 10.1007/s12033-013-9659-3

East, the Arabian Peninsula, Mexico, Central and South
America, Central Asia, and the Indian subcontinent [2, 7].
As the prevalence of brucellosis in animal reservoirs is the
key to its control in humans, the knowledge of the pre-
vailing genotypes of Brucella spp. in a country represents
an important epidemiological tool for the formulation of
policies and strategies for the control of brucellosis in
animal populations. Current characterization of Brucella at
species and biovar levels can be performed by differential
tests based on phenotypic characterization of lipopolysac-
charide (LPS) antigens, phage typing, dye sensitivity,
requirement for CO2, H2S production, and metabolic
properties [8] or low-resolution molecular typing methods
[9, 10]. However, these methods have limited value for
epidemiological trace-back investigations due to the
genetically monomorphic nature of Brucella species [11].
The analysis of the published genome sequences of B.
melitensis 16M, B. suis 1330, and B. abortus 9-941 [12, 13]
resulted in the identification of polymorphic loci. This
allowed the development of schemes based on multilocus
sequence typing (MLST) [14] and multiple-locus VNTR
analysis (MLVA) [12, 15, 16]. Current methodologies for
sizing of VNTR PCR products ranging from traditional
agarose gel electrophoresis to latest microfluidics technol-
ogy. The Lab on a chip technology represents a valid
alternative to standard genotyping technique, and was
previously used for Brucella [17, 18]. The aim of this study
is to evaluate the ability of the QIAxcel Advanced System
(Qiagen, Crawley, UK), using capillary gel electrophoresis,
to be used as an automated improvement to the micro-
fluidics technology for sizing of Brucella VNTR products
in MLVA-16 [16]. The discriminatory capability of the
QIAxcel system was compared to the Lab chip GX (Cali-
per Life Sciences, Hopkinton, USA) in their own ability to
distinguish geographic origins in order to resolve rela-
tionships within a group of 66 B. abortus isolated in Ab-
ruzzo and Molise regions, central Italy. Furthermore a
reference collection, whose MLVA fingerprinting profiles
were previously resolved [18, 19], were de novo genotyped
with QIAxcel. This study also compares to the usability of
the two VNTR alleles sizing technologies with regard to
resources, technological needs, scientific expertises, and
time consumption.
Materials and Methods
Bacterial Strains
An appropriate reference collection, previously genotyped
and reasonably covering the existing allele size ranges, was
reanalyzed to both validate the QIAxcel system and com-
pare the two VNTR allele sizing technologies. Therefore,
fifteen samples were collected by the Istituti Zooprofilattici
Sperimentali (IZS) and submitted to the National Refer-
ence Laboratory (NRL) for brucellosis research at the IZS
dell’Abruzzo e del Molise-G. Caporale (Istituto G. Capo-
rale) for typing during the 2001–2008 years [18], nine
DNA samples, collected in UK, provided at the IZS
dell’Abruzzo e del Molise-G. Caporale (Istituto G. Capo-
rale) for B. suis ring-trial 2006 (COST 845-Brucellosis in
man and animals) [18] and 17 Brucella strains isolated
from Sicilian hospitalized patients with acute brucellosis
[18, 19], were analyzed. Furthermore, ten reference strains,
previously analyzed by Lab on a chip [20] were included as
controls: the type strains of the three biovars of B. meli-
tensis (biovars 1, 2 and 3), biovars 1–3 of B. abortus ref-
erence strains and one for each species of B. canis, B. suis,
B. ovis, and B. neotomae. The sixty-six field strains used in
the study were isolated from cattles in the framework of the
National Brucellosis eradication program throughout Ab-
ruzzo and Molise regions (central Italy) from 2007 to 2009.
The strains were isolated from 13 brucellosis outbreaks in
three provinces (L’Aquila, Isernia and Chieti, about
500 sqkm area). Most outbreaks were epidemiologically
connected one another and the main critical point identified
for brucellosis spreading among herds was the use of
common pastures. Isolation and typing was performed by
the National Reference Laboratory for Brucellosis at the
IZS dell’Abruzzo e Del Molise-G. Caporale (Istituto ‘‘G.
Caporale’’ Teramo), according to the bacteriological stan-
dard techniques described in the OIE Manual [21]. All
isolates were identified as B. abortus biovar 3. The field
isolates and the reference strains used in this study are
summarized in Table 1.
DNA Extraction and VNTR Amplification
Total genomic DNA was extracted by Maxwell 16 Cell
DNA purification kit (Promega, Wisconsin, USA),
according to the manufacturer’s instructions and stored at
-20 �C until needed. The MLVA-16 scheme uses 16 loci
divided in panel 1 (Bruce06, Bruce08, Bruce11, Bruce12,
Bruce42, Bruce43, Bruce45, and Bruce55) and panel 2
(Bruce18, Bruce 19, Bruce21, Bruce04, Bruce07, Bruce09,
Bruce16, and Bruce30). Amplification reaction mixtures
were prepared, according to the methods previously
described [15, 16], in 15 ll volumes using 1U FastStart
polymerase Taq and containing 1 ng of DNA, 19 PCR
Roche reaction buffer (10 mM Tris–HCl, 2,5 mM MgCl2,
50 mM KCl pH 8.3), 0.2 mM dNTPs (Roche, Basel,
Switzerland) and 0,3 lM of each flanking primer (Eurofin
MWJ, Edersberg, Germany). Thermal cycling, conducted
on a Peltier thermal cycler DNA engine DYAD (MJ
Research, Massachusetts, US), was performed as follows:
an initial heating at 95 �C for 5 min, 35 cycles denaturation
Mol Biotechnol
123
at 95 �C for 30 s, annealing at 60 �C for 30 s, and exten-
sion at 70 �C for 60 s. A final extension was performed at
70 �C for 5 min.
MLVA Analysis
The Caliper LabChip GX and the QIAxcel Advanced
System were used to examine polymorphisms at 16 dif-
ferent tandem repeat loci of the sixty-six isolates. Lab on a
chip genotyping was used as described previously [18].
Amplification products were loaded into 96-well or
384-well PCR plates. For each run, the chip (Caliper HT
DNA 5 K Kit) and two tubes were prepared, respectively,
for the ladder (containing the MW size standards of 100,
300, 500, 700, 1100, 1900, 2900, 4900 bp) and the buffer,
according to manufacturer recommendations. The number
of samples per chip preparation is 400, equivalent or four
96-well plates or one 384-well plate. After gel preparation,
the sample plate was loaded into the microplate carrier
moved by a stepper motor driven robot of the Caliper
LabChip GX. During the separation of the fragments, the
samples were analyzed sequentially and amplification
product size estimates were obtained by LabChip Gx
Software. Successfully each size was assigned to the cor-
responding allele by a correspondence table, previously
described [18]. The QIAxcel Advanced System was used to
analyze concurrently six samples for MLVA-16 using a 12
capillary QIAxcel DNA high resolution cartridge, prepared
according to manufacturer recommendations. Amplifica-
tion products were loaded into 96-well PCR plate. The
QIAxcel used a standardized volume (\0.1 ll) for each
analysis of the PCR product that was placed on the
QIAxcel. Accurate measurement of the DNA product sizes
was achieved using on QIAxcel runs a QX DNA Size
Marker 25–500 bp (MW size standards of 25, 50, 75, 100,
150, 200, 250, 300, and 400 bp) for all Panel 2 loci and
Bruce 08, 12, 42, and 43 belonging to the Panel 1. For the
remaining Panel 1 loci a DNA Size Marker 50–1,350 bp
(MW size standards of 100, 250, 300, 350, 400, 450, 500,
550, 600, 650, 700, 766, 916, and 1,350 bp) was used.
QIAxcel electrophoretic separation was performed apply-
ing the OM500 and OM800 methods coupled respectively
with the DNA Size Markers 50–1,350 bp and 25–500 bp.
The separation time (the time taken for the sample to run
through the capillary gel matrix) was approximately 8 min
for OM500 method and 13 min for OM800 method. For
each run, the Biocalculator QIAxcel software sizes the
fragment length producing also a virtual gel image. The
allelic sequences of each sample were then imported into
the BioNumerics software package (version 5.10, Applied-
Maths, Belgium) and clustering analysis were based on the
categorical coefficient and the unweighted-pair group
method using arithmetic averages (UPGMA) analysis and
minimum spanning tree (MST) analysis.
Sequencing Analysis
The PCR amplicons were purified and sequenced by CEQ
8000 automatic DNA Analysis System (Beckman-Coulter,
CA, USA) using a commercial Kit (GenomeLabTM DTCS-
Quick Start Kit, Beckman-Coulter) according to the man-
ufacturer instructions.
Results
The aim of our study was to compare the resolving powers
of two different DNA fragment sizing technologies pro-
viding an assessment of the limitations, advantages, and
field applications of the two MLVA assays for genotyping
Brucella spp. The performance of the QIAxcel against
Caliper LabChip GX was assessed analyzing 66 Italian
field isolates of B. abortus with a MLVA-16 panel (Fig. 1).
Furthermore, in order to set up the system, DNA samples,
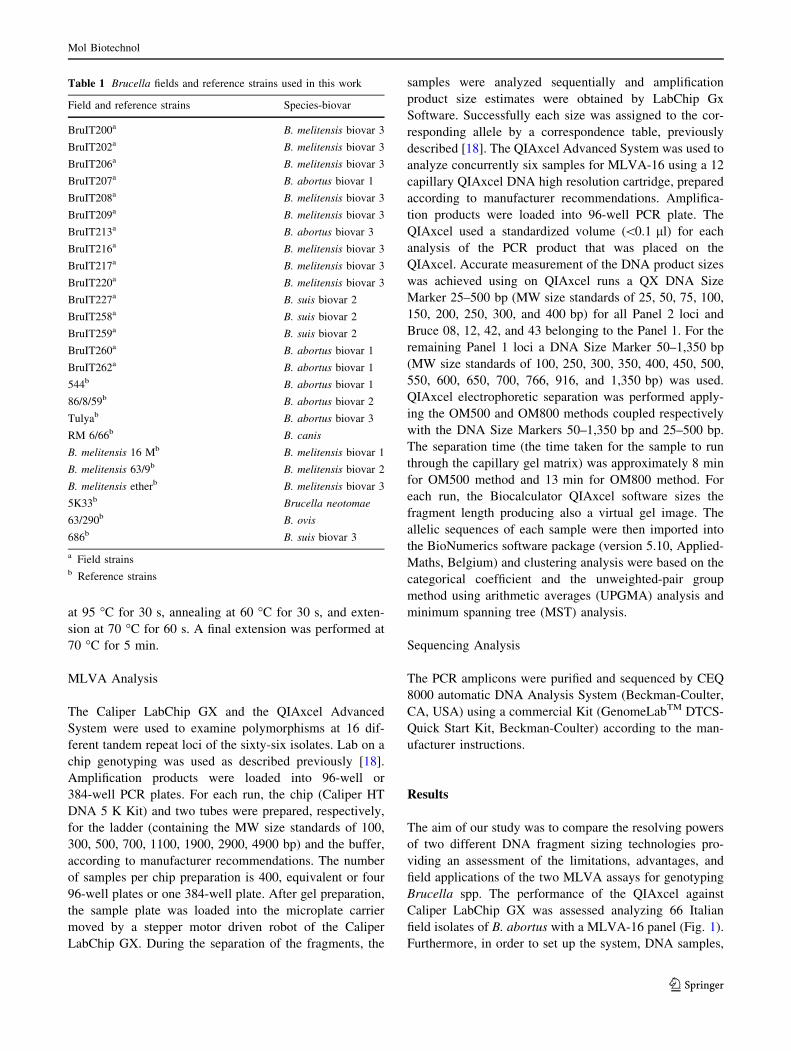
Table 1 Brucella fields and reference strains used in this work
Field and reference strains Species-biovar
BruIT200a B. melitensis biovar 3
BruIT202a B. melitensis biovar 3
BruIT206a B. melitensis biovar 3
BruIT207a B. abortus biovar 1
BruIT208a B. melitensis biovar 3
BruIT209a B. melitensis biovar 3
BruIT213a B. abortus biovar 3
BruIT216a B. melitensis biovar 3
BruIT217a B. melitensis biovar 3
BruIT220a B. melitensis biovar 3
BruIT227a B. suis biovar 2
BruIT258a B. suis biovar 2
BruIT259a B. suis biovar 2
BruIT260a B. abortus biovar 1
BruIT262a B. abortus biovar 1
544b B. abortus biovar 1
86/8/59b B. abortus biovar 2
Tulyab B. abortus biovar 3
RM 6/66b B. canis
B. melitensis 16 Mb B. melitensis biovar 1
B. melitensis 63/9b B. melitensis biovar 2
B. melitensis etherb B. melitensis biovar 3
5K33b Brucella neotomae
63/290b B. ovis
686b B. suis biovar 3
a Field strainsb Reference strains
Mol Biotechnol
123

Mol Biotechnol
123

previously genotyped by micro-fluidics technology and
sequencing system [18, 19], were reanalyzed. The elec-
trophoretic separation by LabChip GX was performed
according to the previously described method [18].
Table 2 Comparison between Brucella product sizes estimated respectively by Qiaxcel and LabChip GX software and actual sizes obtained by
direct sequencing of the PCR product (Expected size)
PCR Locus (UL bps)a Allele Expected size Qiaxcel LabChip GX
Observed size x ± rb Bias Observed size x ± rb Bias
Singleplex 1 Bruce08 (18)c 3 330 333–342 336 ± 5 6 346–359 352.6 ± 5.3 22.6
4 348 351 351 ± 0 3 369–383 376 ± 4.6 28
5 366 365–371 367.4 ± 1.5 1.4 385–410 405 ± 4 39
6 384 387 387 ± 0 3 411–413 412 ± 1 28
Singleplex 2 Bruce43 (12)c 1 170 173–177 174.3 ± 1.1 4.3 179–188 183,17 ± 2 13.2
2 182 184–190 186.1 ± 1.4 4.1 191–200 198 ± 2 16
Singleplex 3 Bruce12 (63)d 10 347 344–346 345 ± 1.4 2 359–369 362,8 ± 3.7 15.8
11 362 362–364 363 ± 1 1 379–388 384.1 ± 3.6 22.1
12 377 375–382 377.2 ± 1.7 0.2 391–402 396.8 ± 2.3 19.8
13 392 393–397 394.6 ± 1 2.6 407–416 412.6 ± 2.3 20.6
14 407 410–411 410.6 ± 0.5 3.6 424–440 430.5 ± 5 23.5
Singleplex 4 Bruce18 (8)c 3 130 135 135 ± 0 5 145 145 ± 0 15
4 138 144 144 ± 0 6 153–155 154 ± 1 16
5 146 150–153 151.5 ± 1.7 5.5 161–162 163 ± 1.1 17
6 154 157–162 158.4 ± 0.6 4.4 164–175 173 ± 2 19
7 162 167–169 168.1 ± 0.6 6.1 177–183 181.3 ± 1.7 19.3
8 170 176–177 176.5 ± 0.6 6.5 189–191 190.3 ± 1 20.3
Singleplex 5 Bruce11 (63)d 2 257 258–263 260.6 ± 2.5 3.6 266–270 268 ± 2.82 11
3 320 291–325 316.3 ± 4 4.3 321–344 335.4 ± 3.6 15.4
4 383 386–394 389.1 ± 2.6 6.1 408–422 412.8 ± 5.3 29.8
6 509 532–535 534 ± 1.7 25 509–536 521.3 ± 13.6 12.3
8 635 669–681 675.6 ± 6.1 40.6 623–648 637.7 ± 11.3 2.7
9 698 706–731 715 ± 13.9 17 680–724 702.3 ± 22 4.3
Singleplex 6 Bruce21 (8)c 6 148 151–155 152.6 ± 2 4.6 163 163 ± 0 15
7 156 166–168 167.5 ± 0.5 11.5 178–179 178.5 ± 0.6 22.5
8 164 169–171 169.6 ± 0.7 5.6 180–188 182.3 ± 1.4 18.3
9 172 180–182 181 ± 0.9 9 193–198 194.4 ± 2 22.4
Singleplex 7 Bruce06 (134)d 1 140 141 141 ± 0 1 153 153 ± 0 13
2 274 262–285 271.5 ± 8.2 2.5 282–294 286.8 ± 3.8 12.8
3 408 393–424 411.1 ± 9.2 3.1 432–454 439.5 ± 5.8 31.5
4 542 555–571 561.6 ± 3.5 19.6 570–606 594 ± 6.6 52
Singleplex 8 Bruce42 (125)d 1 164 157–167 162.8 ± 2.8 1.2 172–177 174.7 ± 1 10.7
2 289 286–302 290.4 ± 3.4 1.4 288–293 290 ± 1 1
3 414 406–430 422.2 ± 9.5 8.2 420–442 433 ± 8.1 19
4 539 546–557 550 ± 6 11 504–550 526.7 ± 19 12.3
Singleplex 9 Bruce45 (18)c 3 151 151–159 155.7 ± 1.4 4.7 159–166 162.5 ± 1.5 11.5
5 187 191–195 192.7 ± 2 5.7 196–206 199.4 ± 3.1 12.4
Singleplex 10 Bruce55 (40)d 1 193 186–190 187.6 ± 1.9 6.5 204–208 206 ± 2 13
2 233 223–236 230.5 ± 4.7 2.5 245–259 249.8 ± 5.2 15.8
3 273 264–282 271 ± 4.7 2 275–289 284 ± 2 11
Fig. 1 Dendrogram based on differences in the copy number of
tandem repeat units of 16 loci. The genetic profiles were arranged in
the following order of loci: Bruce 06, 08, 11, 12, 42, 43, 45, 55, 18,
19, 21, 04, 07, 09, 16, 30. The 66 B. abortus isolates were divided into
ten genotypes
b
Mol Biotechnol
123

Table 2 continued
PCR Locus (UL bps)a Allele Expected size Qiaxcel LabChip GX
Observed size x ± rb Bias Observed size x ± rb Bias
Singleplex 11 Bruce30 (8)c 3 127 127–133 129.9 ± 1.6 2.7 136–142 139 ± 1.4 12
4 135 139–140 139.5 ± 0.7 4.5 145–149 146.4 ± 1.3 11.4
5 143 146–150 148.6 ± 1.7 4 158–159 158.6 ± 0.5 15.6
6 151 154–158 155.7 ± 2 4.7 167–168 167.3 ± 0.6 16.3
Singleplex 12 Bruce04 (8)c 2 152 154–157 155.6 ± 1.5 3.6 169–172 170 ± 1.7 18
3 160 163–166 165 ± 1.4 5 179–180 179.6 ± 0.5 19.6
4 168 169–175 171.5 ± 1.7 3.5 186–192 188.3 ± 1.4 20.3
5 176 179–182 180.8 ± 1 4.8 195–199 197 ± 1.4 21
6 184 187–190 188.4 ± 1.3 4.4 206–210 206.8 ± 1.6 22.8
7 192 196–198 197.2 ± 0.9 5.2 214–217 216.2 ± 1.3 24.2
8 200 203 203 ± 0 3 222–224 222.7 ± 0.9 22.7
Singleplex 13 Bruce07 (8)c 4 150 154–157 155.9 ± 0.9 5.9 158–163 161.3 ± 1.6 11.3
5 158 160–166 162.3 ± 0.9 4 169–174 171 ± 1 13
6 166 170–173 171.9 ± 1.1 5.9 179–181 179.7 ± 0.8 13.7
7 174 179–181 180 ± 1 6 186–190 188.5 ± 1.7 14.5
8 182 186–187 187 ± 0.7 4.5 197–198 197.5 ± 0.7 15.5
Singleplex 14 Bruce09 (8)c 3 124 123–129 125 ± 1.6 1 134–143 137.3 ± 1.7 13.3
4 132 134 134 ± 0 2 147 147 ± 0 15
5 140 140–141 140.5 ± 0.7 0.5 154–158 155.3 ± 2.3 15.3
6 148 150–153 152.3 ± 1.1 4.3 163–167 164.7 ± 1.2 16.7
7 156 159–161 160 ± 1 3 173–175 174.4 ± 0.9 16.4
8 164 167 167 ± 0 3 183–184 183.5 ± 0.7 19.5
9 172 175–177 176 ± 1 3 194 194 ± 0 22
10 180 183–185 184.2 ± 0.9 3 202–203 202.5 ± 0.6 22.5
11 188 193 193 ± 0 5 211–212 211.3 ± 0.6 23.3
12 196 201–202 201.5 ± 0.7 5.5 220 220 ± 0 24
13 204 209 209 ± 0 5 230 230 ± 0 26
16 228 233–234 233.5 ± 0.7 5.5 249–253 251 ± 2.8 24
Singleplex 15 Bruce16 (8)c 3 152 153–157 154.4 ± 0.9 2.4 164–166 165.4 ± 0.8 13.4
4 160 160–163 161.3 ± 1.5 1.3 167–173 168.1 ± 1.6 8.1
5 168 170–171 170.5 ± 0.7 2.5 174–183 178.7 ± 3.8 10.7
6 176 174–179 177.7 ± 2.5 1.7 190–192 191 ± 0.8 15
7 184 188–189 188.5 ± 0.6 4.5 200–202 200.7 ± 0.9 16.7
8 192 193–196 192.2 ± 1.5 0.2 207–210 208.2 ± 1.5 16.2
9 200 204–206 205.1 ± 0.7 5.1 216–219 217.7 ± 1.2 17.7
10 208 213 213 ± 0 4 224–225 224.5 ± 0.7 16.5
11 216 221–222 221.5 ± 0.7 5.5 234–236 235 ± 1.4 19
Singleplex 16 Bruce 19 (6)c 18 163 164–168 165.7 ± 2 2.7 176–178 177 ± 0.7 17
19 169 173 173 ± 0 4 182 182 ± 0 13
20 175 179–182 180.3 ± 1.5 5.3 188 188 ± 0 13
21 181 183–185 184.5 ± 0.6 3.5 189–193 191.6 ± 1.5 10.6
22 187 186–188 187 ± 0.9 0 194–199 197.7 ± 1 10.7
23 193 203 203 10
a Unit lenght sizeb Arithmetic average (x) ± standard deviation (r) of the observed sizesc DNA size markers 25–500 bp coupled with OM800 methodd DNA size markers 50–1,350 bp coupled with OM500 method
Mol Biotechnol
123

Initially, the QIAxcel analysis was performed with differ-
ent electrophoresis methods on a unique ladder
(50–1,350 bps), able to cover all the ranges of the DNA
fragments generated in the 16 different loci. The results
obtained with all the different electrophoresis methods
showed a low discriminatory power for the eight Panel 2
loci and the four loci Bruce 08, 12, 43, and 45 belonging to
the Panel 1. The reason of this failure is probably due to a
few ladder reference bands in the range between 100 and
300 bps. In order to obtain a best resolution of the
ambiguous alleles, a different DNA Size Marker
(25–500 bps) coupled with OM800 method was used. All
loci analyzed by QIAxcel and LabChip GX showed a range
according to the expected sizes respectively from 0 to
40 bp and from 1 to 39 bp (Table 2). The ascertainment of
the number of repeats within loci showed a 100 % corre-
lation between the two instruments QIAxcel and Caliper
LabChip GX except for Bruce 08, Bruce 21, Bruce 16, and
Bruce 19. The alleles 3, 4, and 5 of locus Bruce 16 and 5
and 6 of locus Bruce 08, as previously described [18],
showed also by the LabChip GX equipment a continuity
between neighboring ranges that leads to an ambiguously
assignment of the allele to the observed value (Table 2),
while the QIAxcel showed an higher discriminatory
capacity. Furthermore both the LabChip GX and the
QIAxcel showed a continuity between the neighboring
ranges of the alleles 7 and 8 of locus Bruce 21 (Table 2)
with resulting reduced discriminatory ability. Finally, both
the platforms showed a low discrimination for Bruce 19
(Table 2). In this study, the data discrepancies found by the
comparison between the two platforms were resolved by
sequencing. The publically available MLVA database for
Brucella, MLVA-NET, (http://mlva.u-psud.fr/brucella/)
[22] was used to identify or confirm the identity of all
isolates used in this study.
Stability of the MLVA Loci and Diversity Index (DI)
DI values, affected by the level of genetic diversity within
the test population, were calculated through 66 isolates
from livestock of three different areas of Abruzzo and
Molise region by the Simpson’s diversity index (SDI) using
the online V-DICE bioinformatics tool available at the
HPA website (http://www.hpa.org.uk/srmd/bioinformatics/
tools/tools.htm). The DI values reflect the number of alleles
detected, ranging from 0 (no diversity) to 1 (extreme
diversity). The MLVA-16 assay, developed for epidemio-
logical typing, contains two panels: panel 1 made of eight
conserved markers with larger repeat units ([8 bp)
exhibiting DIs \0.40 in the isolates examined and panel 2
made of eight more-diverse loci with smaller repeat units
(B8 bp). The Bruce 06, 08, 11, 12, 42, 43, 45 belonging to
the panel 1 and the Bruce 18, 04, and 30 belonging to the
panel 2 were monomorphic in the isolates examined. The
invariance we observed at Bruce 18, 04, and 30 is most
likely due to the localized geographic origins of our iso-
lates and represents a level of strains-to-strains conserva-
tion within a geographic area that can be better evaluated in
a larger population of isolates coming from similar loca-
tions. The Bruce 55, 19, 21, 07, 09, and 16 VNTR markers
exhibit DIs ranging from 0.03 to 0.45 among the 16
markers (Table 3) and were shown to have two allelic
patterns with the exception of Bruce 09 that was revealed
to have three allelic profiles (Fig. 1). The allelic type 1 of
Bruce 09 was the most representative of the overall pop-
ulation, at the same time two isolates from AQ1 farm
(2008) showed the allelic type 6 and two isolates one from
IS4 farm (2009) and the other from IS9 farm (2007)
showed the allelic type 5. The Bruce 16 showed the higher
diversity index in the overall population and two different
allelic profiles (3 and 4).
Genetic Relationships
The assigned number of each tandem repeat was imported
into the BioNumerics software package to determine the
genetic relationships among the 66 B. abortus isolates.
Clustering analysis was performed by UPGMA, a method
for inferring genetic relationship when a constant rate of
evolution occurs, which is performed for Brucella species
because of the low genetic recombination and the rare
Table 3 Numbers of alleles and diversity index values of 66 B.abortus isolates from Abruzzo and Molise
Locus SDIa Confidenceinterval
No. ofalleles
Tandemrepeatcopy no.
max(pi)b
Panel 1
Bruce 06 0.000 0.000–0.103 1 4 1.000
Bruce 08 0.000 0.000–0.103 1 5 1.000
Bruce 11 0.000 0.000–0.103 1 3 1.000
Bruce 12 0.000 0.000–0.103 1 12 1.000
Bruce 42 0.000 0.000–0.103 1 2 1.000
Bruce 43 0.000 0.000–0.103 1 2 1.000
Bruce 45 0.000 0.000–0.103 1 3 1.000
Bruce 55 0.114 0.013–0.215 2 1, 3 0.939
Panel 2
Bruce 18 0.000 0.000–0.103 1 6 1.000
Bruce 19 0.059 0.000–0.136 2 22, 23 0.970
Bruce 21 0.087 0.000–0.178 2 7, 8 0.955
Bruce 04 0.000 0.000–0.103 1 4 1.000
Bruce 07 0.030 0.000–0.087 2 5, 6 0.985
Bruce 09 0.143 0.030–0.256 3 3, 5, 6 0.924
Bruce 16 0.454 0.384–0.524 2 4, 3 0.652
Bruce 30 0.000 0.000–0.103 1 3 1.000
a Simpson’s diversityb Fraction of samples that have the most frequent repeat number in this locus(range 0.0–1.0)
Mol Biotechnol
123

horizontal gene transfer [13, 23]. An equal weight was
given to all markers, irrespective of the number of repeats
because at one locus multiple tandem repeats can be
incorporated in one recombination event [16]. The sixty-six
B. abortus isolates were divided into ten genotypes. As
showed in Fig. 1, the most part of isolates from the dif-
ferent livestock were independently divided into two dif-
ferent genotypes, with a single monomorphic allelic profile
(identified as bv3). Eight isolates showing a single geno-
type slightly different by the two main profiles were also
identified as bv3.
Among the 13 livestock, farm IS2 was particularly
investigated for the changes of genotype in isolates of
2009. The farm seems to be infected by B. abortus strains
originating from different sources as showed in Fig. 1. The
genetic relationship of field isolates were successfully
analyzed by MST analysis comparing their genetic profiles
with those obtained by European and African strains,
whose data have been published [15, 24–26] or down-
loaded from the 2010 version of a related website
(http://minisatellites.u-psud.fr). In MST analysis, (Fig. 2)
the strains TE5736/1, TE5736/2 (farm AQ1) and IS2470
(farm IS4) were grouped with France (BCCN 95 7, 94 17
and 94 18), Spain (BCCN 93 15), Germany (BfR 101, 107
and 106), Portugal (LNIV-122Ba3-03, LNIV-120Ba3-03),
and Italy (BCCN 95 34) strains; the most part of the other
strains were located near this group.
Discussion
Currently, in genotyping analysis for bacterial identification,
the gold standard method is represented by the full
sequencing. However, this is an excessively expensive pro-
cedure requiring sophisticated equipment and consequently
is not appropriate for routine typing. Viable alternatives are
represented by MLST and MLVA. In this paper, we utilized
the last method for its high discriminatory power that has
proven to be appropriate for pathogenic bacterial species
typing with an high genetic homogeneity, as well as Brucella
spp. MLVA genotyping can be performed either on micro-
fluidics technology or capillary gel electrophoresis that are
less expensive and demanding in the set up process than
allele sequencing. In the last years, both methodological [17,
18] and epidemiological [24] studies about the use of Caliper
and QIAxcel for MLVA typing of Brucella spp. have been
published. In this study, the resolving capacity of these two
different automated DNA sizing systems were compared
using a 16 loci panel (MLVA16) and repeat units (RU) from
6 bps to more than 100 bps [15, 16].
Fig. 2 Minimum spanning tree
analysis on 66 field isolates and
reference strains using data
from eight markers (Panel 1:
bru06, 08, 11, 12, 42, 43, 45,
55). The central OTU includes
60 of 66 Abruzzo strains, but six
strains individually indicated
(IS319 IS2, IS1255/IS1, IS2470
IS4, TE11426 IS9, TE5736/1
AQ1, TE5736/2 AQ1)
Mol Biotechnol
123

The two platforms have different logistical and technical
requirements but both require a conversion table that
allowed to correlate the DNA fragment sizes to the alleles.
Furthermore, both the LabChip GX and QIAxcel softwares
improve the efficiency of data acquiring by automating
data flows. As a matter of fact, the softwares allow to
export the summary of analysis results to a spreadsheet
application, with the consequent elimination of the paper-
based flows. In despite of its lower precision, Caliper
LabChip GX shows the ability to acquire 96 amplification
product sizes in 40 min rather than 100 min of the QIAx-
cel, with an increased time-reduction. However, the Caliper
equipment shows an accurate discrimination only for 12
loci (Bruce 43, 12, 18, 11, 06, 42, 45, 55, 30, 04, 07, 09).
As previously described [18] and showed in the Table 2,
this platform cannot be used to confidently type the four
loci Bruce 08, 21, 16, and 19. The overlapping of some
alleles range could lead to a failure of the allelic calling.
Conversely, the QIAxcel Advanced System is able to dis-
criminate all alleles of Bruce 08 and 16. This capability lies
a greater flexibility, that enables the use of various ladders
coupled with different methods of electrophoresis, over-
coming therefore the reduced discriminatory ability of the
LabChip GX. Anyway QIAxcel fails, as LabChip GX, the
assignment of the alleles 7 and 8 of locus Bruce 21. The
Bruce 19 data, obtained with both platforms, have to be
confirmed by different systems as fluorescent fragments
analysis or sequencing. However, the QIAxcel Advanced
System represents a significant improvement in the high-
throughput sizing equipments.
The molecular genotyping methods based on MLVA-16
was used to perform a trace-back analysis helping the
identification of specific pathogenic bacteria. As reported
in Kang et al. [27], unstable genetic markers can generate
atypical MLVA profiles among common mutants. Actu-
ally, the changes of repeat numbers at Bruce 09 may be
recognized after in vitro passage experiment, probably
caused by simple insertion and deletion of DNA [27].
Therefore, the stability of the genetic marker for each locus
was investigated. Among the 16 loci, Bruce 16 had a
maximum of two allelic types, and the DI value was 0.45
(Table 3), which is similar to the case with Brucella spp.
previously reported [16]. Bruce09 showed various allelic
patterns in isolates, both coming from the same farm (IS2)
and other different farms. Furthermore, the allelic type 6
was originated in 2008 from farm AQ1. Isolates showing
two or three allelic profiles among the genetic markers also
with a high diversity index have been described [28].
Moreover, the TRs copy numbers of some loci may change
in the course of the adaptation in the host. Also strains re-
isolated from infected host showed minor changes [12].
These minor mutants can be caused by genetic events such
as DNA polymerase slippage and recombination.
Therefore, the isolates should be considered originating
from the same source or closely related strains. The geo-
graphical distribution of outbreaks, concentrated in a
500 km2 area, and the most representative risk factor
identified for the spreading of brucellosis in the area (use of
common pastures) are supporting these findings. In con-
clusion, the Brucella MLVA-16 is useful to analyze the
epidemiological correlation of strains, even in case of
analysis including samples showing low genetic diversity
in a restricted area, and can also be applied to trace the
geographic origin by comparing their genetic patterns
respect to isolates previously reported.
References
1. Corbel, M. J. (1997). Brucellosis: an overview. Emerging Infec-tious Diseases, 3, 213–221.
2. Pappas, G., Papadimitriou, P., Akritidis, N., Christou, L., &
Tsianos, E. V. (2006). The new global map of human Brucellosis.
The Lancet Infectious Diseases, 6, 91–99.
3. Euzeby, J.P. (2010). List of prokaryotic names with standing in
nomenclature—genus Brucella. Available: http://www.bacterio.
cict.fr/b/Brucella.html.
4. Scholz, H. C., Hubalek, Z., Sedlaek, I., Vergnaud, G., Tomaso,
H., Al Dahouk, S., et al. (2008). Brucella microti sp. nov., iso-
lated from the common vole Microtus arvalis. InternationalJournal of Systematic and Evolutionary Microbiology, 58,
375–382.
5. Foster, G., Osterman, B. S., Godfroid, J., Jacques, I., & Cloe-
ckaert, A. (2007). Brucella ceti sp. nov. and Brucella pinniped-ialis sp. nov. for Brucella s with cetaceans and seals as their
preferred hosts. International Journal of Systematic and Evolu-tionary Microbiology, 57, 2688–2693.
6. Scholz, H. C., Nockler, K., Gollner, C., Bahn, P., Vergnaud, G.,
Tomaso, H., et al. (2010). Brucella inopinata sp. nov., isolated
from a breast implant infection. International Journal of Sys-tematic and Evolutionary Microbiology, 60(Pt 4), 801–808.
7. Gwida, M., Al Dahouk, S., Melzer, F., Rosler, U., Neubauer, H.,
& Tomaso, H. (2010). Brucellosis—regionally emerging zoonotic
disease? Croatian Medical Journal, 51(4), 289–295.
8. Alton, G. G., Jones, L. M., Angus, R. D., & Verger, J. M. (1988).
Techniques for the Brucellosis laboratory. Paris: Institut National
de la Recherche Agronomique.
9. Bricker, B. J., & Halling, S. M. (1994). Differentiation of Bru-cella abortus bv.1, 2, and 4, Brucella melitensis, Brucella ovis,
and Brucella suis bv. 1 by PCR. Journal of Clinical Microbiol-ogy, 32, 2660–2666.
10. Hinic, V., Brodard, I., Thomann, A., Cvetnic, Z., Makaya, P. V.,
Frey, J., et al. (2008). Novel identification and differentiation of
Brucella melitensis, B. abortus, B. suis, B. ovis, B. canis, and B.neotomae suitable for both conven-tional and real-time PCR
systems. Journal of Microbiological Methods, 75, 375–378.
11. Gandara, B., Merino, A. L., Rogel, M. A., & Martinez-Romero,
E. (2001). Limited genetic diversity of Brucella spp. Journal ofClinical Microbiology, 39, 235–240.
12. Whatmore, A. M., Shankster, S. J., Perrett, L. L., Murphy, T. J.,
Brew, S. D., Thirlwall, R. E., et al. (2006). Identification and
characterization of variable-number tandem-repeat markers for
typing of Brucella spp. Journal of Clinical Microbiology, 44,
1982–1993.
Mol Biotechnol
123

13. Whatmore, A. M., Perrett, L. L., & MacMillan, A. P. (2007).
Characterisation of the genetic diversity of Brucella by multilo-
cus sequencing. BMC Microbiology, 7, 34.
14. Bricker, B. J., Ewalt, D. R., & Halling, S. M. (2003). Brucella‘Hoof-Prints’: typing by multi-locus analysis of variable number
tandem repeats (VNTRs). BMC Microbiology, 3, 15.
15. Le Fleche, P., Jacques, I., Grayon, M., Al Dahouk, S., Bouchon,
P., Denoeud, F., et al. (2006). Evaluation and selection of tandem
repeat loci for a Brucella MLVA typing assay. BMC Microbi-ology, 6, 9.
16. Al Dahouk, S., Le Fleche, P., Nockler, K., Jacques, I., Grayon,
M., Scholz, H. C., et al. (2007). Evaluation of Brucella MLVA
typing for human Brucellosis. Journal of Microbiological Meth-ods, 69, 137–145.
17. De Santis, R., Ciammaruconi, A., Faggioni, G., D’Amelio, R.,
Marianelli, C., & Lista, F. (2009). Lab on a chip genotyping for
Brucella spp. based on 15-loci multi locus VNTR analysis. BMCMicrobiology, 9, 66.
18. De Santis, R., Ciammaruconi, A., Faggioni, G., Fillo, S., Gentile,
B., Di Giannatale, E., et al. (2011). High throughput MLVA-16
typing for Brucella based on the microfluidics technology. BMCMicrobiology, 11, 60.
19. Marianelli, C., Graziani, C., Santangelo, C., Xibilia, M. T., Im-
briani, A., Amato, R., et al. (2007). Molecular epidemiological
and antibiotic susceptibility characterization of Brucella isolates
from humans in Sicily, Italy. Journal of Clinical Microbiology,45, 2923–2928.
20. Lista, F., Reubsaet, F. A., De Santis, R., Parchen, R. R., de Jong,
A. L., Kieboom, J., et al. (2011). Reliable identification at the
species level of Brucella isolates with MALDI-TOF-MS. BMCMicrobiology, 11, 267.
21. OIE World Organization for Animal Health (OIE). (2008).
Manual of Diagnostic Tests and Vaccines for Terrestrial Animals.
Paris: OIE.
22. Denœud, F., & Vergnaud, G. (2004). Identification of polymorphic
tandem repeats by direct comparison of genome sequence from dif-
ferentbacterial strains: a web-based resource. BMCBioinformatics, 5, 4.
23. Foster, J. T., Beckstrom-Sternberg, S. M., Pearson, T., Beck-
strom-Sternberg, J. S., Chain, P. S., Roberto, F. F., et al. (2009).
Whole-genome-based phylogeny and divergence of the genus
Brucella. Journal of Bacteriology, 191, 2864–2870.
24. Kilic, S., Ivanov, I. N., Durmaz, R., Bayraktar, M. R., Ayaslioglu,
E., Uyanik, M. H., et al. (2011). Multiple-locus variable-number
tandem-repeat analysis genotyping of human Brucella isolates
from Turkey. Journal of Clinical Microbiology, 49(9), 3276–3283.
25. Ferreira, A. C., Chambel, L., Tenreiro, T., Cardoso, R., Flor, L.,
Travassos Dias, I., et al. (2012). MLVA16 typing of Portuguese
human and animal Brucella melitensis and Brucella abortus iso-
lates. PLoS ONE, 7(8), e42514.
26. Muendo, E. N., Mbatha, P. M., Macharia, J., Abdoel, T. H.,
Janszen, P. V., Pastoor, R., et al. (2012). Infection of cattle in
Kenya with Brucella abortus biovar 3 and Brucella melitensis
biovar 1 genotypes. Tropical Animal Health and Production,44(1), 17–20. doi:10.1007/s11250-011-9899-9.
27. Kang, S. I., Heo, E. J., Cho, D., Kim, J. W., Kim, J. Y., Jung, S.
C., et al. (2011). Genetic comparison of Brucella canis isolates by
the MLVA assay in South Korea. Journal of Veterinary MedicalScience, 73(6), 779–786.
28. Her, M., Kang, S. I., Cho, D. H., Cho, Y. S., Hwang, I. Y., Heo,
Y. R., et al. (2009). Application and evaluation of the MLVA
typing assay for the Brucella abortus s isolated in Korea. BMCMicrobiology, 9, 230.
Mol Biotechnol
123