Aortic valve replacement with freehand autologous pericardium

Ultrasound in Med. & Biol., Vol. 34, No. 10, pp. 1638–1650, 2008© 2008 Published by Elsevier Inc. on behalf of World Federation for Ultrasound in Medicine & Biology
Printed in the USA. All rights reserved0301-5629/08/$–see front matter
doi:10.1016/j.ultrasmedbio.2008.03.009
● Original Contribution
FREEHAND REAL-TIME ELASTOGRAPHY: IMPACT OF SCANNINGPARAMETERS ON IMAGE QUALITY AND IN VITRO INTRA- AND
INTEROBSERVER VALIDATIONS
ROALD FLESLAND HAVRE,*† ERLEND ELDE,† ODD HELGE GILJA,*† SVEIN ÖDEGAARD,*†
GEIR EGIL EIDE,‡§ KNUT MATRE,† and LARS BIRGER NESJE*†
*National Centre for Ultrasound in Gastroenterology, Department of Medicine, Haukeland University Hospital,Bergen, Norway; †Institute of Medicine, University of Bergen, Bergen, Norway; ‡Centre for Clinical Research,
Haukeland University Hospital, Bergen, Norway; and §Section for Epidemiology and Medical Statistics, Departmentof Public Health and Primary Health Care, University of Bergen, Bergen, Norway
(Received 12 September 2007; revised 9 February 2008; in final form 10 March 2008)
Abstract—Real-time elastography is a method for visualization of the elastic properties of soft tissue and maypotentially enable differentiation between malignant and benign pathologic lesions. Our aim was to validate themethod on a tissue-mimicking (TM) phantom and to evaluate the influence of different scanning parameters andinvestigator variability. A TM-phantom containing eight spherical inclusions with known storage modulus wasexamined using two different transducers on an ultrasound (US) scanner equipped with software for real-timeelasticity imaging. The ultrasound transducers were moved vertically in a repetitive manner to induce strain. Twoinvestigators performed series of standardized elastography scans applying a 0-4 categorical quality scale to evaluatethe influence of seven parameters: dynamic range of elasticity, region-of-interest, frequency of transducer movement,rejection of elastogram noise, frame rate, persistence and smoothing. Subsequently, repeated examinations of fourselected inclusions were performed using a visual analog scale (VAS) where investigators marked a 100 mm horizontalline representing the span in image quality based on experience from the first examination. The hardest and softestinclusions were imaged more clearly than the inclusions with elasticity more similar to the background material.Intraobserver agreement on elastogram quality was good (kappa: 0.67 - 0.75) and interobserver agreement average(kappa: 0.55 - 0.56) when using the categorical scale. The subsequent VAS evaluation gave intraclass-correlationcoefficients for the two observers of 0.98 and 0.93, respectively, and an interclass-correlation coefficient of 0.93.Real-time elastography adequately visualized isoechoic inclusions with different elastic properties in a TM-phantomwith acceptable intra- and interobserver agreement. Dynamic range of elasticity was the parameter with most impacton the elastographic visualization of inclusions. (E-mail: [email protected]) © 2008 Publishedby Elsevier Inc. on behalf of World Federation for Ultrasound in Medicine & Biology.
Key Words: Real-time elastography, Ultrasonography, Free-hand application, Phantom, Strain, Elastic contrast,
Elasticity dynamic range, In vitro, Interobserver agreement, Intraobserver agreement.INTRODUCTION
Elastography is an ultrasound (US) based imagingmethod, which can display local differences in tissuestiffness by recording tissue strain in response to stress,applied in a repetitive manner (Ophir et al. 1991, 1999).Stress can be applied by moving a handheld transducervertically over the insonified tissue. In hard tissue, thetissue components are strained less than in softer tissueunder uniform stress. By cross-correlation of radio-fre-
Address correspondence to: Roald Flesland Havre, MD, Depart-
ment of Medicine, Haukeland University Hospital, N-5021 Bergen,Norway. E-mail: [email protected]1638
quency (RF) signals, the local strain can be calculated.Diagnostic strain imaging have previously been appliedto obtain strain information in moving organs such as theleft ventricle of the heart (Heimdal et al. 1998; Leitmanet al. 2004). Strain imaging emerges as a potential clin-ical tool for improvement of ultrasound tumor diagnosisand several manufacturers now offer elasticity imagingon their US-scanners.
Phantom examinations have been performed in anumber of studies concerning elasticity imaging algo-rithms and signal processing (Kallel et al. 1997; Kono-fagou and Ophir 1998; Parker et al. 1998). More re-
cently, quality control and endurance of elasticity phan-
seen in
Real-time elastography in vitro ● R. F. HAVRE et al. 1639
tom materials and the construction of more realisticanthropomorphic tissue-mimicking phantoms, takinginto account viscoelastic properties for soft tissues, havebeen published by Madsen et al. (2003, 2005a, 2005b,2006).
Clinically, the focus has been on the ability of elas-tography to distinguish cancer from benign lesions in softtissues. Reports of tissue elasticity imaging are available fora number of applications, e.g., in breast tissue (Itoh et al.
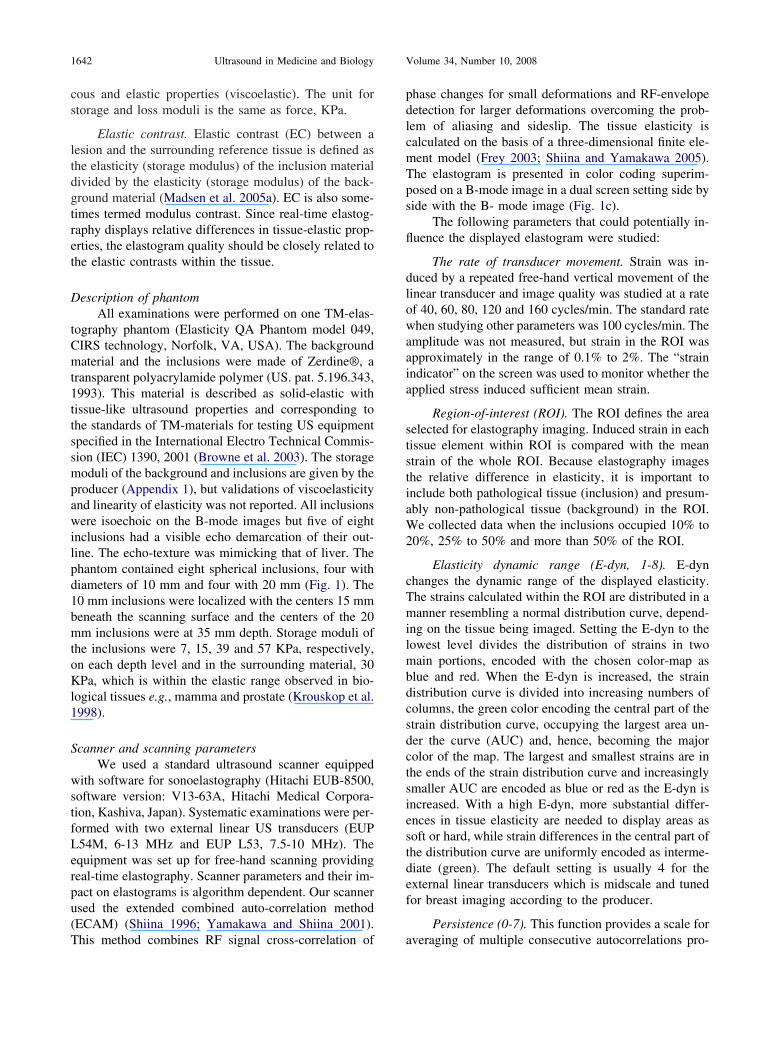
Fig. 1. The tissue mimicking phantom. a: Schematic oveRed: 7 KPa, Yellow: 15 KPa, Green: 39 KPa, Blue: 5transducer. c: Split image showing B-mode image (righ
indicator are
Table 1. Intraobserver data of elastogram qualitymimick
Probe L54(n �
Ka
Investigator A
Elasticity dynamic range (1-8) 0.71Rejection (0-4) 0.64Frame rate (5 levels) 1.00Region-of-interest, ROI (3 levels) 0.42Transducer movement (5 levels) 0.70Persistence (0-7) 0.65Smoothing (1-3) 1.00All observations 0.75
n � number of image scorings (number of inclusions x levels of th
* In some registrations with L54M frame rejection has been scored on levecorresponding levels were used for kappa estimates. This reduced the total nu
2006; Thomas et al. 2006), in prostate cancer diagnostics(Miyanaga et al. 2006; Pallwein et al. 2007) and for gyne-cological (Thomas et al. 2007) and upper endoscopic use(Saftoiu et al. 2006; Giovannini et al. 2006). By combininga B-mode image with an elastogram in real-time, valuableinformation about tissue elasticity can be obtained corre-sponding to the sonogram, which is more familiar to mostclinical examinators. Algorithms for elasticity imaging arealso developed for magnetic resonance imaging (MRI)
f inclusions indicating size, depth and storage modulus.and background: 30 KPa. b: Phantom with ultrasoundsuperimposed elastogram (left). Color scale and strainthe middle.
ed by a categorical scale 0-4 applied on a tissueantom
lusion 1-444]*)
Probe L53, Inclusion 1-8(n � 288)
lue Kappa value
B A B
0.49 0.83 0.600.90 0.53 0.750.46 0.60 0.700.88 0.26 0.330.72 0.61 0.880.69 0.79 0.650.71 0.77 0.820.67 0.71 0.70
g).
rview o7 KPat) with
assessing ph
M, Inc140 [1
ppa va
e settin
l 0-3, in others 0-2. If one set of data lacks four levels, only the threember of scorings from theoretical 144 to 140.
estigatoserver
1640 Ultrasound in Medicine and Biology Volume 34, Number 10, 2008
(Glaser et al. 2006; Hamhaber et al. 2003; Muthupillai et al.1995).
In order to perform free-hand real-time elastogra-phy, the investigator must apply stress by moving thetransducer, set the region-of-interest (ROI) and adjust anumber of parameter settings to optimize the elastogram.However, there are few published studies on how theelastography scanning parameters influence the visual-ization of elastic properties. In the present study, ourobjective was to score elasticity image quality of spher-ical isoechoic inclusions differing only in elasticity fromthe background material in a tissue-mimicking (TM)phantom and to evaluate the impact on image quality byadjusting seven scanning parameters. Additionally, weestimated intra- and interobserver variability using both acategorical and a continuous scale for evaluation.
MATERIALS AND METHODS
In vitro set-up and scanning protocolReal-time elastography was performed in vitro by
two investigators using a standardized scanning protocolon a TM-phantom containing eight spherical inclusionbodies of known size, depth and storage modulus em-bedded in a homogeneous background material withknown storage modulus (Fig. 1a and b). A predefinedevaluation form was filled in when investigating each ofthe seven parameters. Each parameter was evaluated bychanging it systematically while keeping the other pa-rameters fixed at preselected levels. The parameters eval-uated had a different number of scale-levels and thenumbers of observations (n) reported in Table 1 andTable 2, are the product of parameter levels and numberof examined inclusions (four inclusions for L54M andeight for L53). For categorization, we applied the fol-
Table 2. Interobserver data of elastogram quality assesp
Interobserver data CIRS 049Probe: L54M, Inclus
(n �
InvestigatorsAgreement (%)
B-A
Dynamic range of elasticity (1-8) 53Rejection 0-4 44Frame rate (5 levels) 75Region-of-interest, ROI (3 levels) 67Transducer movement (5 levels) 80Persistence (0-7) 71Smoothing (1-3) 67All obsevations: 65
Agreement percentage is the percentage of cases where the two invinvestigators made two sets of scorings for all parameters. For interob
lowing guidelines defining the visualization of the inclu-
sions as elastogram quality. Category 0: Not able toobtain continuous elastogram or inclusion is not de-tected. Category 1: The color is not unique for theinclusion but is represented also outside it. Poor delin-eation of the inclusion or only the upper part is delin-eated; measurement of size would be inaccurate. In thefrozen state, the elastogram merges largely with thebackground but in the continuous elastogram, the inclu-sion is detectable because its color is more stable than thein the surroundings (Fig. 2a). Category 2: The color isnot unique for the inclusion but is also represented out-side it at the same depth. In the frozen elastogram, theinclusion is visible though margins are blurred. Delinea-tion of the inclusion is possible and more than 50% isdelineated. Measurement of size would be possible butinaccurate in many planes (Fig. 2b). Category 3: Thecolor is not unique for the inclusion but is predominantinside it at the depth of the inclusion. Color is shownmore intensely inside the inclusion in both the continu-ous elastogram and in the frozen image. The delineationmakes a good representation of the inclusion. Measure-ment would be possible across more than 80% of themargins of the inclusion (Fig. 2c). Category 4: The colorof the inclusion is seen predominantly inside the inclu-sion at the depth of the inclusion. The color of theinclusion is stable in both continuous scanning an in thefrozen image. The delineation of the inclusion is sharpand accurate measurement of size is possible in mostdirections (Fig. 2d). Even if the continuous real-timeelastogram was given some attention in the categorydescription, in practice, the two investigators (RFH andEE) scored the best obtainable frozen images on eachlevel of the studied.
In the first part of the study, the above mentioned
a categorical scale 0-4 applied on a tissue mimicking
CIRS 049 Probe: L53, Inclusion 1-8 CIRS 049(n � 288)
Kappa value Agreement (%) Kappa valueB-A B-A B-A
0.38 75 0.640.19 78 0.670.64 53 0.400.54 75 0.630.70 58 0.430.57 53 0.390.53 71 0.600.56 65 0.55
rs chose the same category for the same inclusion and settings. Bothcomparison, the last recorded data set was used.
sed byhantom
ion 1-4143)
categorical quality scale was applied. This scale is sim-

ding to
Real-time elastography in vitro ● R. F. HAVRE et al. 1641
ilar to those previously used for classifying pathology inclinical elastography trials (Itoh et al. 2006; Garra et al.1997; Giovannini et al. 2006). Each observer did twoscorings of the same inclusion and parameter combina-tion. The time interval between the two scorings usingthe same transducer and parameter was 2 to 130 d. Meaninterval was 39 � 26 d. For two measurements, theinterval could not be determined but all examinationswere done within the 130-d period.
After the initial investigation, the two investigatorsmade a selective examination on four of the eight inclu-sions. We wanted to focus mainly on the harder inclu-sions but for the evaluation of elasticity imaging, we alsoincluded one soft inclusion. We selected the two smallestand most superficial inclusions with a higher elasticitymodulus than the background (inclusion 3 and 4). Of thedeep and lager inclusions, inclusion 8 was chosen be-cause it was the hardest. As a soft target, we includedinclusion 5. Since the study with the categorical scoringhad indicated that the elasticity dynamic range (E-dyn)was the parameter with most influence on visualization,we chose to evaluate this parameter using the first fourlevels. We applied a continuous visual analogue scale(VAS) setting a mark on a 100 mm horizontal lineindicating an elastogram quality range from “no elasto-gram” (left) to “best elastogram” (right). The final score
Fig. 2. a-d: Examples of elastograms correspon
was the millimeters measured from the left end to the
mark. The inclusions selected for this scoring were num-ber 3, 4, 5 and 8. For details in physical differences of thephantom see Appendix 1.
In the VAS survey, the two investigators made threeconsecutive examinations within a period of 25 d. Theintervals between the repeated investigations were 7 to 17 d.A Seiko Quartz electronic metronome (SQM-358, Tokyo,Japan) was used to keep a standard pace on the transducermovement throughout our examinations. Room tempera-ture was measured at the start of every scanning session.Storing and scanning temperature for the phantom was 21to 23°C.
Definitions
Elastogram. The two-dimensional strain imagebased on auto-correlation of radio-frequency (RF) datafrom consecutive frames in the strained tissue or TM-material. The map of strain distribution is called anelastogram (Ophir et al. 2002).
Storage modulus. A measure of the elastic propertyof a tissue or material defined as the � strain/stress.Storage modulus is the real part of Young’s modulus.Loss modulus is representing the imaginary part ofYoung’s modulus and is related to material or tissues’
the categorical classification 1-4, respectively.
viscous properties. Biological tissues express both vis-
1642 Ultrasound in Medicine and Biology Volume 34, Number 10, 2008
cous and elastic properties (viscoelastic). The unit forstorage and loss moduli is the same as force, KPa.
Elastic contrast. Elastic contrast (EC) between alesion and the surrounding reference tissue is defined asthe elasticity (storage modulus) of the inclusion materialdivided by the elasticity (storage modulus) of the back-ground material (Madsen et al. 2005a). EC is also some-times termed modulus contrast. Since real-time elastog-raphy displays relative differences in tissue-elastic prop-erties, the elastogram quality should be closely related tothe elastic contrasts within the tissue.
Description of phantomAll examinations were performed on one TM-elas-
tography phantom (Elasticity QA Phantom model 049,CIRS technology, Norfolk, VA, USA). The backgroundmaterial and the inclusions were made of Zerdine®, atransparent polyacrylamide polymer (US. pat. 5.196.343,1993). This material is described as solid-elastic withtissue-like ultrasound properties and corresponding tothe standards of TM-materials for testing US equipmentspecified in the International Electro Technical Commis-sion (IEC) 1390, 2001 (Browne et al. 2003). The storagemoduli of the background and inclusions are given by theproducer (Appendix 1), but validations of viscoelasticityand linearity of elasticity was not reported. All inclusionswere isoechoic on the B-mode images but five of eightinclusions had a visible echo demarcation of their out-line. The echo-texture was mimicking that of liver. Thephantom contained eight spherical inclusions, four withdiameters of 10 mm and four with 20 mm (Fig. 1). The10 mm inclusions were localized with the centers 15 mmbeneath the scanning surface and the centers of the 20mm inclusions were at 35 mm depth. Storage moduli ofthe inclusions were 7, 15, 39 and 57 KPa, respectively,on each depth level and in the surrounding material, 30KPa, which is within the elastic range observed in bio-logical tissues e.g., mamma and prostate (Krouskop et al.1998).
Scanner and scanning parametersWe used a standard ultrasound scanner equipped
with software for sonoelastography (Hitachi EUB-8500,software version: V13-63A, Hitachi Medical Corpora-tion, Kashiva, Japan). Systematic examinations were per-formed with two external linear US transducers (EUPL54M, 6-13 MHz and EUP L53, 7.5-10 MHz). Theequipment was set up for free-hand scanning providingreal-time elastography. Scanner parameters and their im-pact on elastograms is algorithm dependent. Our scannerused the extended combined auto-correlation method(ECAM) (Shiina 1996; Yamakawa and Shiina 2001).
This method combines RF signal cross-correlation ofphase changes for small deformations and RF-envelopedetection for larger deformations overcoming the prob-lem of aliasing and sideslip. The tissue elasticity iscalculated on the basis of a three-dimensional finite ele-ment model (Frey 2003; Shiina and Yamakawa 2005).The elastogram is presented in color coding superim-posed on a B-mode image in a dual screen setting side byside with the B- mode image (Fig. 1c).
The following parameters that could potentially in-fluence the displayed elastogram were studied:
The rate of transducer movement. Strain was in-duced by a repeated free-hand vertical movement of thelinear transducer and image quality was studied at a rateof 40, 60, 80, 120 and 160 cycles/min. The standard ratewhen studying other parameters was 100 cycles/min. Theamplitude was not measured, but strain in the ROI wasapproximately in the range of 0.1% to 2%. The “strainindicator” on the screen was used to monitor whether theapplied stress induced sufficient mean strain.
Region-of-interest (ROI). The ROI defines the areaselected for elastography imaging. Induced strain in eachtissue element within ROI is compared with the meanstrain of the whole ROI. Because elastography imagesthe relative difference in elasticity, it is important toinclude both pathological tissue (inclusion) and presum-ably non-pathological tissue (background) in the ROI.We collected data when the inclusions occupied 10% to20%, 25% to 50% and more than 50% of the ROI.
Elasticity dynamic range (E-dyn, 1-8). E-dynchanges the dynamic range of the displayed elasticity.The strains calculated within the ROI are distributed in amanner resembling a normal distribution curve, depend-ing on the tissue being imaged. Setting the E-dyn to thelowest level divides the distribution of strains in twomain portions, encoded with the chosen color-map asblue and red. When the E-dyn is increased, the straindistribution curve is divided into increasing numbers ofcolumns, the green color encoding the central part of thestrain distribution curve, occupying the largest area un-der the curve (AUC) and, hence, becoming the majorcolor of the map. The largest and smallest strains are inthe ends of the strain distribution curve and increasinglysmaller AUC are encoded as blue or red as the E-dyn isincreased. With a high E-dyn, more substantial differ-ences in tissue elasticity are needed to display areas assoft or hard, while strain differences in the central part ofthe distribution curve are uniformly encoded as interme-diate (green). The default setting is usually 4 for theexternal linear transducers which is midscale and tunedfor breast imaging according to the producer.
Persistence (0-7). This function provides a scale for
averaging of multiple consecutive autocorrelations pro-
Real-time elastography in vitro ● R. F. HAVRE et al. 1643
viding a more persistent elastogram. When the parameteris increased, more temporally averaged strain data isdisplayed making the elastogram less flickering, andperception easier. We chose to set the persistence at level5 as the standard level in the categorical survey. For theVAS survey, we increased the persistence setting to 6.
Smoothing (1-3). Smoothing averages pixel to pixelchanges between the current autocorrelation and the pastneighboring autocorrelations thereby creating a smoothervisualization of the elastogram within the ROI. A higherlevel of curve-fitting of pixels is calculated when increas-ing this parameter. As standard settings, we used level 2for the categorical observations and level 3 for the VASevaluation.
Rejection (0-3). This function rejects autocorrela-tions which do not have a sufficient signal-to-noise ratio(SNR). The setting affects the rejection of autocorrela-tions and local areas within each frame simultaneously.Local areas without sufficient signal for autocorrelationor with too much noise compared with signal will not bedisplayed. The parameter can regulate, for instance, thelevel of lateral displacement allowed in autocorrelations.The observer can regulate the level of rejection (0-3).Increasing this level, leads to fewer elastograms beingdisplayed in live scanning. We usually chose to freezethe image and scroll to a representative frame for scor-ing. We chose level 1 as the standard level of this setting.
Frame rate. Frame rate refers to how often thescanner collects strain data for autocorrelation. Eachframe is a set of RF-signals which is correlated with aprevious frame (Zhu and Hall 2002). The examiner canchoose levels max, high, med, low and min and thescanner then responds with the actual frame rate basedon the size and depth of the ROI. The current frame rateis always displayed on the screen. We used position highas the standard level of this parameter.
Reference frequency. Linear transducer EUP L53(7.5-10 MHz) has two settings for the reference fre-quency selecting the level of received and transmittedfrequencies. To obtain acceptable images of the 20 mil-limeter-inclusions reaching from 2.5 to 4.5 cm in depth,we had to set the reference frequency at “low”. Forshallow elastography (1-3 cm), the “high” level providedthe best strain data but changing the setting to “low,”when scanning the superficial inclusions, did not alter theimage quality enough to change the categorical imagescoring. With the L54M probe, the reference frequencycould not be adjusted and this probe did not provideacceptable elastograms of the four deepest inclusions.
Two parameters, scan line density and color-maps,were not subject to evaluation in this study and had one
fixed position for all scans. Scan line density is thedistribution of transmitted RF-A lines distributed overthe linear probes (standard 192 crystal linear transduc-ers). The distance between these lines defines the level oflateral displacement measurements and, thereby, the lat-eral resolution of the elastogram image (Yamakawa andShiina 2001). The scanner had two settings, 1 and 2, thelatter calculating strain with a double number of scanlines and consequently reducing the frame rate. Hence,lateral spatial resolution is gained at the cost of temporalresolution. We chose level 2, the highest scan line den-sity setting for all our examinations.
Color-maps. Initial findings indicated that none ofthe seven optional color-maps improved image interpre-tation, therefore we used color-map 1 (default) for allexaminations. The brightness of the color-map could alsobe changed. We used default blend setting of 26%. Incolor-map 1, the softest areas become red, and increasinghardness is subsequently indicated by yellow, green andfinally blue for the hardest areas with least strain.
The strain indicator (1-6) shows whether enoughtissue displacement is achieved to adequately calculatelocal strains within the ROI. The indicator records themean strain in the ROI between consecutive frames andis displayed in real-time as a feedback to the examiner.The mid levels, 3-5 in a 1-7 scale have been defined bythe producer as the ideal level for real-time elastography,based on breast application experience. Low-amplitudestress can provide sufficient frame-to-frame strainingwhen decreasing the frame rate or increasing the rate ofcompressions.
The definitions of scaling and mathematical expres-sions for the above mentioned scanner parameters are theproperty of Hitachi Medical Corporation, Tokyo, Japan,and we have not gained access to this information.
Statistical methodsDifferent methods were applied to calculate intra-
and interobserver agreement. Coefficient of agreement,the kappa value, was calculated according to Cohen(1960). Agreement was regarded as modest with kappa0.41-0.60; good with kappa 0.61-0.80 and very goodwith kappa 0.81-1 (Altman 1991). The categorical inter-observer agreement was also recorded as absolute agree-ment, which is the percentage of cases where the twoobservers scored the inclusions within the same category.
In the continuous scale (VAS) survey, agreementbetween the investigators was graphically displayed as ascatter plot and also a modified Bland-Altman plot show-ing the differences between observer A and B for thethree consecutive individual VAS scores from a commonaverage value for both observers (Bland and Altman1986, 1999). The 95% limits of agreement are displayed
as mean scorings �1.96 standard deviations (SD). The
server
1644 Ultrasound in Medicine and Biology Volume 34, Number 10, 2008
intra- and interobserver agreement was also assessed bycalculating the intraclass correlation coefficient (intra-CC) and interclass correlation coefficient (inter-CC), re-spectively (Shrout and Fleiss 1979). We used the meanof three consecutive measurements with VAS scoresrather than the single measurements for calculation ofinter-CC with 95% confidence interval (CI). Interob-server agreement was classified as poor (inter-CC: 0.00-0.20), fair to good (inter-CC: 0.40-0.75) or excellent(inter-CC � 0.75) (Fleiss 1986).
The inclusions were divided into two groups. Group1 containing inclusions 1, 4, 5 and 8 representing thesoftest and hardest inclusions had manufacturer definedelastic contrasts (EC) 1.9 (hard) and 0.23 (soft) com-pared with the background material. Inclusions 2, 3, 6and 7 contained in group 2 had storage moduli more likethe background medium and EC 0.5 (soft) and 1.3 (hard),respectively. We expected group 2 to score lower forelastogram image quality than the first group (Vargheseet al. 2001).
Since EC value 1 represents no elastic differencebetween inclusion and background, we decided to alsocalculate the logarithm of EC (log EC). The shift be-tween relatively harder or softer tissue will occur at value0 on the logarithmic scale (Ponnekanti et al. 1995).Hence, softer inclusions will have a negative log ECwhile harder inclusions have a positive log EC. Loga-rithms of inverse elastic contrasts will have the samenegative or positive numeric value. The log EC of thesoft and the hard inclusions in group 1 were �0.64 and� 0.28, respectively, and in group 2, �0.30 and �0.11.Significance of difference in elastogram mean categori-cal scores was evaluated using analysis of variance for
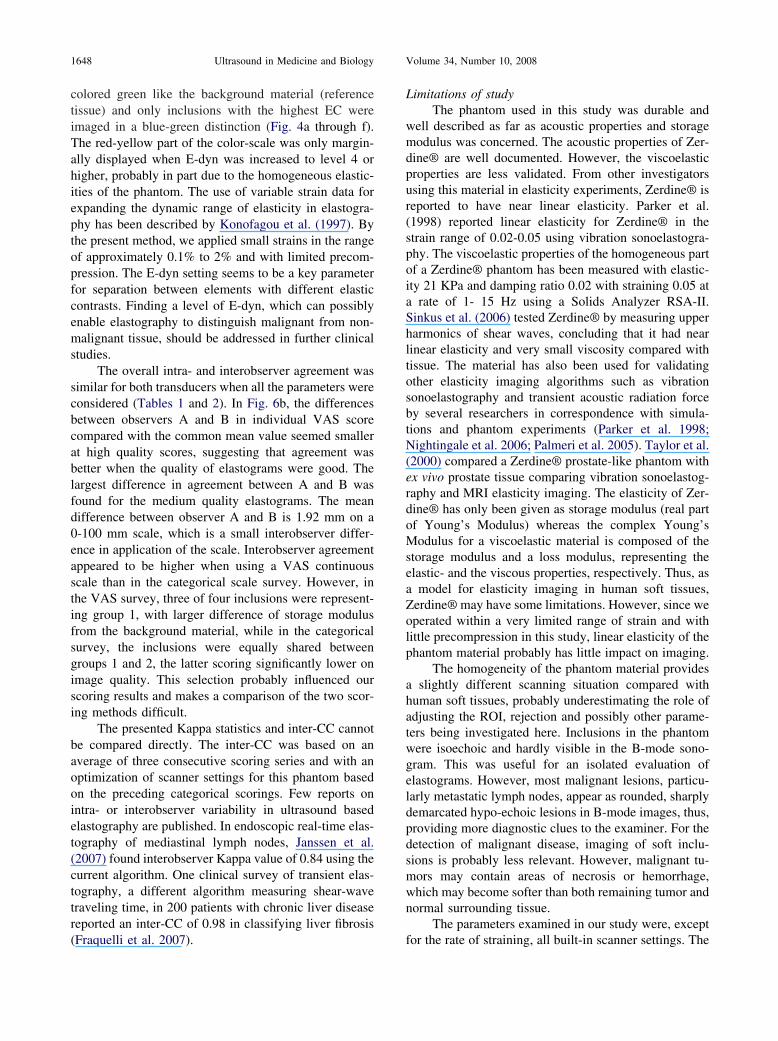
Fig. 3. a: Diagram showing mean categorical quality sca function of increasing E-dynamic range. 3b: Elastogram5 and 8. The vertical dotted lines in Fig. 3a indicate th
ob
repeated measures applying the general linear model
procedure of SPSS 14.0. Other statistical analyses andgraphics were made using SPSS version 14.0.
RESULTS
All inclusions of the phantom could be identified byreal-time elastography. By B-mode scanning, three ofeight inclusions were invisible due to isoechogeneity andfive had a barely visible demarcation.
Rate of transducer movement. At the rate 40 cycles/min, the real-time elastogram was discontinuous andvisible but frequently interrupted by frames without sig-nal. At 60 cycles/min, the real-time elastogram was morecontinuous when using a low frame rate. From 80 cycles/min, the real time elastogram was continuous for allframe rates. At a higher rate of movement, smaller am-plitude was needed to reach adequate strain, indicatingthat sufficient strain was created with smaller stress am-plitude with increasing stress frequency. Both observershad best quality scores in the range 80 to 120 cycles/minbut at 160 cycles/min, the image quality declined slightlyfor some observations. The investigator had to applymore stress (larger amplitude) in order to examine thedeep versus the shallow inclusions.
Region-of-interest (ROI). Best image quality was re-corded when the inclusion covered 25% to 50% of theROI. Lesions were centered in the ROI. Images of thehardest inclusions, numbers 4 and 8, were not influencedby the size of the ROI. When the inclusion occupied 10%to 20% of the ROI, the image was more affected by straindistribution artifacts of the phantom, such as strain decay
all eight inclusions represented by the colored lines asity score by continuous (VAS) scoring of inclusion 3, 4,namic range interval in Fig. 3b. Pooled results of boths.
ores ofqual
e E-dy
towards the deepest part of the ROI.

nge fr
Real-time elastography in vitro ● R. F. HAVRE et al. 1645
Elasticity dynamic range (E-dyn). This settingchanged elastogram quality in a similar pattern for allinclusions and to a larger degree than any of the otherparameters tested (Fig. 3a and b). Inclusions 2, 3, 6 and7 with log EC closer to 0 (�0.30 and �0.11) were onlydetectable with E-dyn levels 1-3 on a scale from 1-8.Inclusions with log EC further from 0 (�0.64 and �0.28) were detectable with a better image quality up toE-dyn levels 4-5. Setting E-dyn above 5 provided poorvisualization even for the hardest inclusions with elasticcontrasts of 1.93. An image series of inclusion 4 whenchanging E-dyn from 1-6 is shown in Fig. 4 a-f.
Persistence (0-7). Increasing persistence from 0 to 1made the largest impact on elastogram quality scoring
Fig. 4. Series of elastograms of inclusion 4 (hard, 57 KPE-dynamic ra
Fig. 5. Diagram showing the changes in elastogram quality forinclusions 1-8, when changing persistence from 0 to 7. Pooled
results of both observers.
for this parameter (Fig. 5). However, the images hadbetter categorical score for settings 6 and 7 in manyobservations. Increasing the persistence to the top levelintroduced a time-lag between movements and real-timeimage.
Through our systematic approach, changing theparameters smoothing (1-3), rejection (0-3) and framerate did not influence image quality assessment sub-stantially. For the deep inclusions, most observationsindicated a slightly improved image when smoothingwas increased from 1 to 3. When rejection was in-creased, the continuous elastogram recordings becamemore distorted and fewer autocorrelations were dis-played as elastograms. However, scoring was mainlydone on selected frozen frames for all parameters, andfor rejection, we scrolled to a representative elasto-gram. The frame rates varied from 6-13 frames/s forthe deepest and largest inclusions and from 7-16frames/s for the shallower and smaller inclusions fol-lowing the adjustment of the ROI. The frame rateinfluence on image quality was related to the rate ofmoving the transducer. A slower movement of thetransducer could allow continuous real-time elasto-grams with sufficient strain levels at low frame rates.
Reference frequency (H/L). In order to visualize thedeeper inclusions (15-35 mm depth), we had to usetransducer L53 (7.5-10 MHz) with the option L for lowfrequency. Transducer L54M was only operating with afrequency interval of 7-13 MHz. Frequency dependentdeterioration of strain estimates with depth was noted inaccordance with previous description by Varghese andOphir (1997). All deep inclusions were scored as cate-
ckground 30 KPa) showing the impact of changing theom 1-6 (a-f).
a in ba
gory 0 using the L54M and only results for the superfi-

rd devi
1646 Ultrasound in Medicine and Biology Volume 34, Number 10, 2008
cial inclusions, 1-4, were included in the statistical eval-uation with this transducer.
The quality of the elastogram was significantly re-lated to the EC between the inclusion and backgroundmaterial. When the inclusions were separated in groupsbased on their storage modulus, group 1 with inclusions1, 4, 5 and 8 with highest and lowest log EC scoredsignificantly better than inclusions in group 2 withsmaller log EC. This finding was reproduced for allcategorical parameters (p � 0.002).
Intraobserver agreement was good using the cate-gorical scale. The absolute intraobserver agreement forobservers A and B was 77% to 81% and 75% to 76%,respectively, for the two transducers, and the kappa valuewas close to 0.70 for both observers (0.67-0.75) (Table1). The interobserver results are presented in Table 2.When evaluating the rejection parameter setting, excel-lent intraobserver agreement was reached with kappavalues up to 0.90 but the interobserver agreement waspoor giving a kappa value of 0.19. For the other param-eter studies, the kappa value range was 0.39 to 0.70.Interobserver results showed absolute categorical agree-ment in 65% of examinations and Kappa values were0.55 and 0.56 for all examinations with transducersL54M and L53, respectively.
The VAS-scoring was repeated three times foreach investigator and the mean scores of investigatorA and B showed an intra-CC of 0.98 and 0.93, respec-tively. The inter-CC of the mean VAS scores of A and
Fig. 6. a: Correlation plot between VAS scores of four inobserver made 3 � 16 scorings, N � 48. b: Bland-Aconfidence interval (CI). Three consecutive VAS scores
between A and B is 1.9 mm, Standa
B was 0.93. Figure 6 shows the individual scores of
observer A and B before averaging. Figure 6a showsthe correlation of VAS-scorings between the observersand Fig. 6b shows that the limits of agreement definedas the 95% confidence interval were within �22 mmon a 100 mm scale.
DISCUSSION
In this study, we found that the scanner parameterE-dyn greatly influenced the quality of elastograms de-fined as elasticity visualization of harder and softer in-clusions in a TM phantom. We also found that the rate ofstraining and the persistence parameter had an impact onelasticity visualization. Other parameters such as the sizeof the ROI relative to inclusion size, rejection, smoothingand frame rate did not have any substantial influence onthe phantom elastograms. Applying a categorical evalu-ation and subsequently a continuous, visual analog scale,we found average and good interobserver agreement,respectively.
Rate of transducer movement in the range of 80-120/min provided elastograms with better mean qualityscore than lower rates. The real-time presentation of theelastogram became discontinuous when the compressionrate was below 60. This effect could be compensated forby reducing the frame-rate which was set to “high” inthis study, typically producing frame rates of 12-17frames/s. The image quality evaluation was mainly basedon frozen images selected from a cine loop. An expla-
s by investigator A and B. Line of unity is shown. Eachplot showing the limits of agreement defined as 95%erver A and B are displayed, N � 48. Mean differenceation: 11.1 mm on a 100 mm scale.
clusionltmanby obs
nation of improved scoring with higher rate of transducer

differe
Real-time elastography in vitro ● R. F. HAVRE et al. 1647
movement may be that when the elastogram is continu-ous, there are more frames containing elasticity data,while in a discontinuous elastogram the images contain-ing elasticity data are fewer and more scattered. Hence,it may be easier to select a high-quality frame when theavailable elastograms are numerous. Choosing frame rate“high” as the standard position, probably also favouredmore frequent compressions in order to produce suffi-cient RF signals for strain data recording between con-secutive frames. The findings on transducer movementrates may support the ability of the method to be usedclinically for example by exploiting the small amplitudeof stress provided by the aortic pulsations and heartbeat,which falls within this rate of straining, when appliedendoscopically in the upper GI-tract.
Among the scanner parameters evaluated, E-dyninfluenced the elastograms most profoundly (Fig. 4). Inthe applied phantom made of a homogeneous elasticmaterial with near linear elasticity, the inclusions withthe largest difference in storage modulus compared withthe background material were imaged with a higherquality and over a wider E-dyn range than inclusionswith smaller differences in storage modulus. This is,however, not necessarily true in human tissue wherelesions as well as surrounding tissue may have a largerrange in elasticity. Inclusions harder than the backgroundmaterial were better visualized than softer inclusions
Fig. 7. Diagrams showing mean VAS score by each obscontrast (EC). The four panels represent E-dynamic ravisualizes a larger drop in image quality score for the nemedium are better visualized than vice versa, and this
using both categorical and noncategorical evaluation.
This was observed even if the softest inclusions hadstorage modulus less than 1/4 of the background whilethe hardest inclusions had less than two times the storagemodulus of the background. Using the log EC, the in-verse value of the relative elasticity (e.g., 1/4 and 4/1)will be numerically identical but with opposite positiveor negative sign. In Fig. 7, we have calculated the risinglog EC of inclusions 5, 3 and 4 and the asymmetriccurves indicate that elastography quality score of inves-tigator A and B were higher for a positive (�0.29) thanfor a negative value (�0.64) of the log EC. This findingis in accordance with the description of contrast-to-noiseratio for elasticity versus modulus contrast by Vargheseet al. (2001). The soft inclusions also dropped more inquality scores than the harder inclusions when E-dyn wasincreased (Fig. 3a and b). In Fig. 7, this is illustrated bythe increasingly asymmetric V-shaped curves with in-creasing E-dyn. This finding correlates well with previ-ous finite element model and phantom evaluation re-ported by Ponnekanti et al. (1995) who showed subop-timal contrast-transfer efficiency (CTE) of soft lesions inharder background.
All inclusions were imaged with a higher qualityscore when E-dyn was set low. A low E-dyn displayedphantom volumes of different storage moduli in a hard/soft (red/blue) distinction with very little volume dis-played as intermediate (green). With increasing E-dyn,
n 3 inclusions with increasing log values of the elasticttings from 1-4. The increasingly asymmetric patternlog EC value indicating that harder inclusions in a soft
nce is attenuated with increasing the E-dynamic range.
erver onge segative
the inclusions with intermediate elastic contrast were
1648 Ultrasound in Medicine and Biology Volume 34, Number 10, 2008
colored green like the background material (referencetissue) and only inclusions with the highest EC wereimaged in a blue-green distinction (Fig. 4a through f).The red-yellow part of the color-scale was only margin-ally displayed when E-dyn was increased to level 4 orhigher, probably in part due to the homogeneous elastic-ities of the phantom. The use of variable strain data forexpanding the dynamic range of elasticity in elastogra-phy has been described by Konofagou et al. (1997). Bythe present method, we applied small strains in the rangeof approximately 0.1% to 2% and with limited precom-pression. The E-dyn setting seems to be a key parameterfor separation between elements with different elasticcontrasts. Finding a level of E-dyn, which can possiblyenable elastography to distinguish malignant from non-malignant tissue, should be addressed in further clinicalstudies.
The overall intra- and interobserver agreement wassimilar for both transducers when all the parameters wereconsidered (Tables 1 and 2). In Fig. 6b, the differencesbetween observers A and B in individual VAS scorecompared with the common mean value seemed smallerat high quality scores, suggesting that agreement wasbetter when the quality of elastograms were good. Thelargest difference in agreement between A and B wasfound for the medium quality elastograms. The meandifference between observer A and B is 1.92 mm on a0-100 mm scale, which is a small interobserver differ-ence in application of the scale. Interobserver agreementappeared to be higher when using a VAS continuousscale than in the categorical scale survey. However, inthe VAS survey, three of four inclusions were represent-ing group 1, with larger difference of storage modulusfrom the background material, while in the categoricalsurvey, the inclusions were equally shared betweengroups 1 and 2, the latter scoring significantly lower onimage quality. This selection probably influenced ourscoring results and makes a comparison of the two scor-ing methods difficult.
The presented Kappa statistics and inter-CC cannotbe compared directly. The inter-CC was based on anaverage of three consecutive scoring series and with anoptimization of scanner settings for this phantom basedon the preceding categorical scorings. Few reports onintra- or interobserver variability in ultrasound basedelastography are published. In endoscopic real-time elas-tography of mediastinal lymph nodes, Janssen et al.(2007) found interobserver Kappa value of 0.84 using thecurrent algorithm. One clinical survey of transient elas-tography, a different algorithm measuring shear-wavetraveling time, in 200 patients with chronic liver diseasereported an inter-CC of 0.98 in classifying liver fibrosis
(Fraquelli et al. 2007).Limitations of studyThe phantom used in this study was durable and
well described as far as acoustic properties and storagemodulus was concerned. The acoustic properties of Zer-dine® are well documented. However, the viscoelasticproperties are less validated. From other investigatorsusing this material in elasticity experiments, Zerdine® isreported to have near linear elasticity. Parker et al.(1998) reported linear elasticity for Zerdine® in thestrain range of 0.02-0.05 using vibration sonoelastogra-phy. The viscoelastic properties of the homogeneous partof a Zerdine® phantom has been measured with elastic-ity 21 KPa and damping ratio 0.02 with straining 0.05 ata rate of 1- 15 Hz using a Solids Analyzer RSA-II.Sinkus et al. (2006) tested Zerdine® by measuring upperharmonics of shear waves, concluding that it had nearlinear elasticity and very small viscosity compared withtissue. The material has also been used for validatingother elasticity imaging algorithms such as vibrationsonoelastography and transient acoustic radiation forceby several researchers in correspondence with simula-tions and phantom experiments (Parker et al. 1998;Nightingale et al. 2006; Palmeri et al. 2005). Taylor et al.(2000) compared a Zerdine® prostate-like phantom withex vivo prostate tissue comparing vibration sonoelastog-raphy and MRI elasticity imaging. The elasticity of Zer-dine® has only been given as storage modulus (real partof Young’s Modulus) whereas the complex Young’sModulus for a viscoelastic material is composed of thestorage modulus and a loss modulus, representing theelastic- and the viscous properties, respectively. Thus, asa model for elasticity imaging in human soft tissues,Zerdine® may have some limitations. However, since weoperated within a very limited range of strain and withlittle precompression in this study, linear elasticity of thephantom material probably has little impact on imaging.
The homogeneity of the phantom material providesa slightly different scanning situation compared withhuman soft tissues, probably underestimating the role ofadjusting the ROI, rejection and possibly other parame-ters being investigated here. Inclusions in the phantomwere isoechoic and hardly visible in the B-mode sono-gram. This was useful for an isolated evaluation ofelastograms. However, most malignant lesions, particu-larly metastatic lymph nodes, appear as rounded, sharplydemarcated hypo-echoic lesions in B-mode images, thus,providing more diagnostic clues to the examiner. For thedetection of malignant disease, imaging of soft inclu-sions is probably less relevant. However, malignant tu-mors may contain areas of necrosis or hemorrhage,which may become softer than both remaining tumor andnormal surrounding tissue.
The parameters examined in our study were, except
for the rate of straining, all built-in scanner settings. The
Real-time elastography in vitro ● R. F. HAVRE et al. 1649
mathematical expressions for defining these parametersor their scales were not available in published material orprovided by the manufacturer. It is a possibility that thescales of parameter settings may be subject to change infuture updates of the scanner software.
Categorical five-step scales have previously beenused for qualitative grading of elastograms from patho-logical lesions in breast, lymph nodes and pancreaticmasses (Giovannini et al. 2006; Hall et al. 2003; Itoh etal. 2006), while our categorical scale is applied on visu-alization of isoechoic, homogeneous structures. Errorsintroduced by differences in categorization can affectboth image scoring and pathology description. In theinterobserver comparison of the categorical scoring, wefound substantial differences between the observerswhen each of the parameters was considered separately.However, this part of the study was based on single setsof scored images, not an averaged value of repeatedobservations as for the inter-CC in the subsequent VASstudy. Performing the VAS survey after the categoricalscale survey implied that both observers had gained moreexperience in scanning the phantom. Together with theshorter time interval, different selection of inclusions anddifference in scoring method can explain the better in-terobserver results in the latter survey. Variations incolor vision between individuals may be a general lim-itation when using color mapping for strain recording inelastography.
SUMMARY
Real-time elastography adequately visualized dif-ferences in relative hardness of homogeneous inclu-sions in a TM-phantom. Harder, smaller and moresuperficial inclusions were imaged with a more accu-rate delineation than softer, larger and deeper inclu-sions. Hard inclusions with low elastic contrast (EC)generally scored lower on elastogram image qualitythan inclusions with higher EC. Soft inclusions arealso visualized according to their EC. Log EC willexpress negative values for soft inclusions and posi-tive values for hard inclusions with similar numericvalue for inverse elastic differences. Visualizationquality of softer inclusions dropped faster than harderinclusions when elasticity dynamic range was in-creased. E-dyn was the parameter most profoundlyinfluencing elastogram quality-scoring. Intraobserverstudies showed good reproducibility. Interobserveragreement was also acceptable. Knowledge obtainedon the effects of parameter setting on a TM-phantommay have to be modified to some extent when elas-tography is to be applied for human tissue. However,
the potential of this method for detection of lesionsand tissue characterization is promising and should befurther tested in a clinical setting.
Acknowledgments—This work was financially supported by WesternNorway Regional Health Authority, the University of Bergen and theMedViz consortium, an inter institutionary R&D program in medicalvisualization by the University of Bergen, Haukeland University Hos-pital and Christian Michelsen Research (CMR). The authors thank therepresentatives of Hitachi Medical Systems, Europe Holding AG, E.Bibby, MSc and K. Kukulski, MD for providing technical information.There is no conflict of interest and the above mentioned institutionsplayed no part in the development or approval of this manuscript.
REFERENCES
Altman D. Some common problems in medical research. Practicalstatistics for medical research. London: Chapman & Hall, 1991:396-409.
Bland JM, Altman D. Measuring agreement in method comparisonstudies. Stat Methods Med Res 1999;8:135–160.
Bland JM, Altman DG. Statistical methods for assessing agreementbetween two methods of clinical measurement. Lancet 1986;1:307–310.
Browne JE, Ramnarine KV, Watson AJ, Hoskins PR. Assessment ofthe acoustic properties of common tissue-mimicking test phantoms.Ultrasound Med Biol 2003;29:1053–1060.
Cohen JA. Coefficient of agreement for normal scales. Educ PsycolMeas 1960;20:27–46.
Fleiss JL. The design and analysis of clinical experiments. New York:John Wiley and Sons, 1986.
Fraquelli M, Rigamonti C, Casazza G, Conte D, Donato M, Ronchi G,Colombo M. Reproducibility of transient elastography in the eval-uation of liver fibrosis in patients with chronic liver disease. Gut2007;56:968–973.
Frey H. [Realtime elastography. A new ultrasound procedure for thereconstruction of tissue elasticity]. Radiologe 2003;43:850–855.
Garra BS, Cespedes EI, Ophir J, Spratt SR, Zuurbier RA, Magnant CM,Pennanen MF. Elastography of breast lesions: Initial clinical re-sults. Radiology 1997;202:79–86.
Giovannini M, Hookey LC, Bories E, Pesenti C, Monges G, DelperoJR. Endoscopic ultrasound elastography: The first step towardsvirtual biopsy? Preliminary results in 49 patients. Endoscopy 2006;38:344–348.
Glaser KJ, Felmlee JP, Manduca A, Kannan MY, Ehman RL. Stiffness-weighted magnetic resonance imaging. Magn Reson Med 2006;55:59–67.
Hall TJ, Zhu Y, Spalding CS. In vivo real-time freehand palpationimaging. Ultrasound Med Biol 2003;29:427–435.
Hamhaber U, Grieshaber FA, Nagel JH, Klose U. Comparison ofquantitative shear wave MR-elastography with mechanical com-pression tests. Magn Reson Med 2003;49:71–77.
Heimdal A, Stoylen A, Torp H, Skjaerpe T. Real-time strain rateimaging of the left ventricle by ultrasound. J Am Soc Echocardiogr1998;11:1013–1019.
Itoh A, Ueno E, Tohno E, Kamma H, Takahashi H, Shiina T, Ya-makawa M, Matsumura T. Breast disease: Clinical application ofUS elastography for diagnosis. Radiology 2006;239:341–350.
Janssen J, Dietrich CF, Will U, Greiner L. Endosonographic elastog-raphy in the diagnosis of mediastinal lymph nodes. Endoscopy2007;39:952–957.
Kallel F, Varghese T, Ophir J, Bilgen M. The nonstationary strain filterin elastography: Part II. Lateral and elevational decorrelation. Ul-trasound Med Biol 1997;23:1357–1369.
Konofagou E, Ophir J. A new elastographic method for estimation andimaging of lateral displacements, lateral strains, corrected axialstrains and Poisson’s ratios in tissues. Ultrasound Med Biol 1998;24:1183–1199.
Konofagou EE, Ophir J, Kallel F, Varghese T. Elastographic dynamic
range expansion using variable applied strains. Ultrason Imaging1997;19:145–166.
1650 Ultrasound in Medicine and Biology Volume 34, Number 10, 2008
Krouskop TA, Wheeler TM, Kallel F, Garra BS, Hall T. Elastic moduliof breast and prostate tissues under compression. Ultrason Imaging1998;20:260–274.
Leitman M, Lysansky P, Sidenko S, Shir V, Peleg E, Binenbaum M,Kaluski E, Krakover R, Vered Z. Two-dimensional strain-a novelsoftware for real-time quantitative echocardiographic assessment ofmyocardial function. J Am Soc Echocardiogr 2004;17:1021–1029.
Madsen EL, Frank GR, Hobson MA, Shi H, Jiang J, Varghese T, HallTJ. Spherical lesion phantoms for testing the performance of elas-tography systems. Phys Med Biol 2005a;50:5983–5995.
Madsen EL, Frank GR, Krouskop TA, Varghese T, Kallel F, Ophir J.Tissue-mimicking oil-in-gelatin dispersions for use in heteroge-neous elastography phantoms. Ultrason Imaging 2003;25:17–38.
Madsen EL, Hobson MA, Frank GR, Shi H, Jiang J, Hall TJ, VargheseT, Doyley MM, Weaver JB. Anthropomorphic breast phantoms fortesting elastography systems. Ultrasound Med Biol 2006;32:857–874.
Madsen EL, Hobson MA, Shi H, Varghese T, Frank GR. Tissue-mimicking agar/gelatin materials for use in heterogeneous elastog-raphy phantoms. Phys Med Biol 2005b;50:5597–5618.
Miyanaga N, Akaza H, Yamakawa M, Oikawa T, Sekido N, Hinotsu S,Kawai K, Shimazui T, Shiina T. Tissue elasticity imaging fordiagnosis of prostate cancer: A preliminary report. Int J Urol2006;13:1514–1518.
Muthupillai R, Lomas DJ, Rossman PJ, Greenleaf JF, Manduca A,Ehman RL. Magnetic resonance elastography by direct visualiza-tion of propagating acoustic strain waves. Science 1995;269:1854–1857.
Nightingale K, Palmeri M, Trahey G. Analysis of contrast in imagesgenerated with transient acoustic radiation force. Ultrasound MedBiol 2006;32:61–72.
Ophir J, Alam SK, Garra BS, Kallel F, Konofagou EE, Krouskop T,Merritt CRB, Righetti R, Souchon R, Srinivasan S, Varghese T.Elastography: Imaging the elastic properties of soft tissues withultrasound. J Med Ultrason 2002;29:155–171.
Ophir J, Alam SK, Garra B, Kallel F, Konofagou E, Krouskop T,Varghese T. Elastography: Ultrasonic estimation and imaging ofthe elastic properties of tissues. Proc Inst Mech Eng 1999;213:203–233.
Ophir J, Cespedes I, Ponnekanti H, Yazdi Y, Li X. Elastography: Aquantitative method for imaging the elasticity of biological tissues.Ultrason Imaging 1991;13:111–134.
Pallwein L, Mitterberger M, Pinggera G, Aigner F, Pedross F, Gradl J,Pelzer A, Bartsch G, Frauscher F. Sonoelastography of the prostate:Comparison with systematic biopsy findings in 492 patients. Eur J
Radiol 2007;65:304–310.* Physical parameters of the elastography phantom (CIRS, model 049) accoradded the logarithm of the elastic contrast (EC), which is the storage modulu
Palmeri ML, Sharma AC, Bouchard RR, Nightingale RW, NightingaleKR. A finite-element method model of soft tissue response toimpulsive acoustic radiation force. IEEE Trans Ultrason FerroelectrFreq Control 2005;52:1699–1712.
Parker KJ, Fu D, Graceswki SM, Yeung F, Levinson SF. Vibrationsonoelastography and the detectability of lesions. Ultrasound MedBiol 1998;24:1437–1447.
Ponnekanti H, Ophir J, Huang Y, Cespedes I. Fundamental mechanicallimitations on the visualization of elasticity contrast in elastogra-phy. Ultrasound Med Biol 1995;21:533–543.
Saftoiu A, Vilmann P, Hassan H, Gorunescu F. Analysis of endoscopicultrasound elastography used for characterization and differentia-tion of benign and malignant lymph nodes. Ultraschall Med 2006;27:535–542.
Shiina T, Doyley MM, Bamber JC. Strain imaging using combined RFand envelope autocorrelation processing. Ultrasonics Symposium,1996. Proceedings, 1996 IEEE, 1996;2:1331-1336.
Shiina T, Yamakawa M. Fast reconstruction of tissue elastic modulusimage by ultrasound. In: Proceedings of the 2005 IEEE, Engineer-ing in Medicine and Biology, Shanghai, China 2005:976-980.
Shrout PE, Fleiss JL. Intraclass correlations: Uses in assessing raterreliability. Psychological Bulletin 1979;86:420–428.
Sinkus R, Bercoff J, Tanter M, Gennisson JL, El-Khoury C, Servois V,Tardivon A, Fink M. Nonlinear viscoelastic properties of tissueassessed by ultrasound. IEEE Trans Ultrason Ferroelectr Freq Con-trol 2006;53:2009–2018.
Taylor LS, Porter BC, Rubens DJ, Parker KJ. Three-dimensionalsonoelastography: Principles and practices. Phys Med Biol 2000;45:1477–1494.
Thomas A, Kummel S, Fritzsche F, Warm M, Ebert B, Hamm B,Fischer T. Real-time sonoelastography performed in addition toB-mode ultrasound and mammography: Improved differentiation ofbreast lesions? Acad Radiol 2006;13:1496–1504.
Thomas A, Kummel S, Gemeinhardt O, Fischer T. Real-time sonoelas-tography of the cervix: Tissue elasticity of the normal and abnormalcervix. Acad Radiol 2007;14:193–200.
Varghese T, Ophir J. The nonstationary strain filter in elastography:Part I. Frequency dependent attenuation. Ultrasound Med Biol1997;23:1343–1356.
Varghese T, Ophir J, Konofagou E, Kallel F, Righetti R. Tradeoffs inelastographic imaging. Ultrason Imaging 2001;23:216–248.
Yamakawa M, Shiina T. Strain estimation using the extended autocor-relation method. Jpn J Appl Phys 2001;40:3872–3876.
Zhu Y, Hall TJ. A modified block matching method for real-time
freehand strain imaging. Ultrason Imaging 2002;24:161–176.APPENDIX 1.
Physical properties of CIRS 049 TM-elastography phantom
Elasticity(kPa)*
Speed of sound(m/s)*
Attenuation coefficient*(dB/cm/MHz)
Diameter(mm)*
Depth of center(mm)* Log EC
Background 30 1548 0.54 — — 0Inclusion 1 7 1548 0.46 10 15 �0.64Inclusion 2 15 1546 0.48 10 15 �0.30Inclusion 3 39 1563 0.52 10 15 �0.11Inclusion 4 58 1545 0.56 10 15 �0.29Inclusion 5 7 1548 0.46 20 35 �0.64Inclusion 6 15 1546 0.48 20 35 �0.30Inclusion 7 39 1563 0.52 20 35 �0.11Inclusion 8 58 1545 0.56 20 35 �0.29
ding to information given by the producer. In the last column, we haves of the inclusion/storage modulus of the background.
Copyright © 2022 FDOKUMEN