Frédéric ORIAS - Accueil | Le Graie
186
N˚d’ordre 2015-ENTP-0005 2015 THESE pour l’obtention du grade de Docteur de l’Ecole Nationale des Travaux Publics de l’Etat et de l’Université Claude Bernard Lyon 1 Université de Lyon Ecole doctorale : CHIMIE Spécialité : Environnement Préparée au Laboratoire d’Ecologie des Hydrosystèmes Naturels et Anthropisés UMR 5023 CNRS, ENTPE, UCB-Lyon 1 Présentée et soutenue publiquement par Frédéric ORIAS CONTRIBUTION A L’EVALUATION DES RISQUES ECOTOXICOLOGIQUES DES EFFLUENTS HOSPITALIERS : BIOCONCENTRATION, BIOACCUMULATION ET BIOAMPLIFICATION DES RESIDUS PHARMACEUTIQUES le 26/06/2015 devant le jury composé de : Christophe DAGOT Pr. à l’Université de Limoges nommé à l’ENSIL Rapporteur Benoit ROIG Pr. à l’Université de Nîmes Rapporteur Valéria MEZZANOTTE Enseignant-chercheur (PhD) Univ. de Milan, Italie Examinatrice Yann VOITURON Pr. à l’Université C. Bernard, Lyon Examinateur François LAURENT Dir. de Recherche (HDR) INRA, Toulouse Examinateur Laurent SIMON Maître de Conf. à l’Université C. Bernard, Lyon Examinateur Yves PERRODIN Dir. de Recherche (HDR) au LEHNA, ENTPE Directeur de thèse
-
Upload
khangminh22 -
Category
Documents
-
view
1 -
download
0
Transcript of Frédéric ORIAS - Accueil | Le Graie

N˚d’ordre 2015-ENTP-0005 2015
THESE
pour l’obtention du grade deDocteur de l’Ecole Nationale des Travaux Publics de l’Etat
et de l’Université Claude Bernard Lyon 1
Université de Lyon
Ecole doctorale : CHIMIE
Spécialité : Environnement
Préparée au Laboratoire d’Ecologie des Hydrosystèmes Naturels et Anthropisés
UMR 5023 CNRS, ENTPE, UCB-Lyon 1
Présentée et soutenue publiquement par
Frédéric ORIAS
CONTRIBUTION A L’EVALUATION DES RISQUESECOTOXICOLOGIQUES DES EFFLUENTS HOSPITALIERS :
BIOCONCENTRATION, BIOACCUMULATION ETBIOAMPLIFICATION DES RESIDUS PHARMACEUTIQUES
le 26/06/2015 devant le jury composé de :
Christophe DAGOT Pr. à l’Université de Limoges nommé à l’ENSIL RapporteurBenoit ROIG Pr. à l’Université de Nîmes RapporteurValéria MEZZANOTTE Enseignant-chercheur (PhD) Univ. de Milan, Italie ExaminatriceYann VOITURON Pr. à l’Université C. Bernard, Lyon ExaminateurFrançois LAURENT Dir. de Recherche (HDR) INRA, Toulouse ExaminateurLaurent SIMON Maître de Conf. à l’Université C. Bernard, Lyon ExaminateurYves PERRODIN Dir. de Recherche (HDR) au LEHNA, ENTPE Directeur de thèse

ii

Remerciements
La première personne que je tiens à remercier est Yves PERODIN. Je veux le remercier toutd’abord pour son accueil dans l’UMR LEHNA (Laboratoire d’Ecologie des Hydrosystèmes Naturelset Anthropisés) au sein de l’équipe « Impact des Polluants sur les Ecosystèmes »de l’ENTPE. Je leremercie également d’avoir mis à ma disposition tous les moyens humains et matériels que nécessi-taient mes travaux de thèse. Je veux également remercier Yves pour la liberté et la confiance qu’ilm’a accordé du premier au dernier jour de ma thèse ainsi que pour la réactivité dont il a fait preuvechacune des nombreuses fois où je l’ai sollicité. Enfin, je le remercie pour m’avoir fait profiter deson recul scientifique et de son expérience.
Je remercie ensuite tous les membres du jury de thèse d’avoir accepté mon invitation. Je remercieplus particulièrement Christophe DAGOT et Benoît ROIG pour leur travail de rapporteur. Jeremercie également Valeria MEZZANOTE, Yann VOITURON et François LAURENT d’être présentdans mon jury de thèse.
Je voudrais maintenant remercier une personne qui a été centrale dans mon travail de thèse grâceà son implication : Laurent SIMON. Merci à lui de m’avoir accordé considération et crédibilitédès le début de ce projet malgré les incertitudes. Je remercie Laurent SIMON pour le travail dedéveloppement de la méthode d’analyse isotopique sans laquelle beaucoup des travaux effectuéspendant ma thèse n’auraient pas pu voir le jour.
Plusieurs personnes ont également eu un rôle important dans mes travaux de recherche. Ainsi, jesouhaite les remercier les uns après les autres pour tous ce qu’ils ont pu m’apporter :
– Bernard CLEMENT pour son soutien lors de ma candidature à cette thèse ainsi que pourl’initiation à l’écotoxicologie lors de mon stage de master. Je le remercie également d’avoiraccepté de participer à mes comités de pilotage de thèse.
– Sylvie BONY pour sa disponibilité lors de mes questionnements ainsi que pour le chat decombat qui est désormais habitant de Millery ! Je la remercie également de m’avoir proposéde co-encadrer avec elle le stage de Marion AUBRAT qui m’a notamment permis de développermon expérience d’encadrant.
– Marion AUBRAT et Julien RODRIGUEZ pour la quantité et la qualité des travaux effectuéspendant leurs stages .
– Alain DEVAUX pour sa bienveillance et son expertise notamment sur l’utilisation et l’élevagedes Danio rerio.
– Claude DURRIEU pour avoir accepté de participer à mes comités de pilotage de thèse.
iii

REMERCIEMENTS
Pendant ma thèse, j’ai également reçu de nombreux soutiens d’ordres logistiques, techniques ouencore administratifs. Ainsi, je tenais à remercier tous ceux qui m’ont soutenu :
– Jean-Philippe BEDELL pour sa gentillesse, sa disponibilité et son accueil dans son bureaupendant ces trois ans de thèse. Je le remercie également pour les premiers meubles qu’il m’agénéreusement donné quand je suis arrivé à Lyon !
– Alicia NAVEROS-EUPHROSINE pour sa patience, sa bonne humeur et sa disponibilité auquotidien.
– Thérèse BASTIDE, Marc DANJEAN et Vanessa BROSSELIN pour leur assistance technique,leur disponibilité et leur efficacité à chaque fois que j’en ai eu besoin.
– Cecile DELOLME et Thierry WINIARSKI pour leurs conseils avisés et leurs encouragementspour le concours d’ITPE.
– Angeline CLAIR et Gladys MIALDEA pour avoir pris soin des Danio rerio que j’ai utilisépour l’expérience de bioconcentration.
– Adriana WIGH pour son professionnalisme et son aide pour l’acclimatation de mes 360 Daniorerio sacrifiés sur l’autel de la Science !
– Laurent LASSABATERE notamment pour son rôle de correspondant informatique inégalable !– Benjamin CAUSSE pour tout le temps gagné grâce à lui !
Je tiens à remercier trois doctorants qui ont particulièrement marqués ces trois dernières an-nées passées au laboratoire. Tout d’abord Morgane « La Directrice »GETTE-BOUVAROT poursa gentillesse et sa bienveillance à l’égard du nouveau doctorant que j’étais quand j’ai commencéma thèse. Je la remercie également pour les bons produits ramenés du Jura que j’ai su apprécier àleurs justes valeurs ! Ensuite, je remercie Guillaume « Guigui / Chouchou / Princesse Cacahuète /Bizuth »ATTARD, pour sa sincérité et sa franchise au quotidien. Je tiens à le remercier égalementpour son amitié et sa présence quand j’en ai eu besoin ainsi que pour le temps qu’il a passé àm’initier au logiciel LaTeX. Enfin, je remercie Clémentine « Clémenfouine / Bizuthe / Donatello /Choco »DRAPEAU pour sa générosité, sa gentillesse et sa patience à mon égard. D’autres docto-rants m’ont également marqué comme Antoine « Dexter Morgan »GOSSET que je remercie poursa gentillesse et son volontarisme. Je remercie aussi Pauline SIDOLI, Caroline ARCANJO, PierreGAYTE, Marine HUET, Etienne HANS, Nicole SCHIPER et Clélia LOPEZ pour tous les bonsmoments partagés ensemble.
Merci aux établissements La Tenaille S.A.S. (Particulièrement Mika & Tifo) pour nous avoirreçu tant de fois pour des réunions professionnelles plus ou moins tardives qui nous ont permis derésoudre de nombreuses problématiques tant scientifiques que techniques. Je remercie mes amis delongue date Mikael BRASERO, Matt RAMBLA, Florian GESLIN, Pierre MILLE, Pierre VALARDet Sylvain DENIS pour leur amitié, leur présence malgré l’éloignement et pour tous ce qu’ils ont pum’apporter.
Pour terminer ces remerciements, je veux remercier ma femme Agathe. Je la remercie pour sonsoutien indéfectible tant au quotidien que dans les pires moments que j’ai pu traverser pendant cestrois dernières années, et avant... Je la remercie pour la patience dont elle sait faire preuve depuisbientôt 10 ans ! Je la remercie aussi pour les encouragements et l’amour qu’elle me porte et quim’aident à avancer tous les jours.
iv

Table des matières
Liste des publications vii
Résumé-Abstract xi
Liste des figures xiii
Liste des tableaux xv
Liste des abréviations xvii
INTRODUCTION GENERALE 1
I APPROCHE BIBLIOGRAPHIQUE DE L’ECOTOXICITE DESEFFLUENTS HOSPITALIERS 11
1 Ecotoxicité des effluents hospitaliers 151.1 Enjeux et démarche . . . . . . . . . . . . . . . . . . . . . . . . . . . . . . . . . . . . 151.2 Article 1 : Characterisation of the ecotoxicity of hospital effluents : a review . . . . . 161.3 Synthèse . . . . . . . . . . . . . . . . . . . . . . . . . . . . . . . . . . . . . . . . . . . 45
2 Ecotoxicité des résidus pharmaceutiques des effluents hospitaliers 472.1 Enjeux et démarche . . . . . . . . . . . . . . . . . . . . . . . . . . . . . . . . . . . . 472.2 Article 2 : Pharmaceuticals in hospital wastewater : Their ecotoxicity and contribution
to the environmental hazard of the effluent . . . . . . . . . . . . . . . . . . . . . . . . 472.3 Synthèse . . . . . . . . . . . . . . . . . . . . . . . . . . . . . . . . . . . . . . . . . . . 59
3 Transferts des résidus pharmaceutiques dans la biocœnose aquatique 613.1 Définition des concepts clés . . . . . . . . . . . . . . . . . . . . . . . . . . . . . . . . 613.2 Impacts du transfert des contaminants sur les écosystèmes . . . . . . . . . . . . . . . 623.3 Caractérisation de la bioaccumulabilité . . . . . . . . . . . . . . . . . . . . . . . . . . 63
3.3.1 Coefficient de partage . . . . . . . . . . . . . . . . . . . . . . . . . . . . . . . 633.3.2 Relation quantitative entre structure et activité (QSAR) . . . . . . . . . . . . 643.3.3 Caractérisation expérimentale . . . . . . . . . . . . . . . . . . . . . . . . . . . 65
3.4 Les résidus pharmaceutiques dans l’Environnement . . . . . . . . . . . . . . . . . . . 663.4.1 Problèmatique générale . . . . . . . . . . . . . . . . . . . . . . . . . . . . . . 663.4.2 Les résidus pharmaceutiques bioaccumulables . . . . . . . . . . . . . . . . . . 67
3.5 La priorisation des résidus pharmaceutiques . . . . . . . . . . . . . . . . . . . . . . . 67
v

TABLE DES MATIÈRES
II CARACTERISATION DE L’ECOTOXICITE DES RESIDUSPHARMACEUTIQUES MODELES 71
4 Caractérisation préliminaire de l’écotoxicité des contaminants modèles 754.1 Introduction . . . . . . . . . . . . . . . . . . . . . . . . . . . . . . . . . . . . . . . . . 754.2 Matériels et méthodes . . . . . . . . . . . . . . . . . . . . . . . . . . . . . . . . . . . 76
4.2.1 Inhibition de la croissance de P. subcapitata (72h) . . . . . . . . . . . . . . . 764.2.2 Immobilisation de D. magna (48h) . . . . . . . . . . . . . . . . . . . . . . . . 764.2.3 Inhitbition du broutage 48h sur D. magna . . . . . . . . . . . . . . . . . . . . 764.2.4 Inhibition de la luminescence de V. fisherii (30min) . . . . . . . . . . . . . . 77
4.3 Résultats . . . . . . . . . . . . . . . . . . . . . . . . . . . . . . . . . . . . . . . . . . 784.3.1 Ecotoxicité du ritonavir . . . . . . . . . . . . . . . . . . . . . . . . . . . . . . 784.3.2 Ecotoxicité de l’amiodarone . . . . . . . . . . . . . . . . . . . . . . . . . . . . 784.3.3 Ecotoxicité du tamoxifen . . . . . . . . . . . . . . . . . . . . . . . . . . . . . 78
4.4 Discussion . . . . . . . . . . . . . . . . . . . . . . . . . . . . . . . . . . . . . . . . . . 794.4.1 Ecotoxicité des contaminants modèles . . . . . . . . . . . . . . . . . . . . . . 794.4.2 Valeurs nominales et réelles . . . . . . . . . . . . . . . . . . . . . . . . . . . . 804.4.3 Complémentarité des tests écotoxicologiques . . . . . . . . . . . . . . . . . . . 80
4.5 Conclusion et synthèse . . . . . . . . . . . . . . . . . . . . . . . . . . . . . . . . . . . 81
5 Ecotoxicité comparative de deux médicaments modèles et de leurs principesactifs respectifs 835.1 Enjeux et démarche . . . . . . . . . . . . . . . . . . . . . . . . . . . . . . . . . . . . 835.2 Article 3 :Comparative ecotoxicity of tamoxifen citrate and amiodarone hydrochloride
and their respective active ingredients . . . . . . . . . . . . . . . . . . . . . . . . . . 835.3 Synthèse . . . . . . . . . . . . . . . . . . . . . . . . . . . . . . . . . . . . . . . . . . . 95
6 Evaluation du risque écotoxicologique du tamoxifen 976.1 Enjeux et démarche . . . . . . . . . . . . . . . . . . . . . . . . . . . . . . . . . . . . 976.2 Article 4 :Tamoxifen ecotoxicity and resulting risks for aquatic ecosystems . . . . . . 976.3 Synthèse . . . . . . . . . . . . . . . . . . . . . . . . . . . . . . . . . . . . . . . . . . . 105
III ETUDE EXPERIMENTALE DU TRANSFERT TROPHIQUED’UN RESIDU PHARMACEUTIQUE MODELE 107
7 Bioconcentration du 15N tamoxifen chez Pseudokirchneriella subcapitata 1137.1 Enjeux et démarche . . . . . . . . . . . . . . . . . . . . . . . . . . . . . . . . . . . . 1137.2 Article 5 :Experimental assessment of the bioconcentration of 15N-tamoxifen in Pseu-
dokirchneriella subcapitata . . . . . . . . . . . . . . . . . . . . . . . . . . . . . . . . 1137.3 Synthèse . . . . . . . . . . . . . . . . . . . . . . . . . . . . . . . . . . . . . . . . . . . 121
8 Bioaccumulation du 15N tamoxifen chez Daphnia magna 1238.1 Enjeux et démarche . . . . . . . . . . . . . . . . . . . . . . . . . . . . . . . . . . . . 1238.2 Article 6 : Respective contributions of diet and medium to the bioaccumulation of
pharmaceutical compounds in the first levels of an aquatic trophic web . . . . . . . . 1238.3 Synthèse . . . . . . . . . . . . . . . . . . . . . . . . . . . . . . . . . . . . . . . . . . . 133
vi

TABLE DES MATIÈRES
9 Bioconcentration du 15N tamoxifen chez Danio rerio 1359.1 Enjeux et démarche . . . . . . . . . . . . . . . . . . . . . . . . . . . . . . . . . . . . 1359.2 Article 7 : Bioconcentration of 15N-tamoxifen at environmental concentration in liver,
gonad and muscle of Danio rerio . . . . . . . . . . . . . . . . . . . . . . . . . . . . . 1369.3 Synthèse . . . . . . . . . . . . . . . . . . . . . . . . . . . . . . . . . . . . . . . . . . . 143
CONCLUSION ET PERSPECTIVES GENERALES 144
Annexe 154
Bibliographie 159
vii

TABLE DES MATIÈRES
viii

Liste des publications
Articles publiés ou à soumettre dans un journal nationalou international avec comité de lectureOrias F., Rambla M., Rodriguez J., Brosselin V., Guillou C., Perrodin Y., à soumettre. Compara-tive acute ecotoxicity of tamoxifen citrate and amiodarone hydrochloride and their respective activeingredients.
Perrodin Y., Bazin C., Orias F., Bastide T., Wigh A., Berlioz-Barbier A., Vuillet E., Wiest L.in press. A posteriori assessment of ecotoxicological risks linked to building a hospital, Chemosphere
Orias F., Simon L., Perrodin Y., 2015. Respective contributions of diet and medium to the bioaccu-mulation of pharmaceutical compounds in the first levels of an aquatic trophic web. EnvironmentalScience and pollution Research Disponible en ligne depuis le 28 août 2015
Orias F., Simon L., Mialdea G., Clair A., Brosselin V., Perrodin Y., 2015. Bioconcentration of15Ntamoxifen at environmental concentration in liver, gonad and muscle of Danio rerio. Ecotoxico-logy and Environmental Safety 120 : 457–462
Perrodin Y., Orias F., Boillot C., Brackers de Hugo A., Jean J., Panouilleres M., Emmanuel E.2015. Évaluation des risques écotoxicologiques liés aux effluents hospitaliers et recommandation degestion. Revue des Sciences de l’Eau 28 : 211–280
Orias F., Bony S., Devaux A., Aubrat M., Durrieu C., Hombert T., Wigh A. Perrodin Y., 2015.Tamoxifen ecotoxicity and resulting risks for aquatic ecosystems. Chemosphere 128 : 79–84.
Orias F., Simon L., Perrodin Y., 2015. Experimental assessment of the bioconcentration of 15Ntamoxifenin Pseudokirchneriella subcapitata. Chemosphere 122 : 251–256.
Perullini M., Orias F., Durrieu C., Jobbágy M., Bilmes S. A., 2014. Co-encapsulation of Daphniamagna and Microalgae in silica matrices, a stepping stone toward a portable Microcosm. Biotech-nology Reports 4 : 147–150.
Orias F. & Perrodin Y., 2014. Pharmaceuticals in hospital wastewater : their ecotoxicity and contri-bution to the environmental hazard of the effluent. Chemosphere 115 : 31–39.
Orias F. & Perrodin Y., 2014. Les résidus pharmaceutiques des effluents hospitaliers : Quels dangerspour les écosystèmes ? L’Actualité Chimique 381 : 17–23.
Orias, F. & Perrodin Y., 2013. Characterisation of the ecotoxicity of hospital effluents : A re-view. Science of The Total Environment 454 - 455 : 250–276.
ix

LISTE DES PUBLICATIONS
Communications orales dans un congrès national ou in-ternational avec comité de lectureOrias F. « Bioconcentration des résidus pharmaceutiques des effluents hospitaliers » In : Orias F.,Simon L. Perrodin Y., Conférence Eau & Santé : Les médicaments dans le cycle urbain de l’eau,26-27 mars 2015, Genève-Annemasse.
Perrodin Y., « Ecotoxicological Risk Assessment of Hospital Waste Water and Management Re-commendations » In : Perrodin Y., Orias F., Boillot C., Jean J., Brackers de Hugo A., AngervilleR., Panoullières M., Emmanuel E., 10th International congress of the GRUTTEE, Octobre 2014,Limoges.
Orias F. « Suivi de la bioconcentration d’un résidu pharmaceutique grâce aux isotopes stables. »In : Orias F., Simon L. Perrodin Y., Colloque de la SEFA, 1-2 juillet 2014, Besançon.
Orias F. « Ecotoxicity of the pharmaceuticals compounds of hospital effluent » In : Orias F. &Perrodin Y., Pharmaceuticals in the Environment : Is there a problem ?, 3-4 juin 2013, Nîmes.
Communication par affiche dans un congrès national ouinternationalOrias F., Simon L., Perrodin Y., « Comparison of 15N tamoxifen bioconcentration in aquatic orga-nisms (microalgae, daphnids and fishes) », SETAC Europe 25th Annual Meeting - Environmentalprotection in a multi-stressed world : challenges for science, industry and regulators. 3-7 mai 2015,Barcelone, Espagne.
Orias F., Simon L., Perrodin Y. « Étude de la bioconcentration, de la bioaccumulation et de labioamplification par marquage isotopique. », Colloque d’Ecophysiologie Animale, 7-9 nov. 2013,Lyon.
Clément B., Herbach U., Lamonica D., Orias F., Lopes C., Nézondet F., Charles S., « Towardsecotoxicological modelling in a laboratory microcosm - a first step focused on daphnid-algae inter-actions. » SETAC Europe 23rd Annual Meeting - Building a Better Future : Responsible Innovationand Environmental Protection. 12-16 mai 2013, Glasgow, UK.
x

Résumé-Abstract
Contribution à l’évaluation des risques écotoxicologiques des effluents hospitaliers :bioconcentration, bioaccumulation et bioamplification des résidus pharmaceutiques
Les hôpitaux génèrent des effluents riches en résidus pharmaceutiques (RP), fonctions de leursactivités de soins et de diagnostic. Certains de ces RP sont aujourd’hui retrouvés de manière ubi-quitaire dans les écosystèmes aquatiques, en raison de leurs propriétés persistantes et/ou de leurémission continue. La variété de ces RP est telle qu’il est nécessaire de les hiérarchiser, en fonctiondes risques qu’ils représentent pour l’Environnement, à des fins d’étude et de gestion. Un de cesrisques est le transfert des RP bioaccumulables (i.e. Kow élevé et faible biodégradabilité) dans leschaînes alimentaires, via les processus de bioconcentration, de bioaccumulation et de bioamplifica-tion. L’objectif principal de cette thèse est de caractériser expérimentalement la bioconcentrationet la bioaccumulation de molécules identifiées comme prioritaires dans des travaux précédents. Lecomposé modèle que nous avons choisi est le tamoxifen, molécule utilisée contre le cancer du sein etdéjà retrouvé dans l’Environnement. Les organismes étudiés, issus des trois niveaux trophiques dela chaine alimentaire modèle, sont Pseudokirchneriella subcapitata, Daphnia magna et Danio rerio.Pour mesurer la teneur de cette molécule dans les organismes, nous avons développé une méthoded’analyse reposant sur l’utilisation d’une molécule marquée par un isotope stable, le 15N tamoxifen.Nous avons mesuré des facteurs de bioconcentration (BCF) allant de 12800 chez D. magna à 85600dans le foie de D. rerio en passant par 21500 chez P. subcapitata. Chez ces derniers, nous avonségalement évalué la part du régime alimentaire dans la bioaccumulation du tamoxifen. Nous avonsobservé que plus la concentration dans le milieu d’exposition est faible, plus le régime alimentairecontribue à la bioaccumulation. Ces travaux de thèse présentent de nombreuses perspectives quel’on peut regrouper autour de deux axes : connaissance de l’écotoxicité des RP et de l’écotoxicologieisotopique.
Contribution to ecotoxicological risk assessment of hospital effluents :bioconcentration, bioaccumulation & biomagnification of pharmaceutical compounds
Hospitals generates effluents rich in pharmaceuticals compounds (PC), notably because of careand diagnostics activities. Some of these PCs are ubiquitous in aquatic ecosystems owing to itspersistent properties and/or because of continuous releasing in environment. The diversity of thesePCs is so strong that it is necessary to prioritize them, considering risks that PCs represents forthe Environment, in order to manage and study these compounds. One of these risks is the transferof bioaccumulatives PCs (i.e. PCs with high Kow and low biodegradability) along trophic webs,via bioconcentration, bioaccumulation and biomagnification processes. The main objective of thisthesis is to characterize bioconcentration and bioaccumulation of molecules identified as priorityin previous studies. The model compound choose in our work is the tamoxifen, a molecule usedin the treatment of breast cancer and already found in Environment. Organisms studied, typicalfrom three trophic levels of the model trophic chain, are Pseudokirchneriella subcapitata, Daphniamagna and Danio rerio. In order to measure content of tamoxifen in organisms, we developed aninnovative analytic method based on the use of stable isotopes labelled tamoxifen : 15N tamoxifen.We succeeded to measure bioconcentration factors (BCF) from 12800 in D. magna to 85600 in liverof D. rerio including BCF of 21500 in P. subcapitata. In this latter, we also assessed the contributionof dietary route to the total contamination of D. magna by tamoxifen. We observed that the morethe medium concentration was weak, the more the dietary route contribute to the contamination.These works shows numerous perspectives that we can gather inside two axes : ecotoxicity knowledgeof PCs an isotopic ecotoxicology.
xi

xii

Table des figures
1 Diagramme représentant les sources et les flux de RP dans les différents com-partiments écosystémique (Lapworth et al., 2012) . . . . . . . . . . . . . . . . 7
2 Diagramme illustrant les objectifs de la thèse et les questions posées pour yrépondre . . . . . . . . . . . . . . . . . . . . . . . . . . . . . . . . . . . . . . . 8
3.1 Exemple de transfert de contaminant dans une chaîne alimentaire : Incorpora-tion et bioamplification du mercure dans une biocœnose dulçaquicole (issu deRamade (2002)). Encadré en noir le milieu d’exposition, en vert, les produc-teurs primaires, en rouge les consommateurs secondaires et en bleu les autresconsommateurs. . . . . . . . . . . . . . . . . . . . . . . . . . . . . . . . . . . . 63
3.2 Exemple de paramètres pris en compte par les approche QSAR pour évaluerla bioaccumulibilité d’une molécule(Adapté de Norstrom et Letcher 1996 inAbarnou and Blanchard (2000)) . . . . . . . . . . . . . . . . . . . . . . . . . . 64
3.3 Expression des facteurs de bioconcentration et de bioaccumulation de plusieurscontaminants déterminés expérimentalement chez des autotrophes (en haut àgauche), des invertébrés (en haut à droite) et des vertébrés (en bas au centre)en fonction des Kow respectifs de ces molécules (Figures issues de Arnot andGobas (2006)) . . . . . . . . . . . . . . . . . . . . . . . . . . . . . . . . . . . . 65
6.1 Schéma conceptuel de la chaîne alimentaire artificielle étudiée . . . . . . . . . 1096.2 Photographie de l’expérience « bioconcentration poisson » installée à l’Ecoa-
quatron, sur le site de la Doua à Villeurbanne. . . . . . . . . . . . . . . . . . 111
xiii

TABLE DES FIGURES
xiv

Liste des tableaux
1 Liste des 14 molécules prioritaires (Jean et al., 2012). En gras les moléculesles plus bioaccumulables de chaque catégorie. . . . . . . . . . . . . . . . . . . . 7
4.1 Description et propriétés physico-chimique des molécules prioritaires testées. . 754.2 Gammes des concentrations testées pour le tamoxifen, l’amiodarone et le rito-
navir chez V. fisheri, P. subcapitata et D. magna (NT : Non testé). . . . . . . 774.3 Synthèse des résultats des tests d’écotoxicité effectués pour le tamoxifen, l’amio-
darone et le ritonavir chez V. fisheri, P. subcapitata et D. magna (NT : Nontesté ; NA : Non applicable). . . . . . . . . . . . . . . . . . . . . . . . . . . . . 78
6.1 Structure et caractéristiques physico-chimiques du tamoxifen . . . . . . . . . . 110
xv

LISTE DES TABLEAUX
xvi

Liste des abréviations
AFNOR : Association Française de NormalisationBAF : Facteur de bioaccumulationBCF : Facteur de bioconcentrationCr : Chlamydomonas reinhardtiiCv : Chlorella vulgarisDm : Daphnia magnaEH : Effluent hospitalierHPLC : Chromatographie en phase liquide à haute performanceHQ : Quotient de dangerISO : Organisation Internationale de NormalisationKow : Coefficient de partage octanol/eauMEC : Concentration mesurée dans l’EnvironnementPCB : PolychlorobyphénylePNEC : Concentration prédite comme sans effetPs : Pseudokirchneriella subcapitataQSAR : Relation quantitative structure / activitéRP : Résidu pharmaceutiqueSTEP : Station d’épurationTMX : TamoxifenVf : Vibrio fisheri
xvii

xviii

1

2

INTRODUCTION GENERALE
3


INTRODUCTION GENERALE
De nos jours, les résidus pharmaceutiques (RP) sont omniprésents dans les écosystèmesaquatiques :
– Le compartiment acqueux. Au sein de ce compartiment central, nous pouvons dis-tinguer deux sous-compartiments contaminés : (i) Les eaux de surface c’est-à-dire leslacs (Blair et al., 2013; Fick et al., 2009), les rivières (Kolpin et al., 2002; Loos et al.,2009) et les eaux estuariennes et côtières (Claessens et al., 2013; Thomas and Hilton,2004) ; (ii) Les eaux profondes, c’est-à-dire les nappes phréatiques (Barnes et al., 2008;Loos et al., 2010).
– Le compartiment sédimentaire. De plus en plus d’études montrent que les sédimentssont contaminés par les RP, tant en milieu continental (Schultz et al., 2010; Silva et al.,2011) qu’en milieu estuarien (Vazquez-Roig et al., 2012; Yang et al., 2011).
Santos et al. (2010) ont publié une revue bibliographique qui recense notamment les concen-trations auxquelles on retrouve les résidus pharmaceutiques dans différents environnementsaquatiques (e.g. rivières, affluents et effluents de stations d’épurations, eaux profondes, sédi-ments, ...).
– Le compartiment biologique. En 2014, Zenker et al. (2014), ont publié une revuebibliographique qui regroupe l’ensemble des mesures des résidus pharmaceutiques dansles organismes vivants dans les rivières.
De nombreuses sources sont responsables de cette pollution aux RP (Figure 1). Il en existe5 majeures :
– Les effluents domestiques. Les effluents domestiques correspondent à tous les ef-fluents issus des habitations. En termes de flux, ces effluents représentent la plus grandesource de résidus pharmaceutiques (Langford and Thomas, 2009). Quand les médica-ments sont consommés, ils sont ensuite excrétés via l’urine et les fèces sous forme plusou moins métabolisées : on parle alors de résidus pharmaceutiques ou de résidus médi-camenteux. Une fois excrétés, ces RP se retrouvent dans les effluents domestiques quisont eux même envoyés vers la station d’épuration. Une des sources de pollutions auxRP pour les écosystèmes peut intervenir à ce moment du processus d’acheminementdes effluents domestiques. En effet, lorsque le réseau d’acheminement est unitaire, lastation d’épuration est parfois « court-circuitée »lors des orages et une quantité nonnégligeable (jusqu’à 15%) d’effluent est directement émise vers le milieu récepteur (leplus souvent une rivière) sans aucun traitement (Chèvre et al., 2013). Lorsque le réseaud’acheminement est séparatif, les effluents domestiques sont traités au sein de la stationd’épuration. Mais les stations d’épuration (STEP) ne sont pas conçues pour traiter desmolécules aussi complexes et variées que celles présentes dans la pharmacopée mon-diale. Ainsi, si les STEP peuvent être efficaces pour abattre à près de 100% certains RP(e.g. paracetamol), elles ne parviennent pas à traiter aussi efficacement tous les RP.
5

INTRODUCTION GENERALE
– Les effluents d’industries pharmaceutiques. Plusieurs études ont montré que leseffluents de l’industrie de conditionnement et/ou de formulation des médicaments sontà l’origine d’une pollution des rivières non négligeable (Collado et al., 2014; Sanchezet al., 2011). En effet, malgré une pression réglementaire qui impose de traiter ces ef-fluents, cela n’est pas toujours suffisant. Cardoso et al. (2014) illustrent qu’en fonctiondu type de médicament conditionné ou formulé sur un site donné, on peut observer deseffets liés à l’activité de tel ou tel médicament sur les organismes vivants en aval durejet de l’effluent (e.g. anabolisant qui augmente la masse des poissons touchés).
– Les élevages et l’aquaculture : Pour traiter les animaux d’élevages contre les pa-thogènes, les éleveurs ont recours à des médicaments vétérinaires qui, comme chezl’Homme, sont plus ou moins métabolisés et se retrouvent dans les lisiers une fois uti-lisés. De la même manière que dans les stations d’épurations à « usage humain », lesstations de traitement de lisiers animaux ne peuvent pas éliminer 100% des résiduspharmaceutiques. De plus, certains lisiers sont simplement stockés dans des bassins etinfiltrés dans le sol (Bartelt-Hunt et al., 2011). Ainsi, on pourra retrouver une quan-tité non négligeable de RP émise vers l’environnement (Sarmah et al., 2006). En cequi concerne l’aquaculture, que ce soit en milieu marin ou continental, le problème estplus complexe puisque les fèces ne sont pas récupérées. Ainsi, que ce soit les RP oules médicaments dispensés en excès, tous se retrouve directement dans l’environnement(Burridge et al., 2010; Kolodziej et al., 2004).
– Les effluents hospitaliers. En termes de concentrations, les effluents hospitaliers sontles plus concentrés en RP parmi les sources précitées (Verlicchi et al., 2010). Les établis-sements hospitaliers sont le siège d’activités très variées qui vont être responsables del’extrême diversité de contaminants présents dans les effluents hospitaliers. Les hôpitauxsont des établissements accueillant du public et hébergeant des patients. La premièreactivité va être à l’origine d’une pollution organique « classique »(i.e. lingerie, cuisine,eaux usées) assez proche de celles des effluents domestiques. Il existe au sein des hôpi-taux des activités qui lui sont beaucoup plus spécifiques, telles que le nettoyage intensifdes surfaces pour limiter l’apparition de maladies nosocomiales, ou encore telles que ladésinfections de sondes médicales. On retrouvera alors dans les effluents des quantitésextrêmement importantes de surfactants et de désinfectants, dont des produits chlorés.Mais les deux activités très spécifiques du milieu hospitalier qui concernent plus direc-tement ces travaux de thèse sont les activités de soins et de diagnostic de pathologie.Ces activités vont être à la source d’émission de RP dans les effluents hospitaliers. En-suite, ces effluents vont, dans la quasi-totalité des cas, directement, sans presqu’aucuntraitement préalable, rejoindre les STEP via le même réseau de canalisation que leseffluents domestiques. On retrouve ainsi les mêmes risques de pollution que ceux liés au
6

INTRODUCTION GENERALE
« court-circuit »de la STEP ou à l’inefficacité du traitement de la STEP. Notons qu’unepartie des effluents hospitaliers subit tout de même un prétraitement : il s’agit des eauxusées issues de la médecine nucléaire. Les effluents issus de ce service sont simplementstockés plusieurs jours le temps que la radioactivité de l’iode utilisé soit redescendue àson seuil réglementaire. Après ce stockage, ces effluents rejoignent également la STEPpar le réseau de canalisation municipal.
Figure 1 Diagramme représentant les sources et les flux de RP dans les différents compartimentsécosystémique (Lapworth et al., 2012)
Compte-tenu du fort potentiel polluant de cette dernière source de RP, de plus en plusd’étude s’intéressent aux risques écotoxicologiques que peuvent représenter ces effluents (Bra-ckers de Hugo et al., 2013; Emmanuel et al., 2005; Kümmerer, 2001; Verlicchi et al., 2012).Cependant, que ces risques soient envisagés selon une approche globale (i.e. matrice complète)ou spécifique (i.e. substance par substance), ce n’est que très récemment que les chercheursse sont intéressés à la bioaccumulabilité des substances qui peuvent être présentes dans leseffluents hospitaliers. Grâce à une approche théorique (i.e. « Quantitative Structure/ActivityRelation »), Jean et al. (2012) ont établi une liste de 14 molécules bioaccumulables prioritairesà étudier (Tableau 1).
Table 1 Liste des 14 molécules prioritaires (Jean et al., 2012). En gras les molécules les plusbioaccumulables de chaque catégorie.
Forte consommation Perturbation endocrinienne Ecotoxicité potentielleTamoxifen
Amiodarone Ethynilestradiol RitonavirDextropropoxyphene Mitotane Hexetidine
Desloratadine Norgestimate ItraconazoleNicardipine Amitryptiline Telethromycine
Mifepristone
7

INTRODUCTION GENERALE
Dans un premier temps, ils ont sélectionné 70 molécules prioritaires sur la base de leurbioaccumulabilité évaluée à partir de leur lipophilie. Cette liste a été ensuite ramenée à14 molécules prioritaires sur la base d’une analyse multicritère. Les molécules finales sélec-tionnées ont été classées dans 3 groupes en fonction du risque additionnel (en plus de labioaccumulabilité) qu’elles pouvaient représenter pour les écosystèmes :(i) molécules consommées en très forte quantité au sein des hôpitaux étudiés ; (ii) moléculesprésentant un risque de perturbation endocrinienne ; (iii) molécules présentant un potentielécotoxicologique. Pour nos travaux, nous avons choisi les composés les plus bioaccumulablesde ces 3 groupes de risque, respectivement, l’amiodarone, le tamoxifen et le ritonavir.
Pour mieux comprendre le fil conducteur qui a guidé mes travaux de thèse, le diagrammesuivant (Figure 2) présente les objectifs fixés au début de la thèse avec les questions que nousnous sommes posées pour y répondre.
Figure 2 Diagramme illustrant les objectifs de la thèse et les questions posées pour y répondre
8

INTRODUCTION GENERALE
Dans la première partie de ce document, nous présentons un état de l’art en troischapitres. Le premier chapitre correspond à une revue bibliographique sur la caractérisationdes effluents hospitaliers ainsi que sur l’écotoxicité de tous les contaminants déjà mesurés dansles effluents hospitaliers. Le deuxième chapitre se focalise sur l’impact écotoxicologique desRP au sein de ces effluents particuliers. Enfin, le troisième chapitre correspond une revuehistorique de la Découverte et la Recherche autour des problématiques de bioconcentration,bioaccumulation et de la bioamplification des contaminants dans les organismes aquatiques.
Ensuite, dans une deuxième partie, nous présentons les résultats de l’étude de l’écotoxi-cité des trois contaminants modèles. Dans le premier chapitre, nous effectuons une batteriede bioessais afin de caractériser l’écotoxicité aiguë et chronique de chacun des contaminantschoisis. Dans un second chapitre, nous vérifions la pertinence de l’utilisation des principesactifs plutôt que des médicaments (i.e. principe actif et excipient) dans les tests d’écotoxicitéen comparant leurs écotoxicités respectives. Finallement, dans un troisième chapitre, nousavons évalué le risque écotoxicologique du contaminant modèle le plus toxique : le tamoxifen.
Enfin, dans une troisième partie, nous présentons les différentes expérimentations re-latives à la bioconcentration et à la bioaccumulation de notre contaminant modèle. Cettedernière partie est divisée en 3 chapitres correspondant chacun à l’étude du transfert dansun niveau trophique : producteur primaire, consommateur primaire et consomma-teur secondaire.
Chacune de ces trois parties est constituée de la compilation d’articles scientifiques publiésou soumis dans des revues internationales à comité de lecture. Ces publications sont précédéesd’un paragraphe introductif sur les enjeux et la démarche de chaque article présenté. A lasuite de chaque article présenté, un paragraphe de synthèse rassemble les principaux résultats.
Enfin, dans la conclusion générale, nous effectuons un bilan des travaux effectués aucours de ces trois années de thèse ainsi qu’un bilan sur les perspectives générales et lessuites éventuelles à donner aux résultats obtenus.
9


Première partie
APPROCHE BIBLIOGRAPHIQUEDE L’ECOTOXICITE DES
EFFLUENTS HOSPITALIERS
11


L’étude bibliographique présentée ci-après correspond à un état des lieux des recherchesscientifiques menées dans le domaine des effluents hospitaliers d’une part, et autour de la pro-blématique « transfert des contaminants dans la biosphère », d’autre part. Dans le premierchapitre, nous avons fait un inventaire des contaminants déjà mesurés dans les effluents hos-pitaliers avec leur écotoxicité respective. Dans le deuxième chapitre nous avons effectuéun focus sur l’écotoxicité liée aux résidus pharmaceutiques présents dans les effluents hospi-taliers et au danger environnemental potentiel lié à leur présence. Enfin, dans un troisièmechapitre, nous avons pris du recul sur les recherches menées autour de la problématique debioconcentration, bioaccumulation et bioamplification des contaminants en général, et desrésidus pharmaceutiques en particulier.
13

14

Chapitre 1
Ecotoxicité des effluents hospitaliers
1.1 Enjeux et démarche
La première démarche adoptée dans ces travaux a été de caractériser les effluents hospi-taliers (EH). Or, plusieurs auteurs s’étaient déjà attachés à caractériser la composition deseffluents hospitaliers. Ces travaux de caractérisation répondaient cependant à des probléma-tiques très éloignées les unes des autres : contribution des EH à la présence de moléculesillicites (Lin et al., 2010), contribution des EH à la charge polluante dans les effluents ur-bains (Langford and Thomas, 2009; Ort et al., 2010; Verlicchi et al., 2010), développementde méthode analytique multi-résidus (Gros et al., 2013) ou encore la caractérisation descontaminants dans les effluents hospitaliers (Boillot et al., 2008; Kümmerer et al., 2000;Tauxe-Wuersch et al., 2006; Weissbrodt et al., 2009; Yuan et al., 2013). D’autres auteursse sont intéressés au risque écotoxicologique potentiel des effluents hospitaliers selon deuxapproches différentes mais néanmoins complémentaires : une approche « substance » (Perro-din et al., 2012; Verlicchi et al., 2012) ou une approche « matrice » (Emmanuel et al., 2005;Zgorska et al., 2011). Dans cette revue bibliographique, nous avons réuni au sein d’un mêmearticle toutes les données obtenues ces 20 dernières années sur la composition des effluentshospitaliers. Cela représente 173 prélèvements sur 115 hôpitaux à travers le monde. Pouraller plus loin, nous avons également réunis toutes les données d’écotoxicité disponibles pourles composés recherchés dans ces effluents ainsi que les données d’écotoxicité lié à l’effluentcomplet. Ainsi, nous avons caractérisé la toxicité des effluents hospitaliers selon les deux ap-proches précitées : (i) une approche « substance » qui s’intéresse à l’écotoxicité de tous lescontaminants recherchés dans les effluents ; (ii) une approche « matrice » qui rassemble tousles tests d’écotoxicité réalisés sur l’effluent entier.
15

CHAPITRE 1. ECOTOXICITÉ DES EFFLUENTS HOSPITALIERS
1.2 Article 1 : Characterisation of the ecotoxicity ofhospital effluents : a review
Article soumis le 1er février 2013, accepté le 22 février 2013 et publié le 29 mars 2013dans le journal « Science of the Total Environment ».
16

Review
Characterisation of the ecotoxicity of hospital effluents: A review
Frédéric Orias ⁎, Yves PerrodinUniversité de Lyon, ENTPE, CNRS, UMR 5023 LEHNA, 2 Rue Maurice Audin, 69518 Vaulx-en-Velin, France
H I G H L I G H T S
• All studies on the hospital wastewater chemistry or ecotoxicity were examined.• 155 PNEC (Predictive Non Effect Concentration) were calculated.• For this assessment, priority was given to the experimental values.• Very ecotoxic compounds have been identified.• Bioaccumulation is rarely considered in the prioritisation methods.
a b s t r a c ta r t i c l e i n f o
Article history:Received 1 February 2013Received in revised form 21 February 2013Accepted 22 February 2013Available online 29 March 2013
Keywords:Hospital wastewaterEcotoxicityChemical pollutantsPharmaceuticalsPNEC
The multiple activities that take place in hospitals (surgery, drug treatments, radiology, cleaning of premisesand linen, chemical and biological analysis laboratories, etc.), are a major source of pollutant emissions intothe environment (disinfectants, detergents, drug residues, etc.). Most of these pollutants can be found in hos-pital effluents (HWW), then in urban sewer networks and WWTP (weakly adapted for their treatment) andfinally in aquatic environments. In view to evaluating the impact of these pollutants on aquatic ecosystems, itis necessary to characterise their ecotoxicity. Several reviews have focused on the quantitative and qualitativecharacterisation of pollutants present in HWW. However, none have focused specifically on the characterisa-tion of their experimental ecotoxicity. We have evaluated this according to two complementary approaches:(i) a “substance” approach based on the identification of the experimental data in the literature for differentsubstances found in hospital effluents, and on the calculation of their PNEC (Predicted Non Effect Concentra-tion), (ii) a “matrix” approach for which we have synthesised ecotoxicity data obtained from the hospital ef-fluents directly. This work first highlights the diversity of the substances present within hospital effluents,and the very high ecotoxicity of some of them (minimum PNEC observed close to 0,01 pg/L). We also ob-served that the consumption of drugs in hospitals was a predominant factor chosen by authors to prioritisethe compounds to be sought. Other criteria such as biodegradability, excretion rate and the bioaccumulabilityof pollutants are considered, though more rarely. Studies of the ecotoxicity of the particulate phase of efflu-ents must also be taken into account. It is also necessary to monitor the effluents of each of the specialiseddepartments of the hospital studied. These steps is necessary to define realistic environmental managementpolicies for hospitals (replacement of toxic products by less pollutant ones, etc.).
© 2013 Elsevier B.V. All rights reserved.
Contents
1. Introduction . . . . . . . . . . . . . . . . . . . . . . . . . . . . . . . . . . . . . . . . . . . . . . . . . . . . . . . . . . . . . 2512. Characterisation of ecotoxicity according to the “substance” approach . . . . . . . . . . . . . . . . . . . . . . . . . . . . . . . . . . 251
2.1. Methodological approach . . . . . . . . . . . . . . . . . . . . . . . . . . . . . . . . . . . . . . . . . . . . . . . . . . . . 2512.2. Results . . . . . . . . . . . . . . . . . . . . . . . . . . . . . . . . . . . . . . . . . . . . . . . . . . . . . . . . . . . . . 252
2.2.1. Pharmaceutical compounds . . . . . . . . . . . . . . . . . . . . . . . . . . . . . . . . . . . . . . . . . . . . . . . 2522.2.2. Non-pharmaceutical compounds . . . . . . . . . . . . . . . . . . . . . . . . . . . . . . . . . . . . . . . . . . . . 256
3. Characterisation of ecotoxicity through a “matrix” approach . . . . . . . . . . . . . . . . . . . . . . . . . . . . . . . . . . . . . . . 2713.1. Methodology . . . . . . . . . . . . . . . . . . . . . . . . . . . . . . . . . . . . . . . . . . . . . . . . . . . . . . . . . . 2713.2. Results (Table 4) . . . . . . . . . . . . . . . . . . . . . . . . . . . . . . . . . . . . . . . . . . . . . . . . . . . . . . . . 272
Science of the Total Environment 454–455 (2013) 250–276
⁎ Corresponding author. Tel.: +33 4 72 04 70 58; fax: +33 4 72 04 77 43.
0048-9697/$ – see front matter © 2013 Elsevier B.V. All rights reserved.http://dx.doi.org/10.1016/j.scitotenv.2013.02.064
Contents lists available at SciVerse ScienceDirect
Science of the Total Environment
j ourna l homepage: www.e lsev ie r .com/ locate /sc i totenv

4. Discussion . . . . . . . . . . . . . . . . . . . . . . . . . . . . . . . . . . . . . . . . . . . . . . . . . . . . . . . . . . . . . . 2724.1. Results obtained by the “substance” approach . . . . . . . . . . . . . . . . . . . . . . . . . . . . . . . . . . . . . . . . . . 272
4.1.1. Consumption… but not alone! . . . . . . . . . . . . . . . . . . . . . . . . . . . . . . . . . . . . . . . . . . . . . 2724.1.2. The numerous “orphan” compounds of ecotoxicity data . . . . . . . . . . . . . . . . . . . . . . . . . . . . . . . . . 2724.1.3. Over-high limits of detection (LOD) . . . . . . . . . . . . . . . . . . . . . . . . . . . . . . . . . . . . . . . . . . . 2734.1.4. Limits of the European method of calculating PNECs . . . . . . . . . . . . . . . . . . . . . . . . . . . . . . . . . . . 2734.1.5. There is nothing automatic about antibiotics! . . . . . . . . . . . . . . . . . . . . . . . . . . . . . . . . . . . . . . 2744.1.6. “Drug focused” measurements . . . . . . . . . . . . . . . . . . . . . . . . . . . . . . . . . . . . . . . . . . . . . 2744.1.7. Limits of ATC classification . . . . . . . . . . . . . . . . . . . . . . . . . . . . . . . . . . . . . . . . . . . . . . . 274
4.2. Results obtained by the “matrix” approach . . . . . . . . . . . . . . . . . . . . . . . . . . . . . . . . . . . . . . . . . . . . 2744.2.1. The variability of ecotoxicity values . . . . . . . . . . . . . . . . . . . . . . . . . . . . . . . . . . . . . . . . . . . 2744.2.2. Ecotoxicity linked to the particulate phase of the effluent . . . . . . . . . . . . . . . . . . . . . . . . . . . . . . . . 2744.2.3. Variation of ecotoxicity linked to the desorption of VOCs in the gaseous phase . . . . . . . . . . . . . . . . . . . . . . . 274
4.3. Comparison between “substance” and “matrix” approaches . . . . . . . . . . . . . . . . . . . . . . . . . . . . . . . . . . . . 2745. Conclusion and perspectives . . . . . . . . . . . . . . . . . . . . . . . . . . . . . . . . . . . . . . . . . . . . . . . . . . . . . . 274References . . . . . . . . . . . . . . . . . . . . . . . . . . . . . . . . . . . . . . . . . . . . . . . . . . . . . . . . . . . . . . . . 275
1. Introduction
The very wide range of activities performed by hospitals (care, di-agnostics, hygiene, maintenance, etc.) lead them to use a great varietyof potentially ecotoxic substances, such as surfactants, disinfectants,drugs and radionuclides (Kummerer et al., 1998; Kümmerer, 2001;Boillot et al., 2008). Once used or excreted by a patient, these sub-stances (except radionuclides which are generally stocked in hospitalbefore releasing) combine with the hospital wastewater (HWW)(Kümmerer, 2001; Langford and Thomas, 2009) in metabolised andnon-metabolised forms, either stable or unstable, and then flow di-rectly into the municipal wastewater network, generally withoutany prior treatment (Emmanuel et al., 2004). However, WasteWater Treatment Plants (WWTP) are not usually adapted to treatthe pollutants present in these specific effluents (Ternes, 1998;Heberer, 2002; Joss et al., 2005). Moreover, HWW can be over 150times more concentrated in micropollutants than urban effluents(Verlicchi et al., 2010). This could contribute towards explaining thepresence of hospital pollutants not only in WWTPs and their effluents(Brown et al., 2006; Langford and Thomas, 2009), but also in differentcompartments of the environment (surface water, groundwater, sed-iments, etc.) (Santos et al., 2010; Vazquez-Roig et al., 2012).
Given the large number of substances used in hospitals, it is necessaryto rank the risks they represent for host aquatic ecosystems. Concerningthe specific case of pharmaceutical compounds (PhCp), and in the frame-work of increasingly generalised monitoring of their diffusion into theenvironment in recent years, several classifications of drugs to be moni-tored with priority have been proposed (Halling-Sørensen et al., 1998;Jjemba, 2006; Besse and Garric, 2008; Kumar and Xagoraraki, 2010; Suiet al., 2012). To do this, different criteria have been taken into account,such as consumption andexcretion rate or,more rarely, biodegradability,bioaccumulability and the ecotoxicity of PhCp.
In view to setting up an HWWmonitoring procedure, it is necessaryto draw up a list of priority compounds to be dosed in these very specificeffluents. To do this, we make use of existing characterisation stud-ies, including several reviews that have focused on the quantitativeand qualitative characterisation of HWW (Kümmerer, 2001; Verlicchiet al., 2012a, 2012b). These works merit completion by characterisingthe ecotoxicity of these effluents, and the compounds they transport,taking into account the potential effects at very low concentrations(Kidd et al., 2007) of certain compounds present in HWW. Escheret al. (2011) performed an initial study to this end, based on a theoret-ical approach based on QSAR (Quantitative Structure Activity Relation).
In this review, we specifically focus on the experimental charac-terisation of the ecotoxicity of HWW, a subject that has not been ex-amined in-depth up to now. This review was carried out according totwo complementary approaches: (i) the “substance” approach forwhich
we first identified all the compounds (disinfectants, detergents, drugs,metabolites and others) sought in HWW. For each compound, we thensought to establish its PNEC (Predicted Non Effect Concentration) in re-lation to the available experimental ecotoxicity data. When not enoughexperimental ecotoxicity data were available in the literature, we usedECOSAR data (Sanderson et al., 2004) which, in addition to QSAR data,take into account experimental ecotoxicity data on structurally similarmolecules, (ii) the “matrix” approach for which we grouped the experi-mental ecotoxicity values measured directly on the HWW.
2. Characterisation of ecotoxicity according to the “substance”approach
2.1. Methodological approach
Characterising the ecotoxicity of effluents using the “substance”approach consists in comparing the concentration of each substance(pharmaceutical compounds, detergents, disinfectants, etc.) soughtin the hospital effluents with its PNEC. As the latter is rarely availablein the literature, notably for pharmaceutical compounds, it was oftenestablished specifically for this review. To achieve this, we first car-ried out bibliographical research essentially, but not only, relying onthe ECOTOX EPA and Wikipharma (Molander et al., 2009) databases.This research included the identification of the trophic level of thespecies tested, according to the classification presented in Table 1.The chronicity of the tests was also recorded. The tests consideredas chronic here are those that measure the effect of contaminantson the reproduction of organisms (transmission from one generationto another) and on the sex of individuals (e.g. population sex ratio, in-duced intersex).
Once the synthesis of existing ecotoxicity data had been established,an “extrapolation factor” (EF) was applied to the lowest toxicity valuesobtained in view to establishing the PNEC of the substance concerned.The approach to assigning EFs is explained in Table 2. It uses themethodproposed by the EU (European Union) in the Technical Guidance Docu-ment (TGD, 2003) issued in relation to launching chemical substanceson the market. However, several adaptations and improvements havebeen achieved. In particular, when ecotoxicological data on fungi (e.g.Glomus intraradices) were available, we considered them as decom-posers. Regarding these organisms,we considered these tests as chronicwhen the tests lasted several weeks and the number of spores was usedas the measurement parameter. Likewise, tests on periphyton wereclassified as chronic tests on decomposers. In the case where the onlydata available corresponded to an EC (Effective Concentration) higherthan those tested, we applied the EF to this EC. For certain compoundswithout chronic tests, acute data were not available for three differenttrophic levels. In this case, the ECOSAR data were considered as acute
251F. Orias, Y. Perrodin / Science of the Total Environment 454–455 (2013) 250–276

data and the EF was applied to the lowest value. Nevertheless, for thePNEC calculation of a compound, we need at least acute ecotoxicitydata (theoric (ECOSAR) or experimental) for species from three differ-ent trophic levels. Without this minimum information, the PNEC couldnot be calculated.
It should be noted that although the “algae” and “macrophyte”tests (those measuring growth rates and not photosynthetic activity)were classed among the chronic tests, they did not permit loweringthe EF when they were only ecotoxicological data available.
Lastly, when rotifers were the only organisms subjected to chronictests at trophic level 2C (denoted “Bc” in the different tables), the EFwas not reduced as is indicated in the classification of the TGD.
Regarding metals, ecotoxicological data are much more numerous(except for gadolinium (Gd) and platinum (Pt)). Thus we report thePNEC calculated by the INERIS, when available, using statistical methods(INERIS, 2005). To give an idea of the robustness of these PNEC, we alsoreport the HC5 (Hazardous Concentration for 5% of species tested) andIC90 (Confidence Index of 90%). Since these data were not available forGd and Pt, we calculated the PNEC using the same method as for theother molecules (PhCp, disinfectants, detergents, other molecules).
2.2. Results
The concentrations of 297 pollutants measured in the HWW, and thePNEC established (143 PNECs based on experimental data and 61 PNECsbased on theoric data) for each substance are given in Tables 3a to 3u,then analysed “therapeutic family by therapeutic family” (Classifiedaccording Anatomical, Therapeutics and Chemical classification systemcalled ATC) for the PhCp and “type of use” by “type of use” for the othersubstances. Table 3u contains all references found in Tables 3a to 3t.
2.2.1. Pharmaceutical compounds
2.2.1.1. Alimentary tract and metabolism (Table 3a). Within this thera-peutic class, 7 compounds were detected in hospital effluents. Onecompound (sulfaguanidine) was never detected. Two compoundsattracted particular attention: nifuroxazide and ranitidine. The
Table 1Identified trophic levels and definitions (TGD, 2003).
Trophic level TGD definition Example
Primaryproducers
Primary producers photo-/chemo-autotrophically synthesiseorganic compounds usinginorganic precursors.
Algae, cyanobacteria,macrophytes,…
Primaryconsumers
They live mainly on living or deadautotrophic organisms or onmicroorganisms.
Crustacea, molluscs,protozoa (non-carnivorous),…
Secondaryconsumers
They live mainly on primaryconsumers.
Rotatoria, fishes, predatorycopepods,…
Table 2Extrapolation factor to derive a PNECwater.
(Inspired from TGD, 2003).
Available data EF
At least one short-term L(E)C50 from eachof three trophic levels of the base-set(fish, daphnia and algae)
1000
One long term chronic data(either fish or invertebrate)
100
Two long term from species representingtwo trophic levels (fish and/or daphnia and/or algae)
50
Long-term NOECs from at least three species(fish and/or daphnia and/or algae and/ordecomposers) representing three trophic levels
10
Statistics method (e.g. species sensitivity distribution) 5–1 (justify case by case)Field data or model ecosystem Reviewed case by case
Table3a
Inve
ntoryof
compo
unds
soug
htin
hosp
ital
wastewater
withtheirco
rrespo
ndingco
ncen
tration,
ecotox
icityda
taan
dPN
ECcalculation—
alim
entary
tractan
dmetab
olism.
N°
CA
SC
om
po
un
d
HW
W c
on
c.
(µg
/L)
Ref.
EC
OS
AR
(µ
g/L
)
(Sa
nd
ers
on
et
al.
, 20
04
)
Ex
pe
rim
en
tal
eco
tox
icit
y
EF
PN
EC
(µ
g/L
)
Ref.
Te
ste
d
Sp
eci
es
Tro
ph
ic l
ev
el
Ch
ron
ic t
est
Th
e m
ost
se
nsi
tiv
e s
pe
cie
s
Min
Ma
xA
lga
eD
ap
hn
iaF
ish
DP
1C
2C
DP
1C
2C
En
dp
oin
tP
ara
me
ter
Sp
eci
es
Va
lue
(µ
g/L
)
51
48
1-6
1-9
Cim
eti
din
e<
0.0
03
0.0
33
32
64
95
35
00
05
72
00
03
10
11
00
00
EC
50
Imm
ob
iliz
ati
on
D. m
ag
na
27
13
00
10
00
27
13
6
76
82
4-3
5-6
Fam
oti
din
e0
.03
50
.29
32
22
00
02
42
00
04
61
50
00
20
01
10
00
0E
C5
0Im
mo
bil
iza
tio
nD
. ma
gn
a3
98
00
01
00
02
23
70
.09
41
7
10
23
8-2
1-8
Gli
be
ncl
am
ide
(G
lyb
uri
de
)0
.05
0.1
13
24
18
19
71
76
10
00
0.1
76
96
5-5
2-6
Nif
uro
xa
zid
e0
.12
.56
32
32
85
81
55
51
00
00
.32
8
58
-74
-2P
ap
av
eri
ne
0.0
01
0.0
02
15
14
30
83
01
00
01
00
00
.83
0
66
35
7-3
5-5
Ra
nit
idin
e
0.4
1.7
10
10
00
06
40
00
10
76
00
03
00
21
00
11
NO
EC
Gro
wth
C. d
ub
ia2
50
0.0
40
36
1.5
65
62
0.2
44
.13
2
57
-67
-0S
ulf
ag
ua
nid
ine
<0
.00
11
73
54
05
23
95
30
45
59
26
10
05
10
EC
50
Gro
wth
L. m
ino
r2
20
50
4.4
03
8;
39
HW
Wco
nc.:co
ncen
trationmea
suredin
hosp
ital
wastewater;D:de
compo
sers;P:
prim
aryprod
ucer;1C
:prim
aryco
nsum
er;2C
:seco
ndaryco
nsum
er;Re
f.:allr
eferen
cesaregrou
pedin
Table3u
.
252 F. Orias, Y. Perrodin / Science of the Total Environment 454–455 (2013) 250–276

Table3b
Inve
ntoryof
compo
unds
soug
htin
hosp
ital
wastewater
withtheirco
rrespo
ndingco
ncen
tration,
ecotox
icityda
taan
dPN
ECcalculation—
cardio-vascu
larsystem
.
N° C
AS
Co
mp
ou
nd
HW
W c
on
c.
(µg
/L)
Ref.
EC
OS
AR
(µ
g/L
) (S
an
de
rso
n e
t a
l.,
20
04
)
Ex
pe
rim
en
tal
eco
tox
icit
y
EF
PN
EC
(µ
g/L
)
Ref.
Te
ste
d
spe
cie
s
Tro
ph
ic l
ev
el
Ch
ron
ic t
est
Th
e m
ost
se
nsi
tiv
e s
pe
cie
s
Min
Ma
xA
lga
eD
ap
hn
iaF
ish
DP
1C
2C
DP
1C
2C
En
dp
oin
tP
ara
me
ter
Sp
eci
es
Va
lue
(µ
g/L
)
37
51
7-3
0-9
Ace
bu
tolo
l (H
Cl)
0.1
85
17
53
76
20
00
03
06
00
00
10
00
5.3
76
29
12
2-6
8-7
Ate
no
lol
0.0
45
0.0
53
15
11
00
08
30
00
14
61
00
05
11
12
01
01
NO
EC
Ind
ex
co
nd
itio
nP
. pro
mel
as
10
00
50
20
36
0.1
12
21
0
2.2
6.6
32
1.6
6.5
25
0.7
96
2.1
34
28
2.3
15
62
1.6
07
17
13
45
23
-00
-5A
torv
ast
ati
n0
.00
30
.00
61
53
84
16
58
66
12
21
10
20
LOE
CF
resh
we
igh
tL.
gib
ba
19
10
00
.19
36
0.0
62
0.3
13
2
63
65
9-1
8-7
Be
tax
olo
l<
0.0
02
0.0
23
21
24
01
67
32
00
00
10
01
00
00
0E
C5
0Im
mo
bil
iza
tio
nD
. ma
gn
a>
30
00
00
10
00
1.2
43
6
41
85
9-6
7-0
Be
zafi
bra
te
<0
.00
12
.93
2
67
30
35
36
38
11
60
04
20
01
1N
OE
CP
op
ula
tio
n g
row
th
inh
itb
itio
nC
. du
bia
23
50
0.4
63
60
.06
36
2
0.0
01
17
75
84
7-7
3-3
En
ala
pri
l0
.09
10
.43
22
10
00
26
00
09
30
00
10
01
00
00
0LC
50
Mo
rta
lity
T. p
laty
uri
us
18
40
00
10
00
21
36
49
56
2-2
8-9
Fe
no
fib
rate
0.6
11
80
35
84
84
01
21
00
11
NO
EC
Po
pu
lati
on
gro
wth
inh
itb
itio
nC
. du
bia
3
95
00
.78
36
<0
.00
10
.02
63
2
54
-31
-9F
uro
sem
ide
0.2
0.4
51
5
10
30
00
79
00
01
66
00
04
+ C
10
31
10
11
LOE
CS
tru
ctu
re a
nd
m
eta
bo
lism
of
com
mu
nit
yB
iofi
lm1
01
01
36
2.0
37
62
5.3
18
32
25
81
2-3
0-0
Ge
mfi
bro
zil
1.1
7.3
11
21
79
10
33
93
09
11
43
00
11
LOE
CD
ecr
ea
se o
f p
lasm
ati
c te
sto
ste
ron
eC
. au
ratu
s1
55
00
.33
6<
0.0
03
0.0
64
32
<0
.00
11
.11
18
<0
.13
41
7
58
-93
-5H
yd
roch
loro
thia
zid
e0
.54
2.4
32
31
70
00
39
40
00
19
09
00
00
10
00
31
71
.99
56
2
83
91
5-8
3-7
Lisi
no
pri
l<
0.0
12
0.6
13
23
33
00
04
29
30
00
85
03
30
00
01
00
03
33
51
38
4-5
1-1
Me
top
rolo
l
0.5
11
.23
2
29
08
82
44
11
60
00
91
23
30
11
1LO
EC
Li
ve
r st
ruct
ure
a
lte
rati
on
O. m
yk
iss
11
00
.13
60
.41
92
5.0
97
31
1.3
25
6
2
0.1
45
17
73
57
3-8
8-3
Me
va
sta
tin
0.0
68
23
22
39
24
01
27
30
10
00
0.2
39
<0
.01
17
42
20
0-3
3-9
Na
do
lol
<0
.00
10
.00
34
32
50
21
19
00
02
90
00
04
00
31
00
00
LC5
0M
ort
ali
tyC
. du
bia
>1
00
00
01
00
05
.02
14
0
64
93
-05
-6P
en
tox
ify
llin
e0
.30
21
70
13
52
3-8
6-9
Pin
do
lol
<0
.00
10
.26
32
31
75
10
00
01
47
00
00
10
00
3.1
75
81
09
3-3
7-0
Pra
va
sta
tin
0.0
64
1.1
32
10
00
00
10
40
00
00
04
97
01
00
00
.49
7<
0.0
01
17
52
5-6
6-6
Pro
pa
no
lol
0.2
6.5
10
22
25
10
50
42
2LO
EC
Re
pro
du
ctio
n s
ucc
ess
O. l
ati
pes
0
,51
00
.05
36
0.1
16
62
<0
.00
20
.09
43
2
<0
.00
05
0.2
25
18
0.0
30
.60
33
2
0.0
42
17
79
90
2-6
3-9
Sim
va
sta
tin
0.0
02
15
92
41
65
64
01
21
01
00
LOE
CG
row
th r
ate
N. s
pin
ipes
0,1
61
00
00
.00
02
41
; 4
2
39
30
-20
-9S
ota
lol
0.3
56
.73
2
13
00
04
20
00
24
30
00
31
11
00
00
0E
C5
0Im
mo
bil
iza
tio
nD
. ma
gn
a>
30
00
00
10
00
13
36
0.7
62
<0
.01
17
13
78
62
-53
-4V
als
art
an
3.0
32
62
0
52
-53
-9V
era
pa
mil
0.0
36
23
61
21
17
30
10
0LO
EC
Len
gth
P. p
rom
ela
s6
00
10
00
0.6
36
; 4
2
HW
Wco
nc.:co
ncen
trationmea
suredin
hosp
ital
wastewater;D:de
compo
sers;P:
prim
aryprod
ucer;1C
:prim
aryco
nsum
er;2C
:seco
ndaryco
nsum
er;Re
f.:allreferen
cesaregrou
pedin
Table3u
;+
C:ecotox
icityda
taav
ailablefortestson
commun
ityof
orga
nism
s(sev
eral
speciesex
posedtoge
ther).
253F. Orias, Y. Perrodin / Science of the Total Environment 454–455 (2013) 250–276

concentrations of these molecules in the HWW were 11-fold and100-fold higher, respectively, than the PNEC established. Although thePNEC of the nifuroxazide is based on ECOSAR data (thus less robust),that of ranitidine is based on experimental data. It is also noteworthythat within this group, 4 molecules detected in the hospital effluentsdid not present any experimental ecotoxicity.
2.2.1.2. Cardio-vascular system (Table 3b). Of the 22 compoundssought in this class, 9 were detected at values 6 (bezafibrate) to 250(metoprolol) fold higher than the PNEC. All the compounds soughtwere detected in the HWW. Furthermore, 8 compounds had neverbeen subject to an experimental ecotoxicological study. Pentoxifyllinehad not been subject to data modelling either.
2.2.1.3. Dermatologicals (Table 3c). One of the seven compounds of thisclass was remarkable, namely clotrimazole, which was measured atconcentrations 200,000 fold higher than its PNECs! The high toxicityof compounds from this group is of great interest given the utilisationof these products, which are all antimicrobial. Although the utilisationof these products is important locally, the impact of these compoundson WWTP could be considered as significant, as they function on theprinciple of biological degradation of pollutants by micro-organisms.Moreover, regarding triclosan, the experimental ecotoxicity data (acuteand chronic and on all the trophic levels) are very complete, leading toan EF of 5. However, the PNEC remains twice as high as the limit of de-tection (LOD) (Kosma et al., 2010), making it difficult to ascertain thereal ecotoxicity of triclosan in this hospital effluent. Not enough (forPNEC calculation) or not at all ecotoxicological data was available formethylprednisolone, fluconazole and econazole, the latter detected inthe effluent and identified as highly bioaccumulable and slightly biode-gradable (Jean et al., 2012). Therefore the PNEC of these compoundscould not be calculated.
2.2.1.4. Genito-urinary system and sex hormones (Table 3d). Only one(clomiphen) of the nine compounds of this group was never detected.Four of them had a MCWmax (Highest Measured Concentration inWastewater)/PNEC ratio between 620 (estriol) and 28,750 (estradiol).It is noteworthy that the LODs of certain compounds were up to 1000times higher than their PNECs (e.g. estradiol), exhibiting the strongecotoxicity of these compounds. It should be noted that no ecotoxico-logical data were available for three compounds detected in the effluentsanalysed: raloxifen, cilastatin and mifepristone, the latter identified asparticularly bioaccumulable and slightly biodegradable (Jean et al., 2012).
2.2.1.5. Anti-infectives for systemic use (Tables 3e to 3j). It is in this classthat we found the largest number of compounds measured in HWWs.Although the anti-infectives not only include antibiotics (e.g. antivi-rals), research are almost limited to the latter. This emphasizes theomnipresence of consumption in the choice of compounds studied.Indeed, antibiotics are among the drugs most frequently consumed.A number of ecotoxicological data were available as these com-pounds have already been subject to numerous studies. However,no ecotoxicological data were available for 6 of the 60 compoundsmeasured. Furthermore, 9 compounds were measured in the efflu-ents at concentrations more than 1000-fold higher than theirPNEC, while the maximum concentration of ampicillin was morethan 500,000-fold higher. In spite of the large number of experi-mental ecotoxicological data, few chronic tests have been carriedout for these compounds.
2.2.1.6. Antineoplastics and immunomodulant agents (Table 3k). Gener-ally, little attention has been devoted to antineoplastics (eight withoutexperimental ecotoxicological data, including two without any eco-toxicological data) in spite of sometimes high MCWmax/PNEC ratios(244 000 for 5-fluorouracil). Among these compounds, ifosfamideis an interesting example. Despite having detected in 6 differentTa
ble3c
Inve
ntoryof
compo
unds
soug
htin
hosp
ital
wastewater
withtheirco
rrespo
ndingco
ncen
tration,
ecotox
icityda
taan
dPN
ECcalculation—
derm
atolog
icals.
N°
CA
SC
om
po
un
dH
WW
co
nc.
(µ
g/L
)
Ref.
EC
OS
AR
(µ
g/L
) (S
an
de
rso
n e
t a
l., 2
00
4)
Ex
pe
rim
en
tal
eco
tox
icit
y
EF
PN
EC
(µ
g/L
)
Ref.
Te
ste
d
Sp
eci
es
Tro
ph
ic l
ev
el
Ch
ron
ic t
est
Th
e m
ost
se
nsi
tiv
e s
pe
cie
s
Min
Ma
xA
lga
eD
ap
hn
iaF
ish
DP
1C
2C
DP
1C
2C
En
dp
oin
tP
ara
me
ter
Sp
eci
es
Va
lue
(µ
g/L
)
23
59
3-7
5-1
Clo
trim
azo
le0
.00
40
.01
11
50
.11
20
.02
30
.09
2+
C1
01
11
00
0LO
EC
Ste
rol
syn
the
sis
Pe
ryp
hy
ton
0.0
00
00
51
00
0.0
00
00
00
53
6;
42
27
22
0-4
7-9
Eco
na
zole
<0
.00
12
0.0
28
28
0
86
38
6-7
3-4
Flu
con
azo
le3
.44
56
22
01
01
00
00
LC5
0M
ort
ali
tyO
. la
tip
es>
10
00
00
42
20
13
-58
-3M
ecl
ocy
clin
e<
0.0
07
31
0
83
-43
-2M
eth
ylp
red
nis
olo
ne
1.4
26
23
42
62
90
10
00
0.0
26
42
69
-72
-7S
ali
cy
lic
aci
d
23
.47
0.1
11
48
16
1.2
88
11
15
41
04
30
LOE
CM
atu
rity
D. l
on
gis
pin
a1
80
05
03
63
60
.92
.43
2
0.0
34
0.0
42
8
33
80
-34
-5T
ricl
osa
n<
0.0
44
11
0.2
96
0.1
07
0.0
22
31
+ C
31
16
12
14
47
LOE
CB
iom
ass
Bio
film
0.1
25
0.0
24
44
HW
Wco
nc.:co
ncen
trationmea
suredin
hosp
ital
wastewater;D:de
compo
sers;P:
prim
aryprod
ucer;1C
:prim
aryco
nsum
er;2C
:seco
ndaryco
nsum
er;Re
f.:allreferen
cesaregrou
pedin
Table3u
;+
C:ecotox
icityda
taav
ailablefortestson
commun
ityof
orga
nism
s(sev
eral
speciesex
posedtoge
ther).
254 F. Orias, Y. Perrodin / Science of the Total Environment 454–455 (2013) 250–276

Table3d
Inve
ntoryof
compo
unds
soug
htin
hosp
ital
wastewater
withtheirco
rrespo
ndingco
ncen
tration,
ecotox
icityda
taan
dPN
ECcalculation—
genito-urina
rysystem
andsexho
rmon
es.
N°
CA
SC
om
po
un
d
HW
W c
on
c.
(µg
/L)
Ref.
EC
OS
AR
(µ
g/L
) (S
an
de
rso
n
et
al.
, 20
04
)
Ex
pe
rim
en
tal
eco
tox
icit
y
EF
PN
EC
(µg
/L)
Ref.
Te
ste
d
spe
cie
s
Tro
ph
ic l
ev
el
Ch
ron
ic t
est
Th
e m
ost
se
nsi
tiv
e s
pe
cie
s
Min
Ma
xA
lga
eD
ap
hn
iaF
ish
DP
1C
2C
DP
1C
2C
En
dp
oin
tP
ara
me
ter
Sp
eci
es
Va
lue
(µ
g/L
)
57
-63
-61
7α-
eth
iny
lest
rad
iol
<0
.00
03
31
67
72
34
40
45
+ C
12
14
28
11
69
NO
EC
Sp
raw
n e
gg
pe
r co
up
leP
. pro
mel
as
0,0
00
12
0.0
00
04
36
; 4
2;
47
<0
.01
17
<0
.02
50
.43
21
8
<0
.00
04
28
50
-28
-21
7β-
est
rad
iol
<0
.00
30
.07
23
1
80
02
77
44
35
02
92
40
13
8LO
EC
Ind
uce
in
ters
ex
O. l
ati
pes
0,0
00
45
00
.00
00
08
36
; 4
2<
0.0
11
7
<0
.02
50
.23
18
82
00
9-3
4-5
Cil
ast
ati
n1
.03
76
20
91
1-4
5-5
Clo
mip
he
n<
0.0
00
52
10
50
-27
-1E
stri
ol
0.1
80
.78
53
14
39
01
45
11
53
00
12
00
02
LOE
CIn
du
ce i
nte
rse
xO
. la
tip
es0
,75
10
00
.00
75
36
; 4
2
4.6
51
17
53
-16
-7E
stro
ne
0.0
07
0.0
47
31
16
60
56
74
12
00
48
00
12
LOE
CIn
du
ce i
nte
rse
xO
. la
tip
es0
,00
85
00
.00
01
63
6;
42
<
0.0
11
7
<0
.02
50
.41
51
8
98
31
9-2
6-7
Fin
ast
eri
de
0.0
00
32
0.0
04
36
21
30
11
10
00
0LE
C5
0M
ort
ali
tyO
. my
kis
s2
00
00
10
00
20
55
84
37
1-6
5-3
Mif
ep
rist
on
e0
.00
64
0.1
95
21
0
84
44
9-9
0-1
Ra
lox
ife
n0
.00
67
40
.02
22
10
57
-83
-0P
rog
est
ero
ne
0.0
09
17
33
00
10
00
73
33
00
21
00
11
LOE
CP
op
ula
tio
n s
ex
ra
tio
D. m
ag
na
10
05
02
42
; 4
6
HW
Wco
nc.:co
ncen
trationmea
suredin
hosp
ital
wastewater;D:de
compo
sers;P:
prim
aryprod
ucer;1C
:prim
aryco
nsum
er;2C
:seco
ndaryco
nsum
er;Re
f.:allreferen
cesaregrou
pedin
Table3u
;+
C:ecotox
icityda
taav
ailablefortestson
commun
ityof
orga
nism
s(sev
eral
speciesex
posedtoge
ther).
255F. Orias, Y. Perrodin / Science of the Total Environment 454–455 (2013) 250–276

studies between 1997 and 2012 (Table 3k), there is still any experi-mental data concerning its ecotoxicity. Otherwise, it should be notedthat three compounds present LODs much higher than the PNECs.
2.2.1.7. Musculoskeletal system (Table 3l). Diclofenac and ibuprofen arethe two compounds that attract attention in this group. In spite of arelatively low EF, their MCWmax/PNEC ratios remain very high (746and 302 respectively).
2.2.1.8. Nervous system (Table 3m). With 47 compounds identified,nervous system category is the investigated in HWW after anti-infectives for systemic use. Caffeine has the highest MCWmax/PNECratio in this class (3.64 × 10⁶). However, the EF is high since therewere no chronic ecotoxicity data. Paracetamol and propofol arealso of note with a ratio close to 200. Although the PNEC of propofolis based on ECOSAR data, that of paracetamol is more robust with anEF of 50. Otherwise, pollutants of this category are almost alwayshigher than LOD (mepirizole only compound of this category notdetected). It should also be noted that only a few compound haveexperimentally studied on more than three species.
2.2.1.9. Compounds for veterinary use (Table 3n). Only five compoundsof this class were detected in the HWW, at concentrations alwayslower than the PNEC. Nevertheless, 4 of the 5 PNECs calculated arebased on theoric data.
2.2.1.10. Respiratory system (Table 3o). No experimental ecotoxicitydata are available for the compounds grouped in this class except fordexamethasone and ECOSAR data was available for four out of six com-pounds in this category. Globally, the MCWmax remained higher thanthe PNEC obtained with the ECOSAR and experimental data (exceptfor clenbuterol).
2.2.1.11. Iodine compound medium (Table 3p). These compounds arevery rarely measured in HWW in spite of the presence in relativelyhigh concentrations in the environment (Santos et al., 2010) and inHWW. Furthermore, very few ecotoxicity data are available. Thosefor which ECOSAR data are available have an MCWmax that remainslower than PNEC.
2.2.1.12. Metabolites of PhCp (Table 3q). Very little information existson the ecotoxicity of the metabolites of PhCp. Only two compoundshad experimental ecotoxicity data available: 2′2′-difluorodeoxyuridineby Zounkova et al. (2010) and clofibric acid (clofibrate metabolite butalso a pesticide). The available MCWmax is far below the PNEC, butvery few organisms have been tested.
2.2.2. Non-pharmaceutical compounds
2.2.2.1. Disinfectants (Table 3r). The reaction of bleach, very often usedin hospitals to disinfect apparatus and premises, with the organiccompounds present in HWW, leads to the production of numerousorganohalogen compounds (Emmanuel et al., 2004).
Generally, the ecotoxicity of the compounds of this group has beenquite well identified, despite there being an imbalance once again be-tween the available chronic tests and acute tests. Glutaraldehyde, thedisinfectant used classically for disinfecting instruments and medicalprobes, was detected in certain effluents at very high concentrationswith respect to its ecotoxicity. The MCWmax/PNEC ratio observed canreach up to 4960.
2.2.2.2. Alcohols (Table 3r). Ten alcohols, stemming from different usesor from the metabolism of initial compounds (Boillot et al., 2008),were detected in HWW at sometimes very high concentrations withrespect to their ecotoxicity. In the case of 2-propanol, the MCWmax/PNEC ratio reached 321,930.Ta
ble3e
Inve
ntoryof
compo
unds
soug
htin
hosp
ital
wastewater
withtheirco
rrespo
ndingco
ncen
tration,
ecotox
icityda
taan
dPN
ECcalculation—
anti-infective
forsystem
icus
e—
β-lactams.
N°
CA
SC
om
po
un
d
HW
W c
on
c.
(µg
/L)
Ref.
EC
OS
AR
(µ
g/L
) (S
an
de
rso
n e
t a
l.,
20
04
)
Ex
pe
rim
en
tal
eco
tox
icit
y
EF
PN
EC
(µ
g/L
)
Ref.
Te
ste
d
spe
cie
s
Tro
ph
ic l
ev
el
Ch
ron
ic t
est
Th
e m
ost
se
nsi
tiv
e s
pe
cie
s
Min
Ma
xA
lga
eD
ap
hn
iaF
ish
DP
1C
2C
DP
1C
2C
En
dp
oin
tP
ara
me
ter
Sp
eci
es
Va
lue
(µ
g/L
)
26
78
7-7
8-0
Am
ox
icil
lin
<0
.03
20
.21
86
46
9.1
52
47
.91
2.6
10
15
31
05
00
NO
EC
Gro
wth
S. l
eo
po
len
sis
0.7
81
00
00
.00
07
83
6, 4
2
69
-53
-4A
mp
icil
lin
<0
.01
05
.08
18
45
71
21
48
77
67
97
50
21
51
93
20
90
1LO
EC
No
rma
l e
xp
ress
ion
o
f p
53
D. r
erio
0.0
00
55
00
.00
00
13
6;
42
<0
.00
46
4
0.0
53
17
61
-72
-3C
lox
aci
llin
<0
.00
51
73
64
66
23
49
53
61
39
01
00
02
3.4
95
66
-79
-5O
xa
cill
in<
0.0
02
51
70
<0
.04
86
4
61
-33
-6P
en
icil
lin
G
(Be
nzy
lpe
nic
illi
n)
0.8
55
.22
20
67
08
17
46
85
43
12
77
20
20
00
20
0E
C5
0G
row
th
M. a
eru
gin
osa
61
00
00
.00
63
6, 4
2
<0
.00
21
8
<0
.00
26
4
ND
29
<0
.00
51
7
87
-08
-1P
en
icil
lin
V(P
hén
ox
ym
éth
ylp
enic
illi
ne)
<0
.01
16
42
81
21
01
06
19
68
50
08
14
00
00
00
01
00
02
81
21
<0
.01
2
HW
Wco
nc.:co
ncen
trationmea
suredin
hosp
ital
wastewater;D:de
compo
sers;P:
prim
aryprod
ucer;1C
:prim
aryco
nsum
er;2C
:seco
ndaryco
nsum
er;Re
f.:allr
eferen
cesaregrou
pedin
Table3u
;ND:co
mpo
undno
tde
tected
.
256 F. Orias, Y. Perrodin / Science of the Total Environment 454–455 (2013) 250–276

Table3f
Inve
ntoryof
compo
unds
soug
htin
hosp
ital
wastewater
withtheirco
rrespo
ndingco
ncen
tration,
ecotox
icityda
taan
dPN
ECcalculation—
anti-infective
forsystem
icus
e—
macrolid
es.
N°
CA
SC
om
po
un
dH
WW
co
nc.
(µ
g/L
)
Ref.
EC
OS
AR
(µ
g/L
) (S
an
de
rso
n e
t a
l.,
20
04
)
Ex
pe
rim
en
tal
eco
tox
icit
y
EF
PN
EC
(µ
g/L
)
Ref.
Te
ste
d
spe
cie
s
Tro
ph
ic l
ev
el
Ch
ron
ic t
est
Th
e m
ost
se
nsi
tiv
e s
pe
cie
s
Min
Ma
xA
lga
eD
ap
hn
iaF
ish
DP
1C
2C
DP
1C
2C
En
dp
oin
tP
ara
me
ter
Sp
eci
es
Va
lue
(µ
g/L
)
83
90
5-0
1-5
Az
ith
rom
yci
n
<0
.00
31
.04
32
16
30
28
73
41
00
20
11
00
10
0E
C5
0G
row
thP
. su
bca
pit
ata
19
10
00
0.0
19
36
; 3
70
.13
96
2
0.0
85
0.1
13
64
0.2
27
17
81
10
3-1
1-9
Cla
rith
rom
yci
n
0.0
21
43
2
17
46
31
10
45
90
60
13
20
11
1 (Bc)
EC
50
Gro
wth
P. s
ub
cap
ita
ta2
50
0.0
43
6;
42
2.5
55
62
0.1
13
0.9
73
64
<0
.52
26
0.7
21
17
18
32
3-4
4-9
Cli
nd
am
yci
n
0.9
83
62
11
00
00
00
0E
C5
0P
rote
in s
yn
the
sis
P. f
alc
ipa
rum
2.2
42
0.1
84
1.4
65
64
0.3
41
17
11
4-0
7-8
Ery
thro
my
cin
0.0
60
.32
32
38
98
78
22
17
10
91
90
11
44
01
11
1 (Bc)
EC
50
Gro
wth
in
hib
itio
nP
. su
bca
pit
ata
20
50
0.4
36
; 4
2<
0.5
27
26
0.0
10
.03
10
<0
.01
0.2
61
4
16
84
6-2
4-5
Josa
my
cin
<0
.00
30
.01
53
21
97
93
53
79
10
01
00
00
.91
<0
.00
25
17
15
4-2
1-2
Lin
com
yci
n
0.3
22
12
97
98
23
56
13
91
570
81
23
20
01
1 (Bc)
EC
50
Gro
wth
P. s
ub
cap
ita
ta7
05
01
.44
2;
52
<0
.00
5
0.1
74
4
<0
.00
90
.11
96
4
ND
29
39
22
-90
-5O
lea
nd
om
yci
n<
0.0
11
76
71
91
80
00
51
00
00
10
00
6.7
19
80
21
4-8
3-1
Ro
xit
hro
my
cin
<0
.00
40
.14
32
32
38
62
05
11
66
26
12
21
02
00
NO
EC
Gro
wth
P. s
ub
cap
ita
ta1
01
00
00
.01
36
<0
.51
26
0.0
23
62
<0
.00
96
4
<0
.01
2.1
89
4
<0
.00
25
17
80
25
-81
-8S
pir
am
yci
n
0.0
01
15
20
20
00
00
0E
C5
0G
row
thM
. aer
ug
ino
sa5
42
<0
.00
20
.11
32
<0
.01
26
4
<0
.01
17
HW
Wco
nc.:co
ncen
trationmea
suredin
hosp
ital
wastewater;D:de
compo
sers;P:
prim
aryprod
ucer;1C
:prim
aryco
nsum
er;2C
:seco
ndaryco
nsum
er;Re
f.:allr
eferen
cesaregrou
pedin
Table3u
.
257F. Orias, Y. Perrodin / Science of the Total Environment 454–455 (2013) 250–276

Table3g
Inve
ntoryof
compo
unds
soug
htin
hosp
ital
wastewater
withtheirco
rrespo
ndingco
ncen
tration,
ecotox
icityda
taan
dPN
ECcalculation—
anti-infective
forsystem
icus
e—
Quino
lone
s.
N°
CA
SC
om
po
un
d
HW
W c
on
c.
(µg
/L)
Ref.
EC
OS
AR
(µ
g/L
) (S
an
de
rso
n e
t a
l.,
20
04
)
Ex
pe
rim
en
tal
eco
tox
icit
y
EF
PN
EC
(µ
g/L
)
Ref.
Te
ste
d
spe
cie
s
Tro
ph
ic l
ev
el
Ch
ron
ic t
est
Th
e m
ost
se
nsi
tiv
e s
pe
cie
s
Min
Ma
xA
lga
eD
ap
hn
iaF
ish
DP
1C
2C
DP
1C
2C
En
dp
oin
tP
ara
me
ter
Sp
eci
es
Va
lue
(µ
g/L
)
28
65
7-8
0-9
C
ino
xa
cin
<0
.00
16
42
3.6
92
1.0
85
6.9
31
10
00
00
00
NO
EC
Bio
lum
ine
sce
nce
V. f
ish
eri
26
.22
10
00
0.0
21
36
85
72
1-3
3-1
Cip
rofl
ox
aci
n
0.8
52
2
13
22
17
99
14
85
80
96
29
31
0 +
C3
41
31
41
0E
C5
0G
row
thM
. aer
ug
ino
sa5
10
0.5
36
; 4
2
<0
.03
85
4.0
49
31
28
31
4
3.6
10
12
0
1.1
25
.85
<0
.00
5
0.2
17
4
0.7
12
4.5
8
5.3
29
7.4
94
64
<0
.00
30
.05
12
6
0.8
4.4
25
31
.98
62
0.4
65
.03
29
1.4
26
32
9.4
49
76
.16
72
8
0.7
51
17
74
01
1-5
8-8
En
ox
aci
n0
.05
80
.48
32
15
02
21
12
71
25
31
16
52
57
91
10
00
00
00
NO
EC
Bio
lum
ine
sce
nce
V. f
ish
eri
2.8
81
00
00
.00
28
83
6
42
83
5-2
5-6
Flu
me
qu
ine
0.0
03
17
61
92
54
07
63
38
27
99
15
21
05
00
EC
50
Bio
lum
ine
sce
nce
V. f
ish
eri
2.6
41
00
00
.00
26
43
6;
42
<0
.00
26
4
10
09
86
-85
-4Le
vo
flo
xa
cin
<0
.07
58
15
11
15
00
EC
50
Gro
wth
M. a
eru
gin
osa
7.9
10
00
0.0
07
93
6;
42
98
07
9-5
1-7
Lom
efl
ox
aci
n<
0.0
85
11
00
00
69
30
00
47
71
00
05
14
00
03
00
NO
EC
Bio
lum
ine
sce
nce
V. f
ish
eri
21
00
00
.00
23
6<
0.0
05
1
.16
24
38
9-0
8-2
Na
lid
ixic
aci
d0
.18
61
72
72
96
02
17
35
92
53
64
02
10
10
00
00
NO
EC
Bio
lum
ine
sce
nce
V. f
ish
eri
72
10
00
0.0
72
36
; 4
2<
0.0
02
<0
.00
56
4
70
45
8-9
6-7
No
rflo
xa
cin
<0
.07
15
.25
16
17
30
12
32
51
21
40
40
44
91
11
10
00
09
00
NO
EC
Gro
wth
po
pu
lati
on
V. f
ish
eri
1.6
10
00
0.0
01
63
6;
42
<0
.00
5
1.6
24
<0
.01
2
5.9
33
62
0.0
22
0.5
13
2
<8
44
26
<0
.02
80
.32
76
4
0.1
31
17
82
41
9-3
6-1
Ofl
ox
aci
n
0.2
7.6
20
13
22
17
99
14
85
80
96
29
31
32
63
20
61
1 (Bc)
NO
EC
Bio
lum
ine
sce
nce
V. f
ish
eri
1.1
50
0.0
22
36
4.9
35
.52
<0
.07
5
1.6
4.2
44
3.3
37
32
2.9
78
10
.36
86
4
<8
44
26
1.0
88
17
14
69
8-2
9-4
Ox
oli
nic
aci
d0
.00
51
72
80
43
52
20
91
92
54
64
46
13
11
03
10
NO
EC
Bio
lum
ine
sce
nce
V. f
ish
eri
0.7
31
10
00
.00
73
13
6;
42
<0
.00
26
4
70
45
8-9
2-3
Pe
flo
xa
cin
0.0
62
17
0
51
94
0-4
4-4
Pip
em
idic
aci
d<
0.0
05
64
44
74
10
89
26
99
91
95
00
00
00
01
00
04
47
0.1
78
17
HW
Wco
nc.:co
ncen
trationmea
suredin
hosp
ital
wastewater;D:de
compo
sers;P:
prim
aryprod
ucer;1C
:prim
aryco
nsum
er;2C
:seco
ndaryco
nsum
er;Re
f.:allreferen
cesaregrou
pedin
Table3u
;+
C:ecotox
icityda
taav
ailablefortestson
commun
ityof
orga
nism
s(sev
eral
speciesex
posedtoge
ther).
258 F. Orias, Y. Perrodin / Science of the Total Environment 454–455 (2013) 250–276
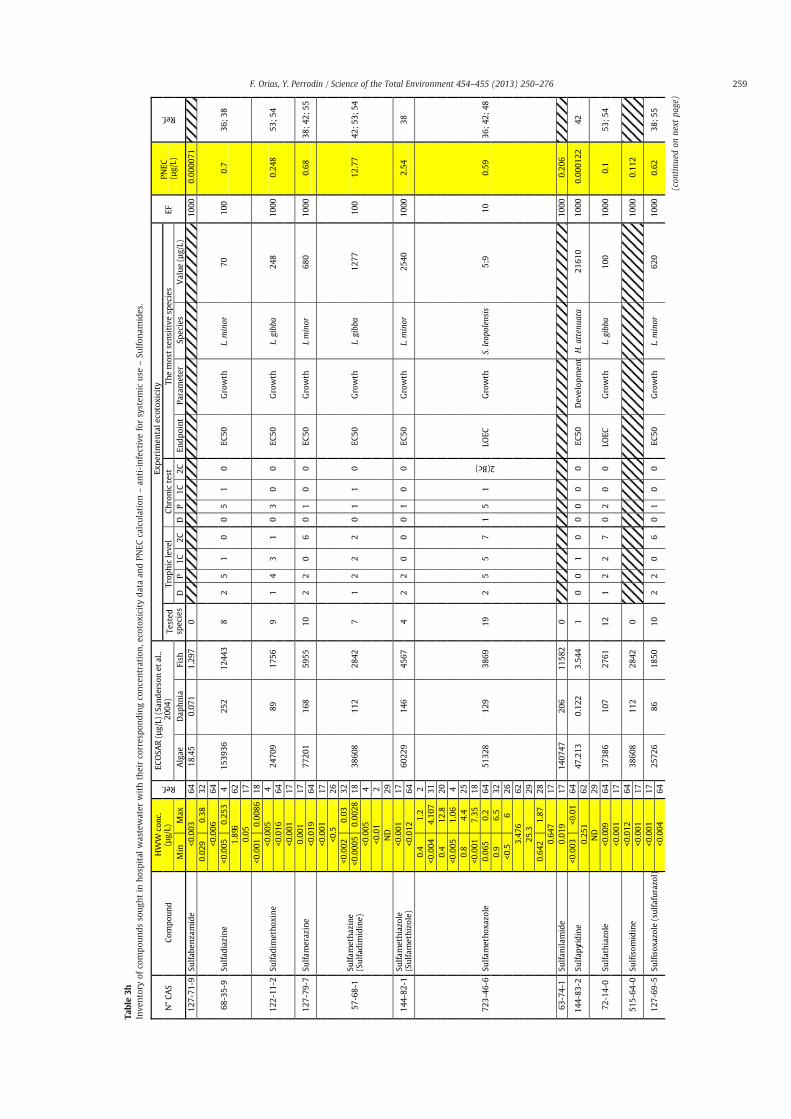
Table3h
Inve
ntoryof
compo
unds
soug
htin
hosp
ital
wastewater
withtheirco
rrespo
ndingco
ncen
tration,
ecotox
icityda
taan
dPN
ECcalculation–an
ti-infective
forsystem
icus
e–Su
lfona
mides.
N°
CA
SC
om
po
un
d
HW
W c
on
c.
(µg
/L)
Ref.
EC
OS
AR
(µ
g/L
) (S
an
de
rso
n e
t a
l..
20
04
)
Ex
pe
rim
en
tal
eco
tox
icit
y
EF
PN
EC
(µ
g/L
)
Ref.
Te
ste
d
spe
cie
s
Tro
ph
ic l
ev
el
Ch
ron
ic t
est
Th
e m
ost
se
nsi
tiv
e s
pe
cie
s
Min
Ma
xA
lga
eD
ap
hn
iaF
ish
DP
1C
2C
DP
1C
2C
En
dp
oin
tP
ara
me
ter
Sp
eci
es
Va
lue
(µ
g/L
)
12
7-7
1-9
Su
lfa
be
nza
mid
e<
0.0
03
64
18
.45
0.0
71
1.2
97
01
00
00
.00
00
71
68
-35
-9S
ulf
ad
iaz
ine
0.0
29
0.3
83
2
15
39
36
25
21
24
43
82
51
00
51
0E
C5
0G
row
thL.
min
or
70
10
00
.73
6;
38
<0
.00
66
4
<0
.00
5
0.2
53
4
1.8
966
2
0.0
51
7
12
2-1
1-2
Su
lfa
dim
eth
ox
ine
<0
.00
10
.00
86
18
24
70
98
91
75
69
14
31
03
00
EC
50
Gro
wth
L. g
ibb
a2
48
10
00
0.2
48
53
; 5
4<
0.0
05
4
<0
.01
66
4
<0
.00
11
7
12
7-7
9-7
Su
lfa
me
raz
ine
0.0
01
17
77
20
11
68
59
55
10
22
06
01
00
EC
50
Gro
wth
L m
ino
r6
80
10
00
0.6
83
8;
42
; 5
5<
0.0
19
64
57
-68
-1S
ulf
am
eth
az
ine
(S
ulf
ad
imid
ine
)
<0
.00
11
7
38
60
81
12
28
42
71
22
20
11
0E
C5
0G
row
thL.
gib
ba
12
77
10
01
2.7
74
2;
53
; 5
4
<0
.52
6
<0
.00
20
.03
32
<0
.00
05
0.0
02
81
8
<0
.00
5
4
<0
.01
2
ND
29
14
4-8
2-1
Su
lfa
me
thia
zole
(S
ulf
am
eth
izo
le)
<0
.00
11
76
02
29
14
64
56
74
22
00
01
00
EC
50
Gro
wth
L. m
ino
r2
54
01
00
02
.54
38
<0
.01
26
4
72
3-4
6-6
Su
lfa
me
tho
xa
zole
0.4
1.2
2
51
32
81
29
38
69
19
25
57
15
1
2(Bc)
LOE
CG
row
thS.
leo
po
len
sis
5;9
10
0.5
93
6;
42
; 4
8
<0
.00
44
.10
73
1
0.4
12
.82
0
<0
.00
5
1.0
64
0.8
4.4
25
<0
.00
17
.35
18
0.0
65
0.2
64
0.9
6.5
32
<0
.56
26
3.4
76
62
25
.32
9
0.6
42
1.8
72
8
0.6
47
17
63
-74
-1S
ulf
an
ila
mid
e0
.01
91
71
40
74
72
06
11
58
20
10
00
0.2
06
14
4-8
3-2
Su
lfa
pyr
idin
e<
0.0
03
<0
.01
64
47
.21
30
.12
23
.54
41
00
10
00
00
EC
50
De
ve
lop
me
nt
H. a
tten
ua
ta2
16
10
10
00
0.0
00
12
24
20
.25
16
2
72
-14
-0S
ulf
ath
iazo
le
ND
29
37
38
61
07
27
61
12
12
27
02
00
LOE
CG
row
thL.
gib
ba
10
01
00
00
.15
3;
54
<0
.00
96
4
<0
.00
11
7
51
5-6
4-0
Su
lfis
om
idin
e<
0.0
12
64
38
60
81
12
28
42
01
00
00
.11
2<
0.0
01
17
12
7-6
9-5
Su
lfis
ox
azo
le (
sulf
afu
razo
l)<
0.0
01
17
25
72
68
61
85
01
02
20
60
10
0E
C5
0G
row
thL.
min
or
62
01
00
00
.62
38
; 5
5<
0.0
04
64
(con
tinu
edon
next
page)
259F. Orias, Y. Perrodin / Science of the Total Environment 454–455 (2013) 250–276

N°
CA
SC
om
po
un
dH
WW
co
nc.
(µ
g/L
)Ref.
EC
OS
AR
(µ
g/L
) (S
an
de
rso
n e
t a
l.. 2
00
4)
Ex
pe
rim
en
tal
eco
tox
icit
y
EF
PN
EC
(µ
g/L
)
Ref.
Te
ste
d
spe
cie
s
Tro
ph
ic l
ev
el
Ch
ron
ic t
est
Th
e m
ost
se
nsi
tiv
e s
pe
cie
s
Min
Ma
xA
lga
eD
ap
hn
iaF
ish
DP
1C
2C
DP
1C
2C
En
dp
oin
tP
ara
me
ter
Sp
eci
es
Va
lue
(µ
g/L
)
73
8-7
0-5
Tri
me
tho
pri
m
0.0
28
7.2
62
9
26
29
90
79
55
79
20
11
04
50
10
10
LOE
CD
ecr
ea
se
me
tab
oli
c a
ctiv
ity
D. p
oly
mo
rph
a0
;29
50
0.0
05
83
6;
42
0.0
68
1.6
32
<0
.56
26
0.0
10
.03
10
2.9
52
0.9
36
2
0.6
7.6
20
<0
.00
21
4.9
93
31
0.0
50
.21
66
4
<0
.00
5
0.1
74
4
1.0
41
7
HW
Wco
nc.:co
ncen
trationmea
suredin
hosp
ital
wastewater;D:de
compo
sers;P:
prim
aryprod
ucer;1C
:prim
aryco
nsum
er;2C
:seco
ndaryco
nsum
er;Re
f.:allr
eferen
cesaregrou
pedin
Table3u
;ND:no
tde
tected
.
Table3h
(con
tinu
ed)
260 F. Orias, Y. Perrodin / Science of the Total Environment 454–455 (2013) 250–276

Table3i
Inve
ntoryof
compo
unds
soug
htin
hosp
ital
wastewater
withtheirco
rrespo
ndingco
ncen
tration,
ecotox
icityda
taan
dPN
ECcalculation–an
ti-infective
forsystem
icus
e–Te
tracyc
lines.
N°
CA
SC
om
po
un
d
HW
W c
on
c.
(µg
/L)
Ref.
EC
OS
AR
(µ
g/L
) (S
an
de
rso
n
et
al.
. 20
04
)
Ex
pe
rim
en
tal
eco
tox
icit
y
EF
PN
EC
(µ
g/L
)
Ref.
Te
ste
d
spe
cie
s
Tro
ph
ic l
ev
el
Ch
ron
ic t
est
Th
e m
ost
se
nsi
tiv
e s
pe
cie
s
Min
Ma
xA
lga
eD
ap
hn
iaF
ish
DP
1C
2C
DP
1C
2C
En
dp
oin
tP
ara
me
ter
Sp
eci
es
Va
lue
(µ
g/L
)
57
-62
-5C
hlo
rte
tra
cycl
ine
<0
.00
60
.06
93
1
32
23
71
67
58
55
20
11
24
32
14
00
LOE
CG
row
th i
nh
ibit
ion
L. g
ibb
a1
00
10
00
0.1
36
; 4
2
<0
.00
50
.01
11
8
<0
.01
86
4
ND
29
<0
.00
80
.09
43
2
<0
.00
51
7
12
7-3
3-3
De
me
clo
cycl
ine
<0
.00
30
.05
23
14
45
74
37
95
99
74
90
10
00
0.7
49
56
4-2
5-0
Do
xy
cycl
ine
<0
.00
50
.40
33
1
50
47
35
66
31
58
65
31
20
01
10
0E
C5
0S
po
re p
rod
uct
ion
G. i
ntr
ara
dic
es3
71
00
0.3
73
6
0.6
6.7
20
<0
.03
46
4
<5
27
<0
.01
50
.97
32
10
11
8-9
0-8
Min
ocy
clin
e<
15
53
1.7
27
25
00
02
21
00
03
97
21
10
00
10
0E
C5
0P
rote
in s
yn
the
sis
P. f
alc
ipa
rum
17
81
00
00
.17
84
2;
56
79
-57
-2O
xy
tetr
acy
clin
e
<0
.01
23
.74
33
1
16
70
16
65
35
17
13
27
93
82
15
11
10
11
32
1 (Bc)
EC
50
Gro
wth
in
hib
iio
nA
. flo
saq
ua
e2
51
02
.53
6;
42
<0
.01
4
<0
.01
2
<0
.00
71
.33
2
<0
.00
36
4
<0
.00
20
.01
41
8
ND
29
<0
.00
51
7
60
-54
-8T
etr
acy
clin
e
<0
.01
54
.17
83
1
49
32
25
15
01
38
43
12
26
31
15
10
LOE
CG
row
th i
nh
ibit
ion
Sy
ne
cch
ocy
sti
sp.
10
10
13
6;
42
<0
.02
46
4
<0
.01
4
<0
.00
20
.45
51
8
<0
.51
58
27
<0
.00
70
.03
33
2
0.0
59
17
HW
Wco
nc.:co
ncen
trationmea
suredin
hosp
ital
wastewater;D:de
compo
sers;P:
prim
aryprod
ucer;1C
:prim
aryco
nsum
er;2C
:seco
ndaryco
nsum
er;Re
f.:Allreferenc
esaregrou
pedin
Table3u
;ND:no
tde
tected
.
261F. Orias, Y. Perrodin / Science of the Total Environment 454–455 (2013) 250–276

Table3j
Inve
ntoryof
compo
unds
soug
htin
hosp
ital
wastewater
withtheirco
rrespo
ndingco
ncen
tration,
ecotox
icityda
taan
dPN
ECcalculation–an
ti-infective
forsystem
icus
e–Others.
N°
CA
SC
om
po
un
d
HW
W c
on
c.
(µg
/L)
Ref.
EC
OS
AR
(µ
g/L
) (S
an
de
rso
n e
t a
l.,
20
04
)
Ex
pe
rim
en
tal
eco
tox
icit
y
EF
PN
EC
(µ
g/L
)
Ref.
Te
ste
d
spe
cie
s
Tro
ph
ic l
ev
el
Ch
ron
ic t
est
Th
e m
ost
se
nsi
tiv
e s
pe
cie
s
Min
Ma
xA
lga
eD
ap
hn
iaF
ish
DP
1C
2C
DP
1C
2C
En
dp
oin
tP
ara
me
ter
Sp
eci
es
Va
lue
(µ
g/L
)
50
37
0-1
2-2
Ce
fad
rox
ilN
D2
91
54
20
31
08
76
62
36
90
90
10
00
36
.9
25
95
3-1
9-9
Ce
fazo
lin
6.2
21
17
10
10
00
10
0E
C5
0G
row
thP
. su
bca
pit
ata
>1
00
00
00
36
<0
.04
96
4
63
52
7-5
2-6
Ce
fota
xim
0.4
13
17
0<
0.0
23
0.0
89
64
38
82
1-5
3-3
Ce
fra
din
e0
.11
31
71
01
71
76
02
41
01
00
21
48
30
10
00
10
10
.20
30
.85
42
9
55
26
8-7
5-2
Ce
furo
xim
e<
0.1
25
31
13
54
89
85
98
10
52
79
74
23
01
11
01
00
NO
EC
Gro
wth
P. s
ub
cap
ita
ta9
10
00
10
00
91
48
<0
.02
46
4
15
68
6-7
1-2
Ce
ph
ale
xin
(C
efa
lex
ine
)2
.45
71
71
01
00
01
00
EC
50
Gro
wth
L., g
ibb
a>
10
00
00
04
2<
0.0
04
64
21
59
3-2
3-7
Ce
ph
ap
irin
(C
efa
pir
in)
0.0
05
17
0<
0.0
18
64
56
-75
-7C
hlo
ram
ph
en
ico
l
<0
.00
40
.03
63
2
29
27
54
71
72
29
40
10
0E
C5
0B
iolu
min
esc
en
ceV
. fis
her
i6
01
00
00
.06
36
; 4
2<
0.5
26
0.0
01
17
14
03
-66
-3G
en
tam
yci
n0
.27
.62
27
10
00
15
69
00
03
50
70
00
03
01
11
01
00
EC
50
Gro
wth
cya
no
ba
cter
ia6
91
00
00
.06
94
91
52
6
44
3-4
8-1
Me
tro
nid
azo
le
1.8
9.4
10
68
30
51
00
08
98
00
01
31
34
50
31
0LO
EC
His
top
ath
olo
gic
al
lesi
on
T. z
illi
i1
00
00
10
01
00
36
; 4
2
0.1
90
.22
0
3.3
88
62
0.0
67
0.6
43
64
0.2
61
.64
32
1.5
91
17
19
66
18
-13
-0O
selt
am
ivir
0.0
25
62
0
15
52
13
-67
-5R
ito
na
vir
0.1
08
62
0
15
31
8-4
5-3
Th
iam
ph
en
ico
l0
.00
41
74
85
71
07
45
05
00
05
00
EC
50
Gro
wth
P. s
ub
cap
ita
ta8
86
01
00
08
.86
50
; 5
1
14
04
-90
-6V
an
com
yci
n1
.31
12
91
10
30
00
68
10
00
03
22
00
01
00
03
22
HW
Wco
nc.:co
ncen
trationmea
suredin
hosp
ital
wastewater;D:de
compo
sers;P:
prim
aryprod
ucer;1C
:prim
aryco
nsum
er;2C
:seco
ndaryco
nsum
er;Re
f.:allr
eferen
cesaregrou
pedin
Table3u
;ND:no
tde
tected
.
262 F. Orias, Y. Perrodin / Science of the Total Environment 454–455 (2013) 250–276

Table3k
Inve
ntoryof
compo
unds
soug
htin
hosp
ital
wastewater
withtheirco
rrespo
ndingco
ncen
tration,
ecotox
icityda
taan
dPN
ECcalculation–an
tine
oplasticsan
dim
mun
omod
ulan
tag
ents.
N°
CA
SC
om
po
un
d
HW
W c
on
c.
(µg
/L)
Ref.
EC
OS
AR
(µ
g/L
) (S
an
de
rso
n e
t a
l.,
20
04
)
Ex
pe
rim
en
tal
eco
tox
icit
y
EF
PN
EC
(µ
g/L
)
Ref.
Te
ste
d
spe
cie
s
Tro
ph
ic l
ev
el
Ch
ron
ic t
est
Th
e m
ost
se
nsi
tiv
e s
pe
cie
s
Min
Ma
xA
lga
eD
ap
hn
iaF
ish
DP
1C
2C
DP
1C
2C
En
dp
oin
tP
ara
me
ter
Sp
eci
es
Va
lue
(µ
g/L
)
51
-21
-85
-flu
oro
ura
cil
<0
.00
52
71
2
96
78
00
07
22
12
02
10
LOE
CE
mb
ryo
de
ve
lop
me
nt
X. l
aev
is0
,05
50
0.0
01
36
; 4
2
20
12
22
3
<0
.00
50
.02
73
3
0.4
0.9
25
<0
.01
53
5
ND
0.0
33
12
05
11
-73
-1A
na
stro
zole
0.0
03
0.0
03
72
10
44
6-8
6-6
Aza
thio
pri
ne
<0
.00
50
.03
23
41
20
00
94
00
01
66
10
00
01
00
01
2
50
-18
-0C
ycl
op
ho
sph
am
ide
<0
.00
20
.02
13
1
81
68
17
95
00
07
00
00
51
12
10
10
0LO
EC
Incr
ea
se o
f ri
gh
tin
g t
ime
A. r
ub
ens
18
00
01
00
01
83
6
<0
.00
22
34
0.1
61
62
0.5
0.8
25
0.3
0.9
3
23
21
4-9
2-8
Do
xo
rub
icin
0.1
0.5
24
73
53
58
35
53
11
10
01
00
NO
EC
Imm
ob
iliz
ati
on
D. m
ag
na
10
10
00
0.0
13
6<
0.0
13
4
56
42
0-4
5-2
Ep
iru
bic
in0
.11
.42
47
35
35
83
55
01
00
00
.35
5
33
41
9-4
2-0
Eto
po
sid
e<
0.0
05
0.3
83
45
50
00
14
90
00
52
83
31
11
00
10
0LO
EC
Gro
wth
P
. su
bca
pit
ata
10
00
01
00
01
03
60
.11
0.6
3
10
78
68
-30
-4E
xe
me
sta
ne
<0
.00
22
10
95
05
8-8
1-4
Ge
mci
tab
ine
<0
.00
09
0.0
38
12
31
11
00
11
0LO
EC
Gro
wth
D. s
ub
cap
ita
tus
10
00
05
02
00
36
37
78
-73
-2If
osf
am
ide
<0
.00
20
.33
83
1
81
68
17
95
00
07
00
00
01
00
08
.2
<0
.11
25
0.8
95
62
<0
.00
61
.91
41
3
<0
.00
21
0.6
47
34
0.2
0.9
3
11
28
09
-51
-5L
etr
ozo
le0
.00
20
.00
23
82
11
00
01
00
01
LOE
CF
ecu
nd
ity
an
d f
ert
ilit
yO
. la
tip
es5
10
00
.05
57
59
-05
-2M
eth
otr
ex
ate
<0
.00
24
.68
93
41
92
00
05
65
93
,83
E+
08
51
12
10
10
0E
C5
0G
row
th i
nh
ibit
ion
T. p
yri
form
is4
50
00
10
00
45
36
ND
0.1
23
67
1-1
6-9
Pro
carb
azi
ne
<0
.00
53
42
79
70
00
47
65
00
03
99
51
00
00
10
00
27
97
10
54
0-2
9-1
Ta
mo
xif
en
0.0
00
20
.00
82
21
48
22
01
60
00
60
04
20
01
2(Bc)
LOE
CD
ev
elo
pm
en
tS.
pu
rpu
ratu
s0
,01
95
00
.00
03
84
2;
57
; 5
80
.00
30
.02
21
5
>0
.00
1<
0.0
04
35
<0
.00
1<
0.0
02
32
89
77
8-2
6-7
To
rem
ife
ne
<0
.00
01
21
0
57
-22
-7V
incr
isti
ne
<0
.02
34
1.8
81
3.3
39
4.8
74
01
00
00
.00
188
1
HW
Wco
nc.:co
ncen
trationmea
suredin
hosp
ital
wastewater;D:de
compo
sers;P:
prim
aryprod
ucer;1C
:prim
aryco
nsum
er;2C
:seco
ndaryco
nsum
er;Re
f.:allreferen
cesaregrou
pedin
Table3u
;ND:no
tde
tected
.
263F. Orias, Y. Perrodin / Science of the Total Environment 454–455 (2013) 250–276

Table3l
Inve
ntoryof
compo
unds
soug
htin
hosp
ital
wastewater
withtheirco
rrespo
ndingco
ncen
tration,
ecotox
icityda
taan
dPN
ECcalculation—
mus
culoskeletal
system
.
N°
CA
SC
om
po
un
d
HW
W c
on
c.
(µg
/L)
Ref.
EC
OS
AR
(µ
g/L
) (S
an
de
rso
n e
t a
l., 2
00
4)
Ex
pe
rim
en
tal
eco
tox
icit
y
EF
PN
EC
(µ
g/L
)
Ref.
Te
ste
d
spe
cie
s
Tro
ph
ic l
ev
el
Ch
ron
ic t
est
Th
e m
ost
se
nsi
tiv
e s
pe
cie
s
Min
Ma
xA
lga
eD
ap
hn
iaF
ish
DP
1C
2C
DP
1C
2C
En
dp
oin
tP
ara
me
ter
Sp
eci
es
Va
lue
(µ
g/L
)
78
-44
-4C
ari
sop
rod
ol
0,0
05
0,0
11
51
59
29
70
00
7,6
29
01
00
00
.00
76
29
64
-86
-8C
olc
hic
ine
s0
,00
91
73
40
00
10
00
02
90
00
10
10
00
00
0E
C5
0P
hy
sio
log
yP
. ma
lha
men
sis
15
00
00
01
00
01
50
04
2
15
30
7-8
6-5
Dic
lofe
na
c
0,0
61
,91
0
77
06
42
38
49
44
17
17
45
07
3
1 (Bc)
LOE
CLi
ve
r, k
idn
ey a
nd
gil
ls
cell
ula
r a
lte
rati
on
O. m
yk
iss
15
00
.02
36
<0
,12
66
,31
1
0,2
38
14
,93
43
1
0,1
70
,53
32
0,8
33
62
<0
,01
70
18
0,2
86
17
0,0
28
6,8
82
9
<0
,00
10
,01
12
8
36
33
0-8
5-5
Fe
nb
ufe
n0
,01
51
72
25
53
14
64
62
28
42
01
00
01
4.6
46
29
67
9-5
8-1
Fe
no
pro
fen
<0
,00
75
17
0
15
68
7-2
7-1
Ibu
pro
fen
78
,93
11
75
10
43
22
54
60
16
+ C
26
45
16
2
2 (Bc)
LOE
CR
ep
rod
uct
ion
O. l
ati
pes
15
0.2
36
0,0
69
8,9
57
31
1,5
15
11
0
0,3
83
,23
2
<0
,02
50
,31
8
0,2
82
17
ND
29
1,6
14
1,7
29
28
53
-86
-1In
do
me
taci
n
0,0
02
0,0
08
15
68
52
36
14
39
22
20
01
10
00
0LC
50
Mo
rta
lity
T. p
laty
uru
s1
61
40
10
00
16
.14
42
0,0
69
62
<0
,00
51
7
0,3
14
,13
2
22
07
1-1
5-4
Ke
top
rofe
n
0,2
0,3
51
5
29
33
11
97
39
32
75
93
11
10
01
00
EC
50
Gro
wth
P. s
ub
cap
ita
ta2
00
01
00
02
36
17
,40
,17
25
<0
,01
17
<0
,01
0,2
31
18
1,1
9,8
32
0,1
43
0,4
01
28
66
63
5-8
3-4
Ke
toro
lac
0,2
59
,51
01
00
01
00
00
LC5
0M
ort
ali
tyL.
ma
cro
chir
us
14
80
00
05
5
61
-68
-7M
efe
na
mic
aci
d
0,0
01
0,0
14
15
99
84
28
32
34
11
11
01
00
EC
50
Imm
ob
iliz
ati
on
T. p
laty
uru
s3
90
01
00
03
.93
6;
42
6,1
46
2
0,1
0,7
53
2
ND
29
22
20
4-5
3-1
Na
pro
xe
n
<0
,04
37
21
,31
1
22
95
21
51
44
24
27
91
51
47
30
41
1 (Bc)
EC
50
Gro
wth
po
pu
lati
on
C. d
ub
ia3
30
50
6.6
36
0,3
41
13
2
<0
,01
1,0
11
8
<5
,6
62
ND
29
0,4
71
7
50
-33
-9P
he
ny
lbu
tazo
ne
0,0
10
,17
32
23
11
97
26
10
10
00
10
0N
OE
CG
row
th p
op
ula
tio
nP
. su
bca
pit
ata
> 2
50
00
01
00
00
.02
64
2
36
32
2-9
0-4
Pir
ox
ica
m<
0,0
01
17
22
00
57
-96
-5S
ulf
inp
yra
zon
e<
0,0
01
17
0
HW
Wco
nc.:co
ncen
trationmea
suredin
hosp
ital
wastewater;D:de
compo
sers;P:
prim
aryprod
ucer;1C
:prim
aryco
nsum
er;2C
:seco
ndaryco
nsum
er;Re
f.:allreferen
cesaregrou
pedin
Table3u
;+
C:ecotox
icityda
taav
ailablefortestson
commun
ityof
orga
nism
s(sev
eral
speciesex
posedtoge
ther),ND:no
tde
tected
.
264 F. Orias, Y. Perrodin / Science of the Total Environment 454–455 (2013) 250–276

Table3m
Inve
ntoryof
compo
unds
soug
htin
hosp
ital
wastewater
withtheirco
rrespo
ndingco
ncen
tration,
ecotox
icityda
taan
dPN
ECcalculation—
nervou
ssystem
.
N°
CA
SC
om
po
un
d
HW
W c
on
c.
(µg
/L)
Ref.
EC
OS
AR
(µ
g/L
) (S
an
de
rso
n e
t a
l., 2
00
4)
Ex
pe
rim
en
tal
eco
tox
icit
y
EF
PN
EC
(µ
g/L
)T
est
ed
sp
eci
es
Tro
ph
ic l
ev
el
Ch
ron
ic t
est
Th
e m
ost
se
nsi
tiv
e s
pe
cie
s
Min
Ma
xA
lga
eD
ap
hn
iaF
ish
DP
1C
2C
DP
1C
2C
En
dp
oin
tP
ara
me
ter
Sp
eci
es
Va
lue
(µ
g/L
)
50
-78
-2A
cety
lsa
licy
lic
aci
d(a
spir
in)
1.5
43
84
29
4.6
70
58
85
.85
37
55
.08
36
13
12
73
02
20
NO
EC
Nu
mb
er
of
via
ble
off
spri
ng
D. l
on
gis
pin
a3
20
50
6.4
36
; 4
2
42
36
; 4
2
36
; 4
2
36
; 4
2
28
98
1-9
7-7
Alp
razo
lam
N
D
0.0
32
63
0.6
28
0.5
08
5.4
06
01
00
00
.00
05
08
12
97
22
-12
-9A
rip
ipra
zole
N
D
0.0
33
63
0
77
-26
-9B
uta
lbit
al
0.0
11
0.4
83
21
5.3
00
00
58
-08
-2C
aff
ein
e
12
.34
21
1
68
52
4.7
00
08
0.5
00
08
00
35
00
00
LOE
CD
ev
elo
pm
en
tX
. la
evis
0.0
51
00
00
.00
00
51
5.6
17
12
.11
82
29
29
8-4
6-4
Ca
rba
ma
zep
ine
0.0
30
.07
10
81
46
63
59
1.4
00
03
3 +
C4
91
38
28
4
2(Bc)
LOE
CD
ecr
ea
se o
f cy
an
ob
act
eri
a
bio
ma
ssP
eri
ph
yti
c co
mm
un
ity
10
52
<0
.01
67
1.7
11
ND
0
.24
63
0.7
2.7
15
0.6
41
.23
2
0.2
22
62
0.0
18
6.0
82
9
0.0
03
0.0
36
28
0.1
63
17
30
3-4
9-1
Ch
lori
mip
ram
ine
N
D
0.0
89
63
0
50
-53
-3C
hlo
rpro
ma
zine
ND
0
.36
46
30
.23
30
.08
80
.78
62
01
10
01
00
LC5
0M
ort
ali
tyT
. pla
tyu
rus
38
01
00
00
.00
00
88
59
72
9-3
3-8
Cit
alo
pra
m
0.0
19
0.3
22
6
30
.72
90
.63
56
.87
81
00
10
00
10
LC5
0M
ort
ali
tyC
. du
bia
39
00
10
00
.00
63
5
57
86
-21
-0C
loza
pin
e
0.2
95
13
.26
31
,46
82
.14
72
61
00
01
00
00
LOE
CM
ort
ali
tyP
. pro
mel
as
30
.81
00
00
.00
14
42
42
42
36
50
-36
-2C
oca
ine
0.0
51
92
28
14
90
51
.30
00
01
00
02
.28
1
76
-57
-3C
od
ein
e
0.3
78
19
44
64
1.6
02
16
00
10
00
0.0
60
.01
5.7
10
0.2
63
.23
2
43
9-1
4-5
Dia
zep
am
<0
.00
10
.03
83
21
42
42
25
82
.80
00
12
11
64
01
00
LOE
CR
eg
en
era
tio
n o
f d
ige
stiv
e
reg
ion
H. v
ulg
ari
s1
01
00
00
.01
0.0
69
62
43
7-3
8-7
Fe
nta
ny
l0
.01
91
96
74
53
95
72
00
10
00
0.5
39
16
22
-62
-4F
lun
itra
zep
am
0.0
06
31
92
87
79
.90
00
0
54
91
0-8
9-3
Flu
ox
eti
ne
0.0
01
0.0
02
15
34
51
78
17
16
27
06
12
90
66
2LO
EC
De
lay
ed
de
ve
lop
me
nt
R. p
ipie
ns
0.0
29
10
0.0
02
9
<0
.03
6
2
<0
.00
20
.06
93
2
ND
0
.02
16
3
<0
.00
51
7
54
73
9-1
8-3
Flu
vo
xa
min
e
ND
0
.43
56
37
04
30
01
10
EC
50
Gro
wth
in
hib
itio
nP
. su
bca
pit
ata
62
50
1.2
4
60
14
2-9
6-3
Ga
ba
pe
nti
n1
9.4
62
19
63
23
46
.76
72
01
00
00
.19
6
67
40
-88
-1K
eta
min
e0
.20
61
98
61
10
72
1.3
00
00
10
00
0.8
61
10
27
67
-28
-2Le
ve
tira
ceta
m1
1.0
26
20
13
7-5
8-6
Lid
oca
ine
(li
gn
oca
ine
)9
.13
36
22
.60
97
.52
31
07
01
00
00
.00
26
1
84
6-4
9-1
Lora
zep
am
0.1
70
.79
32
20
08
37
61
4.8
00
00
10
00
2N
D
0.3
53
63
18
69
4-4
0-1
Me
pir
izo
le (
Ep
iriz
ole
)<
0.0
05
17
3.0
48
92
.85
03
8.3
92
60
10
00
28
.5
53
7-4
6-2
Me
tha
mp
he
tam
ine
0.2
61
90
57
-27
-2M
orp
hin
e1
.24
19
65
45
2.7
56
19
31
00
10
00
00
LOE
CIm
mu
no
tox
ic e
ffe
ctE
. co
mp
lan
ata
88
40
10
00
0.0
93
.67
96
2
72
-69
-5N
ort
rip
tyli
ne
0.0
02
0.0
07
15
2.5
55
52
.25
58
6.0
09
01
00
10
00
00
EC
50
Sp
he
rica
l d
éfo
rma
tio
n
S. a
mb
igu
um
37
01
00
00
.37
36
36
13
25
39
-06
-1O
lan
zap
ine
0
.30
.12
76
30
60
4-7
5-1
Ox
aze
pa
m1
.12
36
21
.92
13
.78
94
90
10
00
0.0
01
90
.18
60
.94
26
3
Ref.
(con
tinu
edon
next
page)
265F. Orias, Y. Perrodin / Science of the Total Environment 454–455 (2013) 250–276

N°
CA
SC
om
po
un
d
HW
W c
on
c.
(µg
/L)
Ref.
EC
OS
AR
(µ
g/L
) (S
an
de
rso
n e
t
al.
, 20
04
)
Ex
pe
rim
en
tal
eco
tox
icit
y
EF
PN
EC
(µg
/L)
Ref.
Te
ste
d
spe
cie
s
Tro
ph
ic l
ev
el
Ch
ron
ic t
est
Th
e m
ost
se
nsi
tiv
e s
pe
cie
s
Min
Ma
xA
lga
eD
ap
hn
iaF
ish
DP
1C
2C
DP
1C
2C
En
dp
oin
tP
ara
me
ter
Sp
eci
es
Va
lue
(µ
g/L
)
10
3-9
0-2
Pa
race
tam
ol
(Ace
tam
ino
ph
en
)
0.5
29
10
9.3
81
62
.75
85
10
71
24
25
11
60
41
0E
C5
0M
ort
ali
tyS.
pro
bo
scid
eus
34
65
06
.92
36
; 4
2
1.4
5.9
32
<0
.00
21
86
.51
8
10
76
2
0.2
71
63
.12
9
5.4
21
13
69
31
56
.11
98
.85
28
3.1
21
.21
1
36
.95
17
61
86
9-0
8-7
Pa
rox
eti
ne
0.0
13
0.0
19
15
1.5
69
91
.26
27
2.8
59
55
01
31
01
10
LOE
CR
ep
rod
uct
ion
C. d
ub
ia4
40
50
8.8
36
ND
63
<0
.00
20
.07
63
2
<0
.00
25
17
76
-74
-4P
en
tob
arb
ita
l0
.01
10
.15
32
12
30
00
10
00
10
00
0E
C5
0M
ort
ali
tyP
. pro
mel
as
4.9
50
03
6
58
-39
-9P
erp
he
na
zin
e
ND
0
.01
26
30
.85
40
.71
7.6
13
01
00
00
.00
07
1
60
-80
-0P
he
na
zon
e (
An
tip
yri
ne
)
0.0
50
.21
5
27
66
75
30
60
10
00
0.2
76
0.1
62
62
<0
.04
34
2.5
11
<0
.00
3<
0.0
08
32
50
-06
-6P
he
no
ba
rbit
al
<0
.00
10
.36
32
10
20
62
00
00
EC
50
Imm
ob
iliz
ati
on
D. m
ag
na
87
88
00
1.1
36
; 4
2
12
5-3
3-7
Pri
mid
on
e0
.38
36
26
97
32
65
01
00
00
.06
9
20
78
-54
-8P
rop
ofo
l1
.11
0.1
25
89
53
06
42
01
00
00
.04
2
47
9-9
2-5
Pro
py
ph
en
azo
ne
<0
.00
30
.13
20
.24
20
.34
90
.08
60
10
00
0.0
00
08
6
11
19
74
-69
-7Q
ue
tia
pin
e
ND
4
.96
7
63
0
10
62
66
-06
-2R
isp
eri
do
ne
0
.00
30
.06
96
31
.11
91
.12
51
30
10
00
0.0
01
79
61
7-9
6-2
Se
rtra
lin
e0
.00
90
.01
15
1.3
08
61
.03
59
2.2
82
01
21
43
40
42
0E
C5
0G
row
thP
. su
bca
pit
ata
12
.15
00
.24
23
6;
42
0.0
09
0.1
06
63
15
67
6-1
6-1
Su
lpir
ide
0
. 43
21
0.8
36
38
.26
44
36
88
01
00
00
.00
8
76
-75
-5T
hio
pe
nta
l0
.76
36
30
27
20
3-9
2-5
Tra
ma
do
l0
.95
86
30
14
4-1
1-6
Tri
he
xy
ph
en
idy
l
0.0
07
0.1
53
63
0
93
41
3-6
9-5
Ve
nla
fax
ine
0.8
11
63
0
15
13
19
-34
-5Z
ale
plo
n
ND
0
.03
36
30
14
69
39
-27
-7Z
ipra
sid
on
eN
D
0.0
04
63
20
02
00
02
0N
OE
CR
ep
rod
uct
ion
D. m
ag
na
11
10
00
.11
36
HW
Wco
nc.:co
ncen
trationmea
suredin
hosp
ital
wastewater;D
:Decom
posers;P:
Prim
aryprod
ucer;1
C:Prim
aryCo
nsum
er;2
C:Se
cond
aryco
nsum
er;Re
f.:allreferen
cesaregrou
pedin
Table3u
;+C:
Ecotox
icityda
taav
ailablefortestson
commun
ityof
orga
nism
s(sev
eral
speciesex
posedtoge
ther),ND:Not
detected
.
Table3m
(con
tinu
ed)
266 F. Orias, Y. Perrodin / Science of the Total Environment 454–455 (2013) 250–276

Table3n
Inve
ntoryof
compo
unds
soug
htin
hosp
ital
wastewater
withtheirco
rrespo
ndingco
ncen
tration,
ecotox
icityda
taan
dPN
ECcalculation—
compo
unds
forve
terina
ryus
e.
N°
CA
SC
om
po
un
d
HW
W c
on
c.
(µg
/L)
Ref.
EC
OS
AR
(µ
g/L
) (S
an
de
rso
n e
t a
l., 2
00
4)
Ex
pe
rim
en
tal
eco
tox
icit
y
EF
PN
EC
(µ
g/L
)
Ref.
Te
ste
d
spe
cie
s
Tro
ph
ic l
ev
el
Ch
ron
ic t
est
Th
e m
ost
se
nsi
tiv
e s
pe
cie
s
Min
Ma
xA
lga
eD
ap
hn
iaF
ish
DP
1C
2C
DP
1C
2C
En
dp
oin
tP
ara
me
ter
Sp
eci
es
Va
lue
(µ
g/L
)
41
93
7-0
2-4
Bro
mb
ute
rol
<0
.00
25
17
57
77
5-2
9-8
Ca
razo
lol
<0
.00
10
.00
23
32
15
39
24
97
31
00
00
10
00
1.5
39
68
04
-07
-5C
arb
ad
ox
<0
.00
51
7
80
37
0-5
7-6
Ce
ftio
fur
<0
.00
36
4
11
23
98
-08
-0D
an
ofl
ox
aci
n<
0.0
05
<0
.00
83
2
<0
.01
26
4
98
10
6-1
7-3
Dif
lox
aci
n<
0.0
05
17
60
00
02
14
00
08
63
00
00
10
00
60
55
1-9
2-8
Dim
etr
ida
zole
0.0
19
17
93
10
6-6
0-6
En
rofl
ox
aci
n
<0
.00
4<
0.0
05
32
81
33
10
31
0E
C5
0G
row
thM
. aer
ug
ino
sa4
95
00
.98
36
; 4
2N
D2
9
<0
.00
86
4
0.0
41
7
43
21
0-6
7-9
Fe
nb
en
da
zole
<0
.00
11
73
18
50
65
12
10
00
10
00
0E
C5
0D
ev
lop
me
nt
D. r
erio
24
10
00
.24
59
73
23
1-3
4-2
Flo
rfe
nic
ol
ND
29
60
42
00
40
0E
C5
0P
op
ula
tio
n g
row
thT
. ch
ui
13
00
10
00
1.3
42
; 5
0;
60
<0
.00
05
17
11
55
50
-35
-1M
arb
ofl
ox
aci
n0
.00
31
7
<0
.00
46
4
20
57
4-5
0-9
Mo
ran
tel
<0
.00
25
17
13
44
14
51
56
01
00
00
.14
5
11
36
17
-63
-3
Orb
iflo
xa
cin
<0
.00
16
4
53
71
6-5
0-0
Ox
fen
da
zole
<0
.00
11
73
59
21
05
41
37
16
61
00
01
00
00
EC
50
De
ve
lop
me
nt
D. r
erio
68
00
01
00
03
.59
65
9
97
82
5-2
5-7
Ra
cto
pa
min
e<
0.0
05
17
98
10
5-9
9-8
Sa
rafl
ox
aci
n<
0.0
01
17
20
20
00
20
0E
C5
0G
row
thP
. su
bca
pit
ata
16
00
04
1
00
00
80
-35
-3S
ulf
am
eth
ox
yp
yri
da
zin
e<
0.0
01
17
82
99
01
80
64
07
42
20
00
20
0E
C5
0G
row
thL.
min
or
15
10
10
00
1.5
13
8<
0.0
05
64
12
20
-83
-3S
ulf
am
on
om
eth
ox
ine
<
0.0
01
17
82
99
01
80
64
07
01
00
00
.18
<0
.00
11
8
12
2-1
6-7
Su
lfa
nit
ran
ND
64
0
59
-40
-5S
ulf
aq
uin
ox
ali
ne
<0
.00
11
73
73
84
11
42
73
35
04
10
04
10
LOE
CG
row
thS.
dim
orp
hu
s2
05
00
.43
9
10
80
50
-54
-0T
ilm
ico
sin
0.0
14
0.3
53
26
65
10
07
87
20
10
00
0.6
65
<0
.00
86
4
14
01
-69
-0T
ylo
sin
<0
.01
4
16
30
26
67
97
27
41
36
14
10
14
10
LOE
CG
row
thP
. su
bca
pit
ata
64
50
1.2
83
6
<0
.01
2
<0
.01
26
4
<0
.00
51
8
ND
29
<0
.00
1<
0.0
02
32
HW
Wco
nc.:co
ncen
trationmea
suredin
hosp
ital
wastewater;D:de
compo
sers;P:
prim
aryprod
ucer;1C
:prim
aryco
nsum
er;2C
:seco
ndaryco
nsum
er;Re
f.:allreferen
cesaregrou
pedin
Table3u
.
267F. Orias, Y. Perrodin / Science of the Total Environment 454–455 (2013) 250–276

Table3o
Inve
ntoryof
compo
unds
soug
htin
hosp
ital
wastewater
withtheirco
rrespo
ndingco
ncen
tration,
ecotox
icityda
taan
dPN
ECcalculation—
resp
iratorysystem
.
N°
CA
SC
om
po
un
d
HW
W c
on
c.
(µg
/L)
Ref.
EC
OS
AR
(µ
g/L
) (S
an
de
rso
n
et
al.
, 20
04
)
Ex
pe
rim
en
tal
eco
to
xic
ity
EF
PN
EC
(µg
/L)
Ref.
Te
ste
d
spe
cie
s
Tro
ph
ic l
ev
el
Ch
ron
ic t
est
Th
e m
ost
se
nsi
tiv
e s
pe
cie
s
Min
Ma
xA
lga
eD
ap
hn
iaF
ish
DP
1C
2C
DP
1C
2C
En
dp
oin
tP
ara
me
ter
Sp
eci
es
Va
lue
(µ
g/L
)
37
14
8-2
7-9
Cle
nb
ute
rol
<0
.00
21
.11
93
22
37
64
04
75
01
00
00
.04
<0
.00
25
17
50
-02
-2D
ex
am
eth
aso
ne
0.1
47
62
41
32
37
90
03
60
01
0LO
EC
We
igh
tA
. mex
ica
nu
s1
00
10
01
36
; 4
2
79
79
4-7
5-5
Lora
tad
ine
<0
.00
10
.02
63
24
91
42
21
01
00
00
.02
1
18
55
9-9
4-9
Sa
lbu
tam
ol
0.0
26
0.1
43
25
83
75
73
01
15
80
10
00
1.1
58
0.0
22
17
23
03
1-2
5-6
Te
rbu
tali
ne
0.0
38
17
0
41
57
0-6
1-0
Tu
lob
ute
rol
<0
.00
11
70
HW
Wco
nc.:co
ncen
trationmea
suredin
hosp
ital
wastewater;D:de
compo
sers;P:
prim
aryprod
ucer;1C
:prim
aryco
nsum
er;2C
:seco
ndaryco
nsum
er;Re
f.:allreferen
cesaregrou
pedin
Table3u
.
Table3p
Inve
ntoryof
compo
unds
soug
htin
hosp
ital
wastewater
withtheirco
rrespo
ndingco
ncen
tration,
ecotox
icityda
taan
dPN
ECcalculation—
iodine
compo
unds
med
ium.
N°
CA
SC
om
po
un
d
HW
W c
on
c.
(µg
/L)
Ref.
EC
OS
AR
(µ
g/L
) (S
an
de
rso
n e
t a
l.,
20
04
)
Ex
pe
rim
en
tal
eco
tox
icit
y
EF
PN
EC
(µ
g/L
)
Ref.
Te
ste
d
spe
cie
s
Tro
ph
ic l
ev
el
Ch
ron
ic t
est
Th
e m
ost
se
nsi
tiv
e s
pe
cie
s
Min
Ma
xA
lga
eD
ap
hn
iaF
ish
DP
1C
2C
DP
1C
2C
En
dp
oin
tP
ara
me
ter
Sp
eci
es
Va
lue
(µ
g/L
)
73
7-3
1-5
Dia
triz
oa
te3
48
.76
20
13
69
49
-58
-1Io
bit
rid
ol
<0
,13
21
32
50
66
10
8-9
5-0
Ioh
ex
ol
<1
2
62
0
<2
01
70
03
34
57
05
00
09
71
90
00
01
20
00
00
00
00
01
00
04
57
05
78
64
9-4
1-9
Iom
ep
rol
0,3
51
39
02
5
04
39
62
28
24
00
33
62
88
3-0
0-5
Iop
am
ido
l<
10
11
20
33
53
63
00
08
59
20
00
64
72
50
00
01
00
05
36
32
59
96
2
73
33
4-0
7-3
Iop
rom
ide
<5
13
90
33
25
60
05
50
86
60
90
00
00
04
01
12
01
10
EC
50
Re
pro
du
ctio
nD
. ma
gn
a>
10
00
00
01
00
25
64
21
70
.66
2
28
17
9-4
4-4
Iox
ita
lam
ic a
cid
34
26
22
85
73
15
41
24
12
00
00
10
00
2.8
57
15
55
03
3
HW
Wco
nc.:co
ncen
trationmea
suredin
hosp
ital
wastewater;D:de
compo
sers;P:
prim
aryprod
ucer;1C
:prim
aryco
nsum
er;2C
:seco
ndaryco
nsum
er;Re
f.:allr
eferen
cesaregrou
pedin
Table3u
.
268 F. Orias, Y. Perrodin / Science of the Total Environment 454–455 (2013) 250–276

Table3q
Inve
ntoryof
compo
unds
soug
htin
hosp
ital
wastewater
withtheirco
rrespo
ndingco
ncen
tration,
ecotox
icityda
taan
dPN
ECcalculation—
metab
olites.
N°
CA
SP
are
nt
com
po
un
dM
eta
bo
lite
HW
W C
on
c. (
µg
/L)
Ref.
Ex
pe
rim
en
tal
eco
tox
icit
y
EF
PN
EC
(µg
/L)
Ref.
Te
ste
d
spe
cie
s
Tro
ph
ic l
ev
el
Ch
ron
ic t
est
T
he
mo
st s
en
siti
ve
sp
eci
es
Min
Ma
xD
P1
C2
CD
P1
C2
CE
nd
po
int
Pa
ram
ete
rS
pe
cie
sV
alu
e (
µg
/L)
11
42
48
-23
-6G
em
cita
bin
e2
'2'-d
iflu
oro
de
ox
yu
rid
ine
<0
.00
90
.84
12
31
11
00
11
0LO
EC
Imm
ob
iliz
ati
on
D
. ma
gn
a1
00
00
05
02
00
06
1
83
-15
-8
Dip
yro
ne
,
Me
tam
izo
le,
Ph
en
azo
ne
4-a
cety
l a
min
oa
nti
py
rin
(Am
py
ron
e)
57
.17
7.4
70
22
56
2
83
-07
-84
-am
ino
an
tip
yri
ne
10
16
20
58
-15
-14
-dim
eth
yla
min
oa
nti
py
rin
e
<0
.14
6
20
16
72
-58
-84
-fo
rmy
l-a
min
oa
nti
py
rin
17
.81
25
.99
70
47
.88
62
0
51
9-9
8-2
4-m
eth
yla
min
oa
nti
py
rin
e2
18
62
0
??
4/5
-me
thy
lbe
nzo
tria
zole
22
36
20
67
03
-27
-1C
od
ein
e6
-ace
tylc
od
ein
e<
0.0
02
19
0
27
84
-73
-8M
orp
hin
e6
-ace
tylm
orp
hin
e<
0.0
00
50
.03
91
90
56
39
2-1
4-4
Ate
no
lol
Ate
no
lol
aci
d9
.84
62
0
51
9-0
9-5
Co
cain
eB
en
zoy
lecg
on
ine
0.0
29
19
0
88
2-0
9-7
Clo
fib
rate
Clo
fib
ric
aci
d0
.00
91
71
20
53
40
51
0LO
EC
Mo
rta
lity
B. c
aly
cifl
oru
s7
40
50
14
.84
2<
0.0
7
62
34
24
5-1
4-2
Ve
rap
am
ilD
61
70
.15
56
20
63
95
0-0
5-0
Do
xo
rub
icin
Do
xo
rub
icin
ol
<0
.01
35
0
?T
etr
acy
clin
eE
pit
etr
acy
clin
e<
0.5
18
.92
70
59
31
9-7
2-1
Ery
thro
my
cin
eE
ryth
rom
yci
n-H
2O
<0
.58
32
6
0
0.6
76
17
<0
.00
16
.11
18
< 0
.00
5
0.8
27
4
ND
29
51
4-5
3-4
Ch
lort
etr
acy
clin
eIs
o-c
hlo
rote
tra
cycl
ine
<0
.01
0
.02
40
48
12
-40
-2M
etr
on
ida
zole
Me
tro
nid
azo
le-O
H0
.15
0.8
87
64
0
12
7-7
4-2
Su
lfa
dia
zin
eN
-ace
tyls
ulf
ad
iazi
ne
<0
.02
56
41
01
00
01
00
EC
50
Gro
wth
Cy
an
ob
act
eri
a1
01
00
05
1
12
7-7
3-1
Su
lfa
me
razi
ne
N-a
cety
lsu
lfa
me
razi
ne
<0
.03
36
40
10
0-9
0-3
Su
lfa
me
tha
zin
eN
-ace
tyls
ulf
am
eth
azi
ne
<0
.00
76
40
31
75
0-4
8-8
Ta
mo
xif
en
N-d
esm
eth
ylt
am
ox
ife
n<
0.0
01
21
0
18
72
27
-45
-8O
selt
am
ivir
Ose
lta
miv
ir c
arb
ox
yla
te0
.15
16
20
19
39
5-4
1-6
Me
thy
lph
en
ida
teR
ita
lin
ic a
cid
0.2
95
62
0
HW
Wco
nc.:co
ncen
trationmea
suredin
hosp
ital
wastewater;D:de
compo
sers;P:
prim
aryprod
ucer;1C
:prim
aryco
nsum
er;2C
:seco
ndaryco
nsum
er;Re
f.:allr
eferen
cesaregrou
pedin
Table3u
.
269F. Orias, Y. Perrodin / Science of the Total Environment 454–455 (2013) 250–276

Table3r
Inve
ntoryof
compo
unds
soug
htin
hosp
ital
wastewater
withtheirco
rrespo
ndingco
ncen
tration,
ecotox
icityda
taan
dPN
ECcalculation—
non-
pharmaceu
ticals
compo
unds
.
N°
CA
SG
rou
pP
are
nt
com
po
un
d
Co
nc.
HW
W
(µg
/L)
Ref.
Ex
pe
rim
en
tal
eco
tox
icit
y
EF
PN
EC
(µ
g/L
)
Ref.
Te
ste
d
spe
cie
s
Tro
ph
ic l
ev
el
Ch
ron
ic t
est
Th
e m
ost
se
nsi
tiv
e s
pe
cie
s
Min
Ma
xD
P1
C2
CD
P1
C2
CE
nd
po
int
Pa
ram
ètr
eS
pe
cie
sV
alu
e (
µg
/L)
67
-56
-1A
lco
ho
lM
eth
an
ol
76
01
65
+ C
11
62
91
91
16
01
LC5
0M
ort
ali
tyA
. im
bec
illi
s3
70
20
50
74
0,4
42
64
-17
-5A
lco
ho
lE
thy
l a
lco
ho
l (E
tha
no
l)1
70
01
55
01
32
51
70
34
0E
C5
0R
ep
rod
uct
ion
D. m
ag
na
14
00
01
01
40
04
2
67
-63
-0A
lco
ho
l2
-pro
pa
no
l3
67
01
20
04
88
04
00
EC
50
Gro
wth
C. v
acu
ola
ta1
1.4
10
00
0.0
01
14
42
75
-65
-0A
lco
ho
lT
ert
-bu
tan
ol
(Te
rtio
bu
tan
ol)
<1
00
18
00
44
00
00
NO
EC
Mo
rta
lity
C. r
ipa
riu
s1
60
00
00
42
71
-23
-8A
lco
ho
l1
-Pro
pa
no
l <
10
01
32
05
19
80
50
0E
C5
0M
ort
ali
tyO
. la
tip
es6
00
00
01
00
06
00
42
78
-92
-2A
lco
ho
l2
-Bu
tan
ol
<1
00
18
01
34
01
00
LC5
0M
ort
ali
tyX
. la
evis
15
30
00
01
00
01
53
04
2
78
-83
-1A
lco
ho
l2
-Mé
thy
l-1
-pro
pa
no
l <
10
01
21
04
71
00
41
0N
OE
CR
ep
rod
uct
ion
D. m
ag
na
40
00
50
80
42
56
5-6
7-3
Alc
oh
ol
2-(
3)-
Pe
nta
no
l <
10
01
0
17
01
5-1
1-1
Alc
oh
ol
3-H
ex
an
ol
<1
00
10
11
1-2
7-3
Alc
oh
ol
1-H
ex
an
ol
<1
00
11
2 +
C1
53
41
50
0LO
EC
Po
pu
lati
on
gro
wth
ra
teM
. aer
ug
ino
sa1
20
00
50
24
04
2
58
9-5
5-9
Alc
oh
ol
4-H
ep
tan
ol
<1
00
10
11
1-8
7-5
Alc
oh
ol
1-O
cta
no
l <
10
01
22
+ C
15
10
71
51
0N
OE
CR
ep
rod
uct
ion
D. m
ag
na
10
00
10
10
04
2
71
-55
-6H
VO
C1
,1,1
-Tri
chlo
roe
tha
ne
<
0.5
11
70
63
80
61
0E
C5
0P
op
ula
tio
n b
iom
ass
C. r
ein
ha
rdti
i5
36
50
10
.74
2
79
-00
-5H
VO
C1
,1,2
-Tri
chlo
roe
tha
ne
<
0.5
12
30
71
15
07
00
LC5
0M
ort
ali
tyP
. pla
tess
a5
50
01
00
05
.54
2
75
-34
-3H
VO
C1
,1-D
ich
loro
eth
an
e
<0
.51
20
01
10
00
0LO
EC
Mo
rta
lity
P. p
rom
ela
s5
00
00
04
2
75
-35
-4H
VO
C1
,1-D
ich
loro
eth
en
e
<0
.51
10
04
24
04
00
EC
50
Po
pu
lati
on
bio
ma
ssC
. rei
nh
ard
tii
91
20
10
00
9.1
24
2
96
-18
-4H
VO
C1
,2,3
-Tri
chlo
rop
rop
an
e
<0
.51
70
33
10
30
0LC
50
Mo
rta
lity
C. m
ari
nu
s2
01
00
00
.02
42
10
6-9
3-4
HV
OC
1,2
-Dib
rom
eth
an
e
<0
.51
0
10
7-0
6-2
HV
OC
1,2
-Dic
hlo
roe
tha
ne
<
0.5
12
20
78
70
70
0N
OE
CF
oo
d c
om
sum
pti
on
D. r
erio
18
20
10
00
1.8
24
2
74
-97
-5H
VO
CB
rom
och
loro
me
tha
ne
<
0.5
11
00
01
00
00
LC5
0M
ort
ali
tyC
. ca
rpio
67
00
04
2
75
-27
-4H
VO
CB
rom
od
ich
loro
me
tha
ne
<
0.5
11
00
10
00
00
EC
50
Po
pu
lati
on
gro
wth
ra
teT
. py
rifo
rmis
24
00
00
42
15
6-5
9-2
HV
OC
cis-
Dic
hlo
roe
the
ne
<
0.5
11
00
01
00
00
LOE
CM
ort
ali
tyP
. pro
mel
as
50
00
00
42
59
4-1
8-3
HV
OC
Dib
rom
od
ich
loro
me
tha
ne
0
.71
0
75
-09
-2H
VO
CD
ich
loro
me
tha
ne
<
0.5
12
50
12
49
01
20
0E
C5
0B
eh
av
iora
l ch
an
ge
s (g
en
era
l)D
. rer
io6
55
00
10
00
65
.54
2
75
-69
-4H
VO
CF
reo
n 1
1
<0
.51
0
76
-13
-1H
VO
CF
reo
n 1
13
2
.61
0
12
7-1
8-4
HV
OC
Te
tra
chlo
roe
the
ne
<
0.5
13
00
81
39
08
20
NO
EC
Re
pro
du
ctio
nD
. ma
gn
a4
00
50
84
2
56
-23
-5H
VO
CT
etr
ach
loro
me
tha
ne
<
0.5
12
00
48
80
40
0E
C5
0P
op
ula
tio
n b
iom
ass
C. r
ein
ha
rdti
i2
46
10
00
0.2
46
42
15
6-6
0-5
HV
OC
tra
ns-
Dic
hlo
roe
the
ne
<
0.5
10
75
-25
-2H
VO
CT
rib
rom
eth
an
e
0.6
10
79
-01
-6H
VO
CT
rich
loro
eth
en
e
<0
.51
35
06
18
11
06
10
EC
50
Mo
rta
lity
D. j
ap
on
ica
17
00
50
34
42
67
-66
-3H
VO
CT
rich
loro
me
tha
ne
2
.41
33
09
10
14
09
20
EC
50
Mo
rta
lity
O. m
yk
iss
12
40
50
24
.84
2
75
-01
-4H
VO
CV
iny
l ch
lori
de
s <
0.5
11
00
10
00
00
EC
50
Mo
rta
lity
T. p
yri
form
is4
05
00
04
2
67
-64
-1O
the
rA
céto
ne
73
00
16
60
11
40
15
01
14
0LC
50
Mo
rta
lity
D. m
ag
na
10
00
05
02
00
42
80
01
-54
-5O
the
rB
en
zalk
on
ium
(H
Cl)
60
00
14
30
21
31
05
03
00
LOE
CC
hlo
rop
hy
ll f
luo
resc
en
ceE
. ca
na
den
sis
51
00
00
.00
54
3;
42
95
-14
-7O
the
rB
en
zotr
iazo
le2
3.5
76
21
00
10
00
00
EC
50
Po
pu
lati
on
gro
wth
ra
teT
. py
rifo
rmis
29
27
04
2
63
1-6
4-1
Oth
er
Dib
rom
oa
ceti
c a
cid
5.4
25
8.2
93
01
01
00
01
00
EC
50
Mo
rta
lity
P. s
ub
cap
ita
ta6
90
00
42
79
-43
-6O
the
rD
ich
loro
ace
tic a
cid
5.1
92
57
.84
30
40
12
10
10
0E
C5
0M
ort
ali
tyN
. sp
inip
es2
30
00
10
00
23
42
93
-72
-1O
the
rF
en
op
rop
<0
.00
25
17
22
06
41
20
60
0E
C5
0M
ort
ali
tyP
. ca
lifo
rnic
a3
40
10
00
0.3
44
2
11
1-3
0-8
Oth
er
Glu
tara
ldé
hy
de
<5
00
37
20
98
01
34
01
00
EC
50
Imm
ob
iliz
ati
on
D
. ma
gn
a7
50
10
00
0.7
54
2
50
-00
-0O
the
rF
orm
ald
eh
yd
e7
01
55
09
21
25
09
00
EC
50
Imm
ob
iliz
ati
on
C
. vir
gin
ica
30
01
00
00
.34
2
79
-11
-8O
the
rM
on
och
loro
ace
tic
aci
d<
0.5
52
2.1
43
05
01
22
01
11
(B
c)E
C5
0G
row
thP
. su
bca
pit
ata
28
50
0.5
64
2
76
-03
-9O
the
rT
rich
loro
ace
tic
aci
d<
0.8
21
9.1
43
01
80
55
80
50
0E
C5
0M
ort
ali
tyS.
pro
bo
scid
eus
12
00
10
00
1.2
42
HW
Wco
nc.:co
ncen
trationmea
suredin
hosp
ital
wastewater;D:de
compo
sers;P:
prim
aryprod
ucer;1C
:prim
aryco
nsum
er;2C
:seco
ndaryco
nsum
er;Re
f.:allreferen
cesaregrou
pedin
Table3u
;+
C:ecotox
icityda
taav
ailablefortestson
commun
ityof
orga
nism
s(sev
eral
speciesex
posedtoge
ther);
HVOC:
haloge
natedvo
latile
orga
nicco
mpo
unds
.
270 F. Orias, Y. Perrodin / Science of the Total Environment 454–455 (2013) 250–276

2.2.2.3. Detergents (Table 3r). Detergents, which are sometimes soughtin HWW, were always subject to global measurements (anionic deter-gents, cationic detergents, non-ionic detergents) in the works listed,which did not allow calculating the PEC/PNEC ratio or the MCWmax/PNEC ratio for each substance concerned. This was unfortunate giventheir level of concentration and the toxicity of some detergent com-pounds (Boillot et al., 2008).
2.2.2.4. Heavy metals (Table 3s and 3t). The PNECs of nine of the elevenmetals sought were obtained by a statistical method (SSD), giving themconsiderable robustness. Therewas insufficient ecotoxicological data ongadolinium and platinum to estimate an SSD (less than ten species). Itwas observed that the LOD of five metals was higher than the PNECs.Mercury had the lowest PNEC (0.01 μg/L) of the elements measuredand detected in the HWW, while the highest MCWmax/PNEC ratioswere obtained with copper and zinc (101 and 62 respectively).
3. Characterisation of ecotoxicity through a “matrix” approach
3.1. Methodology
Contrary to the “substance” approach, the “matrix” approachconsiders the impact of the whole matrix on organisms and the com-munity of organisms. This approach comprises several levels of study:(i) monospecific bioassays: species are exposed one by one to a rangeof concentrations of the matrix; (ii) multispecific bioassays (cosmos):communities of species are exposed together to a range of concentra-tions of the matrix.
This approach has a major advantage when characterising theecotoxicity of a mixture since the response of the organisms ex-posed to the matrix can be observed directly. Furthermore, it permitsunderstanding the combined effect of substances (antagonism, synergy,or additivity). However, it is impossible to determinewhich compoundsare responsible for the mixture's ecotoxicity. “Matrix” and “substance”
Table 3sInventory of compounds sought in hospital wastewater with their corresponding concentration, ecotoxicity data and PNEC calculation — gadolinium and platinum.
Element HWW conc.(μg/L)
Ref. Experimental ecotoxicity EF PNEC (μg/L) Ref.
Tested species Trophic level Chronic test The most sensitive species
Min Max D P 1C 2C D P 1C 2C Endpoint Parameter Species Value (μg/L)
Gadolinium (Gd) 100 14 3 0 1 1 1 0 1 0 0 LC50 Mortality H. azteca 150 1000 0.15 4232 33
b0.5 10.3 28Platinum (Pt) b0.01 3.58 14 7 0 1 5 1 0 1 1 0 EC50 Immobilization T. tubifex 61 50 1.22 42
4.7 145 16b0.003 0.125 13
13 33
HWW conc.: concentration measured in hospital wastewater; D: decomposers; P: primary producer; 1C: primary consumer; 2C: secondary consumer; ref.: all references aregrouped in Table 3u.
Table 3tInventory of compounds sought in hospital wastewater with their corresponding concentration, ecotoxicity data and PNEC calculation (From INERIS, 2005) — Metals.
N° CAS Element
Conc. HWW (µg/L)
Re
f.
Statistical data from INERIS, 2005
HC5 IC90EF PNEC (µg/L)
Min Max µg/L
7440-22-4 Silver (Ag) <2 1 0.203 10 0.0203
7440-38-2 Arsenic (As)
10 1
22.3 2.9 - 80.7 5 4.4<1 2.4 28
11 6
7440-47-3Chromium
(Cr)
<8 1
7.8 3.4 - 15.2
Cr6 Cr3
<5 284.1 4.7
<4 6
7440-50-8 Copper (Cu)
162 1
3.15 1.0 - 2.4 2 1.68.9 73 28
112 6
7439-92-1 Lead (Pb)
12 1
15.1 6.6 - 27.6 3 5<3.5 6
<1 2.6 28
7439-97-6 Mercury (hg)
0.04 2.6 14 Organic form
Inorganic form<2 1
<5 28
0.01 0.271.65 33
<0.5 6
7440-02-0 Nickel (Ni)
<2 1
10 0.5<5 28
<0.7 6
7440-66-6 Zinc (Zn)
147 1
17.2 8.1 - 29.2 2 8.60.03 250 28
536 6
7440-43-9Cadmium
(Cd)
<5 1 < 50 mg/L CaCO3
> 50 mg/L CaCO3<0.5 28
<7 6 0.21 0.75
HWW conc.: concentration measured in hospital wastewater; HC5: hazardous concentration for 5% of species tested; IC90: confidence index of 90%; Ref.: references for HWWvalues are grouped in Table 3u and ecotoxicity data are from INERIS, 2005.
271F. Orias, Y. Perrodin / Science of the Total Environment 454–455 (2013) 250–276

approaches therefore complement each other when attempting to as-certain the ecotoxicity of a matrix.
3.2. Results (Table 4)
Data on the ecotoxicity of effluents are much less numerous thandata on the substances that compose them. Only ten studies performedon different hospitals are currently available. The ecotoxicity valuesmeasured concern only ten organisms, all studies confounded. Onlytwo species were exposed “chronically” to HWW: Ceriodaphnia dubia7 days (Boillot et al., 2008) and Brachionus calyciflorus72 h (Perrodinet al., 2012).
These works nonetheless provide a wealth of information on thespecific characteristics of these effluents: (i) there is very considerablevariability in the ecotoxicity of effluents between hospitals (EC50 of afew % or less for the most ecotoxic effluents, and nearly 100% for theleast ecotoxic effluents); (ii) as with many other effluents, toxicityvaries greatly as a function of the organism tested (toxicity up to 20times higher for an organism in comparison to another with the sameeffluent); (iii) when bioassays permit, the ecotoxicity of non-filtered ef-fluents is greater than that of filtered effluents, therefore demonstratingtoxicity linked to the particular fraction (Boillot et al., 2008); (iv) whensampleswere taken throughout a day of hospital activity, a marked var-iation of ecotoxicity was recorded between diurnal and nocturnal pe-riods. During the diurnal period, considerable variations of ecotoxicitywere observed as a function of the different hospital activities in prog-ress (cleaning premises, operating theatre blocks, chemistry laboratory,etc.) (Boillot et al, 2008).
Lastly, globally, it has been observed that the toxicity of HWW isgenerally higher than that measured in urban effluents (Santiago et al.,2002).
4. Discussion
4.1. Results obtained by the “substance” approach
4.1.1. Consumption… but not alone!Before carrying any measurement campaign, whether for HWW or
other effluents, it is necessary to choose a list of priority substances tobe measured. In existing studies on HWW, the consumption of drugsand other substances is the predominant criteria for choosing these com-pounds and it is the only criterion in certain cases. This criterion is cer-tainly logical and pertinent (it is pointless to measure compounds thatwill never be found in the effluents), but other criteria may also be im-portant. Thus, on reading the results of the studies identified in this re-view, three types of criteria appear important to take into account:(i) those that influence the presence (or detectability) of the compoundin the effluent (e.g., consumption, excretion rate, excretion site (ambula-tory care or not), analytical constraints). These criteria permit increasingthe probability of detecting the compound sought in the effluent,(ii) those that take into account the compound's toxicity (e.g. ecotoxicity,cytotoxicity). The advantage of these criteria is especially to evaluate theimpact that toxic compounds can have on the operation of aWWTP (andthus indirectly generate greater pollution) and on organisms of the envi-ronment receiving the effluents, (iii) those that take into account the fateandpersistence of the compound in the environment (e.g. biodegradabil-ity, solubility, photodegradation (DellaGreca et al., 2007)). This type ofcriterion could be helpful for understanding why some compoundscross the “barrier” of the WWTP without any removal (Verlicchi et al.,2012b).
However, measurements previously available of a compound inthe environment should not influence the compounds to be measured.Indeed, if measurements are performed on what has already been in-vestigated, compounds that are potentially present and which maypresent a high ecotoxicological risk may be overlooked.
4.1.2. The numerous “orphan” compounds of ecotoxicity dataNo experimental ecotoxicity data existed for 48% of the 297 com-
pounds sought in the different studies. Of these compounds, 21% werethe subject of ECOSAR data (Sanderson et al., 2004). This method is cer-tainly controversial (Madden et al., 2009), but it is the only informationavailable to us at present for these compounds without experimentalecotoxicity data. For example, no experimental data is available forifosfamide, detected in the HWW and also in the environment (Besse etal., 2012). For the remaining compounds (17%) any ecotoxicological
Table 3uMatching between references and publications in Tables 3a to 3t.
1 Boillot et al. (2008)2 Brown et al. (2006)3 Catastini et al. (2009)4 Chang et al. (2010)5 Duong et al. (2008)6 Emmanuel et al. (2005)7 Feldmann et al. (2008)8 Hartmann et al. (1999)9 Jolibois et al. (2002)10 Gómez et al. (2006)11 Kosma et al. (2010)12 Kovalova et al. (2009)13 Kümmerer and Helmers (1997)14 Kümmerer (2001)15 Langford and Thomas (2009)16 Lenz et al. (2005)17 Lin et al. (2008)18 Lin and Tsai (2009)19 Lin et al. (2010)20 Lindberg et al. (2004)21 Liu et al. (2010)22 Löffler and Ternes (2003)23 Mahnik et al. (2004)24 Mahnik et al. (2007)25 Mullot et al. (2010)26 Ohlsen et al. (2003)27 Pena et al. (2010)28 Perrodin et al. (2013)29 Sim et al. (2011)30 Sun and Gu (2007)31 Thomas et al. (2007)32 Verlicchi et al. (2012a)33 Weissbrodt et al. (2009)34 Yin et al. (2010)35 Tauxe-Wuersh et al. (2006)36 Wikipharma (Molander et al. 2009)37 Cunningham et al. (2006)38 Białk-Bielińska et al. (2011)39 De Liguoro et al. (2010)40 Huggett et al. (2002)41 Santos et al. (2010)42 EPA ECOTOX database43 Beveridge et al. (1998)44 Brausch and Rand (2011)45 Sanderson and Thomsen (2009)46 Snell and DesRosiers (2008)47 Kidd et al. (2007)48 Grung et al. (2008)49 Straub et al. (2012)50 Lai et al. (2009)51 Eguchi et al. (2004)52 Isidori et al. (2005)53 García-Galán et al. (2012)54 Park and Choi (2008)55 Park (2005)56 Stoichev et al. (2011)57 Besse et al. (2012)58 DellaGreca et al. (2007)59 Carlsson et al. (2013)60 Liu et al. (2012)61 Zounkova et al. (2010)62 Kovalova et al. (2012)63 Yuan et al. (2013)64 Gros et al. (in press)
272 F. Orias, Y. Perrodin / Science of the Total Environment 454–455 (2013) 250–276

data, eithermodelled or experimental, is available. This is especially inter-esting since many compounds such as econazole and mifepristone aredetected in effluents, and have already been identified as having priorityin the literature due to their bioaccumulability and their low biodegrad-ability (Jean et al., 2012). Globally, 105 others compound are detected inHWWwithout experimental ecotoxicity.
4.1.3. Over-high limits of detection (LOD)For some compounds, it is not possible to evaluate their ecotoxicity in
hospital effluents as their limits of detection are higher than the PNECestablished. Therefore care must be taken before concluding on the tox-icity of these compounds: a compound not detected does not mean thatit is necessarily absent or inoffensive. Thus, before measuring a com-pound in view to assessing its contribution to the ecotoxicity of a giveneffluent, it is important to consider the LOD. Furthermore, it is also nec-essary to ask the question of what onewishes to measure, especially re-gardingmetals. Indeed, the ecotoxicity of a metal can differ according toits chemical formula (e.g. CdCl2 or Cd(OH)2), and to whether it is inor-ganic or organic (e.g. Hg or Hg–CH3) (INERIS, 2005). The hardness ofthemedium can also influence ecotoxicity, thus it is interesting to obtainthis parameter during measurements.
4.1.4. Limits of the European method of calculating PNECsThe recommendations of the TGD (2003) for calculating PNEC were
very useful for this synthesis on the ecotoxicity of the substances
present in HWW, but present certain limits. The latter include in partic-ular the use of an available number of data about species belonging todifferent “trophic levels” to determine the EF. The organisms aregrouped into 4 trophic levels (primary (C1) and secondary consumers(C2), primary producers (P) and decomposers (D)). Organisms withvery different metabolisms are present at each level (e.g. C1: in-sects/protozoa, C2: rotifers/fishes) with equally important roles inthe functioning of the ecosystem (e.g. epibenthic, endobenthic andpelagic). This grouping by trophic level would be interesting if wehad sufficient data for the compounds of interest relating to the phe-nomena of bioamplification and bioaccumulation. However, the ef-fects generated by the contaminants are linked more closely to themetabolism of the organism considered than to the trophic level towhich it belongs. Grouping organisms by major metabolic classcould indicate progress. In this way, the organisms exposed wouldbe more susceptible, within the same class, to undergo the same im-pacts. Thus the weight accorded to the individuals of one class or an-other would be the same for all the organisms of this class (not likethe rotifer or the fish which although belonging to the same trophiclevel do not allow applying the same EF when chronic data exist forboth organisms).
Furthermore, with the current classification, some organisms arevery difficult to classify (omnivorous, change of trophic level on be-coming adults, etc.) or cannot be classified (Eumycota) according tocurrent classification.
Table 4Ecotoxicity of raw hospital wastewater.
Reference Species Exposition duration Parameter Endpoint Hospital Toxicity (% of HWW)
SOCOTEC Environment (1994) D. magna 24 h Mortality EC50 A 48.7–>90B 2.1–8.1C 46.3–>90
V. fisheri 15 min Bioluminescence EC50 A 7.9–18.6B 2.1–5.7C 25–53.5
Villegas-Navarro et al. (1997) D. magna 24 h Mortality EC50 D 0.7 ± 0.3E 50.3 ± 8
D. magna 48 h Mortality D 0.4 ± 0.2E 33.2 ± 6.6
Emmanuel et al. (2004) V. fisheri 5 min Bioluminescence EC50 F 1.42 ± 0.2515 min 3.4 ± 0.7
D.magna 24 h Mortality EC50 44 ± 34Emmanuel et al. (2005) V. fisheri 5 min Bioluminescence EC50 G 40
15 min 23.830 min 21.7
P. subcapitata 72 h Growth 1.8D. magna 24 h Mortality 1.6
48 h 1.4Tsakona et al. (2007) V. fisheri 5 min Bioluminescence EC50 H 15.6
15 min 6.8Boillot et al. (2008) D. magna 24 h Mortality EC20 I 19
48 h 17V. fisheri 15 min Bioluminescence 15
30 min 14P. subcapitata 72 h Growth 7C. dubia 24 h Mortality 18
48 h Mortality 187 d Growth 237 d Reproduction 5
L. minor 7 d Growth 100Berto et al. (2009) D. magna 48 h Mortality LOEC J 4
P. subcapitata 72h Fluorescence 16Zgorska et al. (2011) V. fisheri ? Bioluminescence EC50 K 46.3
A. salina 24 h Mortality 59.9D. magna 48 h Mortality 20.8T. platyurus 24 h Mortality 22.6P. subcapitata 72 h Growth 18.8
Perrodin et al. (2012) P. subcapitata 72 h Growth EC20 L 100100
H. incongruens 72 h Mortality 100100
B. calyciflorus 72 h Mortality 1411.5
273F. Orias, Y. Perrodin / Science of the Total Environment 454–455 (2013) 250–276

Moreover, this classification does not take into account the speciesdiversity of the organisms tested. Thus a compound with a long termEC50 for two species of different trophic levels (fishes and daphnia)can have an EF of 50 (e.g. ranitidine) while acute tests of a compoundon 30 species will have an EF of 1000 (e.g. chloramphenicol).
4.1.5. There is nothing automatic about antibiotics!Among the PhCpmeasured, antibiotics are over-represented (20% of
the compoundsmeasured). On the contrary, PhCp such as anitivirals arealmost absent from the measures performed (only 2 antivirals (ritona-vir and oseltamivir) among 60 compounds). Nonetheless, Jean et al.(2012) identified 7 antivirals as prevalently bioaccumulable com-pounds as ritonavir found in HWW (Kovalova et al., 2012). This obser-vation is a good illustration of the preference given to the quantityconsumed in comparison to other criteria, such as “bioaccumulabity”,for choosing the compounds to be measured.
4.1.6. “Drug focused” measurementsCuring patients is not the only activity performed in hospitals, and
compounds other than drugs are used. However, very few studieshave focused on the other products present in HWW. Among theseother “compounds”, mention can be made of: (i) disinfectants includ-ing bleach, glutaraldehyde and detergents. These compounds may bepresent in large quantities and contribute to a great extent to the tox-icity of HWW (Boillot et al., 2008); (ii) metabolites produced by me-tabolism (e.g. erythromycine H2O) and reactions between organiccompounds and the chlorine present in HWW (e.g. dichloracetic acid).These compounds must be considered in the same way as “parent”compounds, since their toxicity can be far greater than the original com-pounds (Daniel et al., 1981; Wu et al., 2009); (iii) products used for di-agnostics such as ICMs, present in large quantities in both hospitaleffluents and the environment (Santos et al., 2010). What is more,there is practically no ecotoxicological data relating to these com-pounds; (iv) metals that can stem from the ageing of hospital piping,leaching of buildings by rainwater (sometimes mixed with wastewater(e.g. Cu, Pb)), and drugs (e.g. Gd, Pt). Regarding the latter, the speciationor chemical form is never specified. However, this information is neces-sary to evaluate the toxicity linked to their presence. Indeed,most of thetime, neutral or inorganic forms are often far less toxic and/or bioavail-able than ionised or organic forms (e.g. for mercury and cadmium).
4.1.7. Limits of ATC classificationThis ATC classification system was chosen for practical reasons. It
permits easy comparison with pharmacological and metabolic data.Moreover, it allows communication between specialists of disparatedisciplines such as chemists, ecologists and biologists. However, it isbased on a human metabolic classification, not necessarily consistentwith the other living organisms used in ecotoxicology.
Another artefact linked to this classification is the presence ofcompounds for veterinary use in HWW. Some compounds are notused exclusively for medical purposes; they can also be used for vet-erinary purposes. What is more, they can be formed after “parent”compounds have reacted with other compounds. Certain of the com-pounds found can be considered as corresponding to metabolites ofcompounds for human use since some molecules are structurallyvery similar. In addition, some compounds could belong to severalcategories and so being hard to classify.
4.2. Results obtained by the “matrix” approach
4.2.1. The variability of ecotoxicity valuesTheoretically, the data available relating to the ecotoxicity mea-
sured in the effluents make it possible to perform a more realisticevaluation of their ecotoxicity, but they are difficult to interpretgiven their variability. This variability is linked to the diversity ofthe activities practised in the hospitals considered. The period of the
year, the geographic position or the number of patients is one of theparameters that can influence the toxicity of HWW. The moment ofsampling during a 24 h period can also influence the concentrationof pollutants in the effluent. For example, Boillot et al., demonstratedthat the period of the day in which the effluent was most ecotoxicwas between 9 a.m. and 1 p.m., a period of intense activity in thehospital.
4.2.2. Ecotoxicity linked to the particulate phase of the effluentFew authors have focused on measuring the particulate phase of
HWW effluents (Löffler and Ternes, 2003; Boillot et al., 2008; Langfordand Thomas, 2009). However, the concentration in contaminant can beup to five times greater when measuring a non-filtered sample (Löfflerand Ternes, 2003). This adsorption of pollutants in the particulatephase of the effluent and the consequences it implies on the ecotoxicityof the effluent as awhole have already been observedwith other types ofeffluents (Corapcioglu and Jiang, 1993; Grolimund and Borkovec, 2001;Han et al., 2006; Massoudieh and Ginn, 2008; Mc Gechan and Lewis,2002). It is essential to take this into account to perform an accurate as-sessment of the ecotoxicity of HWW.
4.2.3. Variation of ecotoxicity linked to the desorption of VOCs in the gas-eous phase
The presence of highly volatile substances in HWW (e.g. HVOC, re-sidual active chlorine, etc.), and the subsequent potential transfer ingaseous phase can lead to a considerable variation of the ecotoxicityof HWW through time. This phenomenon can occur in particularwhen HWW flows into urban sewer systems, or during the transportand conservation of samples in the laboratory under inappropriateconditions.
4.3. Comparison between “substance” and “matrix” approaches
The comparison of the composition of HWWwith the ecotoxicity ofthe corresponding effluents could provide a clearer explanation of thesource of their ecotoxicity and, on this basis, lead to recommendationson the compounds to be treated with priority, or to be eliminatedfrom consumption in hospitals. This task, although tempting at firstglance, is always difficult to perform due to the considerable numberof phenomena to be taken into account regarding the ecotoxicity of aneffluent. Mention can be made here of the phenomena of ecotoxicolog-ical synergy and/or antagonism liable to exist between the compoundsof the same effluent, as well as the effect of the effluent's pH and hard-ness on ecotoxicity.
In the present case, the exercise is even more difficult, given thescarcity of studies available that link “in-depth chemical analysis”with “ecotoxicity” for the same effluent.
5. Conclusion and perspectives
This review first highlighted the very great diversity of compoundspresent in HWW. Given the numerous activities practised in hospitals,with the latter sometimes sharing sewer systems carrying rainwater, avery large number of different substances are discharged into the efflu-ents (disinfectants, detergents, drugs, heavy metals, etc.).
Two complementary approaches have been used to assess theecotoxicity of HWW. The “substance” approach allows identifying thepresence of very toxic compounds (minimum PNEC observed close to10−8 μg/L). This ecotoxicity was observed for both the short term(acute toxicity) and the long term (chronic toxicity). The conclusionsof the “matrix” approach are similar, emphasising strong ecotoxicityof the global effluent in some cases. These two approaches also under-line the great complexity of HWW, with considerable qualitative vari-ability (type of compounds (PhCp, detergents, metabolites, etc.))and quantitative variability (concentrations of the different compounds
274 F. Orias, Y. Perrodin / Science of the Total Environment 454–455 (2013) 250–276

detected), hence potential ecotoxicity that varies greatly as a function ofthe case considered.
The work also brings to the fore the predominance, in the studiesand practices of environmental agencies, of consumption as a criterionfor selecting the compounds to be dosed. Excretion rate and biodegrad-ability are sometimes taken into account as supplementary criteria. Asfor the “bioaccumulability” and “ecotoxicity” of substances, they arerarely taken into account for choosing the compounds to be dosed,whereas they have a major impact on the risk of these compounds forecosystems.
To obtain further knowledge on the ecotoxicity of HWW, it is nownecessary to continue chemical and ecotoxicological analyses in otherhospitals to identify links between their characteristics (size, type ofdepartments, period of the year, etc.) and the ecotoxicity of their ef-fluents. Regarding chemical analyses, we recommend in particularseeking substances with strong ecotoxic potential, in addition to theirlevel of consumption. It is also necessary to followmetabolite concentra-tion for a better understanding about the link between composition ofwastewater and ecotoxicity even if this link is not always directly possi-ble. This statement is highlighted too by Escher and Fenner (2011) whodemonstrated the need to monitor the metabolites of the substancesconsumed. As for ecotoxicological analyses, we recommend using a bat-tery of bioassays that include at least three trophic levels (chronic tests)and performing bioassays on the particulate phase of effluents, whichare often richer in pollutants than the dissolved phase. Following-upthe assessment of toxicity during a day and a week can also provide awealth of information.
In addition to these recommendations, performing studies com-bining “in-depth chemical analysis” and “ecotoxicological analysis”for the same effluent is advisable to improve the knowledge of thesource of the ecotoxicity of effluents in order to make recommenda-tions on the priority compounds for treatment or elimination fromconsumption in hospitals.
Lastly, although analysis of the global effluent collected at thepoint of discharge from the hospital provides interesting information,it is obviously now necessary to set up ecotoxocological monitoring ofthe effluents of each department in them, in view to obtaining betterunderstanding of the global spatial–temporal functioning of hospitals,and to assessing the contribution of different hospital departments toglobal ecotoxicity more efficiently. This step is required to define ef-fective hospital environmental management policies (replacementof toxic products by less pollutant alternative products, sterilisationby steam rather than bactericides, etc.).
References
Berto J, Rochenbach GC, Barreiros MAB, Corrêa AXR, Peluso-Silva S, Radetski CM. Physico-chemical, microbiological and ecotoxicological evaluation of a septic tank/Fenton re-action combination for the treatment of hospital wastewaters. Ecotoxicol EnvironSaf 2009;72:1076–81.
Besse J-P, Garric J. Human pharmaceuticals in surface waters: implementation of a prior-itization methodology and application to the French situation. Toxicol Lett 2008;176:104–23.
Besse J-P, Latour J-F, Garric J. Anticancer drugs in surface waters: what can we sayabout the occurrence and environmental significance of cytotoxic, cytostatic andendocrine therapy drugs? Environ Int 2012;39:73–86.
Beveridge CM, Parr ACS, Smith MJ, Kerr A, Cowling MJ, Hodgkiess T. The effect ofbenzalkonium chloride concentration on nine species of marine diatom. EnvironPollut 1998;103:31–6.
Białk-Bielińska A, Stolte S, Arning J, Uebers U, Böschen A, Stepnowski P, et al.Ecotoxicity evaluation of selected sulfonamides. Chemosphere 2011;85:928–33.
Boillot C, Bazin C, Tissot-Guerraz F, Droguet J, Perraud M, Cetre JC, et al. Daily physico-chemical, microbiological and ecotoxicological fluctuations of a hospital effluentaccording to technical and care activities. Sci Total Environ 2008;403:113–29.
Brausch JM, Rand GM. A review of personal care products in the aquatic environment:environmental concentrations and toxicity. Chemosphere 2011;82:1518–32.
Brown KD, Kulis J, Thomson B, Chapman TH, Mawhinney DB. Occurrence of antibioticsin hospital, residential, and dairy effluent, municipal wastewater, and the RioGrande in New Mexico. Sci Total Environ 2006;366:772–83.
Carlsson G, Patring J, Kreuger J, Norrgren L, Oskarsson A. Toxicity of 15 veterinary phar-maceuticals in zebrafish (Danio rerio) embryos. Aquat Toxicol 2013;126:30–41.
Catastini C, Mullot J-U, Luis Castillo PM, Tordjman I, Cervantes P, Modelon H, et al.Recherche de molécules anticancéreuses dans des effluents hospitaliers: étudepilote. Tech Hosp 2009;714:56–61.
Chang X, Meyer MT, Liu X, Zhao Q, Chen H, Chen J-a, et al. Determination of antibioticsin sewage from hospitals, nursery and slaughter house, wastewater treatmentplant and source water in Chongqing region of Three Gorge Reservoir in China. En-viron Pollut 2010;158:1444–50.
Corapcioglu M, Jiang S. Colloid facilitated groundwater contaminant transport. WaterResour Res 1993;29:2215–26.
Cunningham VL, Buzby M, Huthcinson T, Mastrocco F, Parke N, Roden N. Effects ofhuman pharmaceuticals on aquatic life: next steps. Environ Sci Technol 2006;40:3456–62.
Daniel P, Gaskell SJ, Bishop H, Campbell C, Nicholson RI. Determination of tamoxifenand biologically active metabolites in human breast tumours and plasma. Eur JCancer Clin Oncol 1981;17:1183–9.
De Liguoro M, Di Leva V, Gallina G, Faccio E, Pinto G, Pollio A. Evaluation of the aquatictoxicity of two veterinary sulfonamides using five test organisms. Chemosphere2010;81:788–93.
DellaGreca M, Iesce MR, Isidori M, Nardelli A, Previtera L, Rubino M. Phototransformationproducts of tamoxifen by sunlight inwater. Toxicity of the drug and its derivatives onaquatic organisms. Chemosphere 2007;67:1933–9.
Duong HA, Pham NH, Nguyen HT, Hoang TT, Pham HV, Pham VC, et al. Occurrence, fateand antibiotic resistance of fluoroquinolone antibacterials in hospital wastewatersin Hanoi, Vietnam. Chemosphere 2008;72:968–73.
Eguchi K, Nagase H, Ozawa M, Endoh YS, Goto K, Hirata K, et al. Evaluation of antimicro-bial agents for veterinary use in the ecotoxicity test using microalgae. Chemosphere2004;57:1733–8.
Emmanuel E, Keck G, Blanchard J-M, Vermande P, Perrodin Y. Toxicological effects ofdisinfections using sodium hypochlorite on aquatic organisms and its contributionto AOX formation in hospital wastewater. Environ Int 2004;30:891–900.
Emmanuel E, Perrodin Y, Keck G, Blanchard JM, Vermande P. Ecotoxicological risk assess-ment of hospital wastewater: a proposed framework for raw effluents discharginginto urban sewer network. J Hazard Mater 2005;117:1-11.
EPA ECOTOX database. (last access 01/12/12)http://www.epa.gov/ecotox/.Escher BI, Baumgartner R, Koller M, Treyer K, Lienert J, McArdell CS. Environmental
toxicology and risk assessment of pharmaceuticals from hospital wastewater.Water Res 2011;45:75–92.
Escher BI, Fenner K. Recent advances in environmental risk assessment of transforma-tion products. Environ Sci Technol 2011;45:3835–47.
Feldmann DF, Zuehlke S, Heberer T. Occurrence, fate and assessment of polar metamizole(dipyrone) residues in hospital and municipal wastewater. Chemosphere 2008;71:1754–64.
García-Galán MJ, González Blanco S, López Roldán R, Díaz-Cruz S, Barceló D. Ecotoxicityevaluation and removal of sulfonamides and their acetylated metabolites duringconventional wastewater treatment. Sci Total Environ 2012;437:403–12.
Gómez MJ, Petrović M, Fernández-Alba AR, Barceló D. Determination of pharmaceuti-cals of various therapeutic classes by solid-phase extraction and liquid chromatog-raphy–tandem mass spectrometry analysis in hospital effluent wastewaters. JChromatogr A 2006;1114:224–33.
Grolimund D, Borkovec M. Release and transport of colloidal particles in natural porousmedia. 1. Modelling. Water Resour Res 2001;37:559–70.
Gros M, Rodríguez-Mozaz S, Barceló D. Rapid analysis of multiclass antibiotic residuesand some of their metabolites in hospital, urban wastewater and river water byultra-high-performance liquid chromatography coupled to quadrupole-linear iontrap tandem mass spectrometry. J Chromatogr A in press; http://dx.doi.org/10.1016/j.chroma.2012.12.072.
Grung M, Källqvist T, Sakshaug S, Skurtveit S, Thomas KV. Environmental assessment ofNorwegian priority pharmaceuticals based on the EMEA guideline. Ecotoxicol En-viron Saf 2008;71:328–40.
Halling-Sørensen B, Nors Nielsen S, Lanzky PF, Ingerslev F, Holten Lützhøft HC, JørgensenSE. Occurrence, fate and effects of pharmaceutical substances in the environment— areview. Chemosphere 1998;36:357–93.
Han GH, Hur HG, Kim SD. Ecotoxicological risk of pharmaceuticals from wastewatertreatment plants in Korea: occurrence and toxicity to Daphnia magna. EnvironToxicol Chem 2006;25:265–71.
Hartmann A, Golet EM, Gartiser S, Alder AC, Koller T, Widmer RM. Primary DNA dam-age but not mutagenicity correlates with ciprofloxacin concentrations in Germanhospital wastewaters. Arch Environ Contam Toxicol 1999;36:115–9.
Heberer T. Tracking persistent pharmaceutical residues in the aquatic environment: areview of recent research data. Toxicol Lett 2002;131:5-17.
Huggett DB, Brooks BW, Peterson B, Foran CM, Schlenk D. Toxicity of select beta adren-ergic receptor-blocking pharmaceuticals (B-blockers) on aquatic organisms. ArchEnviron Contam Toxicol 2002;43:229–35.
INERIS. Fiches de données toxicologiques et environnementales des substances chimiques;2005 [http://www.ineris.fr/rapports-d%C3%A9tude/toxicologie-et-environnement/fiches-de-donn%C3%A9es-toxicologiques-et-environnementales- (Dernier accès 18/12/2012)].
Isidori M, Lavorgna M, Nardelli A, Pascarella L, Parrella A. Toxic and genotoxic evalua-tion of six antibiotics on non-target organisms. Sci Total Environ 2005;346:87–98.
Jean J, Perrodin Y, Pivot C, Trepo D, Perraud M, Droguet J, et al. Identification and prior-itization of bioaccumulable pharmaceutical substances discharged in hospital ef-fluents. J Environ Manage 2012;103:113–21.
Jjemba PK. Excretion and ecotoxicity of pharmaceutical and personal care products inthe environment. Ecotoxicol Environ Saf 2006;63:113–30.
Jolibois B, Guerbet M, Vassal S. Glutaraldehyde in hospital wastewater. Arch EnvironContam Toxicol 2002;42:137–44.
275F. Orias, Y. Perrodin / Science of the Total Environment 454–455 (2013) 250–276

Joss A, Keller E, Alder AC, Göbel A, McArdell CS, Ternes T, et al. Removal of pharmaceuti-cals and fragrances in biological wastewater treatment. Water Res 2005;39:3139–52.
Kidd KA, Blanchfield PJ, Mills KH, Palace VP, Evans RE, Lazorchak JM, et al. Collapse of a fishpopulation after exposure to a synthetic estrogen. Proc Natl Acad Sci 2007;104:8897–901.
Kosma CI, Lambropoulou DA, Albanis TA. Occurrence and removal of PPCPs in munici-pal and hospital wastewaters in Greece. J Hazard Mater 2010;179:804–17.
Kovalova L, McArdell CS, Hollender J. Challenge of high polarity and low concentrationsin analysis of cytostatics and metabolites in wastewater by hydrophilic interactionchromatography/tandem mass spectrometry. J Chromatogr A 2009;1216:1100–8.
Kovalova L, Siegrist H, Singer H, Wittmer A, McArdell CS. Hospital wastewater treatmentby membrane bioreactor: performance and efficiency for organic micropollutantelimination. Environ Sci Technol 2012;46:1536–45.
Kumar A, Xagoraraki I. Pharmaceuticals, personal care products and endocrine-disruptingchemicals in U.S. surface and finished drinking waters: a proposed ranking system.Sci Total Environ 2010;408:5972–89.
Kümmerer K. Drugs in the environment: emission of drugs, diagnostic aids and disin-fectants into wastewater by hospitals in relation to other sources — a review.Chemosphere 2001;45:957–69.
Kummerer K, Erbe T, Gartiser S, Brinker L. AOX—emissions from hospitals into munic-ipal waste water. Chemosphere 1998;36:2437–45.
Kümmerer K, Helmers E. Hospital effluents as a source for platinum in the environ-ment. Sci Total Environ 1997;193:179–84.
Lai H-T, Hou J-H, Su C-I, Chen C-L. Effects of chloramphenicol, florfenicol, andthiamphenicol on growth of algae Chlorella pyrenoidosa, Isochrysis galbana, andTetraselmis chui. Ecotoxicol Environ Saf 2009;72:329–34.
Langford KH, Thomas KV. Determination of pharmaceutical compounds in hospital ef-fluents and their contribution to wastewater treatment works. Environ Int2009;35:766–70.
Lenz K, Hann S, Koellensperger G, Stefanka Z, Stingeder G, Weissenbacher N, et al. Pres-ence of cancerostatic platinum compounds in hospital wastewater and possibleelimination by adsorption to activated sludge. Sci Total Environ 2005;345:141–52.
Lin AY-C, Tsai Y-T. Occurrence of pharmaceuticals in Taiwan's surface waters: impact ofwaste streams from hospitals and pharmaceutical production facilities. Sci TotalEnviron 2009;407:3793–802.
Lin AY-C, Wang X-H, Lin C-F. Impact of wastewaters and hospital effluents on the occur-rence of controlled substances in surface waters. Chemosphere 2010;81:562–70.
Lin AY-C, Yu T-H, Lin C-F. Pharmaceutical contamination in residential, industrial, andagricultural waste streams: risk to aqueous environments in Taiwan. Chemosphere2008;74:131–41.
Lindberg R, Jarnheimer P-Å, Olsen B, Johansson M, Tysklind M. Determination of anti-biotic substances in hospital sewage water using solid phase extraction and liquidchromatography/mass spectrometry and group analogue internal standards.Chemosphere 2004;57:1479–88.
Liu W, Ming Y, Huang Z, Li P. Impacts of florfenicol on marine diatom Skeletonemacostatum through photosynthesis inhibition and oxidative damages. Plant PhysiolBiochem 2012;60:165–70.
Liu X, Zhang J, Yin J, Duan H, Wu Y, Shao B. Analysis of hormone antagonists in clinicaland municipal wastewater by isotopic dilution liquid chromatography tandemmass spectrometry. Anal Bioanal Chem 2010;396:2977–85.
Löffler D, Ternes TA. Analytical method for the determination of the aminoglycoside gen-tamicin in hospital wastewater via liquid chromatography–electrospray–tandemmass spectrometry. J Chromatogr A 2003;1000:583–8.
Madden JC, Enoch SJ, Hewitt M, Cronin MTD. Pharmaceuticals in the environment: goodpractice in predicting acute ecotoxicological effects. Toxicol Lett 2009;185:85-101.
Mahnik S, Rizovski B, Fuerhacker M, Mader R. Determination of 5-fluorouracil in hospi-tal effluents. Anal Bioanal Chem 2004;380:31–5.
Mahnik SN, Lenz K, Weissenbacher N, Mader RM, Fuerhacker M. Fate of 5-fluorouracil,doxorubicin, epirubicin, and daunorubicin in hospital wastewater and their elimi-nation by activated sludge and treatment in a membrane-bio-reactor system.Chemosphere 2007;66:30–7.
Massoudieh A, Ginn TR. Modeling colloid-enhanced contaminant transport in stormwaterinfiltration basin best management practices. Vadose Zone J 2008;7:1215–22.
Mc Gechan M, Lewis D. Transport of particulate and colloid sorbed contaminantsthrough soil, part 1: general principles. Biosyst Eng 2002;83:255–73.
Molander L, Ågerstrand M, Rudén C. WikiPharma — a freely available, easily accessible,interactive and comprehensive database for environmental effect data for pharma-ceuticals. Regul Toxicol Pharmacol 2009;55:367–71.
Mullot J-U, Karolak S, Fontanova A, Levi Y. Modeling of hospital wastewater pollutionby pharmaceuticals: first results of Mediflux study carried out in three French hos-pitals. Water Sci Technol 2010;62:2912–9.
Ohlsen K, Ternes T, Werner G, Wallner U, Löffler D, Ziebuhr W, et al. Impact of antibi-otics on conjugational resistance gene transfer in Staphylococcus aureus in sewage.Environ Microbiol 2003;5:711–6.
Park J. Pharmaceuticals in the environment andmanagement approaches in Korea. KEI;2005 [RE-12].
Park S, Choi K. Hazard assessment of commonly used agricultural antibiotics on aquaticecosystems. Ecotoxicology 2008;17:526–38.
Pena A, Paulo M, Silva LJG, Seifrtová M, Lino CM, Solich P. Tetracycline antibiotics in hos-pital and municipal wastewaters: a pilot study in Portugal. Anal Bioanal Chem2010;396:2929–36.
Perrodin Y, Christine B, Sylvie B, Alain D, Jean-Luc B-K, Cécile C-O, et al. A priori assess-ment of ecotoxicological risks linked to building a hospital. Chemosphere 2013;90:1037–46.
Sanderson H, Johnson DJ, Reitsma T, Brain RA, Wilson CJ, Solomon KR. Ranking and pri-oritization of environmental risks of pharmaceuticals in surface waters. RegulToxicol Pharmacol 2004;39:158–83.
Sanderson H, Thomsen M. Comparative analysis of pharmaceuticals versus industrialchemicals acute aquatic toxicity classification according to the United Nations classi-fication system for chemicals. Assessment of the (Q)SAR predictability of pharmaceu-ticals acute aquatic toxicity and their predominant acute toxic mode-of-action.Toxicol Lett 2009;187:84–93.
Santiago S, Becker van Slooten K, Chèvre N, Pardos M, Benninghoff C, Thybaud E, et al.Guide pour l'utilisation des tests écotoxicologiques, avec les daphnies, les bactériesluminescentes et les algues vertes, appliqués aux échantillons de l'environnement;2002 [55 pp.].
Santos LHMLM, Araújo AN, Fachini A, Pena A, Delerue-Matos C, Montenegro MCBSM.Ecotoxicological aspects related to the presence of pharmaceuticals in the aquaticenvironment. J Hazard Mater 2010;175:45–95.
Sim W-J, Lee J-W, Lee E-S, Shin S-K, Hwang S-R, Oh J-E. Occurrence and distribution ofpharmaceuticals in wastewater from households, livestock farms, hospitals andpharmaceutical manufactures. Chemosphere 2011;82:179–86.
Snell TW, DesRosiers NJD. Effect of progesterone on sexual reproduction of Brachionusmanjavacas (Rotifera). J Exp Mar Biol Ecol 2008;363:104–9.
SOCOTEC ENVIRONNEMENT. Etude diagnostiquc des flux de pollution rejetés par leshôpiaux: Edouard Herriot de Lyon, Nord de Grenoble, de Chambéry - Compterendu des visites préliminaires des 19 et 20 mai 1994. Lyon: Société françaised'hygiène hospitalière de l'hôpital de la Croix-rousse; 1994 [1885, 42 pp.].
Stoichev T, Baptista MS, Basto MCP, Vasconcelos VM, Vasconcelos MTSD. Effects ofminocycline and its degradation products on the growth of Microcystis aeruginosa.Ecotoxicol Environ Saf 2011;74:219–24.
Straub JO, Gysel D, Kastl U, Klemmer J, Soderegger M, Studer M. Environmental riskasessment for ancillary substances in biotechnological production of pharmaceuti-cals. Environ Toxicol Chem 2012;31:681–7.
Sui Q, Wang B, Zhao W, Huang J, Yu G, Deng S, et al. Identification of priority pharma-ceuticals in the water environment of China. Chemosphere 2012;89:280–6.
Sun Y-x, Gu P. Determination of haloacetic acids in hospital effluent after chlorinationby ion chromatography. J Environ Sci 2007;19:885–91.
Tauxe-Wuersh A, De Alencastro LP, Grandjean D, Tarradellas J. Trace determination oftamoxifen and 5-fluorouracil in hospital and urban wastewater. 2006;86:473–85.
Ternes TA. Occurrence of drugs in German sewage treatment plants and rivers. WaterRes 1998;32:3245–60.
TGD. Technical Guidance Document in Support of Commission Directive 93/67/EEC onRisk Assessment for New Notified Substances and Commission Regulation (EC);2003.
Thomas KV, Dye C, Schlabach M, Langford KH. Source to sink tracking of selectedhuman pharmaceuticals from two hospitals and and a wastewater treatmentworks. J Environ Monit 2007;9:1410–8.
Tsakona M, Anagnostopoulou E, Gidarakos E. Hospital waste management and toxicityevaluation: a case study. Waste Manag 2007;27:912–20.
Vazquez-Roig P, Andreu V, Blasco C, Picó Y. Risk assessment on the presence of pharmaceu-ticals in sediments, soils and waters of the Pego–Oliva Marshlands (Valencia, easternSpain). Sci Total Environ 2012;440:24–32.
Verlicchi P, Al Aukidy M, Galletti A, Petrovic M, Barceló D. Hospital effluent: investiga-tion of the concentrations and distribution of pharmaceuticals and environmentalrisk assessment. Sci Total Environ 2012a;430:109–18.
Verlicchi P, Al Aukidy M, Zambello E. Occurrence of pharmaceutical compounds inurban wastewater: removal, mass load and environmental risk after a secondarytreatment—a review. Sci Total Environ 2012b;429:123–55.
Verlicchi P, Galletti A, Petrovic M, Barceló D. Hospital effluents as a source of emerg-ing pollutants: an overview of micropollutants and sustainable treatment options. JHydrol 2010;389:416–28.
Villegas-Navarro A, Santiago MR, Perez FR, Torres RR, Abularach TD, Reyes JL. Determina-tion of LC50 from Daphnia magan in treated industrial waste water and non-treatedhospital effluents. Environ Int 1997;23:535–40.
Weissbrodt D, Kovalova L, Ort C, Pazhepurackel V, Moser R, Hollender J, et al. Massflows of X-ray contrast media and cytostatics in hospital wastewater. Environ SciTechnol 2009;43:4810–7.
Wu X, Hawse JR, SubramaniamM, Goetz MP, Ingle JN, Spelsberg TC. The tamoxifen me-tabolite, endoxifen, is a potent antiestrogen that targets estrogen receptor α fordegradation in breast cancer cells. Cancer Res 2009;69:1722–7.
Yin J, Shao B, Zhang J, Li K. A preliminary study on the occurrence of cytostatic drugs inhospital effluents in Beijing, China. Bull Environ Contam Toxicol 2010;84:39–45.
Yuan S, Jiang X, Xia X, Zhang H, Zheng S. Detection, occurrence and fate of 22 psychiat-ric pharmaceuticals in psychiatric hospital and municipal wastewater treatmentplants in Beijing, China. Chemosphere 2013;90:2520–5.
Zgorska A, Arendarczyk A, Grabinska-Sota E. Toxicity assessment of hospital wastewaterby the use of a biotest battery. Arch Environ Prot 2011;37:55–61.
Zounkova R, Kovalova L, Blaha L, Dott W. Ecotoxicity and genotoxicity assessment of cy-totoxic antineoplastic drugs and their metabolites. Chemosphere 2010;81:253–60.
276 F. Orias, Y. Perrodin / Science of the Total Environment 454–455 (2013) 250–276

CHAPITRE 1. ECOTOXICITÉ DES EFFLUENTS HOSPITALIERS
44

CHAPITRE 1. ECOTOXICITÉ DES EFFLUENTS HOSPITALIERS
1.3 Synthèse
Au regard du nombre de produits différents utilisés dans les hôpitaux (e.g. détergents,surfactants, médicaments, produits de contrastes iodés, lessives, ...) très peu de contaminantont été recherchés dans les effluents hospitaliers (297 au total dont 11 métaux). A titre decomparaison, environ 3000 médicaments sont aujourd’hui prescrits dans les hôpitaux euro-péens. En revanche, on observe que les résidus pharmaceutiques sont les contaminants lesplus recherchés dans les effluents hospitaliers (197 résidus pharmaceutiques recherchés sur297 contaminants). Deux groupes thérapeutiques ressortent majoritairement : les antibio-tiques et les antipsychotiques. Par ailleurs, même s’ils restent très peu étudiés au regard deleur diversité potentiel, on observe que les métabolites représentent une part non négligeabledes contaminants recherchés (24 molécules). De plus, parmi les 34 publications scientifiquesregroupées dans cette revue bibliographique, seulement 3 d’entre elles se sont intéressées à lafraction de RP adsorbées sur les particules en suspension. A chaque fois, les concentrationsaprès désorption étaient supérieures à celles en solution.
Considérant le grand nombre de molécules différentes présentes dans les effluents hospita-liers, il est nécessaire de hiérarchiser les molécules d’intérêt. Pour cela, de nombreux auteursutilisent un seul critère : la consommation du médicament au sein de l’hôpital. Or, il n’estpas pertinent de prendre en compte ce seul paramètre pour prioriser les molécules que ce soitpour estimer les molécules qu’on peut retrouver dans l’effluent ou que l’on cherche à évaluerl’impact environnemental potentiel. En effet, le lien entre consommation d’un médicamentet présence d’un résidu pharmaceutiques dans l’effluent n’est pas du tout évident. Des para-mètres comme l’excrétion, la métabolisation ou le caractère ambulatoire du traitement sontdes critères à prendre également en compte pour évaluer la présence d’un résidu pharmaceu-tique dans l’effluent hospitalier. Dans le chapitre suivant, nous avons fait un zoom sur lesrésidus pharmaceutiques dans les effluents hospitaliers, sans considérer les autres substanceséventuellement présentes.
45

CHAPITRE 1. ECOTOXICITÉ DES EFFLUENTS HOSPITALIERS
46

Chapitre 2
Ecotoxicité des résiduspharmaceutiques des effluentshospitaliers
2.1 Enjeux et démarche
Les effluents hospitaliers sont, de manière générale, traités de la même façon que les ef-fluents urbains c’est-à-dire évacués vers les STEP. Or ces installations ne sont pas conçuespour dégrader 100% des résidus pharmaceutiques présents avec une grande diversité et par-fois des concentrations importantes dans les effluents hospitaliers. Ainsi, nous avons vouludéterminer quelles sont, au sein de l’effluent hospitalier, les molécules qui présentaient le plusgrand danger écotoxicologique parmi les 197 recherchées. Pour cela, nous avons comparé lesdonnées d’écotoxicité (quand elles existaient) des molécules détectées à leurs concentrationsmaximales respectives déjà mesurées dans les effluents hospitaliers par divers auteurs. On ob-tient alors des quotients de danger (Hazard Quotient : HQ) qui nous permettent de classer lesmolécules présentes dans les effluents hospitaliers en fonction de leur danger écotoxicologique.
2.2 Article 2 : Pharmaceuticals in hospital wastewa-ter : Their ecotoxicity and contribution to the en-vironmental hazard of the effluent
Article soumis le 8 août 2013, accepté le 6 janvier 2014 et publié le 4 février 2014 dansle journal « Chemosphere ».
47

CHAPITRE 2. ECOTOXICITÉ DES RÉSIDUS PHARMACEUTIQUES DESEFFLUENTS HOSPITALIERS
48

Pharmaceuticals in hospital wastewater: Their ecotoxicityand contribution to the environmental hazard of the effluent
Orias Frédéric ⇑, Perrodin YvesUniversity of Lyon, ENTPE, CNRS, UMR 5023 LEHNA, 2 Rue Maurice Audin, 69518 Vaulx-en-Velin, France
h i g h l i g h t s
� 197 Pharmaceuticals were sought in hospital wastewater.� PNEC are available in bibliography for 150 of them.� Calculation of 127 hazard quotients has been performed.� Hazardousness of pharmaceuticals is greatly variable.� 15 Compounds are very hazardous for the environment.
a r t i c l e i n f o
Article history:Received 8 August 2013Received in revised form 16 December 2013Accepted 6 January 2014Available online 4 February 2014
Handling Editor: J. de Boer
Keywords:Hospital wastewaterEcotoxicityPharmaceuticalsHazard quotient
a b s t r a c t
Nowadays, pharmaceuticals are found in every compartment of the environment. Hospitals are one of themain sources of these pollutant emissions sent to wastewater treatment plants (WWTP) that are poorlyequipped to treat these types of compounds efficiently. In this work, for each pharmaceutical compoundfound in hospital wastewater (HWW), we have calculated a hazard quotient (HQ) corresponding to thehighest concentration measured in HWW divided by its predicted no effect concentration (PNEC). Thuswe have assessed the contribution of each compound to the ecotoxicological threat of HWW taken asa whole. Fifteen compounds are identified as particularly hazardous in HWW. In future more attentionshould be given to their analysis and replacement in hospitals, and to their elimination in WWTPs. Thiswork also highlights the lack of knowledge of the ecotoxicity of certain pharmaceutical compounds foundin HWW at high concentrations (mg L�1). In order to extend this study, it is now necessary to investigateecotoxic risks linked to various emission scenarios, focusing in particular on dilution in the aquaticenvironment and the production of metabolites, especially during transit inside WWTPs.
� 2014 Elsevier Ltd. All rights reserved.
1. Introduction
Nowadays, pharmaceuticals (PCs) are ubiquitous in the envi-ronment. Indeed, several ecosystemic compartments are contami-nated by these substances: the hydrosphere (surface water (Heathet al., 2010), groundwater (Loos et al., 2010), drinking water (Gibset al., 2007)); the geosphere (Silva et al., 2011a,b Yang et al., 2011)and the biosphere (Lajeunesse et al., 2011).
Among the different sources emitting these PCs into the envi-ronment, hospitals are particularly interesting. This is becausethe numerous care activities performed inside these establish-ments (anaesthesia, anticancer treatment, diagnosis, etc.) lead tothe consumption of large quantities of PCs. This intensive activityat a single point leads to high concentrations of PCs (through
excretion) in hospital wastewater (HWW), sometimes greater thanin urban wastewater (Verlicchi et al., 2010).
HWW is almost always untreated before being discharged intourban wastewater networks and then into municipal wastewatertreatment plants (WWTP) (Emmanuel et al., 2004) despite the factthat these plants are not designed to remove complex compoundssuch as PCs (Ternes, 1998; Heberer, 2002; Joss et al., 2005).Although some PCs entering WWTPs are removed (e.g. biodegrada-tion or adsorption onto sludge), a sizeable amount is released intothe environment (Verlicchi et al., 2012b).
Some of these PCs present a considerable threat for aquaticorganisms even at very low concentrations. Given the great num-ber of compounds measured in HWW (Orias and Perrodin, 2013),it is necessary to characterize their respective contributions tothe hazardousness of effluents discharged into the environment,in order to rank them. This will make it possible to identify thepharmaceutical compounds on which hospital managers mustfocus their efforts in order to decrease their release into the
0045-6535/$ - see front matter � 2014 Elsevier Ltd. All rights reserved.http://dx.doi.org/10.1016/j.chemosphere.2014.01.016
⇑ Corresponding author. Tel.: +33 4 72 04 70 58; fax: +33 4 72 04 77 43.E-mail address: [email protected] (O. Frédéric).
Chemosphere 115 (2014) 31–39
Contents lists available at ScienceDirect
Chemosphere
journal homepage: www.elsevier .com/locate /chemosphere

environment and their potential impacts on aquatic ecosystemsand/or on the activated sludges of WWTP.
In order to establish the compounds most concerned by theenvironmental hazardousness of HWW, we compare concentra-tions measured in HWW (Orias and Perrodin, 2013) to the avail-able ecotoxicity data (PNEC: Predictive No Effect Concentration).A hazard quotient (HQ) is calculated for each compound, character-izing its level of involvement in the environmental hazardousnessof HWW.
Finally, we make proposals in this work to improve knowledgeon the environmental hazard of these compounds, and to assessthe environmental risks linked to various scenarios of releasingtreated HWW into the environment.
2. Materials and method
2.1. Determination of PC concentrations in HWW
Two main approaches can be used to determine the concentra-tion of PCs in HWW: (i) a theoretical approach (Mullot et al., 2010;Escher et al., 2011) consisting in assessing the quantity of PCs thatcould be present in HWW (Predictive Effluent Concentration), con-sidering various parameters such as consumption and excretion.The advantage of this method is that it takes into account everycompound used in a hospital, but considerable uncertainty re-mains due to the parameters considered. The other approach (ii)is experimental (Verlicchi et al., 2012a; Perrodin et al., 2013) andconsists in measuring the concentration of PCs directly in HWW.However, measuring every PC potentially present in HWW is veryexpensive. Moreover, limits of detection (LOD) are often too high toassess all ecotoxicological hazards as PNECs are regularly higherthan LODs. Nevertheless, this type of approach provides real infor-mation on concentrations in the effluent.
In this work, we kept the highest concentrations of each PC al-ready measured in HWW from a previous study (Orias and Perro-din, 2013), in order to obtain the ‘‘worst case’’ scenario. It should benoted that only one measure was made for several PCs. In the fu-ture, when more data is available, it could be relevant to studymedian values to evaluate ‘‘typical’’ concentrations of each PC inHWW.
2.2. Ecotoxicity of PCs in HWW (PNEC calculation)
In a previous study (Orias and Perrodin, 2013), PNEC’s of PCswere calculated according to modelled ecotoxicological data usingthe ECOSAR method (Sanderson et al., 2003), experimental datafrom international databases (e.g. EPA ECOTOX, Wikipharma(Molander et al., 2009)) and also from the literature. These resultsare used in this study.
2.3. Involvement of each PCs in hazardousness of HWW (HQcalculation)
The involvement of PCs in the environmental hazard of HWWdepends not only on its concentration in HWW but also on itsecotoxicity.
In order to identify and rank these PCs, a hazard quotient wascalculated for each compound according to the equation below:
HQ ¼ HWWmaxconc:=PNEC
With: HWWmax conc.: highest concentration ever measured inHWW in lg L�1. PNEC: Predictive No Effect Concentration in lg L�1.
The PC with the highest HQ will be considered that mostinvolved in the hazard of HWW.
It is noteworthy that 172 of the 198 PCs sought in the HWWwere detected. Of the 172 PCs detected, data was insufficient for34 to calculate their PNEC. Finally, only 127 HQs were calculated.
3. Results
3.1. Type of available data
In the following paragraphs, the PCs are analysed according totheir distribution in therapeutic classes (Table 1). These classesare those of the ATC (Anatomic Therapeutic and Chemical) classifi-cation proposed by the World Health Organisation CollaboratingCenter for Drug Statistics Methodology (WHOCC, 2011).
3.1.1. PC detection in HWW (Fig. 1)PCs from classes J (antibiotic and antiviral) and N (anaesthesia
compound, antidepressants, etc.) were those most sought for anddetected in HWW, with 47 and 46 PCs detected out of 60 and 47,respectively. Furthermore, 22 of the 22 compounds of class Csought (Cardio-vascular system) in HWW were detected. We alsofound 12 anticancer PCs (class L) of the 16 sought, 11 compoundslinked to the musculoskeletal system (class M) of the 14 soughtand 9 sex hormones (class G) of the 10 sought. For each group V(various), A (Alimentary and tract metabolism) and D (Dermatolog-icals), 7 compounds were sought with 7, 6 and 5 detected, respec-tively. Finally, we found 5 compounds linked to the respiratorysystem (class R) of the 6 sought. It is noteworthy that among thePCs sought for in HWW, no compounds from classes B (Bloodand blood forming organs), H (Systemic hormonal preparations,excluding sex hormones and insulins), P (Antiparasitic products,insecticides and repellents) and S (Sensory organs) were found.
3.1.2. Available PNECsOf the compounds detected in HWW, considering every class,
not enough or no ecotoxicological data was available for 22% ofthem, making it impossible to calculate a PNEC. Class N containedthe most compounds for which no or insufficient data was avail-able. Indeed, 14 PCs detected in class N (of 47) did not have a cal-culable PNEC. Two other therapeutic classes, i.e. classes V and G,drew attention due to the lack of ecotoxicological data. In classV, 7 out of 7 compounds were detected, but sufficient experimentaland modelled data for calculating a PNEC could only be found forone of them. For 3 others, only modelised data were available.Moreover, for 2 compounds of this class, detected at concentra-tions ranging from a hundred lg L�1 to a mg L�1, there was no dataon their ecotoxicity. Concerning 22 compounds classed as veteri-nary compounds sought in HWW, only 5 were detected. Indeed,
Table 1Classes and codes of Anatomic Therapeutic and Chemical classification.
Code Content
A Alimentary tract and metabolismB Blood and blood forming organsC Cardiovascular systemD DermatologicalsG Genito-urinary system and sex hormonesH Systemic hormonal preparations, excluding sex hormones and
insulinsJ Antiinfectives for systemic useL Antineoplastic and immunomodulating agentsM Musculo-skeletal systemN Nervous systemP Antiparasitic products, insecticides and repellentsR Respiratory systemS Sensory organsV Various
32 O. Frédéric, P. Yves / Chemosphere 115 (2014) 31–39

some compounds are not used exclusively for medical purposes;they can also be used for veterinary purposes. What is more, theycan be formed after ‘‘parent’’ compounds have reacted with othercompounds. Certain of the compounds found can be consideredas corresponding to metabolites of compounds for human usesince some molecules are structurally very similar. In addition,some compounds could belong to several categories and so beinghard to classify. That is why we can find veterinary compound inHWW.
Ecotoxicological data were also lacking for classes of sex hor-mones in the compounds detected in HWW. Indeed, no experi-mental data was available for 3 of the 10 hormones found.However, the intrinsic properties of these compounds are activeat very low concentrations, a fact confirmed by the PNECs of theother compounds from this class.
The class whose ecotoxicity had been studied most was class J(antibiotics and antivirals). However, 8 class J compounds detectedin HWW had no calculable PNEC. These compounds included riton-avir, an antiviral identified in a previous study as particularly bio-accumulative and poorly biodegradable (Jean et al., 2012).
Considering metabolites, despite the large number of them de-tected in HWW, we had few data concerning their ecotoxicity. In-deed, the issue of metabolites is emerging and has not yet receivedthe attention it deserves. That is why we chose to exclude this classfrom the HQ calculations.
3.2. Concentration of PCs in HWW
The range of PC concentrations found in HWW is very wide,varying from several ng L�1 (e.g. ethinylestradiol and toremifene)to several mg L�1 (e.g. iobitridol and iopamidol). However, in most
cases, PCs were detected between a hundred ng L�1 and a hundredlg L�1. We found the highest concentrations in class V (iodisedcontrast medium).
3.3. Ecotoxicity of PCs present in HWW
In Figs. 2a–2c, we grouped every PNEC available in the literatureon the PCs sought in HWW. To facilitate reading, we organisedthem into 3 categories: compounds with a PNEC higher than1 lg L�1 (the less ecotoxic), compounds with PNECs between100 ng L�1 and 1 lg L�1 (intermediate ecotoxicity), and com-pounds with PNECs under 100 ng L�1 (the most ecotoxic). Com-pounds with a PNEC calculated on the basis of modelled data(according to ECOSAR) are represented in orange.
Finally, in appendix 1, we grouped the 77 compounds (45 hu-man pharmaceuticals and 32 metabolites and veterinary com-pounds) already sought in HWW and/or detected in HWW,without an available or calculable PNEC.
3.4. Involvement of PCs in the hazard of HWW
3.4.1. HQs < 1: no ecotoxicological hazard in HWW (n = 50) (Figs. 3and 4)
The range of calculated HQs was very wide (from 1 to 10�5).Among the compounds detected in HWW presenting a low ecotox-icological hazard for aquatic organisms, we found a distributionsimilar to that observed for all the compounds sought. That is tosay that we found almost all the classes, with the same distributionfor the compounds with low hazard as in HWW (Fig. 1), with clas-ses N and J being the main classes. It should be noted that no Dcompound was found in the compounds with low ecotoxicity inHWW.
3.4.2. HQs between 1 and 1000: hazardous compounds in HWW(n = 62) (Figs. 5 and 6)
Here again, we can see the same distribution of compoundssearched for in HWW according to their therapeutic classes. How-ever, we observed a lower number of G and A compounds and ahigher number of D compounds in this group of hazardous com-pounds in HWW.
3.4.3. HQs higher than 1000: very compounds hazardous in HWW(n = 15) (Fig. 7)
The 15 PCs with a HQ > 1000 represented 33% of the hormonesmeasured (3 of 9 hormones measured in HWW belonged to themost hazardous compounds in HWW). However, 7 (clotrimazole,lidocaine, propyphenazone, sulpiride, chlorpromazine, sulfapyri-dine and ethinylestradiol) of the 15 compounds detected were de-tected only once in HWW (Table 2). Moreover, ampicillin, estroneand estradiol were detected in two out of three measurements. Theremaining compounds of these 15 most hazardous compoundswere detected 5 times or more (11 times for trimethoprim)(Table 2).
According to Orias and Perrodin (2013), caffeine should be pres-ent in this group but due to a mistake in the transcription from anoriginal article to the EPA ECOTOX database, we dropped this com-pound from this category. We shall discuss this in greater detail inthe discussion part.
4. Discussion
4.1. PC concentrations in HWW
Firstly, when performing a detailed examination of every studycarried out on the concentration of pharmaceuticals in HWW all
0 2 4 6 8
1012141618202224262830323436384042444648505254565860
J N C L M G V A D R Q Meta
Num
ber
of c
ompo
und
Fig. 1. Distribution of pharmaceuticals searched for in hospital wastewater (HWW)and ecotoxicity data available according to therapeutic classes (ATC classification). Ingreen, compounds detected in HWW with an experimental PNEC available, in orange,compounds detected in HWW with only a modelised (ECOSAR) PNEC available, inred, compounds detected in HWW without PNEC available and in blue, compoundsnot detected in HWW. Q and Meta columns respectively represent veterinarycompounds and metabolites. (For interpretation of the references to colour in thisfigure legend, the reader is referred to the web version of this article.)
O. Frédéric, P. Yves / Chemosphere 115 (2014) 31–39 33

over the world, we observed that they have all been performed inthe north hemisphere. Indeed, no study concerning South-Ameri-can, African or Oceanic hospitals was found. Also, given the so-cio-economic, climatic and epidemiological differences betweenthe continents considered, the consumption of pharmaceuticals isprobably not the same as that in the hospitals observed.
Moreover, the pharmaceuticals studied in HWW are oftengrouped by therapeutic class (e.g. antibiotics, anticancer, etc.)
although these classes are human-metabolism-based. But, withthe very wide range of metabolisms found in non-target organisms(e.g., vertebrates, crustaceans, algae, bacteria, etc.) in the environ-ment, these therapeutic classes are no longer relevant. An alterna-tive classification could group PCs according to their toxicophores(or mode of action). A toxicophore is a sub-structure inside a mol-ecule which is responsible for a specific mode of action on metab-olism (Escher and Fenner, 2011). This was suggested by Besse and
0.000
0.100
0.200
0.300
0.400
0.500
0.600
0.700
0.800
0.900
1.000
Azi
thro
myc
in (J
)D
iclo
fena
c (M
)Ci
noxa
cin
(J)
Lora
tadi
ne (R
)O
floxa
cin
(J)
Tric
losa
n (D
)Ph
enyl
buta
zone
(M)
Met
hylp
redn
isol
one
(D)
Clen
bute
rol (
R)Ra
ni�d
ine
(A)
Clar
ithro
myc
in (J
)Pr
opof
ol (N
)Le
troz
ole
(L)
Prop
anol
ol (C
)Ch
lora
mph
enic
ol (
J)Co
dein
e (N
)Pr
imid
one
(N)
Gen
tam
ycin
(J)
Nal
idix
ic a
cid
(J)
Mor
phin
e (N
)Su
lfath
iazo
le (
J)Ch
lort
etra
cycl
ine
(J)
Met
opro
lol (
C)Zi
pras
idon
e (N
)Su
lfiso
mid
ine
(J)
Glib
encl
amid
e (A
)M
inoc
yclin
e (J
)A
torv
asta
�n (C
)G
abap
en�n
(N)
Ibup
rofe
n (M
)Su
lfani
lam
ide
(J)
Mev
asta
�n (C
)Se
rtra
line
(N)
Sulfa
dim
etho
xine
(J)
Phen
azon
e (N
)G
emfib
rozi
l (C)
Nifu
roxa
zide
(A)
Epir
ubic
in (L
)N
ortr
ipty
line
(N)
Dox
ycyc
line
(J)
Eryt
hrom
ycin
(J)
Beza
fibra
te (C
)Pr
avas
ta�n
(C)
Cipr
oflox
acin
(J)
Fent
anyl
(N)
Sulfa
met
hoxa
zole
(J)
Vera
pam
il (C
)Su
lfiso
xazo
le (J
)Su
lfam
eraz
ine
(J)
Sulfa
diaz
ine
(J)
Dem
eclo
cycl
ine
(J)
Feno
fibra
te (C
)Pa
pave
rine
(A)
Keta
min
e (N
)Jo
sam
ycin
(J)
Dex
amet
haso
ne (R
)Fu
rose
mid
e (C
)Te
trac
yclin
e (J
)
PNEC
(μg/
L)
100 ng/L > PNEC ≥ 1 μg/L
Fig. 2b. PNEC between 100 ng L�1 and 1 lg L�1 of pharmaceuticals searched for in HWW. In black, PNEC calculated on the basis of experimental data and in orange, PNECcalculated on the basis of modelised data (ECOSAR). Letters in brackets correspond to the therapeutic group (Table 1). (For interpretation of the references to colour in thisfigure legend, the reader is referred to the web version of this article.)
1.E+00
1.E+01
1.E+02
1.E+03
1.E+04
1.E+05Ph
enob
arbi
tal (
N)
Salb
utam
ol (R
)Be
taxo
lol (
C)Fl
uvox
amin
e (N
)Li
ncom
ycin
(J)
Prog
este
rone
(G)
Lora
zepa
m (N
)Ca
rbam
azep
ine
(N)
Keto
prof
en (M
)Co
cain
e (N
)O
xyte
trac
yclin
e (J
)Su
lfam
ethi
azol
e (J
)Io
xita
lam
icac
id (V
)Pi
ndol
ol (C
)M
efen
amic
acid
(M)
Sulfa
guan
idin
e (A
)N
adol
ol (C
)A
cebu
tolo
l (H
Cl) (
C)A
cety
lsal
icyl
icac
id (N
)N
apro
xen
(M)
Ole
ando
myc
in (J
)Pa
race
tam
ol (N
)Ifo
sfam
ide
(L)
Paro
xe�n
e (N
)Th
iam
phen
icol
(J)
Etop
osid
e (L
)A
zath
iopr
ine
(L)
Sulfa
met
hazi
ne (J
)So
talo
l (C)
Fenb
ufen
(M)
Indo
met
acin
(M)
Cycl
opho
spha
mid
e (L
)Fi
nast
erid
e (G
)A
teno
lol (
C)En
alap
ril (
C)Fa
mo�
dine
(A)
Clox
acill
in (J
)M
epir
izol
e (N
)Sa
licyl
icac
id (D
)Ce
fadr
oxil
(J)
Met
hotr
exat
e (L
)Ce
furo
xim
e (J
)M
etro
nida
zole
(J)
Cefr
adin
e (J
)G
emci
tabi
ne (L
)Io
prom
ide
(V)
Cim
e�di
ne (A
)H
ydro
chlo
roth
iazi
de (C
)Va
ncom
ycin
(J)
Lisi
nopr
il (C
)Pi
pem
idic
acid
(J)
Colc
hici
nes
(M)
Proc
arba
zine
(L)
Peni
cilli
nV (J
)Io
hexo
l (V)
PNEC
(μg/
L)
PNEC > 1 μg/L
Fig. 2a. PNEC greater than 1 lg L�1 of pharmaceuticals searched for in HWW. In black, PNEC calculated on the basis of experimental data and in orange, PNEC calculated onthe basis of modelised data (ECOSAR). Letters in brackets correspond to the therapeutic group (Table 1). (For interpretation of the references to colour in this figure legend, thereader is referred to the web version of this article.)
34 O. Frédéric, P. Yves / Chemosphere 115 (2014) 31–39

Garric (2008) in their method of prioritising pharmaceuticals insurface water. This kind of classification could permit to considerevery pollutant find in HWW.
Concerning the range of PC concentrations, we note that it notonly varies considerably from one pharmaceutical to another butalso for a specific PC when several measurements are performed.Numerous parameters could be responsible for these variations,such as the type of hospital concerned (e.g. general or psychiatric),
number of beds, the country or the moment in the year when themeasurement was performed (e.g. phenomenon of epidemics).
Finally, it should be borne in mind that many compounds havenever been sought in HWW, essentially due to analyticaldifficulties (e.g. amiodarone). Indeed, the HWW matrix is verycomplex and measurements are not always easy. In order to reme-diate this limitation, several teams of chemists have recentlydeveloped an analysis method to measure increasing numbers of
1.E-08
1.E-07
1.E-06
1.E-05
1.E-04
1.E-03
1.E-02
1.E-01
1.E+00
Clot
rim
azol
e (D
)
17β-
estr
adio
l (G
)
Am
pici
llin
(J)
17α-
ethi
nyle
stra
diol
(G)
Sulfa
benz
amid
e (J
)
Prop
yphe
nazo
ne (N
)
Chlo
rpro
maz
ine
(N)
Sulfa
pyri
dine
(J)
Estr
one
(G)
Sim
vast
a�n
(C)
Tam
oxife
n (L
)
Alp
razo
lam
(N)
Perp
hena
zine
(N)
Am
oxic
illin
(J)
Risp
erid
one
(N)
5-flu
orou
raci
l (L)
Cloz
apin
e (N
)
Nor
floxa
cin
(J)
Vinc
ris�
ne (L
)
Oxa
zepa
m (N
)
Lom
eflox
acin
(J)
Lido
cain
e (N
)
Flum
equi
ne (J
)
Enox
acin
(G)
Fluo
xe�n
e (N
)
Caff
eine
(N)
Trim
etho
prim
(J)
Peni
cilli
n G
(J)
Cita
lopr
am (N
)
Oxo
linic
aci
d (J
)
Estr
iol (
G)
Cari
sopr
odol
(M)
Levo
floxa
cin
(J)
Sulp
irid
e (N
)
Dia
zepa
m (N
)
Dox
orub
icin
(L)
Roxi
thro
myc
in (J
)
PNEC
en
μg/L
PNEC ≤ 100 ng/L
Fig. 2c. PNEC lower than 100 ng L�1 of pharmaceuticals searched for in HWW In black, PNEC calculated on the basis of experimental data and in orange, PNEC calculated onthe basis of modelised data (ECOSAR). Letters in brackets correspond to the therapeutic group (Table 1). (For interpretation of the references to colour in this figure legend, thereader is referred to the web version of this article.)
1.E-06
1.E-05
1.E-04
1.E-03
1.E-02
1.E-01
1.E+00
Colc
hici
nes
(M)
Cim
e�di
ne (A
)Fi
nast
erid
e (G
)Pi
pem
idic
aci
d (J
)Th
iam
phen
icol
(J)
Nad
olol
(C)
Fenb
ufen
(M)
Sulfa
mer
azin
e (J
)Su
lfam
etha
zine
(J)
Papa
veri
ne (A
)Va
ncom
ycin
(J)
Prog
este
rone
(G)
Hyd
roch
loro
thia
zide
(C)
Cefr
adin
e (J
)Pa
roxe
�ne
(N)
Fam
o�di
ne (A
)Jo
sam
ycin
(J)
Nor
trip
tylin
e (N
)En
alap
ril (
C)Co
cain
e (N
)A
cebu
tolo
l (H
Cl) (
C)Su
lfadi
met
hoxi
ne (
J)Fe
ntan
yl (N
)Zi
pras
idon
e (N
)Io
hexo
l (V
)Le
troz
ole
(L)
Vera
pam
il (C
)Cy
clop
hosp
ham
ide
(L)
Etop
osid
e (L
)D
emec
locy
clin
e (J
)Pi
ndol
ol (C
)Su
lfani
lam
ide
(J)
Met
hotr
exat
e (L
)Sa
lbut
amol
(R)
Dex
amet
haso
ne (R
)Ke
tam
ine
(N)
Ace
tyls
alic
ylic
aci
d (N
)In
dom
etac
in (M
)Ph
enob
arbi
tal (
N)
Fluv
oxam
ine
(N)
Lora
zepa
m (N
)Se
rtra
line
(N)
Sota
lol (
C)Ch
lora
mph
enic
ol (J
)G
liben
clam
ide
(A)
Cari
sopr
odol
(M)
Oxo
linic
aci
d (J
)Fe
nofib
rate
(C)
Met
roni
dazo
le (J
)Ch
lort
etra
cycl
ine
(J)
Haz
ard
Quo
�en
t (H
Q)
HQ < 1
Fig. 3. Compounds with a hazard quotient (HQ) lower than 1 (n = 50). Letters in brackets correspond to the therapeutic group (Table 1).
O. Frédéric, P. Yves / Chemosphere 115 (2014) 31–39 35

active ingredients in the same sample, achieving greater accuracyin HWW (Tauxe-Wuersch et al., 2006; Weissbrodt et al., 2009;Gros et al., 2013; Yuan et al., 2013).
4.2. Ecotoxicity of PCs found in HWW
Of the PCs studied in HWW (except metabolites and veterinarycompounds), 46 of the PNECs were calculated with modelled datadue to the lack of experimental ecotoxicological data. However, thediscrepancy between experimental and theoretical data issometimes very large (e.g. ranitidine, ampicillin). That is why weemphasize the need to perform minimal tests (batteries of
bioassays with algae, daphnia or other first consumers, and fish)on each compound. One group of compounds attracts particularattention concerning the lack of ecotoxicity data, i.e. iodine con-trast media (e.g. diatrizoate, iobitridol, iohexol, etc.). Of the 7 com-pounds of this group, only 1 has been tested on living organismsand no data exists for 3 others. This is all the more worrying con-sidering the concentrations of these compounds detected in HWW(several mg L�1 for the highest concentrations).
Very little ecotoxicological information is available for anothergroup of compounds measured in HWW: Metabolites. Indeed, ofthe 24 metabolites measured (17 were detected), the ecotoxicolog-ical data available was sufficient to calculate a PNEC for only 2 ofthem (i.e. clofibric acid and 2,2,-difluordeoxyuridine). Escher andFenner (2011) suggest an interesting method for determiningwhich metabolites (or ‘‘transformation products’’) should be stud-ied in priority. However, it is difficult to generalize this method toevery compound given that ecotoxicological data is lacking fornumerous parent compounds, making it necessary to develop eco-toxicity tests for them.
4.3. PCs involved in the hazard of HWW
Some PCs are highlighted by our study as very hazardous for theenvironment because of their high concentration measured inHWW, or because of their ecotoxicity, or both.
Of the 15 PCs most implicated in the hazardousness of HWW, wefound 3 hormones (of the 9 measured in HWW), making class G pro-portionally that most represented among the most hazardous com-pounds. It can be assumed that this is linked to the intrinsicproperty of these compounds which are efficient not only in the hu-man body but also at very low concentrations in non-target organisms.Conversely, other very ecotoxic PCs are relegated to lower positions inthe classification (e.g. alprazolam and citalopram) or are absent, either
A 8%
C 16%
G 4%
J 28%
L 8%
M 8%
N 22%
R 4%
V 2%
Fig. 4. Distribution of no hazardous compounds (HQ lower than 1) found in HWWaccording to therapeutic classes (ATC classes). (n = 50).
1.E+00
1.E+01
1.E+02
1.E+03
Flum
equi
ne (J
)Lo
rata
dine
(R)
Ifosf
amid
e (L
)Li
ncom
ycin
(J)
Oxy
tetra
cycl
ine
(J)
Mef
enam
ic a
cid
(M)
Ator
vast
atin
(C)
Salic
ylic
aci
d (D
)Pr
avas
tatin
(C)
Nal
idix
ic a
cid
(J)
Sulfa
diaz
ine
(J)
Cita
lopr
am (N
)C
arba
maz
epin
e (N
)N
apro
xen
(M)
Epiru
bici
n (L
)Io
prom
ide
(V)
Prim
idon
e (N
)At
enol
ol (C
)Be
zafib
rate
(C)
Phen
ylbu
tazo
ne (M
)D
iaze
pam
(N)
Nifu
roxa
zide
(A)
Mev
asta
tin (C
)Ke
topr
ofen
(M)
Phen
azon
e (N
)Si
mva
stat
in (C
)Pe
rphe
nazi
ne (N
)Fu
rose
mid
e (C
)D
oxyc
yclin
e (J
)Fl
uoxe
tine
(N)
Gem
fibro
zil (
C)
Cle
nbut
erol
(C)
Mor
phin
e (N
)Su
lfam
etho
xazo
le (J
)D
oxor
ubic
in (L
)M
ethy
lpre
dnis
olon
e (D
)Az
ithro
myc
in (J
)Ta
mox
ifen
(L)
Eryt
hrom
ycin
(J)
Ris
perid
one
(N)
Cod
eine
(N)
Gab
apen
tin (N
)R
aniti
dine
(A)
Gen
tam
ycin
(J)
Prop
anol
ol (C
)Te
tracy
clin
e (J
)En
oxac
in (J
)Io
xita
lam
ic a
cid
(V)
Para
ceta
mol
(N)
Clo
zapi
ne (N
)R
oxith
rom
ycin
(J)
Prop
ofol
(N)
Cip
roflo
xaci
n (J
)M
etop
rolo
l (C
)Am
oxic
illin
(J)
Cla
rithr
omyc
in (J
)C
affe
ine
(N)
Lom
eflo
xaci
n (J
)O
xaze
pam
(N)
Estri
ol (G
)Ib
upro
fen
(M)
Peni
cillin
G (J
)
Haz
ard
Quo
tient
(HQ
)
1 > HQ > 1000
Fig. 5. Compounds with a hazard quotient (HQ) between 1 and 1000 (n = 62). Letters in brackets correspond to the therapeutic group (Table 1).
36 O. Frédéric, P. Yves / Chemosphere 115 (2014) 31–39

due to the low concentration measured (e.g. perphenazine) or to lackof detection (e.g. sulfapyridine).
It is noteworthy that only the direct ecotoxicity of PCs was con-sidered in our approach to assess the hazard of PCs present inHWW. Nonetheless, the potential bioaccumulation of some PCscould be responsible for greater indirect ecotoxicity (e.g. via bio-magnification). Tamoxifen, a potentially strongly bioaccumulativecompound, perfectly illustrates this limitation. Indeed, in our studyit corresponds to the 39th HQ, although its strong bioaccumulativepotential should place it among the most hazardous compounds.Finally, once bioaccumulation potential can be demonstrated alongwith the assessment of indirect ecotoxicity, we will be able to usethese two approaches to obtain a wider view of the contribution ofPCs to the hazardousness of HWW.
However, concerning the involvement of PCs hazardousness inHWW, we have to say that numerous of its have been measuredonly one time (Table 3). More measurement in HWW is necessaryin order to point out more accurately the respective contribution ofeach PC.
4.4. The special case of caffeineAt first sight caffeine appears to be the 5th most ecotoxic com-
pound (PNEC = 0.05 ng L�1) of those measured in HWW. In the
light of this finding, we investigated the data leading to this result.The lowest available ecotoxic concentration (LAEC) is 0.05 lg L�1.This value was extracted from the EPA (EPA ECOTOX) databaseand the study in question was an inter-laboratory study carriedout by Bantle et al. (1994). During this study, 2 parameters (i.e.growth and mortality) were measured on X. laevis embryos ex-posed for 4 days to a range of caffeine concentrations. The lethalconcentrations 50 (LC50 for mortality) and lowest observed effectconcentrations (LOEC for development) measured in this studyvaried from 0.22 lg L�1 to 0.37 lg L�1 and from 0.05 to0.125 lg L�1 (22 tests), respectively, according to the EPA database.However, on analysing the publication of Bantle et al. (1994) incloser detail, a mismatch of measurement unit between thedatabase and the publication became apparent. A mistake hadbeen made in the transcription of data from the publication tothe database. Indeed, in the EPA database, the results wereexpressed in lg L�1 but in the article by Bantle et al., the valueswere identical except for the unit which was mg ml�1 (i.e. g L�1).This means that the LAEC from this study was not 0.05 lg L�1
but 0.05 mg mL�1 (or 50 mg L�1). This result is more consistentconsidering the second inter-laboratory study available concerningcaffeine published by DeYoung et al. (1996). Consequently, themost sensitive organism is no longer X. laevis. The next LAECwas 5 lg L�1 (decrease in the development of a periphyticcommunity). Finally, on the basis of an LAED 5 lg L�1 (DeYounget al., 1996), the real HQ of caffeine is 364 (with a modified PNEC
A 3%
C 16%
D 3%
G 2%
J 30%L
7%
M 8%
N 25%
R 3%
V 3%
Fig. 6. Distribution of hazardous compounds (HQ greater than 1) found in HWWaccording to therapeutic classes (ATC classes). (n = 76).
1.E+03
1.E+04
1.E+05
1.E+06
Haz
ard
Quo
�en
t (H
Q)
HQ > 1000
Fig. 7. Hazard quotient (HQ) of the 15 most hazardous compounds in HWW. Letters in brackets correspond to the therapeutic group (Table 1).
Table 2Number of measurements and detection of the 16 most dangerous compound inHWW.
ATC class Compound Measurement Detection
D Clotrimazole 1 1N Lidocaine 1 1N Propyphenazone 1 1N Sulpiride 1 1N Chlorpromazine 1 1J Sulfapyridine 2 1G 17a-Ethinylestradiol 4 1G 17b-Estradiol 3 2G Estrone 3 2J Ampicillin 3 2L 5-Fluorouracil 6 5J Norfloxacin 8 7J Ofloxacin 8 7M Diclofenac 9 9J Trimethoprim 11 11
O. Frédéric, P. Yves / Chemosphere 115 (2014) 31–39 37

of 0.5 lg L�1 (EF = 10 according to the ecotoxicity tests available forthe model ecosystem)), making caffeine the 20th most hazardouscompound!
5. Conclusion and perspectives
Firstly, this study highlighted the huge variability of the ecotox-icity of PCs present in HWW (PNEC between 0.05 pg L�1 forclotrimazole and 45.7 mg L�1 for iohexol).
Next, the HQ calculation allows identifying the PCs most impli-cated in the environmental hazardousness of HWW. According tothe PCs considered, this contribution could be linked mainly tothe high concentration of a compound in the effluent (e.g. 5-fluoro-uracil), to strong ecotoxicity (e.g. clotrimazole), or to a combinationof both parameters (e.g. ethinylestradiol).
It should be noted that the most hazardous compounds do notbelong to only one or two particular therapeutic classes. We foundthem in every class, with a slight overrepresentation of compoundslinked to the nervous system (class N) (Table 2).
It will be necessary in the future to determine the cumulativeecotoxic effect of all the compounds found in HWW without omit-ting the potential interaction between different molecules (addi-tivity, antagonism or synergy), in line with Boillot et al. (2008).This could be done for different effluents corresponding to differ-ent hospitals (e.g. psychiatric, oncologic, general, etc.), differentlocations, or according to the size of the hospital.
Regarding the characterization of compound ecotoxicity, it willbe necessary to take into account indirect ecotoxicity linked to thebioaccumulative potential of certain PCs, in addition to the directecotoxicity considered in this study. Furthermore, the ecotoxicitytests should not be performed only with prescribed drugs (e.g.tamoxifen citrate or hydrochloride amiodarone) but also with theforms excreted (active ingredients or metabolites) after metaboli-sation inside the human body.
It could be also useful to perform measures upstream, ward byward, inside different hospital departments, in order to determinethe location of the point sources of the ecotoxic compounds mostinvolved in emissions. This could permit the prioritization of theareas to be equipped with the appropriate technologies for treatingsuch compounds (e.g. reverse osmosis, enzyme reduction targetinga special kind of compound). This kind of upstream treatment is al-ready in place for radioactive isotopes (nuclear medicine) due toregulatory constraints.
The ‘‘hospital-end-of-pipe’’ approach used in this work does notallow evaluating the local risk linked to the emission of such efflu-ents in aquatic ecosystems. Future works will consider risk assess-ment and the exposure of non-target organisms (PC concentrationsin the environment), could be carried out to assess the risk linkedto different local discharge scenarios.
Acknowledgements
The authors thanks the French Ministry of Ecology, SustainableDevelopment and Energy as well as the partners of project SIPIBELfor their support of this work.
Appendix A. Supplementary material
Supplementary data associated with this article can be found, inthe online version, at http://dx.doi.org/10.1016/j.chemosphere.2014.01.016.
References
Bantle, J.A., Burton, D.T., Dawson, D.A., Dumont, J.N., Finch, R.A., Fort, D.J., Linder, G.,Rayburn, J.R., Buchwalter, D., Gaudet-Hull, A.M., Maurice, M.A., Turley, S.D.,1994. Fetax interlaboratory validation study: phase II testing. Environ. Toxicol.Chem. 13, 1629–1637.
Besse, J.-P., Garric, J., 2008. Human pharmaceuticals in surface waters:implementation of a prioritization methodology and application to the Frenchsituation. Toxicol. Lett. 176, 104–123.
Boillot, C., Bazin, C., Tissot-Guerraz, F., Droguet, J., Perraud, M., Cetre, J.C., Trepo, D.,Perrodin, Y., 2008. Daily physicochemical, microbiological and ecotoxicologicalfluctuations of a hospital effluent according to technical and care activities. Sci.Total Environ. 403, 113–129.
DeYoung, D.J., Bantle, J.A., Hull, M.A., Burks, S.L., 1996. Differences in sensitivity todevelopmental toxicants as seen in xenopus and pimephales embryos. Bull.Environ. Contam. Toxicol. 56, 143–150.
Emmanuel, E., Keck, G., Blanchard, J.-M., Vermande, P., Perrodin, Y., 2004.Toxicological effects of disinfections using sodium hypochlorite on aquaticorganisms and its contribution to AOX formation in hospital wastewater.Environ. Int. 30, 891–900.
EPA ECOTOX database, 2013. <http://www.epa.gov/ecotox/> (accessed 01.08.13).Escher, B.I., Fenner, K., 2011. Recent advances in environmental risk assessment of
transformation products. Environ. Sci. Technol. 45, 3835–3847.Escher, B.I., Baumgartner, R., Koller, M., Treyer, K., Lienert, J., McArdell, C.S., 2011.
Environmental toxicology and risk assessment of pharmaceuticals fromhospital wastewater. Water Res. 45, 75–92.
Gibs, J., Stackelberg, P.E., Furlong, E.T., Meyer, M., Zaugg, S.D., Lippincott, R.L., 2007.Persistence of pharmaceuticals and other organic compounds in chlorinateddrinking water as a function of time. Sci. Total Environ. 373, 240–249.
Gros, M., Rodríguez-Mozaz, S., Barceló, D., 2013. Rapid analysis of multiclassantibiotic residues and some of their metabolites in hospital, urban wastewaterand river water by ultra-high-performance liquid chromatography coupled toquadrupole-linear ion trap tandem mass spectrometry. J. Chromatogr. A 1292,173–188.
Heath, E., Kosjek, T., Farre, M., Quintana, J.B., de Alencastro, L.F., Castiglioni, S., Gans,O., Langford, K., Loos, R., Radjenovic, J., Rocca, L.M., Budzinski, H., Tsipi, D.,Petrovic, M., Barcelo, D., 2010. Second interlaboratory exercise on non-steroidalanti-inflammatory drug analysis in environmental aqueous samples. Talanta 81,1189–1196.
Heberer, T., 2002. Tracking persistent pharmaceutical residues in the aquaticenvironment: a review of recent research data. Toxicol. Lett. 131, 5–17.
Jean, J., Perrodin, Y., Pivot, C., Trepo, D., Perraud, M., Droguet, J., Tissot-Guerraz, F.,Locher, F., 2012. Identification and prioritization of bioaccumulablepharmaceutical substances discharged in hospital effluents. J. Environ.Manage. 103, 113–121.
Joss, A., Keller, E., Alder, A.C., Göbel, A., McArdell, C.S., Ternes, T., Siegrist, H., 2005.Removal of pharmaceuticals and fragrances in biological wastewater treatment.Water Res. 39, 3139–3152.
Lajeunesse, A., Gagnon, C., Gagné, F., Louis, S., Cejka, P., Sauvé, S., 2011. Distributionof antidepressants and their metabolites in brook trout exposed to municipalwastewaters before and after ozone treatment – evidence of biological effects.Chemosphere 83, 564–571.
Loos, R., Locoro, G., Comero, S., Contini, S., Schwesig, D., Werres, F., Balsaa, P., Gans,O., Weiss, S., Blaha, L., Bolchi, M., Gawlik, B.M., 2010. Pan-European survey onthe occurrence of selected polar organic persistent pollutants in ground water.Water Res. 44, 4115–4126.
Molander, L., Ågerstrand, M., Rudén, C., 2009. WikiPharma – a freely available, easilyaccessible, interactive and comprehensive database for environmental effectdata for pharmaceuticals. Regul. Toxicol. Pharmacol. 55, 367–371.
Mullot, J.-U., Karolak, S., Fontana, A., Levi, Y., 2010. Modeling of hospital wastewaterpollution by pharmaceuticals: first results of Mediflux study carried out in threeFrench hospitals. Water Sci. Technol. 62, 2912–2919.
Orias, F., Perrodin, Y., 2013. Characterisation of the ecotoxicity of hospital effluents:a review. Sci. Total Environ. 454–455, 250–276.
Perrodin, Y., Bazin, C., Bony, S., Devaux, A., Bertrand-Krajewski, J.-L., Cren-Olivé, C.,Roch, A., Brelot, E., 2013. A priori assessment of ecotoxicological risks linked tobuilding a hospital. Chemosphere 90, 1037–1046.
Table 3Number of measurements and detection of pharmaceuticals (PCs) searched for in HWW.
Between 10 and 15 times Between 5 and 10 times Between 1 and 5 times One time
Measurements 3 PCs 24 PCs 68 PCs 101 PCsDetections 3 PCs 16 PCs 49 PCs 103 PCs
38 O. Frédéric, P. Yves / Chemosphere 115 (2014) 31–39

Sanderson, H., Johnson, D.J., Wilson, C.J., Brain, R.A., Solomon, K.R., 2003.Probabilistic hazard assessment of environmentally occurringpharmaceuticals toxicity to fish, daphnids and algae by ECOSAR screening.Toxicol. Lett. 144, 383–395.
Silva, B.F., Jelic, A., López-Serna, R., Mozeto, A.A., Petrovic, M., Barceló, D., 2011a.Occurrence and distribution of pharmaceuticals in surface water, suspendedsolids and sediments of the Ebro river basin, Spain. Chemosphere 85, 1331–1339.
Silva, B.F.D., Jelic, A., López-Serna, R., Mozeto, A.A., Petrovic, M., Barceló, D., 2011b.Occurrence and distribution of pharmaceuticals in surface water, suspendedsolids and sediments of the Ebro river basin, Spain. Chemosphere 85, 1331–1339.
Tauxe-Wuersch, A., De Alencastro, L.F., Grandjean, D., Tarradellas, J., 2006. Tracedetermination of tamoxifen and 5-fluorouracil in hospital and wastewaters. Int.J Environ. Anal. Chem. 86, 473–485.
Ternes, T.A., 1998. Occurrence of drugs in German sewage treatment plants andrivers. Water Res. 32, 3245–3260.
Verlicchi, P., Galletti, A., Petrovic, M., Barceló, D., 2010. Hospital effluents as a sourceof emerging pollutants: an overview of micropollutants and sustainabletreatment options. J. Hydrol. 389, 416–428.
Verlicchi, P., Al Aukidy, M., Galletti, A., Petrovic, M., Barceló, D., 2012a. Hospitaleffluent: investigation of the concentrations and distribution ofpharmaceuticals and environmental risk assessment. Sci. Total Environ. 430,109–118.
Verlicchi, P., Al Aukidy, M., Zambello, E., 2012b. Occurrence of pharmaceuticalcompounds in urban wastewater: removal, mass load and environmental riskafter a secondary treatment—a review. Sci. Total Environ. 429, 123–155.
Weissbrodt, D., Kovalova, L., Ort, C., Pazhepurackel, V., Moser, R., Hollender, J.,Siegrist, H., McArdell, C.S., 2009. Mass flows of X-ray contrast media andcytostatics in hospital wastewater. Environ. Sci. Technol. 43, 4810–4817.
WHO Collaborating Centre for Drug Statistics Methodology, 2011. Guidelines forATC classification and DDD assignment. Oslo, 2010.
Yang, Y., Fu, J., Peng, H., Hou, L., Liu, M., Zhou, J.L., 2011. Occurrence and phasedistribution of selected pharmaceuticals in the Yangtze estuary and its coastalzone. J. Hazard. Mater. 190, 588–596.
Yuan, S., Jiang, X., Xia, X., Zhang, H., Zheng, S., 2013. Detection, occurrence and fateof 22 psychiatric pharmaceuticals in psychiatric hospital and municipalwastewater treatment plants in Beijing, China. Chemosphere 90, 2520–2525.
O. Frédéric, P. Yves / Chemosphere 115 (2014) 31–39 39

CHAPITRE 2. ECOTOXICITÉ DES RÉSIDUS PHARMACEUTIQUES DESEFFLUENTS HOSPITALIERS
58

CHAPITRE 2. ECOTOXICITÉ DES RÉSIDUS PHARMACEUTIQUES DESEFFLUENTS HOSPITALIERS
2.3 Synthèse
Ce travail a permis de mettre en évidence une liste de 15 molécules avec un quotient dedanger très important (> 1000). On retrouve globalement la même diversité de moléculesdans ces 15 molécules que dans celles recherchées dans les effluents hospitaliers. Cependant,notons que la classification de la dangerosité ne prend pas en compte le traitement ultérieurpar la STEP. Le passage de l’effluent hospitalier à travers la STEP peut totalement modi-fier la hiérarchie de dangerosité de tous ces composés. En effet, l’efficacité des traitementsbiologiques classiques dans les STEP peut varier fortement d’un composé à un autre. Il estdonc intéressant d’aller plus loin, par exemple en considérant les taux d’abattement de cesdifférents contaminants, parfois disponible dans la littérature. Par ailleurs, cette dangerositéne prend en compte que l’écotoxicité directe. En effet, la bioaccumulabilité des composésn’est pas du tout prise en compte dans ce travail. Or, le transfert trophique des contaminantspeut poser des problèmes majeurs pour la santé des écosystèmes voire pour celle de l’Homme.Nous développerons les enjeux liés à la bioaccumulation dans le chapitre suivant.
59

CHAPITRE 2. ECOTOXICITÉ DES RÉSIDUS PHARMACEUTIQUES DESEFFLUENTS HOSPITALIERS
60

Chapitre 3
Transferts des résiduspharmaceutiques dans la biocœnoseaquatique3.1 Définition des concepts clés
Lorsqu’on s’intéresse au transfert des contaminants dans les organismes, trois conceptsapparaissent comme fondamentaux : la bioconcentration, la bioaccumulation et la bioampli-fication. Bien que centraux, ces concepts sont souvent utilisés les uns à la place des autres,particulièrement en ce qui concerne les termes « bioconcentration » et « bioaccumulation ».C’est pourquoi nous avons choisi ici de préciser le sens des mots que nous allons utiliserci-après :
– Bioconcentration : phénomène par lequel un organisme va concentrer une substanceen concentration supérieure à celle du milieu uniquement via le milieu (respirationet diffusion cutanée). Ce milieu peut être l’eau ou le sédiment pour les organismesaquatiques ou le sol et/ou l’air pour les organismes terrestre. Ce processus est le résultatdu rapport entre la vitesse de pénétration de la substance dans l’organisme (via larespiration et la diffusion cutanée) et la vitesse d’élimination (via échanges respiratoires,métabolisme et dilution par la croissance) : c’est le facteur de bioconcentration (BCF).
– Bioaccumulation : phénomène par lequel un organisme va concentrer une substanceen concentration supérieure à celle du milieu via toutes les voies d’exposition y comprisl’alimentation. Ce processus est le résultat du rapport entre la vitesse de pénétrationde la substance dans l’organisme (via respiration, diffusion cutanée ET alimentation)et la vitesse d’élimination (via les échanges respiratoires, le métabolisme et la dilutionpar la croissance) : c’est le facteur de bioaccumulation (BAF).
– Bioamplification : phénomène par lequel un contaminant se retrouve en concentrationplus importante dans un organisme que dans son alimentation. Ainsi, un contaminantqui est bioamplifié se retrouve en concentration toujours plus élevé chez l’organisme dumaillon n+1 que chez l’organisme du maillon n.
61

CHAPITRE 3. TRANSFERTS DES RÉSIDUS PHARMACEUTIQUES DANS LABIOCŒNOSE AQUATIQUE
Ces différents processus permettent aux organismes de prélever les nutriments nécessairesà leur développement dans leur environnement (e.g. vitamines, oligo-éléments ou encore acidesgras essentiels). Cependant, les composés xénobiotiques sont aussi concernés par ces phéno-mènes. Il est alors indispensable de faire la distinction entre les différents mécanismes décritsci-avant. En effet, il est possible qu’un contaminant puisse être bioconcentré ou bioaccumuléà l’échelle de l’organisme sans qu’il soit nécessairement bioamplifié le long des chaînes ali-mentaires. Ainsi, les risques pour les écosystèmes ne seront pas les mêmes si un contaminantest bioaccumulé et/ou bioamplifié.
3.2 Impacts du transfert des contaminants sur les éco-systèmes
La première référence documentée à propos de la bioconcentration de contaminants dansles écosystèmes remonte à 1954 avec Foster qui relevait des teneurs en radio-phosphore (32P)mille fois supérieures dans le phytoplancton que dans l’eau de la rivière. Cette rivière situéedans l’état de Washington recevait les effluents de réacteurs nucléaires militaires situés enamont (Ramade, 2011). Si cette première observation du transfert des contaminants dansles organismes aquatiques n’a pas mise en évidence d’impact sanitaire retentissant, ce n’estpas le cas de la catastrophe de Minamata. Pendant la première moitié du 20ème siècle, l’en-treprise Chisso Chemical a relargué des effluents chargés en résidus mercuriels dans la baiede Minamata, au Japon. Après méthylation dans les sédiments par le périphyton, le mer-cure inorganique très peu biodisponible le devient fortement et se transfert dans le réseautrophique de la baie (Figure 3.1). Plusieurs milliers de personnes sont touchées par cetteintoxication à cause de la forte consommation de poissons prédateurs situés au sommet dela chaîne alimentaire (e.g. thon). Mais la bioconcentration des contaminants ne concerne pasque les éléments inorganiques.
C’est en 1960 que Hunt & Bischoff (Hunt and Bischoff, 1960) ont pour la première foisdécrit le phénomène de bioaccumulation d’un contaminant chimique organique. Ces cher-cheurs ont mis en évidence que la concentration en dichlorodiphenyldichloroethane (DDD)dans le phytoplancton du lac Clear (Californie) était près de 360 fois plus élevée que dansl’eau. D’autres organochlorés sont bien connus pour leurs propriétés de composés bioaccumu-lables : les polychlorobiphényles (PCB), les dioxines, les composés perfluorés,... Aujourd’hui,on retrouve toutes ces substances de manière ubiquitaire à la surface de la planète. Grâceaux courants atmosphériques, on peut retrouver certains d’entre eux à plusieurs milliers dekilomètres de la plus proche source d’émission (e.g. PCB aux îles Kerguelen (Jaffal et al.,2011)).
62

CHAPITRE 3. TRANSFERTS DES RÉSIDUS PHARMACEUTIQUES DANS LABIOCŒNOSE AQUATIQUE
Figure 3.1 Exemple de transfert de contaminant dans une chaîne alimentaire : Incorporation etbioamplification du mercure dans une biocœnose dulçaquicole (issu de Ramade (2002)). Encadré ennoir le milieu d’exposition, en vert, les producteurs primaires, en rouge les consommateurs secon-daires et en bleu les autres consommateurs.
Historiquement, on remarque que toutes les découvertes autour de ces contaminants pré-sents dans l’Environnement se sont toujours faites de manières conjointes avec l’évolutiondes techniques analytiques. La capacité d’analyse, tant qualitative que quantitative, est uneproblématique centrale en écotoxicologie.
3.3 Caractérisation de la bioaccumulabilité3.3.1 Coefficient de partage
Le coefficient de partage obéit à un principe découvert 1872 qui stipule qu’un « coefficientde partition constant régie le partage d’un corps pur entre deux phases différentes » (Berthelotand Jungfleisch, 1872). C’est cette notion vieille de près de 150 ans qui aujourd’hui estfondamentale dans la caractérisation théorique de la bioaccumulabilité d’une substance. Eneffet, le coefficient de partage entre l’octanol et l’eau (Kow) sert de base à toutes les évaluationsde bioaccumulabilité des substances.
63

CHAPITRE 3. TRANSFERTS DES RÉSIDUS PHARMACEUTIQUES DANS LABIOCŒNOSE AQUATIQUE
3.3.2 Relation quantitative entre structure et activité (QSAR)
En 1979, Hansch & Leo (Hansch and Leo, 1979) présentent un modèle qui, à partir de lastructure de la molécule, est capable de déterminer son activité chimique et biologique : ils’agit du modèle QSAR (Quantitative Structure-Activity Relationship). Ce modèle va plusloin que le seul Kow en intégrant des propriétés polaires et stériques des molécules pour enévaluer l’activité biologique. Il est également possible d’intégrer dans ce modèle des para-mètres biologiques, comme illustré en figure 3.2 (e.g. affinité molécule/récepteurs, constanted’inhibition, pharmacodynamique) (Selassie et al., 2003). Grâce à ce modèle, il est possible dedéterminer la bioconcentrabilité d’une substance et donc sa capacité théorique à se concentrerdu milieu vers les organismes. Aujourd’hui, la modélisation (QSAR) est largement utiliséepour l’évaluation de la bioconcentrabilité d’une substance. Cependant, comme le montre lafigure 3.3, les caractéristiques utilisées dans le modèle QSAR comme l’hydrophobicité ou lapolarité ne suffisent pas à déterminer avec certitude la bioconcentrabilité d’une molécule. Lecomportement au sein de l’organisme (i.e. métabolisation par chaque organisme considéré) etson exposition (i.e. via le milieu et/ou l’alimentation) sont également à considérer. En effet,il n’est pas possible avec ce type de modèle d’estimer la contribution de l’alimentation à lacontamination de l’organisme considéré sans expérimentations préalables.
Figure 3.2 Exemple de paramètres pris en compte par les approche QSAR pour évaluer la bioaccu-mulibilité d’une molécule(Adapté de Norstrom et Letcher 1996 in Abarnou and Blanchard (2000))
64

CHAPITRE 3. TRANSFERTS DES RÉSIDUS PHARMACEUTIQUES DANS LABIOCŒNOSE AQUATIQUE
3.3.3 Caractérisation expérimentale
Il existe une troisième approche pour évaluer la bioconcentrabilité ou la bioaccumulabilitéd’une molécule : l’expérimentation. Cette approche étant onéreuse et complexe, on privilégiesouvent la modélisation pour l’évaluation de la bioaccumulabilité. Or, si pour beaucoup desubstances la bioconcentration est corrélée au Kow, ce n’est pas toujours le cas (Figure 3.3).C’est pourquoi il est indispensable d’effectuer un minimum d’expérimentation pour détermi-ner la bioconcentrabilité réelle d’une substance.
Figure 3.3 Expression des facteurs de bioconcentration et de bioaccumulation de plusieurs conta-minants déterminés expérimentalement chez des autotrophes (en haut à gauche), des invertébrés (enhaut à droite) et des vertébrés (en bas au centre) en fonction des Kow respectifs de ces molécules(Figures issues de Arnot and Gobas (2006))
On remarque sur la figure 3.3 que pour les substances avec un Kow supérieur à 6, lesvaleurs de BCF sont plus diffuses. Cette observation est confirmée par un article de Papa etal. (Papa et al., 2007) qui confirme que la linéarité des modèles QSAR pour prédire les facteursde bioconcentration ne s’applique plus au-delà d’un Kow de 6. De plus, il a été montré que lesorganismes classiquement utilisés en écotoxicologie (e.g. C. reinhardtii, D. pulex ou D. rerio)conservaient une part non négligeable de constituant cellulaires (e.g. enzymes, récepteurs,canaux ioniques ou transporteurs) en commun avec l’Homme (Gunnarson et al., 2008). Ainsi,pour les contaminants comme RP qui sont à la base conçus pour agir sur des cibles cellulaireshumaines, on peut difficilement évaluer comment les organismes modèles en écotoxicologievont réagir face à ces contaminants bien spécifiques.
65

CHAPITRE 3. TRANSFERTS DES RÉSIDUS PHARMACEUTIQUES DANS LABIOCŒNOSE AQUATIQUE
3.4 Les résidus pharmaceutiques dans l’Environnement
3.4.1 Problèmatique généraleLe terme « résidu pharmaceutique » (ou « résidu médicamenteux » ) est un terme géné-
rique qui désigne toute molécule, métabolisée ou non, issue d’un médicament. Il peut s’agirde :
– Principe actif. Un médicament est constitué de deux entités, le principe actif et lesexcipients. Après l’administration du médicament, la totalité du principe actif n’estpas assimilée par l’organisme et une partie variable (en fonction du médicament et dupatient) est évacuée dans les urines et les fèces et in fine dans les eaux usées.
– Métabolite biologique (humains ou animaux dans le cas de produits vétérinaires).Lorsque le principe actif transit dans l’organisme il peut être métabolisé. C’est-à-direque des groupements fonctionnels peuvent être ajouté ou retiré par les différents organestraversés par le principe actif.
– Métabolite environnemental. Lorsque les résidus médicamenteux sont émis via leseaux usées vers les STEP, une métabolisation peut se produire à cause des microorga-nismes présents. Une fois dans l’environnement, les organismes exposés peuvent égale-ment métaboliser ces résidus. D’autres réactions comme l’ozonation ou la photodégra-dation peuvent également générer ce type de métabolites.
Les premiers soupçons sur la présence de résidus pharmaceutiques dans l’Environnementsont apparus au début des années 70 (Norpeth et al. 1973 in Aherne et al. 1985). Cependant,la prise conscience de la communauté scientifique n’est pas apparue avant la fin des années90 grâce à deux découvertes majeures : (i) la découverte de la présence de nombreux résiduspharmaceutiques dans les effluents de stations d’épuration (Ternes, 1998) (ii) la démonstra-tion de l’effet féminisant de l’éthynilestradiol sur les poissons de rivières au Royaume Uni(Jobling et al., 1998). Une troisième découverte majeure contemporaine des deux précitéesest responsable du développement des recherches autour des résidus pharmaceutiques : ladécouverte de résidus pharmaceutiques dans l’eau de boisson (Heberer and Stan, 1997).
Si les eaux de surface sont aujourd’hui contaminées à travers le monde (Fick et al., 2009;Loos et al., 2009) ce n’est pas le seul compartiment écosystémique atteint par la contaminationpar les résidus pharmaceutiques. On retrouve déjà depuis plusieurs décennies des RP dansles eaux profondes. Dès le début des années 90, on a retrouvé des concentrations en résiduspharmaceutiques de l’ordre du µg/L dans les réservoirs d’eau profondes destinées à l’eaude boisson (Eckel et al., 1993). Par ailleurs, à la même époque, vers la fin des années 80,Jacobsen & Berglind (Jacobsen and Berglind, 1988) ont mis en évidence une contaminationdes sédiments par l’oxytetracycline à des teneurs non négligeables (i.e. 0,1 à 4,9 mg/kg).De nombreuses études ont déjà mis en évidence l’écotoxicité des RP aux concentrationsenvironnementale (Brodin et al., 2013; Kidd et al., 2007; Lajeunesse et al., 2011). Cependant,la présence de ces RP à de très faibles concentrations, peut également présenter un risquepour les écosystèmes via la bioaccumulation.
66

CHAPITRE 3. TRANSFERTS DES RÉSIDUS PHARMACEUTIQUES DANS LABIOCŒNOSE AQUATIQUE
3.4.2 Les résidus pharmaceutiques bioaccumulablesDans les compartiments précités, nous avons aujourd’hui de nombreuses informations qui
caractérisent quantitativement et qualitativement les RP que nous retrouvons dans l’Envi-ronnement. Cependant, un dernier compartiment écosystémique reste très peu exploré en cequi concerne la contamination par les RP : la biosphère. C’est au début des années 90 que lespremières études de bioconcentration sont développée (Nelis et al., 1991). Le but de ces pre-mières expérimentations était « d’encapsuler » un médicament vétérinaire dans la nourriture(i.e. Artémies, Cnidaires) afin d’optimiser l’absorption du médicament par les poissons. Enexposant les artémies au médicament, elles l’absorbent et/ou l’adsorbent par bioconcentrationet les poissons à traiter sont nourris avec ces artémies. Cependant, il faut attendre les années2000 pour que les expérimentations sur la bioconcentration et la bioaccumulation des RPse développent (Brown et al., 2007; Kinney et al., 2008; Lai et al., 2002). Très récemment,Lajeunesse et al., (Lajeunesse et al., 2011) ont démontrés que la bioaccumulation des RPpouvait avoir une effet sur les organismes vivants dans les rivières contaminées, notammentles poissons. En effet, ils ont démontré que les teneurs en inhibiteur sélectif de la recapturede la sérotonine (e.g. fluoxetine, sertraline, citalopram,...) mesurés dans les poissons vivantsdans une rivière exposée à ce type de contamination avaient un effet sur le système nerveux.Ainsi, il est aujourd’hui évident que les phénomènes de bioconcentration et de bioaccumu-lation des RP dans l’environnement sont à prendre en compte pour évaluer l’impact de cescontaminants tant sur la santé des écosystèmes que sur celle de l’Homme.
3.5 La priorisation des résidus pharmaceutiquesDans les chapitres précédents, nous avons mis en exergue la diversité des molécules pré-
sentes dans les effluents hospitaliers. Ainsi, il est nécessaire de prioriser les molécules à étudieren fonction de la question scientifique à laquelle on veut répondre. Dans les paragraphes précé-dents, nous avons expliqué pourquoi la bioaccumulation des résidus pharmaceutiques était laproblématique qui nous intéressait. La bioaccumulabilité potentielle (obtenu par la méthodeQSAR) est donc un paramètre fondamental qui va être considéré pour prioriser les moléculesd’intérêt. Cependant, deux autres paramètres sont également très importants à prendre encompte. D’une part, la consommation de la molécule au sein de l’hôpital. En effet, si unemolécule n’est pas consommée dans l’hôpital, il n’y a aucune probabilité de la retrouver dansles effluents hospitaliers. D’autre part, l’écotoxicité des molécules doit être prise en compte.
Pour entamer les premiers travaux expérimentaux sur les 14 molécules prioritaires, nousavons choisi les molécules les plus bioaccumulables au sein de chaque groupe de « facteuraggravant » (cf. Tableau 1) :
– L’ amiodarone pour les « lourdement consommées » .– Le tamoxifen pour les « perturbateurs endocriniens » .– Le ritonavir pour les « molécules potentiellement écotoxique non encore étudiée » .
67


69

70

Deuxième partie
CARACTERISATION DEL’ECOTOXICITE DES RESIDUSPHARMACEUTIQUES MODELES
71


Parmi les 14 molécules identifiées comme prioritaires (Jean et al., 2012) dans les effluentshospitaliers en ce qui concerne la bioaccumulation, nous en avons choisi trois : l’amiodarone,le ritonavir et le tamoxifen. Avant d’évaluer leur bioaccumulabilité, il est nécessaire d’évaluerau préalabale leur écotoxicité directe. En effet, pour nous affranchir des effets écotoxiquesqui pourraient perturber nos mesures de bioaccumulation, il est nécessaire de prendre encompte ces résultats pour fixer la gamme de toxicité de ces molécules pour les organismesque nous allons utiliser. Ainsi, dans un premier chapitre, nous présentons les différentstests d’écotoxicité réalisés pour les 3 molécules modèles choisies. Dans un deuxième cha-pitre, nous tentons d’évaluer l’impact que peut présenter l’excipient sur l’écotoxicité d’unprincipe actif. En effet, certaines études présentents dans la littérature sont effectuées avecle médicament (principe actif + excipient). Or, dans l’Environnement, c’est le principe actifd’une part et éventuellement l’excipient d’autre part qui sont retrouvés. Enfin, dans un troi-sième chapitre, nous évaluons le risque écotoxicologique pour les écosystèmes aquatiques,dans 4 situations différentes sur le plan international, que représente le contaminant modèledont nous avons choisi d’étudier la bioaccumulabilité : le tamoxifen.
73

74

Chapitre 4
Caractérisation préliminaire del’écotoxicité des contaminants modèles4.1 Introduction
Dans la première partie de ce manuscrit, nous avons mis en évidence que pour de nombreuxRP, très peu, voire aucune, données écotoxicologiques n’étaient disponibles. C’est égalementle cas pour nos 14 molécules prioritaires. En effet, à part l’ethynilestradiol qui présente unnombre de données assez riche, et le tamoxifen pour lequel on en possède quelques-unes (Oriasand Perrodin, 2013) les autres molécules ne présentent aucune donnée écotoxicologique. Parailleurs, dans la littérature, il existe quelques données sur le tamoxifen citrate (Mater et al.,2014; Williams et al., 2007). Or, nous préférons ne pas prendre en compte ces données étantdonné l’impact que le citrate (excipient) peut présenter sur l’écotoxicité du tamoxifen (cf.Chapitre 5). Ainsi, au regard de la faible littérature disponible pour nos molécules priori-taires, nous avons décidé d’effectuer une batterie de bioessais sur nos molécules modèles pourévaluer la gamme de concentrations écotoxiques pour nos organismes modèles. En effet, avantd’évaluer la bioaccumulation de ces molécules, il est nécessaire de s’assurer que les concentra-tions auxquelles nous travaillons sont sub-effet afin d’éviter les intéractions entre écotoxicitéet bioaccumulation. Dans le tableau 4.1, nous avons rassemblé les données physico-chimiquesdisponibles concernant nos 3 molécules modèles : amiodarone, tamoxifen, ritonavir.
Table 4.1 Description et propriétés physico-chimique des molécules prioritaires testées.Nom de la molécule Tamoxifen Amiodarone RitonavirClasse thérapeutique Anticancéreux Antiarythmique Antiviral
Numéro CAS 10540-29-1 1951-25-3 155213-67-5Kow 7,1 7,57 3,9
Solubilité dans l’eau (mg/L) 0,167 4,76 1,26
La batterie de bioessais réalisée est constituée de 4 tests d’écotoxicité : inhibition decroissance 72h sur P. subcapitata, immobilisation 48h et inhibition du broutage 48h sur D.magna et inhibition de luminescence (NF ISO 11348-3) 30 minutes sur V. fisherii.
75

CHAPITRE 4. CARACTÉRISATION PRÉLIMINAIRE DE L’ÉCOTOXICITÉ DESCONTAMINANTS MODÈLES
4.2 Matériels et méthodes
4.2.1 Inhibition de la croissance de P. subcapitata (72h)
Les tests de croissance réalisés sur les 3 algues sélectionnées suivent les guidelines OECDN 201 (OECD, 2006). Les algues sont ensemencées en microplaques 48 puits à une concen-tration de 104 cellules par mL dans leur milieu de culture spécifique contenant différentesconcentrations de tamoxifen, après 3 jours de préconditionnement dans les conditions de l’es-sai soit en enceinte climatique (Aralab Fitoclima D 1200), 20 C ± 1 C éclairage continu 10000 lux. Les gammes de concentration testées sont rassemblées dans le tableau 4.2. Trois ré-plicats sont réalisés pour chaque concentration. En parallèle, un témoin avec la concentrationla plus élevée de DMSO introduite dans les puits (0.01%) est mis en place pour s’assurerde l’absence d’effet du solvant sur la croissance algale. Pour limiter l’évaporation dans lespuits durant l’expérience, pouvant modifier la concentration de tamoxifen, de l’eau ultrapureest placée dans les puits extérieurs de la plaque. Soixante-douze heures après l’inoculation lecontenu des puits est homogénéisé et la densité algale est mesurée sur cellule de Malassez (2comptages par puits) à l’aide d’un microscope Zeiss grossissement 400 x. Des concentrationsd’inhibition 50% (IC50) sont ensuite calculées à l’aide du logiciel RegTox.
4.2.2 Immobilisation de D. magna (48h)
Les tests d’immobilisation 48h sur daphnies sont réalisés selon le protocole standard ISO(ISO, 1995). Cinq daphnies de moins de 24h sont placées dans des tubes à essai contenant10 mL de solution contaminée (diluée avec du milieu d’élevage) selon les gammes présen-tées dans le tableau 4.2. Quatre réplicats par concentration sont effectués (20 daphnies parconcentration au total). Afin d’éviter l’éventuelle croissance algale qui pourrait intervenir,les tubes sont incubés dans le noir à 20 C ± 1 C pendant la période d’exposition. Pour unemeilleure précision, les tests sont réalisés 2 fois pour chaque contaminant et les résultats sontmoyennés. Après 48h d’exposition, le nombre de daphnie immobilisée est comptabilisé danschaque tube et les EC50 48h sont calculées en utilisant un modèle de type log-probit.
4.2.3 Inhitbition du broutage 48h sur D. magna
L’inhibition de l’activité de broutage sur 48h chez daphnie est mesurée sous conditionstatique (ni croissance algale ni renouvellement de milieu), d’après Clément and Zaid (2004).L’exposition est menée dans des béchers en verre de 250 mL contenant 150 mL de milieud’élevage contaminé selon les gammes présentées dans le tableau 4.2. Chaque bécher estinoculé avec 75.106 cellules de P. subcapitata (500000 cellules/mL) et 5 daphnies âgées entre3 et 4 jours. Quatre réplicats par concentration sont réalisés. Pour chaque concentration,2 béchers sans daphnies sont utilisés comme témoin de la croissance éventuelle des algues.
76

CHAPITRE 4. CARACTÉRISATION PRÉLIMINAIRE DE L’ÉCOTOXICITÉ DESCONTAMINANTS MODÈLES
Pour prévenir au maximum cette croissance, les béchers sont placés à l’obscurité à 20 C ±1 C. Les béchers son délicatement agités trois fois par jour pour assurer une disponibilitéhomogène des algues dans les béchers. Les algues restantes dans le milieu sont mesuréesaprès 24 et 48h à l’aide d’un compteur à particule (Coultronics, model Z1, seuil de taille3.6 µm). Pour une meilleure précision, les tests sont réalisés 2 fois pour chaque contaminantet les résultats sont moyennés. L’activité de broutage est évaluée par le calcul du taux defiltration F (ml/daphnie/h) selon Gauld (1951) :
F = (V/n) [ln(C0) - ln(Ct) / t - A]
A = [ln(C0) - ln(C ′t)] / t
Où V (mL) est le volume total du milieu, n le nombre de daphnie dans le volume V, C0 etCt les densités initiales et finales (cellules/mL) et t le temps d’exposition (heures). A est unfacteur correctif utilisé pour prendre en compte les changements de densité algale dans letémoin (algues sans daphnies) exprimé comme la densité algale final C ′
t. Aucune mortaliténe doit être observée chez les daphnies exposées.
4.2.4 Inhibition de la luminescence de V. fisherii (30min)
Ces tests ont été réalisés par PROVADEMSE, sous la direction de Christine BAZIN,selon la norme NF ISO 11348-3. Ce test consiste à mesurer combien une substance inhibe laluminescence de la bactérie V. fisherii. Pour cela, des bactéries sont exposées à une gamme decontaminant (Table 4.2) à une température de 15 C ± 1 C. Après 30 minutes, la luminescenceest mesurée (analyseur Microtox M500) et est comparée au témoin.
Table 4.2 Gammes des concentrations testées pour le tamoxifen, l’amiodarone et le ritonavir chezV. fisheri, P. subcapitata et D. magna (NT : Non testé).
Molécule Organisme Concentrations testées (µg/L)
V. fisheri NT NT 6250 9380 12500 18750 25000 38000 50000 75000
Tamoxifen P. subcapitata 3 6 13 25 50 100 200 400 800 1600
D. magna 24 49 98 195 391 781 1563 3125 6250 12500
V. fisheri NT NT 6250 9380 12500 18750 25000 38000 50000 75000
Amiodarone P. subcapitata 185 370 739 1479 2958 5916 11831 23663 47325 94650
D. magna 462 924 1849 3697 7395 14789 29578 59156 118313 236625
V. fisheri NT NT NT NT NT NT NT NT NT NT
Ritonavir P. subcapitata 391 781 1563 3125 6250 12500 25000 50000 100000 200000
D. magna 391 781 1563 3125 6250 12500 25000 50000 100000 200000
77

CHAPITRE 4. CARACTÉRISATION PRÉLIMINAIRE DE L’ÉCOTOXICITÉ DESCONTAMINANTS MODÈLES
4.3 Résultats
Dans le tableau suivant (Tableau 4.3), nous avons réuni l’ensemble des résultats des testsd’écotoxicité obtenus.
Table 4.3 Synthèse des résultats des tests d’écotoxicité effectués pour le tamoxifen, l’amiodarone etle ritonavir chez V. fisheri, P. subcapitata et D. magna (NT : Non testé ; NA : Non applicable).
Molécule Test d’écotoxicité EC50 (mg/L) Intervalle de confiance 95% (mg/L)
V. fisheri 30 min 8,2 7,31 - 8,34
Tamoxifen P. subcapitata 72h 0,702 0,681- 0,787
D. magna 48h immobilisation 0,696 0,660 - 0,830
D. magna 48h broutage 0,104 0,084 - 0,124
V. fisheri 30 min 12,80 11,98 - 13,76
Amiodarone P. subcapitata 72h 0,870 0,670 - 1,173
D. magna 48h immobilisation > 28 NA
D. magna 48h broutage 0,497 0,366 - 0,669
V. fisheri 30 min NT NA
Ritonavir P. subcapitata 72h > 50 NA
D. magna 48h immobilisation > 50 NA
D. magna 48h broutage > 50 NA
4.3.1 Ecotoxicité du ritonavir
Nous ne sommes pas parvenus à mettre en évidence la moindre écotoxicité du ritonavir,aux concentrations auxquelles nous avons effectué les tests.
4.3.2 Ecotoxicité de l’amiodarone
L’amiodarone présente une écotoxicité relative chez tous les organismes testés. Chez Ps,on observe une EC50 de 870 µg/L avec un intervalle de confiance à 95% relativement élevé(670 - 1173 µg/L). Chez Dm, nous ne sommes pas parvenu à mettre en évidence d’effet surla mortalité (> 28000 µg/L) à 48h alors que sur le paramètre broutage, nous remarquonsune EC50 relativement basse de 497 µg/L (IC95 : 366 - 669 µg/L). Enfin, l’écotoxicité del’amiodarone vis-à-vis de Vf est relativement faible avec une EC50 pour l’inhibition de laluminescence de 12800 mg/L (IC95 : 11980 - 13760 µg/L).
4.3.3 Ecotoxicité du tamoxifen
C’est avec le tamoxifen que nous obtenons les niveaux d’écotoxicité les plus forts (EC50 lesplus faibles), quel que soit l’organisme testé ou le paramètre observé. D. magna est l’organisme
78

CHAPITRE 4. CARACTÉRISATION PRÉLIMINAIRE DE L’ÉCOTOXICITÉ DESCONTAMINANTS MODÈLES
le plus sensible au tamoxifen avec des EC50 respectives pour la mortalité et le broutage de696 µg/L (IC95 : 660 - 830 µg/L) et de 104 µg/L (IC95 : 84 - 124 µg/L). Les algues sontles organismes les plus sensibles au tamoxifen après les daphnies avec une EC50 de 702 µg/L(IC95 : 681 - 787 µg/L) et les bactéries marines les moins touchées avec une EC50 de 8200µg/L (IC95 : 7310 - 8340 µg/L).
4.4 Discussion
4.4.1 Ecotoxicité des contaminants modèles
N’observant pas d’effet ni chez les algues ni chez les daphnies (mortalité), nous avons choiside ne pas effectuer de tests supplémentaires pour le ritonavir. Par ailleurs, nous n’avons paschoisi de tester des concentrations supérieures à 200 mg, cette dernière valeur étant déjà bienau-delà de la solubilité du ritonavir dans l’eau (1,6 mg/L). Ces résultats sont surprenantscar cette molécule avait été sélectionnée pour sa forte écotoxicité potentielle, en plus de sabioaccumulabilité. Dans la littérature, nous n’avons trouvé aucune donnée sur l’écotoxicitédu ritonavir. Cette absence de donnée est certainement due à sa faible écotoxicité. En effet,même si une absence d’écotoxicité est un résultat, il est très difficile de le faire publier. Ainsi,les tests d’écotoxicité de ce type de contaminant ne sont jamais visibles.
Parmi les trois molécules testées, c’est le tamoxifen qui présente la plus forte écotoxicité,tous tests confondus. Par ailleurs, c’est la seule molécule avec laquelle nous pouvons fairedes comparaisons avec les résultats obtenus dans la littérature car c’est la seule molécule quia déjà été testée. Les résultats que nous avons obtenus sont relativement cohérents avec ceque nous avons pu observer dans la littérature (Mater et al., 2014; DellaGreca et al., 2007).Par exemple, DellaGreca et al. (2007), ont effectués des tests d’écotoxicité sur 3 invertébrés :Brachionus calyciflorus, Thamnocephalus platyurus et Daphnia magna. Les EC50 obtenuesdans ces travaux sont respectivement de 0,97, 0,40 et 1,53 mg/L et nous avons trouvé unevaleur d’EC50 immobilisation de 0,696 mg/L pour Daphnia magna. Cette équipe a égalementeffectué des tests chroniques avec le tamoxifen sur Brachionus calyciflorus et Cerodaphniadubia avec des valeurs d’EC50 logiquement plus basses, respectivement 0,25 et 0,081 mg/L.Mater et al. (2014) se sont également intéressés à l’écotoxicité que le tamoxifen pouvaitprésenter pour les algues. Mais, ils ont utilisés du tamoxifen citrate. Nous verrons pourquoi,dans le chapitre suivant, nous ne pouvons pas réellement comparer les résultats d’écotoxicitéqu’ils ont obtenus avec les nôtres.
79

CHAPITRE 4. CARACTÉRISATION PRÉLIMINAIRE DE L’ÉCOTOXICITÉ DESCONTAMINANTS MODÈLES
4.4.2 Valeurs nominales et réelles
Lors de nos expériences préliminaires, nous n’avons pas effectué de suivis analytiques denos solutions. Ceci est un point faible de nos travaux car de nombreux processus peuventintervenir pendant la phase d’exposition pouvant causer une modification de la concentrationnominale de l’exposition réelle des organismes, même à très court terme. Cette perturbationde la concentration réelle d’exposition peut être causée par plusieurs paramètres :
– Biologique : la dégradation métabolique et/ou l’absorption des contaminants par lesorganismes exposés peut diminuer la concentration nominale.
– Chimique : les modifications de pH influencent l’ionisation de certains composés mo-difiant ainsi la biodisponibilité de ces derniers.
– Physique : parmi les phénomènes physiques qui peuvent diminuer la concentrationnominale, on trouve la photodégradation ou encore l’adsorption (e.g. sur la verrerie).
Ainsi, de manière à rendre plus robuste les tests d’écotoxicité, il serait pertinent à l’avenird’effectuer un suivi minimum dans les milieux d’exposition. Cela permettrait également demieux valoriser les travaux d’écotoxicologie de manière générale.
4.4.3 Complémentarité des tests écotoxicologiques
Dans nos travaux, nous avons utilisé un test peu commun dans les études d’écotoxicité :l’impact des contaminants sur le broutage des daphnies. Ce test, bien qu’aiguë au mêmetitre que la mortalité 48h, a su montrer son intérêt dans nos travaux avec une sensibilitéparticulière par rapport au test de mortalité. L’utilisation de paramètres complémentaireschez le même organisme permet d’évaluer l’écotoxicité sur plusieurs fonctions de l’organisme,éventuellement plus sensibles à tel ou tel contaminant. Ce type de démarche est égalementréalisable chez les organismes unicellulaires comme les algues ou les bactéries où on peutobserver l’impact des contaminants sur des activités enzymatiques, par exemple. Chez lesalgues, il serait également intéressant d’étudier l’écotoxicité de ces contaminants sur d’autrestypes d’algues utilisant des fonctions métaboliques différentes des algues vertes unicellulaires,par exemple chez des algues vertes flagellées ou chez des diatomées. Pour les invertébrés, ilserait pertinent d’exposer des organismes avec des modes de vie différents de type benthique,par exemple, ou d’autres invertébrés que des vertébrés comme des mollusques. Les informa-tions apportées par les tests chez ces organismes seraient particulièrement intéressantes pourdes molécules comme les composés très lipophiles (comme ceux étudiés ici) qui ont tendanceà s’adsorber sur les sédiments et/ou à se stocker dans les organismes riches en lipides commeles mollusques.
80

CHAPITRE 4. CARACTÉRISATION PRÉLIMINAIRE DE L’ÉCOTOXICITÉ DESCONTAMINANTS MODÈLES
4.5 Conclusion et synthèse
Les données d’écotoxicité que nous avons obtenues pour le ritonavir et l’amiodarone sontles premières et les seules existantes sur le plan international à notre connaissance.Notons cependant qu’il est nécessaire d’approfondir les tests d’écotoxicité avec le ritonaviret l’amiodarone, notamment avec des tests chroniques et sur d’autres espèces et/ou d’autresparamètres biologiques pour mieux caractériser l’écotoxicité de ces contaminants. Par ailleurs,à l’avenir, il serait judicieux de prévoir de suivre l’exposition réelle des organismes testéspour une plus grande robustesse des résultats produits. Enfin, nos résultats montrent que letamoxifen est la molécule modèle la plus toxique parmi les 3 sélectionnées. De surcroît, c’estla seule qui a déjà été détectée dans l’Environnement.
81

CHAPITRE 4. CARACTÉRISATION PRÉLIMINAIRE DE L’ÉCOTOXICITÉ DESCONTAMINANTS MODÈLES
82

Chapitre 5
Ecotoxicité comparative de deuxmédicaments modèles et de leursprincipes actifs respectifs
5.1 Enjeux et démarche
Dans l’Environnement, les RP que nous retrouvons sont rarement le médicament soussa forme initiale (principe actif + excipient) mais peuvent plutôt correspondre au principeactif et/ou à des métabolites. Il n’est donc pas cohérent, d’un point de vue écotoxicologique,d’effectuer des tests avec des substances que nous avons peu de chance de retrouver dansl’Environnement. Ainsi, dans les travaux que nous présentons dans ce chapitre, nous avonsvoulu évaluer l’effet des excipients sur l’écotoxicité de deux molécules modèles : l’amiodaroneet le tamoxifen. Le ritonavir ne fait pas partie de cette étude car il est utilisé sans excipient.Ces travaux ont été menés en collaboration avec une équipe de l’UPR de Gif sur Yvette pourpurifier l’ « amiodarone HCl » en « amiodarone », indisponible dans le commerce.
5.2 Article 3 :Comparative ecotoxicity of tamoxifencitrate and amiodarone hydrochloride and theirrespective active ingredients
Article à soumettre
83

CHAPITRE 5. ECOTOXICITÉ COMPARATIVE DE DEUX MÉDICAMENTSMODÈLES ET DE LEURS PRINCIPES ACTIFS RESPECTIFS
84

Comparative ecotoxicity of tamoxifen citrate and amiodarone hydrochloride and their respective active ingredients
1aFrédéric Orias, bMatt Rambla, aJulien Rodriguez, aVanessa Brosselin, bCatherine Guillou, aYvesPerrodin
aUniversité de Lyon; ENTPE,Equipe (IPE) 2 Rue Maurice Audin, 69518 Vaulx-en-Velin, France ;UMR 5023 LEHNA bCentre de Recherche de Gif, Institut de Chimie des Substances Naturelles, CNRS, LabEx LERMIT, 1 avenue de la Terrasse, Gif-sur-Yvette, France
Abstract Nowadays, pharmaceutical compounds (PCs) are ubiquitous in aquatic ecosystems. These molecules can threat ecosystems because of their ecotoxicity. To assess this latter, ecotoxicity tests have already been carried out by different authors, but most of the time with original drugs (active ingredient + excipient). But, in the environment, we find either one or the other. Moreover, excipient can modify the ecotoxicity of the active principle, increasing its bioavailability, for example. In this work, we performed three acute bioassays (Daphnia magna mortality, Pseudokirchneriella sucapitata growth and Vibrio fisheri bioluminescence) aiming to assess impact of excipient on ecotoxicity of active principle. These bioassays were carried out with four molecules: tamoxifen, tamoxifen citrate, amiodarone and amiodarone hydrochloride. We observed that tamoxifen were less ecotoxic than tamoxifen citrate, but we have not put in evidence ecotoxicity differences between amiodarone and amiodarone hydrochloride. Besides, ecotoxicity tests carried out with amiodarone showed a lower ecotoxicity than tamoxifen.
Keyword Pharmaceuticals, excipients, ecotoxicity, tamoxifen citrate, amiodarone hydrochloride, Daphnia magna, Pseudokirchneriella subcapitata, Vibrio fisheri.
1. Introduction Today, pharmaceutical compounds (PCs) are ubiquitous in aquatic ecosystems and continuously
emitted into the environment. Three main sources of emission are identified: (i) urban effluents
(Langford and Thomas, 2009); (ii) manure spreading and aquaculture (Burridge et al., 2010;
Kolodziej et al., 2004) ; (iii) pharmaceutical factories effluents (Collado et al., 2014). But, PCs are
molecules designed for being biologically actives and can potentially threat development of
exposed organisms. Thus, ecosystems functioning can be significantly disturbed, even at low
PCs concentration (Kidd et al., 2007). Otherwise, drugs are generally composed of two different
1 Corresponding author: Frédéric Orias; Université de Lyon; ENTPE; CNRS; UMR 5023 LEHNA, 2 Rue Maurice Audin, 69518 Vaulx-en-Velin, France. Tel. (33) 4 72 04 70 58. Fax (33) 4 72 04 77 43. Email: [email protected]

parts: (i) active ingredient which is the molecule needed for a giving treatment and which have
an effect on organism to cure (ii) and excipients which will have different roles (e.g. preservation,
solubilization, taste,…) depending on their nature. In the environment, PCs found are rarely
original drugs (excipient + active ingredient) but rather, in one hand, excipients, and in the other
hand, active ingredients incompletely assimilated by treated organisms or metabolites resulting
from metabolization of drugs inside treated body or in the Environment.
For this reason, we decided to study in one hand active ingredient ecotoxicity, in other hand
original drug ecotoxicity for two model drugs and then to compare obtained results.
Concerning organisms used for tested ecotoxicity of models substances, we chose to work with:
Pseudokirchneriella subcapitata (Ps), a microalgae belonging to Chlorophyceae family,
classically used in ecotoxicology, Daphnia magna (Dm), freshwater planktonic
macroinvertebrate belonging to Cladocera family, also classically used in ecotoxicology and
finally a marine bacteria, Vibrio fisheri (Vf). In this way, we asses ecotoxicity on three organisms
from three different trophic levels and living in freshwater and marine water.
Concerning models substances, we choose to study two drugs: (i) amiodarone chlorhydrate, a
class III antiarrhythmic drug, used for heart disease treatment; (ii) tamoxifen citrate, an
antioestrogenic anticancer drug used for breast cancer treatment. These drugs have been chosen
because they contain excipients with different functions: hydrochloride has to preserve and to
stabilize active ingredient amiodarone and citrate has enhance assimilation of tamoxifen by
increasing its solubility (and so its bioavailability).
In this article, are shown exposure results of three tested organisms to the four presented
substances (tamoxifen, tamoxifen citrate, amiodarone and amiodarone chlorhydrate). Results
are then discussed in order to learn firsts lessons about necessity to take into account the real
nature of compound emitted and found into environment.
2. Material and method
2.1. Algal cultures
Pseudokirchneriella subcapitata (Ps), green algae (Chlorophyceae), was cultivated under 3000
lux (16 h/day) at 20 ± 1 °C in oligo L.C. medium(AFNOR, 1980). Media and flasks were
autoclaved (120°C, 1 bar, 20 min) before inoculation.

2.2. Rearing of daphnids
Daphnids (Daphnia magna) were reared in M4 medium (Elendt and Bias, 1990). Thirty neonates
daphnids were kept in 2L glass flasks at 20± 1 °C under 500 lux (16 h/day); they were fed with a
solution of P. subcapitata (106–107 cells/daphnid) added daily to the culture flasks. Neonates
were collected daily and used in tests or discarded. Half of the medium was renewed once a
week. Mother daphnids were discarded after 1month and new cultures were initiated with
neonates obtained by parthenogenesis.
2.3. Chemicals
Tamoxifen (CAS N° 10540-29-1), tamoxifen citrate (CAS N° 54965-24-1) and amiodarone
hydrochloride (CAS N° 19774-82-4) used in this study were purchased from Sigma-Aldrich
Chemical (ST. QUENTIN FALLAVIER, France). Stock solutions were prepared in DMSO with
concentration of 18.6 mM for tamoxifen (6.91g/L of tamoxifen and 10.48 g/L of tamoxifen
citrate) and 29.33 mM for amiodarone (18.93 g of amiodarone/L and 20 g of amiodarone HCl/L)
and then kept at -20°C in glass vials. For each exposure, test solutions were freshly prepared
by proportional successive dilutions of an aliquot of the stock solutions.
2.4. Purification of amiodarone hydrochloride
A solution of Amiodarone hydrochloride (2.5 g, 3.76 mmol) in dichloromethane (50 mL) was
washed with a saturated aqueous NaHCO3 solution (100 mL). The aqueous layer was extracted
three times with dichloromethane (3x15 mL). The organic layers were combined, washed with
brine, dried overs Na2SO4 and evaporated to afford Amiodarone base as pale yellow oil (2.245 g,
3.47 mmol, 92%).1H NMR (300 MHz, CDCl3): 8.20 (s, 2H), 7.53-7.39 (m, 2H), 7.35-7.20 (m, 2H),
4.14 (t, 2H, J = 6.8 Hz), 3.09 (t, 2H, J = 6.6 Hz), 2.84 (t, 2H, 7.5 Hz), 2.72 (q, 4H, J = 7.2 Hz), 1.77
(quint., 2H, J = 7.7 Hz), 1.36 (hex, 2H, J = 7.3 Hz), 1.12 (t, 6H, J = 7.2 Hz), 0.91. 13C NMR (75
MHz, CDCl3): 187.8 (Cq), 166.1 (Cq), 161.5 (Cq), 153.7 (Cq), 140.7 (2CH), 138.3 (Cq), 126.4 (Cq),
124.7 (CH), 123.9 (CH), 121.1 (CH), 115.9 (Cq), 111.1 (CH), 90.9 (2Cq), 71.4 (CH2), 51.1 (CH2),
47.7 (2CH2), 30,0 (CH2), 28.2 (CH2), 22.6 (CH2), 13.8 (2CH3), 12.0 (CH3). M.S. (ESI, m/z): 646.0
[M+H]+, HRMS: calcd. For C25H30I2NO3+ 646.0310 found 646.0335.

2.5. Ecotoxicity tests
2.5.1. Algal growth tests
The growth tests performed were selected according to OECD guideline N° 201 (OECD, 2006)
on Pseudokirchneriella subcapitata. Algae were seeded on 48 well microplates at a concentration
of 104 cells per mL in their specific culture medium in contact with different concentrations of
pharmaceuticals after 3 days preconditioning under the test conditions, i.e. in a climatic chamber
(Aralab Fitoclima D 1200), 20 ± 1°C under continuous lighting of 10 000 lux. The range of tested
concentrations went from 0 to 100 mg/L for amiodarone and amiodarone HCl and between 3
and 1600 µg/L for tamoxifen and tamoxifen citrate. Three replicates were prepared for each
concentration. In parallel, a control with the highest concentration of DMSO introduced in the
wells (0.5%) was prepared to ensure the absence of effect of the solvent on algal growth. To limit
evaporation in the wells during the experiment, susceptible to modify the tamoxifen
concentration, ultrapure water was placed in the outer wells of the plate. Seventy two hours after
inoculation the content of the wells was homogenized and algal density was measured with a
particle counter (Coultronics, model Z1, threshold size 3.6 µm). In order to have a better
accuracy, these tests were done twice for each molecule and all values for each concentration
were averaged. Inhibition concentrations 50% (IC50) were then calculated using the RegTox
software.
2.5.2. Daphnid mortality tests
The daphnid mortality test was carried out according to the ISO standard protocol (ISO, 1995).
Five neonate daphnids (<24 h) were transferred into a glass test tube containing 10 ml of a
tamoxifen solution freshly prepared in the rearing medium. The tested concentrations were
include between 0 to 250 mg/L for amiodarone and amiodarone HCl and between 0.024 and 12.5
mg/L for tamoxifen and tamoxifen citrate. Four replicate tubes were tested per concentration
(20 daphnids). In order to prevent algal growth, tubes were incubated in the dark during the
exposure period. In order to have a better accuracy, these tests were done twice for each molecule
and all values for each concentration were averaged. After 24h and 48h of exposure, the number
of dead daphnids in each tube was recorded and 48h-EC50 was calculated using a probit model.

2.5.3. Bioluminescence inhibition on Vibrio fisheri
These tests were performed by PROVADEMSE, directed by Christine BAZIN, according to the
standard NF ISO 11348-3. This test consist in measure how much a substance inhibit
luminescence of bacteria V. fisherii. For that, bacteria were exposed to a range on contaminant
at 15°C ± 1°C. After 30 minutes, luminescence were measured (analyzer Microtox M500) and
compared to the control unexposed.
2.5.4. Solvents ecotoxicity
For all ecotoxicity experiments, the DMSO ecotoxicity was tested, considering the highest
exposure concentration.
3. Results Any ecotoxicity of DMSO was detected for all tested organisms at exposure concentrations (0.5%
of DMSO for Ps and Dm and 1% for Vf).
3.1. Ecotoxicity of amiodarone HCl and amiodarone
3.1.1. Inhibition of algal growth
For each tested compound, amiodarone and amiodarone hydrochloride, 3 tests of algal growth
were performed. Inhibition growth of these tests were “pooled” in order to obtain only one IC50
(50% inhibition concentration) for each compound (Table 1).
Considering confidence intervals of EC50 for amiodarone and amiodarone HCl, we can say that
amiodarone is as much ecotoxic as amiodarone HCl.
3.1.2. Dahpnids mortality tests
For each studied compound, amiodarone and amiodarone HCl, 3 mortality tests were performed.
In experiment conditions, we couldn’t put into evidence ecotoxicity of these two compounds
regarding daphnids mortality. Indeed, we never reach 100% of mortality with range of tested
concentrations which expend until 250 mg/L. Beyond this value, solvent burden in solution will

be toxic for organisms and will lead to daphnids mortality. However, with our results, we can
say that EC50 is higher than 28 mg/L. Thus, acute ecotoxicity of amiodarone HCl and its active
ingredient can be consider as low to daphnids.
3.1.3. Bioluminescence inhibition of Vibrio fisheri
Assays have shown a much lower ecotoxicity for both tested molecules with EC50 30min. of 12.8
mg/L and 13.6 mg/L.
Table 1: Effect concentrations (EC in µg/L) of amiodarone and amiodarone HCl on tested organisms with interval confidence 95% (IC95% in µg/L; NA: Non applicable).
3.2. Ecotoxicity of tamoxifen citrate and tamoxifen
For all tested organisms, we put into evidence an ecotoxicity of tamoxifen citrate higher than
for tamoxifen alone. For Ps, we observed EC50 of 702 and 509 µg/L respectively for tamoxifen
and tamoxifen citrate. For Dm, the gap between ecotoxicity of these two compounds is much
higher with respectively EC50 of 696 and 201 µg/L for tamoxifen and tamoxifen citrate. Finally,
for Vf, we have the same order of gap than for Dm with EC50 four times higher for tamoxifen
(CE50 = 8,2 mg/L) than for tamoxifen citrate (CE50 = 2,1 mg/L) (Table 2).
Table 2: Effect concentrations (EC in µg/L) of tamoxifen and tamoxifen citrate on tested organisms with interval confidence 95% (IC95%: µg/L).
Tamoxifen Tamoxifen citrate
(µg of tamoxifen /L) EC50 IC 95% EC50 IC 95%
P. subcapitata 72h 702c [681 - 787] 509e [470 - 558]
D. magna 48h 696c [660 - 830] 201f [166 - 250]
V. fisheri 30 min 8200d [7310 - 8340] 2118g [1663 - 2567]
Amiodarone Amiodarone HCl
(µg of amiodarone /L)
EC50 IC 95% EC50 IC 95% P. subcapitata 72h 870a [670 - 1173] 1068a [799 - 1415]
D. magna 48h > 28000 NA > 28000 NA
V. fisheri 30 min 12800b [11980- 13760] 13610b [11460- 15420]

4. Discussion
4.1. Indirect ecotoxicity of citrate
In this work, we have shown that, active ingredient ecotoxicity and drug ecotoxicity are not
necessary equal. Indeed, tamoxifen citrate was more ecotoxic for all tested organisms than
tamoxifen. In Medicine, citrate is used as an excipient with tamoxifen for increasing its solubility
in blood and so enhanced its assimilation by body. It is strongly likely that citrate played the
same role inside our ecotoxicity tests. In 2006, Carlsson et al. demonstrated that excipients, when
released in the environment, could be harmful for ecosystems. Nevertheless, citrate is not one of
these potentially harmful excipient. Indeed, ecotoxicity tests have already been performed with
citrate. Ecotoxicity values are much higher than concentration of excipient used in our tests with
LOEC from 80 to 485 mg/L for unicellular algae and 1.5 g/l for D. magna (US EPA ECOTOX
Database). Thus, higher ecotoxicity of tamoxifen citrate is likely due to to effect of citrate on
bioavailability of tamoxifen.
Concerning amiodarone HCl, we couldn’t put into evidence excipient effect on ecotoxicity.
Hydrochloride is an excipient used for preservation and stability of active ingredient. Its strong
acidity (pKa < 0) had no effect on tested organisms because of its low concentration in exposure
medium leading to a pH close to neutrality. We can also wondering about bioavailability of
amiodarone chlorhydrate. Indeed, this latter could be increased by turning active ingredient into
its salt, leading to an increase of the compound in blood. However at physiological pH,
amiodarone is principally observed as protoned form (salt), implying no bioavailability
difference between the free amine and its salt.
4.2. Ecotoxicological risks of amiodarone and tamoxifen
Before this work, any ecotoxicity tests had been performed about amiodarone. Well, even if
rarely measured and never measured in environment, this contaminant have been identified as
presenting ecotoxicological risks for environment because of its potential bioaccumulability
(Jean et al., 2012) and because of emitted quantity to environment (Escher et al., 2011). Indeed,
Escher et al. (2011) have detected amiodarone inside an hospital effluent at concentration up to
800 ng/L and Jean et al., (2012) have reported theoretical bioconcentration up to 106 depending
on pH. Otherwise, amiodarone have recently been detected inside wastewater treatment plants
(WWTP) effluents at concentration up to 1 µg/L (Fedorova et al., 2014) and inside WWTP sludge
at content close to 300 ng/g. It is now necessary to increase knowledge about chronic ecotoxicity
of these molecules in order to make a better assessment of ecotoxicological risks linked to the

presence of this PC in ecosystems. For that, perform chronic ecotoxicity bioassays is a first step
unavoidable.
Concerning tamoxifen (active ingredient without citrate), we demonstrated in previous works
that its ecotoxicity, regarding environmental concentrations (4 rivers analyzed in the world)
could lead in some situation to significant ecotoxicological risks (Orias et al., 2015). Hence the
interest to have a good ecotoxicity characterization of environmental contaminants.
5. Conclusion and perspectives
Our work demonstrate the interest to take into account excipient effect during ecotoxicity
characterization of drugs. Indeed, we saw that with tamoxifen, ecotoxicity can be highly
modified by excipient.
Otherwise, in this study, we performed the first ecotoxicity tests on amiodarone, a lack regretted
by several authors (Escher et al., 2011; Le Corre et al., 2012). It is now necessary to deepen the
characterization of the ecotoxicity of amiodarone by making chronic ecotoxicity tests. Moreover,
it is also necessary to develop environmental measurements of amiodarone still too rare.
Results of the last ecotoxicity value of tamoxifen citrate confirm conclusions of recent works
concerning in-depth characterization of ecotoxicological risks of tamoxifen (Orias et al, 2015).
However, chronic tests on tamoxifen are still expected in order to have accurate this
characterization.
Direct ecotoxicity of these compound getting better characterize, it is now interesting to improve
knowledge about indirect ecotoxicity linked to these PCs, because of its strong potential to
bioaccumulate in biota. Indeed, tamoxifen and amiodarone are a part of molecules identified as
especially bioaccumulative (Jean et al., 2012).
Acknowledgments The authors thank the SIPIBEL field observatory on hospital effluents and urban wastewater
treatment plants, the European Union, the Rhone-Mediterranean Corsica Water Agency, the
Rhône-Alpes Region, the Ministries of Health and the Environment, the Regional Office of
Health, and the General Council of Haute-Savoie for their support.

References
AFNOR, 1980. Détermination de l’inhibition de la croissance de Scenedesmus subspicatus par une substance.
Burridge, L., Weis, J.S., Cabello, F., Pizarro, J., Bostick, K., 2010. Chemical use in salmon aquaculture: A review of current practices and possible environmental effects. Aquaculture 306, 7–23. doi:10.1016/j.aquaculture.2010.05.020
Carlsson, C., Johansson, A.-K., Alvan, G., Bergman, K., Kühler, T., 2006. Are pharmaceuticals potent environmental pollutants?: Part II: Environmental risk assessments of selected pharmaceutical excipients. Sci. Total Environ. 364, 88–95. doi:10.1016/j.scitotenv.2005.06.036
Collado, N., Rodriguez-Mozaz, S., Gros, M., Rubirola, A., Barceló, D., Comas, J., Rodriguez-Roda, I., Buttiglieri, G., 2014. Pharmaceuticals occurrence in a WWTP with significant industrial contribution and its input into the river system. Environ. Pollut. 185, 202–212. doi:10.1016/j.envpol.2013.10.040
Elendt, B.P., Bias, W.R., 1990. Trace nutrient deficiency in Daphnia magna cultured in standard medium for toxicity testing. Effects of the optimization of culture conditions on life history parameters of D. magna. Water Res. 24, 1157–1167. doi:10.1016/0043-1354(90)90180-E
Escher, B.I., Baumgartner, R., Koller, M., Treyer, K., Lienert, J., McArdell, C.S., 2011. Environmental toxicology and risk assessment of pharmaceuticals from hospital wastewater. Water Res. 45, 75–92. doi:10.1016/j.watres.2010.08.019
Fedorova, G., Golovko, O., Randak, T., Grabic, R., 2014. Storage effect on the analysis of pharmaceuticals and personal care products in wastewater. Chemosphere 111, 55–60. doi:10.1016/j.chemosphere.2014.02.067
ISO, 1995. Qualité de l’eau - Détermination de la mobilité de Daphnia magna Straus, Cladocera, Crustacea, essai de toxicité aiguë.
Jean, J., Perrodin, Y., Pivot, C., Trepo, D., Perraud, M., Droguet, J., Tissot-Guerraz, F., Locher, F., 2012. Identification and prioritization of bioaccumulable pharmaceutical substances discharged in hospital effluents. J. Environ. Manage. 103, 113–121. doi:10.1016/j.jenvman.2012.03.005
Kidd, K.A., Blanchfield, P.J., Mills, K.H., Palace, V.P., Evans, R.E., Lazorchak, J.M., Flick, R.W., 2007. Collapse of a fish population after exposure to a synthetic estrogen. Proc. Natl. Acad. Sci. 104, 8897–8901. doi:10.1073/pnas.0609568104
Kolodziej, E.P., Harter, T., Sedlak, D.L., 2004. Dairy wastewater, aquaculture, and spawning fish as sources of steroid hormones in the aquatic environment. Environ. Sci. Technol. 38, 6377–6384.
Langford, K.H., Thomas, K.V., 2009. Determination of pharmaceutical compounds in hospital effluents and their contribution to wastewater treatment works. Environ. Int. 35, 766–770. doi:10.1016/j.envint.2009.02.007
Le Corre, K.S., Ort, C., Kateley, D., Allen, B., Escher, B.I., Keller, J., 2012. Consumption-based approach for assessing the contribution of hospitals towards the load of pharmaceutical residues in municipal wastewater. Environ. Int. 45, 99–111. doi:10.1016/j.envint.2012.03.008
Montes, R., Rodríguez, I., Casado, J., López-Sabater, M.C., Cela, R., n.d. Determination of the cardiac drug amiodarone and its N-desethyl metabolite in sludge samples. J. Chromatogr. A. doi:10.1016/j.chroma.2015.03.024
OECD, 2006. OECD GUIDELINES FOR THE TESTING OF CHEMICALS : Freshwater Alga and Cyanobacteria, Growth Inhibition Test.
Orias, F., Bony, S., Devaux, A., Durrieu, C., Aubrat, M., Hombert, T., Wigh, A., Perrodin, Y., 2015. Tamoxifen ecotoxicity and resulting risks for aquatic ecosystems. Chemosphere 128, 79–84. doi:10.1016/j.chemosphere.2015.01.002
US EPA ECOTOX Database http://cfpub.epa.gov/ecotox/ last access 23/03/15

CHAPITRE 5. ECOTOXICITÉ COMPARATIVE DE DEUX MÉDICAMENTSMODÈLES ET DE LEURS PRINCIPES ACTIFS RESPECTIFS
94

CHAPITRE 5. ECOTOXICITÉ COMPARATIVE DE DEUX MÉDICAMENTSMODÈLES ET DE LEURS PRINCIPES ACTIFS RESPECTIFS
5.3 Synthèse
On remarque que l’excipient du tamoxifen, le citrate, a un effet amplificateur sur l’éco-toxicité du tamoxifen. L’hydrochloride en revanche n’a pas d’effet significatif sur l’écotoxicitéde l’amiodarone. Ces travaux montrent que l’excipient peut jouer un rôle significatif surl’écotoxicité d’un principe actif. De plus, cela confirme que le tamoxifen est la molécule laplus écotoxique parmi les molécules prioritaires présélectionnées. C’est pourquoi nous allonsévaluer le risque de la présence de cette molécule dans les écosystèmes aquatiques.
95

CHAPITRE 5. ECOTOXICITÉ COMPARATIVE DE DEUX MÉDICAMENTSMODÈLES ET DE LEURS PRINCIPES ACTIFS RESPECTIFS
96

Chapitre 6
Evaluation du risque écotoxicologiquedu tamoxifen
6.1 Enjeux et démarche
Entre les données obtenues à travers nos différents tests d’écotoxicité et les données dispo-nibles dans la littérature, nous sommes en mesure d’établir une PNEC consolidée du tamoxi-fen. En comparant cette valeur aux concentrations déjà mesurées dans différentes rivières surle plan international (MEC), il est possible d’évaluer le risque écotoxicologique que représentele tamoxifen pour les écosystèmes aquatiques concernés. Le résultat de ce travail est présentédans l’article suivant.
6.2 Article 4 :Tamoxifen ecotoxicity and resulting risksfor aquatic ecosystems
Article soumis le 7 mai 2014, accepté le 6 janvier 2015 et publié le 6 février 2015 dans lejournal « Chemosphere ».
97

CHAPITRE 6. EVALUATION DU RISQUE ÉCOTOXICOLOGIQUE DU TAMOXIFEN
98

Tamoxifen ecotoxicity and resulting risks for aquatic ecosystems
Frédéric Orias a,⇑, Sylvie Bony a,b, Alain Devaux a,b, Claude Durrieu a, Marion Aubrat a, Thibault Hombert a,Adriana Wigh a, Yves Perrodin a
a Université de Lyon, ENTPE, CNRS, UMR 5023 LEHNA, 2 Rue Maurice Audin, 69518 Vaulx-en-Velin, Franceb INRA, USC IGH 1369, ENTPE, F-69518 Vaulx-en-Velin, France
h i g h l i g h t s
� First ecotoxicity tests of tamoxifen on algae.� A PNEC of tamoxifen for continental aquatic ecosystems of 81 ng L�1.� Risk quotients of tamoxifen calculate for four situations.� Tamoxifen could present a significant environmental risk for aquatic ecosystems.
a r t i c l e i n f o
Article history:Received 7 May 2014Received in revised form 15 October 2014Accepted 6 January 2015Available online 6 February 2015
Handling Editor: Shane Snyder
Keywords:TamoxifenEcotoxicityEcotoxicological risk assessmentTrophic levelAquatic ecosystems
a b s t r a c t
Tamoxifen, a drug used to treat cancer, is regularly found in hydrosystems at concentrations of severalhundred ng L�1. To characterize its ecotoxicity, we implemented a battery of bioassays on organismsbelonging to 3 different trophic levels: Pseudokirchneriella subcapitata, Chlorella vulgaris and Chlamydo-monas reinhardtii, for primary producers, Daphnia magna (immobilization, grazing and reproduction)for primary consumers, and Danio rerio for secondary consumers (embryotoxicity test). In view of theresults obtained and the ecotoxicity values of tamoxifen available in the literature, we established a PNEC(Predictive No Effect Concentration) equal to 81 ng L�1 for continental water. This PNEC allowed us to cal-culate Risk Quotients (RQ) for 4 continental hydrosystems in 4 different countries in which measures oftamoxifen had already been performed on surface waters. In two of the situations studied, RQs werehigher than 1, reaching a maximum of 2.6. These results show the need to deepen the characterizationof ecotoxicological risks linked to the discharge of tamoxifen in surface waters. In addition, we proposeapplying this approach to other drug residues detected in the environment.
� 2015 Elsevier Ltd. All rights reserved.
1. Introduction
Drugs and their residues are now recognized as ubiquitous inecosystems: the hydrosphere (surface water (Heath et al., 2010),deep water (Loos et al., 2010), drinking water (Gibs et al., 2007)),the geosphere (Silva et al., 2011; Yang et al., 2011) and the bio-sphere (via bioconcentration, bioaccumulation and bioamplifica-tion phenomena) (Lajeunesse et al., 2011; Zenker et al., 2014).The main sources of these generalized contaminations are: (i)urban effluents (domestic and hospital) (Kümmerer, 2009;Verlicchi et al., 2010) treated by sewage plants (WWTP) that areoften poorly adapted to ensure the total degradation of these com-pounds ((Ternes, 1998); (Heberer, 2002); (Joss et al., 2005)); (ii)pharmaceutical plants (Larsson et al., 2007; Collado et al., 2014);
and (iii) domestic livestock breeding and aquaculture (Halling-Sørensen et al., 1998; Lalumera et al., 2004).
Among the many drugs emitted into the environment, ourattention was drawn to tamoxifen. It is an anti-estrogenic com-pound used to treat hormone-dependent breast cancer. This com-pound has been detected in hospital (Langford and Thomas, 2009)and urban effluents (Zhou et al., 2009) at concentrations reaching740 ng L�1, as well as in surface waters at concentrations reaching212 ng L�1 (Zhang et al., 2013). This compound has also been foundin the sediment compartment (212–431 ng g�1; (Yang et al.,2011)). However, only few ecotoxicity data are available concern-ing tamoxifen (see Table 4).
So, in the first part of this work, tamoxifen toxicity wascharacterized for organisms representing different trophic levelsof aquatic ecosystems (primary producers, primary consumerand secondary consumer): (i) three different algae species(growth inhibition tests); (ii) A microcrustean (acute, sub-chronic
http://dx.doi.org/10.1016/j.chemosphere.2015.01.0020045-6535/� 2015 Elsevier Ltd. All rights reserved.
⇑ Corresponding author. Tel.: +33 4 72 04 70 58; fax: +33 4 72 04 77 43.E-mail address: [email protected] (F. Orias).
Chemosphere 128 (2015) 79–84
Contents lists available at ScienceDirect
Chemosphere
journal homepage: www.elsevier .com/locate /chemosphere

and chronic ecotoxicity tests); (iii) A fish species (embryotoxicitytest).
Then, the PNEC (Predictive No Effect Concentration) of tamoxi-fen was calculated for continental hydrosystems on the basis of thetoxicity results obtained in this study and the data available in theliterature.
Lastly, the evaluation of ecotoxicological risks related to thepresence of tamoxifen in the environment was then establishedby comparing the PNEC established with Measured EnvironmentalConcentrations (MEC) in different situations described in the liter-ature (Roberts and Thomas, 2006; Coetsier et al., 2009; Yang et al.,2011; López-Serna et al., 2012), which allowed formulating a RiskQuotient (RQ) for each situation studied.
2. Materials and methods
2.1. Algal cultures
Pseudokirchneriella subcapitata (Ps), Chlorella vulgaris (Cv) andChlamydomonas reinhardtii (Cr), 3 green algae (Chlorophyceae),were cultivated under 3000 lux (16 h d�1) at 20 ± 1 �C in oligoL.C. medium (AFNOR, 1980) (for Ps and Cv) and in TAP (TRIS aceticacid phosphate) medium (for Cr) (Gorman and Levine, 1965).Media and flasks were autoclaved (120 �C, 1 bar, 20 min) beforeinoculation.
2.2. Rearing of daphnids
Daphnids (Daphnia magna) were reared in M4 medium (Elendtand Bias, 1990). Thirty individuals were kept in 2 L glass flasks at20 ± 1 �C under 500 lux (16 h d�1); they were fed with a solutionof P. subcapitata (106–107 cells/daphnid) added daily to the cultureflasks. Neonates were collected daily and used in tests or discarded.Half of the medium was renewed once a week. Mother daphnidswere discarded after 1 month and new cultures were initiated withneonates obtained by parthenogenesis.
2.3. Chemicals
Tamoxifen (CAS Number 10540-29-1) and all the chemicalsused in this study were purchased from Sigma–Aldrich Chemical(ST. QUENTIN FALLAVIER, France). A stock solution of tamoxifenwas prepared in DMSO (50 mM or 18.575 g L�1) and kept at�20 �C. For each exposure, test solutions were freshly preparedby proportional successive dilutions of an aliquot of the stock solu-tions so that DMSO concentration was always less than 0.01% (v/v)in the tested solutions.
2.4. Algal growth tests
The growth tests performed on the 3 algae were selectedaccording to OECD guideline N� 201 (OECD, 2006). The algae wereseeded on 48 well microplates at a concentration of 104 cells permL (Cv, Ps) or 103 cells per mL (Cr) in their specific culture mediumin contact with different concentrations of tamoxifen after 3 d pre-conditioning under the test conditions, i.e. in a climatic chamber(Aralab Fitoclima D 1200), 20 ± 1 �C under continuous lighting of10000 lux. The range of tamoxifen concentrations tested was asfollows: 0, 10, 50, 100, 200, 300, 400, 500, 600, 800 and1600 lg L�1. Three replicates were prepared for each concentra-tion. In parallel, a control with the highest concentration of DMSOintroduced in the wells (0.01%) was prepared to ensure the absenceof effect of the solvent on algal growth. To limit evaporation in thewells during the experiment, susceptible to modify the tamoxifenconcentration, ultrapure water was placed in the outer wells of
the plate. Seventy-two hours after inoculation the content of thewells was homogenized and algal density was measured using aMalassez cell counter (2 counts per well) and a Zeiss microscope,magnification �400. Inhibition concentrations 50% (IC50) werethen calculated using the RegTox software.
2.5. Daphnid toxicity tests
2.5.1. Acute toxicity: immobilization testThe daphnid immobilization test was carried out according to the
ISO standard protocol (ISO, 1995). Five neonate daphnids (<24 h)were transferred into a glass test tube containing 10 ml of a tamox-ifen solution freshly prepared in the rearing medium. The concen-tration range tested was: 0, 100, 200, 400, 800, 1600, 3200, 6400,and 12800 lg L�1. Four replicate tubes were tested per concentra-tion (20 daphnids). In order to prevent algal growth, tubes wereincubated in the dark during the exposure period. After 24 h and48 h of exposure, the number of immobilized daphnids in each tubewas recorded and 48 h-EC50 was calculated using a probit model.
2.5.2. Subchronic toxicity: grazing activityDaphnia grazing activity was measured under static conditions
(no algal growth) over a period of 48 h, according to Clément andZaid (2004). The experiment was carried out in 250 ml glass beak-ers containing 150 ml of rearing medium, five daphnids (agedbetween 3 and 4 d at the start of test) and 500000 P. subcapitatacells/ml. Fives replicates per treatment were tested with the fol-lowing tamoxifen concentration range: 0, 5, 25, 50, 100 and150 lg L�1. For each concentration tested, two beakers withoutdaphnids were used as controls to evaluate possible algal growth.All the beakers were placed in the dark at 20 ± 1 �C and were gentlyshaken three times a day to ensure mixing of the algal suspensionsin order to improve cell availability for daphnids. Residual algaldensities were measured after 24 and 48 h using a particle counter(Coultronics, model Z1, threshold size 3.6 lm). Daphnid grazingactivity was evaluated by calculating the filtration rate (F, in ml/daphnid/h) according to Gauld (Gauld, 1951):
F ¼ ðV=nÞ½lnðC0Þ � lnðCtÞ=t � A�
A ¼ ½lnðC0Þ � lnðC0tÞ�=t
where V (ml) is the total volume of medium, n the number of daph-nids in volume V, C0 and Ct are initial and final algal densities (cells/mL) and t the exposure duration time (duration of experiment inhours). A is a correction factor used to take into account changesin the algae density controls (algae without daphnids) expressedas the final algal density C0t.
No mortality was observed during the experiments, whateverthe tamoxifen concentration.
2.5.3. Chronic toxicity: reproduction testTo test the chronic toxicity of tamoxifen on the reproduction of
D. magna, we referred to guideline 211 of the OECD (OECD, 1998).The daphnids aged less than 24 h were placed for 21 d in 100 mLbeakers containing 80 mL of rearing medium (1 daphnid per bea-ker and 10 beakers per concentration) contaminated as a functionof the following range of tamoxifen concentrations: 0, 5, 15, 30, 60and 120 lg L�1. The daphnids were fed once a week with an algalsuspension of P. subcapitata so that algal density was in the regionof 106 cells mL�1. The medium was renewed twice a week. Thenumber of young daphnids produced was counted daily.
2.6. Fish embryo test
The fish embryo test used here as an alternative to the 96 h fishacute toxicity assay was carried out according to OECD guidelines,
80 F. Orias et al. / Chemosphere 128 (2015) 79–84

with the embryos immersed in the test solutions before cleavage ofthe blastodisc, i.e. less than 4 hpf (OECD, 2013). Zebrafish (Daniorerio) embryos (20 per concentration) were exposed in the darkfor 96 h at 26 �C to tamoxifen prepared from a stock solution madein DMSO (18.575 g L�1) then diluted in ISO water. The range oftamoxifen concentrations studied in ISO water was 50, 100, 200,300, 400, 500, 600, 1000, 1400 and 1850 lg L�1. A negative controlconsisted in exposing embryos to ISO water alone, and the exper-imental design included a solvent control (DMSO 0.01% v/v in ISOwater). The positive control corresponded to embryo exposure to3.7 mg L�1 of 3,4-dichloroaniline (3,4-DCA). Embryos wereobserved every day for 4 d and the dead ones were removed andcounted.
2.7. Calculation of Risk Quotients (RQ)
The simplest and most widespread method for qualifying eco-toxicological risk linked to the exposure of an aquatic ecosystemto a given pollutant (in this case tamoxifen) is the calculation ofa risk quotient. This quotient corresponds to the ratio of the ‘‘pol-lutant concentration present in the environment’’, for the scenariostudied, divided by the concentration of the same pollutant ‘‘withno effect on the target ecosystem’’ of the scenario. If the RQ value ishigher than ‘‘1’’, it is considered that the risk is significant. Thegreater is the distance of RQ value above ‘‘1’’, the higher is the risk.On the contrary, if the RQ value is lower than ‘‘1’’ the risk is consid-ered to be non significant. Depending on the context and objectiveof the study, the concentration of the pollutant in the environmentcan be: (i) predicted, notably by modeling, in which case the termPredictable Environmental Concentration (PEC) is used; (ii) mea-sured directly in the environment of the target ecosystem. In thiscase, the term Measured Environment Concentration (MEC) isused. In the framework of the present study, we worked with theMEC values obtained by different authors in different countries(Spain, UK, China and France) for different hydrosystems pollutedby tamoxifen (Roberts and Thomas, 2006; Yang et al., 2011;López-Serna et al., 2012; Zhang et al., 2013) (Table 1).
The ‘‘no effect on the target ecosystem’’ can be determinedusing the PNEC (Predictive No Effect Concentration) values avail-able in international databases, or established for the requirementsof the study. The PNEC value of tamoxifen, absent from interna-tional databases, was calculated according to the rules set out inthe Technical Guidance Document of the European ChemicalBureau (European Chemical Bureau (ECB) 2003):
PNEC ¼ LAED=EF
with PNEC being the Predictive No Effect Concentration, LAED theLowest Available Ecotoxic Data, and EF the Extrapolation Factor.
This calculation with the results of the ecotoxicity tests per-formed in the framework of this work, added to the ecotoxicolog-ical data available in the literature, makes it possible to calculate arobust PNEC value.
Finally, we calculated the risk quotients corresponding to thefour situations found in the literature on the basis of four
corresponding MEC values, and the PNEC value formulated, usingthe following formula:
RQ x ¼ MECx=PNEC
with MECx being the Measured Environmental Concentration incontext ‘‘x’’, RQx the Risk Quotient in context x, and PNEC the Predic-tive No Effect Concentration.
3. Results
3.1. Algal growth tests
The ecotoxicity tests were used to calculate three IC50s for eachspecies of algae (Concentration for 50% inhibition) grouped inTable 2.
The IC50 values present the same order of magnitude for thethree species of algae. However, the response of P. subcapitatawas more variable than the two other species of algae tested, witha much wider confidence interval.
3.2. Daphnid tests
3.2.1. Immobilization testDetailed data are not provided for the sake of concision and
clarity. After 24 h, we observed a significant increase in the immo-bilization of the daphnia as from the first exposure to tamoxifenconcentrations but which never exceeded 60%, thus preventingthe calculation of an EC50. However, after 48 h exposure, 95%immobilization was measured starting from 800 lg L�1 and 100%at 3200 lg L�1 tamoxifen, respectively. This result permitted calcu-lating an EC50 (Immobilization) at 48 h of 210 lg L�1 (IC95%: 130–400 lg L�1). Detailed data are provided in Appendix 1.
3.2.2. Grazing testIn this experiment we tested the effect of tamoxifen on the algal
grazing activity of D. magna by measuring the rate of filtration ofthe daphnia exposed to an increasing concentration of tamoxifenafter 24 and 48 h. The results are described in Fig. 1.
After 24 h exposure, we observed a significant impact on graz-ing starting from 50 lg L�1 tamoxifen. The average rate of filtrationdecreased in relation to the control by 27% at 50 lg L�1, 22% at75 lg L�1, 45% at 100 lg L�1, to reach 76% at 200 lg L�1. Theseresults permitted calculating an EC50 at 24 h of 104 lg L�1 (IC95%: 84–124 lg L�1).
Over the period 24–48 h, we first observed a slight hormesiseffect on the filtration rate at 25 lg L�1 (+18%). Afterwards, theonly significant difference of grazing with the control appearedat 200 lg L�1, with an average of 40% inhibition.
It is noteworthy that the doubling of the filtration rate between24 h and 48 h was due to the growth of the daphnia which is quiteconsiderable at this stage of their development.
3.2.3. Reproduction testA significant reduction of the reproduction rate was only
observed after the daphnia were exposed to 120 lg L�1 tamoxifen(Table 3).
Table 1Measured Environmental Concentrations (MEC) of tamoxifen in various situation.
Country Rivers Concentrations(ng L�1)
References
Min Max
Spain Ebro River 12.4 20.1 López-Serna et al. (2012)China Yangtze Estuary 120 129 Yang et al. (2011)UK Lower Tyne River 27 212 Roberts and Thomas (2006)France Gardon River <5.8 25 Coetsier et al. (2009)
Table 2Tamoxifen inhibition concentration 50% (IC50) for the three algae species Ps, Cv, et Crwith their confidence interval at 95% (n = 10).
Algal species IC50 (lg L�1) Confidence interval 95%
Ps 980 830–1360Cv 610 540–660Cr 470 430–510
F. Orias et al. / Chemosphere 128 (2015) 79–84 81

3.3. Fish embryo test
Fig. 2 illustrates the level of mortality encountered in zebrafishembryos. The positive control corresponding to the embryosexposed to 3,4-DCA exhibited an average of 90% mortality.Exposure to tamoxifen did not lead to any significant increase inembryo mortality compared to the control for final tamoxifen con-centrations between 0.05 and 1.85 mg L�1. Furthermore, time tohatching was not delayed, with hatchability remaining unchanged,and no major abnormalities were observed whatever the tamoxi-fen concentration.
3.4. Risk quotient (RQ)
In the framework of this study, four additional organisms (threemicro-algae, an invertebrate and a vertebrate) were tested forcomparison to data previously available in the literature (Table 4).The ecotoxicity of tamoxifen had already been tested on D. magnabut we tested two new endpoints (i.e. grazing activity and
reproduction). All these data allow us to specify a robust PNECfor tamoxifen in aquatic ecosystems. In particular, the ecotoxicitytests performed on micro-algae provided data for an additional tro-phic level (primary producers), permitting the reduction of theextrapolation factor from 50 to 10 according to the TGD rules(European Chemical Bureau (ECB), 2003). Thus a PNEC value oftamoxifen of 81 ng L�1 was obtained by using the LAED 810 ng L�1
for C. dubia (Della Greca et al., 2007) with the following calculation:PNEC = 810/10 = 81 ng L�1.
The risk quotients calculated with this new PNEC for differentrivers studied in the international literature (Table 4) are presentedin Table 5.
This table highlights a significant ecotoxicological risk linked totamoxifen in the cases of the Yangtze and Lower Tyne rivers, con-trary to the cases of the Ebro and Gardon rivers where the RQ islower than 1.
4. Discussion
4.1. Toxicity of tamoxifen for the different organisms tested
We noted, initially, that under our experimental conditions the50% inhibition effect produced by tamoxifen on algal growthrequires concentrations higher by several orders of magnitude(2000–6000 times the IC50) than those found up to now in theenvironment. The result of the algae test did not therefore presagean effect of tamoxifen on the compartment of primary producers,at least on the species considered in our test. The low variabilityof the IC 50 value obtained for each of the 3 species indicatedthe good reproducibility of the test. It was nonetheless noteworthythat the culture media used (LC and TAP) were enriched with nutri-tive substances capable of stimulating growth and masking possi-ble toxic effects. It might be interesting to perform a growth test ina more oligotrophic medium (e.g. an ISO medium) to go further inthe assessment of the risk of tamoxifen for the algal compartment.
Regarding the reproduction of D. magna, the concentrations forwhich an effect was measured in our works remained fairly high(absence of effect below 120 lg L�1). Previous studies show thatdaphnia reproduction can, however, be inhibited by lower concen-trations. Indeed, Della Greca et al. (2007), obtained an EC50 for thereproduction of Cerodaphnia dubia of 0.81 lg L�1 tamoxifen. This
aa
b bb
c
d
e
d
d;f d;ff
0
5
10
15
20
25
30
35
40
45
0 25 50 75 100 200
Filt
rati
on
rat
e (m
L/d
ay/d
aph
nia
)
Tamoxifen concentration (µg/L)
F 0-24h
F 24-48h
Fig. 1. Filtration rate (F: mL/day/daphnid) of daphnids exposed to tamoxifen(lg L�1) ± standard deviation. Letters indicate a significant difference betweenconcentrations (Student-t test, p value = 0.05; n = 3).
Table 3Number of daphnids produced during 21 d of tamoxifen exposure to increasing tamoxifen concentrations. (a – b Student-t Test; p value = 0.05).
Tamoxifen concentration (lg L�1) 0 5 15 30 60 120
Number of neonates per mother 64.22a 59.70a; b 62.70a 63.90a 62.67a 55.44b
Standard deviation 5.38 4.32 6.09 5.76 3.35 6.27
Table 4Ecotoxicity data for tamoxifen available in literature and in this study.
Reference Species Parameter Endpoint Value (lg L�1)
EPA ECOTOX DATABASE A. tonsa Invertebrate Development LOEC 49X. laevis Vertebrate Reproduction (atretic follicle stage) LOEC 3.7
Della Greca et al. (2007) B. calyciflorus Invertebrate Mortality LC50 24 h 970Reproduction EC50 48 h 250
T. platyurus Invertebrate Mortality LC50 24 h 400D. magna Invertebrate Immobilization EC50 24 h 1530C. dubia Invertebrate Reproduction EC50 7 d 0.81
Sun et al. (2007) O. latipes Vertebrate Plasmatic vitelogenin LOEC 1This study P. subcapitata Algae Growth inhibition IC50 980
C. culgaris Algae Growth inhibition IC50 610C. reinhardtii Algae Growth inhibition IC50 470D. magna Invertebrate Immobilization EC50 48 h 210
Filtration rate EC50 24 h 104Reproduction
D. rerio Vertebrate Embryo lethality
82 F. Orias et al. / Chemosphere 128 (2015) 79–84

difference of sensitivity between the two species of daphnia none-theless requires verification by other tests. It is noteworthy thatthe measure of the effect of tamoxifen on daphnia grazing demon-strated that this parameter is more sensitive than the two othertested here. Indeed, we observed significant effects as from 24 hof exposure at relatively low concentrations (50 lg L�1).Bengtsson et al. (2004) also suggested the importance of consider-ing the impact of contaminants on sub-lethal parameters (e.g.grazing, locomotion, etc.).
The lower effect on reproduction after 48 h exposure could havebeen due to the adsorption of part of the tamoxifen on organicmatter accumulating in the medium (i.e. carapace residues, senes-cent algae, etc.). This adsorption of dissolved tamoxifen could alsoexplain the absence of effect measured in the ‘‘chronic daphnia’’experiment. The high algal density could have led to the ‘‘seques-tration’’ of tamoxifen making it less bioavailable for the daphnia.
Regarding tamoxifen toxicity towards fish embryos, Sun et al.(2007) observed significant effects on hatchability and time tohatching of Japanese medaka exposed to tamoxifen in the concen-tration range of 125–625 lg L�1, but for a longer exposure time(14 d) than in the present work and with daily renewal of the expo-sure medium. In another study carried out on sea urchin, Paganoet al. (2001) showed both embryo mortality and developmentaldefects in a concentration range similar to that used in our study,but with tamoxifen citrate, which is known to be more bioavailablethan tamoxifen.
4.2. Ecotoxicological effects linked to tamoxifen
Before our works, no data on the ecotoxicity of tamoxifen forphotosynthetic organisms was available in spite of their funda-mental role in ecosystem functioning. In addition, only crustaceans(Brachionus calyciflorus and Cerodaphnia dubia) had undergonechronic tests. However, other ecotoxicity tests have been per-formed with a compound close to tamoxifen, namely tamoxifencitrate (Williams et al., 2007; Mater et al., 2014). This drug (activeprinciple + excipient) is prescribed to patients with breast cancer.The chemical form of tamoxifen citrate is more soluble in waterthan that of tamoxifen. This increase in solubility is accompanied
with an increase in the bioavailability of tamoxifen, implying con-sequences for its ecotoxicity. Thus the ecotoxicity values of thedrug and its active principle can be potentially different. That iswhy the ecotoxicity values obtained by these authors were notused to calculate the PNEC of tamoxifen. It is noteworthy thatanother value from the literature was not used to calculate thePNEC, i.e. ecotoxicity data on S. Purpuratus (US EPA database), sincethe latter is a marine species and we only focused on freshwaterspecies in our calculation of PNEC for continental hydrosystems.
Pharmacodynamics must also be taken into account in the caseof drugs. When a patient undergoes medicinal treatment, they areadministered the active principle and excipients (e.g. tamoxifencitrate). However, the patient does not excrete the drug (activeprinciple + excipients) but the active principle and its metabolites(e.g., tamoxifen-OH or endoxifen for tamoxifen). Thus, what isfound in urban discharges and, finally, in the environment, is theactive principle, its metabolites and possibly transformation prod-ucts. Therefore the ecotoxicity tests performed on drugs (activeprinciples + excipient), are not pertinent as such for assessing eco-toxicological risks linked to a drug. According to us, they should beperformed on active ingredients AND their metabolites. Such testscan also be used only in the case where it is proven that the excip-ient can be excreted.
The data available concerning tamoxifen concentrations mea-sured in the hydrosystems of different countries (Table 4) allowedthe calculation of 4 risk quotients (RQ) with two higher than 1(Table 5). Indeed, in China and United Kingdom, highest RQ’s calcu-lated are respectively 1.59 and 2.6. It should be noted that tamox-ifen has been little subject to detection in the environment giventhe scarcity of tamoxifen measures in comparison to other phar-maceutical residues (e.g. diclofenac, ibuprofen, paracetamol, etc.).
Furthermore it should be remembered that the calculation ofthe PNEC used here (European Chemical Bureau (ECB), 2003) doesnot take into account indirect ecotoxicity linked to bioaccumula-tion. However, recent works have identified tamoxifen as beingespecially bioaccumulable and poorly biodegradable (Jean et al.,2012). Lastly, it is noteworthy that we did not calculate the RQfor sediments in spite of the availability of an environmental mea-sure since no ecotoxicity test on sedimentary organisms (e.g. theostracod Heterocypris incongurens and the dipterous insect Chiron-omus riparus) has ever been performed.
5. Conclusion
The present work first permitted enriching knowledge on theecotoxicity of tamoxifen. A relatively strong value of its PNEC forfreshwater ecosystems (81 ng L�1) was calculated using the eco-toxicity data obtained. Using this basis, and following a study ofthe different contexts of contamination taken from the interna-tional literature, it was shown that tamoxifen could present a sig-nificant ecotoxicological risk for local aquatic ecosystems. In one ofthe situations studied (Roberts and Thomas, 2006), the Risk Quo-tient calculated was close to 3.
On the methodological level, in order to improve ecotoxicitytests for very hydrophobic compounds (logKow > 4), it seems nec-essary to improve the experimental protocols of the usual stan-dards, in particular for hydrophobic compounds. For example,regarding the chronic ecotoxicity tests, such as the 21-d D. magnatest, daphnia could be left to develop in a medium without algae.Daphnia could then be fed in isolation during the time requiredin a medium saturated in algae without contaminant. Thus thecontaminant would be less adsorbed on the algae and the daphniawould be exposed to a concentration close to the nominal concen-tration. Another possibility would be to increase the frequency ofrenewal of the exposure medium at the beginning of the experi-
0102030405060708090
100
96h
Em
bryo
mor
talit
y (%
)
Tamoxifen concentration (mg/L)
Fig. 2. Percentage of mortality in zebrafish embryos after 96 h of exposure. Each barcorresponds to the mean of 3 different experimentations ± SEM.
Table 5Risk quotients calculated for the 4 sites studied.
Country River Risk quotient Min–Max
Spain Ebro River 0.153–0.248China Yangtze Estuary 1.48–1.59UK Lower Tyne River 0.33–2.6France Gardon River <0.07–0.3
F. Orias et al. / Chemosphere 128 (2015) 79–84 83

ment to ‘‘saturate’’ the adsorption sites of the contaminant on thewalls of the containers used.
It is now necessary to implement this type of approach for otherpharmaceutical residues present at significant levels in the envi-ronment. Indeed, we lack the minimum ecotoxicity data requiredto assess the risks they present in various contexts (e.g. smalland large rivers, major rivers, estuaries, etc.).
Acknowledgments
The authors thank the SIPIBEL field observatory on hospitaleffluents and urban wastewater treatment plants, the EuropeanUnion, the Rhone-Mediterranean Corsica Water Agency, theRhône-Alpes Region, the Ministries of Health and the Environment,the Regional Office of Health, and the General Council ofHaute-Savoie for their support.
Appendix A. Supplementary material
Supplementary data associated with this article can be found, inthe online version, at http://dx.doi.org/10.1016/j.chemosphere.2015.01.002.
References
AFNOR, 1980. Détermination de l’inhibition de la croissance de Scenedesmussubspicatus par une substance.
Bengtsson, G., Hansson, L.-A., Montenegro, K., 2004. Reduced grazing rates inDaphnia pulex caused by contaminants: Implications for trophic cascades.Environ. Toxicol. Chem. 23, 2641–2648.
Clément, B., Zaid, S., 2004. A new protocol to measure the effects of toxicants ondaphnid–algae interactions. Chemosphere 55, 1429–1438.
Coetsier, C.M., Spinelli, S., Lin, L., Roig, B., Touraud, E., 2009. Discharge ofpharmaceutical products (PPs) through a conventional biological sewagetreatment plant: MECs vs PECs? Environ. Int. 35, 787–792.
Collado, N., Rodriguez-Mozaz, S., Gros, M., Rubirola, A., Barceló, D., Comas, J.,Rodriguez-Roda, I., Buttiglieri, G., 2014. Pharmaceuticals occurrence in a WWTPwith significant industrial contribution and its input into the river system.Environ. Pollut. 185, 202–212.
Della Greca, M., Iesce, M.R., Isidori, M., Nardelli, A., Previtera, L., Rubino, M., 2007.Phototransformation products of tamoxifen by sunlight in water. Toxicity of thedrug and its derivatives on aquatic organisms. Chemosphere 67, 1933–1939.
Elendt, B.P., Bias, W.R., 1990. Trace nutrient deficiency in Daphnia magna cultured instandard medium for toxicity testing. Effects of the optimization of cultureconditions on life history parameters of D. magna. Water Res. 24, 1157–1167.
European Chemical Bureau (ECB), I. I. 2003. Technical Guidance Document (TGD) insupport of Commission Directive 93/67/EEC on Risk Assessment for newnotified substances, Commission Regulation (EC) No 1488/94 on RiskAssessment for existing substances and Directive 98/8/EC of the EuropeanParliament and of the Council concerning the placing of biocidal products onthe market.
Gauld, D.T., 1951. The grazing rate of planktonic copepods. J. Mar. Biol. Assoc. U. K.29, 695–706.
Gibs, J., Stackelberg, P.E., Furlong, E.T., Meyer, M., Zaugg, S.D., Lippincott, R.L., 2007.Persistence of pharmaceuticals and other organic compounds in chlorinateddrinking water as a function of time. Sci. Total Environ. 373, 240–249.
Gorman, D.S., Levine, R.P., 1965. Cytochrome f and plastocyanin: their sequence inthe photosynthetic electron transport chain of Chlamydomonas reinhardi. Proc.Natl. Acad. Sci. 54, 1665–1669.
Halling-Sørensen, B., Nors Nielsen, S., Lanzky, P.F., Ingerslev, F., Holten Lützhøft,H.C., Jørgensen, S.E., 1998. Occurrence, fate and effects of pharmaceuticalsubstances in the environment – a review. Chemosphere 36, 357–393.
Heath, E., Kosjek, T., Farre, M., Quintana, J.B., de Alencastro, L.F., Castiglioni, S., Gans,O., Langford, K., Loos, R., Radjenovic, J., Rocca, L.M., Budzinski, H., Tsipi, D.,Petrovic, M., Barcelo, D., 2010. Second interlaboratory exercise on non-steroidalanti-inflammatory drug analysis in environmental aqueous samples. Talanta 81,1189–1196.
Heberer, T., 2002. Occurrence, fate, and removal of pharmaceutical residues in theaquatic environment: a review of recent research data. Toxicol. Lett. 131, 5–17.
ISO, 1995. Qualité de l’eau - Détermination de la mobilité de Daphnia magna Straus,Cladocera, Crustacea, essai de toxicité aiguë.
Jean, J., Perrodin, Y., Pivot, C., Trepo, D., Perraud, M., Droguet, J., Tissot-Guerraz, F.,Locher, F., 2012. Identification and prioritization of bioaccumulablepharmaceutical substances discharged in hospital effluents. J. Environ.Manage. 103, 113–121.
Joss, A., Keller, E., Alder, A.C., Göbel, A., McArdell, C.S., Ternes, T., Siegrist, H., 2005.Removal of pharmaceuticals and fragrances in biological wastewater treatment.Water Res. 39, 3139–3152.
Kümmerer, K., 2009. The presence of pharmaceuticals in the environment due tohuman use – present knowledge and future challenges. J. Environ. Manage. 90,2354–2366.
Lajeunesse, A., Gagnon, C., Gagné, F., Louis, S., Cejka, P., Sauvé, S., 2011. Distributionof antidepressants and their metabolites in brook trout exposed to municipalwastewaters before and after ozone treatment – evidence of biological effects.Chemosphere 83, 564–571.
Lalumera, G.M., Calamari, D., Galli, P., Castiglioni, S., Crosa, G., Fanelli, R., 2004.Preliminary investigation on the environmental occurrence and effects ofantibiotics used in aquaculture in Italy. Chemosphere 54, 661–668.
Langford, K.H., Thomas, K.V., 2009. Determination of pharmaceutical compounds inhospital effluents and their contribution to wastewater treatment works.Environ. Int. 35, 766–770.
Larsson, D.G.J., de Pedro, C., Paxeus, N., 2007. Effluent from drug manufacturescontains extremely high levels of pharmaceuticals. J. Hazard. Mater. 148, 751–755.
Loos, R., Locoro, G., Comero, S., Contini, S., Schwesig, D., Werres, F., Balsaa, P., Gans,O., Weiss, S., Blaha, L., Bolchi, M., Gawlik, B.M., 2010. Pan-European survey onthe occurrence of selected polar organic persistent pollutants in ground water.Water Res. 44, 4115–4126.
López-Serna, R., Petrovic, M., Barceló, D., 2012. Occurrence and distribution ofmulti-class pharmaceuticals and their active metabolites and transformationproducts in the Ebro River basin (NE Spain). Sci. Total Environ.
Mater, N., Geret, F., Castillo, L., Faucet-Marquis, V., Albasi, C., Pfohl-Leszkowicz, A.,2014. In vitro tests aiding ecological risk assessment of ciprofloxacin, tamoxifenand cyclophosphamide in range of concentrations released in hospitalwastewater and surface water. Environ. Int. 63, 191–200.
OECD, 1998. OECD GUIDELINES FOR TESTING OF CHEMICALS: Daphnia magnaReproduction Test.
OECD, 2006. OECD GUIDELINES FOR THE TESTING OF CHEMICALS: Freshwater Algaand Cyanobacteria, Growth Inhibition Test.
OECD, 2013. OECD GUIDELINES FOR TESTING OF CHEMICALS: Fish Embryo AcuteToxicity (FET) Test.
Pagano, G., de Biase, A., Deeva, I.B., Degan, P., Doronin, Y.K., Iaccarino, M., Oral, R.,Trieff, N.M., Warnau, M., Korkina, L.G., 2001. The role of oxidative stress indevelopmental and reproductive toxicity of tamoxifen. Life Sci. 68, 1735–1749.
Roberts, P.H., Thomas, K.V., 2006. The occurrence of selected pharmaceuticals inwastewater effluent and surface waters of the lower Tyne catchment. Sci. TotalEnviron. 356, 143–153.
Silva, B.F.d., Jelic, A., López-Serna, R., Mozeto, A.A., Petrovic, M., Barceló, D., 2011.Occurrence and distribution of pharmaceuticals in surface water, suspendedsolids and sediments of the Ebro river basin, Spain. Chemosphere 85, 1331–1339.
Sun, L., Zha, J., Spear, P.A., Wang, Z., 2007. Tamoxifen effects on the early life stagesand reproduction of Japanese medaka (Oryzias latipes). Environ. Toxicol.Pharmacol. 24, 23–29.
Ternes, T.A., 1998. Occurrence of drugs in German sewage treatment plants andrivers. Water Res. 32, 3245–3260.
US EPA database. http://www.epa.gov/ecotox/; last access 01/03/14.Verlicchi, P., Galletti, A., Petrovic, M., Barceló, D., 2010. Hospital effluents as a source
of emerging pollutants: an overview of micropollutants and sustainabletreatment options. J. Hydrol. 389, 416–428.
Williams, T.D., Caunter, J.E., Lillicrap, A.D., Hutchinson, T.H., Gillings, E.G., Duffell, S.,2007. Evaluation of the reproductive effects of tamoxifen citrate in partial andfull life-cycle studies using fathead minnows (Pimephales Promelas). Environ.Toxicol. Chem. 26, 695–707.
Yang, Y., Fu, J., Peng, H., Hou, L., Liu, M., Zhou, J.L., 2011. Occurrence and phasedistribution of selected pharmaceuticals in the Yangtze Estuary and its coastalzone. J. Hazard. Mater. 190, 588–596.
Zenker, A., Cicero, M.R., Prestinaci, F., Bottoni, P., Carere, M., 2014. Bioaccumulationand biomagnification potential of pharmaceuticals with a focus to the aquaticenvironment. J. Environ. Manage. 133, 378–387.
Zhang, J., Chang, V.W.C., Giannis, A., Wang, J.-Y., 2013. Removal of cytostatic drugsfrom aquatic environment: a review. Sci. Total Environ. 445–446, 281–298.
Zhou, J.L., Zhang, Z.L., Banks, E., Grover, D., Jiang, J.Q., 2009. Pharmaceutical residuesin wastewater treatment works effluents and their impact on receiving riverwater. J. Hazard. Mater. 166, 655–661.
84 F. Orias et al. / Chemosphere 128 (2015) 79–84

CHAPITRE 6. EVALUATION DU RISQUE ÉCOTOXICOLOGIQUE DU TAMOXIFEN
6.3 Synthèse
En ne s’intéressant qu’au risque écotoxicologique direct (hors bioaccumulation), on ob-serve que le tamoxifen présente déjà un risque pour les écosystèmes aquatiques. En effet,à plusieurs endroits dans le monde où le tamoxifen a été détecté, le quotient de risque estsupérieur à 1.
Dans la partie suivante de ce manuscrit, nous allons mesurer dans quelle mesure le ta-moxifen, déjà identifié comme écotoxique, peut se transférer et se concentrer dans une chaînealimentaire expérimentale.
105


Troisième partie
ETUDE EXPERIMENTALE DUTRANSFERT TROPHIQUE D’UNRESIDU PHARMACEUTIQUE
MODELE
107


Il est aujourd’hui possible d’évaluer la bioconcentrabilité d’une molécule sur la base deses propriétés physico-chimiques. Cependant, la bioaccumulation ou la bioamplification sontplus difficiles à aborder par la seule modélisation. Ainsi, pour répondre à la problématiquede transfert des RP dans les réseaux trophiques, nous avons mis en place une chaîne alimen-taire artificielle et cloisonnée. Nous avons choisi trois espèces modèles représentatives de 3niveaux trophiques différents (Figure 6.1) que nous avons alternativement exposées ou nonau contaminant via l’alimentation et/ou via le milieu (l’eau en l’occurrence) :
– Un producteur primaire : Pseudokirchneriella subcapitata, une algue unicellulaire dela famille des Chlorophycées.
– Un consommateur primaire : Daphnia magna, un crustacé de la famille des Clado-cères.
– Un consommateur secondaire : Danio rerio, un poisson tropical de la famille desCyprinidés.
Figure 6.1 Schéma conceptuel de la chaîne alimentaire artificielle étudiée
Une fois établie notre chaîne alimentaire modèle, il a fallu déterminer un contaminantmodèle. Nous avons choisi le tamoxifen pour 3 raisons majeures : (i) il fait partie de la listedes 14 composés prioritaires (ii) il a déjà été détecté plusieurs fois dans l’Environnement, (iii)il est analysable dans l’eau (chromatographie) et dans les organismes (isotopie).
109

Le problème majeur auquel nous avons été confrontés au moment d’entamer nos travauxsur la bioaccumulation du tamoxifen était d’ordre analytique. En effet, les protocoles d’extrac-tion et d’analyse sur des matrices biologiques complexes (e.g. algues, cuticule, tissu,...) sontrarement disponibles pour les résidus pharmaceutiques. Au moment d’entamer nos études,ces protocoles n’existaient pas pour le tamoxifen. Au moment où ce manuscrit est rédigé, cesprotocoles n’existent toujours pas pour les cellules algales. Ainsi, nous avons développé uneautre méthode analytique pour étudier la bioaccumulation du tamoxifen dans toutes les ma-trices biologiques susceptible d’être exposées dans l’environnement. C’est grâce aux isotopesstables que nous sommes parvenus à surmonter notre contrainte analytique.
Laurent SIMON de l’équipe E3S de l’UMR LEHNA a été un acteur majeur dans le dé-veloppement de cette méthode. En effet, le tamoxifen existe sous une forme enrichie en 15Nsans que ses propriétés biologiques ou physico-chimiques ne soient modifiées (Tableau 6.1).Par ailleurs, au sein des organismes vivants, il existe un ratio naturel entre les différentsisotopes stables de l’azote (i.e. 15N/14N). Ainsi, lorsqu’un organisme est exposé au tamoxi-fen 15N, nous avons supposé que le ratio 15N/14N naturel pouvait être modifié en faveur du15N. Au regard des différentes contraintes liées à la nature de notre molécule modèle et denotre molécules analytique, les gammes de concentrations d’exposition ont été guidées parles critères suivants :
– Ne pas dépasser la solubilité du tamoxifen (167 µg/L) pour ne pas qu’il y ait deprécipitation qui pourrait perturber la mesure de bioconcentration.
– Ne pas induire de toxicité pour les organismes pour éviter la confusion d’effet entreécotoxicité directe et bioconcentration et/ou bioaccumulation.
– Ne pas être trop basses pour que les concentrations soient mesurables par HPLCdans l’eau et par isotopie dans les organismes.
Table 6.1 Structure et caractéristiques physico-chimiques du tamoxifen
Nom : Tamoxifen
N CAS : 10540-29-1
Classe thérapeutique : Antinéoplasiques (Classe C)
Solubilité dans l’eau : 167 µg/L
Masse molaire : 371,5146 ± 0,0233 g/mol
Kow : 7,1
pKa : 8,6
110

Par ailleurs, au cours de toutes les expérimentations présentées dans cette partie, nousavons fait un effort particulier pour limiter la présence de plastique dans les contenantsd’exposition. Cet effort a été particulièrement important pour la dernière expérience où despoissons ont été exposés 21 jours au tamoxifen (Figure 6.2). En effet, nous avons utilisé desaquariums en verre monobloc pour éviter la présence de joint en caoutchouc ou en silicone,nous avons chauffé la chambre d’exposition plutôt que l’eau dans laquelle baignaient lespoissons pour limiter l’adsorption sur d’éventuels dispositifs de chauffage immergés et enfinnous avons effectué plusieurs renouvellements du milieu pour maintenir la concentrationd’exposition la plus proche possible de la concentration nominale.
Figure 6.2 Photographie de l’expérience « bioconcentration poisson » installée à l’Ecoaquatron, surle site de la Doua à Villeurbanne.
Dans les chapitres suivants, nous présentons les résultats obtenus concernant la biocon-centration et la bioaccumulation du tamoxifen 15N mesurées grâce à notre méthode isotopiquedans les trois organismes présentés ci-avant.
111

112

Chapitre 7
Bioconcentration du 15N tamoxifenchez Pseudokirchneriella subcapitata
7.1 Enjeux et démarche
Les algues unicellulaires sont le premier maillon de la chaîne alimentaire dans de nom-breux écosystèmes aquatiques. Ainsi, nous avons choisi ce premier organisme pour répondre ànotre problématique de transfert des RP au sein des écosystèmes. Dans ces premiers travaux,nous avions deux objectifs : (i) déterminer si notre méthode d’analyse utilisant les isotopesstables était viable (ii) déterminer la dynamique de bioconcentration du tamoxifen chez unealgue unicellulaire. Pour cela, nous avons exposé des algues 5 jours à plusieurs concentra-tions en tamoxifen : 1, 10 et 100 µg/L. La teneur dans les algues est ensuite mesurée aprèsquelques minutes d’exposition, à 12h, 24h, 48h, 144h et 168h afin de connaitre la dynamiquede bioconcentration dans ces organismes.
7.2 Article 5 :Experimental assessment of the biocon-centration of 15N-tamoxifen in Pseudokirchneriellasubcapitata
Article soumis le 29 septembre 2014, accepté le 28 novembre 2015 et publié le 15 décembre2015 dans le journal « Chemosphere ».
113

CHAPITRE 7. BIOCONCENTRATION DU 15N TAMOXIFEN CHEZPSEUDOKIRCHNERIELLA SUBCAPITATA
114

Experimental assessment of the bioconcentration of 15N-tamoxifenin Pseudokirchneriella subcapitata
Frédéric Orias ⇑, Laurent Simon, Yves PerrodinUniversité de Lyon, ENTPE, Université Lyon 1, CNRS, UMR 5023 LEHNA, 2 Rue Maurice Audin, 69518 Vaulx-en-Velin, France
h i g h l i g h t s
�We study the bioconcentration oftamoxifen in algae at severalconcentrations.� Tamoxifen concentrations tested are
1, 10 and 100 lg L�1.� We use stable isotopes (14N/15N) in
order to follow the bioconcentration.� We find a bioconcentration factor up
to 27000.
g r a p h i c a l a b s t r a c t
CONTROL
1, 10 or 100 µg/L
TAMOXIFEN15N
a r t i c l e i n f o
Article history:Received 29 September 2014Received in revised form 26 November 2014Accepted 28 November 2014Available online 15 December 2014
Handling Editor: Klaus Kümmerer
Keywords:Pharmaceuticals compounds (PCs)BioconcentrationStable isotopesLabelled pharmaceuticalsPseudokirchneriella subcapitata
a b s t r a c t
Nowadays, pharmaceutical compounds (PC) are ubiquitous in aquatic ecosystems. In addition to directecotoxicity, the bioconcentration of PC in organisms is a phenomenon which could have an impact onthe whole ecosystem. In order to study this phenomenon, we exposed unicellular algae (Pseudokirchneri-ella subcapitata) to 15N-tamoxifen, an anticancer drug labelled with a stable nitrogen isotope used as atracer. By measuring 15N enrichment over time, we were able to measure the increase of tamoxifen con-tent in algae. This enrichment was measured by an elemental analyser coupled with an isotopic ratiomass spectrometer (EA–IRMS). Algal cells were exposed for 7 d to 3 concentrations of tamoxifen: 1, 10and 100 lg L�1. Our result shows a high bioconcentration in algae from the first minutes of contact.The highest bioconcentration factor measured is around 26500. We also observe that bioconcentrationis not linked to the exposure concentration. This study is the first to use stable isotopes in order tomonitor PCs in aquatic organisms such as algae. The use of stable isotopes in ecotoxicology offersinteresting perspectives in the field of contaminant transfer in organisms and along the trophic web.
� 2014 Elsevier Ltd. All rights reserved.
1. Introduction
Nowadays, pharmaceuticals (PCs) are ubiquitous in aquatic eco-systems all over the world: surface water (Roberts and Thomas,2006; Farré et al., 2008), groundwater (Fick et al., 2009), drinking
water (Touraud et al., 2011), sediments (Silva et al., 2011) and biota(Zenker et al., 2014). The main routes of ecosystem pollution by PCsinclude: pharmaceutical manufacturing (formulation, production,etc.) (Sanchez et al., 2011), manure spreading and fish breeding(Halling-Sørensen et al., 1998; Lalumera et al., 2004), and thedischarge of urban effluents (from households and hospitals)(Kümmerer, 2009; Verlicchi et al., 2010). In recent years, improve-ments made to analytic methods have made it possible to detect
http://dx.doi.org/10.1016/j.chemosphere.2014.11.0700045-6535/� 2014 Elsevier Ltd. All rights reserved.
⇑ Corresponding author. Tel.: +33 4 72 04 70 58; fax: +33 4 72 04 77 43.E-mail address: [email protected] (F. Orias).
Chemosphere 122 (2015) 251–256
Contents lists available at ScienceDirect
Chemosphere
journal homepage: www.elsevier .com/locate /chemosphere

PCs at ever lower concentrations. At these environmental concentra-tions, the risk for ecosystems generally is not from direct ecotoxicitybut from indirect ecotoxicity via the bioconcentration phenomenon.The PCs generally measured are the most consumed in a given area(Calamari et al., 2003; Wiegel et al., 2004; Loos et al., 2009) whilenumerous other parameters may be more relevant than drug con-sumption. Among these parameters are excretion rate of a givendrug, PC persistence and bioaccumulability. Indeed, PCs and otheremerging ecotoxic contaminants can lead to bioconcentrations highenough to endanger the organisms exposed (Lajeunesse et al., 2011).In a previous study, Jean et al. (2012) determined 14 priority PCs inhospital wastewater on the basis of three criteria: bioaccumulability,biodegradability and their consumption inside hospitals.
These priority PCs include tamoxifen (N� CAS 10540-29-1)which has already been measured in aquatic ecosystems atamounts ranging from a few ng L�1 to several hundred ng L�1 insurface water, and also at several hundred ng L�1 in sediments(Roberts and Thomas, 2006; Coetsier et al., 2009; Yang et al.,2011; López-Serna et al., 2012). Tamoxifen is an anticancer drugused to treat breast cancer. Considering the physicochemical prop-erties of tamoxifen, it can theoretically bioconcentrate 385000times in organisms (Jean et al., 2012). Thus it is necessary to studyhow this kind of contaminant is transferred along the trophic chain.
In this paper, we present the results of an experimental study ofthe bioconcentration of a pharmaceutical compound, tamoxifen, inthe unicellular algae Pseudokirchneriella subcapitata (Chlorophy-ceae), an organism commonly used in ecotoxicology. To our knowl-edge, this is the first time that isotopic chemistry rather thananalytical chemistry and radioactivity has been used to monitor aPC. Indeed, tamoxifen, and PCs in general, are very difficult if notimpossible to analyse in a biological matrix using classical analysismethods (e.g. HPLC–MS/MS), especially due to the extraction step.They require large quantities of biomass (at least several mg) andthere is often a significant loss of contaminant which preventsworking at concentrations close to environmental ones. In orderto study bioconcentration, we used 15N tamoxifen which has thesame chemical behaviour as classical tamoxifen and which is usu-ally used as a standard in analytical chemistry. Consequently, wecould use elementary analysis associated with mass spectrometry(EA–IRMS) to monitor the presence of tamoxifen in algae due to itsenrichment by 15N. Thus we were not limited by the nature of thematrix and the sample mass was limited to 1 mg down to 50 lg ofdry biomass depending on the nitrogen content.
In this work, we used 15N tamoxifen in order to observe howalgae, the first link in numerous food chains, adsorbs and/orabsorbs this compound through time. To do this, we exposed algalsolutions to 1, 10 and 100 lg L�1 of 15N tamoxifen for seven days.
2. Materials and methods
2.1. Algal culture
P. subcapitata (Ps), a green algae (Chlorophyceae), was culti-vated under 3000 lux 16 h d�1 at 20 ± 1 �C in oligo L.C. medium(AFNOR, 1980). The media and flasks were autoclaved (120 �C,1 bar, 20 min) before reinoculation. In order to calculate the algalbiomass in each replicate, we multiplied the algal density mea-sured with a particle counter (Coultronics, model Z1, threshold size3.6 lm) by the average weight of an algal cell (20 pg/cell) proposedby the OECD guideline (OECD, 2006).
2.2. Toxicant
Tamoxifen 15N13C2 (see Fig. 1) was purchased from Sigma–Aldrich chemical (ST QUENTIN FALAVIER, FRANCE), prepared inmethanol (1 g L�1) and kept in glass ampoule at �20 �C.
2.3. Algal exposure to 15N tamoxifen
We managed this exposure in three steps corresponding to thethree concentrations tested with a control in each step: (i)0–100 lg L�1; (ii) 0–10 lg L�1 and (iii) 0–1 lg L�1. The exposuremedium corresponded to the culture medium but diluted 5 timesto enhance the nitrogen contrast. For the concentrations of 100and 10 lg L�1 tested, we directly introduced 15 lL and 1.5 lL ofstock solution (1 g L�1), respectively. However, for the 0–1 lg L�1
step, we introduced 1.5 mL from a solution with a concentrationof 100 lg L�1 (in water) in each contaminated Erlenmeyer flaskin order to obtain a concentration of 1 lg L�1. It should be notedthat the highest concentration of methanol in experiments is0.01%. For each step, we had 18 contaminated replicas (withconcentrations of 1, 10 and 100 lg L�1) and 18 controls withoutcontaminant. Each replica correspond to an Erlenmeyer flaskcontaining 150 mL of medium with an algal density of600000 cells mL�1 (90 � 106 cells all in all). The 36 Erlenmeyerflasks were placed on a rotation table at 3000 lux, 20 �C ± 1 �C, witha photoperiod of 16 h d�1. Immediately after exposure, at 12 h,24 h, 48 h, 144 h and 168 h, three contaminated Erlenmeyer flasksand three controls were removed. We measured the pH and algaldensity was determined with a particle counter (Coultronics,model Z1, threshold size 3.6 lm). Then, the algae were centrifugedfor 20 min at 3000 rpm (1600 G) in glass tubes. The pellets werethen transferred inside a plastic 1 mL Eppendorf tube and plungedinto liquid nitrogen for five minutes. Finally, the Eppendorf tubeswere placed in a lyophilizer for 48 h at �85 �C and 0.01 mbar.
2.4. 15N measurements
After freeze-drying, the algae samples were weighed at 1 mg intin capsules before analysis. Nitrogen concentration and 15N/14Nratio were measured using an isotope ratio mass spectrometer(Isoprime 100, Isoprime Ltd., Manchester, UK) coupled in continu-ous flow with an elemental analyser (FlashEA 1112 ThermoElectron, Milan, Italy). F-aspartic acid was used to calibrate the Nconcentration measurements. For the isotope ratio measurements,a two-point normalization of the values measured was performedusing international reference material IAEA-N1 and IAEA-305following IUPAC guidelines. The 15N/14N ratio were expressed asd15N in ‰ relative to atmospheric N2 (Air):
d15N ¼ 15N=14Nsample=15N=14NAir � 1
� �� 103
and converted to atomic fraction (i.e. atomic%, Coplen, 2011):
x 15N� �
¼ ð15N=15NsampleÞ= 1þ 15N=14Nsample� �
In-house standards calibrated against IAEA-N1 and IAEA-N2were interspersed within the samples and the standard deviationsfor the replicate analyses were lower than 0.2‰.
2.5. Calculation of excess 15N and tamoxifen concentration
Excess 15N concentration, [15N] was calculated from thedifference between the 15N fraction (x(15N)) of algae exposed to
Name: TamoxifenN°CAS: 10540-29-1 Water solubility: 167 µg/L Kow: 7.1 pKa: 8.6
Fig. 1. Physico-chemical properties and topological formula of tamoxifen.
252 F. Orias et al. / Chemosphere 122 (2015) 251–256

15N-tamoxifen and the 15N fraction (x(15N)control) measured in thecontrol treatment, without exposure, as follows:
½15N� ¼ xð15NÞ � xð15NÞcontrol
� �� ½N�;
where [N] is the N concentration in the sample.As 15N-tamoxifen was the only 15N tracer source in the
experiment, and assuming no significant dissociation of tamoxifenby chemical reactions or metabolic pathways (under ourexperimental conditions (DellaGreca et al., 2007)), the tamoxifenconcentration was calculated from the 15N concentration:
½Tamoxifen�ðlg � g�1Þ ¼ ½15N�=15 �MTamoxifen � 106:
with Mtamoxifen (374.49 g mol�1) being the molar mass of [13C, 15N]-tamoxifen.
A detection limit of tamoxifen in algae of 0.5 lg g�1 was calcu-lated using this equation from the detection limit of 15N/14N ratiodifference, which is less than 0.2‰.
2.6. Bioconcentration factor calculation
Bioconcentration factors (BCF) are calculated according to thefollowing equation:
BCF ¼ Tamoxifen content in algae ðg kg�1ÞMedium tamoxifen concentration ðg kg�1Þ
3. Results
3.1. Evolution of algal biomass and pH during experiments
Fig. 2 shows the kinetics of the algal biomass through time.Algal growth began with a classically observed exponential phasebefore stabilisation at 6 d when all the nutrients had been con-sumed. It is noteworthy that we observed no effect of tamoxifenon algal growth in our experiments.
Fig. 3 shows the evolution of pH during the experiments.Regarding pH, we observed that alkalinity peaked at 9.2 at 48 h,before decreasing slightly and stabilising between 8.2 and 8.5.Interestingly, at 48 h, during the peak, variability was particularlyhigh compared to the other points.
3.2. Kinetics of 15N tamoxifen content in algae
3.2.1. Algae exposed to 100 lg L�1 (Fig. 4)As soon as the first minutes of exposition, we observed a high
tamoxifen content in the algae (up to 1000 lg g�1 DW namely10000 times more than the nominal medium concentration). Then,during the first 24 h, we observed a rapid increase of the algaetamoxifen content which peaked at 24 h with a maximum of
26000 times more tamoxifen in the algae (2.67 mg g�1 DW) thanin water. Finally, in the third part of the curve, the contentdecreased until concentrations stabilized but at still high contentsin the algae (between 553 and 527 lg g�1 DW).
3.2.2. Algae exposed to 10 lg L�1 (Fig. 5)In this treatment, we can observe nearly the same kinetics of
bioconcentration of tamoxifen. Indeed, we have a great contentduring the first minutes of contact (96.9 lg g�1 DW), then a peak(around 220 lg g�1 DW) and finally a stable content (between 55and 59 lg g�1 DW). It should be noted that the content in algae,whatever the time, is approximately 10 times lower in algaeexposed to 100 lg L�1.
3.2.3. Algae exposed to 1 lg L�1 (Fig. 5)For the ‘‘1 lg L�1’’ treatment (Fig. 6), the variability around the
average values is greater than for the ‘‘10 lg L�1’’ and ‘‘100 lg L�1’’treatments. Moreover, the factor 10 that have be seen between‘‘10 lg L�1’’ and ‘‘100 lg L�1’’ is higher here (around 25). However,despite the high variability, the shape of kinetics of tamoxifen inalgae at 1 lg L�1 is similar compared ‘‘10 lg L�1’’ treatment witha progressive increase from 4 lg g�1 at t = 0 to approximately7 lg g�1 between 12th and 48th h. At the end of the experiment,tamoxifen content in algae remain constant around 2 lg g�1.
3.3. Mass balance and BCF calculation
As shown in Fig. 7, we calculated the mass balance through timeto determine how much tamoxifen injected in each replica wasfixed on or in the algae. This mass balance was calculated by mul-tiplying the average algal biomass and the average tamoxifen con-tent at each concentration and at each time. We observed that themass balance was slightly overestimated (up to 20%), especially forthe ‘‘10 lg L�1’’ treatment, maybe because of a difference com-pared to the nominal concentration. However, for the ‘‘1 lg L�1’’
0
5
10
15
20
25
30
35
0 20 40 60 80 100 120 140 160 180
Alga
l bio
mas
s (m
g dr
y w
eigh
t)
Time (hours)
Fig. 2. Algal biomass (mg dry weight) through time (h). Each point represents theaverage biomass for all treatments and at each time (the three controls and 1, 10and 100 lg L�1, thus 6 data for each time). Error bars show standard deviation.
6
6.5
7
7.5
8
8.5
9
9.5
10
0 20 40 60 80 100 120 140 160 180
pH
Time (Hours)
Fig. 3. Evolution of pH through time (h). Each point represents the average biomassfor all treatments and at each time (the three controls and 1, 10 and 100 lg L�1,thus 6 data for each time). Error bars show standard deviation.
0
500
1000
1500
2000
2500
3000
3500
0 20 40 60 80 100 120 140 160 180
Tam
oxife
n co
nten
t in
Times (Hours)
algu
e (µ
g/g
DW
)
Fig. 4. Kinetics of the tamoxifen content in algae (lg tamoxifen/g dry weight)exposed to 100 lg L�1 during 6 d. Error bars show standard deviation.
F. Orias et al. / Chemosphere 122 (2015) 251–256 253

treatment, we obtained only 40% of the nominal content fixed inthe algae. This can be explained by the fact that the algae in thistreatment were exposed to an intermediate dilution. During thisintermediate step, we may have lost part of the tamoxifenintroduced (e.g. by adsorption). We think that the concentrationadsorbed on the glass was the same at each concentration but thatit represented a larger fraction compared to the dose of 1 lg L�1.That is why we were unable to detect this ‘‘loss of adsorption’’ inthe other treatments.
These results showed that the bioconcentration of tamoxifen inthe algae was at equilibrium from 48 h to the end of theexperiment. Thus it was possible to establish experimentalbioconcentration factors (BCF) for each concentration tested.Indeed, BCF are calculable only when the contaminant consideredis at equilibrium between the medium and the organismconsidered. In our case, BCF corresponds to the 3 maximumcontents for 1, 10 and 100 lg L�1, respectively, i.e. ‘‘6900’’,‘‘22400’’ and ‘‘26700’’, respectively.
4. Discussion
4.1. Bioconcentration kinetics of tamoxifen in Pseudokirchneriellasubcapitata
Whatever the treatment, 1, 10 or 100 lg L�1 of tamoxifen, weobserved significant 15N enrichment through time, especially athigher tamoxifen concentrations. This 15N enrichment was directlydue to the adsorption and/or absorption of 15N labelled tamoxifen onand/or inside the algae cells. We can describe the bioconcentrationkinetics observed in our work in four steps:
(i) Step 0: Very high bioconcentration during the first minutesof exposure.
(ii) Step 1: A progressive increase of bioconcentration untilreaching a peak during the first 24 h.
(iii) Step 2: A decrease until stabilisation during the next 24 h.(iv) Step 3: A stabilisation of the tamoxifen content in the algae
during the final days.
These steps were accentuated more or less according totreatment, but the general shape was the same for all theconcentrations tested. Correa-Reyes et al. (2007) studied thebioconcentration kinetics of nonylphenols in a marine microalgae(Isochrysis galbana) and showed that bioconcentration was evenfaster for this kind of contaminant. It reached a maximum stablecontent after only two hours of exposure. In order to explain thedynamics observed in our work, several hypotheses are possible:
(a) Adsorption and desorption beyond the pKa of tamoxifen,which is 8.4. The pH of 8.4 was reached between 48 h and72 h. However, if this desorption were due to tamoxifen ion-isation, the decrease of tamoxifen content in the algaeshould have occurred simultaneously with this change ofpH. But this was not what we observed as there was a lagof 24 h. Moreover, using the mass balancer, we observedthat 100% of the tamoxifen had fixed in and/or on algae.Thus no desorption of tamoxifen occurred beyond the pKa.
(b) Adsorption, absorption then depuration. When examiningonly the evolution of algal content in the algae, it could beplausible that the tamoxifen was first adsorbed, then pro-gressively absorbed and metabolised by the algae since thealgal tamoxifen content decreased. However, tamoxifen isa very stable molecule (DellaGreca et al., 2007). Moreover,it is unlikely that the cellular mechanism of the algae is effi-cient enough to metabolise a human pharmaceutical liketamoxifen, especially in such a short time. Degradationcould also have been due to photolysis. However,DellaGreca et al. (2007) demonstrated that this processwas very long under natural light (only 50% conversion after30 d sunlight exposition).
(c) Adsorption and/or absorption and then dilution in thebiomass. It is this hypothesis which seems the mostprobable explanation for these bioconcentration dynamicsin the algae. Bioconcentration at t = 0 was so fast that weassume the phenomenon involved was adsorption. Then,the bioconcentration process was slower during step 1. Itcould have occurred by progressive adsorption on the cellwall and/or absorption inside the algal cells. It could alsohave been simply due to an increase in pH that increasedthe bioconcentration.
It is noteworthy that none of our interpretations consider thattamoxifen was metabolised. However, even though metabolisationwas improbable due to the fact that it is a very stable molecule
0
50
100
150
200
250
300
0 20 40 60 80 100 120 140 160 180
Tam
oxife
n co
nten
t in
Time (hours)
alga
e (µ
g/g
DW)
Fig. 5. Kinetics of the tamoxifen content in algae (lg tamoxifen/g dry weight)exposed to 10 lg L�1 during 6 d. Error bars show standard deviation.
0.01.02.03.04.05.06.07.08.09.0
10.0
0 20 40 60 80 100 120 140 160 180
Tam
oxife
n co
nten
t in
Time (hours)
alga
e (µ
g/g
DW)
Fig. 6. Kinetics of the tamoxifen content in algae (lg tamoxifen/g dry weight)exposed to 1 lg L�1 during 6 d. Error bars show standard deviation.
0%
20%
40%
60%
80%
100%
120%
0 20 40 60 80 100 120 140 160 180
% o
f fixe
d 15
N ta
mox
ifen
Time (hours)
Fig. 7. Percentage of nominal tamoxifen fixed through time for the concentrationstested: with 100 lg L�1 shown by blue diamonds, 10 lg L�1 by red squares and1 lg L�1 by green triangles. Error bars show standard deviation. (For interpretationof the references to colour in this figure legend, the reader is referred to the webversion of this article.)
254 F. Orias et al. / Chemosphere 122 (2015) 251–256

(DellaGreca et al., 2007), we cannot totally exclude partial meta-bolisation during our experiments (e.g., hydrolysis, photolysis,depuration, etc.).
4.2. Theoretical and experimental BCF
The theoretical bioconcentration factors (BCF) of tamoxifenmodelled by QSAR methodology were established according topH and varied within 11900 (pH 7) and 385000 (pH 9) (Jeanet al., 2012). We observed that in our work the maximal BCFmeasured was around 26600 and so within the range modelled.P. subcapitata is not, a priori, a ‘‘target organism’’ of tamoxifen(contrary to human being). This was confirmed by the fact that‘‘algal tamoxifen content/tamoxifen concentration in water’’ ratiosremained almost stable when increasing the tamoxifen concentra-tion in water (22423 at 10 lg L�1 and 26681 at 100 lg L�1). How-ever, this relation can be modified if the organism is a ‘‘target’’ ofthe molecule considered. Jin et al. (2012) studied the bioconcentra-tion of prometryne, a herbicide, on Chlamydomonas reinhardtii(unicellular algae), and observed that the BCF decreased whenthe concentration of prometryne in the medium increased.
Our study is the first to examine the bioconcentration dynamicsof a pharmaceutical compound (PC), in this case an anticancerdrug, in a microalgae. We found only a few other studies in the lit-erature that focused on contaminants in algae (Wang et al., 1996;Jin et al., 2012). Indeed, Correa-Reyes et al. (2007) studied the bio-concentration of nonylphenols, a type of organic molecule used inparticular as a dispersant, on I. galbana, and found a maximum BCFof 6940. For tetrachloroethylene, another organic compound usedin several industrial process, the BCFs were lower, between 100and 300 (Wang et al., 1996). The only study to our knowledge deal-ing with the bioconcentration of PCs in a unicellular algae is that ofVernouillet et al. (2010), in which the BCF of carbamazepine, anantiepileptic, was observed to be almost nil (BCF = 2). The biocon-centration of other PCs (flumequine, oxytetracycline, oxolinic acid)on aquatic plants has been studied (Delépée et al., 2004) but theplants used were bryophytes. The comparison of BCF between mol-ecules and/or organisms is nonetheless still very difficult in eachcase because these values vary greatly according to the organism,molecule and experimental conditions considered (e.g. light, pH,etc.) (Voutsas et al., 2002; Delépée et al., 2004).
However, classically, high adsorption on the beaker walls canoccur with hydrophobic compounds such as tamoxifen. Moreover,the inaccuracy of the tools used could also be responsible for a shiftfrom the nominal concentration. All these phenomena leading tothe reduction of the dissolved tamoxifen concentration could beresponsible for underestimating the experimental BCF. But, in pre-vious studies (data not shown), we’ve already observed a total dis-appearance in few days of dissolved tamoxifen in the mediumcontaining algae, while in beakers without algae, tamoxifen con-centration was still high.
Besides, the theoretical BCF calculated by QSAR takes intoaccount only the influence of pH. But we observed that the BCFsdid not evolve correlatively to the pH during algal growth,especially between 24 and 48 h. It should be noted that we couldnot verify if the highest experimental BCF observed here was thehighest experimental BCF possible. Indeed, after 48 h, all thetamoxifen injected was inside and/or on the algae, thereby limitingbioconcentration. It is reasonable to assume that if we had injecteda higher quantity of tamoxifen, the maximum BCF would havebeen higher and closer to the maximum BCF calculated by QSAR(385000) and perhaps even higher.
Finally, Lajeunesse et al. (2011) recently demonstrated thateven for poorly bioaccumulable compounds, the bioaccumulationof such compounds present in concentrations of around ng L�1 inwater could have an effect on ecosystem organisms like fishes.
Thus it is legitimate to question the impact of highly bioaccumula-ble compounds like tamoxifen, which have already been detectedin the environment at concentrations higher than 200 ng L�1.Zenker et al. (2014) also thought that better consideration ofcompound bioaccumulability in ecotoxicity assessments isfundamental when considering the ubiquity of contaminants inour environment.
4.3. A multi-advantage approach
In order to study the bioconcentration of organic molecules (inopposition to metals), classical measuring methods use eitherradioactive isotopes (Meredith-Williams et al., 2012) or analyticchemistry (e.g. LC–MS/MS (Garcia et al., 2012) or HPLC/MS(Vernouillet et al., 2010). The first leads to evident risks for boththe scientist’s health and that of the studied organisms. The secondis quite expensive, extractions are time consuming and protocols inthe biological matrix with exposure to environmental concentra-tions are available only for very few pharmaceuticals.
In our study, we used stable isotopes to quantify tamoxifenadsorbed and/or absorbed in algal cells. Stable isotopes have longbeen used as tracers in several fields: biogeochemical cycles, plantphysiology (Hama et al., 1983), trophic relations inside ecosystems(Foulquier et al., 2010), contaminant degradation and transferprocesses (Badia-Fabregat et al., 2014; Colabuono et al., 2014),and so forth. Stable isotopes can also be used in human physiology,notably in order to track the fate of pharmaceuticals in the body(Fan et al., 2012) and in palaeoenvironmental (Pucéat et al.,2003; Bajpai et al., 2013) and in paleoecological studies (Amiotet al., 2010).
To our knowledge, the method we used had only been usedonce before to track the bioconcentration of a contaminant (i.e. tet-rachloroethylene) in an organism (i.e. marine unicellular algae)through time (Wang et al., 1996). This analytic method presentsseveral advantages compared to radioactive isotopes and analyticalchemistry. Indeed, the drawbacks linked to the use of radioactiveisotopes (i.e. safety, impact on living organisms) are eliminatedwith this method. In addition, bulk carbon or nitrogen isotopeanalysis by EA–IRMS is generally 1 order of magnitude cheaperthan extraction and analysis using a chromatographic method suchas HPLC–MS on complex matrix. Moreover, it requires lowersample masses (typically 50 lg to 1 mg compared to several mgby HPLC–MS), which is a considerable advantage for researchersworking with small organisms and microorganisms. The two mainadvantages of our method are: (i) no loss of matter since it does notinclude an extraction step; (ii) our method is not limited by thenature of the matrix and so any kind of sample can be analysed(e.g. sediment, biological matrix, etc.).
However, this method has certain disadvantages when studyingthe fate of a molecule. The detection limit using stable isotopelabelling is generally higher (ppm range) than using HPLC–MS(ppb range) because of the natural minor isotope abundance (forexample, 15N/14N is close to 0.003677 in natural substance). Theother main disadvantage is linked more to the compound to bemonitored than to the methodology itself: in-depth knowledge ofthe metabolisation routes and metabolites of the compound stud-ied are necessary in order to know what is being measured. Indeed,as it is an indirect measurement (enrichment of the matrix with astable isotope) one must be sure that not only the labelled part ofthe molecule is measured. Thus, if the compound is metabolisedduring the experiment, the enrichment measured could also bedue to the presence of the labelled atom alone or inside ametabolite. Otherwise, in order to amplify the isotopic ratio andso improve the accuracy and the resolution of the analysis, theexposure medium must be as nitrogen poor as possible, if thelabelled atom used is nitrogen.
F. Orias et al. / Chemosphere 122 (2015) 251–256 255

5. Conclusion
Our works demonstrated that tamoxifen is a highly bioaccumu-lable compound. Indeed, the BCF measured in P. subcapitata wasalways higher than 6900. The highest BCF measured under ourexperimental conditions was around 26600. But 100% of thetamoxifen injected was contained in the algae after 48 h exposure.Therefore it is probable that if more tamoxifen had been injected,the highest BCF would have been even higher. However, no toxiceffects of tamoxifen on algal growth were observed under ourexperimental conditions (maximum 100 lg L�1 during 7 d).
The analysis method used, isotopic chemistry, presentsnumerous advantages compared to the other methods usually usedfor these kinds of studies. It requires very little biomass and it isindifferent to the nature of the matrix studied.
It is now necessary to observe the fate of 15N tamoxifen not onlyin other algal species but also on other organisms like inverte-brates and fishes. Consequently, it will be possible to improveknowledge on the transfer of contaminants in trophic webs.
It could also be interesting in the future to study the fate ofother bioaccumulative contaminants with characteristicscompatible with isotopic chemistry. Diclofenac, acetaminophenand carbamazepine could be interesting candidates (only onenitrogen atom) for a shift from chemical ecotoxicology to isotopicecotoxicology.
Acknowledgments
The authors thank the SIPIBEL field observatory on hospitaleffluents and urban wastewater treatment plants, the EuropeanUnion, the Rhone-Mediterranean Corsica Water Agency, theRhône-Alpes Region, the Ministries of Health and the Environ-ment, the Regional Office of Health, and the General Council ofHaute-Savoie for their support.
References
AFNOR, 1980. Détermination de l’inhibition de la croissance de Scenedesmussubspicatus par une substance.
Amiot, R., Buffetaut, E., Lécuyer, C., Wang, X., Boudad, L., Ding, Z., Fourel, F., Hutt, S.,Martineau, F., Medeiros, M.A., Mo, J., Simon, L., Suteethorn, V., Sweetman, S.,Tong, H., Zhang, F., Zhou, Z., 2010. Oxygen isotope evidence for semi-aquatichabits among spinosaurid theropods. Geology 38, 139–142.
Badia-Fabregat, M., Rosell, M., Caminal, G., Vicent, T., Marco-Urrea, E., 2014. Use ofstable isotope probing to assess the fate of emerging contaminants degraded bywhite-rot fungus. Chemosphere 103, 336–342.
Bajpai, S., Holmes, J., Bennett, C., Mandal, N., Khosla, A., 2013. Palaeoenvironment ofNorthwestern India during the late Cretaceous Deccan volcanic episode fromtrace-element and stable-isotope geochemistry of intertrappean ostracodshells. Global Planet. Change 107, 82–90.
Calamari, D., Zuccato, E., Castiglioni, S., Bagnati, R., Fanelli, R., 2003. Strategic surveyof therapeutic drugs in the Rivers Po and Lambro in Northern Italy. Environ. Sci.Technol. 37, 1241–1248.
Coetsier, C.M., Spinelli, S., Lin, L., Roig, B., Touraud, E., 2009. Discharge ofpharmaceutical products (PPs) through a conventional biological sewagetreatment plant: MECs vs PECs? Environ. Int. 35, 787–792.
Colabuono, F.I., Barquete, V., Taniguchi, S., Ryan, P.G., Montone, R.C., 2014. Stableisotopes of carbon and nitrogen in the study of organochlorine contaminants inalbatrosses and petrels. Mar. Pollut. Bull. 83, 241–247.
Correa-Reyes, G., Viana, M.T., Marquez-Rocha, F.J., Licea, A.F., Ponce, E., Vazquez-Duhalt, R., 2007. Nonylphenol algal bioaccumulation and its effect through thetrophic chain. Chemosphere 68, 662–670.
Delépée, R., Pouliquen, H., Le Bris, H., 2004. The bryophyte Fontinalis antipyreticaHedw. bioaccumulates oxytetracycline, flumequine and oxolinic acid in thefreshwater environment. Sci. Total Environ. 322, 243–253.
DellaGreca, M., Iesce, M.R., Isidori, M., Nardelli, A., Previtera, L., Rubino, M., 2007.Phototransformation products of tamoxifen by sunlight in water. Toxicity of thedrug and its derivatives on aquatic organisms. Chemosphere 67, 1933–1939.
Fan, T.W.M., Lorkiewicz, P.K., Sellers, K., Moseley, H.N.B., Higashi, R.M., Lane, A.N.,2012. Stable isotope-resolved metabolomics and applications for drugdevelopment. Pharmacol. Ther. 133, 366–391.
Farré, M., Petrovic, M., Gros, M., Kosjek, T., Martinez, E., Heath, E., Osvald, P., Loos, R.,Le Menach, K., Budzinski, H., De Alencastro, F., Müller, J., Knepper, T., Fink, G.,
Ternes, T.A., Zuccato, E., Kormali, P., Gans, O., Rodil, R., Quintana, J.B., Pastori, F.,Gentili, A., Barceló, D., 2008. First interlaboratory exercise on non-steroidal anti-inflammatory drugs analysis in environmental samples. Talanta 76, 580–590.
Fick, J., Söderström, H., Lindberg, R.H., Phan, C., Tysklind, M., Larsson, D.G.J., 2009.Contamination of surface, ground, and drinking water from pharmaceuticalproduction. Environ. Toxicol. Chem. 28, 2522–2527.
Foulquier, A., Simon, L., Gilbert, F., Fourel, F., Malard, F., Mermillod-Blondin, F., 2010.Relative influences of DOC flux and subterranean fauna on microbial abundanceand activity in aquifer sediments: new insights from 13C-tracer experiments.Freshwater Biol. 55, 1560–1576.
Garcia, S.N., Foster, M., Constantine, L.A., Huggett, D.B., 2012. Field and laboratoryfish tissue accumulation of the anti-convulsant drug carbamazepine. Ecotoxicol.Environ. Saf. 84, 207–211.
Halling-Sørensen, B., Nors Nielsen, S., Lanzky, P.F., Ingerslev, F., Holten Lützhøft,H.C., Jørgensen, S.E., 1998. Occurrence, fate and effects of pharmaceuticalsubstances in the environment – a review. Chemosphere 36, 357–393.
Hama, T., Miyazaki, T., Ogawa, Y., Iwakuma, T., Takahashi, M., Otsuki, A., Ichimura,S., 1983. Measurement of photosynthetic production of a marine phytoplanktonpopulation using a stable 13C isotope. Mar. Biol. 73, 31–36.
Jean, J., Perrodin, Y., Pivot, C., Trepo, D., Perraud, M., Droguet, J., Tissot-Guerraz, F.,Locher, F., 2012. Identification and prioritization of bioaccumulablepharmaceutical substances discharged in hospital effluents. J. Environ.Manage. 103, 113–121.
Jin, Z.P., Luo, K., Zhang, S., Zheng, Q., Yang, H., 2012. Bioaccumulation and catabolismof prometryne in green algae. Chemosphere 87, 278–284.
Kümmerer, K., 2009. The presence of pharmaceuticals in the environment due tohuman use – present knowledge and future challenges. J. Environ. Manage. 90,2354–2366.
Lajeunesse, A., Gagnon, C., Gagné, F., Louis, S., Cejka, P., Sauvé, S., 2011. Distributionof antidepressants and their metabolites in brook trout exposed to municipalwastewaters before and after ozone treatment – evidence of biological effects.Chemosphere 83, 564–571.
Lalumera, G.M., Calamari, D., Galli, P., Castiglioni, S., Crosa, G., Fanelli, R., 2004.Preliminary investigation on the environmental occurrence and effects ofantibiotics used in aquaculture in Italy. Chemosphere 54, 661–668.
Loos, R., Gawlik, B.M., Locoro, G., Rimaviciute, E., Contini, S., Bidoglio, G., 2009. EU-wide survey of polar organic persistent pollutants in European river waters.Environ. Pollut. 157, 561–568.
López-Serna, R., Petrovic, M., Barceló, D., 2012. Occurrence and distribution ofmulti-class pharmaceuticals and their active metabolites and transformationproducts in the Ebro River basin (NE Spain). Sci. Total Environ.
Meredith-Williams, M., Carter, L.J., Fussell, R., Raffaelli, D., Ashauer, R., Boxall, A.B.A.,2012. Uptake and depuration of pharmaceuticals in aquatic invertebrates.Environ. Pollut. 165, 250–258.
OECD. 2006. OECD guidelines for the testing of chemicals: Freshwater Alga andCyanobacteria, Growth Inhibition Test.
Pucéat, E., Lécuyer, C., Sheppard, S.M.F., Dromart, G., Reboulet, S., Grandjean, P.,2003. Thermal evolution of Cretaceous Tethyan marine waters inferred fromoxygen isotope composition of fish tooth enamels. Paleoceanography 18,1029.
Roberts, P.H., Thomas, K.V., 2006. The occurrence of selected pharmaceuticals inwastewater effluent and surface waters of the lower Tyne catchment. Sci. TotalEnviron. 356, 143–153.
Sanchez, W., Sremski, W., Piccini, B., Palluel, O., Maillot-Maréchal, E., Betoulle, S.,Jaffal, A., Aït-Aïssa, S., Brion, F., Thybaud, E., Hinfray, N., Porcher, J.-M., 2011.Adverse effects in wild fish living downstream from pharmaceuticalmanufacture discharges. Environ. Int. 37, 1342–1348.
Silva, B.F.d., Jelic, A., López-Serna, R., Mozeto, A.A., Petrovic, M., Barceló, D., 2011.Occurrence and distribution of pharmaceuticals in surface water, suspendedsolids and sediments of the Ebro river basin, Spain. Chemosphere 85, 1331–1339.
Touraud, E., Roig, B., Sumpter, J.P., Coetsier, C., 2011. Drug residues and endocrinedisruptors in drinking water: Risk for humans? Int. J. Hyg. Environ. Health 214,437–441.
Verlicchi, P., Galletti, A., Petrovic, M., Barceló, D., 2010. Hospital effluents as a sourceof emerging pollutants: an overview of micropollutants and sustainabletreatment options. J. Hydrol. 389, 416–428.
Vernouillet, G., Eullaffroy, P., Lajeunesse, A., Blaise, C., Gagné, F., Juneau, P., 2010.Toxic effects and bioaccumulation of carbamazepine evaluated by biomarkersmeasured in organisms of different trophic levels. Chemosphere 80, 1062–1068.
Voutsas, E., Magoulas, K., Tassios, D., 2002. Prediction of the bioaccumulation ofpersistent organic pollutants in aquatic food webs. Chemosphere 48, 645–651.
Wang, X., Harada, S., Watanabe, M., Koshikawa, H., Sato, K., Kimura, T., 1996.Determination of bioconcentration potential of tetrachloroethylene in marinealgae by 13C. Chemosphere 33, 865–877.
Wiegel, S., Aulinger, A., Brockmeyer, R., Harms, H., Löffler, J., Reincke, H., Schmidt, R.,Stachel, B., von Tümpling, W., Wanke, A., 2004. Pharmaceuticals in the river Elbeand its tributaries. Chemosphere 57, 107–126.
Yang, Y., Fu, J., Peng, H., Hou, L., Liu, M., Zhou, J.L., 2011. Occurrence and phasedistribution of selected pharmaceuticals in the Yangtze Estuary and its coastalzone. J. Hazard. Mater. 190, 588–596.
Zenker, A., Cicero, M.R., Prestinaci, F., Bottoni, P., Carere, M., 2014. Bioaccumulationand biomagnification potential of pharmaceuticals with a focus to the aquaticenvironment. J. Environ. Manage. 133, 378–387.
256 F. Orias et al. / Chemosphere 122 (2015) 251–256

CHAPITRE 7. BIOCONCENTRATION DU 15N TAMOXIFEN CHEZPSEUDOKIRCHNERIELLA SUBCAPITATA
7.3 Synthèse
Au cours de ces travaux, nous avons, tout d’abord, pour la première fois mis en évidencela fiabilité de notre méthode analytique avec cependant certains biais qui seront explicitésdans la dernière partie de ce document. Nous avons mis en évidence une dynamique debioconcentration très rapide du tamoxifen au sein des cellules algales et obtenu des BCFtoujours supérieurs à 6900 dans nos conditions expérimentales. Il est maintenant nécessaired’étudier cette dynamique chez des organismes de différents niveaux trophiques. Par ailleurs,connaissant désormais la dynamique chez les algues, nous pouvons utiliser ces données pourétudier l’impact du régime alimentaire dans la bioaccumulation d’organisme consommant cesalgues. C’est ce que nous allons présenter dans la partie suivante avec Daphnia magna.
121

CHAPITRE 7. BIOCONCENTRATION DU 15N TAMOXIFEN CHEZPSEUDOKIRCHNERIELLA SUBCAPITATA
122

Chapitre 8
Bioaccumulation du 15N tamoxifenchez Daphnia magna
8.1 Enjeux et démarche
Après avoir étudié la dynamique de bioconcentration du tamoxifen chez les algues, nouspouvons désormais étudier le rôle de ce maillon chez les daphnies qui vont les consommer. Pourcela, nous avons exposé alternativement des daphnies à une alimentation (algues) contaminéeou non dans un milieu contaminé ou non. Nous avons testé deux concentrations dans l’eau :5 et 50 µg/L. Quotidiennement et pendant 5 jours, les daphnies de ces trois concentrationsd’exposition étaient alimentées par des algues contaminées (une seule teneur testée) ou non.Avant et après chaque alimentation, le ratio 15N/14N des daphnies a été mesuré pour évaluerl’enrichissement lié à la bioconcentration ou à la bioaccumulation du tamoxifen.
8.2 Article 6 : Respective contributions of diet andmedium to the bioaccumulation of pharmaceuticalcompounds in the first levels of an aquatic trophicweb
Article soumis le 21 avril 2015 accepté le 13 août 2015 et publié en ligne le 28 août 2015dans le journal « Environmental Science and Pollution Research ».
123

CHAPITRE 8. BIOACCUMULATION DU 15N TAMOXIFEN CHEZ DAPHNIA MAGNA
124

RESEARCH ARTICLE
Respective contributions of diet and mediumto the bioaccumulation of pharmaceutical compounds in the firstlevels of an aquatic trophic web
Frédéric Orias1 & Laurent Simon1& Yves Perrodin1
Received: 21 April 2015 /Accepted: 13 August 2015# Springer-Verlag Berlin Heidelberg 2015
Abstract Nowadays, pharmaceuticals (PCs) are ubiquitousin aquatic ecosystems. It is known that these compounds haveecotoxic effects on aquatic organisms at low concentrations.Moreover, some of them can bioaccumulate inside organismsor trophic webs exposed at environmental concentrations andamplify ecotoxic impacts. PCs can bioaccumulate in twoways: exposure to a medium (e.g., respiration, diffusion,etc.) and/or through the dietary route. Here, we try to assessthe respective contributions of these two forms of contamina-tion of the first two levels of an aquatic trophic web. Weexposed Daphnia magna for 5 days to 0, 5, and 50 μg/L15N-tamoxifen and then fed them with control and contami-nated diets. We used an isotopic method to measure the ta-moxifen content inside the daphnids after several minutes’exposure and every day before and after feeding. We foundthat tamoxifen is very bioaccumulative inside daphnids (BCFup to 12,000) and that the dietary route has a significant im-pact on contamination by tamoxifen (BAF up to 22,000), es-pecially at low concentrations in medium.
Keywords Bioconcentration . Bioaccumulation .
Pharmaceutical compound . Tamoxifen . Stable isotopes
Introduction
Nowadays, pharmaceutical compounds (PCs) are ubiquitousin aquatic ecosystems. Indeed, PCs are found in surface waters(Blair et al. 2013; Fick et al. 2009; Kolpin et al. 2002), ground-water (Barnes et al. 2008; Loos et al. 2010), coastal zone(Claessens et al. 2013; Thomas and Hilton 2004), sediment(Schultz et al. 2010; Vazquez-Roig et al. 2012), and in biota(Zenker et al. 2014) all over the world. They are found atconcentrations ranging from several picrograms per liter toseveral milligrams per liter (Loos et al. 2009). Among thesePCs, bioaccumulative PCs potentially threaten aquatic ecosys-tems due to their bioaccumulation inside organisms and alongtrophic webs (Lajeunesse et al. 2011). These compounds oftenhave a high octanol/water partition coefficient Kow.
Tamoxifen, an anticancer drug used to treat breast cancer, isone of these bioaccumulative PCs (Jean et al. 2012).Tamoxifen is a hydrophobic molecule, having high octanol/water partition coefficients with log Kow up to 7.1. QSARmodels predicted bioconcentration factors between 1650 and385,000 (Jean et al. 2012). This molecule has already beendetected numerous times in the water (several hundred ng/L)and sediments of aquatic ecosystems (Roberts and Thomas2006; Coetsier et al. 2009; Yang et al. 2011; López-Sernaet al. 2012). In previous works, we demonstrated experimen-tally that tamoxifen was highly bioconcentrated in the firstlevel of the aquatic trophic web, with substantial accumulationin unicellular algae when they are exposed to dissolved ta-moxifen in water (Orias et al. 2015). The consumption ofcontaminated food sources (i.e., aquatic primary producersexposed to dissolved tamoxifen) might therefore constitutean important route of exposure for primary consumers.
The aim of this work is to determine experimentally the trans-fer of tamoxifen between a primary producer (photosyntheticalgae) and a primary consumer (Daphnia magna), and to assess
Responsible editor: Philippe Garrigues
* Frédéric [email protected]
1 Université de Lyon; ENTPE; Université Lyon 1; CNRS; UMR 5023LEHNA, 2 Rue Maurice Audin, 69518 Vaulx-en-Velin, France
Environ Sci Pollut ResDOI 10.1007/s11356-015-5243-7

the respective contributions of exposure through feeding andthrough surrounding water to tamoxifen bioaccumulation in thefirst levels of a simplified freshwater food chain. Daphnids wereexposed simultaneously to a medium and to a diet (i.e.,microalgae), both contaminated by tamoxifen. We assess therespective contribution of each route to the bioaccumulation oftamoxifen by comparing these organisms to control organismsexposed only via diet or only via water or not exposed at all.
Because of analytic difficulties in measuring PCs withincomplex biological matrices, tamoxifen transfers between wa-ter, algae, and daphnids were quantified by stable isotopiclabelling with 15N using [15N]-tamoxifen and by monitoringthe evolution of 15N contents inside daphnids through time.
Materials and methods
Algal cultures and rearing of daphnids
Algal culture (Pseudokirchneriella subcapitata) and daphnid(Daphnia magna) rearing conditions were described in previ-ous works (Clément and Zaid 2004).
Chemicals
Tamoxifen-13C2,15N solution (CASNumber 10540-29-1) was
purchased from Sigma-Aldrich Chemical (St. QuentinFallavier, France). The stock solution of tamoxifen was pre-pared in methanol (1 mg/mL) and kept at −20 °C.
Exposure of algae to tamoxifen
An algal solution of 500 mL aged less than 10 days with aclassical AFNOR medium (AFNOR 1980) and a density of106 cells/mL (10 mg dry weight of algae) was exposed to50 μg of 15N-tamoxifen (100 μg/L). After exposure for24 h, the algal solution was centrifuged at 3000 rpm for20 min in glass tubes. A Bcontrol^ solution was also centri-fuged at the same time. The supernatant was removed, and thebottoms of the Bcontrol^ and Bexposed^ tubes were stored inglass tubes at 5 °C throughout the experiment.
Exposure of daphnids to tamoxifen
Exposure via water
Daphnids were exposed to three concentrations of tamoxifen:0, 5, and 50 μg/L, for 5 days. For each concentration, fourbeakers containing 1 L of rearing medium with ten daphnidsaged 10 days were prepared. These beakers were then placedin a climatic room at 20 °C with a photoperiod of 16 h(500 lx). For each treatment (0, 5, and 50 μg/L), two beakers
were reserved for the15N-tamoxifen-contaminated diet. In or-der to limit the ingestion of dissolved contaminant by neonatedaphnids, the latter were removed daily.
Exposure via feeding
Daphnids were fed for 2 h a day with contaminated or controlalgae by placing the daphnids in beakers containing 80 mL ofmedium with an algal density of 400,000 cells/mL. This dis-continuous diet prevented the development of algae within theexposure medium and the dilution of tamoxifen in the algalbiomass, thus feeding the daphnids with algae in isolationreduced the adsorption of tamoxifen on the algae.
Determination of 15N-tamoxifen content in algaeand daphnids
Sample preparation
A sample of algae (0.5mL of concentrated) was extracted dailybefore feeding the daphnids. Algae were placed in 2-mLEppendorf tubes frozen for 5 min in liquid nitrogen andfreeze-dried before EA-IRMS analyses in order to quantifythe tamoxifen content in the algae before each feeding step.
The daphnids were extracted daily before (3, 12, 24, 48, 72,and 96 h) and after (5, 27, 48, 51, 75, 96, and 99 h) feeding. Theywere then frozen for 5 min in liquid nitrogen and freeze-dried.
15N measurements
After freeze-drying, the algae samples were weighed at 1 mgin tin capsules before analysis. Nitrogen concentration and15N/14N ratio were measured using an isotope ratio mass spec-trometer (Isoprime 100, Isoprime Ltd, Manchester, UK)coupled in continuous flow with an elemental analyser(FlashEA 1112 Thermo Electron, Milan, Italy). Aspartic acidwas used to calibrate the N concentration measurements. Forthe isotope ratio measurements, two-point normalization ofmeasured values was performed using international referencematerial IAEA-N1 and IAEA-305 according to IUPACguidelines.15N/14N ratio is expressed as δ15N in ‰ relativeto atmospheric N2 (air):
δ15N ¼ 15N=14Nsample=15N=14NAir–1
� � � 103
and converted to atomic fraction (i.e., atomic %, Coplen2011):
x 15N� � ¼ 15N=14Nsample
� �= 1þ15N=14Nsample
� �
In-house standards calibrated against IAEA-N1 and IAEA-N2 were interspersed within the samples, and the standarddeviations for the replicate analyses were lower than 0.2‰.
Environ Sci Pollut Res

Calculation of excess15N and tamoxifen content
Excess15N concentration, [15N], was calculated from the dif-ference between the 15N fraction (x(15N)) of algae exposed to15N-tamoxifen and the 15N fraction (x(15N)control) measured inthe control treatment without exposure as follows:
15N� � ¼ x 15N
� �−x 15N
� �control
� �� N½ �;
where [N] is the N concentration in the sample.As 15N-tamoxifen was the only 15N tracer source in the
experiment, and assuming no dissociation of tamoxifen bychemical reactions or metabolic pathways, the tamoxifen con-centration was calculated from the15N concentration:
Tamoxifen½ � μg.g
� �¼ 15N
� �.15 �MTamoxifen � 106:
with Mtamoxifen (374.49 g/mol) being the molar mass of [13C,15N]-tamoxifen.
Determination of dissolved tamoxifen concentrationin water
At the end of the experiment, 150 mL of medium was collect-ed in each beaker in which the daphnids were exposed.Because of the amount of water required for tamoxifen quan-tification, samples of each three replicates were pooled,resulting in a single tamoxifen concentration per treatment.Analytical measurements were performed by the AnalyticalSciences Institute (CNRS, Lyon) using HPLC-MS/MS(Waters: UHPLC H-Class/Xevo TQ-S). Analytes were sepa-rated on a C18 column (Phenomenex Kinetex C18 PhénylHexyl 100×2.1 mm, 2.6 μm) using as mobile phase a binarygradient formed by (A) Milli-Q quality water+0.01 % aceticacid, and (B) acetonitrile (ACN). The gradient started at 40 %B, rose to 100 % B in 2 min, leveled for 2 min at 100 % ACN,and was followed by column repackaging at 40 % ACN for2 min. The flowwas 0.5 mL/min, the furnace temperature was40 °C, and the volume of injection was 2 μL. Eluted analyseswere monitored by MS/MS equipped with an electrospray ionsource operating in positive-ionmode, and the acquisition wasperformed in multi-reaction monitoring (MRM) mode.Detection and quantification limits were 0.15 μg/L (LOD)and 0.5 μg/L (LOQ), respectively.
Statistical analysis
The differences of δ15N values of daphnids between the dif-ferent treatments (water contamination; food contamination)were tested using three-way repeated measure analysis of var-iance (RM-ANOVA), with Btime^ being the repeated factor,and Bwater contamination level^ and Balgae contamination^the independent factors. Mauchly’s test was used to test for
sphericity and univariate test degrees of freedom were adjust-ed using the Huynh-Feldt epsilon correction factor when nec-essary. Post hoc tests (contrast method) were performed todetermine whether significant pairwise differences occurredbetween treatments. Significance for statistical tests was ac-cepted for α<0.05. All the statistical analyses were performedusing JMP 9 (SAS Institute Inc., Cary, NC) software.
Results
Evolution of δ15N in daphnids
δ15N values of daphnids fed with noncontaminated algae(δ15 N=−1.6±0.5‰) remained constant during the course ofthe experiment, with a mean value of +3±1‰. When exposedto algae artificially contaminated with 15N-tamoxifen (δ15 N=53±1‰), the δ15N value of daphnids increased from +3 to +6‰ (Fig. 1). This significant increase of 15N in the organismswhen exposed to contaminated algae compared tononcontaminated algae demonstrated a transfer of 15N-tamox-ifen via the trophic route.
Daphnids exposed to 15N-tamoxifen via surrounding waterexhibited a significant increase of δ15N values, up to +9‰ at5 μg/L and up to +60‰ at 50 μg/L (Fig. 2). The 15N enrich-ment showed that tamoxifen transfer from environmental wa-ter is a major contamination route.
When exposed to 15N-tamoxifen via the trophic route andthe surrounding medium, the δ15N values of daphnids wereclose to the δ15N values measured during exposure via sur-rounding water only (Fig. 3).
15N tamoxifen quantification in algae and daphnids
Tamoxifen content in algae
The average tamoxifen content in algae measured before eachfeeding step was 390 μg/g (±SD 3.32 μg/g).
Daphnids exposed via the dietary route only (Fig. 4)
During the experiment, the tamoxifen concentration indaphnids increased from 15 to 20 μg/g after each feeding step,except at the fourth step (Fig. 4). This increase was due to thetamoxifen inside the algae grazed by daphnids during the 2-hfeeding periods. This increase of content was systematicallyfollowed by a depuration phase, complete after the first feed-ing step (no more tamoxifen inside the daphnids), and thenpartial for the other feeding steps. This first step showed that20 h was enough to purge the gut. However, the next stepsshowed that tamoxifen accumulated inside the daphnia evenafter the gut was purged. Consequently, considering the whole
Environ Sci Pollut Res

curve, we observed progressive bioaccumulation of tamoxifenin daphnids as the experiment progressed. This clearly showedthat the dietary route was a significant route of contaminationunder our experimental conditions.
Daphnids exposed via medium only (Fig. 5a)
Figure 5a shows the tamoxifen content in daphnids ex-posed to tamoxifen via only the medium. We observed thatdaphnids had a very high tamoxifen content within the firstminutes of exposure, about 10 μg/g and about a hundred mi-crograms per gram for daphnids exposed to 5 and 50 μg/Ltamoxifen, respectively. We could also see that the content indaphnids decreased slightly during the feeding step. This canbe explained by the fact that there was no tamoxifen in thefeeding medium. The algae was not contaminated either so thetamoxifen content in the daphnids decreased via a depurationmechanism. Steady state was rapidly reached with a stabletamoxifen content in the daphnids. After the third feedingstep, the tamoxifen content in the daphnids was stable in both
treatments. At the end of this third feeding step, we reached acontent in daphnids of up to 26 μg/g (SD±6) and 234 μg/g(SD±64) for 5 and 50 μg/L, respectively, in water. It is note-worthy that the same order of magnitude was obtained be-tween the water of two treatments and the daphnids of twotreatments (ten times more in each case). Thus, thebioconcentration factor of tamoxifen in daphnids was notlinked to the initial concentration in water for the concentra-tion range tested.
Daphnids exposed via medium and dietary routes (Fig. 5b)
Figure 5b shows the tamoxifen content in daphnids exposedvia the medium and dietary routes. The dynamic bioaccumu-lation in these daphnids is close to that of daphnids exposedonly via water: rapid bioaccumulation during the first fewhours and at steady state reached around 48 h. Tamoxifencontents in daphnids were 46 μg/g (SD±13) and 299 μg/g(SD±95) for daphnids exposed to 5 and 50 μg/L in waterand to contaminated algae, respectively.
0
1
2
3
4
5
6
7
0 20 40 60 80 100
d15N
of
dap
hnid
s
Time (h)
Control
Algae only
Fig. 1 Evolution of ratios15N/14N (δ15N) in daphnidswithout toxicant (control: graycircles) and in daphnids exposedto 15N-tamoxifen via the dietaryroute (algae only: green circles).Error bars show standarddeviation
1
10
100
0 20 40 60 80 100
d15N
of
dap
hnid
s
Time (h)
Fig. 2 Evolution of ratios15N/14N (δ15N) in daphnidswithout toxicant (control: graycircles) and in daphnids exposedto 15N-tamoxifen via mediumonly (5 μ/L, light blue circles, and50 μg/L, dark blue circles).Error bars show standarddeviations
Environ Sci Pollut Res

Discussion
Bioconcentration and bioaccumulation factors
For better comprehension of the respective contributions ofmedium and dietary routes to tamoxifen contamination, wecompared tamoxifen concentrations dissolved in water andits content in daphnids at the end of the experiment (at steadystate) (Table 1). Indeed, we could calculate BCF and BAFonly when the concentrations were at steady state betweenmedium and the organism.
We observed that the concentrations measured in wa-ter at the 99th hour were nearly half the initial concen-tration, most likely because of the adsorption of thetamoxifen onto the walls of the beakers (data notshown).
First, the results of these chemical analyses allowed calcu-lating the bioconcentration factor (BCF) (for daphnids ex-posed only via water) and bioaccumulation factors (BAF)(for daphnids exposed via medium and the dietary route).These values (Table 1) show the high bioaccumulability oftamoxifen in daphnids.
Then, by comparing the BCFs and BAFs calculated for allthe treatments, we saw that the dietary route contributed moreto bioaccumulation in daphnids exposed to 5 μg/L in waterthan in daphnids exposed to 50 μg/L.
Finally, we observed that the tamoxifen content indaphnids at the end of the experiment was always lowerthan that in algae used to feed them (390 μg/g). Thus,under these experimental conditions, we did not observebiomagnification of tamoxifen. This can be explained bythe fact that, in our experiment, the tamoxifen concentra-tion to which the algae were exposed (100 μg/L) wasalways higher than that to which the daphnids were ex-posed (5 and 50 μg/L).
To our knowledge, tamoxifen is the most bioaccumulativePC ever measured experimentally in an invertebrate.However, other organic compounds have already been mea-sured as more bioaccumulative, notably inside Daphniamagna (Geyer et al. 1991).
However, it is noteworthy that our method is an indirectanalytic method. In our work, we consider that a nitrogenatom corresponds to a molecule of tamoxifen. However, it ispossible that this nitrogen atom is not an unchanged
1
10
100
0 20 40 60 80 100
d1
5N
of
dap
hnid
s
Time (h)
Fig. 3 Evolution of ratios15N/14N (δ15N) in daphnidswithout toxicant (control: gaycircles) and in daphnids exposedto 15N tamoxifen via medium(5 μ/L, yellow circles, and50 μg/L, red circles) and thedietary route. Error bars showstandard deviations
0
5
10
15
20
25
30
35
0 20 40 60 80 100
sdinhpad ni tnetnoc nefixoma
T
(µg
TM
X/g
DW
)
Time (h)
Fig. 4 Tamoxifen content indaphnids (μg tamoxifen/g dryweight) exposed to tamoxifen viaonly the dietary route for 5 days.Error bars shows standarddeviations. Red arrows showfeeding steps
Environ Sci Pollut Res

molecule of tamoxifen but a metabolite of it. Indeed, it hasalready been demonstrated that human pharmaceuticals canbe metabolized by freshwater crustaceans (Jeon et al. 2013).We note that the pharmaceuticals studied in the latter workwere not bioaccumulative compounds.
Bioconcentration and bioaccumulation dynamics
When observing our tamoxifen bioconcentration dynamicsinside daphnids, we saw that it was consistent with otherworks on the bioconcentration of pharmaceuticals inside
1
10
100
1000
0 10 20 30 40 50 60 70 80 90 100
sdi
nh
pad
ni tnet
noc
nefix
oma
T
(µg
TM
X/g
DW
)
Time (h)
Water only (50 µg/L)
Water only (5µg/L)
1
10
100
1000
0 10 20 30 40 50 60 70 80 90 100
sdi
nh
pad
ni tnet
noc
nefix
oma
T
(µg
TM
X/g
DW
)
Time (h)
Water (50 µg/L) and algae (389 µg/g)
Water (5µg/L) and algae (389 µg/g)
A
B
Fig. 5 a, b Evolution oftamoxifen content in daphnids(μg tamoxifen/g dry weight)exposed to tamoxifen via onlywater (5 μg/L, yellow square, and50 μg/L, red square) and viawater and food (5 μg/L, dark bluetriangle, and 50 μg/L, light bluetriangle). Error bars showstandard deviations. Red arrowsshow feeding steps
Table 1 Tamoxifen 15N concentration in water and tamoxifen 15N content in daphnids exposed to tamoxifen via only the dietary route for 5 days
Treatments
Water 5 μg/L Water 5 μg/L andalgae 390 μg/g
Water 50 μg/L Water 50 μg/L andalgae 390 μg/g
Measured TMX concentration inwater at the end of the experiment (μg/L)
2 1.9 29.5 25.9
Mean (n=4) TMX content (± SD) indaphnids at the end of the experiment (μg/g)
25.69 (±7.6) 42.13 (±3.5) 250.3 (±53) 289.2 (±95)
Bioconcentration factor (± SD) 12844 (±3791) 8483 (±1794)
Bioaccumulation factor (± SD) 22172 (±1844) 11167 (±3689)
Environ Sci Pollut Res

invertebrates (Meredith-Williams et al. 2012; Anskjær et al.2013). In these studies, the authors observed a very highbioconcentration at the beginning of exposure and then a sta-bilization of the content inside organisms after 24 to 48 h.Nevertheless, the PC contents in these studies were lower thanthose observed in our works concerning tamoxifen.
There is an increasing number of works on PCbioconcentration in invertebrates in the literature, but studieson the bioaccumulation of these contaminants are still rare.These studies are more common for other organic contami-nants (e.g., perfluoroalkyl, polychlorobiphnyles, andorhexachlorobenzene). However, all these studies demonstrat-ed that for pelagic organisms, aqueous medium is the predom-inant route of contamination compared to the dietary route(Muñoz et al. 1996; Dai et al. 2013; Kim et al. 2014).However, for benthic organisms, the relative contribution tothe bioaccumulation of the dietary route and water can bemodified (Dussault et al. 2009; Lopes et al. 2012; Bertinet al. 2014).
Ecosystemic consequences
We can describe at least two of the consequences of thesebioaccumulations at ecosystem scale: biomagnification anddecreasing fitness. Indeed, many works have already shownthat organic contaminant transfer, notably of PCs, can occuralong the trophic web and have harmful effects on the organ-isms exposed (Correa-Reyes et al. 2007; Lajeunesse et al.2011; Dai et al. 2013). Moreover, it has been demonstratedthat PCs can be transferred after several generations (Kimet al. 2014). This Bmultigenerational effect^ is consistent withthe work of Chiaia-Hernandez et al. (2013), who showed thatseveral PCs could be significantly accumulated in daphniaeggs. Lastly, Montiglio and Royauté (2014) highlighted theneed to take into account anthropogenic contaminants in thebehavioral disturbances of several organisms (e.g., fish, crus-taceans, insects, birds, etc.).
Conclusion and perspectives
This work, as wel l as previous exper iments onbioconcentration in microalgae (Orias et al. 2015), showedthat tamoxifen has strong bioaccumulative potential in the firstlevels of the trophic web considered. The experiment de-scribed in this paper focused on the transfer of tamoxifen indaphnids, the second level of this experimental trophic web,on the one hand due to immersion in the contaminated medi-um and, on the other hand, from the dietary route via theconsumption of contaminated algae. Under these experimen-tal conditions, we observed that this consumption plays a keyrole, especially when the concentration of medium is lower. Inother words, we can say that the lower the concentration in
medium, the greater the role played by the dietary route incontamination by tamoxifen. In the future, it would be inter-esting to test lower levels of food and medium contaminationin order to get closer to environmental conditions. Moreover,assays integrating a secondary consumer (i.e., a fish species)could enrich knowledge on the bioaccumulation of pharma-ceuticals such as tamoxifen along a longer trophic web.
In addition, in this study, we used stable isotopes for thefirst time in order to monitor an organic contaminant in aninvertebrate. Our results highlighted the advantages of thismethod for studying the bioaccumulation of contaminants inaquatic invertebrates (especially the possibility of analyzingthe material directly without prior extraction, and the smallquantity of living material required for the analysis).However, stable isotope analysis does not allow identifyingthe potential metabolites of the molecule studied. Therefore, itis now necessary to validate our method using a direct analysismethod such as chromatography.
Acknowledgments The authors thank the SIPIBEL field observatoryon hospital effluents and urban wastewater treatment plants, the EuropeanUnion, the Rhone-Mediterranean Corsica Water Agency, the Rhône-Alpes Region, the Ministries of Health and the Environment, the Region-al Office of Health, and the General Council of Haute-Savoie for theirsupport.
References
AFNOR (1980) Détermination de l’inhibition de la croissance deScenedesmus subspicatus par une substance
Anskjær G, Rendal C, Kusk K (2013) Effect of pH on the toxicity andbioconcentration of sulfadiazine on Daphnia magna. Chemosphere91(8):1183–1188
Barnes KK, Kolpin DW, Furlong ET, Zaugg SD, Meyer MT, Barber LB(2008) A national reconnaissance of pharmaceuticals and other or-ganic wastewater contaminants in the United States—I)Groundwater. Sci Total Environ 402:192–200. doi:10.1016/j.scitotenv.2008.04.028
Bertin D, Ferrari BJD, Labadie P, Sapin A, Garric J, Budzinski H, HoudeM, Babut M (2014) Bioaccumulation of perfluoroalkyl compoundsin midge (Chironomus riparius) larvae exposed to sediment.Environ Pollut 189:27–34. doi:10.1016/j.envpol.2014.02.018
Blair BD, Crago JP, Hedman CJ, Klaper RD (2013) Pharmaceuticals andpersonal care products found in the Great Lakes above concentra-tions of environmental concern. Chemosphere 93:2116–2123. doi:10.1016/j.chemosphere.2013.07.057
Chiaia-Hernandez AC, Ashauer R, Moest M, Hollingshaus T, Jeon J,Spaak P, Hollender J (2013) Bioconcentration of organic contami-nants in daphnia resting eggs. Environ Sci Technol 47:10667–10675. doi:10.1021/es401763d
Claessens M, Vanhaecke L, Wille K, Janssen CR (2013) Emerging con-taminants in Belgian marine waters: single toxicant and mixturerisks of pharmaceuticals. Mar Pollut Bull 71:41–50. doi:10.1016/j.marpolbul.2013.03.039
Clément B, Zaid S (2004) A new protocol to measure the effectsof toxicants on daphnid–algae interactions. Chemosphere55(10):1429–1438
Coetsier CM, Spinelli S, Lin L, Roig B, Touraud E (2009) Discharge ofpharmaceutical products (PPs) through a conventional biological
Environ Sci Pollut Res

sewage treatment plant: MECs vs PECs? Environ Int 35:787–792.doi:10.1016/j.envint.2009.01.008
Coplen TB (2011) Guidelines and recommended terms for expression ofstableisotope-ratio and gas-ratiom easurement results. RapidCommun Mass Spectrom 25:2538–2560
Correa-Reyes G, Viana MT, Marquez-Rocha FJ, Licea AF, Ponce E,Vazquez-Duhalt R (2007) Nonylphenol algal bioaccumulation andits effect through the trophic chain. Chemosphere 68:662–670. doi:10.1016/j.chemosphere.2007.02.030
Dai Z, Xia X, Guo J, Jiang X (2013) Bioaccumulation and uptake routesof perfluoroalkyl acids in daphnia magna. Chemosphere 90:1589–1596. doi:10.1016/j.chemosphere.2012.08.026
Dussault ÈB, Balakrishnan VK, Borgmann U, Solomon KR, Sibley PK(2009) Bioaccumulation of the synthetic hormone 17α-ethinylestradiol in the benthic invertebrates Chironomus tentansand Hyalella azteca. Ecotoxicol Environ Saf 72:1635–1641. doi:10.1016/j.ecoenv.2009.04.019
Fick J, Söderström H, Lindberg RH, Phan C, Tysklind M, Larsson DGJ(2009) Contamination of surface, ground, and drinking water frompharmaceutical production. Environ Toxicol Chem 28:2522–2527.doi:10.1897/09-073.1
Geyer HJ, Scheunert I, Brüggemann R, Steinberg C, Korte F, Kettrup A(1991) QSAR for organic chemical bioconcentration in Daphnia,algae, and mussels. QSAR Environ Toxicol 109–110:387–394.doi:10.1016/0048-9697(91)90193-I
Jean J, Perrodin Y, Pivot C, Trepo D, Perraud M, Droguet J, Tissot-Guerraz F, Locher F (2012) Identification and prioritization ofbioaccumulable pharmaceutical substances discharged in hospitaleffluents. J Environ Manage 103:113–121. doi:10.1016/j.jenvman.2012.03.005
Jeon J, Kurth D, Hollender J (2013) Biotransformation pathways of bio-cides and pharmaceuticals in freshwater crustaceans based on struc-ture elucidation of metabolites using high resolution mass spectrom-etry. Chem Res Toxicol 26:313–324. doi:10.1021/tx300457f
Kim HY, Jeon J, Hollender J, Yu S, Kim SD (2014) Aqueous and dietarybioaccumulation of antibiotic tetracycline in D. magna and its mul-tigenerational transfer. J Hazard Mater 279:428–435. doi:10.1016/j.jhazmat.2014.07.031
Kolpin DW, Furlong ET, Meyer MT, Thurman EM, Zaugg SD, BarberLB, Buxton HT (2002) Pharmaceuticals, hormones, and other or-ganic wastewater contaminants in U.S. streams, 1999−2000: a na-tional reconnaissance. Environ Sci Technol 36:1202–1211. doi:10.1021/es011055j
Lajeunesse A, Gagnon C, Gagné F, Louis S, Čejka P, Sauvé S (2011)Distribution of antidepressants and their metabolites in brook troutexposed to municipal wastewaters before and after ozone treat-ment—evidence of biological effects. Chemosphere 83:564–571.doi:10.1016/j.chemosphere.2010.12.026
Loos R, Gawlik BM, Locoro G, Rimaviciute E, Contini S, Bidoglio G(2009) EU-wide survey of polar organic persistent pollutants inEuropean river waters. Environ Pollut 157:561–568. doi:10.1016/j.envpol.2008.09.020
Loos R, Locoro G, Comero S, Contini S, Schwesig D,Werres F, Balsaa P,Gans O, Weiss S, Blaha L, Bolchi M, Gawlik BM (2010) Pan-European survey on the occurrence of selected polar organic persis-tent pollutants in ground water. Water Res 44:4115–4126. doi:10.1016/j.watres.2010.05.032
Lopes C, Persat H, Babut M (2012) Transfer of PCBs from bottom sed-iment to freshwater river fish: a food-web modelling approach in theRhône River (France) in support of sediment management.Ecotoxicol Environ Saf 81:17–26. doi:10.1016/j.ecoenv.2012.04.007
López-Serna R, Petrović M, Barceló D (2012) Occurrence and distribu-tion of multi-class pharmaceuticals and their active metabolites andtransformation products in the Ebro River basin (NE Spain). SciTotal Environ. doi:10.1016/j.scitotenv.2012.06.027
Meredith-Williams M, Carter LJ, Fussell R, Raffaelli D, Ashauer R,Boxall ABA (2012) Uptake and depuration of pharmaceuticals inaquatic invertebrates. Environ Pollut 165:250–258
Montiglio P-O, Royauté R (2014) Contaminants as a neglected source ofbehavioural variation. Anim Behav 88:29–35. doi:10.1016/j.anbehav.2013.11.018
MuñozMJ, Ramos C, Tarazona J (1996) Bioaccumulation and toxicity ofhexachlorobenzene in chlorella vulgaris and daphnia magna. AquatToxicol 35:211–220. doi:10.1016/0166-445X(96)00010-0
Orias F, Simon L, Perrodin Y (2015) Experimental assessment of thebioconcentration of 15N-tamoxifen in Pseudokirchneriellasubcapitata. Chemosphere 122:251–256. doi:10.1016/j.chemosphere.2014.11.070
Roberts PH, Thomas KV (2006) The occurrence of selected pharmaceu-ticals in wastewater effluent and surface waters of the lower Tynecatchment. Sci Total Environ 356:143–153. doi:10.1016/j.scitotenv.2005.04.031
Schultz MM, Furlong ET, Kolpin DW, Werner SL, Schoenfuss HL,Barber LB, Blazer VS, Norris DO, Vajda AM (2010)Antidepressant pharmaceuticals in two U.S. Effluent-impactedstreams: occurrence and fate in water and sediment, and selectiveuptake in fish neural tissue. Environ Sci Technol 44:1918–1925. doi:10.1021/es9022706
Thomas KV, Hilton MJ (2004) The occurrence of selected human phar-maceutical compounds in UK estuaries. Mar Pollut Bull 49:436–444. doi:10.1016/j.marpolbul.2004.02.028
Vazquez-Roig P, Andreu V, Blasco C, Picó Y (2012) Risk assessment onthe presence of pharmaceuticals in sediments, soils and waters of thePego–OlivaMarshlands (Valencia, eastern Spain). Sci Total Environ440:24–32. doi:10.1016/j.scitotenv.2012.08.036
Yang Y, Fu J, Peng H, Hou L, Liu M, Zhou JL (2011) Occurrence andphase distribution of selected pharmaceuticals in the YangtzeEstuary and its coastal zone. J Hazard Mater 190:588–596. doi:10.1016/j.jhazmat.2011.03.092
Zenker A, Cicero MR, Prestinaci F, Bottoni P, Carere M (2014)Bioaccumulation and biomagnification potential of pharmaceuticalswith a focus to the aquatic environment. J Environ Manage 133:378–387. doi:10.1016/j.jenvman.2013.12.017
Environ Sci Pollut Res

CHAPITRE 8. BIOACCUMULATION DU 15N TAMOXIFEN CHEZ DAPHNIA MAGNA
8.3 Synthèse
Pour la première fois à notre connaissance, la bioaccumulation et la bioconcentration d’uncontaminant organique ont été mesurées chez un invertébré. Les résultats de ces expérimen-tations montrent que le tamoxifen est très rapidement bioconcentrable dans les daphnies eten forte proportion. Ces travaux montrent également que le régime alimentaire à un rôle nonnégligeable dans la contamination par le RP étudié, et que plus la concentration dans le milieuest faible, plus cet impact est important. Il est maintenant nécessaire de remonter encore lelong de la chaine alimentaire en étudiant la dynamique du tamoxifen chez un consommateursecondaire.
133

CHAPITRE 8. BIOACCUMULATION DU 15N TAMOXIFEN CHEZ DAPHNIA MAGNA
134

Chapitre 9
Bioconcentration du 15N tamoxifenchez Danio rerio
9.1 Enjeux et démarche
A ce stade, nous avons réussi à mesurer un transfert important du tamoxifen dans lesdeux premiers maillons de la chaine alimentaire. Ainsi, nous arrivons maintenant au troi-sième niveau : le consommateur secondaire. Chez les daphnies, il a été techniquement possibled’évaluer à la fois la bioaccumulation et la bioconcentration. Chez le poisson, nous n’avonstoutefois eu seulement la possibilité d’évaluer la bioconcentration. De même que pour lesdeux premiers niveaux trophiques étudiés, l’objectif de ces expérimentations était double :(i) mesurer si nous observons un enrichissement en 15N significatif pour quantifier une accu-mulation de tamoxifen dans notre organisme, ici le poisson (ii) déterminer la dynamique dutamoxifen dans le temps et dans différents organes. Nous avons également mesuré l’évolutiondu tamoxifen dissout afin de déterminer à quelles concentrations les poissons étaient réelle-ment exposés. Les poissons ont été exposés 21 jours à 3 concentrations de tamoxifen : 0,1µg/L, 1 µg/L et 10 µg/L. A chaque prélèvement, foie, gonades et muscles ont été récupéréset l’enrichissement en 15N y est mesuré. Nous nous sommes intéressés à ces trois organes àcause de leur nature différente, présentant toutes un intérêt spécifique : (i) Le foie est l’organeresponsable de la détoxification des contaminants et est très riche en lipide. (ii) Les gonadessont très riches en lipides. Ainsi, une molécule très hydrophobe comme le tamoxifen risqued’être présente dans cet organe. (iii) Les muscles sont pauvres en lipides est souvent témoinsd’une contamination chronique. La présence de tamoxifen dans cet organe après 21 jourspourrait présenter un risque supplémentaire pour les organismes exposés.
135

CHAPITRE 9. BIOCONCENTRATION DU 15N TAMOXIFEN CHEZ DANIO RERIO
9.2 Article 7 : Bioconcentration of 15N-tamoxifen atenvironmental concentration in liver, gonad andmuscle of Danio rerio
Article soumis 19 mars 2015 dans le journal « Ecotoxicology and Environmental Safety ».
136

Bioconcentration of 15N-tamoxifen at environmental concentration inliver, gonad and muscle of Danio rerio
Frédéric Orias n, Laurent Simon, Gladys Mialdea, Angéline Clair, Vanessa Brosselin,Yves PerrodinUniversité de Lyon, ENTPE, Université Lyon 1, CNRS, UMR 5023 LEHNA, 2 Rue Maurice Audin, 69518 Vaulx-en-Velin, France
a r t i c l e i n f o
Article history:Received 19 March 2015Received in revised form19 June 2015Accepted 22 June 2015
Keywords:PharmaceuticalsBioconcentrationDanio rerioStable isotopesTamoxifen
a b s t r a c t
Pharmaceutical compounds (PCs) are ubiquitous in aquatic ecosystems. In addition to the direct eco-toxicological risk presented by certain PCs, others can accumulate inside organisms and along trophicwebs, subsequently contaminating whole ecosystems. We studied the bioconcentration of a bioaccu-mulative PC already found several times in the environment: tamoxifen. To this end, we exposed Daniorerio for 21 d to 15N-tamoxifen concentrations ranging from 0.1 to 10 mg/L and used an analytic methodbased on stable isotopes to evaluate the tamoxifen content in these organisms. The evolution of the15N/14N ratio was thus measured in liver, muscle and gonads of exposed fish compared to control fish. Wesucceeded in quantifying 15N-tamoxifen bioconcentrations at all the exposure concentrations tested. Thehighest bioconcentration factors of tamoxifen measured were 14,920 in muscle, 73,800 in liver and85,600 in gonads of fish after 21 d exposure at a nominal concentration of 10 mg/L. However, thesebioconcentration factors have to be considered as maximal values (BCFMAX). Indeed, despite its provenstability, tamoxifen can be potentially partially degraded during experiments. We now need to refinethese results by using a direct analytic method (i.e. LC–MS/MS).
& 2015 Elsevier Inc. All rights reserved.
1. Introduction
Nowadays, pharmaceutical compounds (PCs) are found in allparts of aquatic ecosystems: water, sediment and organisms. Twomain sources are responsible for the emission of PCs:(i) wastewater from pharmaceutical factories (Collado et al., 2014;Larsson et al., 2007), (ii) urban wastewater (domestic and hospital)(Kümmerer, 2009; Verlicchi et al., 2010). It has already been de-monstrated that these PCs could have harmful effects on organ-isms or at the ecosystem scale, notably on fish, even at very lowconcentrations. Indeed, Brodin et al. (2013) have already shownthat low concentrations of psychiatric drugs can modify the be-havior of natural fishes. Moreover, Kidd et al. (2007) illustratedthat only 5 ng/L of ethinylestradiol can lead to the durable collapseof the fish population of a whole lake. In addition to direct eco-toxicity, some of these PCs are sometimes found at concentrationsmany times higher inside organisms than in water (Zenker et al.,2014): in this case we use the term bioaccumulative compounds.
Here, we focus our work on a particularly bioaccumulativepharmaceutical: tamoxifen (Jean et al., 2012). This molecule is an
anticancer drug available as tamoxifen citrate used to treat breastcancer. It has already been detected not only in sediment (Yanget al., 2011) but also in water (Ashton et al., 2004) at significantconcentrations (several hundred ng/kg and several hundred ng/L,respectively). Theoretical bioconcentration factors (BCF) of ta-moxifen have been estimated at around 7000 (Jean et al., 2012),using a quantitative structure activity relation (QSAR).
In this study, we measured how tamoxifen bioconcentratesinside a fish classically used in ecotoxicology, Danio rerio, at sev-eral concentrations, including environmental concentrations.Therefore we exposed this organism for 21 d at concentrationsfrom 0.1 mg/L to 10 mg/L. After fish sampling at several time steps,we removed liver, gonads and muscle. These organs were chosenbecause: 1) tamoxifen is expected to be metabolized in liver (bycytochrome P450), 2) gonads are very rich in lipids, in which it isexpected to accumulate (high Kow), and 3) muscle, which is anindicator of chronic contamination.
Due to difficulties linked to the measurement of this kind ofcompound inside a biological matrix, we performed the mea-surements with a stable isotope labelled molecule (15N tamoxifen)using an elemental analyzer coupled with a mass spectrometer(EA-IRMS). Therefore the evolution of the 15N/14N ratio was firstmeasured in each organ, after which tamoxifen (and/or
Contents lists available at ScienceDirect
journal homepage: www.elsevier.com/locate/ecoenv
Ecotoxicology and Environmental Safety
http://dx.doi.org/10.1016/j.ecoenv.2015.06.0330147-6513/& 2015 Elsevier Inc. All rights reserved.
n Corresponding author. Fax: þ33 4 72 04 77 43.E-mail address: [email protected] (F. Orias).
Ecotoxicology and Environmental Safety 120 (2015) 457–462

metabolites) enrichment was quantified. This original analyticalapproach had been developed during previous works (Orias et al.,2015).
2. Materials and methods
2.1. Tamoxifen 15N
Tamoxifen 15N13C2 was purchased from Sigma-Aldrich chemi-cal (St Quentin Falavier, France), prepared in methanol (1 mg/mL)and kept in a glass ampoule at �20 °C.
2.2. Danio rerio
360 female fishes (D. rerio) aged 3 months, taken from a fishfarm certified for animal experimentation (Elevage de la Granderivière, La fond Garel, 69490 Saint Forgeux), were used in theseexperiments. We chose female fishes because their gonads arelarger than male fish gonads and have a higher lipid content,thereby increasing the potential bioconcentration of the con-taminant studied.
2.3. Exposure conditions
The aquariums used were one piece glass tanks without seals,with a capacity of 12 L. They were filled with 10 L of syntheticmedium composed of osmosed water and trace elements (MgSO4
180 mg/L, CaCl2 200 mg/L, NaHCO3 100 mg/L, KHCO3 20 mg/L). Inorder to limit contaminant adsorption, we eliminated the use ofplastic equipment inside the aquariums. Oxygenwas provided by aglass pipette and the exposure room was thermostated at2671 °C in order to prevent the use of devices inside the aqua-riums. The latter were then filled with medium without con-taminant and left for one week to ensure the stabilization ofphysicochemical parameters. Before the experiment started, thefish were distributed in all 12 aquariums (33 fishes per aquarium)for ten days for acclimation. The aquariums were covered with aplastic film to limit water evaporation. Lighting was provided byneon tubes imitating sunlight with a photoperiod of 16 h. pH,conductivity, nitrates, nitrites and the temperature of the waterand air were measured daily. The fish were fed until satiety6 times a week with Tetramins
flakes. Three times a week, feceswere flushed out of the aquariums with a hand pump to limittamoxifen adsorption on them. The fish were exposed to 3 ta-moxifen concentrations (0.1 mg/L, 1 mg/L and 10mg/L) for 21 d (tri-plicates). Mediums were half renewed at 7 d and 14 d. The quan-tity of tamoxifen added at each renewal was the same as than on0 d. Before and after each renewal, 200 mL of medium was sam-pled for chemical analysis (cf. Section 2.7).
Finally, these experiments conformed to European regulationsconcerning animal experiments and were authorized by theFrench Ministry of Higher Education and Research (Project no.DR2013-33, approved since 07/04/14).
2.4. Determination of dissolved tamoxifen concentration in water
Water samples were analyzed at the beginning of the experi-ment (0 d), before (7 d and 14 d), after each renewal (7 dþ and14 dþ) and at the end of exposure (21 d) in all treatments. Thewater samples were pooled by exposure concentration, by timeand concentration (6 all in all), in order to obtain a sufficientamount of tamoxifen, and then filtered. Analytical measurementswere performed by the Analytical Sciences Institute (CNRS, Lyon)using HPLC–MS/MS (Waters: UHPLC H-Class/Xevo TQ-S) with thefollowing analytical parameters: Column: Phenomenex Kinetex
C18 Phenyl Hexyl 100�2.1 mm2, 2.6 μm; Mobile phases (A)¼MilliQ quality waterþ0.01% acetic acid (B)¼Acetonitrile (ACN);Gradient: Departure 40% B, rising to 100% B in two minutes, levelfor two minutes at 100% ACN, column repackaging at 40% ACN fortwo minutes; Flow: 0.5 mL/min; Furnace temperature: 40 °C; In-jection: 2 mL; Ionization source: Positive mode electrospray; Ac-quisition parameters: Multi-Reaction Monitoring (MRM) mode.Detection and quantification limits were 0.15 mg/L (LOD) and0.5 mg/L (LOQ), respectively.
2.5. Fish sampling and dissection
In order to assess tamoxifen bioconcentration dynamics, fishwere sampled at: 0 d (2 h exposure), 1 d, 2 d, 3 d, 4 d, 7 d (beforerenewal), 10 d, 17 d, 14 d (before renewal) and 21 d. Each time,3 fish were sampled for each concentration and each system (all inall 36 fishes at each time). Immediately afterwards, the fish wereplunged in cold water (3 °C) to euthanize them. Each fish was thenslightly dried on absorbent paper, weighed and measured (Forklength). Livers, gonads and muscles were then removed and pulledby triplicate. So, each sample is a combination of organs fromthree fishes and there is three sample by treatment. Finally, sam-ples were plunged in liquid nitrogen and lyophilized for 7 d.
2.6. 15N measurements
After freeze-drying, fish samples were weighed at 1 mg in tincapsules before analysis. Nitrogen concentration and 15N/14N ratiowere measured using an isotope ratio mass spectrometer (Iso-prime 100, Isoprime Ltd., Manchester, UK) coupled in continuousflow with an elemental analyzer (Flash EA 1112 Thermo Electron,Milan, Italy). Aspartic acid was used to calibrate the N con-centration measurements. For isotope ratio measurements, two-point normalization of measured values was performed using in-ternational reference material IAEA-N1 and IAEA-305 according toIUPAC guidelines. 15N/14N ratios were expressed as δ15N in‰ re-lative to atmospheric N2 (Air):
N N/ N / N/ N 1 1015 15sample
14 15Air
14 3( )δ = – ×
and converted to atom fraction (i.e. atom %; Coplen, 2011):
x N N/ N / 1 N/ N15 15sample
14 15sample
14( ) ( ) ( )= +
In-house standards calibrated against IAEA-N1 and IAEA-N2were interspersed within the samples and the standard deviationsfor replicate analyses were lower than 0.2‰.
2.7. Calculation of excess 15N and tamoxifen concentration
Excess 15N concentration, [15N], was calculated from the dif-ference between the 15N fraction (x(15N)) of fish exposed to15N-tamoxifen and the 15N fraction (x(15N)control) measured in thecontrol treatment without exposure as follows:
x xN N N N ,15 15 15control[ ] = ( ( ) − ( ) )· [ ]
where [N] is the N concentration in the sample.As 15N-tamoxifen was the only 15N tracer source in the ex-
periment, and by considering that no dissociation of tamoxifenhad occurred through chemical reactions or metabolic pathways(DellaGreca et al., 2007; Li et al., 2001; Negreira et al., 2014; Zhouet al., 2009; ECP, 2014), the concentration of tamoxifen was cal-culated from the 15N concentration:
⎡⎣ ⎤⎦ MTamoxifen g g N /15 101 15Tamoxifen
6( )[ ] μ = · ·−
with Mtamoxifen (374.49 g/mol) the molar mass of [13C,
F. Orias et al. / Ecotoxicology and Environmental Safety 120 (2015) 457–462458

15N]-tamoxifen.These tamoxifen concentrations should be considered as
maximal concentrations. Indeed, despite the stability of tamoxifen,partial degradation is always possible during the experiment.
A detection limit of tamoxifen in the fish samples of 1.5 mg g�1
was calculated using this equation from the detection limit of thedifference between the 15N/14N ratio, less than 0.2‰, resulting inan estimation of the quantification limit of 4.6 mg g�1.
2.8. Bioconcentration factor of the tamoxifen calculation
To calculate the BCF of a contaminant, it is necessary to reachequilibrium between excretion and assimilation constants in or-ganisms. Here, considering the bioconcentration dynamics in thefish studied, we estimated that equilibrium was reached at 21 d.
The bioconcentration factors of tamoxifen were then calculatedaccording to the following equation:
BCFTamoxifen content quantified in organ g/kg at equilibrium
Tamoxifen concentration measured in water g/kg
at equilibrium
=( )
( )
As in Section 2.7, these BCF should be considered as maximalBCFs, considering the potential partial degradation of tamoxifen.That is why from now in this paper, we will refer to BCFMAX.
2.9. Statistical analysis
δ15N values were compared between treatments with a re-peated measures analysis of variance (ANOVA) with the tamoxifenconcentration (“treatment”) and time as independent factors, fol-lowed by a Tukey HSD posthoc test to determine which treatmentsdiffered. Statistical analyses were performed using JMP8 software(SAS Institute) and statistical significance was accepted at αo0.05.
3. Results
3.1. Physicochemical and biological parameters
During the 21 d of exposure, the temperatures of air and waterfluctuated between 25 and 27 °C. Conductivity oscillated between650 and 750 mS/cm and pH between 6.8 and 7.6. Gradually, duringthe experiment, we observed an increase of nitrate and nitriteconcentrations reaching up to 250 mg/L and 10 mg/L, respectively,by the end of the experiment. Nevertheless, it is noteworthy thatwe did not observe any mortality and D. rerio is tolerant to theseamounts of nitrite and nitrate concentrations (Macova et al.,2008). Otherwise, the weight and size measurements did not al-low us to highlight differences in weight or size between treat-ments (4237129 mg and 2772.4 mm).
Tamoxifen concentrations measured in water by HPLC for thehighest exposure concentration (10 mg/L) at the beginning and atthe end (0 d and 21 d) of the experiment, and also before (7 d and14 d) and after (7 dþ and 14 dþ) each renewal, are presented inTable 1. From the beginning of the experiment, we observed thatthe real concentration was under 50% of the nominal
concentration (10 mg/L). At 7 d, the concentration of tamoxifen inwater was under 150 ng/L (LOD). After both renewals, the dis-solved tamoxifen concentration did not reach more than 33% ofthe nominal concentration and fell to around 500 ng/L after 7 d.
3.2. Evolution of ratio 15N/14N in organs
Without exposure to tamoxifen, the δ15N of liver, gonads andmuscles remained constant throughout the experiment (Fig. 1a;δ15N¼11‰ for liver, 12‰ for gonads and muscles). At the ex-posure concentration of 10 mg/L tamoxifen, liver δ15N (Fig. 1a)exhibited a significant increase from 11‰ to 15‰ (repeatedmeasures ANOVA, “Concentration” effect, and Tukey HSD posthoc,po0.0001). As 15N-tamoxifen was the only supply of 15N in theexperiment compared to the control, this significant 15N enrich-ment indicates that tamoxifenwas incorporated in liver tissues. 15Nenrichment (and therefore tamoxifen incorporation) occurred
from the first hours of exposure, followed by a slow decrease to aδ15N value of 13‰ at 7 d. 15N enrichment increased up to 16‰after each renewal of the medium (i.e. 7 d and 14 d). A slight in-crease of liver δ15N (from 11‰ to 12‰) was measured for anexposure concentration of 0.1 and 1 mg/L of tamoxifen (Fig. 1a), but
Table 1Tamoxifen (TMX) concentration in water during the experiment for the “10 mg/L”treatment. “þ” means after renewal of half of the medium.
Time (d) 0 7 7þ 14 14þ 21
TMX concentration in water (mg TMX/L) 4.8 oLOD 3.3 0.6 3.2 0.5
910111213141516171819
0 1 2 3 4 5 6 7 8 9 10 11 12 13 14 15 16 17 18 19 20 21d15
NTime (d)
10 µg/L1 µg/L0,1 µg/L0 µg/L
9101112131415161718
0 1 2 3 4 5 6 7 8 9 10 11 12 13 14 15 16 17 18 19 20 21
d15N
Time (d)
10 µg/L1 µg/L0,1 µg/L0 µg/L
Fig. 1. (a) Evolution of the 15N/14N ratio (d15N) in Danio rerio livers exposed to 15Ntamoxifen for 21 d. Red arrows mean half-renewal and error bars show standarddeviations (2SE). (b) Evolution of the 15N/14N ratio (d15N) in Danio rerio gonadsexposed to 15N tamoxifen 21 d. Red arrows mean half-renewal and error bars showstandard deviations (2SE). (c) Evolution of the ratio 15N/14N (d15N) in Danio reriomuscles exposed to 15N tamoxifen for 21 d. Red arrows mean half-renewal anderror bars show standard deviations (2SE). (For interpretation of the references tocolor in this figure legend, the reader is referred to the web version of this article.)
F. Orias et al. / Ecotoxicology and Environmental Safety 120 (2015) 457–462 459

this 15N enrichment was not significant (Tukey HSD posthoc, re-spectively p¼0.743 and p¼0.158 for 0.1 and 1 mg/L).
In fish exposed to a tamoxifen concentration of 10 mg/L, δ15Nvalues of gonads rapidly increased from 12‰ to 13.5‰ at 7 d, andto 16.5‰ after the first medium renewal (Fig. 1b). 15N enrichmentsignificantly increased with the concentration of tamoxifen (re-peated measures ANOVA, “Concentration” effect, po0.0001), and15N enrichment was significantly higher at exposure to 10 mg/Lthan to 0.1 and 1 mg/L (Tukey HSD posthoc, po0.0001). A slightincrease of gonad δ15N (from 12‰ to 13‰) was measured for anexposure concentration of 0.1 and 1 mg/L of tamoxifen (Fig. 1b), butthis 15N enrichment was not significant at 0.1 mg/L (Tukey HSDposthoc, p¼0.83 and po0.01 for 0.1 and 1 mg/L, respectively).
In muscles, δ15N values exhibited a slight increase from 12‰ to12.6‰ in the treatment with a tamoxifen concentration of 10 mg/L(Fig. 1c), significantly higher than in the control experiment and alower tamoxifen concentration (repeated measure ANOVA, “Con-centration” effect, and Tukey HSD posthoc, po0.01). No significant15N enrichment was measured in the treatment with a tamoxifenconcentration of 0.1 and 1 mg/L (Tukey HSD posthoc, p40.19).
3.3. Estimation of tamoxifen content in fish from 15N concentration
In these experiments, 15N tamoxifen was the only source of 15Ncompared to the control treatment without exposure to tamoxifen.We therefore attempted to estimate the concentration of tamox-ifen incorporated in the different fish tissues on the basis of 15Nenrichment (cf. Section 2.6). As the increase of δ15N during theexperiments remained low, we calculated a tamoxifen con-centration only when significant differences of δ15N were mea-sured in comparison to the control (i.e. for the treatment at 10 mg/Lfor the 3 organs, and the treatment at 1 mg/L for gonads). More-over, the concentrations calculated are shown only when averagevalues are higher than the quantification limit of 4600 ng/g.
3.3.1. Exposition at 10 mg/LAt the highest concentration tested, 10 mg/L, all the organs were
contaminated rapidly and durably. Indeed, in the three organsobserved, average tamoxifen contents were higher than thequantification limit from the beginning to the end of the experi-ment. The least contaminated of the three organs was the muscle,which presented average contents of 5100 (74700) ng/g at 2 dand 7460 (72600) ng/g at the end of the experiment. Gonad andliver presented much higher contents. Indeed, the highest averagecontents in the liver (17 d) and in the gonad (21 d) were respec-tively 45,400 (76900) and 42,800 (710,200) ng/g. Bioconcen-tration dynamics inside these organs were quite similar. Duringthe first days of the experiment, the average contents increasedslightly until 3 d (liver: 29,900 (77000) ng/g; gonad: 21,700(79700) ng/g) and then decreased before the first renewal. Threedays later (10 d), we observed a strong increase in all the organs,particularly in liver (44,20078000 ng/g) and gonads(40,20079100 ng/g), before decreasing again until the secondrenewal, with respective contents of 19,200 (715,400) ng/g and32,0007(3000) ng/g. Finally, after the second renewal, we foundsimilar contents in liver and gonad, between 35,000 and45,000 ng/g (Fig. 2a).
3.3.2. Exposure at 1 mg/LWith our analytic method based on the 15N/14N measurement,
we did not succeed in highlighting any significant muscle bio-concentration of tamoxifen in fish exposed to 1 mg/L. In liver, onlyfour significant contents were measured from 4700 (72510) ng/gat 3 d to 7900 (71920) ng/g at 10 d. The final average tamoxifencontent measured in liver was 5570 (71800) ng/g. In gonad, threeaverage contents were quantified at 14 d, 17 d and 21 d with 7370
(7610), 5860 (72210) and 858071750 ng/g, respectively(Fig. 2b).
3.3.3. Exposureat 0.1 mg/LOnly one average content was quantified at this concentration.
At 10 d, we found 7140 (74540) ng/g in fish liver.
3.4. Bioconcentration factors of tamoxifen (BCFMAX)
The maximum bioconcentration factors calculated for eachorgan are gathered in Table 2. It shows that gonads and liver arethe organs (of the three studied here) that bioconcentrate ta-moxifen most, with an average BCFMAX reaching 85,600 and73,800, respectively. Muscle bioconcentrates tamoxifen but with alower BCFMAX of around 15,000.
4. Discussion
4.1. 15N enrichment and bioconcentration
15N labeled tamoxifen was used to trace the incorporation oftamoxifen in D. rerio organs (liver, gonads and muscles).
Fig. 2. (a) Tamoxifen content in liver (blue diamond), gonads (red square) andmuscle (green triangle) as a function of time of fish exposed to 10 mg/L tamoxifen15N. Red arrows show renewal of half of the medium. Error bars show standarderrors (2SE). (b) Tamoxifen content in liver (blue diamond), gonads (red square)and muscle (green triangle) as a function of time of fish exposed to 1 mg/L ta-moxifen 15N. Red arrows show renewal of half of the medium. Error bars showstandard errors (2SE). (For interpretation of the references to color in this figurelegend, the reader is referred to the web version of this article.)
Table 2Tamoxifen contents (mg/g) and bioconcentration factors in muscles, gonads andlivers of Danio rerio after 21 d exposure to 10 mg/L tamoxifen.
TMX content in organs at day 21 (ngTMX/g dry weight)
BCFMAX (after 21 d) at 10 mg/L
Mean Standard error Mean Standard error
Muscles 7460 2600 14,920 5200Gonads 42,800 10,200 85,600 20,400Livers 36,900 10,000 73,800 20,000
F. Orias et al. / Ecotoxicology and Environmental Safety 120 (2015) 457–462460

Significant 15N enrichment at 10 mg/L exposure demonstrated thattamoxifen was transferred from water to these three organs. En-vironmental water is therefore a major contamination pathway fortamoxifen. Higher 15N enrichments in liver and gonads than inmuscles were measured. These results indicate higher tamoxifenaccumulation in these organs, as was expected, as liver and gonadsexhibit higher metabolic turnover rates and lipid contents thanmuscles. At lower exposure concentrations, 15N enrichment wasmuch lower, but nevertheless present in gonads and liver. Ta-moxifen therefore accumulated in these organs even at low con-centration in water, close to concentrations reported for tamoxifenin river water (Ashton et al., 2004; Yang et al., 2011).
Several studies have already shown the bioaccumulative po-tential of PCs in fish. Pharmaceuticals are found in all fish com-partments (i.e. brain, plasma, gills, liver, muscle, etc.) even in fishexposed at environmental concentrations (Al-Ansari et al., 2010;Chair et al., 1996; Garcia et al., 2012; Lajeunesse et al., 2011; Mi-meault et al., 2005). However, in the literature, information on themechanisms of this bioconcentration is still scarce.
In our experiments, the liver is the only organ in which wecould quantify tamoxifen at all the concentrations tested (0.1,1 and 10 mg/L). These results show that liver is the organ mostconcerned by the bioconcentration of tamoxifen. The other organswere also contaminated when we increased the exposure con-centration. We were able to quantify a significant tamoxifen con-tent in gonads immediately on reaching 1 mg/L, but only at 10 mg/Lfor muscle. This could the consequence of progressive liver “sa-turation” when exposure to the concentration increased. Above1 mg/L, the metabolization capacities of liver were exceeded andtamoxifen diffused into other organs. As gonads have a high lipidcontent, tamoxifen bioconcentration was privileged in this organ.These results are consistent with those of Liu et al. (2014), whoobserved a change in the distribution of roxythromycin, anotherPC, in the organs of Carassius auratus according to exposure con-centration. However, we need more data for the lowest con-centration (i.e. 0.1 mg/L) to fully validate this hypothesis.
At the highest concentrations (1 and 10 mg/L), we could see thatthe average contents inside liver and gonads were similar (around40,000 ng/g) at the end of exposure. However, if the respectivemasses of these organs in D. rerio are considered, it can be seenthat the highest contaminant load was present in gonads. Indeed,liver and gonads are approximately and respectively 1% and 10% ofthe organism's dry weight (Naderi et al., 2014). These observationslead to reflection on the consequences of this bioconcentration onfuture fish generations.
The maximal bioconcentration factors obtained for tamoxifenin our experiments are the highest ever measured. Some authorshave identified several bioaccumulative PCs such as diclofenac(BCF between 69 and 2730) (Schwaiger et al., 2004), carbamaze-pine (BCF from 1.9 to 4.6) (Garcia et al., 2012) and a sertralinemetabolite (i.e. desmethylsertraline), with a BCF in Salvelinus fon-tinalis liver (i.e. brook trout) of 12,250 (Lajeunesse et al., 2011).
4.2. Nominal, measured and real exposure concentrations in water
Great care had to be taken to limit the adsorption of tamoxifenand thus maximize tamoxifen dissolution during the experiment:air heating rather than water in order to prevent the use of plasticdevices inside the aquariums, use of a glass pipette for oxygen, useof single piece tanks without plastic seals and the drainage of fe-ces. Nevertheless, when we observed the values measured fordissolved tamoxifen, we realized that they were insufficient be-cause the nominal concentration had not been reached even at thebeginning of the experiment. This gap between real and nominalvalues at the beginning of the experiment (52%) was certainly dueto the adsorption of tamoxifen, a highly hydrophobic compound,
on the wall of the aquarium. Before the first renewal (7 d), thedissolved tamoxifen concentration was under the LOD (150 ng/L),probably because of the continuous adsorption on the wall of theaquariums but also on (and inside) the fish, and on the suspendedmatter accumulating in the aquariums during this period. Indeed,accumulated feces can trap tamoxifen and thus remove a largeamount of tamoxifen from the aquarium. After the following re-newals (day 7þ and day 14þ), we saw a strong decrease of thedissolved concentration but with similar concentrations at day 14and day 21 (0.6 and 0.5 mg/L, respectively). These analytic resultsshow that tamoxifen remained in the medium even after severaldays and despite a high concentration of suspended matter.
4.3. Tamoxifen and metabolites
The analytical method used to measure the tamoxifen contentin a biological matrix is an indirect method. In our study, initially,we considered that each supplementary 15N atom inside the or-ganism corresponded to one molecule of tamoxifen. Indeed, ta-moxifen is known to be a relatively stable molecule. This state hasbeen shown under different conditions: in the aquatic environ-ment (ECP, 2014), in wastewater treatment plant effluent (Negreiraet al., 2014; Zhou et al., 2009); under gastric conditions (Li et al.,2001), and under sunlight conditions (DellaGreca et al., 2007).
However, despite this stability, partial degradation couldnonetheless have occurred under the specific conditions of ourexperiments. That is why we decided to consider that the ta-moxifen bioconcentration measured corresponded to the max-imum, and that the calculated BCF corresponded to BCFMAX.
Moreover, if the hypothesis according to which “no biode-gradation of tamoxifen is possible” is correct for organisms such asalgal cells, this is probably not quite true for organisms such asfish. Indeed, fish such as D. rerio share a large proportion of bio-cellular characteristics with human beings (Gunnarsson et al.,2008). In addition, several authors have demonstrate that meta-bolites could be accumulate inside fish organs (Brooks et al., 2005;Lajeunesse et al., 2011).
5. Conclusion
In this work, we measured for the first time the bioconcen-tration dynamics of an anticancer drug detected several times inthe environment in three organs (liver, muscle and gonads) of avertebrate organism (D. rerio). Our results show that tamoxifenaccumulates considerably in fish, especially in fish gonad and liver,with a BCFMAX up to 85,600. We also showed that even at en-vironmental concentrations (i.e. several hundred ng/L), tamoxifenbioconcentrates significantly. In our experiments, we confirm thatbioconcentration differs according to the organ considered (La-jeunesse et al., 2011): tamoxifen content is higher in organs withhigh lipid contents. Bioconcentration also depends on the ex-posure concentration. Indeed, we obtained higher contents insideorganisms exposed to higher nominal tamoxifen concentrations.
Additionally, in these experiments we used isotopic chemistryfor the first time to measure the bioconcentration of a PC in avertebrate. This method has several advantages: all matrixes canbe analyzed (e.g. sediments, plants, invertebrates, etc.), a fewhundred mg are enough for a sample, and all the extraction pro-cesses leading to the loss of contaminant can be avoided. However,this method has a major disadvantage as it measures every 15Nlabelled molecule, without distinguishing between the originalmolecule and potential metabolites. However, in our work, thislimit was offset by the fact that tamoxifen is a persistent molecule(ECP, 2014; DellaGreca et al., 2007; Li et al., 2001; Negreira et al.,2014; Zhou et al., 2009) that metabolizes little. It is noteworthy
F. Orias et al. / Ecotoxicology and Environmental Safety 120 (2015) 457–462 461

that fish are nevertheless probably capable of metabolizing ta-moxifen (Gunnarsson et al., 2008). Thus in future research it willbe necessary to perform analytic experiments with LC–MS/MSanalysis, for example, to determine the precise rates of originaltamoxifen and metabolites in the matrixes analyzed.
Acknowledgments
The authors thank the SIPIBEL field observatory on hospitaleffluents and urban wastewater treatment plants, the EuropeanUnion, the Rhone-Mediterranean Corsica Water Agency, theRhône-Alpes Region, the Ministries of Health and the Environ-ment, the Regional Office of Health, and the General Council ofHaute-Savoie for their support.
Appendix A. Supplementary material
Supplementary data associated with this article can be found inthe online version at
http://dx.doi.org/10.1016/j.ecoenv.2015.06.033.
References
Al-Ansari, A.M., Saleem, A., Kimpe, L.E., Sherry, J.P., McMaster, M.E., Trudeau, V.L.,Blais, J.M., 2010. Bioaccumulation of the pharmaceutical 17α-ethinylestradiol inshorthead redhorse suckers (Moxostoma macrolepidotum) from the St. ClairRiver. Can. Environ. Pollut. 158, 2566–2571. http://dx.doi.org/10.1016/j.envpol.2010.05.020.
Ashton, D., Hilton, M., Thomas, K.V., 2004. Investigating the environmental trans-port of human pharmaceuticals to streams in the United Kingdom. Sci. TotalEnviron. 333, 167–184. http://dx.doi.org/10.1016/j.scitotenv.2004.04.062.
Brodin, T., Fick, J., Jonsson, M., Klaminder, J., 2013. Dilute concentrations of a psy-chiatric drug alter behavior of fish from natural populations. Science 339,814–815.
Brooks, B.W., Chambliss, C.K., Stanley, J.K., Ramirez, A., Banks, K.E., Johnson, R.D.,Lewis, R.J., 2005. Determination of select antidepressants in fish from an ef-fluent-dominated stream. Environ. Toxicol. Chem. 24, 464–469. http://dx.doi.org/10.1897/04-081R.1.
Chair, M., Nelis, H.J., Leger, P., Sorgeloos, P., de Leenheer, A.P., 1996. Accumulation oftrimethoprim, sulfamethoxazole, and N-acetylsulfamethoxazole in fish andshrimp fed medicated Artemia franciscana. Antimicrob. Agents Chemother. 40,1649–1652.
Collado, N., Rodriguez-Mozaz, S., Gros, M., Rubirola, A., Barceló, D., Comas, J., Ro-driguez-Roda, I., Buttiglieri, G., 2014. Pharmaceuticals occurrence in a WWTPwith significant industrial contribution and its input into the river system.Environ. Pollut. 185, 202–212. http://dx.doi.org/10.1016/j.envpol.2013.10.040.
Coplen, T.B., 2011. Guidelines and recommended terms for expression of stable-isotope-ratio and gas-ratio measurement results. Rapid Commun. Mass Spec-trom. 25, 2538–2560. http://dx.doi.org/10.1002/rcm.5129.
DellaGreca, M., Iesce, M.R., Isidori, M., Nardelli, A., Previtera, L., Rubino, M., 2007.Phototransformation products of tamoxifen by sunlight in water. Toxicity of thedrug and its derivatives on aquatic organisms. Chemosphere 67, 1933–1939.http://dx.doi.org/10.1016/j.chemosphere.2006.12.001.
ECP, Environmentally Classified Pharmaceuticals, 2014–2015, ⟨www.janusinfo.se/environement⟩.
Garcia, S.N., Foster, M., Constantine, L.A., Huggett, D.B., 2012. Field and laboratoryfish tissue accumulation of the anti-convulsant drug carbamazepine. Ecotox-icol. Environ. Saf. 84, 207–211. http://dx.doi.org/10.1016/j.ecoenv.2012.07.013.
Gunnarsson, L., Jauhiainen, A., Kristiansson, E., Nerman, O., Larsson, D.G.J., 2008.Evolutionary conservation of human drug targets in organisms used for en-vironmental risk assessments. Environ. Sci. Technol. 42, 5807–5813. http://dx.
doi.org/10.1021/es8005173.Jean, J., Perrodin, Y., Pivot, C., Trepo, D., Perraud, M., Droguet, J., Tissot-Guerraz, F.,
Locher, F., 2012. Identification and prioritization of bioaccumulable pharma-ceutical substances discharged in hospital effluents. J. Environ. Manag. 103,113–121. http://dx.doi.org/10.1016/j.jenvman.2012.03.005.
Kidd, K.A., Blanchfield, P.J., Mills, K.H., Palace, V.P., Evans, R.E., Lazorchak, J.M., Flick,R.W., 2007. Collapse of a fish population after exposure to a synthetic estrogen.Proc. Natl. Acad. Sci. USA 104, 8897–8901. http://dx.doi.org/10.1073/pnas.0609568104.
Kümmerer, K., 2009. The presence of pharmaceuticals in the environment due tohuman use – present knowledge and future challenges. J. Environ. Manag. 90,2354–2366. http://dx.doi.org/10.1016/j.jenvman.2009.01.023.
Lajeunesse, A., Gagnon, C., Gagné, F., Louis, S., Čejka, P., Sauvé, S., 2011. Distributionof antidepressants and their metabolites in brook trout exposed to municipalwastewaters before and after ozone treatment – evidence of biological effects.Chemosphere 83, 564–571. http://dx.doi.org/10.1016/j.chemosphere.2010.12.026.
Larsson, D.G.J., de Pedro, C., Paxeus, N., 2007. Effluent from drug manufacturescontains extremely high levels of pharmaceuticals. J. Hazard. Mater. 148,751–755. http://dx.doi.org/10.1016/j.jhazmat.2007.07.008.
Liu, J., Lu, G., Wang, Y., Yan, Z., Yang, X., Ding, J., Jiang, Z., 2014. Bioconcentration,metabolism, and biomarker responses in freshwater fish Carassius auratus ex-posed to roxithromycin. Chemosphere 99, 102–108. http://dx.doi.org/10.1016/j.chemosphere.2013.10.036.
Li, X.-F., Carter, S., Dovichi, N.J., Zhao, J.Y., Kovarik, P., Sakuma, T., 2001. Analysis oftamoxifen and its metabolites in synthetic gastric fluid digests and urinesamples using high-performance liquid chromatography with electrospraymass spectrometry. J. Chromatogr. A 914, 5–12. http://dx.doi.org/10.1016/S0021-9673(01)00538-6, Int. Symp. High Perform. Liq. Phase Sep. Relat.Technol..
Macova, S., Pistekova, V., Svobodova, Z., Votavova, P., Voslarova, E., Bedanova, I.,2008. Comparison of acute nitrite toxicity for various stages of Danio rerio.Toxicol. Lett. 180 (Supplement), S190. http://dx.doi.org/10.1016/j.tox-let.2008.06.195, Abstr. 45th Congr. Eur. Soc. Toxicol..
Mimeault, C., Woodhouse, A.J., Miao, X.-S., Metcalfe, C.D., Moon, T.W., Trudeau, V.L.,2005. The human lipid regulator, gemfibrozil bioconcentrates and reducestestosterone in the goldfish, Carassius auratus. Aquat. Toxicol. 73, 44–54. http://dx.doi.org/10.1016/j.aquatox.2005.01.009.
Naderi, M., Wong, M.Y.L., Gholami, F., 2014. Developmental exposure of zebrafish(Danio rerio) to bisphenol-S impairs subsequent reproduction potential andhormonal balance in adults. Aquat. Toxicol. 148, 195–203. http://dx.doi.org/10.1016/j.aquatox.2014.01.009.
Negreira, N., de Alda, M.L., Barceló, D., 2014. Cytostatic drugs and metabolites inmunicipal and hospital wastewaters in Spain: filtration, occurrence, and en-vironmental risk. Sci. Total Environ. 497–498, 68–77. http://dx.doi.org/10.1016/j.scitotenv.2014.07.101.
Orias, F., Simon, L., Perrodin, Y., 2015. Experimental assessment of the bioconcen-tration of 15N-tamoxifen in Pseudokirchneriella subcapitata. Chemosphere 122,251–256. http://dx.doi.org/10.1016/j.chemosphere.2014.11.070.
Schwaiger, J., Ferling, H., Mallow, U., Wintermayr, H., Negele, R.D., 2004. Toxic ef-fects of the non-steroidal anti-inflammatory drug diclofenac: Part I: histo-pathological alterations and bioaccumulation in rainbow trout. Aquat. Toxicol.68, 141–150. http://dx.doi.org/10.1016/j.aquatox.2004.03.014.
Verlicchi, P., Galletti, A., Petrovic, M., Barceló, D., 2010. Hospital effluents as a sourceof emerging pollutants: an overview of micropollutants and sustainabletreatment options. J. Hydrol. 389, 416–428. http://dx.doi.org/10.1016/j.jhydrol.2010.06.005.
Yang, Y., Fu, J., Peng, H., Hou, L., Liu, M., Zhou, J.L., 2011. Occurrence and phasedistribution of selected pharmaceuticals in the Yangtze Estuary and its coastalzone. J. Hazard. Mater. 190, 588–596. http://dx.doi.org/10.1016/j.jhazmat.2011.03.092.
Zenker, A., Cicero, M.R., Prestinaci, F., Bottoni, P., Carere, M., 2014. Bioaccumulationand biomagnification potential of pharmaceuticals with a focus to the aquaticenvironment. J. Environ. Manag. 133, 378–387. http://dx.doi.org/10.1016/j.jenvman.2013.12.017.
Zhou, J.L., Zhang, Z.L., Banks, E., Grover, D., Jiang, J.Q., 2009. Pharmaceutical residuesin wastewater treatment works effluents and their impact on receiving riverwater. J. Hazard. Mater. 166, 655–661. http://dx.doi.org/10.1016/j.jhazmat.2008.11.070.
F. Orias et al. / Ecotoxicology and Environmental Safety 120 (2015) 457–462462

CHAPITRE 9. BIOCONCENTRATION DU 15N TAMOXIFEN CHEZ DANIO RERIO
9.3 Synthèse
A la plus forte concentration d’exposition testée (10 µg/L), nous sommes parvenus àmettre en évidence une bioconcentration significative dans tous les organes du poisson aprèsseulement 21 jours d’exposition. A la concentration de 0,1 µg/L, inférieure à des concentra-tions déjà mesurées dans l’Environnement, seul le foie présente une bioconcentration quanti-fiable. Cependant, au niveau individuel, les gonades représentent le réservoir de contaminantle plus important. Les conséquences intergénérationnelles de cette bioconcentration repré-sentent un risque supplémentaire à celui de l’écotoxicité directe du contaminant.
143


CONCLUSION ET PERSPECTIVESGENERALES
145


Conclusion générale
L’étude bibliographique approfondie concernant les effluents hospitaliers, nous a permisde développer plusieurs points :
– Tout d’abord, nous avons publié la liste exhaustive des substances déjà recherchéesdans ces effluents à travers le monde. Nous avons identifié que près de 300 substancescomprenant des détergents, des métaux ou encore des résidus pharmaceutiques avaientdéjà été recherchées dans les effluents hospitaliers.
– Ensuite, nous avons réuni toutes les données d’écotoxicité disponibles pour ces sub-stances afin d’établir des concentrations sans effet (PNEC). Nous avons calculé deuxtypes de PNEC : celles basée sur des données de modélisation (i.e. ECOSAR (Sander-son et al., 2003)) au nombre de 61, et celles basées sur des données expérimentales,au nombre de 155. Parmi ces 155 substances, on trouve 12 métaux et 143 autres sub-stances. Pour 81 des substances recherchées, nous n’avons pas été en mesure de calculerde PNEC en raison du manque de données écotoxicologiques.
– Enfin, nous avons focalisé notre travail sur les 197 résidus pharmaceutiques déjà recher-chés dans les effluents hospitaliers. Nous avons caractérisé leur contribution au dangerécotoxicologique global des effluents hospitaliers en comparant les concentrations maxi-mum auxquelles on les avait déjà mesurées dans les effluents à leur PNEC. Ainsi, nousavons calculé 127 quotients de danger écotoxicologique. Parmi ceux-ci, nous avons iden-tifié les 15 RP les plus dangereux, conduisant à des quotients de danger supérieurs à1000.
Nous nous sommes ensuite intéressés à l’écotoxicité directe de 3 molécules modèles trèsbioaccumulables : le ritonavir, l’amiodarone et le tamoxifen. Parmi elles, nous avons montré,suite à la mise en œuvre d’une batterie de bioessais complémentaires, que c’était le tamoxifenqui était la molécule la plus écotoxique.
Puis nous avons étudié le rôle que pouvait jouer les excipients sur l’écotoxicité des principesactifs des médicaments. Nous avons alors observé que la nature de l’excipient était à prendreen compte lorsque des tests d’écotoxicité étaient effectués sur un médicament (principe actif+ excipient). En effet, si nous n’avons pas observé d’impact significatif de l’hydrochloratesur l’écotoxicité de l’amiodarone, le citrate a significativement augmenté l’écotoxicité dutamoxifen dans tous les tests d’écotoxicité mis en œuvre.
147

Enfin, étant donné que le tamoxifen était la molécule la plus écotoxique parmi nos mo-lécules modèles, nous avons choisi de caractériser le risque écotoxicologique qu’il pouvaitreprésenter pour les écosystèmes aquatiques de quelques cours d’eau étudié par d’autres surle plan international. Nous avons ainsi mis en évidence que le tamoxifen présentait un risqueécotoxicologique significatif pour deux des cours d’eau où il avait été mesuré.
Une fois caractérisée l’écotoxicité directe du tamoxifen, nous nous nous sommes intéesséà son écotoxicité potentielle indirecte liée à sa bioconcentration dans les organismes. Ainsi,nous avons évalué sa bioaccumulabilité chez P. subcapitata, D. magna et D. rerio.
– Chez les algues, nous avons mesuré une bioconcentration très rapide. En effet, dès lespremières minutes d’exposition, nous avons mesuré des teneurs en tamoxifen 10000fois supérieures dans les algues que dans l’eau. Le facteur de bioconcentration le plusimportant que nous avons mesuré est de 26700.
– Dans le niveau trophique supérieur, les daphnies, nous avons également mesuré une bio-concentration forte et rapide du tamoxifen avec des teneurs près de 1000 fois supérieuresdans les daphnies que dans l’eau, ceci après seulement 2 heures d’exposition. Chez lesdaphnies, nous avons également pu tester l’impact d’une alimentation contaminée surla bioaccumulation du tamoxifen. Nous avons mis en évidence que plus la concentrationdu milieu était basse, plus l’impact de l’alimentation dans la contamination était impor-tant. Autrement dit, plus la concentration dans le milieu sera faible, plus l’alimentationcontribuera de manière importante à la contamination de l’organisme.
– Chez le dernier organisme que nous avons testé, le poisson zèbre, nous avons mesuréla bioconcentration du tamoxifen dans trois organes : le foie, les gonades et le muscle.Nous avons déterminé que le foie et les gonades étaient les organes privilégiés de bio-concentration du tamoxifen avec de fortes teneurs dès les premiers jours d’exposition.Au regard de la masse de gonades présente chez ces poissons, nous avons égalementdéterminé que cet organe accumulait la grande majorité du tamoxifen bioconcentré àl’échelle de l’organisme. Les facteurs de bioconcentration maximaux mesurés dans lesfoies et les gonades de ces organismes sont respectivement de l’ordre de 73800 et 85600après 21 jours d’exposition.
Enfin, au cours de ces travaux, nous avons développé une méthode nous permettant d’étu-dier le transfert dans les organismes de molécules bioaccumulables. Cette méthode d’analysequi s’appuie sur la mesure du ratio isotopique d’un élément donné, présente de nombreuxavantages :
– Le premier d’entre eux est la possibilité de mesurer une accumulation de contaminantdans n’importe quelle matrice : organisme végétal, animal ou sédiment. Cet avantageserait particulièrement utile dans une approche de type micro ou mésocosme. En ef-fet, il serait possible de suivre dans tous les compartiments du système le devenir ducontaminant considéré.
148

– Grâce à cette technique d’analyse, nous n’avons pas besoin d’effectuer d’étape d’ex-traction sur nos échantillons. Cette étape est cruciale car c’est à ce moment qu’il estpossible de perdre une quantité non négligeable de contaminant. Ces pertes peuventêtre compensées par l’introduction de standards interne et/ou externe mais sans êtrecertain que ces standards se comportent exactement comme le contaminant. De plus,les protocoles d’extraction ou les standards n’existent pas toujours. Ainsi, il n’est paspossible de travailler avec n’importe quelle substance.
– Cette technique présente également l’avantage de ne nécessiter qu’une très faible massed’échantillon. En effet, dans nos travaux, le seuil minimal était de 150 µg de matériel. Ilest assez facile d’imaginer l’avantage que cela représente quand on sait que les techniquesd’analyse par chromatographie par exemple nécessitent plusieurs dizaine de mg dematériel.
– Une autre méthode d’analyse indirecte est utilisée dans les études de transfert de sub-stance dans les organismes, et repose sur l’utilisation d’isotopes radioactifs. Avec laméthode que nous avons développé, les risques pratiques liés à l’utilisation de ce typede substances (i.e. radioactivité) sont inexistants. Par ailleurs, l’utilisation d’isotopestable ne peut pas perturber le développement de l’organisme contrairement une laradioactivité.
Cependant, si nous avons réussi à nous affranchir des contraintes liées aux techniquesclassiques d’analyse dans ce type d’étude (i.e. chromatographie ou radioactivité), nous avonsété confrontés à certaines limites :
– La première limite de notre technique d’analyse concerne la possible surévaluation de laconcentration en tamoxifen, pouvant être liée au fait que chaque atome d’azote présentdans les tissus est assimilé à une molécule de tamoxifen, alors qu’il pourrait s’agirpartiellement de métabolites du tamoxifen, voire d’une produit de dégradation final.La dégradation jusqu’à un produit final, nous parait exclue ou minoritaire, à l’échellede temps à laquelle on a travaillé, compte-tenu du caractère très stable de la molécule(DellaGreca et al., 2007). A l’inverse, les métabolites du tamoxifen peuvent être prisen compte dans les mesures basées sur l’analyse élémentaire. Dans ces conditions, onpourrait plutôt considérer que « tamoxifen » signifie « tamoxifen + métabolites » dansles résultats de nos expérimentions, ce qui reste très intéressant, voire un « plus », enévitant d’exclure du raisonnement des molécules qui peuvent contribuer fortement àl’impact environnemental de cette substance. Nous avons attiré l’attention sur ce pointdans la discussion et les conclusions de nos différentes publications. De plus, nous avonsréalisé en fin de thèse une étude exploratoire de comparaison de l’analyse isotopique etde l’analyse « classique » (i.e. HPLC-MS), désormais possible pour le tamoxifen (horsmétabolites), sur un des tissus échantillonnés : les gonades de poisson. Cette étudeexploratoire, décrite en annexe X, va dans le sens de la présence à la fois du tamoxifenet de ses métabolites dans les tissus exposés, et conclue à la possibilité et l’intérêt, via
149

la conduite en parallèle de ces deux types d’analyses, d’exprimer désormais deux typesde BCF, en vue de leur usage dans l’évaluation des risques écotoxicologiques : le BCFdu tamoxifen « strict » et le BDC du « tamoxifen + métabolites ».
– Une autre contrainte de notre méthode est la limite de quantification qui, dans lesconditions où nous avons travaillé, est très haute. En effet, quand les méthodes d’analysepar chromatographie nous proposent des limites de quantification de l’ordre du ng/g,nous ne sommes pas capables de quantifier précisément au-dessus du µg/g avec l’analyseisotopique. Cependant, cette limite doit pouvoir être baissée en augmentant les prisesd’essai qui dans nos travaux étaient très basses.
– La dernière contrainte majeure liée à notre méthode d’analyse est l’impossibilité de l’ap-pliquer in situ. En effet, il est indispensable d’utiliser des contaminants marqués pourobserver une variation du ratio isotopique. L’utilisation de notre méthode d’analyseisotopique est strictement limitée aux études in vitro.
150

Perspectives générales
Les résultats obtenus lors de nos expérimentations présentent de nombreuses perspectives.
Chez les algues nous avons observé des facteurs de bioconcentration (BCF) très importants(i.e. jusqu’à 26700) pouvant être liés au fait que cet organisme est incapable d’excréter et/oude dégrader le tamoxifen comme peuvent le faire les autres organismes testés. Par ailleurs,il est impossible de déterminer si ce contaminant s’adsorbe simplement à la surface desalgues ou s’il est internalisé dans la cellule. Des techniques de microscopie couplées à unmarquage des molécules de tamoxifen pourraient nous indiquer à quel endroit se positionneles contaminants. Par ailleurs, dans les conditions expérimentales que nous avons testées, toutle tamoxifen en solution a été fixé par les algues en suspension. Ainsi, nous ne connaissonspas le BCF maximal du couple algue/tamoxifen. La modélisation pourrait venir en aide sinous arrivons à déterminer le taux de saturation des cellules algales, par exemple en exposantdes algues au tamoxifen sans lumière, rendant la croissance nulle et donc la dilution dans labiomasse nulle.
L’objectif de l’expérience sur les daphnies était notamment de déterminer quel pouvait êtrel’impact d’un régime alimentaire contaminé sur l’accumulation du contaminant à l’échelle del’organisme. Nous avons mis en évidence que cet apport alimentaire était non négligeablecar en n’exposant les daphnies que par la voie alimentaire, on observait une accumulationdu tamoxifen dans l’organisme (teneur en tamoxifen dans les daphnies jusqu’à 30 µg/g). Enrevanche, en comparaison de l’apport lié au milieu d’exposition, la contamination liée ré-gime alimentaire est beaucoup plus faible. Notons cependant que plus la concentration dansle milieu est faible plus la fraction de contaminant apportée par le régime alimentaire estimportante. Pour vérifier si cela est lié à la durée d’exposition aux deux voies de contami-nation, il faudrait effectuer la même expérience mais en augmentant la fréquence des étapesd’alimentation. Par ailleurs, dans nos expérimentations, nous avons choisi de contaminer trèsfortement l’alimentation des daphnies, en l’occurrence les algues, en exposant ces cellules àune forte concentration en tamoxifen (i.e. 100 µg/L), supérieure à celle du milieu d’expositiondes daphnies (i.e.5 et 50 µg/L). Ainsi, nous n’avons pas pu évaluer la bioamplification dutamoxifen entre ces deux maillons de la chaîne alimentaire. En effet, pour évaluer ce phéno-mène, il est nécessaire que les deux organismes soient exposés aux mêmes concentrations decontaminant. Récemment, une nouvelle perspective s’est ouverte dans ce domaine. Les proto-
151

coles analytiques sont désormais disponibles pour analyser le tamoxifen dans les organismesinvertébrés par chromatographie. Il serait donc intéressant de dimensionner de nouvelles ex-périences de sorte à pouvoir comparer les teneurs en tamoxifen mesurées dans les daphniespar les deux méthodes (i.e. HPLC-MS-MS et EA-IRMS) afin d’étudier la capacité excrétricedes invertébrés.
Le poisson zèbre, chez qui nous avons étudié la bioconcentration du tamoxifen, a égale-ment montré des résultats positifs. Les trois organes de Danio rerio étudiés ont montré desmodifications significatives du ratio 15N/14N, mais dans des proportions plus ou moins im-portantes. C’est dans le foie et les gonades que nous retrouvons les plus fortes teneurs entamoxifen après 21 jours d’exposition, dans des proportions similaires (i.e. BCF entre 13000et 85600). Ainsi, en considérant la masse des différents organes, nous avons mis en évidenceque les gonades étaient le réservoir de contaminant prédominant à l’échelle de l’organisme.Ces résultats nous encouragent à étudier ces phénomènes à plus long terme. D’une part, pourobserver ce que ces phénomènes d’accumulation dans les gonades pouvaient engendrer sur ladescendance. D’autre part, pour observer si avec une exposition plus longue les muscles pou-vaient être également contaminés via ces phénomènes d’accumulation avec les conséquencessanitaires imaginables. Au niveau expérimental, quelques améliorations peuvent être appor-tées au protocole mis en place. Dans cette expérience sur la bioconcentration du tamoxifendan le poisson, nous avons régulièrement éliminé les fèces du système. Or, que ce soit parl’excrétion ou par l’adsorption sur ces dernières, le tamoxifen sort du système. Grâce à notreméthode nous permettant de mesurer la teneur en tamoxifen sur toutes les matrices, nousaurions dû mesurer ce ratio dans les fèces pour évaluer la quantité de tamoxifen qu’ellescontenaient. Par ailleurs, pour limiter les variations dans le ratio 15N/14N du témoin, il seraitutile de standardiser l’alimentation. En effet, dans nos expériences, nous avons nourri lespoissons avec du Tetraminő en paillette qui comprend différents type d’aliments broyés (i.e.algues, invertébrés,...) avec des ratios 15N/14N différents qui peuvent ainsi perturber la teneurde base en 15N du témoin. A terme, afin d’approfondir nos connaissances sur le transfert descontaminants dans les chaînes alimentaires, l’idéal serait d’alimenter nos poissons avec desinvertébrés élevés dans un milieu contaminé et non contaminé ayant reçu une alimentation enalgues contaminées et non contaminées. En somme, l’objectif ultime est de réaliser tous lestraitements présentés dans la chaîne alimentaire artificielle présentée au début de la partie 3de ce manuscrit (figure 6.1).
En complément des travaux réalisés sur ces trois organismes, des études sur d’autres orga-nismes modèles seraient utiles pour mieux évaluer les risques liés à la bioaccumulation dansles écosystèmes. Par exemple, pour les algues, nous pourrions évaluer la bioconcentrationdu tamoxifen chez des algues mobiles comme les Chlamydomonas reinhardtii. Pour les inver-tébrés, nous pourrions travailler avec des mollusques (e.g. Potamopyrgus antipodarum) quisont des organismes filtreurs et très riches en lipides. Ainsi, on peut s’attendre à des fac-
152

teurs de bioconcentration et de bioaccumulation encore plus élevés que chez la daphnie. Lepoisson modèle que nous avons choisi est un poisson tropical qui vit dans eaux relativementchaudes (i.e. 26-28˚C) assez éloignées des conditions environnementales de nos écosystèmeseuropéens. Ainsi, travailler sur une espèce d’eau plus froide pourrait nous fournir des infor-mations intéressantes sur la bioconcentration sous nos latitudes.
Lorsque les données d’écotoxicité d’une substance sont disponibles, il est à noter qu’il s’agitle plus souvent de données d’écotoxicité aiguë. Or, il est indispensable de connaître l’effetà long terme d’une substance pour évaluer au mieux les risques qu’elle représente pour lesécosystèmes. Dans l’idéal, pour évaluer au mieux le risque écotoxicologique vis-à-vis d’un or-ganisme, il est même nécessaire d’évaluer l’impact d’une gamme de concentration à tous lesstades de développement de l’organisme considéré. Pour mieux évaluer le comportement desRP à l’échelle de l’écosystème, certaines équipes de recherche ont effectuée des tests d’éco-toxicité à l’échelle du microcosme voire du mésocosme. Cette approche permet non seulementd’évaluer l’impact du contaminant sur l’organisme mais également sur les relations qu’il peutavoir avec les autres organismes avec lesquels il est susceptible d’interagir. Concernant laméthode d’analyse isotopique que nous avons développée, elle pourrait être appliquée surd’autres molécules pour répondre à de problématiques différentes. D’une part, travailler avecdes molécules faciles à analyser dans les différentes matrices biologiques (e.g. diclofenac, pa-racétamol). En utilisant de manière complémentaire les analyses par chromatographie et parisotopie, nous pourrions mieux comprendre les mécanismes de dégradation de ces moléculesdans des organismes non cibles des RP (i.e. organismes vivants autres que l’Homme). D’autrepart, nous pourrions approfondir les expérimentations sur les molécules prioritaires bioaccu-mulables. Le meilleur candidat pour cela semble être l’amiodarone. En effet, cette moléculeprésente un seul azote dans sa structure moléculaire. Elle est analysable par chromatographiedans les matrices biologiques et c’est la molécule la plus potentiellement bioaccumulable.
153


ANNEXE
155


Annexe :Comparaison de l’analyse dutamoxifen dans les organismes vivantspar EA-IRMS et par HPLC-MS-MS
Etude exploratoire réalisée en collaboration avec l’Institut des SciencesAnalytiques (ISA) du CNRS
Au démarrage de cette thèse, les protocoles analytiques pour l’analyse des résidus médi-camenteux par une approche classique (extraction + dosage par HPLC-MS-MS) n’étaientpas disponibles. Pour cette raison, et notamment pour la possibilité de travailler avec detrès petites prises d’essai, nous avons développé une méthode spécifique dite des « isotopesstables ».
Cette méthode qui a donné satisfaction pour nos travaux, pose toutefois la question dela possible surévaluation de la concentration en tamoxifen « strict », qui pourrait être liéeau fait que chaque atome d’azote présent dans les tissus est assimilé à une molécule de ta-moxifen, alors qu’il pourrait s’agir partiellement de métabolites du tamoxifen, voire d’unproduit de dégradation final. La dégradation jusqu’à un produit de dégradation final, nousparait exclue ou minoritaire, à l’échelle de temps à laquelle on a travaillé, compte-tenu ducaractère très stable de la molécule (DellaGreca et al., 2007). A l’inverse, les métabolitespeuvent être pris en en compte par la mesure puisque tous les métabolites connus du tamoxi-fen possèdent un atome d’azote : 4-hydroxytamoxifen, N-dedimethyltamoxifen, 4-hydroxy-N-demethyltamoxifen, tamoxifen-N-oxide ou N-desmethyltamoxifen (DellaGreca et al., 2007;Kisanga et al., 2005; Gjerde et al., 2005).
Dans ces conditions, on pourrait considérer que « tamoxifen » signifie « tamoxifen + mé-tabolites » dans les résultats de nos expérimentions, ce qui est très intéressant, en évitantd’exclure du raisonnement des molécules qui peuvent contribuer fortement à l’impact envi-ronnemental de ce RP. Nous avons attiré l’attention sur ce point dans la discussion et lesconclusions de nos différentes publications. Pour consolider ces hypothèses, et compte-tenude l’avancée récente des techniques analytiques « classiques », nous avons décidé de lancer
157

fin 2014, en complément de nos travaux initiaux, et en collaboration avec l’ISA du CNRS,une étude exploratoire de comparaison des deux protocoles analytiques portant sur au moinsun tissu vivant : les gonades de poisson. Ce tissu a été choisi en raison de la concentrationimportante en tamoxifen à l’issue de nos expériences, mais aussi en raison de la quantité debiomasse disponible. Ce travail exploratoire a permis de comparer les deux valeurs de BCFobtenues entre elles, mais aussi de les situer par rapport aux valeurs théoriques présentesdans la littérature (tableau ci-dessous). Dans ce tableau nous avons 3 types BCF différents :
– BCFthéorique : Ce BCF est obtenu de manière théorique grâce à une méthode baséesur la relation entre structure et l’activité d’une molécule donnée (Jean et al., 2012).
– BCFtotal : Ce BCF est obtenu à partir des teneurs en tamoxifen mesurées dans lesgonades de poissons obtenues par la méthode isotopique décrite au Chapitre 9.
– BCFstrict : Ce BCF est obtenu à partir des teneurs en tamoxifen mesurées dans lesgonades de poissons obtenue par l’approche « extraction + HPLC-MS-MS » (prise encompte uniquement du tamoxifen, les métabolites étant non dosables dans les tissusvivants par cette technique, dans l’état actuel des connaissances).
BCFthéorique 1620 (pH 6) à 385000 (pH9)BCFtotal 85600 (Erreur standard : 20400)BCFstrict 8648 à 10758
La plus faible valeur expérimentale est obtenue par la méthode dite « classique ». Ellepeut s’expliquer par le dosage exclusif du tamoxifen, mais aussi par la perte de contaminantlors de l’étape d’extraction préalable au dosage par HPLC (contrairement à la méthodedes isotopes qui ne nécessite pas d’extraction). Les deux techniques d’analyse pratiquéess’avèrent complémentaires, et nous disposons désormais d’une valeur du BCF du « tamoxifen+ métabolites », et d’une valeur du BCF pour le « tamoxifen seul » (c’est toutefois unminimum compte-tenu des pertes potentielles lors de l’extraction).
Ce travail reste maintenant à préciser et à consolider par des études complémentaires, enparticulier en dosant les principaux métabolites du tamoxifen par la méthode « classique »,et en caractérisant le BCF pour d’autres organes et tissus du poisson et pour les autresorganismes de notre chaine trophique (algues, daphnie). Concernant les micro-algues, il estprobable que les métabolites seront moins présents compte-tenu de leur arsenal métaboliqueplus limité dans le domaine, mais cela reste à démontrer expérimentalement.
Ces deux valeurs expérimentales correspondent néanmoins d’ores et déjà à des informationsextrêmement intéressantes, et nettement plus robustes que les valeurs théoriques relevéesdans la littérature, en vue d’une évaluation des risques écotoxicologiques liées à la présencede l’environnement de ce type molécules.
158

BibliographieListe des publications citées dans le corps du manuscrit
159

BIBLIOGRAPHIE
160

Bibliographie
Abarnou, A. and Blanchard, M. (2000). Les contaminants organiques : quels risques pour lemonde vivant ? Ifremer.
Aherne, G., English, J., and Marks, V. (1985). The role of immunoassay in the analysis ofmicrocontaminants in water samples. Ecotoxicology and Environmental Safety, 9(1) :79–83.
Arnot, J. A. and Gobas, F. A. (2006). A review of bioconcentration factor (BCF) andbioaccumulation factor (BAF) assessments for organic chemicals in aquatic organisms.Environmental Reviews, 14(4) :257–297.
Barnes, K. K., Kolpin, D. W., Furlong, E. T., Zaugg, S. D., Meyer, M. T., and Barber,L. B. (2008). A national reconnaissance of pharmaceuticals and other organic wastewatercontaminants in the United States Ů I) Groundwater. Science of The Total Environment,402(2-3) :192–200.
Bartelt-Hunt, S., Snow, D. D., Damon-Powell, T., and Miesbach, D. (2011). Occurrenceof steroid hormones and antibiotics in shallow groundwater impacted by livestock wastecontrol facilities. Journal of Contaminant Hydrology, 123(3-4) :94–103.
Berthelot, M. and Jungfleisch, E. (1872). Sur les lois qui president ou partage dŠun corpsentre deux dissolvants (experiences). (26) :396–407.
Blair, B. D., Crago, J. P., Hedman, C. J., and Klaper, R. D. (2013). Pharmaceuticals andpersonal care products found in the Great Lakes above concentrations of environmentalconcern. Chemosphere, 93(9) :2116–2123.
Boillot, C., Bazin, C., Tissot-Guerraz, F., Droguet, J., Perraud, M., Cetre, J. C., Trepo,D., and Perrodin, Y. (2008). Daily physicochemical, microbiological and ecotoxicologicalfluctuations of a hospital effluent according to technical and care activities. Science of TheTotal Environment, 403(1-3) :113–129.
Brackers de Hugo, A., Sylvie, B., Alain, D., Jérôme, G., and Yves, P. (2013). Ecotoxicologicalrisk assessment linked to the discharge by hospitals of bio-accumulative pharmaceuticalsinto aquatic media : The case of mitotane. Chemosphere, (0).
Brodin, T., Fick, J., Jonsson, M., and Klaminder, J. (2013). Dilute Concentrations of a Psy-chiatric Drug Alter Behavior of Fish from Natural Populations. Science, 339(6121) :814–815.
Brown, J. N., Paxéus, N., Förlin, L., and Larsson, D. J. (2007). Variations in bioconcentrationof human pharmaceuticals from sewage effluents into fish blood plasma. EnvironmentalToxicology and Pharmacology, 24(3) :267–274.
161

BIBLIOGRAPHIE
Burridge, L., Weis, J. S., Cabello, F., Pizarro, J., and Bostick, K. (2010). Chemical usein salmon aquaculture : A review of current practices and possible environmental effects.Aquaculture, 306(1-4) :7–23.
Cardoso, O., Porcher, J.-M., and Sanchez, W. (2014). Factory-discharged pharmaceuticalscould be a relevant source of aquatic environment contamination : Review of evidenceand need for knowledge. PHARMACEUTICAL PRODUCTS IN THE ENVIRONMENT :FOR A MORE RELIABLE RISK ASSESSMENT, 115(0) :20–30.
Chèvre, N., Coutu, S., Margot, J., Wynn, H. K., Bader, H.-P., Scheidegger, R., and Rossi, L.(2013). Substance flow analysis as a tool for mitigating the impact of pharmaceuticals onthe aquatic system. Water Research, 47(9) :2995–3005.
Claessens, M., Vanhaecke, L., Wille, K., and Janssen, C. R. (2013). Emerging contaminantsin Belgian marine waters : Single toxicant and mixture risks of pharmaceuticals. MarinePollution Bulletin, 71(1-2) :41–50.
Clément, B. and Zaid, S. (2004). A new protocol to measure the effects of toxicants ondaphnid-algae interactions. Chemosphere, 55(10) :1429–1438.
Collado, N., Rodriguez-Mozaz, S., Gros, M., Rubirola, A., Barceló, D., Comas, J., Rodriguez-Roda, I., and Buttiglieri, G. (2014). Pharmaceuticals occurrence in a WWTP with signifi-cant industrial contribution and its input into the river system. Environmental Pollution,185(0) :202–212.
DellaGreca, M., Iesce, M. R., Isidori, M., Nardelli, A., Previtera, L., and Rubino, M. (2007).Phototransformation products of tamoxifen by sunlight in water. Toxicity of the drug andits derivatives on aquatic organisms. Chemosphere, 67(10) :1933–1939.
Eckel, W. P., Ross, B., and Isensee, R. K. (1993). Pentobarbital Found in Ground Water.Ground Water, 31(5) :801–804.
Emmanuel, E., Perrodin, Y., Keck, G., Blanchard, J. M., and Vermande, P. (2005). Ecotoxi-cological risk assessment of hospital wastewater : a proposed framework for raw effluentsdischarging into urban sewer network. Journal of Hazardous Materials, 117(1) :1–11.
Fick, J., Söderström, H., Lindberg, R. H., Phan, C., Tysklind, M., and Larsson, D. G. J.(2009). Contamination of surface, ground, and drinking water from pharmaceutical pro-duction. Environmental Toxicology and Chemistry, 28(12) :2522–2527.
Gauld, D. T. (1951). The grazing rate of planktonic copepods. Journal of the MarineBiological Association of the United Kingdom, 29(03) :695–706.
Gjerde, J., Kisanga, E., Hauglid, M., Holm, P., Mellgren, G., and Lien, E. (2005). Iden-tification and quantification of tamoxifen and four metabolites in serum by liquidchromatography-tandem mass spectrometry. 1082(1) :6–14.
Gros, M., Rodríguez-Mozaz, S., and Barceló, D. (2013). Rapid analysis of multiclass antibio-tic residues and some of their metabolites in hospital, urban wastewater and river waterby ultra-high-performance liquid chromatography coupled to quadrupole-linear ion traptandem mass spectrometry. Journal of Chromatography A, 1292(0) :173–188.
162

BIBLIOGRAPHIE
Gunnarson, L., K., E., J., and A. (2008). Evolutionnary Conservation of Human Drug Targetin Organisms used for Environmental Risk Assessment. Environ. Sci. Technol, 42 :5807–5813.
Hansch, C. and Leo, A. (1979). Substituent constants for correlation analysis in chemistryand biology. Wiley-Interscience publication. Wiley.
Heberer, T. and Stan, H.-J. (1997). Determination of Clofibric Acid and N-(Phenylsulfonyl)-Sarcosine in Sewage, River and Drinking Water. International Journal of EnvironmentalAnalytical Chemistry, 67(1-4) :113–124.
Hunt, E. and Bischoff, A. (1960). Inimical effects on wildlife of periodic application of DDDto Clear lake. Califrornia Fish and Game.
ISO (1995). Qualité de l’eau - Détermination de la mobilité de Daphnia magna Straus,Cladocera, Crustacea, essai de toxicité aiguë.
Jacobsen, P. and Berglind, L. (1988). Persistence of oxytetracycline in sediments from fishfarms. Aquaculture, 70(4) :365–370.
Jaffal, A., Givaudan, N., Betoulle, S., Terreau, A., Paris-Palacios, S., Biagianti-Risbourg, S.,Beall, E., and Roche, H. (2011). Polychlorinated biphenyls in freshwater salmonids fromthe Kerguelen Islands in the Southern Ocean. Adaptation of Forest Ecosystems to AirPollution and Climate Change, 159(5) :1381–1389.
Jean, J., Perrodin, Y., Pivot, C., Trepo, D., Perraud, M., Droguet, J., Tissot-Guerraz, F.,and Locher, F. (2012). Identification and prioritization of bioaccumulable pharmaceuti-cal substances discharged in hospital effluents. Journal of Environmental Management,103(0) :113–121.
Jobling, S., Nolan, M., Tyler, C. R., Brighty, G., and Sumpter, J. P. (1998). WidespreadSexual Disruption in Wild Fish. Environmental Science & Technology, 32(17) :2498–2506.
Kidd, K. A., Blanchfield, P. J., Mills, K. H., Palace, V. P., Evans, R. E., Lazorchak, J. M., andFlick, R. W. (2007). Collapse of a fish population after exposure to a synthetic estrogen.Proceedings of the National Academy of Sciences, 104(21) :8897–8901.
Kinney, C. A., Furlong, E. T., Kolpin, D. W., Burkhardt, M. R., Zaugg, S. D., Werner,S. L., Bossio, J. P., and Benotti, M. J. (2008). Bioaccumulation of Pharmaceuticals andOther Anthropogenic Waste Indicators in Earthworms from Agricultural Soil AmendedWith Biosolid or Swine Manure. Environmental Science & Technology, 42(6) :1863–1870.
Kisanga, E. R., Moi, L. L. H., Gjerde, J., Mellgren, G., and Lien, E. A. (2005). Induction ofhepatic drug-metabolising enzymes and tamoxifen metabolite profile in relation to adminis-tration route during low-dose treatment in nude rats. The Journal of Steroid Biochemistryand Molecular Biology, 94(5) :489–498.
Kümmerer, K. (2001). Drugs in the environment : emission of drugs, diagnostic aids anddisinfectants into wastewater by hospitals in relation to other sources - a review. Chemos-phere, 45(6-7) :957–969.
163

BIBLIOGRAPHIE
Kümmerer, K., Al-Ahmad, A., Bertram, B., and Wießler, M. (2000). Biodegradability ofantineoplastic compounds in screening tests : influence of glucosidation and of stereoche-mistry. Chemosphere, 40(7) :767–773.
Kolodziej, E. P., Harter, T., and Sedlak, D. L. (2004). Dairy wastewater, aquaculture, andspawning fish as sources of steroid hormones in the aquatic environment. Environmentalscience & technology, 38(23) :6377–6384.
Kolpin, D. W., Furlong, E. T., Meyer, M. T., Thurman, E. M., Zaugg, S. D., Barber, L. B.,and Buxton, H. T. (2002). Pharmaceuticals, Hormones, and Other Organic WastewaterContaminants in U.S. Streams, 1999-2000 : A National Reconnaissance. EnvironmentalScience & Technology, 36(6) :1202–1211.
Lai, K. M., Scrimshaw, M. D., and Lester, J. N. (2002). Prediction of the bioaccumulationfactors and body burden of natural and synthetic estrogens in aquatic organisms in theriver systems. Science of The Total Environment, 289(1-3) :159–168.
Lajeunesse, A., Gagnon, C., Gagné, F., Louis, S., Cejka, P., and Sauvé, S. (2011). Distributionof antidepressants and their metabolites in brook trout exposed to municipal wastewatersbefore and after ozone treatment - Evidence of biological effects. Chemosphere, 83(4) :564–571.
Langford, K. H. and Thomas, K. V. (2009). Determination of pharmaceutical compoundsin hospital effluents and their contribution to wastewater treatment works. EnvironmentInternational, 35(5) :766–770.
Lapworth, D., Baran, N., Stuart, M., and Ward, R. (2012). Emerging organic contami-nants in groundwater : A review of sources, fate and occurrence. Environmental Pollution,163(0) :287–303.
Lin, A. Y.-C., Wang, X.-H., and Lin, C.-F. (2010). Impact of wastewaters and hospitaleffluents on the occurrence of controlled substances in surface waters. Chemosphere,81(5) :562–570.
Loos, R., Gawlik, B. M., Locoro, G., Rimaviciute, E., Contini, S., and Bidoglio, G. (2009). EU-wide survey of polar organic persistent pollutants in European river waters. EnvironmentalPollution, 157(2) :561–568.
Loos, R., Locoro, G., Comero, S., Contini, S., Schwesig, D., Werres, F., Balsaa, P., Gans, O.,Weiss, S., Blaha, L., Bolchi, M., and Gawlik, B. M. (2010). Pan-European survey on theoccurrence of selected polar organic persistent pollutants in ground water. Water Research,44(14) :4115–4126.
Mater, N., Geret, F., Castillo, L., Faucet-Marquis, V., Albasi, C., and Pfohl-Leszkowicz, A.(2014). In vitro tests aiding ecological risk assessment of ciprofloxacin, tamoxifen andcyclophosphamide in range of concentrations released in hospital wastewater and surfacewater. Environment International, 63(0) :191–200.
Nelis, H. J., Léger, F., Sorgeloos, P., and De leenheer, A. P. (1991). Liquid chromatographicdetermination of efficacy of incorporation of trimethoprim and sulfamethoxazole in brineshrimp (Artemia spp.) used for prophylactic chemotherapy of fish. Antimicrobial Agentsand Chemotherapy, 35(12) :2486–2489.
164

BIBLIOGRAPHIE
Norpeth, K., Nehrkorn, A., Kirchner, M., Holsen, H., and Teipel, H. (1973). Investigationson the problem of solubility and stability of steroid ovulation inhibitors in water, wastewater and activated sludge.
OECD (2006). OECD GUIDELINES FOR THE TESTING OF CHEMICALS : FreshwaterAlga and Cyanobacteria, Growth Inhibition Test.
Orias, F. and Perrodin, Y. (2013). Characterisation of the ecotoxicity of hospital effluents :A review. Science of The Total Environment, 454-455(0) :250–276.
Ort, C., Lawrence, M. G., Reungoat, J., Eaglesham, G., Carter, S., and Keller, J. (2010). De-termining the fraction of pharmaceutical residues in wastewater originating from a hospital.Water Research, 44(2) :605–615.
Papa, E., Dearden, J., and Gramatica, P. (2007). Linear QSAR regression models for the pre-diction of bioconcentration factors by physicochemical properties and structural theoreticalmolecular descriptors. Chemosphere, 67(2) :351–358.
Perrodin, Y., Christine, B., Sylvie, B., Alain, D., Jean-Luc, B.-K., Cécile, C.-O., Audrey, R.,and Elodie, B. (2012). A priori assessment of ecotoxicological risks linked to building ahospital. Chemosphere, (0).
Ramade, F. (2002). Dictionnaire encyclopédique de l’écologie et des sciences de l’environne-ment. 2ème edition.
Ramade, F. (2011). Introduction à l’écochimie : les substances de l’écosphère à l’Homme.Lavoisier.
Sanchez, W., Sremski, W., Piccini, B., Palluel, O., Maillot-Maréchal, E., Betoulle, S., Jaffal,A., Aït-Aïssa, S., Brion, F., Thybaud, E., Hinfray, N., and Porcher, J.-M. (2011). Ad-verse effects in wild fish living downstream from pharmaceutical manufacture discharges.Environment International, 37(8) :1342–1348.
Sanderson, H., Johnson, D. J., Wilson, C. J., Brain, R. A., and Solomon, K. R. (2003).Probabilistic hazard assessment of environmentally occurring pharmaceuticals toxicity tofish, daphnids and algae by ECOSAR screening. Toxicology Letters, 144(3) :383–395.
Santos, L. H. M. L. M., Araújo, A. N., Fachini, A., Pena, A., Delerue-Matos, C., and Mon-tenegro, M. C. B. S. M. (2010). Ecotoxicological aspects related to the presence of phar-maceuticals in the aquatic environment. Journal of Hazardous Materials, 175(1-3) :45–95.
Sarmah, A. K., T., M. M., and Boxall, A. B. (2006). A global perspective on the use,sales, exposure pathways, occurrence, fate and effects of veterinary antibiotics (VAs) inthe environment. Chemosphere, 65 :725–759.
Schultz, M. M., Furlong, E. T., Kolpin, D. W., Werner, S. L., Schoenfuss, H. L., Barber, L. B.,Blazer, V. S., Norris, D. O., and Vajda, A. M. (2010). Antidepressant Pharmaceuticals inTwo U.S. Effluent-Impacted Streams : Occurrence and Fate in Water and Sediment, andSelective Uptake in Fish Neural Tissue. Environmental Science & Technology, 44(6) :1918–1925.
165

BIBLIOGRAPHIE
Selassie, C., Verma, R. P., and Abraham, D. J. (2003). History of Quantitative Structure-Activity Relationships. In Burger’s Medicinal Chemistry and Drug Discovery. John Wiley& Sons, Inc.
Silva, B. F. d., Jelic, A., López-Serna, R., Mozeto, A. A., Petrovic, M., and Barceló, D.(2011). Occurrence and distribution of pharmaceuticals in surface water, suspended solidsand sediments of the Ebro river basin, Spain. Chemosphere, 85(8) :1331–1339.
Tauxe-Wuersch, A., De Alencastro, L. F., Grandjean, D., and Tarradellas, J. (2006). Tracedetermination of tamoxifen and 5-fluorouracil in hospital and wastewaters. InternationalJournal of Environmental Analytical Chemistry, 86(7) :473–485.
Ternes, T. A. (1998). Occurrence of drugs in German sewage treatment plants and rivers.Water Research, 32(11) :3245–3260.
Thomas, K. V. and Hilton, M. J. (2004). The occurrence of selected human pharmaceuticalcompounds in UK estuaries. Marine Pollution Bulletin, 49(5-6) :436–444.
Vazquez-Roig, P., Andreu, V., Blasco, C., and Picó, Y. (2012). Risk assessment on thepresence of pharmaceuticals in sediments, soils and waters of the Pego-Oliva Marshlands(Valencia, eastern Spain). Science of The Total Environment, 440(0) :24–32.
Verlicchi, P., Al Aukidy, M., Galletti, A., Petrovic, M., and Barceló, D. (2012). Hospitaleffluent : Investigation of the concentrations and distribution of pharmaceuticals and en-vironmental risk assessment. Science of The Total Environment, 430(0) :109–118.
Verlicchi, P., Galletti, A., Petrovic, M., and Barceló, D. (2010). Hospital effluents as a sourceof emerging pollutants : An overview of micropollutants and sustainable treatment options.Journal of Hydrology, 389(3-4) :416–428.
Weissbrodt, D., Kovalova, L., Ort, C., Pazhepurackel, V., Moser, R., Hollender, J., Siegrist,H., and McArdell, C. S. (2009). Mass Flows of X-ray Contrast Media and Cytostatics inHospital Wastewater. Environmental Science & Technology, 43(13) :4810–4817.
Williams, T. D., Caunter, J. E., Lillicrap, A. D., Hutchinson, T. H., Gillings, E. G., andDuffell, S. (2007). Evaluation of the reproductive effects of tamoxifen citrate in partialand full life-cycle studies using fathead minnows (Pimephales Promelas). EnvironmentalToxicology and Chemistry, 26(4) :695–707.
Yang, Y., Fu, J., Peng, H., Hou, L., Liu, M., and Zhou, J. L. (2011). Occurrence andphase distribution of selected pharmaceuticals in the Yangtze Estuary and its coastal zone.Journal of Hazardous Materials, 190(1-3) :588–596.
Yuan, S., Jiang, X., Xia, X., Zhang, H., and Zheng, S. (2013). Detection, occurrence andfate of 22 psychiatric pharmaceuticals in psychiatric hospital and municipal wastewatertreatment plants in Beijing, China. Chemosphere, 90(10) :2520–2525.
Zenker, A., Cicero, M. R., Prestinaci, F., Bottoni, P., and Carere, M. (2014). Bioaccumulationand biomagnification potential of pharmaceuticals with a focus to the aquatic environment.Journal of Environmental Management, 133(0) :378–387.
Zgorska, A., Arendarczyk, A., and Grabinska-Sota, E. (2011). TOXICITY ASSESSMENTOF HOSPITAL WASTEWATER BY THE USE OF A BIOTEST BATTERY. Archivesof Environmental Protection, 37(3) :55–61.
166

BIBLIOGRAPHIE
167

Frédéric ORIAS Thèse de Doctorat (PhD Thesis) - ENTPE 2015
Contribution à l’évaluation des risques écotoxicologiques des effluents hospitaliers :bioconcentration, bioaccumulation et bioamplification des résidus pharmaceutiques.
Résumé : Les hôpitaux génèrent des effluents riches en résidus pharmaceutiques (RP), fonctions deleurs activités de soins et de diagnostic. Certains de ces RP sont aujourd’hui retrouvés de manièreubiquitaire dans les écosystèmes aquatiques, en raison de leurs propriétés persistantes et/ou de leurémission continue. La variété de ces RP est telle qu’il est nécessaire de les hiérarchiser, en fonctiondes risques qu’ils représentent pour l’Environnement, à des fins d’étude et de gestion. Un de cesrisques est le transfert des RP bioaccumulables (i.e. Kow élevé et faible biodégradabilité) dans leschaînes alimentaires, via les processus de bioconcentration, de bioaccumulation et de bioamplifica-tion. L’objectif principal de cette thèse est de caractériser expérimentalement la bioconcentrationet la bioaccumulation de molécules identifiées comme prioritaires dans des travaux précédents. Lecomposé modèle que nous avons choisi est le tamoxifen, molécule utilisée contre le cancer du sein etdéjà retrouvé dans l’Environnement. Les organismes étudiés, issus des trois niveaux trophiques dela chaine alimentaire modèle, sont Pseudokirchneriella subcapitata, Daphnia magna et Danio rerio.Pour mesurer la teneur de cette molécule dans les organismes, nous avons développé une méthoded’analyse reposant sur l’utilisation d’une molécule marquée par un isotope stable, le 15N tamoxifen.Nous avons mesuré des facteurs de bioconcentration (BCF) allant de 12800 chez D. magna à 85600dans le foie de D. rerio en passant par 21500 chez P. subcapitata. Chez ces derniers, nous avonségalement évalué la part du régime alimentaire dans la bioaccumulation du tamoxifen. Nous avonsobservé que plus la concentration dans le milieu d’exposition est faible, plus le régime alimentairecontribue à la bioaccumulation. Ces travaux de thèse présentent de nombreuses perspectives quel’on peut regrouper autour de deux axes : connaissance de l’écotoxicité des RP et de l’écotoxicologieisotopique.
Mots clés : Effluents hospitaliers, résidus pharmaceutiques, bioconcentration, bioaccumulation,isotopes stables, tamoxifen
Contribution to ecotoxicological risk assessment of hospital effluents :bioconcentration, bioaccumulation & biomagnification of pharmaceutical compounds.
Abstract : Hospitals generates effluents rich in pharmaceuticals compounds (PC), notably becauseof care and diagnostics activities. Some of these PCs are ubiquitous in aquatic ecosystems owingto its persistent properties and/or because of continuous releasing in environment. The diversity ofthese PCs is so strong that it is necessary to prioritize them, considering risks that PCs representsfor the Environment, in order to manage and study these compounds. One of these risks is thetransfer of bioaccumulatives PCs (i.e. PCs with high Kow and low biodegradability) along trophicwebs, via bioconcentration, bioaccumulation and biomagnification processes. The main objective ofthis thesis is to characterize bioconcentration and bioaccumulation of molecules identified as priorityin previous studies. The model compound choose in our work is the tamoxifen, a molecule used inthe treatment of breast cancer and already found in Environment. Organisms studied, typical fromthree trophic levels of the model trophic chain, are Pseudokirchneriella subcapitata, Daphnia magnaand Danio rerio. In order to measure content of tamoxifen in organisms, we developed an innovativeanalytic method based on the use of stable isotopes labelled tamoxifen : 15N tamoxifen. We suc-ceeded to measure bioconcentration factors (BCF) from 12800 in D. magna to 85600 in liver of D.rerio including BCF of 21500 in P. subcapitata. In this latter, we also assessed the contribution ofdietary route to the total contamination of D. magna by tamoxifen. We observed that the more themedium concentration was weak, the more the dietary route contribute to the contamination. Theseworks shows numerous perspectives that we can gather inside two axes : ecotoxicity knowledge ofPCs an isotopic ecotoxicology.
Key words : Hospital effluents, pharmaceutical compounds, bioconcentration, bioaccumulation,stable isotopes, tamoxifen
168


![“Le Monde à son image: le cinéma et le mythe d’Icare [Guest Lecture].”](https://static.fdokumen.com/doc/165x107/633d5f5ad0a2f101870ab50b/le-monde-a-son-image-le-cinema-et-le-mythe-dicare-guest-lecture.jpg)