Fourth Capitalism: the Real Driver of Italian Growth
50
Fourth capitalism: the real driver of Italian growth Fulvio Coltorti, Director Emeritus , Mediobanca Research Area CUOA, meeting with supporting partners 3 July 2014
-
Upload
independent -
Category
Documents
-
view
6 -
download
0
Transcript of Fourth Capitalism: the Real Driver of Italian Growth

Fourth capitalism: the real driver of Italian growth Fulvio Coltorti, Director Emeritus , Mediobanca Research Area CUOA, meeting with supporting partners
3 July 2014

Section 1
European manufacturing: who matters?
3
0
500
1,000
1,500
2,000
2,500
3,000
3,500
4,000
4,500
5,000
50,000 100,000 150,000 200,000 250,000 300,000 350,000 400,000 450,000 500,000 550,000
Manufacturing value added in 2013 (€m)
Germany
Switzerland
UK
ITALY
France
Spain
Netherlands
Sweden
Poland
Austria
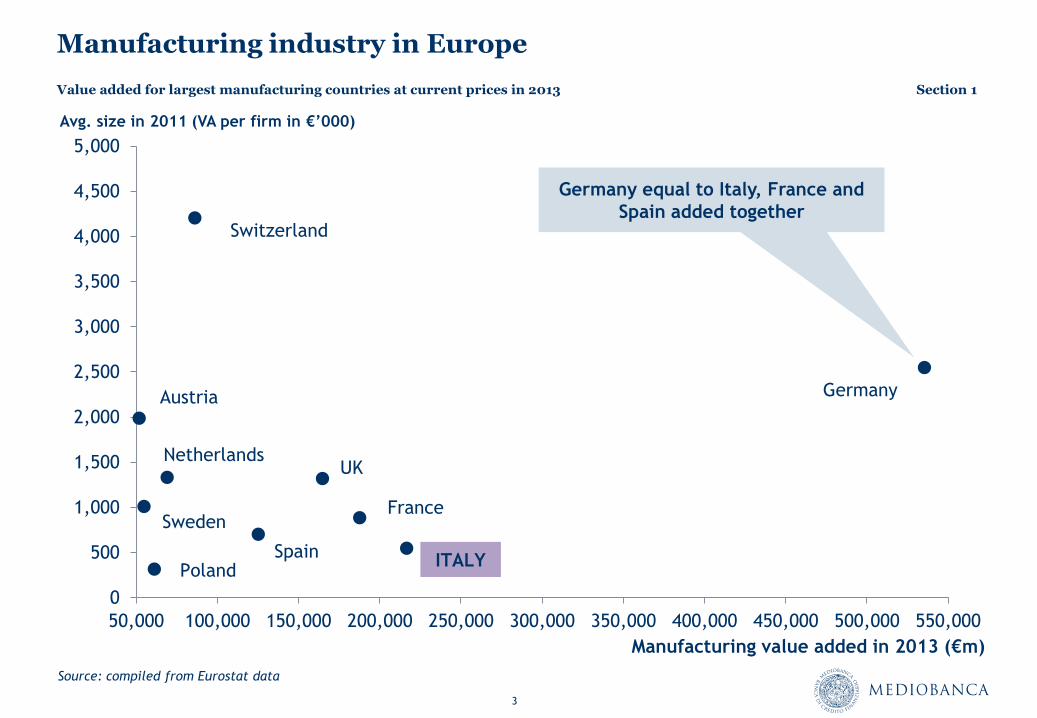
Manufacturing industry in Europe
Value added for largest manufacturing countries at current prices in 2013 Section 1
Source: compiled from Eurostat data
Avg. size in 2011 (VA per firm in €’000)
Germany equal to Italy, France and
Spain added together

4
Italy vs European competitors: still at the bottom of the barrel … strong impulse needed to bounce back
23.1
23.5
24.0 24.2 24.2
23.9 23.9
24.4
24.9 25.2
24.1
23.2
21.6 21.6 21.6 21.9
20.3
21.1 21.1
2000 2001 2002 2003 2004 2005 2006 2007 2008 2009 2010 2011 2012 2013 2013 Q1
2013 Q2
2013 Q3
2013 Q4
2014 Q1
Relative VA indicators calculated based on Eurostat data - VA as % of aggregated European competitors (France, Germany, UK and Spain)

5
Geography of future growth …
Real GDP – 2011 index = 100 – Source: IMF
95
97
99
101
103
105
107
109
111
2011 2012 2013 2014 2015 2016 2017 2018 2019
Germany Italy Eurozone
+1.4%
+1.5%
+1%
2014-19
World: 2.5%...3.4% p.a.
Emerging: 4.9%...5.4%
Emerging Asia: 6.4%...6.8%
Sub-Saharan Africa: 5.4%...5.8%

Section 2
Italy does not stand out because of its excess of small businesses, but because of the crisis and the decline of its large industries

7
Crisis and decline of large enterprise in Italy
Percentage of GDP accounted for by leading Italian companies (based on Mediobanca and Istat data at current prices)
0.55
0.65
0.75
0.85
0.95
1.05
1974
1975
1976
1977
1978
1979
1980
1981
1982
1983
1984
1985
1986
1987
1988
1989
1990
1991
1992
1993
1994
1995
1996
1997
1998
1999
2000
2001
2002
Value added by LE/Italian GDP
First restructuring
Rescues and bailouts
Robots; group organization
Second restructuring
Rescues and bailouts
Lean production;
relocations
Technological decline
Loss of market shares
Relocations
Wrong investments
Lack of research
Financial crises

8
Dualism reversed: fewer and fewer large companies
Istat – Manufacturing industry census: firms with 1,000 staff and more
339
324
241
223
176
3,877
3,631 3,228
2,503 2,438
1971 1981 1991 2001 2011
No. of firms Avg. size (no. of staff)

9
Italy: four capitalisms
First large companies (late 1900s)
State capitalism (1933)
Industrial Districts (1960-70)
Medium-sized companies and others (1990s)
1
2
3
4

Section 3
What has happened in the territories?

11
Manufacturing in the provinces: % shares of staff
51.9 50.3
39.8
36.0
31.4 31.9
0.6 0.8 1.2
3.3
6.7 7.2
2.1
8.2
19.3
24.7
41.8 43.9
1951 1961 1971 1981 1991 1996
LE LE LI ID
LE=Large Enterprise areas; LI=low industrialization areas; ID = districts areas
Source: Becattini-Coltorti 2004
12
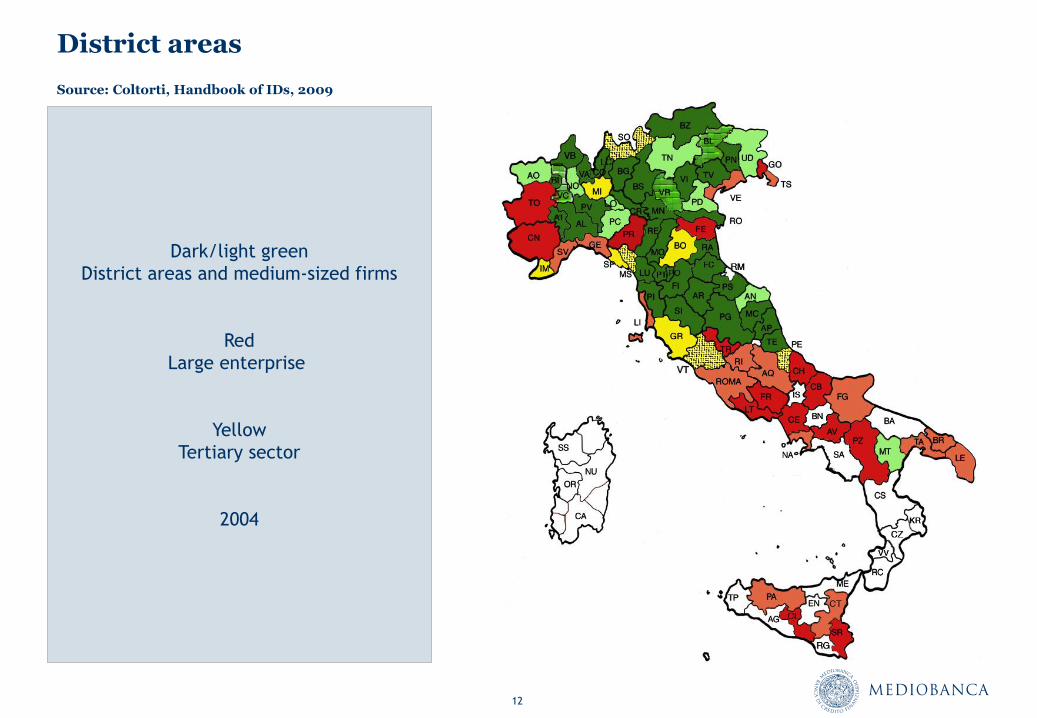
District areas
Source: Coltorti, Handbook of IDs, 2009
Dark/light green
District areas and medium-sized firms
Red
Large enterprise
Yellow
Tertiary sector
2004

13
Manufacturing: value added in 2011
Largest groups 6.1
Non-Italian LEs 12.4
Medium-large 12.6
Medium-sized 15.6
Small 53.3
Fourth capitalism
Medium-large,
medium
and small firms
50-60%
Mediobanca Research Area estimates based on Mediobanca and Istat data

Section 4
Methods of production change: end of Fordism

15
Lean production: the Apple iPad
Apple margin 25%
US non-Apple suppliers' margins
2%
Retail distribution and sale
23%
Korean suppliers' margins
7%
Taiwanese suppliers' margins
2%
Japanese suppliers' margins
2%
Costs of unknown origin
4%
Direct labour costs for suppliers
10%
Cost of acquiring input 25%
Source: Linden, Dedrick, Kraemer, Rassweiler (Who captures value in the Apple iPad?; 2011)
Plus margin for retail
distribution if sold online or
at own stores
LG and Samsung
(display and memory chip)
Breakdown of value generated by iPad 16GB, cost $499 (2009)
Manufacturing: Asia

Section 5
Can one be competitive without being large?

17
District effect: trust, filières, networks, entrepreneurialism
Districts are based on trust
Industry is concentrated in places
Places = communities of people, agglomerations of enterprises
High degree of division of labour enables specialization
Filières (short and long, to produce and acquire knowledge)
Many SMEs compete and co-operate with each other
Competition (= innovation, quality and appropriate production costs)
There are local markets for goods and services
Networks (informal and formal, short and long)
The strengthening of relations and technical/behavioural codes on a local basis facilitates the circulation of
information and reduces barriers to entry
Turnover between entrepreneurs and integrated division of labour

18
How does the fourth capitalism work?
1. Competition engaged in on basis of “systems” of companies
2. Impact of production scale felt at system level (network of relations; external economies leveraged)
3. Reliance on territory which provides and regenerates the resources and on network of social relations
4. Companies specialize
5. Firms create niches in which they have a virtual monopoly, innovating continuously and avoiding the
large multinationals’ practices
External economies and product differentiation
Carel: total sales €169m per annum

19
Fourth capitalism: governance
Competition takes place on product market rather than at level of
ownership structure
Decisions taken by market of consumers, not by financial markets
(institutional investors, banks, advisors, analysts, etc.)
Company survives and prospers to the extent that it remains
efficient
Quest for beauty is fundamental
NICE – Oderzo (Treviso)

20
Medium-sized enterprises in 2012
Source: Centro Studi Unioncamere
3,528 medium-sized firms
(3,463 considering groups)
50-499 employees
Annual total sales €15m-€330m
Limited companies
Independently-owned

21
Size: growth trends
-59 -59 -69 -50 -22 -55 -38 -55 -70
-44
8
-21 -34 -11
248
438
214
98 44
169 122
333 301
-81
-598
271 250
-50
1999 2000 2001 2002 2003 2004 2005 2006 2007 2008 2009 2010 2011 2012
MSEs become large Small firms become MSEs
Net changes, 1999-2012. A total of 334 companies was excluded in 2008 following adoption of new parameters

Section 6
Medium-sized firms qualify districts

23
More medium-sized companies in Istat districts
36.5 26.8
21.0 16.9
47.5
40.1
36.6
31.1
14.3
24.7
30.7
35.9
1.7 8.4 11.7 16.1
(0-49) > 74.9% (0-49) 62.5%-74.9% (0-49) 50%-62.5% (0-49) < 50%
Categories based on % presence of micro and small firms
Micro 0-9 Small 10-49 Medium-size I 50-249 Medium-size II + LEs >250
% breakdown of total staff employed, 2001 – Source: Coltorti (Handbook of IDs, 2009)
% of total staff 34% 44% 8% 14%

24
More staff in medium-sized firms in district areas
Compiled from M. Bellandi & F. Coltorti, “Distretti industriali e medium-sized companies, tra declino e traiettorie di sviluppo industriale in Italia”, Artimino report 2012-14, Bologna, Il Mulino (forthcoming); indexes 2001 = 100 – no. of staff
100
90.6 86.2
81.5
100
107.4
90.7 94.9
2001 2007 2009 2011
Total Medium-sized businesses

25
District areas between 2001 and 2011
MSE consolidation 72%
District restructuring 22%
District crisis 3%
District growth 3%
Source: M. Bellandi & F. Coltorti, 2014

26
District areas with high concentration of medium-sized companies
Source: M. Bellandi & F. Coltorti, op. cit. 2014 – KIS = Knowledge Intensive Services; LKIS = Low KIS
0
500
1000
1500
2000
2500
3000
2001 2007 2009 2011
Manufacturing staff Services: KIS Services: LKIS
No. of staff (000)

27
Changes in value added by medium-sized companies
614
1,357
1,289
2,859
2,498
6,592
8,232
191
325
577
2,006
2,422
-211
5,804
Other industries
Metallurgical
Paper, printing & Publishing
Food and drinks
Chemicals & pharmaceuticals
Personal and households goods
Mechanical engineering
in 1996 Change 1996-2012
Value added 1996-2012 – universe of medium-sized companies
“Made in Italy” turnover 62% (65.8% in 1996)
Exports 40.4% (32.5% in 1996)

Section 7
International orientation

29
Fourth capitalism: the happy many …
Categories of firms based on % share of exports in 2012; Source: Mediobanca Research Area
126 m
ediu
m-s
ized/la
rge >
75%
175 m
ediu
m-s
ized/la
rge 4
1-
74%
131 m
ediu
m-s
ized/la
rge 0
-40%
651 m
ediu
m-s
ized >
75%
467 m
ediu
m-s
ized 6
1-7
4%
628 m
ediu
m-s
ized 4
1-6
0%
708 m
ediu
m-s
ized 1
6-4
0%
504 m
ediu
m-s
ized <
15%
505 m
ediu
m-s
ized z
ero
%
Italy Elsewhere
3,463 medium-sized companies 432 medium-large firms

30
0
50
100
150
200
250
300
350
400
450
500
550
0.0 10.0 20.0 30.0 40.0 50.0 60.0 70.0 80.0 90.0 100.0
No. of staff
% Sales abroad
Exports: size is NOT a conditio sine qua non
Universe of medium-sized companies 2012: shares of exports and no. of staff

Section 8
Growth drivers and brakes

32
The two drivers of value added: data by class of good
Index number of value added based on current prices (2000 = 100; Istat database with estimates for 2012-13)
100.0 99.3 100.0
98.9
103.2 104.8
108.9
116.2
111.7
93.1
102.3 103.1
96.9 96.3
100.0
104.7 106.2
105.3
107.1 107.3
111.9
118.9 117.4
103.8
108.2
110.0
103.5 102.2
2000 2001 2002 2003 2004 2005 2006 2007 2008 2009 2010 2011 2012 2013
Goods produced by large enterprise Goods produced by districts and fourth capitalism

33
The two drivers of value added: data by companies
Index number of value added based on current prices; Mediobanca data for companies with production facilities in Italy
100.0
86.1
77.6
85.3 86.6
83.4
94.7
108.6
98.2
83.3
94.9
88.5 85.9
100.0
104.2 106.4 107.2
113.0 115.9
125.1
136.7 136.8
124.9
132.9
137.9
134.2
2000 2001 2002 2003 2004 2005 2006 2007 2008 2009 2010 2011 2012
Large groups Medium-sized companies

Section 9
Medium-size enterprise in Europe: a comparison

35
Where?
Medium Sized Enterprises in Europe (2013)

36
Medium-sized companies: size, productivity and CLUP
Size increases left to right (staff); median values based on rolling sets of 200 observations
Net VA per employee CLUP
Source: Confindustria, R&S, Unioncamere, Medium-Sized Enterprises in Europe, 2013

37
Medium-sized companies: productivity, wages and tax
Germany Italy France Spain
Net VA per employee (€'000) 56.1 51.0 52.1 47.9
DE index no. = 100 100.0 90.9 92.9 85.4
Unit labour cost (€'000) 46.7 39.6 43.6 36.8
DE index no. = 100 100.0 84.8 93.4 78.8
EBITDA as % of VA 14.9 18.6 14.9 19.2
DE index no. = 100 100.0 124.8 100.0 128.9
Tax rate* 27.4 38.2 24.5 23.5
FY 2009 - Confindustria – R&S Mediobanca – Unioncamere survey
* Tax rate in Italy in 2012
Medium-sized firms 37.0%
Large groups: 23.5%

38
Lots of it net worth, little of it working capital
-27.5 -12.8 -16.9 -21.3
-20.1
-19.6 -13.3 -21.0
-52.4 -67.6 -69.8
-57.7
44.2 30.2
38.1 38.8
38.4
36.0 34.6 35,7
17.4 33.8 27.3 25.5
Itay France Germany Spain
Short-term debt Medium-term debt Tangible net worth Fixed assets Working capital Financial assets
Assets
Loans
MSEs in Europe (2013) – Data as at 2009 - tangible net capital includes provisions set aside in medium/long term

39
If tax was less aggressive in Italy?
% of firms by class of financial solidity
Source: compiled by R&S based on R&S-Unioncamere scoring model
76.3
69.0 68.6
56.6
78.0
19.3
26.4 25.0
35.3
18.2
4.4 4.6 6.4 8.1 3.9
Germany France Spain Italy Italy 2
Investment grade Intermediate Distressed
Assuming tax rates equivalent to
those for large groups
(last ten years)

Section 10
What to do to exit the crisis

41
Promote fourth capitalism in district areas
Net flows of exports/imports in Euros by territories classified based on Becattini-Coltorti method (2004ff– UA = Turin/Milan/Rome/Naples)
-60,000
-40,000
-20,000
0
20,000
40,000
60,000
1999 2000 2001 2002 2003 2004 2005 2006 2007 2008 2009 2010 2011 2012 2013
€ mln
District areas Large enterprise areas Urban areas Remainder

42
Stimulate investments: Italy vs FR, DE and UK
Gross fixed investments in manufacturing sector, relative values (% of Eurostat national accounting data based on current prices)
50
60
70
80
90
100
110
120
1999 2000 2001 2002 2003 2004 2005 2006 2007 2008 2009 2010 2011 2012 2013
% of France % of Germany % of UK

43
Italy vs Germany
Data as at 2012
Italy Germany Italy vs
Germany
Population 59.4 m 81.7 m 73%
Balance of exports-imports:
districts + fourth capitalism/Mittelstand €86.2bn €102.9bn 84%
large groups €7.9bn €203.5bn 4%
Attract investment from large foreign groups /win back those which have fled

44
Keys to success: focus on revenues, not costs
1) Quality of work force (measured via unit wage levels): companies which use low-cost staff are less
productive than those which use a workforce which are more expensive when measured by unit cost but
matched with the stock of capital per staff member and against high-quality production. A work force
which is “worth” salary levels which are €1 higher produces, ceteris paribus, an increase of €1.4 in value
terms in productivity
2) Inverse relationship between size and productivity: a winning strategy involves production
specialization and a commercial policy geared towards creating and exploiting market niches, which are
dominated through skill and innovative ability (confirmed by the data shown in the previous slides)
3) Knowledge Intensive Services (KIS): there is a need for companies which provide high knowledge-
intensive services
4) Positive impact of managerial capabilities and infrastructure: the former is a product of training; the
latter tends to differentiate between performance (e.g. deteriorating in Southern Italy)
Source: econometric analysis based on data for medium-sized companies taken from Mediobanca-Unioncamere surveys produced in the last ten years
(F. Coltorti and D.Venanzi, “Produttività, competitività e territori delle medie imprese italiane”; in I nuovi distretti industriali. Rapporto di Artimino
sullo sviluppo locale 2012-13; ed. by M. Bellandi and A. Caloffi, Bologna, Il Mulino (forthcoming).

45
Indicators of attractiveness of fourth capitalism
Compiled by Mediobanca Reearch Area
0.0
0.1
0.2
0.3
0.4
0.5
0.6
0.7
0.8
0.9
1.0
Veneto
Lom
bard
ia
Em
ilia
-Rom
agna
Marc
he
Fri
uli V
G
Um
bri
a
Trenti
no A
A
Pie
monte
+
VdA
Abru
zzo
Tosc
ana
Cam
pania
Lig
uri
a
Puglia
Basi
licata
Sic
ilia
Molise
Sard
egna
Lazio
Cala
bri
a
Blue indicates territories identified
by Giorgio Fuà in his North-East-
Centre model (NEC) - 1981
Normalized average of 7 indexes calculated based on data for medium-sized companies

46
Roll up our sleeves …
A proposal to recover use of resources which are currently wasted

47
Most important districtions: selected using KPIs
Source: F. Coltorti & L. Mastromarino, Per un piano strategico a sostegno dei distretti (OND report, 2014)
1
2
3
4
5
6
7 8 9
10
11
12
13
14
15
16
17 18 19
20
21
22 23
24
25
26
27
28
29
30
31
32
33
34
35
36
37
38
39
40
41 42
43
44 45
4.0%
5.0%
6.0%
7.0%
8.0%
9.0%
10.0%
11.0%
12.0%
13.0%
14.0%
-3.5% -1.5% 0.5% 2.5% 4.5% 6.5% 8.5%
EBITDA/sales, % avg. 2010-12
Q1
Q2
Q3
Q4
Chg. in sales, 2010-12

48
Strategic plan with pivotal companies
ACTIVITIES RESPONSIBILITY
MAPPING DISTRICTS UNIONCAMERE
DISTRICTS CLASSIFIED BY KPIs (SALES, EBITDA, VA) MISE/REGIONAL AUTHORITY/UNIONCAMERE
DISTRICT COMMITTEE SET UP MISE/REGIONAL AUTHORITY
DISTRICT STRATEGIC PLAN DRAWN UP (DSP) DISTRICT COMMITTEE AND PIVOTAL COMPANIES
PSD APPROVED
DISTRICT COMMITTEE, PIVOTAL COMPANIES, TRADE
UNIONS, CATEGORY ASSOCIATIONS, LOCAL
ADMINISTRATION
START OF ACTIVITY AND MONITORING DISTRICT COMMITTEE/ REGIONAL AUTHORITY/MISE
Coltorti-Mastromarino methodological proposal: plan stages

49
Bibliography
R&S and Mediobanca, various publications (www.mbres.it)
Mediobanca-Unioncamere, Le medie imprese industriali italiane (www.mbres.it)
G. Becattini-F. Coltorti, “Aree di grande impresa ed aree distrettuali nello sviluppo post-bellico
dell’Italia” (Rivista Italiana degli Economisti, 2004); “Areas of large enterprise and industrial districts in
the development of post-war Italy: a preliminary study” (European Planning Studies 8, 2006)
F. Coltorti, “Medium-Sized Firms, Groups and Industrial Districts: an Italian Perspective”; in A Handbook
of Industrial Districts, ed. by G. Becattini, M. Bellandi e L. De Propris; Edward Elgar 2009
Confindustria, R&S and Unioncamere, Medium-Sized Enterprises in Europe; 2013 (www.mbres.it)
F. Coltorti-G. Garofoli, “Le medie imprese in Europa” (Economia Italiana 1, 2011); “Medium-Sized
Enterprises in Europe” (Review of Economic Conditions in Italy 1, 2011)
F. Coltorti, R. Resciniti, A. Tunisini, R. Varaldo (eds), Mid-Sized Manufacturing Companies: The New
Driver of Italian Competitiveness; Springer 2013
F. Coltorti, “Italian Industry, Decline or Transformation? A Framework”; (European Planning Studies, 21 ,
2013)
Osservatorio Nazionale Distretti Italiani, 2014 report (www.osservatoriodistretti.org)
M. Bellandi-F. Coltorti, “Distretti industriali e medie imprese, tra declino e traiettorie di sviluppo
industriale in Italia”; F. Coltorti-D. Venanzi, “Produttività, competitività e territori delle medie imprese
italiane”; in I nuovi distretti industriali, ed. by M. Bellandi and A. Caloffi, Il Mulino 2014 (forthcoming)
F. Coltorti-L. Mastromarino, Per un piano strategico a sostegno dei distretti industriali; 2014
(forthcoming)