
Fossil groups origins II. Unveiling the formation of the brightest group galaxies through their...
16
arXiv:1110.0465v1 [astro-ph.CO] 3 Oct 2011 Astronomy & Astrophysics manuscript no. mendezabreu c ESO 2011 October 5, 2011 Fossil groups origins II. Unveiling the formation of the brightest group galaxies through their scaling relations J. M´ endez-Abreu 1,2 , J. A. L. Aguerri 1,2 , R. Barrena 1,2 , R. S´ anchez-Janssen 3 , W. Boschin 4 , N. Castro-Rodriguez 1,2 , E. M. Corsini 5 , C. del Burgo 6 , E. D’Onghia 7 , M. Girardi 8,9 , J. Iglesias-P´ aramo 10,11 , N. Napolitano 12 , J. M. Vilchez 10 , and S. Zarattini 1,2,5 1 Instituto Astrof´ ısico de Canarias, C/ V´ ıa L´ actea s/n, 38200 La Laguna, Spain 2 Departamento de Astrof´ ısica, Universidad de La Laguna, C/ Astrof´ ısico Francisco S´ anchez, 38205 La Laguna, Spain e-mail: [email protected] 3 European Southern Observatory, Alonso de C´ ordova 3107, Vitacura, Santiago, Chile 4 Fundaci´ on Galileo Galilei-INAF, Rambla Jos´ e Ana Fern´ andez P´ erez 7, 38712 Bre˜ na Baja, Spain 5 Dipartimento di Astronomia, Universit` a di Padova, vicolo dell’Osservatorio 3, 35122 Padova, Italy 6 UNINOVA/CA3, Campus da FCT/UNL, Quinta da Torre, 2825-149 Caparica, Portugal 7 Harvard-Smithsonian Center for Astrophysics, 60 Garden Street, Cambridge, MA 02138, USA 8 Dipartimento di Fisica-Sezione Astronomia, Universit` a degli Studi di Trieste, via Tiepolo 11, 34143 Trieste, Italy 9 INAF-Osservatorio Astronomico di Trieste, via Tiepolo 11, 34143 Trieste, Italy 10 Instituto de Astrof´ ısica de Andalucia-C.S.I.C., 18008 Granada, Spain 11 Centro Astron´ omico Hispano Alem´ an, C/ Jes´ us Durb´ an Rem´ on 2-2, 04004 Almer´ ıa, Spain 12 INAF-Osservatorio Astronomico di Capodimonte, Salita Moiariello 16, 80131 Napoli, Italy Received September 15, 1996; accepted March 16, 1997 ABSTRACT Context. Fossil systems are galaxy associations dominated by a relatively isolated, bright elliptical galaxy, surrounded by a group of smaller galaxies lacking L ∗ objects. Because of this extreme environment, fossil groups (FGs) are ideal laboratories to study the mass assembly of brightest group galaxies (BGGs). Aims. We analyzed the near-infrared photometric and structural properties of a sample of 20 BGGs present in FGs in order to better understand their formation mechanisms. This represent the largest sample studied to date. Methods. K s -band deep images were used to study the structural properties of our sample galaxies. Their surface-brightness distri- bution was fitted to a S´ ersic profile using the GASP2D algorithm. Then, the standard scaling relations were derived for the first time for these galaxies and compared with those of normal ellipticals and brightest cluster galaxies in non-fossil systems. Results. The BGGs presented in this study represent a subset of the most massive galaxies in the Universe. We found that their ellipticity profiles are continuously increasing with the galactocentric radius. Our fossil BCGs follow closely the fundamental plane described by normal ellipticals. However, they depart from both the log σ 0 vs. log L Ks and log r e vs. log L Ks relations described by intermediate mass ellipticals. This occurs in the sense that our BGGs have larger effective radii and smaller velocity dispersions than those predicted by these relations. We also found that more elliptical galaxies systematically deviate from the previous relations while more rounder object do not. No similar correlation was found with the S´ ersic index. Conclusions. The derived scaling relations can be interpreted in terms of the formation scenario of the BGGs. Because our BGGs follow the fundamental plane tilt but they have larger effective radii than expected for intermediate mass ellipticals, we suggest that they only went through dissipational mergers in a early stage of their evolution and then assembled the bulk of their mass through subsequent dry mergers, contrary to previous claims that BGGs in FGs were formed mainly by the merging of gas-rich galaxies. Key words. galaxies: elliptical and lenticular, cD – galaxies: evolution – galaxies: formation – galaxies: fundamental parameters – galaxies: photometry – galaxies: structure 1. Introduction Fossil groups (FGs) are observationally defined as X-ray bright systems (L X > 10 42 h −2 50 erg s −1 ), dominated in the optical by a giant elliptical galaxy at the center, and with an R-band differ- ence in the absolute magnitude of ΔM 12 > 2 (Jones et al. 2003) between the two brightest galaxies located within half the virial radius of the system. These relatively rare systems were first identified by Ponman et al. (1994) and were the target of several studies in the last years (Vikhlinin et al. 1999; Jones et al. 2003; Mendes de Oliveira et al. 2006; Cypriano et al. 2006; Khosroshahi et al. 2006; Mendes de Oliveira et al. 2009; Zibetti et al. 2009; D´ emocl` es et al. 2010; Aguerri et al. 2011). Observationally, these systems are massive galaxy associa- tions with typical masses of rich groups or poor clusters. They follow also the scaling relations of groups or clusters such as X- ray luminosity (L X ) vs. gas temperature (T X ), total mass ( M) vs. T X , gas entropy vs. T X , L X vs. cluster velocity disper- sion (σ cl ), optical luminosity (L opt ) vs. σ cl , σ cl vs. T X , gas fraction ( f gas ) vs. T X (Khosroshahi et al. 2007; Sun et al. 2009). Some differences have been found in the optical vs. X-ray lu- minosity (L opt -L X ) relation (Khosroshahi et al. 2007) even if 1
-
Upload
independent -
Category
Documents
-
view
2 -
download
0
Transcript of Fossil groups origins II. Unveiling the formation of the brightest group galaxies through their...
arX
iv:1
110.
0465
v1 [
astr
o-ph
.CO
] 3
Oct
201
1Astronomy & Astrophysicsmanuscript no. mendezabreu c© ESO 2011October 5, 2011
Fossil groups origins II.Unveiling the formation of the brightest group galaxies through
their scaling relationsJ. Mendez-Abreu1,2, J. A. L. Aguerri1,2, R. Barrena1,2, R. Sanchez-Janssen3, W. Boschin4,
N. Castro-Rodriguez1,2, E. M. Corsini5, C. del Burgo6, E. D’Onghia7, M. Girardi8,9, J. Iglesias-Paramo10,11,N. Napolitano12, J. M. Vilchez10, and S. Zarattini1,2,5
1 Instituto Astrofısico de Canarias, C/ Vıa Lactea s/n, 38200 La Laguna, Spain2 Departamento de Astrofısica, Universidad de La Laguna, C/Astrofısico Francisco Sanchez, 38205 La Laguna, Spain
e-mail:[email protected] European Southern Observatory, Alonso de Cordova 3107, Vitacura, Santiago, Chile4 Fundacion Galileo Galilei-INAF, Rambla Jose Ana Fernandez Perez 7, 38712 Brena Baja, Spain5 Dipartimento di Astronomia, Universita di Padova, vicolodell’Osservatorio 3, 35122 Padova, Italy6 UNINOVA/CA3, Campus da FCT/UNL, Quinta da Torre, 2825-149 Caparica, Portugal7 Harvard-Smithsonian Center for Astrophysics, 60 Garden Street, Cambridge, MA 02138, USA8 Dipartimento di Fisica-Sezione Astronomia, Universita degli Studi di Trieste, via Tiepolo 11, 34143 Trieste, Italy9 INAF-Osservatorio Astronomico di Trieste, via Tiepolo 11,34143 Trieste, Italy
10 Instituto de Astrofısica de Andalucia-C.S.I.C., 18008 Granada, Spain11 Centro Astronomico Hispano Aleman, C/ Jesus Durban Remon 2-2, 04004 Almerıa, Spain12 INAF-Osservatorio Astronomico di Capodimonte, Salita Moiariello 16, 80131 Napoli, Italy
Received September 15, 1996; accepted March 16, 1997
ABSTRACT
Context. Fossil systems are galaxy associations dominated by a relatively isolated, bright elliptical galaxy, surrounded by a group ofsmaller galaxies lackingL∗ objects. Because of this extreme environment, fossil groups (FGs) are ideal laboratories to study the massassembly of brightest group galaxies (BGGs).Aims. We analyzed the near-infrared photometric and structural properties of a sample of 20 BGGs present in FGs in order to betterunderstand their formation mechanisms. This represent thelargest sample studied to date.Methods. Ks-band deep images were used to study the structural properties of our sample galaxies. Their surface-brightness distri-bution was fitted to a Sersic profile using the GASP2D algorithm. Then, the standard scaling relations were derived for the first timefor these galaxies and compared with those of normal ellipticals and brightest cluster galaxies in non-fossil systems.Results. The BGGs presented in this study represent a subset of the most massive galaxies in the Universe. We found that theirellipticity profiles are continuously increasing with the galactocentric radius. Our fossil BCGs follow closely the fundamental planedescribed by normal ellipticals. However, they depart fromboth the logσ0 vs. logLKs and logre vs. logLKs relations described byintermediate mass ellipticals. This occurs in the sense that our BGGs have larger effective radii and smaller velocity dispersions thanthose predicted by these relations. We also found that more elliptical galaxies systematically deviate from the previous relations whilemore rounder object do not. No similar correlation was foundwith the Sersic index.Conclusions. The derived scaling relations can be interpreted in terms ofthe formation scenario of the BGGs. Because our BGGsfollow the fundamental plane tilt but they have larger effective radii than expected for intermediate mass ellipticals, we suggest thatthey only went through dissipational mergers in a early stage of their evolution and then assembled the bulk of their massthroughsubsequent dry mergers, contrary to previous claims that BGGs in FGs were formed mainly by the merging of gas-rich galaxies.
Key words. galaxies: elliptical and lenticular, cD – galaxies: evolution – galaxies: formation – galaxies: fundamental parameters –galaxies: photometry – galaxies: structure
1. Introduction
Fossil groups (FGs) are observationally defined as X-ray brightsystems (LX > 1042h−2
50 erg s−1), dominated in the optical by agiant elliptical galaxy at the center, and with anR-band differ-ence in the absolute magnitude of∆M12 > 2 (Jones et al. 2003)between the two brightest galaxies located within half the virialradius of the system. These relatively rare systems were firstidentified by Ponman et al. (1994) and were the target of severalstudies in the last years (Vikhlinin et al. 1999; Jones et al.2003; Mendes de Oliveira et al. 2006; Cypriano et al. 2006;
Khosroshahi et al. 2006; Mendes de Oliveira et al. 2009;Zibetti et al. 2009; Democles et al. 2010; Aguerri et al. 2011).
Observationally, these systems are massive galaxy associa-tions with typical masses of rich groups or poor clusters. Theyfollow also the scaling relations of groups or clusters suchas X-ray luminosity (LX) vs. gas temperature (TX), total mass (M)vs. TX, gas entropy vs.TX , LX vs. cluster velocity disper-sion (σcl), optical luminosity (Lopt) vs. σcl, σcl vs. TX , gasfraction (fgas) vs. TX (Khosroshahi et al. 2007; Sun et al. 2009).Some differences have been found in the optical vs. X-ray lu-minosity (Lopt-LX) relation (Khosroshahi et al. 2007) even if
1
J. Mendez-Abreu et al.: Fossil groups origins. II.
this is still controversial (Voevodkin et al. 2010). Detailed X-ray observations of some FGs also indicate that these systemswere assembled at early epochs in high centrally concentrateddark matter (DM) halos with large mass-to-light ratios (M/L)(Democles et al. 2010). Nevertheless, they do not show coolingcores as those detected in galaxy clusters, which points towardthe presence of other heating mechanisms, like active galac-tic nuclei (AGN) feedback (Sun et al. 2004; Khosroshahi et al.2004, 2006; Mendes de Oliveira et al. 2009).
From numerical simulations, and due to the interest-ing nature of these systems, their formation scenarios havebeen matter of debate in the last years (D’Onghia et al.2005; Sommer-Larsen 2006; von Benda-Beckmann et al. 2008;Romeo et al. 2008; Dıaz-Gimenez et al. 2011; Cui et al. 2011).One scenario attributes their properties to their dynamical his-tory, implying that fossil systems are formed if a group/clusterremains undisturbed for a long period of time. Therefore, iffos-sil systems were assembled in an early epoch of the Universethroughout a fast and efficient process of merging, they shouldhad time enough for theirL∗ galaxies to merge, thus pro-ducing the observed lack of intermediate-luminosity galaxiesand the large magnitude gap between the brightest and thesecond brightest galaxy of the group (D’Onghia et al. 2005;von Benda-Beckmann et al. 2008). An alternative explanationfor FG formation is that such systems are failed groups thatsuffer from a lack of L∗ galaxies as an accident of birth(Mulchaey & Zabludoff 1999). On the other hand, some authorssuggest that FGs might represent a transitory phase in the clus-ter life, with an absence of significant mergers for a long time,enough for cluster relaxation (von Benda-Beckmann et al. 2008;Cui et al. 2011).
The merger history underlying the origin of the central galax-ies in FGs continue to be discussed in the literature. Their bright-est group galaxies (BGGs) are among the most massive galaxiesknown in the Universe. Originally, they were thought to be pos-sible results of group evolution as driven by dynamical friction(Ponman et al. 1994; Jones et al. 2003). Recent N-body simula-tions and semi-analytic calculations have suggested that BGGsformed in a short time-scale as consequence of mergers with lowangular momentum (Sommer-Larsen 2006), pushing dynamicalfriction to a less likely scenario for the evolution of BGGs.
Observations show that BGGs have also different observa-tional properties than other bright elliptical galaxies. In partic-ular, they present disky isophotes in the center and their lumi-nosities correlate with the velocity dispersions of the groups.These different properties suggest a different formation sce-nario for bright ellipticals in fossil and non-fossil systems(Khosroshahi et al. 2006). Whereas bright ellipticals in FGswould grow out of gas-rich mergers, giant ellipticals in non-fossil systems would suffer more dry mergers. However, neitherrecent samples of BGGs (La Barbera et al. 2009) nor numericalsimulations (Dıaz-Gimenez et al. 2008) show these differences(La Barbera et al. 2009). All previous results on fossil systemshave the drawback that they were obtained using small samplesof FGs. This could be the reason of some contradictory findingsfound by different studies. The lack of a large and homogeneousstatistical study of this kind of systems makes the previousre-sults not conclusive.
In the framework of the Fossil Groups Origins (FOGO)project (Aguerri et al. 2011), which aims to carry out a system-atic, multiwavelength study of a sample of 34 FGs selected fromthe Sloan Digital Sky Survey (SDSS; Santos et al. 2007), near-infrared images in theKs-band were taken for the central re-gions of 17 groups using the Long-slit Intermediate Resolution
Infrared Spectrograph (LIRIS) at the 4.2-m William HerschelTelescope (WHT). This represent the largest sample of BGGsstudied to date at these wavelengths. Near-infrared observationshave the advantage of mapping the distribution of the mass-carrying evolved stars and diminish the influence of dust. Inthis work, we analyze in detail the photometric properties ofthe BGGs present on these FGs to perform a systematic studyof their structural properties and shed light on their forma-tion/evolution scenarios.
The remainder of this paper is as follows: the data sam-ple, observations, and data reduction are summarized in Sect. 2.In Sect. 3 we describe the surface photometry and photometricdecomposition. The scaling relations are presented in Sect. 4.The discussion of the results and conclusions are presentedinSects. 5, and 6, respectively.
Throughout this paper we assume a flat cosmology withΩM = 0.3, ΩΛ = 0.7, and a Hubble parameter H0 = 70 kms−1 Mpc−1.
2. Data sample, observations, and data reduction
2.1. LIRIS data
Near-infrared imaging of a sample of 17 FG systems belong-ing to the FOGO project was carried out at the WHT inJanuary 2010. We observed in theKs-band using the LIRISimaging mode. LIRIS is a near-infrared (0.9-2.4µm) instru-ment with an optical system based on a classical camera design(Manchado et al. 2004). The detector is a Hawaii 1024×1024HgCdTe array operating at 70 K with a pixel scale of 0.′′25pixel−1.
We exposed a total of 3000 s per field, developing several cy-cles of a 5 points dithering for each target. The exposure time ofindividual frames was 10-12 s. The dithering cycling procedureallowed us to estimate and then correct the background contri-butions of the sky and its significant oscillations. In addition, thedithering and flat frames helped us to clean cosmetic effectsofthe CCDs. After these corrections, we obtained maximum vari-ations of about 0.4% in the background across the full image.
Data reduction was carried out under IRAF1 environmentand LIRIS specific packages. In order to keep the quality of thepoint spread function (PSF) across the whole field of view afterstacking individual frames, the geometry effect of the distortedfield was corrected. In the combined images the PSF is consis-tent with that of the single ones. This is true even close to theedges of the field.
Our observations were carried out under photometric condi-tions and within a seeing range of 0.′′6-1.′′1 (FWHM) as mea-sured by fitting a Moffat PSF to field stars in our images.The photometric calibration was performed by observing UnitedKingdom Infra-Red Telescope (UKIRT) faint near-infrared stan-dards (Casali & Hawarden 1992). We have checked our pho-tometric calibration taking the Two Micron All Sky Survey(2MASS) photometry as reference. Our zero-point estimationswere in agreement with those of 2MASS within±0.02 mag.
Finally we identified galaxies in ourKs-band imagesand measured their magnitudes with the SExtractor package(Bertin & Arnouts 1996). Objects were identified imposing thatthey cover a certain minimum area and have a number counts
1 IRAF is distributed by the National Optical AstronomyObservatories, which are operated by the Association of Universitiesfor Research in Astronomy, Inc., under cooperative agreement with theNational Science Foundation.
2
J. Mendez-Abreu et al.: Fossil groups origins. II.
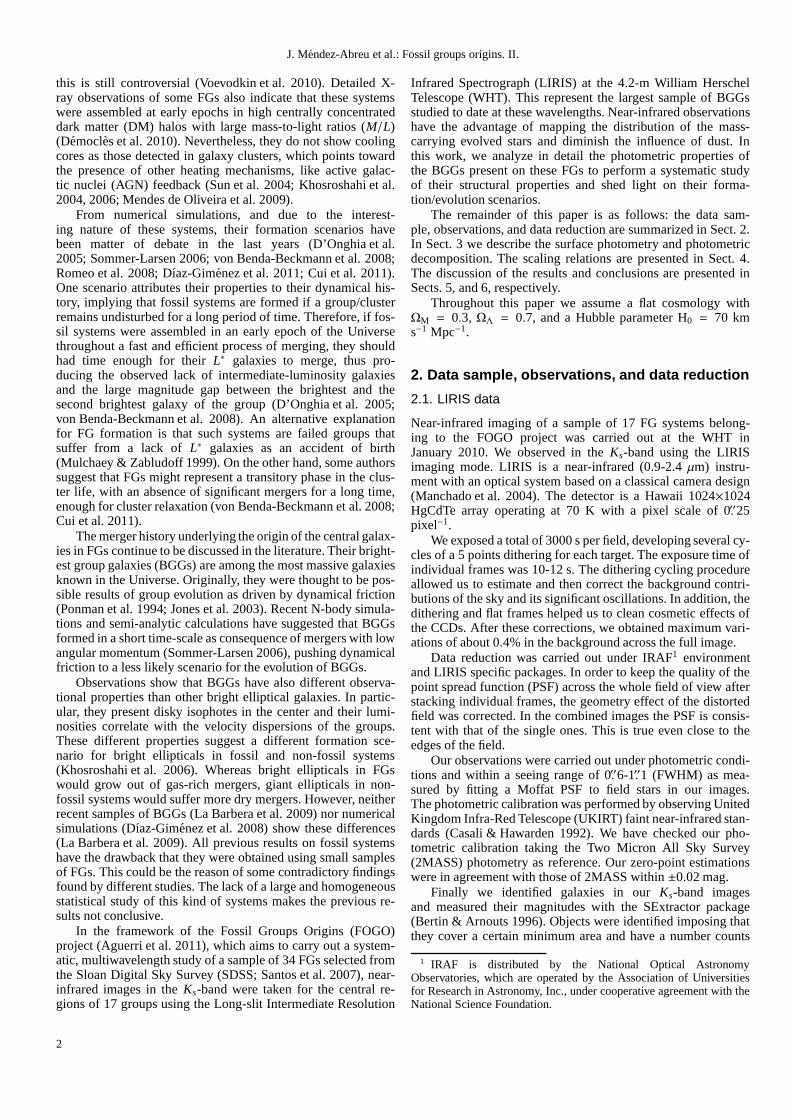
Fig. 1: Ks-band counts per square degree per 0.5 magnitude binfor the fields observed with LIRIS. The continuous curve andvertical dotted lines represent the logarithmic function fit to thehistogram, completeness, and limit magnitudes, respectively.
above a limiting threshold taking the local sky background as areference. The limiting size and flux were 9 pixels and 1.5 stan-dard deviation of the sky counts, respectively. The selected lim-iting size corresponds to an apparent size of 0.′′75, which is aboutthe typical seeing FWHM obtained from our combined images.We performed careful visual inspections of the frames in orderto deal with the best combination of the above parameters thatremoves spurious objects from the catalogues.
Figure 1 shows theKs-band counts for the fields observedwith LIRIS. The counts follow the count-magnitude relationex-pected for a homogeneous galaxy distribution in a universe withEuclidean geometry. The completeness was computed as themagnitude where the measured counts are less than 10% withrespect to the fit, whereas the limit magnitude was assumed tobe that of the faintest detected objects. For our sample, thecom-pleteness and limit magnitudes correspond to targets with signal-to-noise ratioS/N=5 and 3, and areKs = 18.7 and 20.3, respec-tively. The characteristics of the observed sample are listed inTable 1.
2.2. Additional data
2.2.1. UKIDSS data
Since we were not able to observe the whole sample of 34 FGs ofthe FOGO sample, we carried out a search in the UKIRT InfraredDeep Sky Survey (UKIDSS) eighth data release database tocomplete our sample. We found 7 galaxies out of 17 alreadyobserved with LIRIS. In addition, 5 new groups not previouslyobserved with LIRIS were found.
Since the quality and depth of the UKIDSS data is clearlypoorer than those of images obtained using LIRIS, we analyzedthe images of the 7 common BGGs (see Table. 1) to under-stand whether the UKIDSS data could be useful to our scien-tific purpose. We perform a photometric decomposition of thesurface-brightness distribution of the BGGs measured on theUKIDSS images as we did for the LIRIS data (see Sect. 3.1for details). By comparing the total magnitudes obtained fromboth fits, we found that only for 4 BGGs (see Table. 1) the re-sults are comparable within 0.2 mag. After analyzing the re-sults of the fits we concluded that in order to obtain a reli-
able fit we need a suitable combination of surface-brightnessdynamical range and Sersic index, i.e., we found that galax-ies with Sersic indexn > 3 need at least a range of 6 magarcsec−2 to be well fitted within the observational errors; instead,for n ≤ 3 we need only a range of 4 mag arcsec−2. Applyingthese criteria to the 5 images of the BGGs without counterpart inLIRIS we found that three groups (SDSSJ154855.85+085044.3,SDSSJ161431.10+264350.3, SDSSJ225630.04-003210.8) sat-isfy the conditions and only these were included in the analysis.
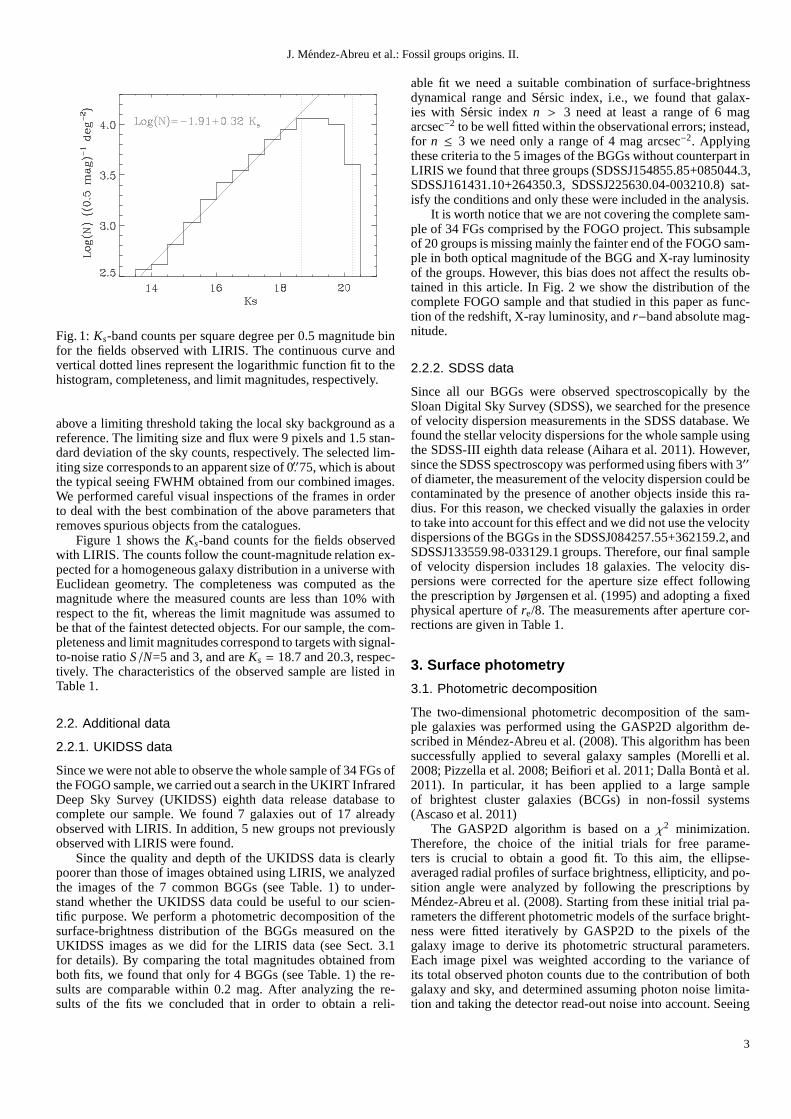
It is worth notice that we are not covering the complete sam-ple of 34 FGs comprised by the FOGO project. This subsampleof 20 groups is missing mainly the fainter end of the FOGO sam-ple in both optical magnitude of the BGG and X-ray luminosityof the groups. However, this bias does not affect the resultsob-tained in this article. In Fig. 2 we show the distribution of thecomplete FOGO sample and that studied in this paper as func-tion of the redshift, X-ray luminosity, andr−band absolute mag-nitude.
2.2.2. SDSS data
Since all our BGGs were observed spectroscopically by theSloan Digital Sky Survey (SDSS), we searched for the presenceof velocity dispersion measurements in the SDSS database. Wefound the stellar velocity dispersions for the whole sampleusingthe SDSS-III eighth data release (Aihara et al. 2011). However,since the SDSS spectroscopy was performed using fibers with 3′′
of diameter, the measurement of the velocity dispersion could becontaminated by the presence of another objects inside thisra-dius. For this reason, we checked visually the galaxies in orderto take into account for this effect and we did not use the velocitydispersions of the BGGs in the SDSSJ084257.55+362159.2, andSDSSJ133559.98-033129.1 groups. Therefore, our final sampleof velocity dispersion includes 18 galaxies. The velocity dis-persions were corrected for the aperture size effect followingthe prescription by Jørgensen et al. (1995) and adopting a fixedphysical aperture ofre/8. The measurements after aperture cor-rections are given in Table 1.
3. Surface photometry
3.1. Photometric decomposition
The two-dimensional photometric decomposition of the sam-ple galaxies was performed using the GASP2D algorithm de-scribed in Mendez-Abreu et al. (2008). This algorithm has beensuccessfully applied to several galaxy samples (Morelli etal.2008; Pizzella et al. 2008; Beifiori et al. 2011; Dalla Bontaet al.2011). In particular, it has been applied to a large sampleof brightest cluster galaxies (BCGs) in non-fossil systems(Ascaso et al. 2011)
The GASP2D algorithm is based on aχ2 minimization.Therefore, the choice of the initial trials for free parame-ters is crucial to obtain a good fit. To this aim, the ellipse-averaged radial profiles of surface brightness, ellipticity, and po-sition angle were analyzed by following the prescriptions byMendez-Abreu et al. (2008). Starting from these initial trial pa-rameters the different photometric models of the surface bright-ness were fitted iteratively by GASP2D to the pixels of thegalaxy image to derive its photometric structural parameters.Each image pixel was weighted according to the variance ofits total observed photon counts due to the contribution of bothgalaxy and sky, and determined assuming photon noise limita-tion and taking the detector read-out noise into account. Seeing
3
J. Mendez-Abreu et al.: Fossil groups origins. II.
Fig. 2: Distribution of redshift (left panel), X-ray luminosity (middle panel), andr-band absolute magnitude (right panel) for theFOGO FGs (solid black line) and of FGs studied in this work (red dotted line).
Table 1: Characteristics of our sample of FGs and BGGs.
Group Lx z mr σ0 Source FWHM(×1043 erg/s) (mag) (km/s) (arcsec)
(1) (2) (3) (4) (5) (6) (7)SDSSJ015021.27-100530.5 14.40 0.365 17.26 341±44 L 0.7SDSSJ015241.95+010025.5 15.10 0.230 15.72 317±16 L,U 1.1SDSSJ075244.19+455657.3 0.562 0.052 14.46 221±5 L 0.8SDSSJ080730.75+340041.6 4.210 0.208 16.38 263±21 L 0.7SDSSJ084257.55+362159.2 29.50 0.282 16.79 ... L 0.8SDSSJ084449.07+425642.1 0.211 0.054 14.08 157±4 L 0.7SDSSJ090303.18+273929.3 17.40 0.489 18.06 273±54 L,U∗ 0.7SDSSJ094829.04+495506.7 6.260 0.409 18.21 270±30 L 0.6SDSSJ104302.57+005418.2 4.990 0.125 15.98 235±8 L,U∗ 0.9SDSSJ105452.03+552112.5 11.70 0.468 17.69 365±61 L 0.7SDSSJ111439.76+403735.1 4.190 0.202 17.14 218±11 L 0.6SDSSJ112155.27+104923.2 3.850 0.240 16.97 251±21 L,U∗ 0.7SDSSJ114128.29+055829.5 2.190 0.188 16.03 309±28 L,U 0.8SDSSJ114647.57+095228.1 4.930 0.221 16.36 276±18 L,U∗ 0.6SDSSJ124742.07+413137.6 0.625 0.155 15.88 240±13 L 0.6SDSSJ133559.98-033129.1 3.680 0.177 15.84 ... L 0.9SDSSJ154855.85+085044.3 0.509 0.072 13.50 326±9 U 0.7SDSSJ161431.10+264350.3 2.370 0.184 15.76 276±15 U 0.7SDSSJ225630.04-003210.8 2.180 0.224 16.81 274±20 U 0.7SDSSJ235815.10+150543.5 0.926 0.178 16.08 297±14 L,U 0.8
Notes.Col. (1): Group name; Col. (2): X-ray luminosity from Santoset al. (2007); Cols. (3, 4, 5): redshift,r-band model magnitude, and aperturecorrected velocity dispersion of the BGGs derived from SDSS; Col. (6): source of the photometric observations: L=LIRIS, U=UKIDSS, commongalaxies with successfully fitted UKIDSS images are marked with an asterisk; Col. (7): FWHM of the Moffat PSF fitted to the stars in the imagefield of view.
effects were also taken into account by convolving the modelimage with a circular Moffat PSF with a FWHM matching theobserved one (see Table 1). The convolution was performed as
a product in Fourier domain before the least-squares minimiza-tion.
We tested three different parametric models to fit thegalaxy surface-brightness distribution. The de Vaucouleurs pro-
4
J. Mendez-Abreu et al.: Fossil groups origins. II.
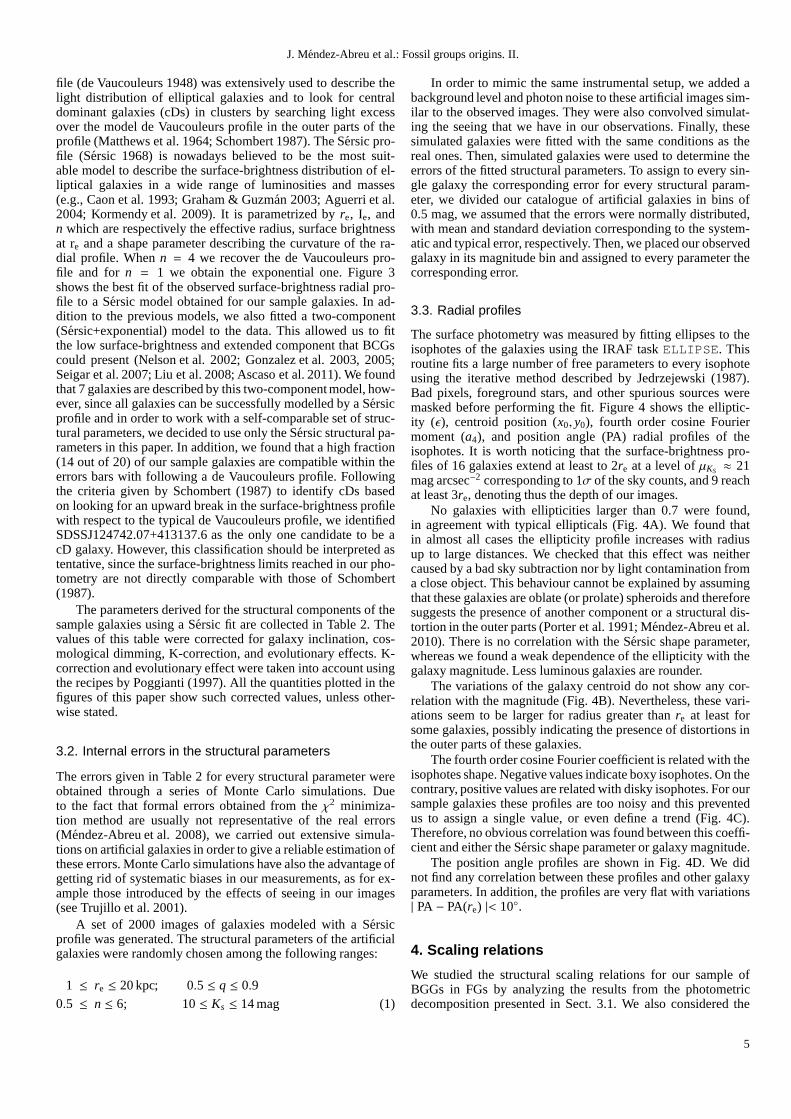
file (de Vaucouleurs 1948) was extensively used to describe thelight distribution of elliptical galaxies and to look for centraldominant galaxies (cDs) in clusters by searching light excessover the model de Vaucouleurs profile in the outer parts of theprofile (Matthews et al. 1964; Schombert 1987). The Sersic pro-file (Sersic 1968) is nowadays believed to be the most suit-able model to describe the surface-brightness distribution of el-liptical galaxies in a wide range of luminosities and masses(e.g., Caon et al. 1993; Graham & Guzman 2003; Aguerri et al.2004; Kormendy et al. 2009). It is parametrized byre, Ie, andn which are respectively the effective radius, surface brightnessat re and a shape parameter describing the curvature of the ra-dial profile. Whenn = 4 we recover the de Vaucouleurs pro-file and for n = 1 we obtain the exponential one. Figure 3shows the best fit of the observed surface-brightness radialpro-file to a Sersic model obtained for our sample galaxies. In ad-dition to the previous models, we also fitted a two-component(Sersic+exponential) model to the data. This allowed us tofitthe low surface-brightness and extended component that BCGscould present (Nelson et al. 2002; Gonzalez et al. 2003, 2005;Seigar et al. 2007; Liu et al. 2008; Ascaso et al. 2011). We foundthat 7 galaxies are described by this two-component model, how-ever, since all galaxies can be successfully modelled by a S´ersicprofile and in order to work with a self-comparable set of struc-tural parameters, we decided to use only the Sersic structural pa-rameters in this paper. In addition, we found that a high fraction(14 out of 20) of our sample galaxies are compatible within theerrors bars with following a de Vaucouleurs profile. Followingthe criteria given by Schombert (1987) to identify cDs basedon looking for an upward break in the surface-brightness profilewith respect to the typical de Vaucouleurs profile, we identifiedSDSSJ124742.07+413137.6 as the only one candidate to be acD galaxy. However, this classification should be interpreted astentative, since the surface-brightness limits reached inour pho-tometry are not directly comparable with those of Schombert(1987).
The parameters derived for the structural components of thesample galaxies using a Sersic fit are collected in Table 2. Thevalues of this table were corrected for galaxy inclination,cos-mological dimming, K-correction, and evolutionary effects. K-correction and evolutionary effect were taken into accountusingthe recipes by Poggianti (1997). All the quantities plottedin thefigures of this paper show such corrected values, unless other-wise stated.
3.2. Internal errors in the structural parameters
The errors given in Table 2 for every structural parameter wereobtained through a series of Monte Carlo simulations. Dueto the fact that formal errors obtained from theχ2 minimiza-tion method are usually not representative of the real errors(Mendez-Abreu et al. 2008), we carried out extensive simula-tions on artificial galaxies in order to give a reliable estimation ofthese errors. Monte Carlo simulations have also the advantage ofgetting rid of systematic biases in our measurements, as forex-ample those introduced by the effects of seeing in our images(see Trujillo et al. 2001).
A set of 2000 images of galaxies modeled with a Sersicprofile was generated. The structural parameters of the artificialgalaxies were randomly chosen among the following ranges:
1 ≤ re ≤ 20 kpc; 0.5 ≤ q ≤ 0.9
0.5 ≤ n ≤ 6; 10≤ Ks ≤ 14 mag (1)
In order to mimic the same instrumental setup, we added abackground level and photon noise to these artificial imagessim-ilar to the observed images. They were also convolved simulat-ing the seeing that we have in our observations. Finally, thesesimulated galaxies were fitted with the same conditions as thereal ones. Then, simulated galaxies were used to determine theerrors of the fitted structural parameters. To assign to every sin-gle galaxy the corresponding error for every structural param-eter, we divided our catalogue of artificial galaxies in binsof0.5 mag, we assumed that the errors were normally distributed,with mean and standard deviation corresponding to the system-atic and typical error, respectively. Then, we placed our observedgalaxy in its magnitude bin and assigned to every parameter thecorresponding error.
3.3. Radial profiles
The surface photometry was measured by fitting ellipses to theisophotes of the galaxies using the IRAF taskELLIPSE. Thisroutine fits a large number of free parameters to every isophoteusing the iterative method described by Jedrzejewski (1987).Bad pixels, foreground stars, and other spurious sources weremasked before performing the fit. Figure 4 shows the elliptic-ity (ǫ), centroid position (x0, y0), fourth order cosine Fouriermoment (a4), and position angle (PA) radial profiles of theisophotes. It is worth noticing that the surface-brightness pro-files of 16 galaxies extend at least to 2re at a level ofµKS ≈ 21mag arcsec−2 corresponding to 1σ of the sky counts, and 9 reachat least 3re, denoting thus the depth of our images.
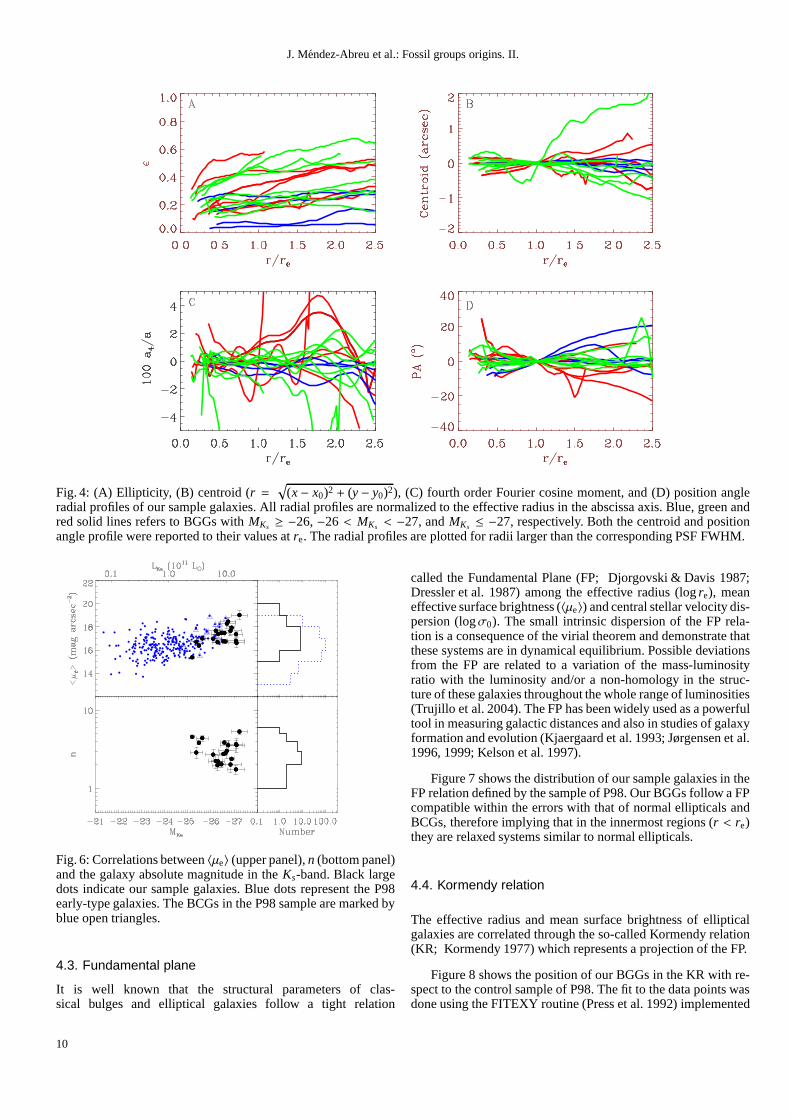
No galaxies with ellipticities larger than 0.7 were found,in agreement with typical ellipticals (Fig. 4A). We found thatin almost all cases the ellipticity profile increases with radiusup to large distances. We checked that this effect was neithercaused by a bad sky subtraction nor by light contamination froma close object. This behaviour cannot be explained by assumingthat these galaxies are oblate (or prolate) spheroids and thereforesuggests the presence of another component or a structural dis-tortion in the outer parts (Porter et al. 1991; Mendez-Abreu et al.2010). There is no correlation with the Sersic shape parameter,whereas we found a weak dependence of the ellipticity with thegalaxy magnitude. Less luminous galaxies are rounder.
The variations of the galaxy centroid do not show any cor-relation with the magnitude (Fig. 4B). Nevertheless, thesevari-ations seem to be larger for radius greater thanre at least forsome galaxies, possibly indicating the presence of distortions inthe outer parts of these galaxies.
The fourth order cosine Fourier coefficient is related with theisophotes shape. Negative values indicate boxy isophotes.On thecontrary, positive values are related with disky isophotes. For oursample galaxies these profiles are too noisy and this preventedus to assign a single value, or even define a trend (Fig. 4C).Therefore, no obvious correlation was found between this coeffi-cient and either the Sersic shape parameter or galaxy magnitude.
The position angle profiles are shown in Fig. 4D. We didnot find any correlation between these profiles and other galaxyparameters. In addition, the profiles are very flat with variations| PA− PA(re) |< 10.
4. Scaling relations
We studied the structural scaling relations for our sample ofBGGs in FGs by analyzing the results from the photometricdecomposition presented in Sect. 3.1. We also considered the
5
J. Mendez-Abreu et al.: Fossil groups origins. II.
(a)
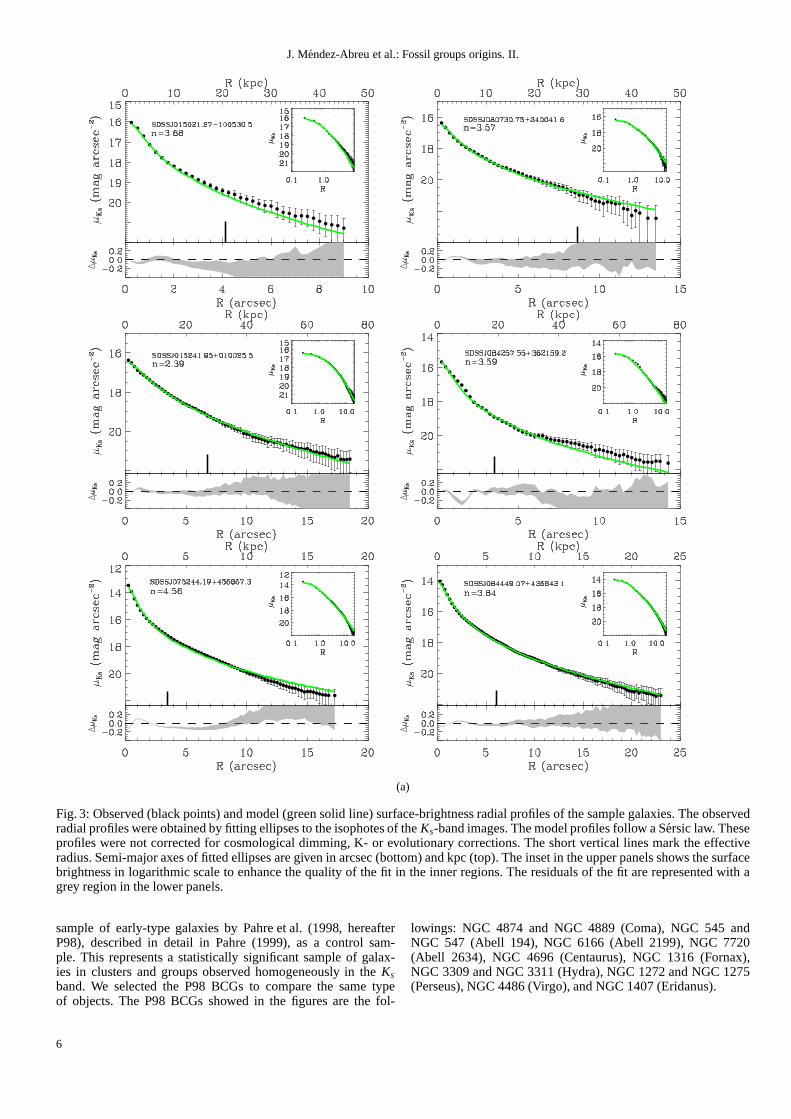
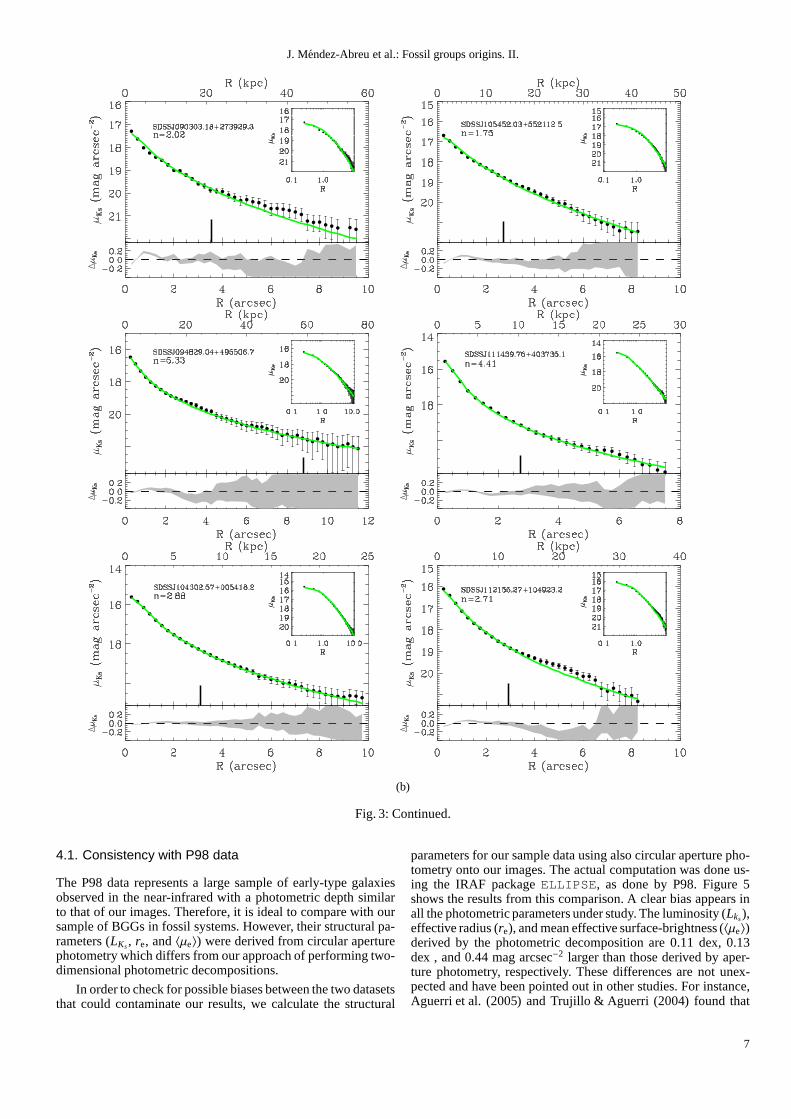
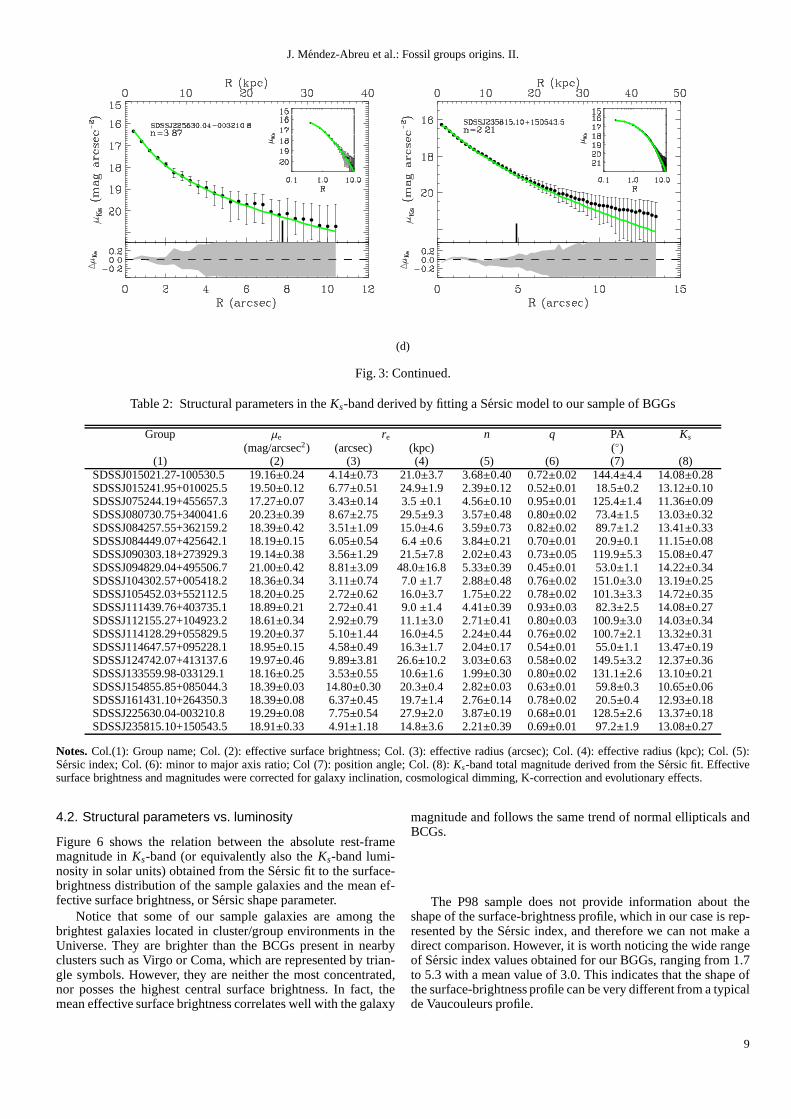
Fig. 3: Observed (black points) and model (green solid line)surface-brightness radial profiles of the sample galaxies.The observedradial profiles were obtained by fitting ellipses to the isophotes of theKs-band images. The model profiles follow a Sersic law. Theseprofiles were not corrected for cosmological dimming, K- or evolutionary corrections. The short vertical lines mark theeffectiveradius. Semi-major axes of fitted ellipses are given in arcsec (bottom) and kpc (top). The inset in the upper panels shows the surfacebrightness in logarithmic scale to enhance the quality of the fit in the inner regions. The residuals of the fit are represented with agrey region in the lower panels.
sample of early-type galaxies by Pahre et al. (1998, hereafterP98), described in detail in Pahre (1999), as a control sam-ple. This represents a statistically significant sample of galax-ies in clusters and groups observed homogeneously in theKsband. We selected the P98 BCGs to compare the same typeof objects. The P98 BCGs showed in the figures are the fol-
lowings: NGC 4874 and NGC 4889 (Coma), NGC 545 andNGC 547 (Abell 194), NGC 6166 (Abell 2199), NGC 7720(Abell 2634), NGC 4696 (Centaurus), NGC 1316 (Fornax),NGC 3309 and NGC 3311 (Hydra), NGC 1272 and NGC 1275(Perseus), NGC 4486 (Virgo), and NGC 1407 (Eridanus).
6
J. Mendez-Abreu et al.: Fossil groups origins. II.
(b)
Fig. 3: Continued.
4.1. Consistency with P98 data
The P98 data represents a large sample of early-type galaxiesobserved in the near-infrared with a photometric depth similarto that of our images. Therefore, it is ideal to compare with oursample of BGGs in fossil systems. However, their structuralpa-rameters (LKs , re, and〈µe〉) were derived from circular aperturephotometry which differs from our approach of performing two-dimensional photometric decompositions.
In order to check for possible biases between the two datasetsthat could contaminate our results, we calculate the structural
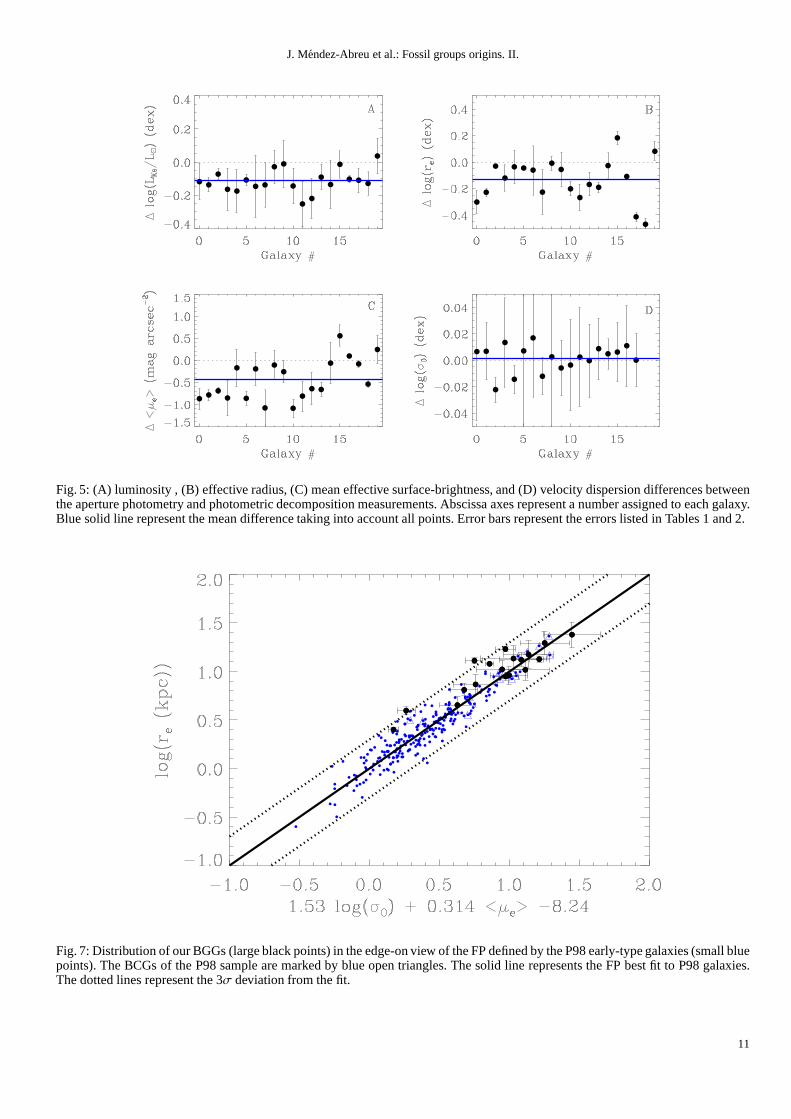
parameters for our sample data using also circular aperturepho-tometry onto our images. The actual computation was done us-ing the IRAF packageELLIPSE, as done by P98. Figure 5shows the results from this comparison. A clear bias appearsinall the photometric parameters under study. The luminosity(Lks),effective radius (re), and mean effective surface-brightness (〈µe〉)derived by the photometric decomposition are 0.11 dex, 0.13dex , and 0.44 mag arcsec−2 larger than those derived by aper-ture photometry, respectively. These differences are not unex-pected and have been pointed out in other studies. For instance,Aguerri et al. (2005) and Trujillo & Aguerri (2004) found that
7
J. Mendez-Abreu et al.: Fossil groups origins. II.
(c)
Fig. 3: Continued.
the differences in magnitudes between the two methods is neverlarger that 0.5 mag, in agreement with our result. The mainreason for these differences is that models used in the photo-metric decomposition approach are extrapolated to the infinite,therefore given larger magnitudes, effective radius and effectivesurface-brightness.
Figure 5 also shows the comparison between the central ve-locity dispersion of the galaxies using P98 and this work. Asexplained in Sect. 2.2.2, we corrected our velocity dispersionsusing a physical aperture ofre/8 whereas P98 used a physicalscale of 1.53 kpc. These different aperture corrections do not
introduce a bias between the two samples and it only could in-crease the scatter in the relations.
These biases must be kept in mind in the following but theyare not enough to change the results presented in this work. Infact, most of the differences are within the error bars of themea-surements. To avoid confusions, we have corrected for thesebi-ases in all the figures where we compare our measurements withP98 data.
8
J. Mendez-Abreu et al.: Fossil groups origins. II.
(d)
Fig. 3: Continued.
Table 2: Structural parameters in theKs-band derived by fitting a Sersic model to our sample of BGGs
Group µe re n q PA Ks
(mag/arcsec2) (arcsec) (kpc) ()(1) (2) (3) (4) (5) (6) (7) (8)
SDSSJ015021.27-100530.5 19.16±0.24 4.14±0.73 21.0±3.7 3.68±0.40 0.72±0.02 144.4±4.4 14.08±0.28SDSSJ015241.95+010025.5 19.50±0.12 6.77±0.51 24.9±1.9 2.39±0.12 0.52±0.01 18.5±0.2 13.12±0.10SDSSJ075244.19+455657.3 17.27±0.07 3.43±0.14 3.5±0.1 4.56±0.10 0.95±0.01 125.4±1.4 11.36±0.09SDSSJ080730.75+340041.6 20.23±0.39 8.67±2.75 29.5±9.3 3.57±0.48 0.80±0.02 73.4±1.5 13.03±0.32SDSSJ084257.55+362159.2 18.39±0.42 3.51±1.09 15.0±4.6 3.59±0.73 0.82±0.02 89.7±1.2 13.41±0.33SDSSJ084449.07+425642.1 18.19±0.15 6.05±0.54 6.4±0.6 3.84±0.21 0.70±0.01 20.9±0.1 11.15±0.08SDSSJ090303.18+273929.3 19.14±0.38 3.56±1.29 21.5±7.8 2.02±0.43 0.73±0.05 119.9±5.3 15.08±0.47SDSSJ094829.04+495506.7 21.00±0.42 8.81±3.09 48.0±16.8 5.33±0.39 0.45±0.01 53.0±1.1 14.22±0.34SDSSJ104302.57+005418.2 18.36±0.34 3.11±0.74 7.0±1.7 2.88±0.48 0.76±0.02 151.0±3.0 13.19±0.25SDSSJ105452.03+552112.5 18.20±0.25 2.72±0.62 16.0±3.7 1.75±0.22 0.78±0.02 101.3±3.3 14.72±0.35SDSSJ111439.76+403735.1 18.89±0.21 2.72±0.41 9.0±1.4 4.41±0.39 0.93±0.03 82.3±2.5 14.08±0.27SDSSJ112155.27+104923.2 18.61±0.34 2.92±0.79 11.1±3.0 2.71±0.41 0.80±0.03 100.9±3.0 14.03±0.34SDSSJ114128.29+055829.5 19.20±0.37 5.10±1.44 16.0±4.5 2.24±0.44 0.76±0.02 100.7±2.1 13.32±0.31SDSSJ114647.57+095228.1 18.95±0.15 4.58±0.49 16.3±1.7 2.04±0.17 0.54±0.01 55.0±1.1 13.47±0.19SDSSJ124742.07+413137.6 19.97±0.46 9.89±3.81 26.6±10.2 3.03±0.63 0.58±0.02 149.5±3.2 12.37±0.36SDSSJ133559.98-033129.1 18.16±0.25 3.53±0.55 10.6±1.6 1.99±0.30 0.80±0.02 131.1±2.6 13.10±0.21SDSSJ154855.85+085044.3 18.39±0.03 14.80±0.30 20.3±0.4 2.82±0.03 0.63±0.01 59.8±0.3 10.65±0.06SDSSJ161431.10+264350.3 18.39±0.08 6.37±0.45 19.7±1.4 2.76±0.14 0.78±0.02 20.5±0.4 12.93±0.18SDSSJ225630.04-003210.8 19.29±0.08 7.75±0.54 27.9±2.0 3.87±0.19 0.68±0.01 128.5±2.6 13.37±0.18SDSSJ235815.10+150543.5 18.91±0.33 4.91±1.18 14.8±3.6 2.21±0.39 0.69±0.01 97.2±1.9 13.08±0.27
Notes.Col.(1): Group name; Col. (2): effective surface brightness; Col. (3): effective radius (arcsec); Col. (4): effectiveradius (kpc); Col. (5):Sersic index; Col. (6): minor to major axis ratio; Col (7): position angle; Col. (8):Ks-band total magnitude derived from the Sersic fit. Effectivesurface brightness and magnitudes were corrected for galaxy inclination, cosmological dimming, K-correction and evolutionary effects.
4.2. Structural parameters vs. luminosity
Figure 6 shows the relation between the absolute rest-framemagnitude inKs-band (or equivalently also theKs-band lumi-nosity in solar units) obtained from the Sersic fit to the surface-brightness distribution of the sample galaxies and the meanef-fective surface brightness, or Sersic shape parameter.
Notice that some of our sample galaxies are among thebrightest galaxies located in cluster/group environmentsin theUniverse. They are brighter than the BCGs present in nearbyclusters such as Virgo or Coma, which are represented by trian-gle symbols. However, they are neither the most concentrated,nor posses the highest central surface brightness. In fact,themean effective surface brightness correlates well with thegalaxy
magnitude and follows the same trend of normal ellipticals andBCGs.
The P98 sample does not provide information about theshape of the surface-brightness profile, which in our case isrep-resented by the Sersic index, and therefore we can not make adirect comparison. However, it is worth noticing the wide rangeof Sersic index values obtained for our BGGs, ranging from 1.7to 5.3 with a mean value of 3.0. This indicates that the shape ofthe surface-brightness profile can be very different from a typicalde Vaucouleurs profile.
9
J. Mendez-Abreu et al.: Fossil groups origins. II.
Fig. 4: (A) Ellipticity, (B) centroid (r =√
(x − x0)2 + (y − y0)2), (C) fourth order Fourier cosine moment, and (D) position angleradial profiles of our sample galaxies. All radial profiles are normalized to the effective radius in the abscissa axis. Blue, green andred solid lines refers to BGGs withMKs ≥ −26,−26 < MKs < −27, andMKs ≤ −27, respectively. Both the centroid and positionangle profile were reported to their values atre. The radial profiles are plotted for radii larger than the corresponding PSF FWHM.
Fig. 6: Correlations between〈µe〉 (upper panel),n (bottom panel)and the galaxy absolute magnitude in theKs-band. Black largedots indicate our sample galaxies. Blue dots represent the P98early-type galaxies. The BCGs in the P98 sample are marked byblue open triangles.
4.3. Fundamental plane
It is well known that the structural parameters of clas-sical bulges and elliptical galaxies follow a tight relation
called the Fundamental Plane (FP; Djorgovski & Davis 1987;Dressler et al. 1987) among the effective radius (logre), meaneffective surface brightness (〈µe〉) and central stellar velocity dis-persion (logσ0). The small intrinsic dispersion of the FP rela-tion is a consequence of the virial theorem and demonstrate thatthese systems are in dynamical equilibrium. Possible deviationsfrom the FP are related to a variation of the mass-luminosityratio with the luminosity and/or a non-homology in the struc-ture of these galaxies throughout the whole range of luminosities(Trujillo et al. 2004). The FP has been widely used as a powerfultool in measuring galactic distances and also in studies of galaxyformation and evolution (Kjaergaard et al. 1993; Jørgensenet al.1996, 1999; Kelson et al. 1997).
Figure 7 shows the distribution of our sample galaxies in theFP relation defined by the sample of P98. Our BGGs follow a FPcompatible within the errors with that of normal ellipticals andBCGs, therefore implying that in the innermost regions (r < re)they are relaxed systems similar to normal ellipticals.
4.4. Kormendy relation
The effective radius and mean surface brightness of ellipticalgalaxies are correlated through the so-called Kormendy relation(KR; Kormendy 1977) which represents a projection of the FP.
Figure 8 shows the position of our BGGs in the KR with re-spect to the control sample of P98. The fit to the data points wasdone using the FITEXY routine (Press et al. 1992) implemented
10
J. Mendez-Abreu et al.: Fossil groups origins. II.
Fig. 5: (A) luminosity , (B) effective radius, (C) mean effective surface-brightness, and (D) velocity dispersion differences betweenthe aperture photometry and photometric decomposition measurements. Abscissa axes represent a number assigned to each galaxy.Blue solid line represent the mean difference taking into account all points. Error bars represent the errors listed in Tables 1 and 2.
Fig. 7: Distribution of our BGGs (large black points) in the edge-on view of the FP defined by the P98 early-type galaxies (small bluepoints). The BCGs of the P98 sample are marked by blue open triangles. The solid line represents the FP best fit to P98 galaxies.The dotted lines represent the 3σ deviation from the fit.
11
J. Mendez-Abreu et al.: Fossil groups origins. II.
in IDL2, which estimates the parameters of a straight-line fit tak-ing into account for data errors on both variables. The best fittedKR to the P98 sample is given by
〈µe〉 = 15.13(±0.38)+ 3.34(±0.86) logre. (2)
Our galaxies are systematically above the best-fit relationob-tained for the P98 sample, even if both relations are similaroncethe errors are taken into account. The relation obtained by fittingonly our galaxies is
〈µe〉 = 13.48(±2.71)+ 3.78(±1.51) logre. (3)
Several works studied the KR in galaxy clusters demon-strating that the intrinsic dispersion is approximately 0.4 magarcsec−2 in 〈µe〉 (Hoessel et al. 1987; Sandage & Perelmuter1991; La Barbera et al. 2003). This high intrinsic dispersion canbe interpreted in different ways: by the fact that the KR doesnot consider the third parameter of FP (i.e., velocity dispersion,Ziegler et al. 1999); because of the measurement errors as wellas the systematic errors due to the photometric calibrationandalso due to the corrections introduced for different biases(e.g.,zero point and color transformation, K-correction and redden-ing); or because the position of the galaxies in the KR dependson their magnitude (Nigoche-Netro et al. 2008).
In the case of our BGGs, we suggest that since our galaxiesrepresent the brightest galaxies located in cluster/groups, the dif-ferent position of the BGGs in the KR is produced only by theirhigher luminosity. In fact, galaxies with increasing magnitudesare placed parallel to the KR but with higher values of the meansurface brightness for a given effective radius, as it is thecaseof our sample galaxies. In addition, the coefficients of our fit arepoorly constrained due to our small number statistics, and bothsamples are consistent within the errors.
4.5. Faber-Jackson relation
The Faber-Jackson relation (FJ; Faber & Jackson 1976) repre-sents another physically significant projection of the FP. It cor-relates the galaxy magnitude with the stellar velocity dispersionand for this reason it is observationally more expensive to obtainthan the KR since it requires for spectroscopic data. For thesakeof clarity, in Fig. 9 we plot the total luminosity in theKs-band in-stead of the magnitude. TheKs-band luminosities of a given stel-lar population are less affected by metallicity effects than thosein optical passbands. In addition, they are a good proxy of thetotal stellar mass since the typicalM/L ∼ 1 for an old stellarpopulation (e.g., Bruzual & Charlot 2003).
Figure 9 represents the FJ relation for the P98 sample andour sample of BGGs. Recently, Bernardi et al. (2011a,b) havedemonstrated that the scaling relations of early-type galaxiespresent a change in their slope at a characteristic stellar mass(M∗ ∼ 2× 10¹¹ M⊙, see also Tortora et al. 2009). Interestingly,this curvature of the scaling relations is not present when the stel-lar mass of the galaxies is replaced by the central velocity dis-persion. In particular, they find that galaxies with masses higherthan 2×10¹¹ M⊙ have smaller velocity dispersions and largereffective radius for a given mass than their counterparts inthemass range 3×10¹⁰< M∗/M⊙ < 2×10¹¹.
Our sample galaxies represent a subset of the most mas-sive galaxies of the Universe. Some of them probably fall inthe Bernardi’s sample (Bernardi et al. 2011a,b) since they have
2 Interactive Data Language is distributed by ITT Visual InformationSolutions.
SDSS information. Unfortunately, we cannot compare directlywith their work since they have optical photometry whereas wehave near-infrared photometry. In Fig. 9 we plot the FJ fit to therange of masses where Bernardi et al. (2011b) consider that therelation is linear. Most of our BGGs follows the expected curva-ture in the logσ0 vs. logLKs relation, confirming and extendingthe results by Bernardi et al. (2011b).
4.6. Effective radius vs. luminosity
Figure 10 shows the relation between theKs-band luminosity insolar units obtained from the Sersic fit to the surface brightnessand the effective radius of the galaxies.
As done in the previous section, we tested the results ofBernardi et al. (2011b) with our sample of massive BGGs. Wefitted a straight line in logarithmic scale to the data in the massrange 3×10¹⁰ < M∗/M⊙ <2×10¹¹ and extrapolated such a fit tolarger masses. From our data, it is clear that most of our BGGsfollow the expected curvature in the logre vs. logLKs relation,i.e., galaxies with masses higher than 2×10¹¹M⊙ have largereffective radius for a given mass than their counterparts inthemass range between 3×10¹⁰ < M∗/M⊙ < 2×10¹¹, in agreementwith Bernardi et al. (2011b).
5. Discussion
The BGGs of the fossil systems presented in this study repre-sent a subset of the brightest and most massive galaxies in theUniverse. This can be seen by looking at both theirKs-band lu-minosities and central stellar velocity dispersions. However, theyclosely follow the FP scaling relation defined by normal ellipti-cal galaxies and other BCGs, suggesting that they are dynami-cally relaxed systems at least in their central regions.
FGs are believed to be created fast and in an early epoch ofthe Universe by the efficient merger ofL∗ galaxies inside DMhalos (D’Onghia et al. 2005; Dıaz-Gimenez et al. 2011). Inthisscenario, the BGGs observed at low redshift had time to reacha virialized status although some remnant of their merger phasecould still be present. The different relaxation time scales be-tween the inner and outer regions imply that the outskirts ofgalaxies may have fossil information about their past formation.The continuously increasing ellipticity profile observed in al-most all galaxies of our sample could be a hint of such a mergerhistory. Porter et al. (1991) reported on this behaviour of the el-lipticity profiles in a sample of BCGs, they found that 50%of the BCGs in rich clusters present these characteristics andassociated them with the observed absence of rotation in lumi-nous ellipticals (Davies et al. 1983; Carter et al. 1985). This re-sult might be consistent with our findings if the increasing ellip-ticity profiles are correlated with galaxy luminosity. In addition,Boylan-Kolchin et al. (2006) demonstrated by using numericalsimulations that these ellipticity trends can be explainedin termsof a high fraction of radial collisions, indicating a preferential di-rection in the orbits of the mergers.
Assuming that FGs were formed in an early epoch(Dariush et al. 2007; Dıaz-Gimenez et al. 2011) and then pas-sively evolved for a long time in order to reach a relaxed state,it is customary to consider that dissipational mergers withahigh fraction of gas should be predominant in the formationof these systems (Dıaz-Gimenez et al. 2008). Recent worksbyRobertson et al. (2006) and Hopkins et al. (2008) have demon-strated through simulations and observations, respectively, howthe observed tilt of the FP can be explained in terms of the
12
J. Mendez-Abreu et al.: Fossil groups origins. II.
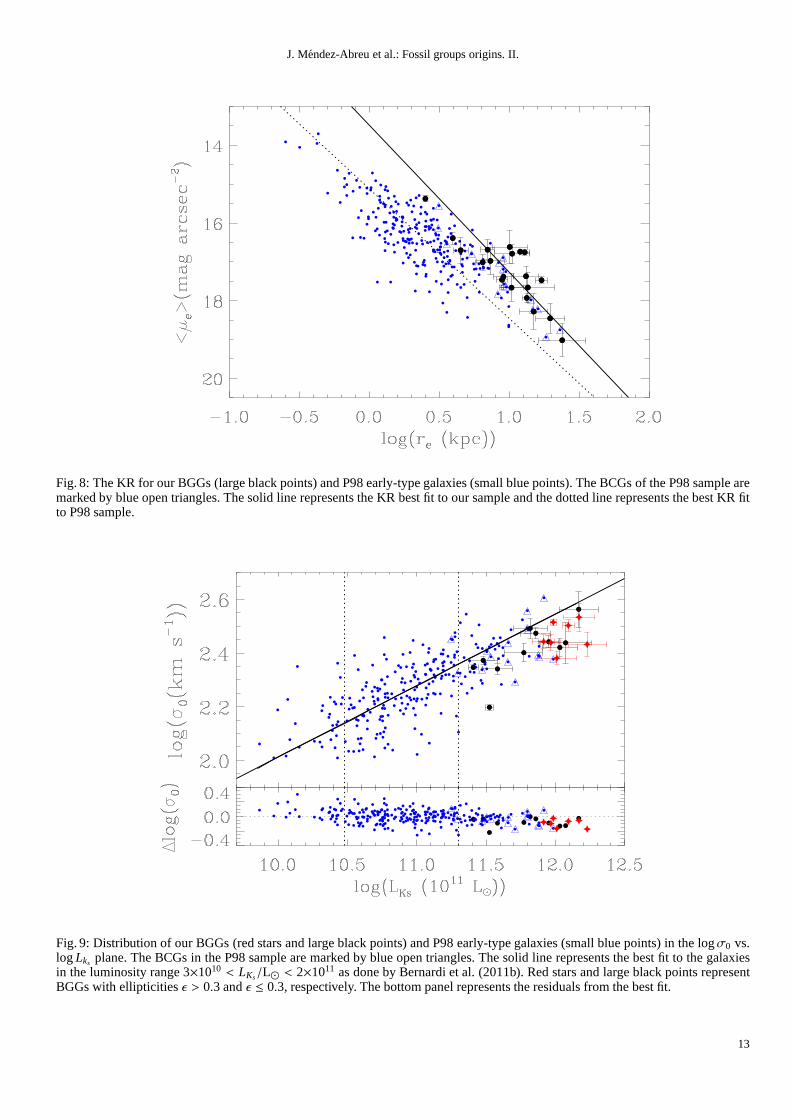
Fig. 8: The KR for our BGGs (large black points) and P98 early-type galaxies (small blue points). The BCGs of the P98 samplearemarked by blue open triangles. The solid line represents theKR best fit to our sample and the dotted line represents the best KR fitto P98 sample.
Fig. 9: Distribution of our BGGs (red stars and large black points) and P98 early-type galaxies (small blue points) in thelogσ0 vs.logLks plane. The BCGs in the P98 sample are marked by blue open triangles. The solid line represents the best fit to the galaxiesin the luminosity range 3×10¹⁰ < LKs/L⊙ < 2×10¹¹ as done by Bernardi et al. (2011b). Red stars and large black points representBGGs with ellipticitiesǫ > 0.3 andǫ ≤ 0.3, respectively. The bottom panel represents the residualsfrom the best fit.
13

J. Mendez-Abreu et al.: Fossil groups origins. II.
Fig. 10: Distribution of our BGGs (red stars and large black points) and P98 early-type galaxies (small blue points) in the logre vs.logLKs plane. The BCGs in the P98 sample are marked by blue open triangles. The solid line represents the best fit to the galaxiesin the luminosity range 3×10¹⁰ < LKs/L⊙ < 2×10¹¹ as done by Bernardi et al. (2011b). Red stars and large black points representBGGs with ellipticitiesǫ > 0.3 andǫ ≤ 0.3, respectively. The bottom panel represents the residualsfrom the best fit.
amount of dissipation involved in the formation of ellipticalgalaxies. They conclude that galaxies formed through dissipa-tionless mergers perfectly follow the FP defined by the virialtheorem (re ∝ σ
20〈µe〉
0.4) whereas ellipticals formed through dis-sipational mergers will present a FP tilt depending on the frac-tion of gas involved in the merger. Our galaxies, as normal el-lipticals, are well described by a tilted FP, thus showing someindications that most of them could be the remnants of mergerswith a high gas fraction. In addition, numerical simulations showthat gas-rich mergers at an early stage of the formation of BGGsare needed to account for the observed properties of ellipticalgalaxies (Hernquist et al. 1993; Naab & Ostriker 2009).
However, numerical simulations of gas-rich mergers alsopredict that the remnants will be round and compact galax-ies (i.e., with small effective radius) where the stellar veloc-ity dispersions should increase (e.g., Khochfar & Silk 2006;Naab et al. 2007; Hopkins et al. 2008). Recent observationalworks on early type galaxies by Bernardi et al. (2011a,b) haveshown a change in the slope of different scaling relations thatinvolve the stellar mass. This trend is interpreted by the authorsin terms of the kind of mergers that have been involved in theformation of these systems. Major dissipationless mergersbe-tween galaxies are mechanisms expected to increase the finalsize of the resulting galaxy but not its central velocity disper-sion; however, if minor dry mergers are the predominant mech-anism, they are expected to change both the size and veloc-ity dispersion (Bernardi et al. 2011a). Therefore, Bernardi et al.(2011b) claimed that the most feasible scenario is that galax-ies with M∗ > 2×10¹¹M⊙ formed mainly by major dissipa-tionless mergers. It is clear that most of our BGGs follow the
expected curvature in both the logσ0 vs. logLKs (Fig. 9) andlogre vs. logLKs (Fig. 10) relations, confirming the observa-tional trend found by Bernardi et al. (2011b). This interpretationcontradicts the previous one hinting toward a formation scenariowhere most of our BGGs formed through major gas-rich merger(Khosroshahi et al. 2006).
Another commonly used proxy to understand the forma-tion mechanisms of early-type galaxies is the Sersic index.Numerical simulations predict Sersic indexes for the remnants ofdry mergers in the range 3< n < 8 (Gonzalez-Garcıa & Balcells2005; Naab & Trujillo 2006), whereas in dissipational mergersthey would be in the range 2< n < 4 (Hopkins et al. 2009;Kormendy et al. 2009). We have tentatively divided our samplein galaxies withn ≤ 3 andn >3 in order to understand whetherthe shape of the surface-brightness profiles could be used todis-tinguish among the different formation scenarios. We did notfind any relation between the departure from the intermediate-mass scaling relations and Sersic index. Similarly, several worksbased on numerical simulations found that the shape of theisophotes can be also used to trace the merger history of ellip-tical galaxies (Naab & Burkert 2003; Khochfar & Burkert 2005;Naab et al. 2006). These studies found out that disky isophotesare the result of gas-rich mergers whereas boxy isophotes arepreferentially formed in dissipationless collisions. Supported bythese results, Khosroshahi et al. (2006) claim that BGGs in fossilsystems were formed through dissipational mergers since theyshow non-boxy isophotes. We measured the isophote shapes bymeans of thea4 coefficient, however, their noisy profiles (Fig. 4)prevented us to extract conclusions about the merger history ofour BGGs based on the isophotes shape.
14
J. Mendez-Abreu et al.: Fossil groups origins. II.
Interestingly, we found that the ellipticity turned out to be agood indicator of the kind of merger involved in the formation ofBGGs. Numerical simulations show that the remnants of dissipa-tional mergers are rounder on average when compared to rem-nants of dissipationless mergers (Cox et al. 2004). In fact,theellipticity distribution of dissipational merger remnants peaks atabout 0.2 which is in sharp contrast to the dissipationless rem-nants whose distribution of ellipticities peaks at about 0.4. Weused this information to separate our BGGs in galaxies withǫ ≤ 0.3 andǫ > 0.3. We measured the ellipticities atre to mimicsimulations. The results are shown in Figs. 9 and 10. It is clearthat BGGs with larger ellipticities systematically deviate fromthe intermediate-mass scaling relation, whereas rounder galaxiesare also distributed near to this relation. Therefore, we interpretthis result as a further hint that dissipationless mergers (ǫ > 0.3)are the main processes driven the evolution of BGGs.
We conclude that BGGs in fossil systems suffered major dis-sipational mergers in an early epoch of their formation, but thebulk of their mass is assembled latter in subsequent dissipation-less mergers that increase the BGGs size.
6. Conclusions
We analyzed the near-infraredKs-band photometric propertiesof a sample of 20 BGGs observed within the framework of theFOGO project (Aguerri et al. 2011). So far, this represent thelargest sample of BGGs in fossil systems studied in the near-infrared. Here we summarize our results:
– The structural parameters of the sample galaxies were de-rived using the GASP2D algorithm (Mendez-Abreu et al.2008) by fitting a Sersic model to the their surface-brightnessdistribution. This model provides a good description for allthe galaxies and allows a straightforward comparison withthe results available in literature.
– Only one sample BGG is a candidate to be a cD galaxy sinceit shows an upward break in the surface-brightness profilewith respect to a de Vaucouleurs profile.
– The ellipticity profile of most of our galaxies is an increasingfunction of the radius. This can be related to the fact that ourgalaxies represent the very bright end of the luminosity func-tion. The trend in the ellipticity profile cannot be explainedin terms of a oblate/prolate spheroid. Together with the varia-tion observed in the galaxy centroid and position angle radialprofiles, it might indicate the presence of preferential direc-tion in the orbits of the mergers.
– We built theKs-band scaling relations (FP, KR, and FJ) forour sample of BGGs and we compared them with those ofnormal elliptical and BCGs. We did not find any significantdifference between the FP defined by BGGs and those ofellipticals or BCGs. This suggests that the central regionsofBGGs are relaxed with structure similar to those of normalellipticals. However, we found a change of the slope in the FJand in the logre vs. logLKs relation for our massive galaxies.
These observational results can be interpreted in terms of theformation scenario of the BGGs. Our BGGs sample follows theFP of ellipticals and therefore are well reproduced by a tiltedFP. Therefore, this supports that most of our BGGs probablysuffered dissipational mergers during their formation. However,the curvature found in the scaling relation involving the mass ofthe galaxies can be interpreted as an indication that the stellarmass of these systems grew mainly by dissipationless mergers.Therefore, we suggest that BGGs in fossil system suffered ma-jor dissipational mergers in an early epoch of their formation,
but the bulk of their mass is assembled latter in subsequent dis-sipationless mergers that increase the BGGs size.
Acknowledgements. We acknowledge the anonymous referee for the pos-itive comments which helped us to improve the paper. JMA, JIP, andJVM are partially funded by the Spanish MICINN under the Consolider-Ingenio 2010 Program grant CSD2006-00070: First Science with the GTC(http://www.iac.es/consolider-ingenio-gtc). JMA and JALA are partially fundedby the Spanish MICINN (grants AYA2007-67965-C03-01 and AYA2010-21887-C04-04). JIP and JVM are partially funded by the Spanish MICINN (grantsAYA2007-67965-C03-02 and AYA2010-21887-C04-01). EMC is supported bythe University of Padua through grants CPDA089220, 60A02-1283/10, and60A02-5052/11 and by the Italian Space Agency (ASI) throughgrant ASI-INAFI/009/10/0. This article is based on observations made withthe William HerschelTelescope operated on the island of La Palma, in the Spanish Observatorio delRoque de los Muchachos of the Instituto de Astrofısica de Canarias. This workis based in part on data obtained as part of the UKIRT InfraredDeep Sky Survey.
ReferencesAguerri, J. A. L., Girardi, M., Boschin, W., et al. 2011, A&A,527, A143Aguerri, J. A. L., Iglesias-Paramo, J., Vilchez, J. M., & Mu˜noz-Tunon, C. 2004,
AJ, 127, 1344Aguerri, J. A. L., Iglesias-Paramo, J., Vılchez, J. M., Munoz-Tunon, C., &
Sanchez-Janssen, R. 2005, AJ, 130, 475Aihara, Allende Prieto, C., An, D., et al. 2011, ArXiv e-printsAscaso, B., Aguerri, J. A. L., Varela, J., et al. 2011, ApJ, 726, 69Beifiori, A., Courteau, S., Corsini, E. M., & Zhu, Y. 2011, MNRAS, submittedBernardi, M., Roche, N., Shankar, F., & Sheth, R. K. 2011a, MNRAS, 412, 684Bernardi, M., Roche, N., Shankar, F., & Sheth, R. K. 2011b, MNRAS, 412, L6Bertin, E. & Arnouts, S. 1996, A&AS, 117, 393Boylan-Kolchin, M., Ma, C.-P., & Quataert, E. 2006, MNRAS, 369, 1081Bruzual, G. & Charlot, S. 2003, MNRAS, 344, 1000Caon, N., Capaccioli, M., & D’Onofrio, M. 1993, MNRAS, 265, 1013Carter, D., Inglis, I., Ellis, R. S., Efstathiou, G., & Godwin, J. G. 1985, MNRAS,
212, 471Casali, M. M. & Hawarden, T. G. 1992, in UKIRT Newsletter, UKIRT
NewsletterCox, T. J., Primack, J., Jonsson, P., & Somerville, R. S. 2004, ApJ, 607, L87Cui, W., Springel, V., Yang, X., De Lucia, G., & Borgani, S. 2011, ArXiv e-printsCypriano, E. S., Mendes de Oliveira, C. L., & Sodre, Jr., L. 2006, AJ, 132, 514Dalla Bonta, E., Houghton, R., Davies, R. L., & et al. 2011, MNRAS, in prepa-
rationDariush, A., Khosroshahi, H. G., Ponman, T. J., et al. 2007, MNRAS, 382, 433Davies, R. L., Efstathiou, G., Fall, S. M., Illingworth, G.,& Schechter, P. L.
1983, ApJ, 266, 41de Vaucouleurs, G. 1948, Annales d’Astrophysique, 11, 247Democles, J., Pratt, G. W., Pierini, D., et al. 2010, A&A, 517, A52Dıaz-Gimenez, E., Muriel, H., & Mendes de Oliveira, C. 2008, A&A, 490, 965Dıaz-Gimenez, E., Zandivarez, A., Proctor, R., Mendes deOliveira, C., &
Abramo, L. R. 2011, A&A, 527, A129Djorgovski, S. & Davis, M. 1987, ApJ, 313, 59D’Onghia, E., Sommer-Larsen, J., Romeo, A. D., et al. 2005, ApJ, 630, L109Dressler, A., Lynden-Bell, D., Burstein, D., et al. 1987, ApJ, 313, 42Faber, S. M. & Jackson, R. E. 1976, ApJ, 204, 668Gonzalez, A. H., Zabludoff, A. I., & Zaritsky, D. 2003, Ap&SS, 285, 67Gonzalez, A. H., Zabludoff, A. I., & Zaritsky, D. 2005, ApJ, 618, 195Gonzalez-Garcıa, A. C. & Balcells, M. 2005, MNRAS, 357, 753Graham, A. W. & Guzman, R. 2003, AJ, 125, 2936Hernquist, L., Spergel, D. N., & Heyl, J. S. 1993, ApJ, 416, 415Hoessel, J. G., Oegerle, W. R., & Schneider, D. P. 1987, AJ, 94, 1111Hopkins, P. F., Cox, T. J., Dutta, S. N., et al. 2009, ApJS, 181, 135Hopkins, P. F., Cox, T. J., & Hernquist, L. 2008, ApJ, 689, 17Jedrzejewski, R. I. 1987, MNRAS, 226, 747Jones, L. R., Ponman, T. J., Horton, A., et al. 2003, MNRAS, 343, 627Jørgensen, I., Franx, M., Hjorth, J., & van Dokkum, P. G. 1999, MNRAS, 308,
833Jørgensen, I., Franx, M., & Kjaergaard, P. 1995, MNRAS, 276,1341Jørgensen, I., Franx, M., & Kjaergaard, P. 1996, MNRAS, 280,167Kelson, D. D., van Dokkum, P. G., Franx, M., Illingworth, G. D., & Fabricant,
D. 1997, ApJ, 478, L13+Khochfar, S. & Burkert, A. 2005, MNRAS, 359, 1379Khochfar, S. & Silk, J. 2006, ApJ, 648, L21Khosroshahi, H. G., Maughan, B. J., Ponman, T. J., & Jones, L.R. 2006,
MNRAS, 369, 1211Khosroshahi, H. G., Ponman, T. J., & Jones, L. R. 2007, MNRAS,377, 595
15
J. Mendez-Abreu et al.: Fossil groups origins. II.
Khosroshahi, H. G., Raychaudhury, S., Ponman, T. J., Miles,T. A., & Forbes,D. A. 2004, MNRAS, 349, 527
Kjaergaard, P., Jorgensen, I., & Moles, M. 1993, ApJ, 418, 617Kormendy, J. 1977, ApJ, 218, 333Kormendy, J., Fisher, D. B., Cornell, M. E., & Bender, R. 2009, ApJS, 182, 216La Barbera, F., Busarello, G., Merluzzi, P., Massarotti, M., & Capaccioli, M.
2003, ApJ, 595, 127La Barbera, F., de Carvalho, R. R., de la Rosa, I. G., et al. 2009, AJ, 137, 3942Liu, F. S., Xia, X. Y., Mao, S., Wu, H., & Deng, Z. G. 2008, MNRAS, 385, 23Manchado, A., Barreto, M., Acosta-Pulido, J., et al. 2004, in Society of
Photo-Optical Instrumentation Engineers (SPIE) Conference Series, Vol.5492, Society of Photo-Optical Instrumentation Engineers(SPIE) ConferenceSeries, ed. A. F. M. Moorwood & M. Iye, 1094–1104
Matthews, T. A., Morgan, W. W., & Schmidt, M. 1964, ApJ, 140, 35Mendes de Oliveira, C. L., Cypriano, E. S., Dupke, R. A., & Sodre, L. 2009, AJ,
138, 502Mendes de Oliveira, C. L., Cypriano, E. S., & Sodre, Jr., L. 2006, AJ, 131, 158Mendez-Abreu, J., Aguerri, J. A. L., Corsini, E. M., & Simonneau, E. 2008,
A&A, 478, 353Mendez-Abreu, J., Simonneau, E., Aguerri, J. A. L., & Corsini, E. M. 2010,
A&A, 521, A71+Morelli, L., Pompei, E., Pizzella, A., et al. 2008, MNRAS, 389, 341Mulchaey, J. S. & Zabludoff, A. I. 1999, ApJ, 514, 133Naab, T. & Burkert, A. 2003, ApJ, 597, 893Naab, T., Jesseit, R., & Burkert, A. 2006, MNRAS, 372, 839Naab, T., Johansson, P. H., Ostriker, J. P., & Efstathiou, G.2007, ApJ, 658, 710Naab, T. & Ostriker, J. P. 2009, ApJ, 690, 1452Naab, T. & Trujillo, I. 2006, MNRAS, 369, 625Nelson, A. E., Simard, L., Zaritsky, D., Dalcanton, J. J., & Gonzalez, A. H. 2002,
ApJ, 567, 144Nigoche-Netro, A., Ruelas-Mayorga, A., & Franco-Balderas, A. 2008, A&A,
491, 731Pahre, M. A. 1999, ApJS, 124, 127Pahre, M. A., Djorgovski, S. G., & de Carvalho, R. R. 1998, AJ,116, 1591 [P98]Pizzella, A., Corsini, E. M., Sarzi, M., et al. 2008, MNRAS, 387, 1099Poggianti, B. M. 1997, A&AS, 122, 399Ponman, T. J., Allan, D. J., Jones, L. R., et al. 1994, Nature,369, 462Porter, A. C., Schneider, D. P., & Hoessel, J. G. 1991, AJ, 101, 1561Press, W. H., Teukolsky, S. A., Vetterling, W. T., & Flannery, B. P. 1992,
Numerical recipes in FORTRAN. The art of scientific computing, ed. Press,W. H., Teukolsky, S. A., Vetterling, W. T., & Flannery, B. P.
Robertson, B., Cox, T. J., Hernquist, L., et al. 2006, ApJ, 641, 21Romeo, A. D., Napolitano, N. R., Covone, G., et al. 2008, MNRAS, 389, 13Sandage, A. & Perelmuter, J. 1991, ApJ, 370, 455Santos, W. A., Mendes de Oliveira, C., & Sodre, Jr., L. 2007,AJ, 134, 1551Schombert, J. M. 1987, ApJS, 64, 643Seigar, M. S., Graham, A. W., & Jerjen, H. 2007, MNRAS, 378, 1575Sersic, J. L. 1968, Atlas de galaxias australes, ed. Sersic, J. L.Sommer-Larsen, J. 2006, MNRAS, 369, 958Sun, M., Forman, W., Vikhlinin, A., et al. 2004, ApJ, 612, 805Sun, M., Voit, G. M., Donahue, M., et al. 2009, ApJ, 693, 1142Tortora, C., Napolitano, N. R., Romanowsky, A. J., Capaccioli, M., & Covone,
G. 2009, MNRAS, 396, 1132Trujillo, I. & Aguerri, J. A. L. 2004, MNRAS, 355, 82Trujillo, I., Aguerri, J. A. L., Cepa, J., & Gutierrez, C. M.2001, MNRAS, 328,
977Trujillo, I., Burkert, A., & Bell, E. F. 2004, ApJ, 600, L39Vikhlinin, A., McNamara, B. R., Hornstrup, A., et al. 1999, ApJ, 520, L1Voevodkin, A., Borozdin, K., Heitmann, K., et al. 2010, ApJ,708, 1376von Benda-Beckmann, A. M., D’Onghia, E., Gottlober, S., etal. 2008, MNRAS,
386, 2345Zibetti, S., Pierini, D., & Pratt, G. W. 2009, MNRAS, 392, 525Ziegler, B. L., Saglia, R. P., Bender, R., et al. 1999, A&A, 346, 13
16