Formulation of Nano/Micro-Carriers Loaded with an Enriched ...
30
Citation: Fathi, F.; Ebrahimi, S.N.; Prior, J.A.V.; Machado, S.M.L.; Kouchaksaraee, R.M.; Oliveira, M.B.P.P.; Alves, R.C. Formulation of Nano/Micro-Carriers Loaded with an Enriched Extract of Coffee Silverskin: Physicochemical Properties, In Vitro Release Mechanism and In Silico Molecular Modeling. Pharmaceutics 2022, 14, 112. https://doi.org/10.3390/ pharmaceutics14010112 Academic Editor: Patrick J. Sinko Received: 8 November 2021 Accepted: 23 December 2021 Published: 4 January 2022 Publisher’s Note: MDPI stays neutral with regard to jurisdictional claims in published maps and institutional affil- iations. Copyright: © 2022 by the authors. Licensee MDPI, Basel, Switzerland. This article is an open access article distributed under the terms and conditions of the Creative Commons Attribution (CC BY) license (https:// creativecommons.org/licenses/by/ 4.0/). pharmaceutics Article Formulation of Nano/Micro-Carriers Loaded with an Enriched Extract of Coffee Silverskin: Physicochemical Properties, In Vitro Release Mechanism and In Silico Molecular Modeling Faezeh Fathi 1 , Samad N. Ebrahimi 2 , João A. V. Prior 3 , Susana M. L. Machado 1 , Reza Mohsenian Kouchaksaraee 1 , M. Beatriz P. P. Oliveira 1, * and Rita C. Alves 1, * 1 REQUIMTE/LAQV, Laboratory of Bromatology and Hydrology, Department of Chemical Sciences, Faculty of Pharmacy, University of Porto, Rua de Jorge Viterbo Ferreira, 228, 4050-313 Porto, Portugal; [email protected] (F.F.); [email protected] (S.M.L.M.); [email protected] (R.M.K.) 2 Department of Phytochemistry, Medicinal Plants and Drugs Research Institute, Shahid Beheshti University, Tehran 1983969411, Iran; [email protected] 3 REQUIMTE/LAQV, Laboratory of Applied Chemistry, Department of Chemical Sciences, Faculty of Pharmacy, University of Porto, Rua de Jorge Viterbo Ferreira, 228, 4050-313 Porto, Portugal; [email protected] * Correspondence: [email protected] (M.B.P.P.O.); [email protected] (R.C.A.) Abstract: Designing strategies for an effective transformation of food waste into high-value prod- ucts is a priority to address environmental sustainability concerns. Coffee silverskin is the major by-product of the coffee roasting industry, being rich in compounds with health benefits. Such composition gives it the potential to be transformed into high-value products. In this study, coffee silverskin extracts were enriched, regarding caffeine and chlorogenic acid contents, by adsorbent col- umn chromatography. The compounds content increased 3.08- and 2.75-fold, respectively, compared to the original extract. The enriched fractions were loaded into nano-phytosomes or cholesterol- incorporated nano-phytosomes (first coating layers) to improve the physiochemical properties and permeation rate. These nano-lipid carriers were also subjected to a secondary coating with different natural polymers to improve protection and stability against degradation. In parallel, and for compar- ison, different natural polymers were also used as first coating layers. The produced particles were evaluated regarding product yield, encapsulation efficiency, loading capacity, particle size, surface charge, and in vitro release simulating gastrointestinal conditions. All samples exhibited anionic surface charge. FTIR and molecular docking confirmed interactions between the phytoconstituents and lipid bilayers. The best docking score was observed for 5-caffeoylquinic acid (chlorogenic acid) exhibiting a stronger hydrogen binding to the lipid bilayer. Among several kinetic models tested, the particle release mechanism fitted well with the First-order, Korsmeyer–Peppas, and Higuchi models. Moreover, most of the formulated particles followed the diffusion-Fick law and anomalous transport. Keywords: coffee by-product; phytosome; cholesterol; natural polymer; molecular docking; kinetic release model 1. Introduction Food processing industries produce relevant amounts of by-products that are dis- carded, despite their content in valuable nutritional and biological constituents. Their valorization can play a vital role in financial prospects [1]. Therefore, a current concern is to implement the concept of sustainable food waste management worldwide in order to use by-products and convert them into new products of high value, while assuring the development and exploitation of eco-friendly techniques to achieve that goal [2]. Coffee silverskin (SI) is a light brownish pellicle integument of the raw coffee bean. These pellicles are detached from the coffee bean during the industrial roasting process. Given the abundance of coffee factories, SI has become a relevant by-product that should Pharmaceutics 2022, 14, 112. https://doi.org/10.3390/pharmaceutics14010112 https://www.mdpi.com/journal/pharmaceutics
-
Upload
khangminh22 -
Category
Documents
-
view
2 -
download
0
Transcript of Formulation of Nano/Micro-Carriers Loaded with an Enriched ...

�����������������
Citation: Fathi, F.; Ebrahimi, S.N.;
Prior, J.A.V.; Machado, S.M.L.;
Kouchaksaraee, R.M.; Oliveira,
M.B.P.P.; Alves, R.C. Formulation of
Nano/Micro-Carriers Loaded with
an Enriched Extract of Coffee
Silverskin: Physicochemical
Properties, In Vitro Release
Mechanism and In Silico Molecular
Modeling. Pharmaceutics 2022, 14, 112.
https://doi.org/10.3390/
pharmaceutics14010112
Academic Editor: Patrick J. Sinko
Received: 8 November 2021
Accepted: 23 December 2021
Published: 4 January 2022
Publisher’s Note: MDPI stays neutral
with regard to jurisdictional claims in
published maps and institutional affil-
iations.
Copyright: © 2022 by the authors.
Licensee MDPI, Basel, Switzerland.
This article is an open access article
distributed under the terms and
conditions of the Creative Commons
Attribution (CC BY) license (https://
creativecommons.org/licenses/by/
4.0/).
pharmaceutics
Article
Formulation of Nano/Micro-Carriers Loaded with an EnrichedExtract of Coffee Silverskin: Physicochemical Properties,In Vitro Release Mechanism and In Silico Molecular ModelingFaezeh Fathi 1 , Samad N. Ebrahimi 2 , João A. V. Prior 3 , Susana M. L. Machado 1,Reza Mohsenian Kouchaksaraee 1 , M. Beatriz P. P. Oliveira 1,* and Rita C. Alves 1,*
1 REQUIMTE/LAQV, Laboratory of Bromatology and Hydrology, Department of Chemical Sciences,Faculty of Pharmacy, University of Porto, Rua de Jorge Viterbo Ferreira, 228, 4050-313 Porto, Portugal;[email protected] (F.F.); [email protected] (S.M.L.M.); [email protected] (R.M.K.)
2 Department of Phytochemistry, Medicinal Plants and Drugs Research Institute, Shahid Beheshti University,Tehran 1983969411, Iran; [email protected]
3 REQUIMTE/LAQV, Laboratory of Applied Chemistry, Department of Chemical Sciences,Faculty of Pharmacy, University of Porto, Rua de Jorge Viterbo Ferreira, 228, 4050-313 Porto, Portugal;[email protected]
* Correspondence: [email protected] (M.B.P.P.O.); [email protected] (R.C.A.)
Abstract: Designing strategies for an effective transformation of food waste into high-value prod-ucts is a priority to address environmental sustainability concerns. Coffee silverskin is the majorby-product of the coffee roasting industry, being rich in compounds with health benefits. Suchcomposition gives it the potential to be transformed into high-value products. In this study, coffeesilverskin extracts were enriched, regarding caffeine and chlorogenic acid contents, by adsorbent col-umn chromatography. The compounds content increased 3.08- and 2.75-fold, respectively, comparedto the original extract. The enriched fractions were loaded into nano-phytosomes or cholesterol-incorporated nano-phytosomes (first coating layers) to improve the physiochemical properties andpermeation rate. These nano-lipid carriers were also subjected to a secondary coating with differentnatural polymers to improve protection and stability against degradation. In parallel, and for compar-ison, different natural polymers were also used as first coating layers. The produced particles wereevaluated regarding product yield, encapsulation efficiency, loading capacity, particle size, surfacecharge, and in vitro release simulating gastrointestinal conditions. All samples exhibited anionicsurface charge. FTIR and molecular docking confirmed interactions between the phytoconstituentsand lipid bilayers. The best docking score was observed for 5-caffeoylquinic acid (chlorogenic acid)exhibiting a stronger hydrogen binding to the lipid bilayer. Among several kinetic models tested, theparticle release mechanism fitted well with the First-order, Korsmeyer–Peppas, and Higuchi models.Moreover, most of the formulated particles followed the diffusion-Fick law and anomalous transport.
Keywords: coffee by-product; phytosome; cholesterol; natural polymer; molecular docking; kineticrelease model
1. Introduction
Food processing industries produce relevant amounts of by-products that are dis-carded, despite their content in valuable nutritional and biological constituents. Theirvalorization can play a vital role in financial prospects [1]. Therefore, a current concernis to implement the concept of sustainable food waste management worldwide in orderto use by-products and convert them into new products of high value, while assuring thedevelopment and exploitation of eco-friendly techniques to achieve that goal [2].
Coffee silverskin (SI) is a light brownish pellicle integument of the raw coffee bean.These pellicles are detached from the coffee bean during the industrial roasting process.Given the abundance of coffee factories, SI has become a relevant by-product that should
Pharmaceutics 2022, 14, 112. https://doi.org/10.3390/pharmaceutics14010112 https://www.mdpi.com/journal/pharmaceutics

Pharmaceutics 2022, 14, 112 2 of 30
be valorized based on its richness in several phytochemicals, such as caffeine and phenoliccompounds [3,4].
Fractionation of plant crude extracts using polymeric adsorbent resin column chro-matography promotes an enrichment of bioactive compounds based on functionality andpolarity of the phytoconstituents. This enrichment provides an enhancement of the phyto-constituents bioactivity at a low dosage [5].
To overcome limitations related to low stability, absorption rates, bioavailability, orfunctionality of some phytoconstituents, a wise choice is to focus on natural-based carriersfor safe and targeted delivery [6] Accordingly, phytosomes are targeted delivery carriers,characterized by a specific bonding between phospholipids and the compounds of interest(e.g., drugs, phytochemicals, etc.), with possible distinctive configurations. In other words,phytosomes are non-polar carriers for the efficient delivery of bioactive components throughthe cell membrane. Indeed, they are considered suitable carriers for medicines, dietarysupplements, or cosmetic products due to the improved bioavailability and permeationof compounds through the cell membrane, while protecting natural sensitive structuresagainst environmental conditions [7].
Taking into account the low permeation of polar phytoconstituents through the cellmembrane, nano-phytosomes based on soybean lecithin (containing 94% phosphatidyl-choline) assure significant similarities with the cell membrane to facilitate permeation, avery important requisite for the development of highly efficient delivery carriers [8]. Addi-tionally, the incorporation of cholesterol into the nano-phytosome lipid layer (cholesterol-incorporated nano-phytosomes) by surface modification provides improved stability of thenano-phytosome in solution media [9].
Natural polymers (NP), which are non-toxic, biodegradable, and biocompatible, canalso protect phytoconstituents or drugs, through encapsulation techniques, improvingstability during storage and handling, and also allowing a controlled release [10]. Therefore,NP coating of extracts or nano-phytosomes (being, in this last case, a secondary coating)in the form of small capsules obtained by spray-drying can also be applied to enhanceprotection, solubility, and stability of the compounds in acidic media, and to improveshelf-life during handling and storage [11].
The main aim of this work was to formulate and compare different types of nano/micro-carriers loaded with an SI extract enriched in caffeine and phenolic compounds with an-tioxidant properties. A potential application, for instance, in the dietary supplement fieldis foreseen, more specifically to improve mental and physical performance, competingwith other products already existing in the market [12]. A final product is expected that iswell absorbed and tolerated, which efficiently delivers the mentioned phytochemicals intargeted body areas, to more effective bioactivity at lower dosages.
For that, lipid carriers (nano-phytosomes or cholesterol-incorporated nano-phytosomes)were applied as first layers to an SI-enriched extract, in order to enhance the phytochemicalspermeation rates. In parallel, and for comparison, different NPs were also used as firstlayers, directly coating the SI-enriched extract (simple encapsulation). Additionally, bothlipid-based layers (nano-phytosomes and cholesterol-incorporated nano-phytosomes) werealso coated with different NPs as secondary coating layers to increase stability duringstorage and handling, improve adhesion affinity of particles (which enhance phytochemi-cals uptake), and provide a controlled release [13–15]. Afterwards, the in silico moleculardocking was used to confirm the molecular arrangement and interactions among the lipidbilayer and specific phytochemicals [16]. Indeed, this study presents, for the first time, bymolecular docking, the interaction between the nano-phytosome bilayer and two majorconstituents of SI, namely, caffeine and chlorogenic acid (5-caffeoylquinic acid). The ar-rangement of other phytochemicals within similar lipid bilayers was also recently reportedfor the first time by our research group [16].

Pharmaceutics 2022, 14, 112 3 of 30
2. Materials and Methods2.1. Chemicals and Standards
Gallic acid (CAS 149-91-7) and chlorogenic acid 95% (CAS 327-97-9) were supplied bySigma, Life Science, Shanghai, China. Apple pectin (CAS 9000-09-5) was purchased fromLABChem, Lisbon, Portugal; maltodextrin (CAS 32671-12) from Fargon, Barcelona, Spain;and gum Arabic from Guinama, Valencia, Spain. Water-soluble starch from potato (CAS9005-84-9) was supplied from PanReac-Applichem, Darmstadt, Germany. Soybean lecithin(CAS 8002-43-5; purity of 90%) was obtained from Alfa Aesar, Thermofisher, Kandel, Ger-many. Cholesterol (CAS C8667-25G; purity ≥ 99%) was supplied by Sigma, Life Science,St. Louis, MO, USA. Absolute ethanol (≥99.8% and 96% purity), dichloromethane (≥99.9%),and HPLC grade analytical solvents were purchased from Honeywell (Hessen, Germany).Relite EXA90 (ion exchange resin) DiaionTM HP20LX (spherical porous polystyrene resin)were both kindly supplied by the Resindion group of Mitsubishi Chemical, Binasco,Italy. Sodium phosphate dibasic heptahydrate (Na2HPO4·7H2O) and sodium phosphatemonobasic monohydrate (NaH2PO4·H2O) were purchased from PanReac, Barcelona, Spain.Ultra-pure water was obtained from Seralpur PRO 60 CN and Seradest LFM 20 waterpurification systems.
2.2. Samples
SI was kindly provided by a Portuguese coffee roaster industry (BICAFÉ). It resultedfrom the roast of commercial batches composed of both Coffee arabica and Coffea canephorabeans and was representative of the major by-product of the factory.
2.3. Experimental Design
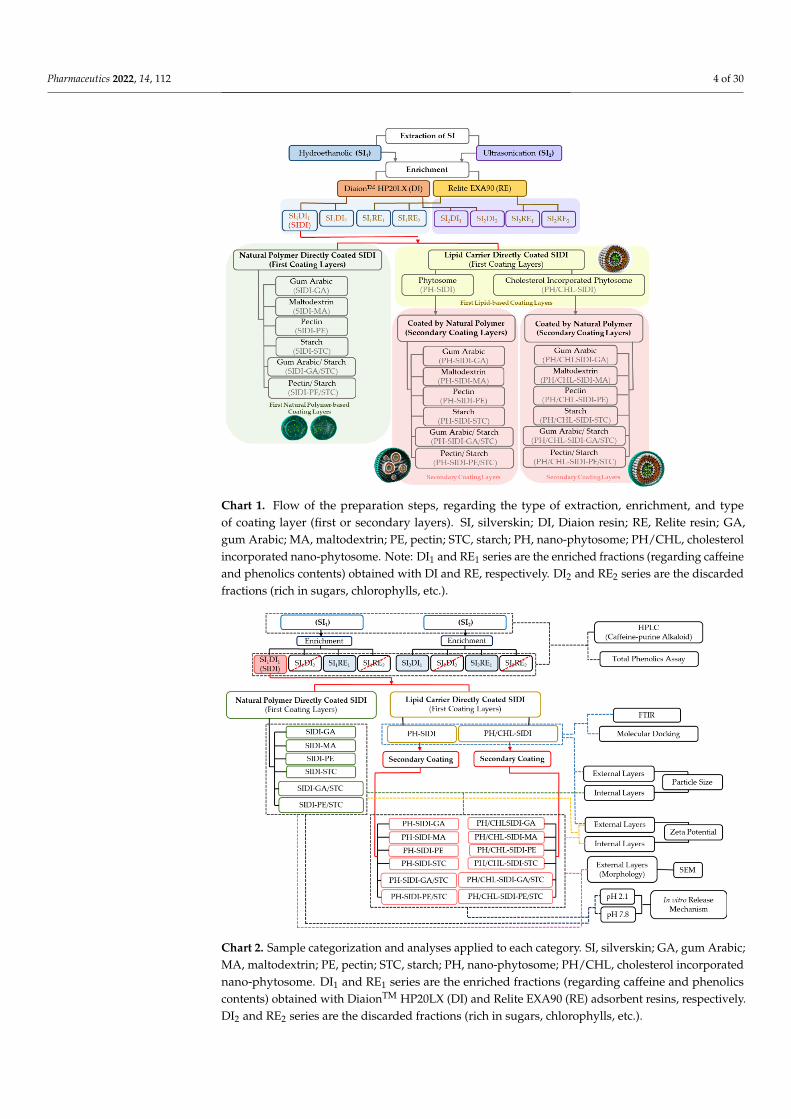
Chart 1 aims to clearly introduce the flow of the preparation steps, regarding the typeof extraction, enrichment, and type of coating layer in terms of first and secondary layers.The final product codes for each category are also presented in Chart 1.
SI was extracted using different techniques (maceration with a hydroethanolic solvent(SI1) or ultrasonication (SI2)) and each extract was enriched (to increase caffeine andphenolics contents) using one of these resins: DiaionTM HP20LX (DI) or Relite EXA90 (RE).DI1 and RE1 series are the enriched fractions obtained with DI and RE, respectively. DI2and RE2 series are the rejected fractions (explained in Section 2.4. and Chart 2)
The most enriched fraction (SI1DI1) was then selected for the following formulationprocedures. SI1DI1 (from now on named SIDI) was loaded into nano-phytosomes orcholesterol-incorporated nano-phytosomes as first coating layers (Chart 1, in yellow). Inparallel, SIDI was also directly coated with NP as the first coating layer (single coatinglayer) (Chart 1, in green). Meanwhile, to improve the stability and protection of lipid-basedcarriers, NPs were also used to prepare secondary layers, encapsulating the abovemen-tioned nano-phytosomes and cholesterol-incorporated nano-phytosomes (Chart 1, in pink).In sum, two types of the first coating layers were prepared, namely NP-based and lipid-based. In addition, these lipid-based layers (nano-phytosomes and cholesterol-incorporatednano-phytosomes) were also coated with different NPs as the secondary layer.
Pharmaceutics 2022, 14, 112 4 of 30
Pharmaceutics 2021, 14 3 of 32
2. Materials and Methods
2.1. Chemicals and Standards
Gallic acid (CAS 149-91-7) and chlorogenic acid 95% (CAS 327-97-9) were supplied
by Sigma, Life Science, Shanghai, China. Apple pectin (CAS 9000-09-5) was purchased
from LABChem, Lisbon, Portugal; maltodextrin (CAS 32671-12) from Fargon, Barcelona,
Spain; and gum Arabic from Guinama, Valencia, Spain. Water-soluble starch from potato
(CAS 9005-84-9) was supplied from PanReac-Applichem, Darmstadt, Germany. Soybean
lecithin (CAS 8002-43-5; purity of 90%) was obtained from Alfa Aesar, Thermofisher, Kan-
del, Germany. Cholesterol (CAS C8667-25G; purity ≥ 99%) was supplied by Sigma, Life
Science, St. Louis, MO, USA. Absolute ethanol (≥99.8% and 96% purity), dichloromethane
(≥99.9%), and HPLC grade analytical solvents were purchased from Honeywell (Hessen,
Germany). Relite EXA90 (ion exchange resin) DiaionTM HP20LX (spherical porous poly-
styrene resin) were both kindly supplied by the Resindion group of Mitsubishi Chemical,
Binasco, Italy. Sodium phosphate dibasic heptahydrate (Na2HPO4·7H2O) and sodium
phosphate monobasic monohydrate (NaH2PO4·H2O) were purchased from PanReac, Bar-
celona, Spain. Ultra-pure water was obtained from Seralpur PRO 60 CN and Seradest LFM
20 water purification systems.
2.2. Samples
SI was kindly provided by a Portuguese coffee roaster industry (BICAFÉ). It resulted
from the roast of commercial batches composed of both Coffee arabica and Coffea canephora
beans and was representative of the major by-product of the factory.
2.3. Experimental Design
Chart 1 aims to clearly introduce the flow of the preparation steps, regarding the type
of extraction, enrichment, and type of coating layer in terms of first and secondary layers.
The final product codes for each category are also presented in Chart 1.
Chart 1. Flow of the preparation steps, regarding the type of extraction, enrichment, and type of
coating layer (first or secondary layers). SI, silverskin; DI, Diaion resin; RE, Relite resin; GA, gum Chart 1. Flow of the preparation steps, regarding the type of extraction, enrichment, and typeof coating layer (first or secondary layers). SI, silverskin; DI, Diaion resin; RE, Relite resin; GA,gum Arabic; MA, maltodextrin; PE, pectin; STC, starch; PH, nano-phytosome; PH/CHL, cholesterolincorporated nano-phytosome. Note: DI1 and RE1 series are the enriched fractions (regarding caffeineand phenolics contents) obtained with DI and RE, respectively. DI2 and RE2 series are the discardedfractions (rich in sugars, chlorophylls, etc.).
Pharmaceutics 2021, 14 4 of 32
Arabic; MA, maltodextrin; PE, pectin; STC, starch; PH, nano-phytosome; PH/CHL, cholesterol in-
corporated nano-phytosome. Note: DI1 and RE1 series are the enriched fractions (regarding caffeine
and phenolics contents) obtained with DI and RE, respectively. DI2 and RE2 series are the discarded
fractions (rich in sugars, chlorophylls, etc.).
SI was extracted using different techniques (maceration with a hydroethanolic sol-
vent (SI1) or ultrasonication (SI2)) and each extract was enriched (to increase caffeine and
phenolics contents) using one of these resins: DiaionTM HP20LX (DI) or Relite EXA90 (RE).
DI1 and RE1 series are the enriched fractions obtained with DI and RE, respectively. DI2
and RE2 series are the rejected fractions (explained in Section 2.4. and Chart 2)
Chart 2. Sample categorization and analyses applied to each category. SI, silverskin; GA, gum Ara-
bic; MA, maltodextrin; PE, pectin; STC, starch; PH, nano-phytosome; PH/CHL, cholesterol incorpo-
rated nano-phytosome. DI1 and RE1 series are the enriched fractions (regarding caffeine and phe-
nolics contents) obtained with DiaionTM HP20LX (DI) and Relite EXA90 (RE) adsorbent resins,
respectively. DI2 and RE2 series are the discarded fractions (rich in sugars, chlorophylls, etc.).
The most enriched fraction (SI1DI1) was then selected for the following formulation
procedures. SI1DI1 (from now on named SIDI) was loaded into nano-phytosomes or cho-
lesterol-incorporated nano-phytosomes as first coating layers (Chart 1, in yellow). In par-
allel, SIDI was also directly coated with NP as the first coating layer (single coating layer)
(Chart 1, in green). Meanwhile, to improve the stability and protection of lipid-based car-
riers, NPs were also used to prepare secondary layers, encapsulating the abovementioned
nano-phytosomes and cholesterol-incorporated nano-phytosomes (Chart 1, in pink). In
sum, two types of the first coating layers were prepared, namely NP-based and lipid-
based. In addition, these lipid-based layers (nano-phytosomes and cholesterol-incorpo-
rated nano-phytosomes) were also coated with different NPs as the secondary layer.
2.4. Preparation of SI Extracts
SI was extracted using two different methodologies: A hydroethanolic maceration
(SI1) and an ultrasonication extraction (SI2).
The hydroethanolic maceration used 100 g of SI and occurred in a 5 L glass flask
during 24 h for each solvent. It was performed in triplicate, with different and subsequent
ethanol:water mixtures (100:0, 50:50, 50:70, and 0:100; 2 L each). A filtration step followed
Chart 2. Sample categorization and analyses applied to each category. SI, silverskin; GA, gum Arabic;MA, maltodextrin; PE, pectin; STC, starch; PH, nano-phytosome; PH/CHL, cholesterol incorporatednano-phytosome. DI1 and RE1 series are the enriched fractions (regarding caffeine and phenolicscontents) obtained with DiaionTM HP20LX (DI) and Relite EXA90 (RE) adsorbent resins, respectively.DI2 and RE2 series are the discarded fractions (rich in sugars, chlorophylls, etc.).

Pharmaceutics 2022, 14, 112 5 of 30
2.4. Preparation of SI Extracts
SI was extracted using two different methodologies: A hydroethanolic maceration(SI1) and an ultrasonication extraction (SI2).
The hydroethanolic maceration used 100 g of SI and occurred in a 5 L glass flaskduring 24 h for each solvent. It was performed in triplicate, with different and subsequentethanol:water mixtures (100:0, 50:50, 50:70, and 0:100; 2 L each). A filtration step followedeach maceration. The four extracts were combined, and ethanol was recovered using arotating vacuum evaporator at 40 ◦C. The concentrated aqueous extract (SI1) was stored at2 ◦C prior to the next step.
Ultrasonic extraction was performed, in triplicate, based on the procedure describedpreviously by Puga et al. [17] with some modifications. The sample (100 g) was maceratedfor 2 h in 2 L of deionized water, and sonicated with an ultrasonic probe (BANDELINelectronic, UW 50, Berlin, Germany) during 30 min, at 25 ◦C. After, the solutions werefiltered and concentrated using a rotating vacuum evaporator at 40 ◦C. The concentratedaqueous extract (SI2) was stored at 4 ◦C prior to the next step.
The enrichment was designed to concentrate SI1 and SI2 regarding the contents ofcaffeine and total phenolics, and was performed according to the methodology describedand scaled up at the Medicinal Plants and Drugs Research Institute—Shahid BeheshtiUniversity [5]. DiaionTM HP20LX (DI) and Relite EXA90 (RE) adsorbent resin columns(50 cm × 6 cm) were used separately, according to the procedure described in Chart 1. Bothcolumns were activated with ethanol ≥ 99.8% for 12 h, followed by solvent removal andwashing with 5 L of distilled water. A 6 g amount of the concentrated aqueous extracts (SI1and SI2) were diluted in distilled water (500 mL) and loaded into the resin columns at a flowrate of 5 mL/min and kept for 30 min for bioactive compounds (caffeine and phenolics)adsorption in resin porous. A new washing of the resin columns, with 5 L of distilled water,was performed to remove residues (sugar, chlorophyll, etc.). These fractions (SI1DI2, SI2DI2,SI1RE2, and SI2RE2) were discarded (Chart 2). Afterwards, the columns were eluted withethanol ≥ 99.8% (2 L) for the desorption of caffeine and phenolics. Ethanol was recoveredusing a rotating vacuum evaporator and the enriched fractions were frozen at −80 ◦C,and lyophilized (48 h, −80 ◦C, 0.022 mbar; TELSTAR, Cryodos freeze dryer, Barcelona,Spain). These lyophilized enriched fractions (SI1DI1, SI1RE1, SI2DI1, SI2RE1) were kept inthe refrigerator at 2–4 ◦C for further analysis and to follow the next steps in accordancewith Charts 1 and 2) [18,19].
2.5. Phytochemicals Analyses2.5.1. Caffeine Analysis by High-Performance Liquid Chromatography (HPLC)
The caffeine content of the extracts was analyzed using an HPLC-DAD system (Jasco,Tokyo, Japan). This system consisted of an LC-NetII/ADC hardware interface, an automaticsampler (Jasco AS-2057 Plus), a pump (Jasco PU-2089 Plus), a multi-wavelength diodearray detector (DAD, Jasco MD-2018 Plus), and a column oven (Jasco CO-2060 Plus). Thegradient elution used was the following: 0 min, 5% B; 40 min, 25% B; 55 min, 45% B; 60 min,60% B; 65 min, 5% B (solvent A: 0.5% acetic acid; solvent B: 100% methanol), with a flow rateof 1.1 mL/min. The chromatographic column was a Zorbax-SB-C18 (5 µm, 250 mm × 4.6;Agilent Technologies, Santa Clara, CA, USA), at 28 ◦C. The DAD recorded data from200 to 600 nm were monitored at 274 nm. For HPLC analyses, the lyophilized extracts weredissolved in H2O (10 mg/mL) and the injected volume was 20 µL. Caffeine was used asthe standard for HPLC analyses validation. The calibration curve (y = 36,096x − 227,800;R2 = 0.9996) was constructed in the linear range of 1.5–800 µg/mL. The detection limit ofthe method was 1.24 µg/mL.
2.5.2. Total Phenolics Assay
Total phenolics contents were determined as described by Costa et al. [3]. Briefly,150 µL of the Folin–Ciocalteu reagent (1:10) and 120 µL of a sodium carbonate solution(7.5% m/v) were added to 30 µL of the extract, followed by incubation at 45 ◦C for 15 min

Pharmaceutics 2022, 14, 112 6 of 30
and 30 min at room temperature. Absorbance was monitored at 765 nm (BioTek, SynergyHT, PMT 49,984, Winooski, VT, USA). Two calibration curves were prepared using gallicacid (5–100 µg/mL; y = 0.0085x −0.0544; R2 = 0.998) and chlorogenic acid (5–140 µg/mL;y = 0.0056x − 0.0364; R2 = 0.9973) as standards.
2.6. Particles Preparation and Characterization2.6.1. Preparation of First Coating Layers: Coating Layers Based on Natural Polymers
Gum Arabic (GA), maltodextrin (MA), pectin (PE), and starch (STC), individually, andblends (1:1) of pectin/starch (PE/STC) and gum Arabic/starch (GA/STC) were used as thefirst NP coating layers (Chart 1, Table 1). The feed solution had 10% (w/v) of NP and 1%(w/v) of SIDI (selected as the best enriched extract, Chart 1). These proportions were usedbecause they do not compromise the layer efficiency and have an adjusted viscosity forfeeding the spray dryer. In this context, six different NP-based solutions were prepared in100 mL of distilled water. The prepared solutions were stirred and homogenized for 2 h at55 ◦C and, afterwards, injected into the spray dryer under specific conditions as describedin Section 2.6.5.
Table 1. Encapsulation design: Ratio between ingredients of each formula.
Categories FormulaIngredient Ratio
SIDI LEC CHL NP
Types of first coating layersNP-based coating
Single wall layer
SIDI-GA
1 0 0 10SIDI-MASIDI-PE
SIDI-STC
Complex matrix in wall layer SIDI-GA/STC 1 0 0 5:5SIDI-PE/STC
Lipid-basedcoating
Phytosome (lecithin) PH-SIDI 1 1 0 0Cholesterol incorporated
phytosome PH/CHL-SIDI 1 1 0.5 0
Secondary coating layers
NP-secondary coating I(pH were coated
with NP)
Single wall layer
PH-SIDI-GA
1 1 0.5 10PH-SIDI-MAPH-SIDI-PE
PH-SIDI-STC
Complex matrix in wall layer PH-SIDI-GA/STC1 1 0.5 5:5PH-SIDI-PE/STC
NP-secondary coating II(PH/CHL were coated
with NP)
Single wall layer
PH/CHL-SIDI-GA
1 1 0.5 15PH/CHL-SIDI-MAPH/CHL-SIDI-PE
PH/CHL-SIDI-STC
Complex matrix in wall layer PH/CHL-SIDI-GA/STC1 1 0.5 7.5:7.5PH/CHL-SIDI-PE/STC
SIDI, enriched fraction of the silverskin extract (SI1) obtained using the DiaionTM HP20LX resin; PH, nano-phytosome; PH/CHL, cholesterol incorporated nano-phytosome; GA, gum Arabic; MA, maltodextrin; PE, pectin;STC, starch; LEC, lecithin (containing 94% phosphatidylcholine); NP, natural polymer.
2.6.2. Preparation of First Coating Layers Based on Lipids: Nano-Phytosomes
Nano-phytosomes were produced by the thin film hydration method described byFathi and Ebrahimi, with small modifications [5]. To decrease the size of the obtainedparticles, in the hydration step, a sonication probe was applied. Phytosomes were preparedwith lecithin (containing 94% phosphatidylcholine) and loaded with the SIDI enrichedfraction, with an optimum molar ratio of (1:1) (Table 1 and Chart 1). This lecithin-based layerwas another type of the first coating layer (phytosome coating layer). The experimentalprocedures were performed as follows: 50 mg of SIDI dissolved in 20 mL of ethanolwas placed in a 50 mL round flask and heated up to 55 ◦C until a transparent solutionwas achieved. Then, 50 mg of lecithin was dissolved in 2 mL of dichloromethane andvortexed (Shaker & Mixers Reax top, Heidolph, Schwabach, Germany) for 5 min, at roomtemperature, to obtain a transparent yellow solution. Afterwards, the lecithin solution indichloromethane was sprayed on the SIDI ethanolic solution and refluxed under stirringfor 2 h at 55 ◦C. The solution was cooled, and the solvent evaporated (rotary vacuumevaporator) at 37 ◦C at a medium speed from 40 to 200 rpm and 55 mbar of vacuumpressure until a thin layer was shaped. Afterwards, N2 was flushed on the thin layer

Pharmaceutics 2022, 14, 112 7 of 30
for 1 min, the flask was sealed, and kept overnight on a desiccator [20]. Thereupon, thephytosome mother solution (PH-SIDI) was formed by hydration of the thin film layerwith phosphate buffer (pH 5.5), at 40 ◦C for 10 min (vacuum pressure: 200 mbar; rotation:200 rpm). Afterwards, ultra-sonication was applied for 25 min, at 60% amplitude inpulsation mode (5:1 s) (total energy: 10,000 ± 100 kJ) [21].
2.6.3. Preparation of First Coating Layers Based on Lipids: Nano-Phytosomes Incorporatedby Cholesterol
Cholesterol-incorporated nano-phytosomes consist of a combination of SIDI, lecithin,and cholesterol in an optimum molar ratio (1:1:0.5) treated according to the description inSection 2.6.2, with some modifications. This was the third type of the first coating layerdeveloped in this study.
The combination of SIDI and lecithin was performed as described in the previoussection (Section 2.6.2) and stirred for 10 min (Solution A). Afterwards, 25 mg of cholesterolwas dissolved in 2 mL of dichloromethane and vortexed for 5 min. This solution wassprayed on solution A and refluxed under stirring for 2 h at 55 ◦C. The solvent wasevaporated using a rotary vacuum evaporator at 37 ◦C, at a medium speed of 40 to 200 rpm,and a vacuum pressure of 55 mbar, until a thin layer was shaped. After, N2 was flushed onthe thin layer for 1 min, and the flask was kept overnight in the desiccator. The solution ofcholesterol-incorporated nano-phytosomes loaded with SIDI (PH/CHL-SIDI) was hydratedusing the same conditions described in the previous section (Section 2.6.2) with phosphatebuffer (pH 7.8) (Table 1).
2.6.4. Preparation of Secondary Coating Layers (Coating of Nano-Phytosomes andCholesterol-Incorporated Nano-Phytosomes with Natural Polymers as Secondary Layers)
The secondary layer was prepared with 10% (w/v) of NP for PH-SIDI, and 15% (w/v)of NP for PH/CHL-SIDI. For this purpose, immediately after preparation, the lipid coatinglayers (PH-SIDI or PH/CHL-SIDI), the solutions of NP in the aforementioned concentration,were individually added (Table 1). The NP were first dissolved in ultrapure water andstirred for 2 h at 55 ◦C. After, the NP solution was mixed and added to PH-SIDI or PH/CHL-SIDI (Table 1, Chart 1) and subjected to ultrasonication with a probe for 5 min, in pulsationmode (5:1 s) and stirred for 20 min. The solutions were then injected into the spray dryer toobtain the final powder (Table 1 and Chart 1) [16].
2.6.5. Spray Drying Conditions for Encapsulation
A mini spray-dryer B-290 BÜCHI (Flawil, Switzerland) with a standard nozzle (0.5 mm)was used for the drying of NP coating and secondary NP coating layers. The encapsulationprocedure was optimized based on previously reported data with some modifications [16].The different prepared emulsions (Sections 2.6.1 and 2.6.4) fed the spray dryer under opti-mized stirring conditions, at a flow rate of 10 mL/min, aspiration of 100% (36 m3/h), airpressure of 5.5–6 bar, and a nozzle cleaner set to 3. Although all solutions were preparedin ultrapure water, the drying process used the same drying conditions with differentdrying temperatures. The inlet temperature differed according to the type of the NPs. Inthe case of starch, gum Arabic/starch, and pectin/starch, the drying temperatures were135 ◦C as the inlet temperature and 63 ± 3 ◦C as the outlet temperature. In the case ofpectin, the inlet temperature was set at 120 ◦C, and the outlet temperature almost 58 ± 2 ◦C.For the other NP, the inlet temperature was set at 115 ◦C, and the outlet temperatureat 55 ± 2 ◦C. Throughout the injection process, a magnetic stirrer, at room temperature,shook the emulsions continuously to avoid aggregation of its solid content. Finally, theparticles were recovered from the collector, sealed in aluminum foil, and stored at 4 ◦Cfor further analyses. The product yield (%) was calculated by the amount of the particlesrecovered from the drying step divided by the total mass content of the initial feedingsolution (Equation (1)) [22,23].

Pharmaceutics 2022, 14, 112 8 of 30
Yeild (%) =Total weight o f polymeric or binary layers in powder (mg)
Total weight o f f eed solution (combination o f all ingridient) (mg)× 100 (1)
2.7. Physicochemical Properties of Nano/Micro-Particles2.7.1. Encapsulation Efficiency and Loading Capacity
The encapsulation efficiency (EE) was defined by the SIDI concentration successfullyentrapped in the particles. The EE% is the amount of drug successfully trapped in theparticles (the total drug added subtracted by the non-entrapped drug) divided by thetotal quantity of the drug initially added in preparation steps [24,25]. Therefore, theencapsulation efficiency expressed in a percentage (EE%) and the loading capacity (LC)were calculated using the amount of the remaining free caffeine in the surface of the powderparticles quantified by HPLC-DAD immediately after the preparation steps, according tothe chromatographic conditions described in Section 2.5.1.
For that, 10 mg of particles were dissolved in 1 mL of solvent (ultrapure water andethanol 30:70, v/v) under continuous stirring for 10 min, followed by centrifugation (HER-AEUS FRESCO 17, Thermo Fisher Scientific, LR56495, Bremen, Germany) for 6 min, at12,000 rpm. After, a 0.45 µm pore size PTFE syringe filter was used to filter the samplesbefore HPLC injection.
The EE% was calculated via Equation (2). This method was previously described [24,25].Regarding Equation (2), the amount of encapsulated caffeine in the solution is thecaffeineexperimental (calculated using HPLC data), and the caffeinetheoretical is the SIDI totalamount of caffeine hypothetically present in the particles.
EE(%) =caffeineexperimental
caffeinetheoretical× 100 (2)
Thereafter, taking into consideration Equation (3), theoretical LC is the caffeine contentif 100% of SIDI caffeine were trapped in the particles. The specific LC% was calculatedusing Equation (3) [24].
LC (%) = EE× LCtheoretical × 100 (3)
2.7.2. Fourier-Transform Infrared Spectroscopy Analyses (FTIR)
The interaction between lecithin and cholesterol with SIDI in the phytosomes (PH-SIDI)and cholesterol-incorporated phytosomes (PH/CHL-SIDI) in a lyophilized form (driedwith TELSTAR freeze dryer, Cryodos, Spain) were evaluated using a Fourier transforminfrared (FTIR) apparatus (Frontier, PerkinElmer, Beaconsfield, UK) equipped with anattenuated total reflectance (ATR) accessory (PerkinElmer, Beaconsfield, UK), operated byspectrum software (PerkinElmer, Beaconsfield, UK).
2.7.3. Particle Size Distribution and Zeta Potential (Surface Charge)
Particle size distribution was assessed using a particle size analyzer (BrookhavenInstruments Corporation, operated by particle sizing v.5 Brookhaven instruments software,Holtsville, NY, USA). The qualitative particle properties were determined in PH-SIDI andPH/CHL-SIDI in solution, in external and internal NP coating and NP-secondary coatingI and II layers in powder. The dried particles were dispersed in ethanol 99% to avoidprobable agglomeration and sonicated (SOLTEC, SONICA 2200MH S360Hz, Milano, Italy)for 7 min to eliminate the agglomeration and deformation of external layer. In the caseof PH-SIDI and PH/CHL-SIDI solutions, the small droplets were dispersed in ethanol99% and sonicated for more 7 min to avoid aggregation of lipid colloids. The particle sizewas characterized by mean size in volume and number, obtained in six runs of 1 min at21 ◦C. The particles surface charges were obtained with ZetaPLAS (Zeta Potential Analyzer,Brookhaven Instruments Corporation, operated by the PALS Zeta Potential Analyzer v.5Brookhaven Instruments software, Holtsville, NY, USA), after 6 runs of 30 s at 21 ◦C. Allsamples were analyzed regarding individual parameters in separated runs.

Pharmaceutics 2022, 14, 112 9 of 30
2.7.4. Scanning Electron Microscopy (SEM)
The study of the size and surface morphology of polymeric and secondary layers(external layer) used surface structural analysis under images performed by SEM (FeiQuanta 400 FEG ESEM/EDAX Pegasus X4M). Beforehand, samples were adjusted on abrass stub (carbon stub) using double-sided adhesive tape, dried under a N2 stream, andthen coated by electrical conductivity (a thin layer of gold) in a vacuum by sputtering in aJEOL JFC 100 apparatus at Centro de Materiais da Universidade do Porto (CEMUP).
2.7.5. In Vitro Drug Release
The in vitro drug release study (dissolution assay) was based on the caffeine releasefrom particles over time, assessed in a gastrointestinal simulator containing 100 mL PBSbuffer (pH 7.8 or 2.1), a Spectra/Por® Dialysis membrane standard (RC Tubing, MWCO:3.5 KD, width: 45 mm, diameter: 29 mm, USA & Canada), with a stirrer speed of 70 rpmand heated at 37 ± 2 ◦C. The media was sealed and protected to avoid evaporation duringthe process. For that, 10 mg of powder was dispersed in ethanol 99% and placed insidethe dialysis tubing. The end of the dialysis membrane was closed with clamps, placedhorizontally in the middle of PBS media, and the top was stuck with wires. A caffeinecalibration curve (2.5–120 µg/L; y = 0.0051 × +0.1038) was used to calculate the totalamount of drug release. “t” (time) corresponds to the presence of the characteristic peak ofcaffeine, evaluated by UV-Vis spectrometry at a maximum wavelength of 274 nm (BioTek,Synergy HT, PMT 49984, USA). The caffeine release was monitored from time zero to 72 h,at regular time intervals, based on the release route of each sample, in triplicate [24].
2.7.6. Mathematical Models of Kinetic Release
Mathematical modeling was exploited to adjust the results obtained in Section 2.7.5.In vitro drug release to different kinetic release models was used as a tool to obtain criticalparameters that allow one to predict important aspects concerning the release/dissolutionprofile. The application of the kinetic model to predict the release behavior of phyto-constituents/drugs was previously reported [26–28]. Therefore, caffeine release from thesynthesized particles was evaluated through correlation studies between the caffeine re-lease data into the medium with different pHs and mathematical kinetic models, namely,zero-order (Equation (4)), first order (Equation (5)), Korsmeyer–Peppas (Equation (6)),Higuchi (Equation (7)), and Hixson–Crowell (Equation (8)) [29,30], as described below:
Ft = F0 + K0t (4)
where “Ft” is the cumulative amount of the active ingredient released at the time “t”, “F0”is the initial amount of the active compound in solution (normally F0 = 0), “K0” is thezero-order release constant, and “t” is a time value.
Ft = Fmax×(
1− eK1t)
(5)
where “Ft” is the cumulative amount of the active ingredient released at the time “t”, “Fmax”is the maximum cumulative amount, and “K1” is the first-order release constant.
Ft/
F∞= FKP tn (6)
where “Ft/F∞” is the amount of active compound released until time “t”, “FKP” is theKorsmeyer–Peppas constant, “t” is a value of time, and n (release exponent) is an estimatingdifferent release mechanism. When n < 0.43, drug transport (mass transfer) occurs by purediffusion following the Fick law (case-I transport). In the case of n > 0.43, the masstransfer follows a non-Fickian model; when 0.43 < n < 0.85, drug transport occurs basedon anomalous drug transport resulting in a combination of Fickian diffusion and swellingrelease (case II). If n is equal to 0.85, drug transport occurs based on Case-II (zero-order

Pharmaceutics 2022, 14, 112 10 of 30
kinetic controlling swelling and relaxation of polymer matrix). Finally, when n > 0.85, drugtransport occurs based on super case-II transport [29,31].
Ft = FH√
t (7)
where “Ft” is the cumulative amount of the active ingredient released at the time “t”, “FH”is the Higuchi constant, and “t“ is a value of time.
Ft = 100× [1− (1−KHC × t)3] (8)
where “Ft” is the cumulative amount of the active ingredient released at the time “t”, “KHC”is the Higuchi constant, and “t” is a value of time.
The fitting of a kinetic model to a release profile is dependent on the calculated adjustedcorrelation coefficient (R2
adj), since the correlation coefficient (R2) is influenced by the numberof parameters in the equation, increasing with the number of those parameters [32–34].
2.7.7. Molecular Docking Arrangement
The 3D structures of phosphatidylcholine (≥ 94% of lecithin), cholesterol, and the twomain phytochemicals of SI—caffeine and 5-caffeoylquinic acid (chlorogenic acid)—weredownloaded from the ChemSpider database. They were prepared and refined using theLigprep application (Maestro 12.8, Schrödinger, New York, NY, USA). The 3D models ofnano-phytosome and cholesterol-incorporated nano-phytosome bilayers were generatedusing a MemGen web server defined for lipid membrane simulation systems [35]. Thegenerated models were downloaded in PDB format and subjected to additional optimiza-tion using the OPLS3 force field using Maestro 12.8. To investigate the interaction of thephytochemicals with the related bilayers, a grid box (x = 8.96, y = 28.10, z = 30.36, Size of40, 40, 40 Å) was created by grid generation. The interaction between ligands and bilayerswas carried out using a glide application with extra precision (XP) level in Maestro 12.8.For each ligand, five poses have been used to evaluate docking interactions.
2.8. Statistical Analysis
The results were expressed as mean ± standard deviation. A One-way ANOVA testfollowed by post-hoc comparisons with Tukey’s HSD was used to identify significantdifferences between samples at p < 0.05 (IBM SPSS 25 for Windows, IBM Corp., Armonk,NY, USA).
3. Results3.1. Phytochemical Profiling and Enrichment Efficiency
SI was extracted with the hydroethanolic solvent (SI1) and ultrasonication with water(SI2). The extracts were enriched using DiaionTM HP20LX (DI) and Relite EXA90 (RE)adsorbent resins (Chart 1) regarding the caffeine and total phenolics contents.
The highest extraction yield was achieved with the hydroethanolic extraction (SI1,66.58%), being almost twice that of those obtained with ultrasonication extraction. Thehighest enrichment yield was obtained with the DiaionTM HP20LX resin (SI1-Di1, 50.62%)compared to other fractions under study (Table 2).
The chromatograms obtained from the HPLC analysis of crude and enriched fractionsare depicted in Figure 1. The highest caffeine enrichment was observed in the SI2 series(SI2DI1: 4.16-fold and SI2RE1: 4.10-fold). However, a significantly higher (p < 0.05) caffeinecontent was achieved in SI1DI1 (1333.78 mg/L vs. SI2DI1 (1278.45 mg/L) and SI2RE1(1259.21 mg/L)).

Pharmaceutics 2022, 14, 112 11 of 30
Table 2. Caffeine and total phenolics content of SI crude and enriched extracts.
Sample Yield (%) Caffeine ECCTotal Phenolics
CAE ECA GAE EGA
SI1 66.58 432.57 ± 1.64 e - 10.61 ± 0.42 d - 4.87 ± 0.28 d -SI1DI1 50.62 1333.78 ± 5.51 a 3.08 29.15 ± 1.54 a 2.75 17.09 ± 1.01 a 3.51SI1DI2 DC 7.62 ± 0.18 g - 6.54 ± 0.39 e - 2.19 ± 0.26 e -SI1RE1 52.87 951.76 ± 3.87 d 2.20 26.27 ± 1.61 b 2.48 15.19 ± 1.06 b 3.12SI1RE2 DC 6.73 ± 0.19 g - 4.27 ± 0.27 ef - 0.70 ± 0.18 ef -
SI2 36.67 307.34 ± 1.10 f - 9.30 ± 0.24d - 4.01 ± 0.16 d -SI2DI1 20.00 1278.45 ± 5.28 b 4.16 19.13 ± 0.67 c 2.06 10.48 ± 0.44 c 2.61SI2DI2 DC 6.94 ± 0.19 g - 5.97 ± 1.17 ef - 1.82 ± 0.77 ef -SI2RE1 18.00 1259.21 ± 5.19 c 4.10 18.23 ± 0.86 c 1.96 9.89 ± 0.57 c 2.47SI2RE2 DC 6.74 ± 0.19 g - 3.80 ± 0.22 f - 0.38 ± 0.15 f -
Values of caffeine, CAE, and GAE expressed in mg/L (mean ± standard deviation). Different letters within thesame column represent significant differences between samples at p < 0.05. ECC, enhance on caffeine content; ECA,enhance on chlorogenic acid content; EGA, enhance on gallic acid content; CAE, chlorogenic acid equivalents;GAE, gallic acid equivalents; DC, discarded fractions containing sugar and chlorophylls.
Pharmaceutics 2021, 13 13 of 32
Figure 1. HPLC chromatogram of caffeine before and after enrichment.
In addition, the highest phenolic enrichment was also obtained with the DiaionTM
HP20LX (SI1-Di1: 29.15 mg CAE/L; SI1-Di:17.09 mg GAE/L). Total phenolics increased, in
relation to the crude extract, almost 2.75- and 3.51-fold for chlorogenic acid and gallic acid
equivalents, respectively. Overall, a considerable phenolics enrichment was observed in
all samples under study.
Based on the higher extraction yield obtained in the SI1 series (~50%), the higher phy-
tochemicals enrichment yield regarding the DI1 series, and the considerable enhancement
on caffeine and total phenolics content (Table 2), SI1DI1 was selected as the best enriched
fraction to proceed with the studies (Charts 1 and 2).
The results obtained herein are in accordance with those already published by Fathi
et al. [5] who reported plant extract enrichment in phenolic compounds using a Diaion
HP20 resin. The EXA-118 adsorbent resin was also successfully employed in the purifica-
tion of anthocyanins and hydroxycinnamic acids (phenolic backbone) from a citrus by-
product [36]. Moreover, the use of adsorbent resins in chromatography columns for the
pre-purification of food ingredients, as a source of economic technology, was previously
described in the food area [37]. Additionally, Diaion HP20 was also previously used for
the extraction and purification of esculeoside A (steroidal alkaloid glycosides) from to-
mato [38]. It must be taken into consideration that Relite EXA90 was not reported previ-
ously in the extraction and purification of alkaloids from natural sources. Therefore, this
study provides relevant information about the specific functionality of Relite EXA90 on
the purification of alkaloid-based natural products (caffeine; purine alkaloid) regarding
the considerable information obtained for SI2DI1 and SI2RE1 (Table 2).
3.2. Physicochemical Properties of Nano/Micro-Particles
3.2.1. Product Yield
The product yield was calculated based on the method described in Section 2.6.5 and
Equation (1). It must be taken into consideration that the inlet temperatures were set ac-
cording to the NP used (Section 2.6.5), ranging among 115 and 135 °C in order to enhance
the final product yield and decrease moisture content, resulting in improved storage and
stabilization of the particles [39]. The product yields ranged from 35.22 to 72.92%, consid-
ering all samples (Table 3). Among the four subgroups under study, no considerable dif-
ferences were observed. In contrast, the product yield varied from the type of NP and the
drying conditions, which might be due to the viscosity, volume, and concentration of the
initial feed, drying temperature, features, and ratio of the coating layer, according to
Tontul and Topuz [40]. The experimental results showed the high product yield from
Figure 1. HPLC chromatogram of caffeine before and after enrichment.
In addition, the highest phenolic enrichment was also obtained with the DiaionTM
HP20LX (SI1-Di1: 29.15 mg CAE/L; SI1-Di:17.09 mg GAE/L). Total phenolics increased, inrelation to the crude extract, almost 2.75- and 3.51-fold for chlorogenic acid and gallic acidequivalents, respectively. Overall, a considerable phenolics enrichment was observed in allsamples under study.
Based on the higher extraction yield obtained in the SI1 series (~50%), the higher phy-tochemicals enrichment yield regarding the DI1 series, and the considerable enhancementon caffeine and total phenolics content (Table 2), SI1DI1 was selected as the best enrichedfraction to proceed with the studies (Charts 1 and 2).
The results obtained herein are in accordance with those already published byFathi et al. [5] who reported plant extract enrichment in phenolic compounds using aDiaion HP20 resin. The EXA-118 adsorbent resin was also successfully employed in thepurification of anthocyanins and hydroxycinnamic acids (phenolic backbone) from a citrusby-product [36]. Moreover, the use of adsorbent resins in chromatography columns for thepre-purification of food ingredients, as a source of economic technology, was previouslydescribed in the food area [37]. Additionally, Diaion HP20 was also previously used for theextraction and purification of esculeoside A (steroidal alkaloid glycosides) from tomato [38].It must be taken into consideration that Relite EXA90 was not reported previously in the

Pharmaceutics 2022, 14, 112 12 of 30
extraction and purification of alkaloids from natural sources. Therefore, this study providesrelevant information about the specific functionality of Relite EXA90 on the purificationof alkaloid-based natural products (caffeine; purine alkaloid) regarding the considerableinformation obtained for SI2DI1 and SI2RE1 (Table 2).
3.2. Physicochemical Properties of Nano/Micro-Particles3.2.1. Product Yield
The product yield was calculated based on the method described in Section 2.6.5and Equation (1). It must be taken into consideration that the inlet temperatures wereset according to the NP used (Section 2.6.5), ranging among 115 and 135 ◦C in order toenhance the final product yield and decrease moisture content, resulting in improvedstorage and stabilization of the particles [39]. The product yields ranged from 35.22 to72.92%, considering all samples (Table 3). Among the four subgroups under study, noconsiderable differences were observed. In contrast, the product yield varied from thetype of NP and the drying conditions, which might be due to the viscosity, volume, andconcentration of the initial feed, drying temperature, features, and ratio of the coating layer,according to Tontul and Topuz [40]. The experimental results showed the high productyield from starch and gum Arabic particles, in both forms, single and complex coatinglayers. Gum Arabic showed a higher product yield. These results are in accordance withthose of Ferreira et al. [41], who reported high product yields (≥50%) for 1:1.5 and 1:2starch/gum Arabic. The authors reported that increasing the ratio of gum Arabic allows asignificant increase on the product yield of a complex of starch/gum Arabic. In contrast,a low product yield was observed for pectin. A significant improvement (almost 4–6%)on the product rate was observed in secondary coating layers (I and II) comparatively toNP in the single pectin coating, while, in the case of the pectin/starch complex, the yielddecreased in all categories compared with the single coating (Table 3). It could be concludedthat the impact of these factors will depend on the lipid layer, in this case, especially in thenano-phytosome incorporated by cholesterol, to improve the stability of lipid particles insolution media [9], provide the adhesion between the lipid layer and NP, and avoid massloss during drying [16]. Moreover, the complex of pectin/ starch provides surface coverageof the particles and reduces adhesion during spray drying [42]. These two factors lead to aslight improvement from the NP coating to NP-Secondary coatings I and II, and, resultingin a considerable product yield on PH/CHL-SIDI-PE/STC.
However, the product yield showed slight differences, when comparing the NP firstcoating and NP-secondary coating I and II. A slight increase in the production yieldof some of the NP-secondary coatings II (2–15%) occurred, when compared to the sin-gle coating and NP-secondary coating I. Furthermore, no practical differences were ob-served for NP complexes on coating layers in all samples under study. In general, NP-secondary coating II presented slightly higher product yields compared to the other samplesunder study.
Meanwhile, a certain powder loss occurred in all samples due to the adhesion ofparticles to the drying cyclone. This phenomenon occurred due to the low glass transitiontemperature of the initial ingredient (phytoconstituent) at high drying temperature. There-fore, the drying temperature causes surface deformation of the particles to a viscoelasticrubbery state, causing their adhesion to the drying chamber. Although the addition ofNP (with a high glass transition temperature) considerably improves this phenomenon, todecrease the mass loss during the process, an optimization of NP concentration is required,as well as adding secondary coating layers (I and II). The referred situation can justify thelow product yield values obtained for some variables. However, some mass loss during thedrying process is expected and could not be eliminated [37,39].

Pharmaceutics 2022, 14, 112 13 of 30
Table 3. Product yield, encapsulation efficiency, and loading capacity of formulated samplesin powder.
Formula Yield (%) EE (%) LC (%)
Lipid-based first coating PH-SIDI 60.22 - -PH/CHL-SIDI 57.44 - -
NP-based first coating
SIDI-GA 50.00 95.67 ± 1.08 a 8.70 ± 0.10 a
SIDI-MA 42.55 96.51 ± 1.10 a 8.77 ± 0.10 a
SIDI-PE 42.36 95.02 ± 0.02 a 8.64 ± 0.00 a
SIDI-STC 72.18 97.15 ± 2.96 a 8.83 ± 0.27 a
SIDI-GA/STC 66.75 94.46 ± 0.20 a 8.59 ± 0.02 a
SIDI-PE/STC 37.25 95.43 ± 1.60 a 8.68 ± 0.15 a
NP-secondary coating I
PH-SIDI-GA 72.92 94.26 ± 0.24 a 7.85 ± 0.02 a
PH-SIDI-MA 51.69 94.68 ± 1.24 a 7.89 ± 0.10 a
PH-SIDI-PE 46.92 96.62 ± 0.79 a 8.05 ± 0.07 a
PH-SIDI-STC 48.31 92.57 ±1.57 a 7.71 ± 0.13 a
PH-SIDI-GA/STC 62.67 94.26 ± 1.46 a 7.86 ± 0.12 a
PH-SIDI-PE/STC 35.22 94.29 ± 1.04 a 7.86 ± 0.09 a
NP-secondary coating II
PH/CHL-SIDI-GA 65.51 92.56 ± 2.63 a 5.29 ± 0.15 b
PH/CHL-SIDI-MA 53.62 94.64 ± 1.25 a 7.02 ± 2.35 ab
PH/CHL-SIDI-PE 50.70 95.11 ± 0.17 a 5.43 ± 0.01 b
PH/CHL-SIDI-STC 54.49 91.22 ±3.59 a 5.21 ± 0.21 b
PH/CHL-SIDI-GA/STC 61.73 93.61 ± 0.53 a 5.35 ± 0.03 b
PH/CHL-SIDI-PE/STC 42.38 94.44 ± 0.96 a 5.40 ± 0.05 b
Different letters within the same column represent significant differences between samples at p < 0.05. SIDI,enriched fraction of the silverskin extract (SI1) obtained using the DiaionTM HP20LX resin; PH, nano-phytosome;PH/CHL, cholesterol incorporated nano-phytosome; GA, gum Arabic; MA, maltodextrin; PE, pectin; STC, starch;NP, natural polymer. Note: EE% and LC% were not recorded for PH-SIDI and PH/CHL-SIDI.
3.2.2. Encapsulation Efficiency and Loading Capacity
The encapsulation efficacy (EE%) and loading capacity (LC%) of all formulated sam-ples in powder are presented in Table 3. The highest to lowest average EE% was ob-served as follows: NP first coating (94.46 ± 0.20–97.15 ± 2.96%) > NP-secondary coating I(92.57 ± 1.57–96.62 ± 0.79%) > NP-secondary coating II (91.22 ± 3.59–95.11 ± 0.17%). Thehighest EE% was observed for SIDI-STC, and the lowest one was presented by PH/CHL-SIDI-STC (Table 3). The LC followed a similar behavior to the one described for EE%.The highest LC was observed in NP coatings, and the lowest one in NP-secondary coat-ing II (Table 3). In general, the results demonstrated a slight decrease in EE% (althoughnot statistically significant) and a significant decrease in LC% (p < 0.05) from the firstlayers to secondary layers, which may be due to the low encapsulation efficiency of nano-phytosomes and nano-phytosomes incorporated by cholesterol (NP-secondary coatingsI and II), as reported by Huanga et al. [43]. These authors verified EE% of 35.88% forphytosome structures. However, NPs in the complex form did not significantly influenceEE% nor LC% within each group of samples (Table 3).
As shown in this work, EE% is strongly affected by the initial materials used tomanufacture the particles, where trial-and-error is usually required to select the bestwall materials, as reported by Gharsallaoui et al. [44]. The slight differences found inEE% (not statistically different, p > 0.05) may be due to the first coating layer (lipid coat-ing) and the drying and encapsulation conditions, which confirm the results obtained byRoccia et al. [45], which reported an EE% decrease upon increasing the drying temperature.Therefore, it could be concluded that the drying conditions and the lipid carriers mightaffect the EE%, but not the type of NP used.
3.2.3. Fourier-Transform Infrared Spectroscopy Analyses (FTIR)
The FTIR spectra was recorded in the scanning range from 400 to 4000 cm−1, con-firming the interactions among SIDI, lecithin (phosphatidylcholine), and cholesterol inthe nano-phytosomes and nano-phytosomes incorporated by cholesterol. The interactions

Pharmaceutics 2022, 14, 112 14 of 30
among lipid substrates and SIDI via suppressing a functional group at PH, PH/CHL,PH-SIDI, and PH/CHL-SIDI compared to SIDI, phosphatidylcholine, and cholesterol wasproven (Figure 2).
Pharmaceutics 2021, 13 16 of 32
Figure 2. Specific interactions among phosphatidylcholine, cholesterol, and SIDI at PH/CHL, PH-
SIDI, and PH/CHL-SIDI by FTIR spectra.
Furthermore, a significant change in the fingerprint area (marked in Figure 2, 400–
1500 cm−1) and critical substitution areas clearly show the interaction between the lipid
bilayer and SIDI. Taking into consideration Figure 2, peaks (a) and (b) show, at the specific
critical substitution areas, differences in PH-SIDI compared to PH/CHL-SIDI, confirming
the lack of a functional group of cholesterol at PH-SIDI, and the existence of phosphati-
dylcholine on the related area (2924 cm−1). The cholesterol and phosphatidylcholine func-
tional groups at 2924 cm−1 in PH/CHL, PH-SIDI, and PH/CHL-SIDI confirmed the inter-
action of phosphatidylcholine in all related structures.
The following results are in line with those of Hou et al. [46] that confirmed the phys-
icochemical interaction between mitomycin C-soybean phosphatidylcholine by FTIR,
paying attention to significant differences between the pure compound and phytosome
complex [47]. Moreover, a significant suppression of the sharp endothermic nature of the
functional groups of the spectra of curcumin and phospholipid was reported [46], which
is in line with the verification in the current FTIR spectra.
3.2.4. Nano/Micro Particle Size Distribution
The particle size was determined via the effective particles diameter, number, and
volume of internal layers. In all samples, the particles were heterogeneous, at nanoscale
(≤800 nm). For particle size evaluation, the initial lipid coatings regarding nano-phyto-
somes (PH-SIDI) and nano-phytosomes incorporated by cholesterol (PH/CHL-SIDI), ini-
tial NP coating (SIDI-NPs), and NP-secondary coating (PH-SIDI-NPs and PH/CHL-SIDI-
NPs) were considered (Table 4). Equipment from Brookhaven Instruments (Holtsville,
NY, USA) evaluated the particle size (internal layers).
Figure 2. Specific interactions among phosphatidylcholine, cholesterol, and SIDI at PH/CHL, PH-SIDI, and PH/CHL-SIDI by FTIR spectra.
Furthermore, a significant change in the fingerprint area (marked in Figure 2,400–1500 cm−1) and critical substitution areas clearly show the interaction between the lipidbilayer and SIDI. Taking into consideration Figure 2, peaks (a) and (b) show, at the specificcritical substitution areas, differences in PH-SIDI compared to PH/CHL-SIDI, confirmingthe lack of a functional group of cholesterol at PH-SIDI, and the existence of phosphatidyl-choline on the related area (2924 cm−1). The cholesterol and phosphatidylcholine functionalgroups at 2924 cm−1 in PH/CHL, PH-SIDI, and PH/CHL-SIDI confirmed the interactionof phosphatidylcholine in all related structures.
The following results are in line with those of Hou et al. [46] that confirmed thephysicochemical interaction between mitomycin C-soybean phosphatidylcholine by FTIR,paying attention to significant differences between the pure compound and phytosomecomplex [47]. Moreover, a significant suppression of the sharp endothermic nature of thefunctional groups of the spectra of curcumin and phospholipid was reported [46], which isin line with the verification in the current FTIR spectra.
3.2.4. Nano/Micro Particle Size Distribution
The particle size was determined via the effective particles diameter, number, andvolume of internal layers. In all samples, the particles were heterogeneous, at nanoscale(≤800 nm). For particle size evaluation, the initial lipid coatings regarding nano-phytosomes(PH-SIDI) and nano-phytosomes incorporated by cholesterol (PH/CHL-SIDI), initial NPcoating (SIDI-NPs), and NP-secondary coating (PH-SIDI-NPs and PH/CHL-SIDI-NPs)were considered (Table 4). Equipment from Brookhaven Instruments (Holtsville, NY, USA)evaluated the particle size (internal layers).

Pharmaceutics 2022, 14, 112 15 of 30
Table 4. Particle size (internal layers, nm) and zeta potential (mV) of internal and external layers.
Formula Name
Particle Size (nm)
Zeta Potential (mV) *First Month(Internal Layers) kcps PDI
Fourth Month(Internal Layers) kcps PDI
Volume * Number Volume * Number Internal Layers External Layers
PH-SIDI 70.8 ± 0.3 34.3 399.3 0.161 74.1 ± 0.8 36.6 513.3 0.157 −84.22 ± 6.58
PH/CHL-SIDI 114.1 ± 1.1 39.1 459.6 0.235 179.1 ± 1.0 70.0 536.9 0.206 −75.06 ± 5.86
SIDI-GA 512.4± 62.7 498.6 502.9 0.005 691.3± 74.1 672.6 443.3 0.005 −51.02 ± 4.43 −53.54 ± 3.65
SIDI-MA 619.1± 147.7 602.3 322.6 0.005 832.3± 90.8 602.3 396.9 0.005 −33.83 ± 16.96 −25.42 ± 7.44
SIDI-PE 808.7± 102.4 786.8 415.8 0.005 892.3± 124.7 868.2 528.2 0.005 −30.07 ± 7.47 −45.28 ± 6.89
SIDI-STC 226.1± 28.5 187.1 363.6 0.055 267.3± 30.3 260.0 433.2 0.005 −52.79 ± 2.97 −58.17 ± 2.97
SIDI-GA/STC 699.8± 98.1 680.0 412.4 0.005 919.8± 100.1 894.0 462.3 0.005 −49.22 ± 2.82 −49.22 ± 2.82
SIDI-PE/STC 241.8± 26.3 235.2 426.3 0.005 267.7± 11.1 260.1 473.7 0.005 −37.69 ± 4.00 −45.41 ± 3.49
PH-SIDI-GA 462.8± 71.1 404.2 432.4 0.005 650.0± 100.1 632.4 422.4 0.005 −61.76 ± 4.48 −52.25 ± 2.83
PH-SIDI-MA 535.2± 194.9 520.7 388.9 0.005 893.3± 34.0 869.1 351.2 0.005 −31.49 ± 4.73 −19.31 ± 8.73
PH-SIDI-PE 492.0± 52.8 478.7 353.7 0.005 588.0± 44.0 572.1 386.3 0.005 −30.66 ± 3.67 −19.08 ± 10.79
PH-SIDI-STC 298.7± 28.7 290.6 298.7 0.005 327.0± 38.9 318.2 439.7 0.005 −52.88 ± 3.11 −32.61 ± 18.30
PH-SIDI-GA/STC 760.1± 132.5 505.1 462.7 0.005 976.8± 104.1 950.0 465.0 0.005 −39.41 ± 5.39 −31.80 ± 6.67
PH-SIDI-PE/STC 452.0± 86.4 439.8 412.4 0.005 688.5± 101.2 669.9 412.4 0.005 −33.01 ± 5.85 −31.28 ± 8.38
PH/CHL-SIDI-GA 429.4± 45.6 414.8 388.2 0.005 474.3± 49.2 461.4 432.5 0.005 −55.22 ± 1.14 −48.43 ± 5.64
PH/CHL-SIDI-MA 604.5± 67.7 588.2 361.1 0.005 691.1± 96.4 259.0 450.6 0.215 −24.43 ± 12.00 −26.69 ± 9.68
PH/CHL-SIDI-PE 524.2± 52.1 527.5 449.4 0.005 626.4± 12.8 609.4 449.4 0.005 −31.61 ± 14.35 −15.25 ± 5.87
PH/CHL-SIDI-STC 259.1 ± 8.8 252.1 523.6 0.005 414.2± 19.1 403.0 459.2 0.005 −59.86 ± 4.41 −47.95 ± 5.56
PH/CHL-SIDI-GA/STC 441.1± 19.2 429.2 460.1 0.005 526.9± 36.2 512.6 460.1 0.005 −51.25 ± 4.25 −45.43 ± 7.81
PH/CHL-SIDI-PE/STC 387.4± 35.9 376.9 490.3 0.005 435.9± 62.4 424.1 500.9 0.005 −34.69 ± 2.31 −30.68 ± 1.95
* The presented values correspond to the mean ± standard deviation provided by the equipment (BrookhavenInstruments, Holtsville, NY, USA). kcps, average count rate (kilo counts per second) that shows a quality ofparticle size, in which the kcps range approximately between 300 and 500 (it provides a high precise particlesize recording); PDI, polydispersity index that shows the size range index of particles: <0.05, high monodispersestandard in which near to zero shows a perfect uniformed sample; >0.7, very broad particle size distribution inwhich near to 1.0 shows a super highly polydisperse sample with various particle sizes [15].
Initial Lipid Coating
The distribution of particle size on lipid layers was evaluated after 20 min of sonica-tion for both nano-phytosomes (PH-SIDI) and cholesterol-incorporated nano-phytosomes(PH/CHL-SIDI), immediately after the hydration to avoid agglomeration. PH-SIDI andPH/CHL-SIDI had less than 120 nm, with nanoparticles in both volume and number(Table 4). The obtained results are in line with those of minaei et al. [48], in the case of PH-SIDI, and in agreement to Nazari et al. [49], in the case of PH/CHL-SIDI. The nanoparticlessize increased in the presence of cholesterol (PH/CHL-SIDI). Therefore, it was demon-strated that incorporating cholesterol in the lipid bilayer, between phospholipids, increasesthe particles size, but also improves their stability as reported by Rasaie et al. [9].
Initial NP Coating
To crush the NP external coating layer and determine the particle size of the internallayers, a small amount of powder previously dispersed on ethanol 99% was subjected to7 min of sonication (Table 4). The particles size of the NP external coating is discussed inSection 3.2.5. The particles size of the internal layers was in the range of 187.1–786.8 nmin number and 226.1–808.7 nm in volume. The pectin-based coating produced the biggestparticles and the STC and PE/STC complex produced the smallest. Similarities wereobserved in the distribution of volume and number. Therefore, the particles followed aharmonious distribution at internal layers regarding the initial NP coating, and followedstructural arrangements Type A-I and A-II. The probable molecular arrangement of NPcoatings were previously discussed [16].

Pharmaceutics 2022, 14, 112 16 of 30
The size-reducing properties of starch in the PE/STC complex is proven in this studyand it is in line with the results reported by Fathi et al. [16]. This behavior may be dueto the initial features of some carbohydrates such as starch that affect steric hindrancemechanisms on the particles’ surface when placed among the NP molecules. Therefore,this feature could limit the particle size. The impact of starch on gum Arabic was alsoevaluated. Nevertheless, the observed results with the GA/STC complex showed differentoutcomes compared to PE/STC. These results are in line with those of Chanamai et al. [50]that reported particles size of the GA/STC complex around 700 nm in emulsion form.
NP-Secondary Coating
The evaluation of PH-SIDI-NPs and PH/CHL-SIDI-NPs was described in Section 3.2.4.*Initial Lipid Coating* The particles size was moderately larger compared to the initial NPcoatings. The biggest particles were obtained with maltodextrin and the smallest oneswith starch in single form. The biggest and smallest complex particles were from GA/STCand PE/STC, respectively. Distributions in volume and number were also similar (as inSection 3.2.4. *Initial NP Coating*). Considering the PH-SIDI (70.8 nm) and PH/CHL-SIDI(114.1 nm) particle size in the secondary coating layer and considering the formation ofthe coating layer explained by Fathi et al. [12], NP-secondary coating I and II probablyfollow A-III and A-IV and A-V and A-VI types. In the way, the small differences betweenvolume and number confirm the structure type A-III and A-IV followed by the majority ofparticles [16]. Moreover, the size-reducing properties of starch in the PE/STC complex wasverified in both series as well (Table 4) [51].
The particle size distribution after four months of preparation was recorded to evaluatetheir stability against moisture in storage conditions (−4 ◦C, 95% moisture). A slightincrease in particles size in all samples under study was obtained. However, the particleswere still in an acceptable size range, and no relevant instability was observed.
3.2.5. Surface Morphology of External Layers
Scanning electron microscopy (SEM) was used to evaluate the surface morphologyand determine the particles size of the external layer for all particles under study. TheSEM images cannot provide any information regarding internal layers (Figure 3). Thesurface morphology was quite different regarding each NP in the single form, and com-plex forms had an intermediate morphology (mixture of both NPs). In summary, thesurface morphology shows spherical shrinkage with regular and irregular concavitiesrelated to the differences in the NPs shapes. Regular concavities on the particles’ surfacewere observed in gum Arabic and maltodextrin. An irregular shrinkage, albeit uniform,was observed in starch and pectin particle surfaces in the single matrix (Figure 3). Theobtained results concerning maltodextrin were in line with those reported by Papoutsiset al. [52] with slight differences. The authors reported a spherical uniform surface withlow concavities in the case of maltodextrin, and the results of this work showed more deepconcavities while still spherical and uniform. These differences may be due to differencesin the drying temperatures that directly affect the glass transition temperature of NP, re-sulting in surface deformation. This happened for all samples under study [37,39]. In thecase of starch particles, a spherical surface, uniform and regular with some concavities, is inagreement with the uniform irregular surface with a moderate rate of concavities reported byGangurde et al. [53]. The surface morphology of complex forms followed an intermediate routewith a decreasing rate of concavities. The results reported in this study concerning the surfacemorphology of starch and pectin particles are in accordance with those of Cortes et al. [54].

Pharmaceutics 2022, 14, 112 17 of 30
Pharmaceutics 2021, 13 19 of 32
SEM images cannot provide any information regarding internal layers (Figure 3). The sur-
face morphology was quite different regarding each NP in the single form, and complex
forms had an intermediate morphology (mixture of both NPs). In summary, the surface
morphology shows spherical shrinkage with regular and irregular concavities related to
the differences in the NPs shapes. Regular concavities on the particles’ surface were ob-
served in gum Arabic and maltodextrin. An irregular shrinkage, albeit uniform, was ob-
served in starch and pectin particle surfaces in the single matrix (Figure 3). The obtained
results concerning maltodextrin were in line with those reported by Papoutsis et al. [52]
with slight differences. The authors reported a spherical uniform surface with low con-
cavities in the case of maltodextrin, and the results of this work showed more deep con-
cavities while still spherical and uniform. These differences may be due to differences in
the drying temperatures that directly affect the glass transition temperature of NP, result-
ing in surface deformation. This happened for all samples under study [37,39]. In the case
of starch particles, a spherical surface, uniform and regular with some concavities, is in
agreement with the uniform irregular surface with a moderate rate of concavities reported
by Gangurde et al. [53]. The surface morphology of complex forms followed an interme-
diate route with a decreasing rate of concavities. The results reported in this study con-
cerning the surface morphology of starch and pectin particles are in accordance with those
of Cortes et al. [54].
Figure 3. Surface morphology of the final products regarding first and secondary coatings. First coat-ing: (a) Maltodextrin; (b) gum Arabic; (c) pectin; (d) starch; (e) starch/gum Arabic; (f) pectin/starch.Secondary coating: (g) Maltodextrin; (h) gum Arabic; (i) pectin; (j) starch; (k) starch/ gum Arabic;(l) pectin/ starch.
In terms of the external layer particle size, although no remarkable differences wereobserved in the particles under study, it ranged 1–5 µm for all samples. These values (thesize of external layers) were directly affected by drying conditions, such as inlet and outlettemperatures, the spraying nozzle, and the aspiration rate [40]. Therefore, the similaritybetween the particle sizes of external coating layers is justified.
3.2.6. Surface Charge of Internal and External Layers
The surface charge (zeta potential) of all particles (nano-phytosome, nano-phytosomeincorporated by cholesterol, NP coatings, and NP-Secondary coatings) were evaluatedregarding the internal and external layers. A surface charge lower than −30 mV (anionicsurface charge) is desirable in terms of stability at aqueous media, compelling repulsionbetween particles and avoiding agglomeration. On the other hand, the surface chargeof about ±10 mV produces neutral particles, favoring the agglomeration rate [55,56]. Itmust be taken into consideration that cationic particles have more toxicity to the cell wallmembrane [55], but by contracting, they could interact better with the cell membrane [57].

Pharmaceutics 2022, 14, 112 18 of 30
The lipid bilayer improves the permeability due to its similarity to the cell membrane [58].Therefore, the anionic lipid-based particles play a vital role in food and pharmaceutical finalproducts, resulting in improved permeability of active ingredients/drugs and avoiding theprobable toxicity related to the cationic particles [24]. Keeping this information in mind,all particles presented a desirable anionic charge, ranging from −24.43 to −61.76 in thecase of internal layers (Table 4) and from −15.25 to −58.17 in the case of external layers(Table 4). It is to be noted that the surface negative charge of internal layers was moderatelyhigher than the external layers, in the same conditions. This feature can contribute tothe stability of particles, avoiding a high agglomeration rate. The lipid layers surfacecharge ranged between −84.22 ± 6.58 and −75.06 ± 5.86 mV for the phytosome and thecholesterol-incorporated phytosome, respectively. The negative surface charge of lipidlayers, in the case of phosphatidylcholine, was already reported by Hindarto et al. [59], andin the case of phosphatidylcholine bilayer incorporated by cholesterol, by Tang et al. [57].
Considering the values presented in Table 4, the zeta potentials decreased significantlyfrom the lipid layer to NP coatings. In general, a slight increase from the NP coating to NP-Secondary coatings I and II was verified. In terms of performance, the zeta potential of gumArabic and starch considerably decrease in both complex forms (GA/STC, and PE/STC)(Table 4). However, the pectin zeta potential increases in these forms (PE/STC). Thementioned results show the positive impact of starch on stabilizing the PE/STC complex insolution. The results reported are in line with Fathi et al. [16]. Indeed, it could be concludedthat the size-reducing properties of starch could improve the zeta potential, increasingcolloidal stability.
3.2.7. In Vitro Drug Release Studies
The in vitro drug release study (dissolution assay) was performed at pH 2.1 and 7.8,corresponding to gastrointestinal media. The profiles obtained by the dissolution assayswere evaluated regarding kinetic mathematical models and stabilization of the producedparticles in an in vitro environment. Table 5 lists the results obtained at pH 2.1 and Table 6at pH 7.8. Zero-order (ZO), first-order (FO), Higuchi (HG), Hixson–Crowell (HC), andKorsmeyer–Peppas (KrP) were the theoretical mathematical models used to evaluate thecapacity for the prediction of release profiles. The criteria for selecting the most appropriatemodel were based on the adjusted correlation coefficient in which R2
Adj ≥ 0.800 wasconsidered as an acceptable fit indicator of the model, and the best-fitting model was theone with the R2
Adj closest to 1 [32–34].

Pharmaceutics 2022, 14, 112 19 of 30
Table 5. In vitro release assays at pH 2.1.
VariableMA GA PE STC GA/STC PE/STC
SIDI PH PH/CHL SIDI PH PH/CHL SIDI PH PH/CHL SIDI PH PH/CHL SIDI PH PH/CHL SIDI PH PH/CHL
ST (min) 2670.1 540.1 1620.1 210.1 450.1 630.1 270.1 1688.1 522.1 1880.1 1800.1 1860 340.1 900.1 210.1 520.1 1230.1 1298.1
ZO
F0 13.554 55.964 2.3204 31.877 49.773 29.398 57.423 15.517 53.611 49.120 44.165 7.946 71.305 54.364 49.044 69.368 48.045 45.833K0 0.027 0.013 0.052 0.162 0.072 0.045 0.023 0.044 0.029 0.024 0.032 0.046 0.019 0.0427 0.018 0.020 0.30 0.033R2 0.938 0.321 0.956 0.679 0.697 0.766 0.469 0.965 0.442 0.829 0.735 0.975 0.285 0.619 0.361 0.2618 0.708 0.699
R2Adj 0.927 0.297 0.954 0.639 0.673 0.746 0.453 0.964 0.420 0.824 0.726 0.975 0.254 0.600 0.31 0.2230 0.699 0.689
FO
K1 0.0004 0.0072 0.0002 0.006 0.0074 0.0065 0.006 0.001 0.0067 0.004 0.003 0.0003 0.009 0.008 0.012 0.018 0.007 0.0051Kmax 135.9 75.82 346.5 106.68 95.485 58.959 87.742 123.62 91.992 85.267 90.691 219.803 93.698 86.740 63.917 92.398 85.443 88.626
R2 0.980 0.908 0.960 0.884 0.945 0.897 0.928 0.951 0.953 0.881 0.916 0.978 0.953 0.891 0.895 0.925 0.868 0.941R2
Adj 0.977 0.905 0.959 0.869 0.941 0.889 0.926 0.949 0.951 0.877 0.913 0.977 0.951 0.886 0.888 0.921 0.863 0.939
HGKH 1.686 2.136 2.009 4.890 4.049 2.439 2.625 2.075 2.722 2.0283 2.457 1.933 3.008 3.390 2.515 3.073 2.574 2.629R2 0.944 0.520 0.907 0.808 0.868 0.874 0.649 0.955 0.648 0.942 0.830 0.933 0.530 0.802 0.556 0.499 0.846 0.858
R2Adj 0.944 0.520 0.907 0.808 0.868 0.874 0.649 0.955 0.648 0.942 0.830 0.933 0.530 0.802 0.556 0.499 0.846 0.858
HCKHC 0.0002 0.0006 0.0003 0.002 0.002 0.0005 0.0008 0.0003 0.0008 0.0005 0.0006 0.0003 0.001 0.0013 0.0005 0.001 0.0007 0.0007R2 0.976 0.670 0.941 0.909 0.960 0.938 0.755 0.946 0.839 0.923 0.880 0.959 0.687 0.842 0.471 0.557 0.848 0.926
R2Adj 0.976 0.670 0.941 0.909 0.960 0.838 0.755 0.946 0.839 0.923 0.880 0.959 0.687 0.842 0.471 0.557 0.848 0.926
KrP
Kkp 0.465 27.871 0.089 7.084 19.556 10.643 24.663 0.929 19.555 15.812 10.120 0.159 33.097 16.898 23.889 40.193 16.236 13.418N 0.664 0.139 0.932 0.435 0.244 0.260 0.181 0.613 0.218 0.231 0.301 0.849 0.149 0.249 0.149 0.123 0.236 0.266R2 0.965 0.700 0.957 0.807 0.892 0.828 0.790 0.965 0.759 0.946 0.890 0.979 0.758 0.830 0.737 0.706 0.894 0.905
R2Adj 0.960 0.690 0.955 0.783 0.883 0.814 0.783 0.964 0.750 0.944 0.886 0.978 0.748 0.822 0.721 0.691 0.890 0.902
DTM ANM C-I C-II ANM C-I C-I C-I ANM C-I C-I C-I ANM C-I C-I C-I C-I C-I C-ISIDI, enriched fraction of SI used in all formulated samples; PH, phytosome; PH/CHL, cholesterol-incorporated phytosome; GA, gum Arabic; MA, maltodextrin; PE, pectin; STC,starch; min; minutes; ZO, zero-order; FO, first-order; KrP, Korsmeyer–peppas; HG, Higuchi; HC, Hixson–Crowell; ST, stabilization time (approximately the time when the release start tobe stable and the curve change to be linear); R2
Adj, R2Adjusted; DTM, drug transport mechanism; C-I, case-I; ANM, anomalous; C-II, case-II transport; SC-II, super case-II.

Pharmaceutics 2022, 14, 112 20 of 30
Table 6. In vitro release assays at pH 7.8.
VariableMA GA PE STC GA/STC PE/STC
SIDI PH PH/CHL SIDI PH PH/CHL SIDI PH PH/CHL SIDI PH PH/CHL SIDI PH PH/CHL SIDI PH PH/CHL
ST (min) 500.1 100.1 50.1 54.1 239.1 1229.1 1634.1 1514.1 1594.1 2160.1 2107.1 2160.1 1080.1 1080.1 1080.1 1900.1 1260 1944.1
ZO
F0 76.984 28.249 38.031 66.060 43.196 38.309 39.624 52.759 40.692 14.169 16.400 7.122 27.114 44.0878 56.337 26.737 28.941 12.727K0 0.031 0.412 0.461 0.250 0.190 0.178 0.036 0.023 0.037 0.034 0.037 0.036 0.059 0.046 0.035 0.033 0.035 0.046R2 0.827 0.956 0.663 0.475 0.835 0.980 0.910 0.838 0.880 0.961 0.910 0.947 0.913 0.709 0.508 0.952 0.887 0.930
R2Adj 0.816 0.952 0.642 0.451 0.826 0.979 0.907 0.834 0.975 0.959 0.907 0.945 0.910 0.697 0.489 0.951 0.882 0.927
FO
K1 0.010 0.023 0.028 0.097 0.012 0.0009 0.003 0.030 0.003 0.001 0.001 0.0004 0.003 0.007 0.009 0.001 0.003 0.0008Kmax 97.320 77.731 99.845 94.204 97.688 371.43 87.869 77.297 93.081 126.21 120.03 156.62 90.655 86.158 89.574 94.589 71.232 124.290
R2 0.502 0.813 0.962 0.874 0.935 0.982 0.887 0.580 0.940 0.986 0.964 0.982 0.957 0.936 0.965 0.961 0.850 0.984R2
Adj 0.470 0.797 0.959 0.869 0.931 0.982 0.882 0.569 0.937 0.986 0.963 0.982 0.956 0.933 0.964 0.960 0.844 0.983
HGKH 4.141 7.076 8.859 10.234 6.069 6.759 2.521 2.475 2.564 1.799 1.922 1.740 2.762 3. 101 3.201 2.022 2.078 2.108R2 0.865 0.912 0.837 0.699 0.944 0.967 0.989 0.903 0.977 0.963 0.934 0.950 0.977 0.862 0.700 0.978 0.933 0.956
R2Adj 0.865 0.912 0.837 0.699 0.944 0.967 0.989 0.903 0.977 0.963 0.934 0.950 0.977 0.862 0.700 0.978 0.933 0.956
HCKHC 0.0017 0.0036 0.0076 0.0093 0.003 0.0016 0.0005 0.0007 0.0006 0.0002 0.0003 0.0002 0.0006 0.001 0.012 0.0003 0.0003 0.0003R2 0.802 0.919 0.969 0.875 0.971 0.791 0.9562 0.779 0.976 0.986 0.968 0.984 0.958 0.919 0.877 0.982 0.904 0.987
R2Adj 0.802 0.919 0.969 0.875 0.971 0.791 0.9562 0.779 0.976 0.986 0.968 0.984 0.958 0.919 0.877 0.982 0.904 0.987
KrP
Kkp 71.286 14.051 16.452 46.261 15.323 2.331 11.684 30.156 9.538 0.485 0.605 0.211 4.119 14.235 23.560 2.416 5.371 0.613N 0.043 0.343 0.367 0.157 0.323 0.657 0.279 0.141 0.312 0.676 0.658 0.781 0.440 0.267 0.198 0.475 0.361 0.671R2 0.508 0.857 0.868 0.827 0.912 0.985 0.976 0.899 0.964 0.980 0.944 0.966 0.978 0.910 0.809 0.975 0.919 0.964
R2Adj 0.477 0.845 0.860 0.819 0.907 0.984 0.975 0.897 0.962 0.979 0.942 0.965 0.977 0.906 0.809 0.974 0.915 0.962
DTM C-I C-I C-I C-I C-I ANM C-I C-I C-I ANM ANM ANM ANM C-I C-I ANM C-I ANMSIDI, enriched fraction of SI used in all formulated samples; PH, phytosome; PH/CHL, cholesterol-incorporated phytosome; GA, gum Arabic; MA, maltodextrin; PE, pectin; STC,starch; min; minutes; ZO, zero-order; FO, first-order; KrP, Korsmeyer–peppas; HG, Higuchi; HC, Hixson–Crowell; ST, stabilization time (approximately the time when the release start tobe stable and the curve change to be linear); R2
Adj, R2Adjusted; DTM, drug transport mechanism; C-I, case-I; ANM, anomalous; C-II, case-II transport; SC-II, super case-II.

Pharmaceutics 2022, 14, 112 21 of 30
Zero-order kinetics were applied to determine if the caffeine release from the particlesfollowed a Fickian or non-Fickian mechanism. A Fickian mechanism occurs when thebioactive/drug release happens at a constant and linear rate, during a specific time, andindependently of the concentration at any time [24]. The zero-order kinetics model supportsa sustained-release mechanism, that is, the active agent is released at a constant rate duringa period of time. This assures that the active agent is continuously released at a constantpharmacological concentration, but on the other hand, it implies a frequent repetitivedosing, considering the limited amount of the active agent per formulation, which rapidlycauses the drug concentration to be outside of the therapeutic range [25]. In relation to thetested formulations at pH 2.1, and according to the R2
Adj value, it was concluded that thezero-order kinetic model did not fit well to most of the release results, indicating an overallnon-Fickian release mechanism with the exception of five formulae: SIDI-MA (R2
Adj: 0.927),PH/CHL-SIDI-MA (R2
Adj: 0.954), PH-SIDI-PE (R2Adj: 0.964), SIDI-STC (R2
Adj: 0.824),PH/CHL-SIDI-STC (R2
Adj: 0.975). In contrast, regarding pH 7.8, most of the drug releaseassays of the particles fitted well to the zero-order kinetic model (indicating a Fickianrelease mechanism), except for the formulations PH/CHL-SIDI-MA (R2
Adj: 0.642), SIDI-GA(R2
Adj: 0.451), PH-SIDI-GA/STC (R2Adj: 0.697), and PH/CHL-SIDI-GA/STC (R2
Adj: 0.489).For zero-order kinetics models, the release mechanism relies on the fact that the amount ofthe drug dissolved only depends on time. Thus, the synthetized formulations that wererevealed to be compatible with a zero-order kinetic model allow the drug to be dissolved ata constant rate independently of the active agent concentration.
The first-order kinetic model is normally used to mathematically describe the release,absorption, and dissolution phenomena of a drug from a solid particle in a liquid me-dia, thus being dependent on the surface area of the solid in contact with the solutionmedium [29]. In this process, the drug release rate is concentration dependent [15], re-sulting in a super slow release profile since the concentration of the drug diminishes withthe release process, which in turn slows down due to the lower drug concentration insidethe particles [33,60]. By analyzing the calculated statistical parameters, in Tables 5 and 6,derived from the application of the first-order model to the dissolution assays’ results, itwas concluded that the first kinetic model fitted well to the release data associated withpH 2.1 (R2
Adj ≥ 0.877) and associated with pH 7.8 (R2Adj ≥ 0.797) except in the particles
SIDI-MA (R2Adj: 0.470) and PH-SIDI-PE (R2
Adj: 0.569). Therefore, the release of the formu-lated particles conceptualizes a constant compound release over specific times (super slowrelease) regarding a good fit of the first-order kinetic model.
The Higuchi model is based on a premier mathematical kinetic equation that describesdrug release. Even though this model presented an overall good fit to the in vitro release re-sults, some reservations about its suitability were still assumed. As general knowledge, theHiguchi models are sustained by numerous assumptions such as a scarce or non-existingswelling rate and the erosion of the coating matrix, with the drug release only being basedon a Fickian diffusion for water-soluble and low-soluble drugs in the polymer matrix.The root-based Higuchi equation was used when the polymer matrices were swellableand biodegradable, giving rise to a *pseudo-steady-state* as described by Higuchi [33,61].Most of the calculated results for the Higuchi model (Tables 5 and 6) revealed a good fitat both the tested pH (R2
Adj ≥ 0.800), indicating that the release of caffeine from most ofthe produced particles was dependent on the erosion of the coating matrix. Moreover,it was proved that the produced particles were swellable in both tested pH values, espe-cially at pH 7.8 with the exception of SIDI-GA (R2
Adj: 0.699) and PH/CHL-SIDI-GA/STC(R2
Adj: 0.700), (Table 6).The Hixson–Crowell model tries to mathematically justify the dissolution rate of
uniform particles in a powder by describing the release profile based on the cube root ofcumulative concentration of drugs released at time “t”. This equation was adjusted tonumerous pharmaceutical products, namely tablets and drug particles [33,60]. Furthermore,this model assumes that the drug’s release velocity is limited by its dissolution rate and notby its diffusion across the polymeric matrix. The Hixson–Crowell model justifies a drug

Pharmaceutics 2022, 14, 112 22 of 30
release based on constant sustainability of the geometrical form of particles over time. Inother words, the dissolution rate should be constant if the surface morphology of particles(whether cubic or spherical) is also constant. Hence, the samples that fit well with theHixson–Crowell model have a constant geometrical based dissolution profile [29]. TheR2
Adj value of the Hixson–Crowell model fits better to the result obtained from pH 7.8,except PH/CHL-SIDI-GA (R2
Adj: 0.791) and PH-SIDI-PE (R2Adj: 0.779), compared to results
obtained from pH 2.1 in which particles PH-SIDI-MA (R2Adj: 0.670), SIDI-PE (R2
Adj: 0.755),SIDI-GA/STC (R2
Adj: 0.687), PH/CHL-SIDI-GA/STC (R2Adj: 0.670), SIDI-PE/STC (R2
Adj:0.557) showed the lowest fitting correlation determination. Therefore, the R2
Adj obtainedby fitting the Hixson–Crowell model to the dissolution results indicated that the caffeinerelease rate occurred by a dissolution process and not by the diffusion on the surface ofparticles. The prevalence of the dissolution over diffusion probably occurs because whenthe solution is agitated deeply it prevents the accumulation of particles at the bottom of thesolution, resulting in a slow diffusion rate [33]. This phenomenon justified the slow-releasetime (stabilization time) obtained from most of particles.
The Korsmeyer–Peppas model is most often used to justify the release profile ofsubstances from polymeric matrixes and additionally allow one to classify the release mech-anism based on the interpretation of its release exponent (“n” in Equation (6)). Korsmeyer–Peppas is a semi-empirical power law equation assuming the particles geometry spherical(6) [15], and when the n value corresponds to 0.43, the release is due to pure Fickian diffu-sion (Case I) (resulting in low polymer degradation); when n values reach 0.85 then thesystem release is a Case II transport following a zero-order kinetic, which is dependent onthe swelling and relaxation of the polymer chains; when n values are between 0.43 and 0.85,the transport is anomalous, meaning that the mechanism of release involves both Fickiandiffusion and Case II transport [29,31,62].
Considering the experimental results in the present work, the Korsmeyer–Peppasmodel was revealed to have a satisfactory fitting based on R2
Adj at pH 7.8 (R2Adj ≥ 0.819), ex-
cept SIDI-MA (R2Adj: 0.477), and moderate satisfaction at pH 2.1 regarding that R2
Adj ≥ 0.690.The obtained results for this model (Tables 5 and 6) might be due to the non-linear releasedata (microcapsules/particles or microspheres), which was the main aim of the applicationof Korsmeyer–Peppas kinetic models [60].
By observing the calculated release factors, “n” values of the Korsmeyer–Peppas model(Tables 5 and 6), significant differences based on transport mechanisms were observed for allthe synthetized carrier-particles under characterization, and additionally, these differencescould not be categorized accordingly with the groups of the coating walls exploited in thisstudy. Nevertheless, the drug releases could be divided in just two routes: Case-I drugtransport and anomalous drug transport for both pH, with the exception of PH/CHL-SIDI-MA at pH 2.1, which followed super case-II drug transport (n = 0.932). When n < 0.43,the drug release follows case-I drug transport, justified by the low degradation of thepolymers matrix, and as the n value increases, it indicates that the degradation of polymersalso increases, giving rise to anomalous super case-II drug transport [15]. A low rate ofpolymer degradation results in a slow release profile. Therefore, the slow release of mostof the particles was justified [15]. However, overall, and considering the magnitude ofthe tabulated data (Tables 5 and 6), it was not possible to elaborate profiles of calculatedrelease factors and relate these to the different groups of coating polymers exploited inthe study. This way, the specific classification of the particle’s dissolution assay at bothpH levels could not be determined. This fact may be related to the diversity of the chemicalcomposition of the NP used for producing the polymer coating walls.
In vitro drug release in terms of stabilization time was observed to be discordant in allsamples under study with a slow-release time except in some particles (explained belowin the same section). The super slow release may be justified by the concentration of theNP (1:10 and 1:15), which can make the drug’s diffusion through a particle coating difficult(Tables 5 and 6). Our result is in accordance with the work of Paarakh et al. [33] whoreported that the concentration of NP influences the media viscosity and, consequently, the

Pharmaceutics 2022, 14, 112 23 of 30
drug’s diffusion, significantly increasing the stabilization time. Furthermore, regardingpH 2.1, no significant differences were observed between the NP coating and NP-Secondarycoating II, contrary to almost all particles of the NP-Secondary coating I (phytosome-based)in which the stabilization times were enhanced at current pH (Tables 5 and 6). RegardingpH 7.8, the stabilization release time varied between (216.1 and 1080.1 min) except for thegum Arabic coating in which the release time was enhanced from the NP coating to NP-Secondary coating II at both pH (ascending order; increase in release stabilization time byadding the coating layer resulting in the improvement of the particle stability and increasein the release time), which can be justified by findings in the work of Paarakh et al. [33]regarding the polymer concentration (explained in beginning of this paragraph). However,in contrast, maltodextrin stabilization times were observed in a descending order in whichthe release time decreased from the first coating layer (NP-Coating) to NP-Secondarycoating II at pH 7.8, as seen in Table 6.
Considering there are numerous kinetic models already established to predict a greatvariety of release behaviors of different types of micro/nanoparticles, in the present work,different mathematical kinetic models were used to assess their adjustment to the drug re-lease profiles from the several silverskin-based formulations produced [31]. The Korsmeyer–Peppas provided a better understanding about the release behavior of the generally devel-oped carrier’ particles [31,63]. The Korsmeyer–Peppas and first-order kinetic models wereable to justify the slow release of most of the as-synthetized particles [15]. In vitro releaseassays curves of PE/STC series as an example is shown in Figure 4. The other curves arepresented in the Supplementary Materials.
Pharmaceutics 2021, 13 25 of 32
who reported that the concentration of NP influences the media viscosity and, conse-
quently, the drug’s diffusion, significantly increasing the stabilization time. Furthermore,
regarding pH 2.1, no significant differences were observed between the NP coating and
NP-Secondary coating II, contrary to almost all particles of the NP-Secondary coating I
(phytosome-based) in which the stabilization times were enhanced at current pH (Tables
5 and 6). Regarding pH 7.8, the stabilization release time varied between (216.1 and 1080.1
min) except for the gum Arabic coating in which the release time was enhanced from the
NP coating to NP-Secondary coating II at both pH (ascending order; increase in release
stabilization time by adding the coating layer resulting in the improvement of the particle
stability and increase in the release time), which can be justified by findings in the work
of Paarakh et al. [33] regarding the polymer concentration (explained in beginning of this
paragraph). However, in contrast, maltodextrin stabilization times were observed in a de-
scending order in which the release time decreased from the first coating layer (NP-Coat-
ing) to NP-Secondary coating II at pH 7.8, as seen in Table 6.
Considering there are numerous kinetic models already established to predict a great
variety of release behaviors of different types of micro/nanoparticles, in the present work,
different mathematical kinetic models were used to assess their adjustment to the drug
release profiles from the several silverskin-based formulations produced [31]. The
Korsmeyer–Peppas provided a better understanding about the release behavior of the
generally developed carrier’ particles [31,63]. The Korsmeyer–Peppas and first-order
kinetic models were able to justify the slow release of most of the as-synthetized particles
[15]. In vitro release assays curves of PE/STC series as an example is shown in Figure 4.
The other curves are presented in the Supplementary Materials.
Figure 4. In vitro release assays curves of PE/STC series at two different pH (A: pH 2.1; B: pH 7.6).
The other curves are presented in the Supplementary Materials.
3.2.8. In Silico Investigation Based on Molecular Docking
In silico investigation of molecular arrangement was based on caffeine (the main al-
kaloid structure) and 5-caffeoylquinic acid (also known as chlorogenic acid), which is the
main phenolic of SI (Figure 5 and Table 7). The molecular docking confirmed a good in-
teraction between the phytochemicals and the phospholipid bilayer. The molecular ar-
rangement of phospholipid in the nano-phytosome bilayer and cholesterol-incorporated
nano-phytosome was designed using the MemGen webserver. The phytoconstituents
were docked on both lipid bilayers and evaluated based on a 3D model (Figures 4–7),
Figure 4. In vitro release assays curves of PE/STC series at two different pH (A: pH 2.1; B: pH 7.6).The other curves are presented in the Supplementary Materials.
3.2.8. In Silico Investigation Based on Molecular Docking
In silico investigation of molecular arrangement was based on caffeine (the mainalkaloid structure) and 5-caffeoylquinic acid (also known as chlorogenic acid), which isthe main phenolic of SI (Figure 5 and Table 7). The molecular docking confirmed a goodinteraction between the phytochemicals and the phospholipid bilayer. The moleculararrangement of phospholipid in the nano-phytosome bilayer and cholesterol-incorporatednano-phytosome was designed using the MemGen webserver. The phytoconstituents weredocked on both lipid bilayers and evaluated based on a 3D model (Figures 4–7), dockingscore, and grid energy (Table 7), taking into account that a low docking score justifies ahigh number of hydrogen binding and stronger interactions [64].

Pharmaceutics 2022, 14, 112 24 of 30
Pharmaceutics 2021, 13 26 of 32
docking score, and grid energy (Table 7), taking into account that a low docking score
justifies a high number of hydrogen binding and stronger interactions [64].
Table 7. Binding energy of docked molecule expressed as kcal/mol.
Lipid Structure Categories Main Compounds Docking Score * Glide evdw Glide Energy
Phytosome Alkaloid Caffeine −2.518 −20.202 −21.949
Phenolic 5-Caffeoylquinic acid −9.008 −26.590 −39.743
Cholesterol-incorporated phytosome Alkaloid Caffeine −2.347 −17.696 −21.247
Phenolic 5-Caffeoylquinic acid −7.120 −25.621 −39.665
* Docking score exhibited the number of hydrogen bindings occurring between structures. Lower
docking scores denote a higher hydrogen binding.
Figure 5. 3D model of lipid bilayers. (a) Bilayer containing phosphatidylcholine and cholesterol; (b)
simulated model for bilayer designed with phosphatidylcholine. The polar site of the bilayer is fitted
to the outer layer and covered with hundreds of water molecules (the white and red site on top and
bottom of bilayer). Differences on bilayer diameter between structure (a,b) are discussed in Section
3.2.4. *Initial Lipid Coating* and Table 4).
Figure 5. 3D model of lipid bilayers. (a) Bilayer containing phosphatidylcholine and cholesterol;(b) simulated model for bilayer designed with phosphatidylcholine. The polar site of the bilayer isfitted to the outer layer and covered with hundreds of water molecules (the white and red site ontop and bottom of bilayer). Differences on bilayer diameter between structure (a,b) are discussed inSection 3.2.4. *Initial Lipid Coating* and Table 4).
Table 7. Binding energy of docked molecule expressed as kcal/mol.
Lipid Structure Categories Main Compounds Docking Score * Glide Evdw Glide Energy
Phytosome Alkaloid Caffeine −2.518 −20.202 −21.949Phenolic 5-Caffeoylquinic acid −9.008 −26.590 −39.743
Cholesterol-incorporated phytosome Alkaloid Caffeine −2.347 −17.696 −21.247Phenolic 5-Caffeoylquinic acid −7.120 −25.621 −39.665
* Docking score exhibited the number of hydrogen bindings occurring between structures. Lower docking scoresdenote a higher hydrogen binding.
The data elicited by molecular docking showed lower and higher docking scores for5-caffeoylquinic acid and caffeine, respectively, in both lipid bilayers (nano-phytosome andnano-phytosome incorporated by cholesterol) (Table 7). Note that lower docking scoresdenote higher hydrogen binding. 5-Caffeoylquinic acid exhibited a lower absolute dockingscore in both structures, although was better suited for the phytosome bilayer (Table 7and Figures 5 and 6). It was shown that the phytoconstituents were positioned withinthe lipid bilayer, exhibiting high hydrogen binding between the polar site of the lipidbilayer and the hydroxyl groups of 5-caffeoylquinic acid. Pruchnik et al. [65] also confirmedthe interaction between chlorogenic acid and biological membranes, as verified in thiswork. The referenced authors evaluated the chlorogenic acid permeation mechanism by

Pharmaceutics 2022, 14, 112 25 of 30
differential scanning calorimetry and fluorescence spectroscopy, showing the interactionbetween chlorogenic acid and the polar site of the biological membrane. Therefore, thelower docking score obtained for 5-caffeoylquinic acid (Table 7) is justified.
Pharmaceutics 2021, 13 27 of 32
Figure 6. Simulated 3D model of grid of nano-phytosome bilayer docked with main phytochemicals
of SI (caffeine and 5-caffeoylquinic acid). In the model, for better visualization, only polar hydrogens
are represented. The lipid bilayer appears spherical (see also Figure 4). (a,b) show an overlap of the
compound’s interaction with the lipid bilayer. (c) Caffeine (purine alkaloid); adjusted near a polar
size with a minimum rate of hydrogen binding. (d) 5-Caffeoylquinic acid; the majority of hydrogen
binding occurs due to caffeic aldehyde moiety.
Figure 7. Simulated 3D model of the cholesterol-incorporated nano-phytosome bilayer docked with
main phytochemicals of SI (caffeine and 5-caffeoylquinic acid). The lipid bilayer appears spherical
(see also Figure 4). (a,b) show an overlap of the compound’s interaction with the lipid bilayer. (c)
Figure 6. Simulated 3D model of grid of nano-phytosome bilayer docked with main phytochemicalsof SI (caffeine and 5-caffeoylquinic acid). In the model, for better visualization, only polar hydrogensare represented. The lipid bilayer appears spherical (see also Figure 4). (a,b) show an overlap of thecompound’s interaction with the lipid bilayer. (c) Caffeine (purine alkaloid); adjusted near a polarsize with a minimum rate of hydrogen binding. (d) 5-Caffeoylquinic acid; the majority of hydrogenbinding occurs due to caffeic aldehyde moiety.
The interaction between nitrogen and the choline site of phospholipids was confirmedpreviously by molecular dynamics simulation (MD) regarding the peroxynitrous acid(ONOOH) and phospholipid bilayers [66]. Therefore, the higher docking score suggeststhe weaker hydrogen binding of caffeine (Table 7). This behavior may be due to its smallsize, not allowing a good incorporation in the lipid bilayer. However, based on the 3Dmodel (Figures 5 and 6), caffeine was adjusted on the polar site of phosphatidylcholine,just like the chlorogenic acid, but with a low docking score. Phenolics arrangement withina lipid bilayer was reported, recently, for the first time [16]. Based on information reportedby Pruchnik et al. [65] and Cordeiro et al. [66] (already discussed in the current section)and the results obtained in this study regarding the in silico molecular arrangement, theinteraction between active phytoconstituents/drugs with biological cell membranes couldbe properly predicted by molecular docking and molecular dynamic simulations.

Pharmaceutics 2022, 14, 112 26 of 30
Pharmaceutics 2021, 13 27 of 32
Figure 6. Simulated 3D model of grid of nano-phytosome bilayer docked with main phytochemicals
of SI (caffeine and 5-caffeoylquinic acid). In the model, for better visualization, only polar hydrogens
are represented. The lipid bilayer appears spherical (see also Figure 4). (a,b) show an overlap of the
compound’s interaction with the lipid bilayer. (c) Caffeine (purine alkaloid); adjusted near a polar
size with a minimum rate of hydrogen binding. (d) 5-Caffeoylquinic acid; the majority of hydrogen
binding occurs due to caffeic aldehyde moiety.
Figure 7. Simulated 3D model of the cholesterol-incorporated nano-phytosome bilayer docked with
main phytochemicals of SI (caffeine and 5-caffeoylquinic acid). The lipid bilayer appears spherical
(see also Figure 4). (a,b) show an overlap of the compound’s interaction with the lipid bilayer. (c)
Figure 7. Simulated 3D model of the cholesterol-incorporated nano-phytosome bilayer docked withmain phytochemicals of SI (caffeine and 5-caffeoylquinic acid). The lipid bilayer appears spherical(see also Figure 4). (a,b) show an overlap of the compound’s interaction with the lipid bilayer.(c) Caffeine (purine alkaloid); adjusted near a polar size with minimum rate of hydrogen binding.(d) 5-Caffeoylquinic acid; the majority of hydrogen binding occurred due to both caffeic aldehydeand quinic acid moieties.
4. Conclusions
The objective of this work was to obtain the highest enrichment of a coffee roastingby-product (SI) extract, followed by its incorporation in nanoparticles. Nano-phytosomeswere formulated with the enriched fraction to improve the phytochemicals’ permeationthrough the cell membrane. The nano-phytosome surface was modified using cholesterolto improve the permeation rate and stability during the formulation process. The structuralarrangements were evaluated by in silico molecular docking. To enhance the stability ofthe formulated structures and natural phytoconstituents, the first lipid-based layer wasalso coated with NPs.
The high yield of SI enrichment and the enrichment rate associated with caffeine andtotal phenolics as main constituents was obtained in the fraction SI1DI1 and, because ofthat, it was selected to load the micro/nanoparticles.
Different formulation techniques were used, and the nanoparticles and nano-sizedcolloids were evaluated regarding physicochemical properties and in vitro drug release.
The experimental data revealed different formulation groups and significant simi-larities within related subgroups. In conclusion, higher and lower product yields wereobserved at ≥70.00% (SIDI-STC and PH-SIDI-GA) and ≤40.00% (SIDI-PE/STC and PH-SIDI-PE/STC), respectively. No significant differences (p > 0.05) were found between theEE% of the different groups of particles, while significantly lower (p < 0.05) LC% valueswere observed in NP-secondary coating II (PH/CHL-SIDI-NPs).
Both lipid-based layer structures were confirmed as nanoparticles, and the externallayer (NP-coating) varied between 1 and 5 µm for all samples under study. Concerningthe inner layer size, it formed various subgroups and varied mainly between 226.1 and808.7 nm in volume, and from 187 to 786.8 nm, in number.

Pharmaceutics 2022, 14, 112 27 of 30
All formulated particles exhibited anionic surface charges and high stability in aqueousmedia. FTIR and molecular docking confirmed the interaction of the layers with the purinealkaloid (caffeine) and the phenolic compound (5-caffeoylquinic acid). The best dockingscore was recorded for 5-caffeoylquinic acid, which exhibited stronger hydrogen bonding,resulting in a better/stronger interaction.
The in vitro release assays conceptualize the dissolution rate of a specific drug encap-sulated in the formulated particles. Considering that the natural polymers’ layers used inthis study have good solubility at neutral pH, a higher number of samples with a goodfitting of drug release models at pH 7.8 was confirmed. The obtained results allow us tohypothesize that the drug release profile from the particles was pH dependent, and thatthe coating layers in this work allowed a sustained and controlled drug release at pH 7.8.
Moreover, the majority of the particles followed a super slow release time confirmedby all kinetic models under study following both erosion and diffusion release due tothe type of coating layers. Korsmeyer–Peppas, First-order, and Higuchi fitted well to theexperimental data regarding the R2
adj parameter. Furthermore, the majority of formulatedparticles followed the case-I and anomalous transport mechanism.
To conclude, independently of the type of the coating layer used (first or secondary),the final products can have high efficiency at lower dosages, making them suitable for oraldelivery. Based on their enriched content in caffeine and phenolic compounds (antioxi-dants), they have potential to be used, for instance, in dietary supplements to improvemental and physical performance, competing with other products already existing inthe market.
Supplementary Materials: The supporting information contain the in vitro release assays curves ofall samples can be downloaded at: https://www.mdpi.com/article/10.3390/pharmaceutics14010112/s1, Figure S1: In vitro release assays curves associated to MA series at pH 2.1; Figure S2: In vitrorelease assays curves associated to MA series at pH 7.8; Figure S3: In vitro release assays curvesassociated to GA series at pH 2.1; Figure S4: In vitro release assays curves associated to GA seriesat pH 7.8; Figure S5: In vitro release assays curves associated to STC series at pH 2.1; Figure S6:In vitro release assays curves associated to STC series at pH 7.8; Figure S7: In vitro release assayscurves associated to GA/STC series at pH 2.1; Figure S8: In vitro release assays curves associated toGA/STC series at pH 7.8; Figure S9: In vitro release assays curves associated to PE series at pH 2.1;Figure S10: In vitro release assays curves associated to PE series at pH 7.8.
Author Contributions: F.F.: Conceptualization, investigation, methodology, formal analysis, writing—original draft; S.N.E.: Conceptualization, validation, formal analysis, editing original draft, supervi-sion; J.A.V.P.: Validation, formal analysis and editing original draft; S.M.L.M.: Investigation by HPLCanalysis; R.M.K.: Formal analysis, writing and editing original draft; R.C.A.: Formal analysis, editingoriginal draft, supervision, funding acquisition; M.B.P.P.O.: Conceptualization, editing original draft,supervision, resources, funding acquisition. All authors have read and agreed to the publishedversion of the manuscript.
Funding: The open access publication fee of this paper was funded by AgriFood XXI I&D&I project(NORTE-01-0145-FEDER-000041) cofinanced by European Regional Development Fund (ERDF)through the NORTE 2020 (Programa Operacional Regional do Norte 2014/2020).
Institutional Review Board Statement: Not applicable.
Informed Consent Statement: Not applicable.
Data Availability Statement: The data presented in this study are available on request from thecorresponding author. The data are not publicly available due to privacy restriction.
Acknowledgments: Faezeh Fathi is grateful to Laboratório Associado para a Química Verde—Tecnologias e Processos Limpos—UIDB/50006/2020 that supports her grant REQUIMTE 2020-20. RitaC. Alves is also grateful to FCT for the CEECIND/01120/2017 contract. The authors thank to BICAFÉfor kindly providing silverskin. This research was also supported by the UIDB/50006/2020 project,funded by FCT/MCTES (Portugal) (through national funds); U2SCOFFEE project (POCI/01/0247/FEDER/033351), financed by FEDER; and project SYSTEMIC “an integrated approach to the chal-

Pharmaceutics 2022, 14, 112 28 of 30
lenge of sustainable food systems: adaptive and mitigatory strategies to address climate change andmalnutrition”, Knowledge hub on Nutrition and Food Security, funded by national research fundingparties in Belgium (FWO), France (INRA), Germany (BLE), Italy (MIPAAF), Latvia (IZM), Norway(RCN), Portugal (FCT), and Spain (AEI) in a joint action of JPI HDHL, JPI-OCEANS and FACCE-JPIlaunched in 2019 under the ERA-NET ERA-HDHL (n◦ 696295). Furthermore, thanks to Salette Reis,Chemical Science Department University of Porto (FFUP) for providing equipment.
Conflicts of Interest: The authors declare no conflict of interest.
References1. Rashid, N.; Ashraf, I.; Ramzan, S. Impacts of Food Industrial Wastes on Soil and Its Utilization as Novel Approach for Value
Addition. In Research Anthology on Food Waste Reduction and Alternative Diets for Food and Nutrition Security; Bhat, R., Qadri, H.,Wani, K., Dar, G., Mehmood, M., Eds.; IGI Global: Hershey, PA, USA, 2021; pp. 652–669.
2. Comunian, T.A.; Silva, M.P.; Souza, C.J.F. The use of food by-products as a novel for functional foods: Their use as ingredientsand for the encapsulation process. Trends Food Sci. Technol. 2021, 108, 269–280. [CrossRef]
3. Costa, A.S.G.; Alves, R.C.; Vinha, A.F.; Barreira, S.V.P.; Nunes, M.A.; Cunha, L.M.; Oliveira, M.B.P.P. Optimization of antioxidantsextraction from coffee silverskin, a roasting by-product, having in view a sustainable process. Ind. Crop. Prod. 2014, 53, 350–357.[CrossRef]
4. Costa, A.S.G.; Alves, R.C.; Vinha, A.F.; Costa, E.; Costa, C.S.G.; Nunes, M.A.; Almeida, A.A.; Santos-Silva, A.; Oliveira, M.B.P.P.Nutritional, chemical and antioxidant/pro-oxidant profiles of silverskin, a coffee roasting by-product. Food Chem. 2018, 267,28–35. [CrossRef] [PubMed]
5. Fathi, F.; Ebrahimi, S.N. Investigation of physiochemical properties nanophytosome obtained from of polyphenolic enrichfraction of Satureja khuzistanica by freeze-drying. Nashrieh Shimi va Mohandesi Shimi Iran. in press. Available online:https://www.nsmsi.ir/article_242399.html?lang=en (accessed on 7 November 2021).
6. Grgic, J.; Šelo, G.; Planinic, M.; Tišma, M.; Bucic-Kojic, A. Role of the encapsulation in bioavailability of phenolic compounds.Antioxidants 2020, 9, 923. [CrossRef]
7. Amin, T.; Bhat, S.V. A review on phytosome technology as a novel approach to improve the bioavailability of nutraceuticals. Int.J. Adv. Res. Technol. 2012, 1, 1–5.
8. Ozkan, G.; Kostka, T.; Esatbeyoglu, T.; Capanoglu, E. Effects of Lipid-Based Encapsulation on the Bioaccessibility and Bioavail-ability of Phenolic Compounds. Molecules 2020, 25, 5545. [CrossRef] [PubMed]
9. Rasaee, S.; Ghanbarzadeh, S.; Mohammadi, M.; Hamishehkar, H. Nano phytosomes of quercetin: A promising formulation forfortification of food products with antioxidants. Pharm. Sci. 2014, 20, 96–101.
10. Liu, N.; Park, H.-J. Chitosan-coated nanoliposome as vitamin E carrier. J. Microencapsul. 2009, 26, 235–242. [CrossRef]11. Hosseini, H.; Tajiani, Z.; Jafari, S.M. Improving the shelf-life of food products by nano/micro-encapsulated ingredients. In Food
Quality and Shelf Life; Galanakis, C.M., Ed.; Elsevier: Amesterdam, The Netherlands, 2019; pp. 159–200.12. Bessada, S.M.; Alves, R.C.; Oliveira, M.B.P. Caffeine-based food supplements and beverages: Trends of consumption for
performance purposes and safety concerns. Int. Food Res. 2018, 109, 310–319. [CrossRef]13. Plapied, L.; Duhem, N.; des Rieux, A.; Préat, V. Fate of polymeric nanocarriers for oral drug delivery. Curr. Opin. Colloid Interface
Sci. 2011, 16, 228–237. [CrossRef]14. Wu, W.; Wang, J.; Lin, Z.; Li, X.; Li, J. Tumor-Acidity Activated Surface Charge-Conversion of Polymeric Nanocarriers for
Enhanced Cell Adhesion and Targeted Drug Release. Macromol. Rapid Commun. 2014, 35, 1679–1684. [CrossRef]15. Danaei, M.; Dehghankhold, M.; Ataei, S.; Hasanzadeh Davarani, F.; Javanmard, R.; Dokhani, A.; Khorasani, S.; Mozafari, M. Impact of
particle size and polydispersity index on the clinical applications of lipidic nanocarrier systems. Pharmaceutics 2018, 10, 57. [CrossRef][PubMed]
16. Fathi, F.; Ebrahimi, S.N.; Valadão, A.I.G.; Andrade, N.; Costa, A.S.G.; Silva, C.; Fathi, A.; Salehi, P.; Martel, F.; Alves, R.C.; et al.Exploring Gunnera tinctoria: From Nutritional and Anti-Tumoral Properties to Phytosome Development Following StructuralArrangement Based on Molecular Docking. Molecules 2021, 26, 5935. [CrossRef]
17. Puga, H.; Alves, R.C.; Costa, A.S.G.; Vinha, A.F.; Oliveira, M.B.P. Multi-frequency multimode modulated technology as a clean,fast, and sustainable process to recover antioxidants from a coffee by-product. J. Clean. Prod. 2017, 168, 14–21. [CrossRef]
18. Ebrahimi, S.N.; Gafner, F.; Dell’Acqua, G.; Schweikert, K.; Hamburger, M. Flavone 8-C-Glycosides from Haberlea rhodopensisFriv.(Gesneriaceae). Helv. Chim. Acta. 2011, 94, 38–45. [CrossRef]
19. Shehzad, O.; Jin Ha, I.; Park, Y.; Wan Ha, Y.; Shik Kim, Y. Development of a rapid and convenient method to separate eightginsenosides from Panax ginseng by high-speed counter-current chromatography coupled with evaporative light scatteringdetection. J. Sep. Sci. 2011, 34, 1116–1122. [CrossRef]
20. Singh, R.P.; Gangadharappa, H.V.; Mruthunjaya, K. Phytosome complexed with chitosan for gingerol delivery in the treatment ofrespiratory infection: In vitro and in vivo evaluation. Eur. J. Pharm. Sci. 2018, 122, 214–229. [CrossRef]
21. Anwar, E.; Farhana, N. Formulation and Evaluation of Phytosome-Loaded Maltodextrin-Gum Arabic Microsphere System forDelivery of Camellia sinensis Extract. J. Young Pharm. 2018, 10, 56–62. [CrossRef]

Pharmaceutics 2022, 14, 112 29 of 30
22. Tuyen, C.K.; Nguyen, M.H.; Roach, P.D.; Stathopoulos, C.E. Microencapsulation of Gac oil: Optimisation of spray dryingconditions using response surface methodology. Powder Technol. 2014, 264, 298–309.
23. Santana, A.A.; Oliveira, R.A.d.; Kurozawa, L.E.; Park, K.J. Microencapsulation of pequi pulp by spray drying: Use of modifiedstarches as encapsulating agent. Eng. Agricola 2014, 34, 980–991. [CrossRef]
24. Campos, J.C.; Ferreira, D.C.; Lima, S.; Reis, S.; Costa, P.J. Swellable polymeric particles for the local delivery of budesonide in oralmucositis. Int. J. Pharm. 2019, 566, 126–140. [CrossRef]
25. Nagarwal, R.C.; Kumar, R.; Pandit, J.K. Chitosan coated sodium alginate–chitosan nanoparticles loaded with 5-FU for oculardelivery: In vitro characterization and in vivo study in rabbit eye. Eur. J. Pharm. Sci. 2012, 47, 678–685. [CrossRef] [PubMed]
26. Boidya, J.; Hasan, I.; Reza, M.S. Carvedilol Matrix Tablet: Formulation and In Vitro Assessment. Bangladesh Pharm. J. 2020, 23,26–31. [CrossRef]
27. Arisoy, S.; Comoglu, T. Kinetic evaluation of L-Dopa loaded WGA-grafted nanoparticles. Med. Sci. 2020, 9, 385–388. [CrossRef]28. Minisy, I.M.; Salahuddin, N.A.; Ayad, M.M. In vitro release study of ketoprofen-loaded chitosan/polyaniline nanofibers. Polym.
Bull. 2020, 78, 5609–5622. [CrossRef]29. Costa, P.; Lobo, J.M.S. Modeling and comparison of dissolution profiles. Eur. J. Pharm. Sci. 2001, 13, 123–133. [CrossRef]30. Costa, A.L.d.O.; Enéas, P.C.R.; Miranda, T.A.; mingoti, S.A.; Soares, C.D.V.; Pianetti, G.A. In vitro dissolution kinetic for
mycophenolic acid derivatives tablets. Braz. J. Pharm. Sci. 2013, 49, 311–319. [CrossRef]31. Permanadewi, I.; Kumoro, A.; Wardhani, D.; Aryanti, N. Modelling of controlled drug release in gastrointestinal tract simulation.
J. Phys. Conf. Ser. 2019, 1295, 012063. [CrossRef]32. Rehman, Q.; Akash, M.S.H.; Rasool, M.F.; Rehman, K. Role of Kinetic Models in Drug Stability. In Drug Stability and Chemical
Kinetics; Akash, M.S.H., Rehman, K., Eds.; Springer: Singapore, 2020; pp. 155–165.33. Paarakh, M.P.; Jose, P.A.; Setty, C.; Christoper, G.P. Release kinetics–concepts and applications. Int. J. Pharm. Res. Technol 2018, 8,
12–20.34. Cojocaru, V.; Ranetti, A.E.; Hinescu, L.G.; Ionescu, M.; Cosmescu, C.; Pos, toarcă, A.G.; Cinteză, L.O. Formulation and evaluation
of in vitro release kinetics of Na3CaDTPA decorporation agent embedded in microemulsion-based gel formulation for topicaldelivery. Farmacia 2015, 63, 656–664.
35. Knight, C.J.; Hub, J.S. MemGen: A general web server for the setup of lipid membrane simulation systems. Bioinformatics 2015,31, 2897–2899. [CrossRef]
36. Scordino, M.; Di Mauro, A.; Passerini, A.; Maccarone, E. Selective recovery of anthocyanins and hydroxycinnamates from abyproduct of citrus processing. J. Agric. Food Chem. 2005, 53, 651–658. [CrossRef]
37. Mahato, N.; Sinha, M.; Sharma, K.; Koteswararao, R.; Cho, M.H. Modern extraction and purification techniques for obtaininghigh purity food-grade bioactive compounds and value-added co-products from citrus wastes. Foods 2019, 8, 523. [CrossRef][PubMed]
38. Fujiwara, Y.; Takaki, A.; Uehara, Y.; Ikeda, T.; Okawa, M.; Yamauchi, K.; Ono, M.; Yoshimitsu, H.; Nohara, T. Tomato steroidalalkaloid glycosides, esculeosides A and B, from ripe fruits. Tetrahedron 2004, 60, 4915–4920. [CrossRef]
39. Jovanovic, A.A.; Levic, S.M.; Pavlovic, V.B.; Markovic, S.B.; Pjanovic, R.V.; Ðordevic, V.B.; Nedovic, V.; Bugarski, B.M. Freezevs. Spray Drying for Dry Wild Thyme (Thymus serpyllum L.) Extract Formulations: The Impact of Gelatin as a Coating Material.Molecules 2021, 26, 3933. [CrossRef] [PubMed]
40. Tontul, I.; Topuz, A. Spray-drying of fruit and vegetable juices: Effect of drying conditions on the product yield and physicalproperties. Trends Food Sci Technol. 2017, 63, 91–102. [CrossRef]
41. Ferreira, N.G.; Pereira Martin, L.G.; Matta Fakhouri, F.; Oliveira, A.d.R. Microencapsulation of blackberry pulp with arrowrootstarch and gum arabic mixture by spray drying. J. Microencapsul. 2018, 35, 482–493. [CrossRef]
42. Wang, Y.; Xie, Y.; Xu, D.; Lin, X.; Feng, Y.; Hong, Y. Hydroxypropyl methylcellulose reduces particle adhesion and improvesrecovery of herbal extracts during spray drying of Chinese herbal medicines. Dry. Technol. 2014, 32, 557–566. [CrossRef]
43. Huang, Z.; Brennan, C.S.; Zhao, H.; Liu, J.; Guan, W.; Mohan, M.S.; Stipkovits, L.; Zheng, H.; Kulasiri, D. Fabrication andassessment of milk phospholipid-complexed antioxidant phytosomes with vitamin C and E: A comparison with liposomes. FoodChem. 2020, 324, 126837. [CrossRef]
44. Gharsallaoui, A.; Roudaut, G.; Chambin, O.; Voilley, A.; Saurel, R. Applications of spray-drying in microencapsulation of foodingredients: An overview. Food Res. Int. 2007, 40, 1107–1121. [CrossRef]
45. Roccia, P.; Martínez, M.L.; Llabot, J.M.; Ribotta, P.D. Influence of spray-drying operating conditions on sunflower oil powderqualities. Powder Technol. 2014, 254, 307–313. [CrossRef]
46. Hou, Z.; Li, Y.; Huang, Y.; Zhou, C.; Lin, J.; Wang, Y.; Cui, F.; Zhou, S.; Jia, M.; Ye, S. Phytosomes loaded with mitomycin C-soybeanphosphatidylcholine complex developed for drug delivery. Mol. Pharm. 2013, 10, 90–101. [CrossRef]
47. Zhang, J.; Tang, Q.; Xu, X.; Li, N. Development and evaluation of a novel phytosome-loaded chitosan microsphere system forcurcumin delivery. Int. J. Pharm. 2013, 448, 168–174. [CrossRef]
48. Minaei, A.; Sabzichi, M.; Ramezani, F.; Hamishehkar, H.; Samadi, N. Co-delivery with nano-quercetin enhances doxorubicin-mediated cytotoxicity against MCF-7 cells. Mol. Biol. Rep. 2016, 43, 99–105. [CrossRef]
49. Nazari, M.; Ghanbarzadeh, B.; Kafil, H.S.; Zeinali, M.; Hamishehkar, H. Garlic essential oil nanophytosomes as a natural foodpreservative: Its application in yogurt as food model. Colloids Interface Sci. Commun. 2019, 30, 100176. [CrossRef]

Pharmaceutics 2022, 14, 112 30 of 30
50. Chanamai, R.; McClements, D. Comparison of gum arabic, modified starch, and whey protein isolate as emulsifiers: Influence ofpH, CaCl2 and temperature. J. Food Sci. 2002, 67, 120–125. [CrossRef]
51. Ansari, F.; Sobhani, A.; Salavati-Niasari, M. Simple sol-gel synthesis and characterization of new CoTiO3/CoFe2O4 nanocompositeby using liquid glucose, maltose and starch as fuel, capping and reducing agents. J. Colloid Interface Sci. 2018, 514, 723–732.[CrossRef] [PubMed]
52. Papoutsis, K.; Golding, J.B.; Vuong, Q.; Pristijono, P.; Stathopoulos, C.E.; Scarlett, C.J.; Bowyer, M. Encapsulation of citrus by-product extracts by spray-drying and freeze-drying using combinations of maltodextrin with soybean protein and ι-Carrageenan.Foods 2018, 7, 115. [CrossRef] [PubMed]
53. Gangurde, A.B.; Ali, M.T.; Pawar, J.N.; Amin, P.D. Encapsulation of vitamin E acetate to convert oil to powder microcapsule usingdifferent starch derivatives. J. Pharm. Investig. 2017, 47, 559–574. [CrossRef]
54. Cortes, U.A.B.; Gutiérrez, M.C.; Mendoza, D.G.; Salitre, L.G.; Vargas, A.S.; Catzim, C.E.A.; Durán, C.C.; Valenzuela, B.E.L.Microencapsulation and antimicrobial activity of extract acetone-methanol of Hibiscus sabdariffa L. using a blend modified starchand pectin as a wall material. Ind. Crops Prod. 2021, 170, 113725. [CrossRef]
55. Clogston, J.D.; Patri, A.K. Zeta potential measurement. In Characterization of Nanoparticles Intended for Drug Delivery; Scott, E.M.,Ed.; Humana Press: Totowa, NJ, USA, 2011; Volume 697, pp. 63–70.
56. Bhattacharjee, S. DLS and zeta potential-what they are and what they are not? J. Control. Release 2016, 235, 337–351. [CrossRef]57. Tang, Q.; Cao, B.; Wu, H.; Cheng, G. Cholesterol-peptide hybrids to form liposome-like vesicles for gene delivery. PLoS ONE
2013, 8, e54460. [CrossRef]58. Amit, P.; Tanwar, Y.; Rakesh, S.; Poojan, P. Phytosome: Phytolipid drug delivery system for improving bioavailability of herbal
drug. J. Pharm. Sci. Biosci. Res. 2013, 3, 51–57.59. Hindarto, C.K.; Surini, S.; Saputri, F.C.; Irawan, C. In vivo evaluation of luteolin-loaded phytosome. J. Pharm. Innov. 2017, 6,
347–349.60. Ramteke, K.H.; Dighe, P.A.; Kharat, A.R.; Patil, S.V. Mathematical models of drug dissolution: A review. Sch. Acad. J. Pharm. 2014,
3, 388–396.61. Siepmann, J.; Peppas, N.A. Higuchi equation: Derivation, applications, use and misuse. Int. J. Pharm. 2011, 418, 6–12. [CrossRef]
[PubMed]62. Varga, N.; Turcsányi, Á.; Hornok, V.; Csapó, E. Vitamin E-loaded PLA-and PLGA-based core-shell nanoparticles: Synthesis,
structure optimization and controlled drug release. Pharmaceutics 2019, 11, 357. [CrossRef] [PubMed]63. Hamedi, S.; Koosha, M. Designing a pH-responsive drug delivery system for the release of black-carrot anthocyanins loaded in
halloysite nanotubes for cancer treatment. Appl. Clay Sci. 2020, 197, 105770. [CrossRef]64. Choudhary, M.I.; Shaikh, M.; tul-Wahab, A.; ur-Rahman, A. In silico identification of potential inhibitors of key SARS-CoV-2 3CL
hydrolase (Mpro) via molecular docking, mmGBSA predictive binding energy calculations, and molecular dynamics simulation.PLoS ONE 2020, 15, e0235030. [CrossRef] [PubMed]
65. Pruchnik, H.; Bonarska-Kujawa, D.; Kleszczynska, H. Effect of chlorogenic acid on the phase transition in phospholipid andphospholipid/cholesterol membranes. J. Therm. Anal. Calorim. 2014, 118, 943–950. [CrossRef]
66. Cordeiro, R.M. Reactive oxygen and nitrogen species at phospholipid bilayers: Peroxynitrous acid and its homolysis products. J.Phys. Chem. B. 2018, 122, 8211–8219. [CrossRef] [PubMed]