Formulation and Evaluation of Self-Nanoemulsifying Drug ...
24
Citation: Nair, A.B.; Singh, B.; Shah, J.; Jacob, S.; Aldhubiab, B.; Sreeharsha, N.; Morsy, M.A.; Venugopala, K.N.; Attimarad, M.; Shinu, P. Formulation and Evaluation of Self-Nanoemulsifying Drug Delivery System Derived Tablet Containing Sertraline. Pharmaceutics 2022, 14, 336. https://doi.org/ 10.3390/pharmaceutics14020336 Academic Editors: Vitaliy Khutoryanskiy and Hisham Al-Obaidi Received: 27 December 2021 Accepted: 29 January 2022 Published: 31 January 2022 Publisher’s Note: MDPI stays neutral with regard to jurisdictional claims in published maps and institutional affil- iations. Copyright: © 2022 by the authors. Licensee MDPI, Basel, Switzerland. This article is an open access article distributed under the terms and conditions of the Creative Commons Attribution (CC BY) license (https:// creativecommons.org/licenses/by/ 4.0/). pharmaceutics Article Formulation and Evaluation of Self-Nanoemulsifying Drug Delivery System Derived Tablet Containing Sertraline Anroop B. Nair 1, * , Bhavna Singh 2 , Jigar Shah 2, * , Shery Jacob 3 , Bandar Aldhubiab 1 , Nagaraja Sreeharsha 1,4 , Mohamed A. Morsy 1,5 , Katharigatta N. Venugopala 1,6 , Mahesh Attimarad 1 and Pottathil Shinu 7 1 Department of Pharmaceutical Sciences, College of Clinical Pharmacy, King Faisal University, Al-Ahsa 31982, Saudi Arabia; [email protected] (B.A.); [email protected] (N.S.); [email protected] (M.A.M.); [email protected] (K.N.V.); [email protected] (M.A.) 2 Department of Pharmaceutics, Institute of Pharmacy, Nirma University, Ahmedabad 382481, India; [email protected] 3 Department of Pharmaceutical Sciences, College of Pharmacy, Gulf Medical University, Ajman P.O. Box 4184, United Arab Emirates; [email protected] 4 Department of Pharmaceutics, Vidya Siri College of Pharmacy, Off Sarjapura Road, Bangalore 560035, India 5 Department of Pharmacology, Faculty of Medicine, Minia University, El-Minia 61511, Egypt 6 Department of Biotechnology and Food Technology, Durban University of Technology, Durban 4000, South Africa 7 Department of Biomedical Sciences, College of Clinical Pharmacy, King Faisal University, Al-Ahsa 31982, Saudi Arabia; [email protected] * Correspondence: [email protected] (A.B.N.); [email protected] (J.S.); Tel.: +966-536219868 (A.B.N.); +91-9909007411 (J.S.) Abstract: Being a biopharmaceutics classification system class II drug, the absorption of sertraline from the gut is mainly limited by its poor aqueous solubility. The objective of this investigation was to improve the solubility of sertraline utilizing self-nanoemulsifying drug delivery systems (SNEDDS) and developing it into a tablet dosage form. Ternary phase diagrams were created to identify nanoemulsion regions by fixing oil (glycerol triacetate) and water while varying the surfactant (Tween 80) and co-surfactant (PEG 200) ratio (S mix ). A three-factor, two-level (2 3 ) full factorial design (batches F1–F8) was utilized to check the effect of independent variables on dependent variables. Selected SNEDDS (batch F4) was solidified into powder by solid carrier adsorption method and compressed into tablets. The SNEDDS-loaded tablets were characterized for various pharmaceutical properties, drug release and evaluated in vivo in Wistar rats. A larger isotropic region was noticed with a S mix ratio of 2:1 and the nanoemulsion exhibited good stability. Screening studies’ data established that all three independent factors influence the dependent variables. The prepared tablets displayed optimal pharmaceutical properties within acceptable limits. In vitro sertraline release demonstrated from solid SNEDDS was statistically significant (p < 0.0001) as compared to pure sertraline. Differential Scanning Calorimetry and X-Ray Diffraction data established the amorphous state of the drug in SNEDDS formulation, while FTIR spectra indicate the compatibility of excipients and drug. Pharmacokinetic evaluation of the SNEDDS tablet demonstrated significant increment (p < 0.0001) in AUC 0- α (~5-folds), C max (~4-folds), and relative bioavailability (386%) as compared to sertraline suspension. The current study concludes that the solid SNEDDS formulation could be a practicable and effective strategy for oral therapy of sertraline. Keywords: self-nanoemulsifying tablets; nanoemulsion; full factorial design; sertraline; pharmacokinetics; bioavailability 1. Introduction In the pharmaceutical product development field, there exist a wide variety of drug substances including potential drug candidates which are often limited by poor aqueous sol- Pharmaceutics 2022, 14, 336. https://doi.org/10.3390/pharmaceutics14020336 https://www.mdpi.com/journal/pharmaceutics
-
Upload
khangminh22 -
Category
Documents
-
view
1 -
download
0
Transcript of Formulation and Evaluation of Self-Nanoemulsifying Drug ...
�����������������
Citation: Nair, A.B.; Singh, B.;
Shah, J.; Jacob, S.; Aldhubiab, B.;
Sreeharsha, N.; Morsy, M.A.;
Venugopala, K.N.; Attimarad, M.;
Shinu, P. Formulation and Evaluation
of Self-Nanoemulsifying Drug
Delivery System Derived Tablet
Containing Sertraline. Pharmaceutics
2022, 14, 336. https://doi.org/
10.3390/pharmaceutics14020336
Academic Editors:
Vitaliy Khutoryanskiy and
Hisham Al-Obaidi
Received: 27 December 2021
Accepted: 29 January 2022
Published: 31 January 2022
Publisher’s Note: MDPI stays neutral
with regard to jurisdictional claims in
published maps and institutional affil-
iations.
Copyright: © 2022 by the authors.
Licensee MDPI, Basel, Switzerland.
This article is an open access article
distributed under the terms and
conditions of the Creative Commons
Attribution (CC BY) license (https://
creativecommons.org/licenses/by/
4.0/).
pharmaceutics
Article
Formulation and Evaluation of Self-Nanoemulsifying DrugDelivery System Derived Tablet Containing SertralineAnroop B. Nair 1,* , Bhavna Singh 2, Jigar Shah 2,* , Shery Jacob 3 , Bandar Aldhubiab 1 ,Nagaraja Sreeharsha 1,4 , Mohamed A. Morsy 1,5 , Katharigatta N. Venugopala 1,6 , Mahesh Attimarad 1
and Pottathil Shinu 7
1 Department of Pharmaceutical Sciences, College of Clinical Pharmacy, King Faisal University,Al-Ahsa 31982, Saudi Arabia; [email protected] (B.A.); [email protected] (N.S.);[email protected] (M.A.M.); [email protected] (K.N.V.); [email protected] (M.A.)
2 Department of Pharmaceutics, Institute of Pharmacy, Nirma University, Ahmedabad 382481, India;[email protected]
3 Department of Pharmaceutical Sciences, College of Pharmacy, Gulf Medical University,Ajman P.O. Box 4184, United Arab Emirates; [email protected]
4 Department of Pharmaceutics, Vidya Siri College of Pharmacy, Off Sarjapura Road, Bangalore 560035, India5 Department of Pharmacology, Faculty of Medicine, Minia University, El-Minia 61511, Egypt6 Department of Biotechnology and Food Technology, Durban University of Technology,
Durban 4000, South Africa7 Department of Biomedical Sciences, College of Clinical Pharmacy, King Faisal University,
Al-Ahsa 31982, Saudi Arabia; [email protected]* Correspondence: [email protected] (A.B.N.); [email protected] (J.S.); Tel.: +966-536219868 (A.B.N.);
+91-9909007411 (J.S.)
Abstract: Being a biopharmaceutics classification system class II drug, the absorption of sertralinefrom the gut is mainly limited by its poor aqueous solubility. The objective of this investigationwas to improve the solubility of sertraline utilizing self-nanoemulsifying drug delivery systems(SNEDDS) and developing it into a tablet dosage form. Ternary phase diagrams were created toidentify nanoemulsion regions by fixing oil (glycerol triacetate) and water while varying the surfactant(Tween 80) and co-surfactant (PEG 200) ratio (Smix). A three-factor, two-level (23) full factorial design(batches F1–F8) was utilized to check the effect of independent variables on dependent variables.Selected SNEDDS (batch F4) was solidified into powder by solid carrier adsorption method andcompressed into tablets. The SNEDDS-loaded tablets were characterized for various pharmaceuticalproperties, drug release and evaluated in vivo in Wistar rats. A larger isotropic region was noticedwith a Smix ratio of 2:1 and the nanoemulsion exhibited good stability. Screening studies’ dataestablished that all three independent factors influence the dependent variables. The prepared tabletsdisplayed optimal pharmaceutical properties within acceptable limits. In vitro sertraline releasedemonstrated from solid SNEDDS was statistically significant (p < 0.0001) as compared to puresertraline. Differential Scanning Calorimetry and X-Ray Diffraction data established the amorphousstate of the drug in SNEDDS formulation, while FTIR spectra indicate the compatibility of excipientsand drug. Pharmacokinetic evaluation of the SNEDDS tablet demonstrated significant increment(p < 0.0001) in AUC0-α (~5-folds), Cmax (~4-folds), and relative bioavailability (386%) as compared tosertraline suspension. The current study concludes that the solid SNEDDS formulation could be apracticable and effective strategy for oral therapy of sertraline.
Keywords: self-nanoemulsifying tablets; nanoemulsion; full factorial design; sertraline; pharmacokinetics;bioavailability
1. Introduction
In the pharmaceutical product development field, there exist a wide variety of drugsubstances including potential drug candidates which are often limited by poor aqueous sol-
Pharmaceutics 2022, 14, 336. https://doi.org/10.3390/pharmaceutics14020336 https://www.mdpi.com/journal/pharmaceutics
Pharmaceutics 2022, 14, 336 2 of 24
ubility, despite their high therapeutic efficacy. Thus, achieving desired drug concentrationat the target site is a major challenge typically faced by the formulation and develop-ment scientists. Sertraline, a selective serotonin reuptake inhibitor, is currently used as ananti-depressant, belongs to biopharmaceutics classification system (BCS) class II, has pooraqueous solubility (3.5 mg/L), high lipophilicity (log P 5.1), and low oral bioavailability ofapproximately 44% [1,2]. Administration of drugs through the oral route is most favoredover other modes of drug delivery chiefly due to convenience of self-administration, safety,pain avoidance, high patient compliance, low cost, and flexibility in accommodating differ-ent types of drugs [3]. Sertraline is gradually absorbed after oral administration howevercoadministration with food was shown to increase maximum plasma drug concentration(Cmax) by nearly 25% and decrease time to reach peak concentration (Tmax). Moreover,sertraline undergoes extensive hepatic biotransformation via oxidative and glucuronidationpathways [4].
Various approaches like solid dispersion [5], micronization [6], pH modification [7],crystal modification [8], and self-emulsifying drug delivery systems [9] have been evaluatedfor enhancing the low solubility and dissolution rate of hydrophobic drugs. Modificationof physicochemical properties using typical approaches such as salt formation has inherentdemerits. Therefore, the probable reason for the low bioavailability of hydrochloride saltmight be due to its conversion to a less soluble freebase which further leads to the formationof aggregates in the gastrointestinal tract, thereby hindering the oral absorption of the drug.Few attempts have been carried out to improve the therapeutic efficacy of sertraline byformulating it into solid lipid nanoparticles [10] as well as loading it into inorganic microand mesoporous materials [11]. Alternatively, the transdermal delivery approach has alsobeen investigated [12,13].
Lipid-based preparations such as self-emulsifying drug delivery system (SEDDS),self-microemulsifying drug delivery system, and self-nanoemulsifying drug delivery sys-tem (SNEDDS) have been largely explored in many studies to augment the bioavailabilityof highly lipophilic drugs [14–17]. The SNEDDS encompasses isotropic mixtures of oil,surfactants along with one or more hydrophilic co-solvents or co-surfactants [18]. These na-noemulsion preconcentrates or anhydrous nanoemulsion systems instantaneously emulsify,when dispersed in an aqueous medium under mild agitation to form o/w nanoemulsionwith globule size < 100 nm [19]. The spontaneous emulsification process eventually re-duces particle size, maximizing surface area hence resulting in enhancement of solubility,dissolution, and bioavailability. Furthermore, these lipid formulations in a liquid state canbe readily converted into solid-state powder, granules, beads, and pellets by adsorbing ona solid carrier thereby enabling them to develop as unit dosage forms suitable for peroraladministration [20]. The major benefits of conversion to solid dosage forms are high doseprecision, lowest variability, portability, stable and accurate dosing. Solidification of liquidSNEDDS (L-SNEDDS) provides additional benefits such as good thermodynamic stabilitythereby preventing supersaturation of drug [21]. On the other hand, the nanoemulsionsare thermodynamically unstable colloidal systems susceptible to time-bound physicalstability problems similar to coarse emulsions viz., creaming, coalescence, and phase break-ing [22]. The stability of nanoemulsions is also influenced by the temperature as well aspH [23]. It was reported that the chemical properties of various additives included in theformulation can potentially influence the stability as well as in vitro release profile of thenanoemulsions [24].
In SNEDDS, suitable excipients such as oil, surfactant, and co-surfactant are chosenbased on their ability to form nanoemulsion spontaneously in the gastrointestinal envi-ronment after oral administration [25,26]. Moreover, in situ solubilized drugs formed inthe lumen of the GIT can be subsequently absorbed via the lymphatic system evadingthe hepatic first-pass metabolism [27]. Adsorbing the L-SNEDDS in a suitable carrier canpotentially convert the encapsulated drug molecule from crystalline to an amorphous stateand hence an increase in the aqueous solubility of the drug [28]. In contrast to other studies,the primary objective of the research was to conduct systematic and thorough investiga-
Pharmaceutics 2022, 14, 336 3 of 24
tions to examine the practical feasibility of SNEDDS to improve the oral bioavailabilityof sertraline. The liquid SNEDDS was later modified to solid SNEDDS (S-SNEDDS) andpatient-friendly tablet dosage form based on a full-factorial statistical design of experimenttechnique for future clinical application via oral therapy. This novel methodology hasthe prospect of potential industrial scale-up due to the generation of flowable, coherent,and compactable powdered form, fewer manufacturing steps, and equipment, generallyregarded as safe (GRAS) approved excipients, avoidance of organic solvents, and thereforeless production expense. In addition, in vivo evaluation of selected formulation was stud-ied in Wistar rats, and to assess the relative bioavailability, pharmacokinetic parameterswere compared with pure sertraline.
2. Materials and Methods2.1. Materials
Sertraline hydrochloride, polyvinylpyrrolidone K30, microcrystalline cellulose,croscarmellose sodium (Ac-Di-Sol®) were procured from Torrent Pharmaceuticals, Gandhi-nagar, India. Kollidon® VA 64 and Solutol HS 15 were received from BASF, Ludwigshafen,Germany. The β-cyclodextrin, castor oil, corn seed oil, crospovidone, glycerol monooleate,isopropyl myristate, L-hydroxypropyl cellulose, magnesium stearate, oleic acid, poloxamer188, polyethylene glycol 200 (PEG 200), polyethylene glycol 400 (PEG 400), propylene glycol,sodium starch glycolate, sorbitan monolaurate (Span 20), sorbitan monoleate (Span 80), sun-flower oil, and talc were commercially acquired from Central Drug House, Mumbai, India.Glycerol triacetate was purchased from HiMedia, Mumbai, India. LabrafacTM WL 1349and Labrasol® were donated by Gattefosse, Saint-Priest Cedex, France. Lemon oil, orangeoil, and coconut oil were procured from Astron Chemicals, Ahmedabad, India. Capryol®
90 and Cremophor® EL were donated by Piramal Healthcare, Mumbai, India. Soyabean oil,Tween 40, and Tween 80 were obtained from Chemdyes Corporation, Vadodara, India.
2.2. Quantification of Sertraline
Analysis of sertraline from various samples was carried out by minor modification ofthe previously reported high-performance liquid chromatography (HPLC) method [29].The system is comprised of the Shimadzu Prominence HPLC (DGU-20A5, Tokyo, Japan)attached with a monolithic C18 HPLC column (Zorbax, 150 mm × 4.6 mm). The quantifica-tion of the analyte was carried out by connecting to a fluorescence detector maintained atan excitation wavelength of 260 nm and emission at 310 nm. The extraction of sertralineand subsequent analysis was performed using a solvent mixture constituted of acetonitrileand water (80:20% v/v) maintained at a flow of 1 mL/min. The volume of injection wasset at 50 µL, and the retention time was noticed at 12.2 min. Linear regression analysisdemonstrates acceptable linearity between the sertraline concentration of 5–500 ng/mL(r2 = 0.9992). The method was validated as per ICH Q2 guidelines [30], which demon-strated the limit of quantification (LOQ) and the limit of detection (LOD) as 7.90 ng/mL and3.60 ng/mL, respectively. The coefficient of variation was estimated between 1.26–4.84%and the recovery of sertraline from plasma was found to be 96.35 ± 1.3%.
2.3. Liquid Self-Nanoemulsifying Drug Delivery System (L-SNEDDS)2.3.1. Preliminary Studies for Components of L-SNEDDS
The solubility of sertraline in various oils (Capryol 90®, castor oil, coconut oil, cornseed oil, glycerol triacetate, isopropyl myristate, Labrafac™ WL 1349, lemon oil, oleicacid, olive oil, orange oil, soyabean oil, and sunflower oil), surfactants (Cremophor® EL,Labrasol®, solutol HS 15, Span 20, 80, Tween 40 and 80), and co-surfactants (glycerolmonooleate, PEG 200, PEG 400, propylene glycol) was estimated by equilibrium solubilitymethod. To experiment, an extra quantity of the drug was placed in vials holding 2 mLof each of the excipients. The vials were shaken using an orbital shaker at 40 rpm at37 ± 0.2 ◦C for 72 h. After 72 h, the vials were centrifuged at 4000 rpm for 10 min, filtered,suitably diluted with methanol, and analyzed by HPLC.

Pharmaceutics 2022, 14, 336 4 of 24
2.3.2. Creation of Ternary Phase Diagram
A ternary phase diagram was drawn using the titration method as mentioned else-where [31]. The physical characteristics of the nanoemulsion were noted on the individualaxis of the phase diagram depicting percentage water, oil, and Smix at fixed weight ratios,respectively. To experiment, different ratios (1:1, 1:2, 1:3, 2:1, 3:1, 4:1) of Smix combinationswere prepared. A set of oil/water mixtures were prepared at all possible ratios (9:1, 8:2,7:3, 6:4, 5:5, 4:6, 3:7, 2:8, 1:9) and titrated with Smix in 5% increment up to 100% to establishthe nanoemulsion region. The total volume of Smix consumed was expressed as % v/v andphase diagrams were created using Chemix School software (version 3.60, Bergen, Norway)to obtain the nanoemulsion region.
2.4. Thermodynamic Stability and Dispersibility Studies of L-SNEDDS Preparations
Thermodynamic stability studies were performed based on centrifugation test (5000 rpmfor 30 min), heating-cooling cycle (45 ◦C and at 0 ◦C for 48 h), and freeze-thaw cycle (−21 ◦Cand 21 ◦C for 24 h) [32]. The lack of phase separation indicates the stability of the prepara-tion. Dispersibility test which demonstrates the efficiency of self-emulsification tendency ofSNEDDS was evaluated using a USP dissolution type II apparatus (Paddle), where 1 mL ofSNEDDS was separately added to distilled water or 0.1 N HCl (500 mL) kept at 37 ± 0.5 ◦Cand paddle rotated at 50 rpm [33]. In vitro behavior of the preparations was visually checkedbased on the following grading system [34]: (A) Spontaneous formation (<1 min) of na-noemulsion with a transparent or slight bluish look; (B) Spontaneously forming with lowtransparent microemulsion, with a bluish color; (C) Formation of milky emulsion (<2 min;(D) Dull, greyish white emulsion with somewhat oily appearance (>2 min); and (E), Formu-lation with low emulsification but had big oil globules appearing on top.
2.5. Screening of Formulations by Full Factorial Design
Based on the results of the ternary phase diagram and preliminary studies like screen-ing of components, thermodynamic stability, and dispersibility studies, the independentvariables with their effective concentration were identified. From the suitable statisticalexperimental designs, the full factorial design was selected. The L-SNEDDS were preparedbased on the statistical design of the experiment applying a three-factor, two levels (23) fullfactorial design (FFD) using Design-Expert software (Stat-Ease, Version 12, Minneapolis,USA) by selecting the amount (milligram) of glycerol triacetate (X1), Tween 80 (X2) and PEG200 (X3) as independent variables, while dissolution efficiency % (Y1), globule size in nm(Y2) and self-emulsification time (SEF) in secs (Y3) as responses and dependent variables(Table 1).
Table 1. 23 Full factorial design indicating both independent and dependent variables.
Batch No.Amount of Oil (mg) (X1) Amount of Surfactant (mg) (X2) Amount of Co-Surfactant (mg) (X3)
Coded Values Actual Values Coded Values Actual Values Coded Values Actual Values
F1 −1 100 −1 66.5 −1 33.5F2 −1 100 −1 66.5 +1 66.5F3 −1 100 +1 133.5 −1 33.5F4 −1 100 +1 133.5 +1 66.5F5 +1 200 −1 66.5 −1 33.5F6 +1 200 −1 66.5 +1 66.5F7 +1 200 +1 133.5 −1 33.5F8 +1 200 +1 133.5 +1 66.5
Responses: Y1 = % Dissolution efficiency; Y2 = Globule size (nm).
Response surface analyses were performed to find the influence of various indepen-dent factors on the observed dependent variables or responses. A set dose of sertralinehydrochloride (50 mg) was added to oil, Smix at room temperature under constant stirring ina vortex mixer to obtain a homogenous mixture. The responses were statistically analyzed
Pharmaceutics 2022, 14, 336 5 of 24
utilizing the one-way ANOVA method. The statistical differences between data displayingp < 0.05 were selected as significant. The most favorable formulation was chosen by fac-torial design, which shows maximum % dissolution efficiency, low globule size, and lessself-emulsification time. To evaluate the authenticity of the created mathematical model,the validation of the model was evaluated by checkpoint batch. For these formulations,all the three dependent variables (Y1–Y3) were evaluated as per established mathematicalmodels and experimental techniques.
2.6. Characterization of Designed Batches of L-SNEDDS2.6.1. Determination of Dissolution Efficiency
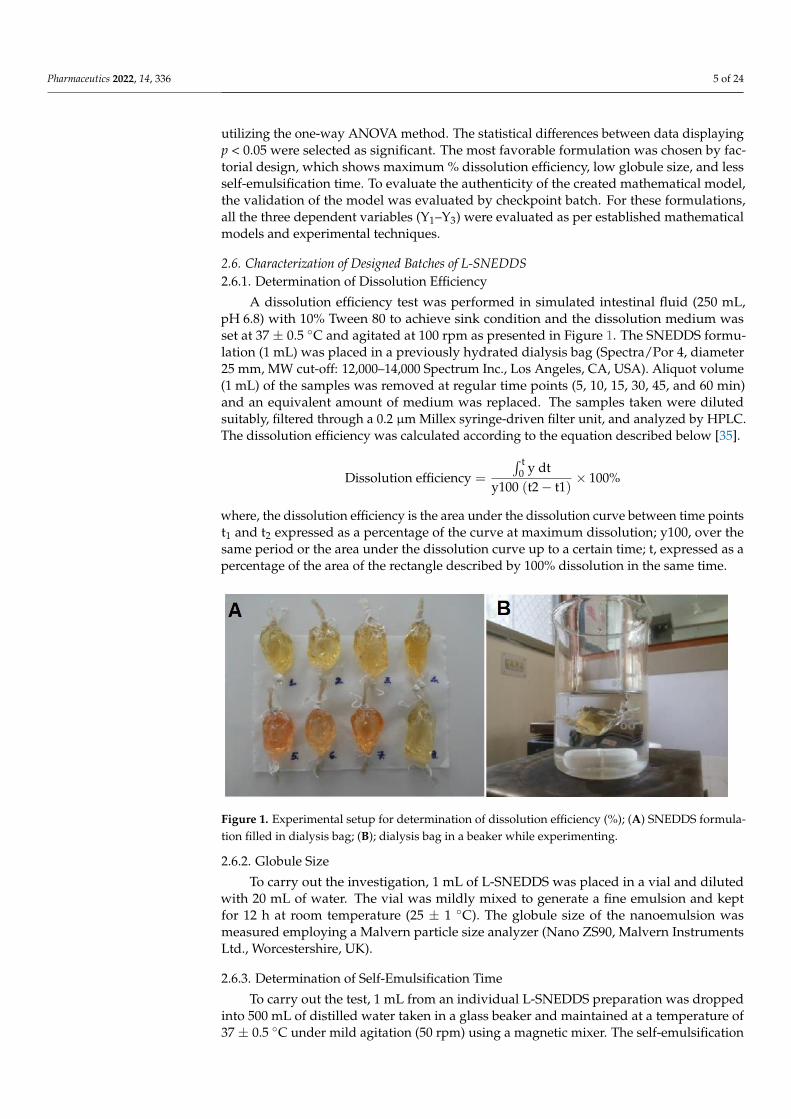
A dissolution efficiency test was performed in simulated intestinal fluid (250 mL,pH 6.8) with 10% Tween 80 to achieve sink condition and the dissolution medium wasset at 37 ± 0.5 ◦C and agitated at 100 rpm as presented in Figure 1. The SNEDDS formu-lation (1 mL) was placed in a previously hydrated dialysis bag (Spectra/Por 4, diameter25 mm, MW cut-off: 12,000–14,000 Spectrum Inc., Los Angeles, CA, USA). Aliquot volume(1 mL) of the samples was removed at regular time points (5, 10, 15, 30, 45, and 60 min)and an equivalent amount of medium was replaced. The samples taken were dilutedsuitably, filtered through a 0.2 µm Millex syringe-driven filter unit, and analyzed by HPLC.The dissolution efficiency was calculated according to the equation described below [35].
Dissolution efficiency =
∫ t0 y dt
y100 (t2 − t1)× 100%
where, the dissolution efficiency is the area under the dissolution curve between time pointst1 and t2 expressed as a percentage of the curve at maximum dissolution; y100, over thesame period or the area under the dissolution curve up to a certain time; t, expressed as apercentage of the area of the rectangle described by 100% dissolution in the same time.
Figure 1. Experimental setup for determination of dissolution efficiency (%); (A) SNEDDS formula-tion filled in dialysis bag; (B); dialysis bag in a beaker while experimenting.
2.6.2. Globule Size
To carry out the investigation, 1 mL of L-SNEDDS was placed in a vial and dilutedwith 20 mL of water. The vial was mildly mixed to generate a fine emulsion and keptfor 12 h at room temperature (25 ± 1 ◦C). The globule size of the nanoemulsion wasmeasured employing a Malvern particle size analyzer (Nano ZS90, Malvern InstrumentsLtd., Worcestershire, UK).
2.6.3. Determination of Self-Emulsification Time
To carry out the test, 1 mL from an individual L-SNEDDS preparation was droppedinto 500 mL of distilled water taken in a glass beaker and maintained at a temperature of37 ± 0.5 ◦C under mild agitation (50 rpm) using a magnetic mixer. The self-emulsification
Pharmaceutics 2022, 14, 336 6 of 24
process was visually checked and recorded for the rate of emulsification and subsequentformation of nanoemulsion.
2.6.4. Determination of Viscosity, Zeta Potential, Percentage Transmittance
The viscosity of the undiluted batch (F4) nanoemulsion (0.25 g) was measured us-ing a Brookfield viscometer (LVDVI prime, Middleborough, USA) at room temperature.The zeta potential, as well as polydispersity index, were measured employing a Malvernparticle size analyzer (Nano ZS90, Malvern Instruments Ltd., Malvern, Worcestershire,UK). The optical clarity of the emulsion upon dilution was measured as percentage trans-mittance against double distilled as blank using UV-spectrophotometer (model UV-1800,Shimadzu Corporation, Kyoto, Japan) at 500 nm [36].
2.7. Solidification of L-SNEDDS
Solidification of selected L-SNEDDS (Batch F4) was done by the solid carrier adsorp-tion method. Briefly, 20 g of L-SNEDDS formulation was blended with 24 g of microcrys-talline cellulose to obtain a wet mixture. Later, 6 g of Aerosil 200 was added to the wetmixture and mixed to obtain S-SNEDDS.
Flowability and Compressibility
The flow property of S-SNEDDS was estimated by the conventional static angle ofrepose (θ) method using Flodex apparatus (Erweka, Heusenstamm, Germany) according tothe standard formulae [37]. Similarly, percentage compressibility (Carr’s index) of powderwas determined utilizing tap density apparatus (Labindia, Mumbai, India) accordingto the formulae mentioned in other studies [38]. The flowability of the powder was alsointerpreted with Hausner’s ratio using the standard equation: Tapped density/bulk density.
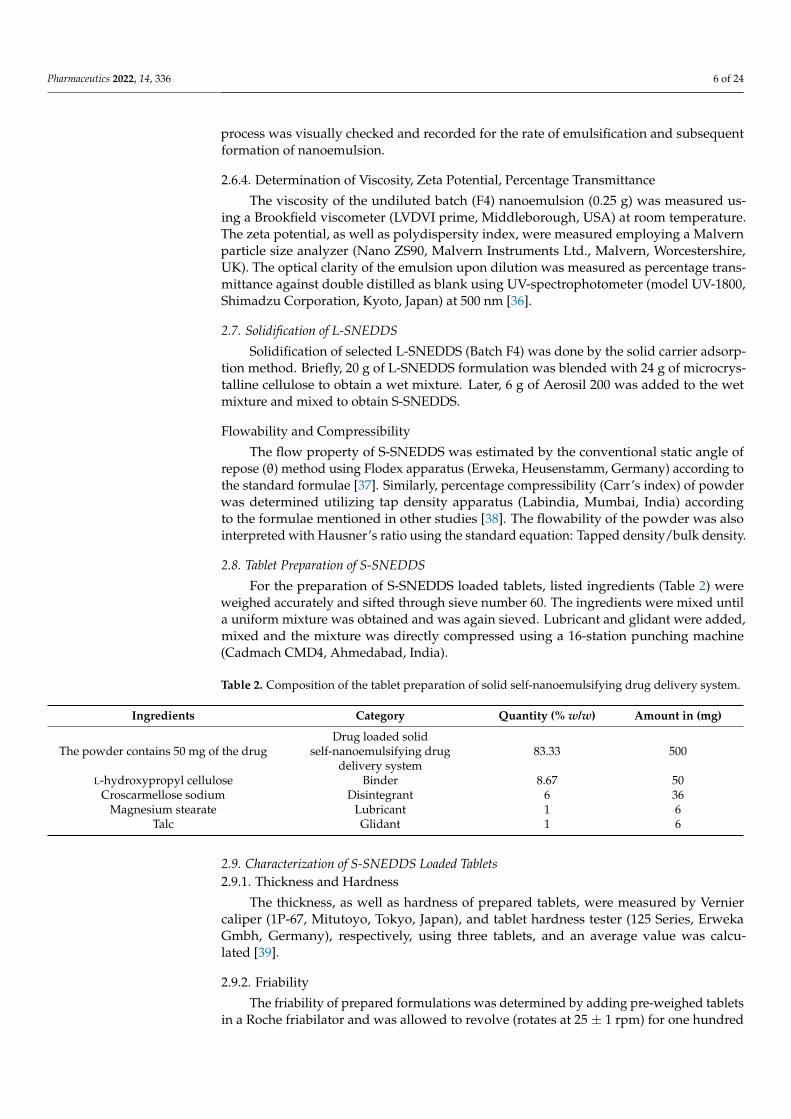
2.8. Tablet Preparation of S-SNEDDS
For the preparation of S-SNEDDS loaded tablets, listed ingredients (Table 2) wereweighed accurately and sifted through sieve number 60. The ingredients were mixed untila uniform mixture was obtained and was again sieved. Lubricant and glidant were added,mixed and the mixture was directly compressed using a 16-station punching machine(Cadmach CMD4, Ahmedabad, India).
Table 2. Composition of the tablet preparation of solid self-nanoemulsifying drug delivery system.
Ingredients Category Quantity (% w/w) Amount in (mg)
The powder contains 50 mg of the drugDrug loaded solid
self-nanoemulsifying drugdelivery system
83.33 500
L-hydroxypropyl cellulose Binder 8.67 50Croscarmellose sodium Disintegrant 6 36
Magnesium stearate Lubricant 1 6Talc Glidant 1 6
2.9. Characterization of S-SNEDDS Loaded Tablets2.9.1. Thickness and Hardness
The thickness, as well as hardness of prepared tablets, were measured by Verniercaliper (1P-67, Mitutoyo, Tokyo, Japan), and tablet hardness tester (125 Series, ErwekaGmbh, Germany), respectively, using three tablets, and an average value was calcu-lated [39].
2.9.2. Friability
The friability of prepared formulations was determined by adding pre-weighed tabletsin a Roche friabilator and was allowed to revolve (rotates at 25 ± 1 rpm) for one hundred

Pharmaceutics 2022, 14, 336 7 of 24
times according to USP. The same tablets were weighed again after removing dust andcalculated the percentage friability [36].
2.9.3. Disintegration
The disintegration time (min) of the tablet was measured employing USP disintegra-tion test apparatus (DT 1000, Labindia, Mumbai, India) in water at 37 ± 2 ◦C. The timeat which the tablet disintegrates completely was noted down and the average time wascalculated.
2.9.4. Drug Content
To analyze the drug content, ten tablets were pulverized and the quantity of powderproportionate to 50 mg of sertraline hydrochloride was taken and dispersed in methanolby stirring for 10 min. The solution was filtered using a 0.2 µm filter and assayed by HPLC.The average percentage of drug content was estimated and compared with the total dose.
2.9.5. Drug Release
The percentage release rate of the S-SNEDDS loaded tablet and the pure drug wasestimated employing USP dissolution testing apparatus type II (Labindia, Mumbai, India)operated at 75 rpm. The dissolution test was carried out in simulated intestinal fluid(900 mL; pH 6.8) [40] with 10% Tween 80 to maintain sink condition, and the temperatureof the dissolution medium was set at 37 ± 0.5 ◦C using a thermostatically controlledwater bath. The selected formulation of sertraline L-SNEDDS, S-SNEDDS, and plain drugequivalent to 50 mg sertraline were used for the comparative evaluation of dissolution data.Aliquot volume (5 mL) of the sample was withdrawn at specified time intervals of 6, 12,15, 20, 25, 30, 35, 40, 50, and 60 min, and replacements were made with 5 mL of releasemedium. Each sample was filtered using a 0.2 µm filter and analyzed for sertraline contentby HPLC.
2.9.6. Differential Scanning Calorimetry (DSC)
DSC curves of the pure sertraline hydrochloride, microcrystalline cellulose, physicalmixture, and S-SNEDDS were obtained by employing a scanning calorimeter furnishedwith a thermal analysis data system (DSC 60 Shimadzu, Tokyo, Japan). Thermal scanningof the samples placed in hermetically sealed pans was carried out at a temperature rangingbetween 10 to 300 ◦C at a heating rate of 20 ◦C/min using a blank aluminum pan as thereference standard [41].
2.9.7. X-ray Diffraction (XRD)
Diffraction patterns exploring the physical state of the sertraline, blank S-SNEDDS,and drug-loaded S-SNEDDS were studied with the utilization of Bruker AXS D8 FocusP-XRD (Billerica, MA, USA). The drug or formulations were powdered separately andplaced in an aluminum holder. The spectral scanning was carried using CU Kα radiation ata similar voltage and current (40 mA) between the range of 2θ angles from 10–40◦, with aslow angle scan of 0.01◦/min at a sampling interval of 0.02◦/s [42].
2.9.8. Fourier Transform Infrared (FTIR)
FTIR spectra of powder samples of pure sertraline and S-SNEDDS were recordedon a Spectrum-GX FTIR spectrophotometer (Perkin Elmer, Waltham, MA, USA). Sampleswere compressed with potassium bromide (1:10 ratio) at 1 ton/cm2 to obtain the disc byemploying a hydraulic punching machine [43]. The spectral scanning was performedbetween 4000–400 cm−1.

Pharmaceutics 2022, 14, 336 8 of 24
2.9.9. Scanning Electron Microscopy (SEM)
The morphological characteristics of the powder sample were recorded using an SEM(ESEM EDAX XL-30, Philips, Eindhoven, The Netherlands). Before observation, sampleswere retained on an aluminum dock using a double-sided adhesive tape which was furthercoated with gold (~20 nm) to make it electrically conductive in a vacuum. The scanningoperation of the SEM was conducted at an acceleration voltage of 15 kV.
2.10. Oral Bioavailability Studies
The pharmacokinetic evaluation of sertraline was investigated on male albino Wistarrats (200–250 g) to assess the oral bioavailability differences between the S-SNEDDS andpure drug (control). Animals were caged individually in a well-ventilated room that wasmaintained at constant temperature (20–24 ◦C), specified photoperiod (12-h light/12-h darkcycle), and unrestricted access to food and water. Animals fasted for 12 h were classifiedinto two groups (group I and II), each consisting of six rats. Animal experiments wereperformed following the institutional ethical committee guidelines of animal care (ProtocolNo. IP/PCEU/FAC/29/2021/40; dated 18/09/2021). A dose equivalent to 5 mg/kg ofsertraline or S-SNEDDS was administered as calculated from the standard daily humandose of 50 mg utilizing the equation recommended in the literature [44]. The formulationwas prepared as a suspension in 0.5% w/v carboxymethyl cellulose and administered to ratsorally as a single dose by intragastric gavage in both groups. A blood sample (~200 µL)was drawn at predefined time points (1, 2, 4, 6, 9, 12, and 24 h) post-dosing from retro-orbital plexus of individual rat under anesthesia using isoflurane [45]. Samples werecollected in heparin pre-coated tubes and proteins were subsequently precipitated witha similar volume of acetonitrile [46]. It was then centrifuged at 12,000 rpm for 15 minand the supernatant fraction was membrane filtered (0.2 µm). The filtrate (50 µL) wasinjected into the HPLC system whilst the sample taken at zero time was considered as thebaseline value during analysis. The pharmacokinetic parameters of interest included areaunder the concentration-time curve (AUC0–t), peak concentration (Cmax), and time to reachpeak concentration (Tmax) and were determined by non-compartmental analysis describedelsewhere [45].
3. Results and Discussion3.1. Preliminary Studies for Components of L-SNEDDS
An efficient SNEDDS must spontaneously generate nanoemulsions to enhance thesolubility of the drug in the gastrointestinal fluid. Hence the selection of componentsto formulate SNEDDS is of utmost importance. The study was performed in such amanner to guarantee that the results generated from the prepared SNEDDS closely simulatethe in vivo conditions. Indeed, the most widely used excipients were selected for thedevelopment of SNEDDS that were not influenced by the alteration in pH and ionicstrength, based on the literature [47]. The solubility studies of sertraline were carried outin various oils, surfactants, and co-surfactants was estimated and the solubility profilesare depicted in Figure 2. From the screening study (Figure 2) it was observed that oil(glycerol triacetate; 55 ± 4.62 mg/mL), surfactant (Tween 80; 100.02 ± 2.88 mg/mL) andco-surfactant (PEG 200; 200 ± 58.37 mg/mL) had highest solubility of sertraline. Hence,glycerol triacetate, Tween 80, and PEG 200 were chosen as oil, surfactant, and co-surfactant,respectively.

Pharmaceutics 2022, 14, 336 9 of 24
Figure 2. Solubility profile of sertraline in various components of self-nanoemulsifying drug deliverysystem; (A) oils; (B); surfactants; (C) co-surfactants.
3.2. Construction of Ternary Phase Diagram
Nanoemulsion is considered as the isotropic region in the phase diagram whereintransparent and fluid formulations were formed and established through visual observa-tion. The formulation was primarily assessed by evaluating the nanoemulsion regionsusing pseudo ternary diagrams. It is known that the crucial factor associated with thenanoemulsion formulation is the selection of the type and mass ratio of the surfactant/co-surfactant. Therefore, the oil (glycerol triacetate) and water were fixed and Smix (Tween 80and PEG 200) ratio was varied (1:1, 1:2, 1:3, 2:1, 3:1, 4:1). The o/w nanoemulsion area in theternary phase diagram drawn for various Smix ratios is presented in Figure 3.
Pharmaceutics 2022, 14, 336 10 of 24
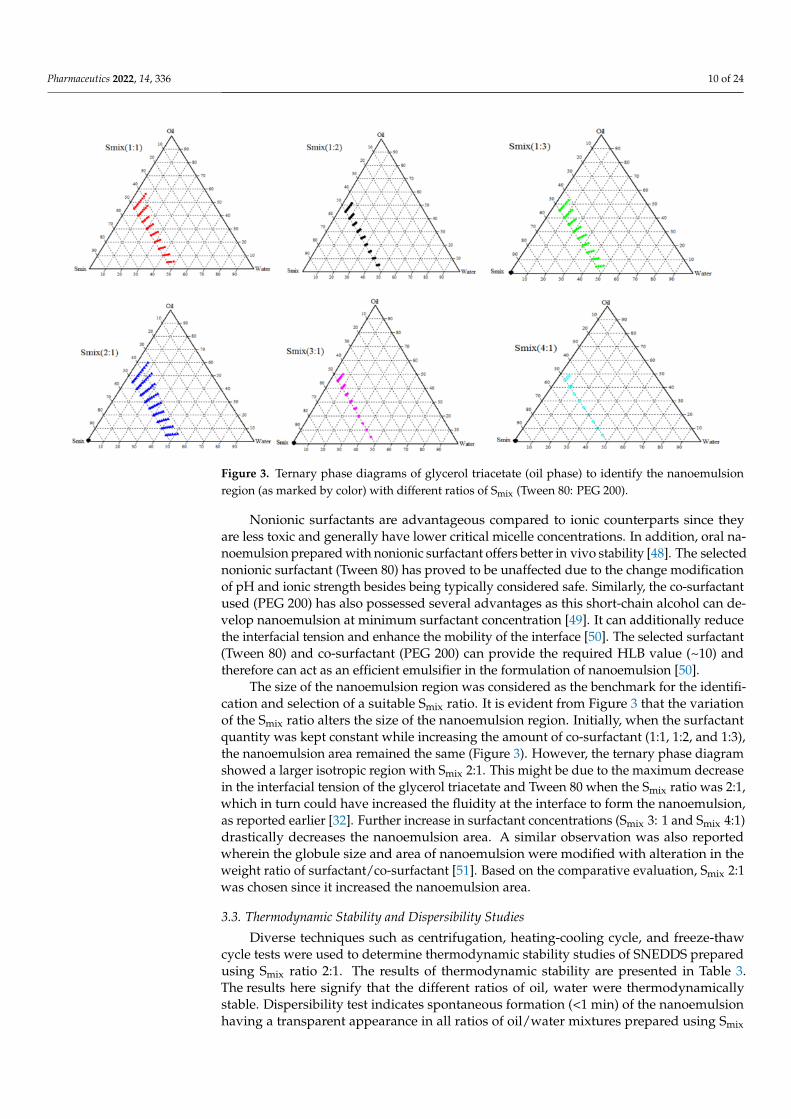
Figure 3. Ternary phase diagrams of glycerol triacetate (oil phase) to identify the nanoemulsionregion (as marked by color) with different ratios of Smix (Tween 80: PEG 200).
Nonionic surfactants are advantageous compared to ionic counterparts since theyare less toxic and generally have lower critical micelle concentrations. In addition, oral na-noemulsion prepared with nonionic surfactant offers better in vivo stability [48]. The selectednonionic surfactant (Tween 80) has proved to be unaffected due to the change modificationof pH and ionic strength besides being typically considered safe. Similarly, the co-surfactantused (PEG 200) has also possessed several advantages as this short-chain alcohol can de-velop nanoemulsion at minimum surfactant concentration [49]. It can additionally reducethe interfacial tension and enhance the mobility of the interface [50]. The selected surfactant(Tween 80) and co-surfactant (PEG 200) can provide the required HLB value (~10) andtherefore can act as an efficient emulsifier in the formulation of nanoemulsion [50].
The size of the nanoemulsion region was considered as the benchmark for the identifi-cation and selection of a suitable Smix ratio. It is evident from Figure 3 that the variationof the Smix ratio alters the size of the nanoemulsion region. Initially, when the surfactantquantity was kept constant while increasing the amount of co-surfactant (1:1, 1:2, and 1:3),the nanoemulsion area remained the same (Figure 3). However, the ternary phase diagramshowed a larger isotropic region with Smix 2:1. This might be due to the maximum decreasein the interfacial tension of the glycerol triacetate and Tween 80 when the Smix ratio was 2:1,which in turn could have increased the fluidity at the interface to form the nanoemulsion,as reported earlier [32]. Further increase in surfactant concentrations (Smix 3: 1 and Smix 4:1)drastically decreases the nanoemulsion area. A similar observation was also reportedwherein the globule size and area of nanoemulsion were modified with alteration in theweight ratio of surfactant/co-surfactant [51]. Based on the comparative evaluation, Smix 2:1was chosen since it increased the nanoemulsion area.
3.3. Thermodynamic Stability and Dispersibility Studies
Diverse techniques such as centrifugation, heating-cooling cycle, and freeze-thawcycle tests were used to determine thermodynamic stability studies of SNEDDS preparedusing Smix ratio 2:1. The results of thermodynamic stability are presented in Table 3.The results here signify that the different ratios of oil, water were thermodynamicallystable. Dispersibility test indicates spontaneous formation (<1 min) of the nanoemulsionhaving a transparent appearance in all ratios of oil/water mixtures prepared using Smix
Pharmaceutics 2022, 14, 336 11 of 24
ratio 2:1 (Table 3). As the Smix ratio of 2:1 showed maximum nanoemulsion area, stability,and good dispersibility, this ratio was selected for the application of full factorial design onits nanoemulsion area.
Table 3. Results of the thermodynamic study and dispersibility test of various liquid self-nanoemulsifying drug delivery systems prepared using Smix ratio of 2:1.
SmixRatio
Oil: WaterRatio
% w/w Thermodynamic Stability Dispersibility Test
Oil Water Smix
HeatingCoolingCycles
Centrifugation Freeze-ThawCycles Water 0.1 N HCl
2:1
9:158.05 6.45 35.5 P P P A A
56.25 6.25 37.5 P P P A A
8:248.48 12.12 39.4 P P P A A
47.04 11.76 41.2 P P P A A
7:341.16 17.65 41.19 P P P A A
39.99 17.14 42.87 P P P A A
6:435.29 23.53 41.18 P P P A A
34.29 22.86 42.85 P P P A A
5:522.73 22.73 54.54 P P P A A
20.83 20.83 58.34 P P P A A
4:616.67 25.00 58.33 P P P A A
15.38 23.07 61.55 P P P A A
3:713.04 30.43 56.53 P P P A A
11.54 26.92 61.54 P P P A A
2:88.33 33.32 58.35 P P P A A
7.69 30.76 61.55 P P P A A
1:94.35 39.15 56.5 P P P A A
3.85 34.65 61.5 P P P A A
Smix, Tween 80 (surfactant) and PEG 200 (co-surfactant); P, passed; A, spontaneousformation (<1 min) of nanoemulsion, having a transparent appearance.
3.4. Screening of Formulations by Full Factorial Design
Factorial designs are a statistical design of experiments wherein the influence of multi-ple factors and their interactions on experimental outcomes are determined. The selectedFactorial model (three-factor linear interactions) designs have maximum efficiency inestablishing the main effects (X1, X2, X3) and potential interactions (X1X2, X2X3, X1X3,and X1X2X3). Factorial designs have maximum efficiency in establishing the main effectsand potential interactions. The main effects indicate the mean outcome of varying onefactor at a time from its low to high value. The interaction terms signify how the responsealters when multiple factors were entirely transformed. L-SNEDDS were prepared basedon the design of the experiment applying a three-factor, two-level (23) full factorial design,and the responses of variables for designed batches (F1–F8) are summarized in Table 4.
Pharmaceutics 2022, 14, 336 12 of 24
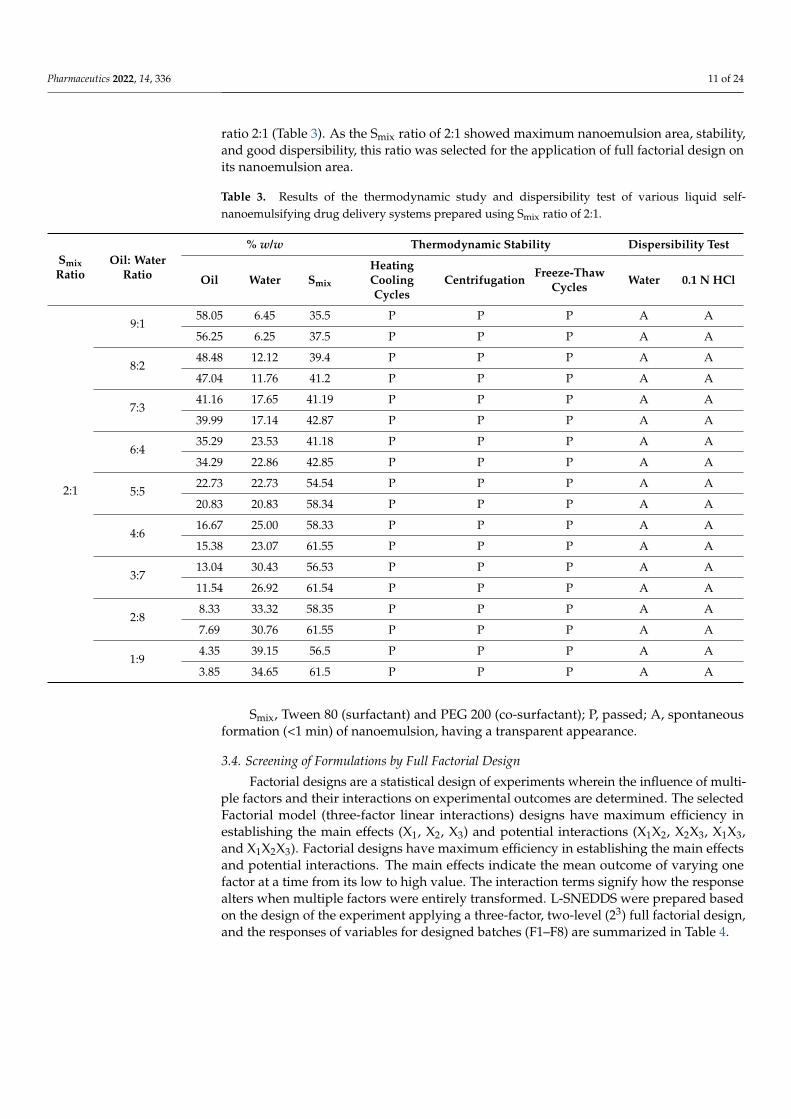
Table 4. Responses of designed batches for dependent variables (dissolution efficiency %; globulesize; and self-emulsification time).
Batch No. Y1 (break)Dissolution Efficiency (%) Y2 (break)Globule Size (nm) Y3Self-Emulsification Time (s)
F1 55.67 ± 2.02 241.51 ± 40.92 38.52 ± 3.11F2 65.55 ± 1.82 153.8 ± 42. 55 45.05 ± 4.35F3 75.20 ± 2.18 112.3 ± 35.58 22.78 ± 3.42F4 92.98 ± 2.92 75.66 ± 24.47 31.14 ± 2.67F5 81.02 ±2.07 94.15 ± 29.51 58.37 ± 5.14F6 67.65 ± 2.15 149.2 ± 38.18 68.33 ± 5.48F7 80.19 ± 3.11 96.65 ± 24.72 59.18 ± 5.22F8 58.95 ± 2.19 195.7 ± 39.77 18.28 ± 2.46
3.4.1. Influence of Formulation Factors on Y1 (Dissolution Efficiency %)
The concentration of oil, surfactant, and co-surfactant and related impact on dissolu-tion efficiency are graphically illustrated utilizing design expert software. It is apparentfrom the 3D surface plot (Figure 4) that the amount of surfactant has a significant effecton dissolution efficiency i.e., with an increase in the amount of surfactant. Dissolutionefficiency % also increases whereas the amount of oil and co-surfactant were found to behaving a negative effect on Y1. From the globule size determination of full factorial batches,it was observed that with a decrease in globule size, dissolution efficiency increases withmore surface area.
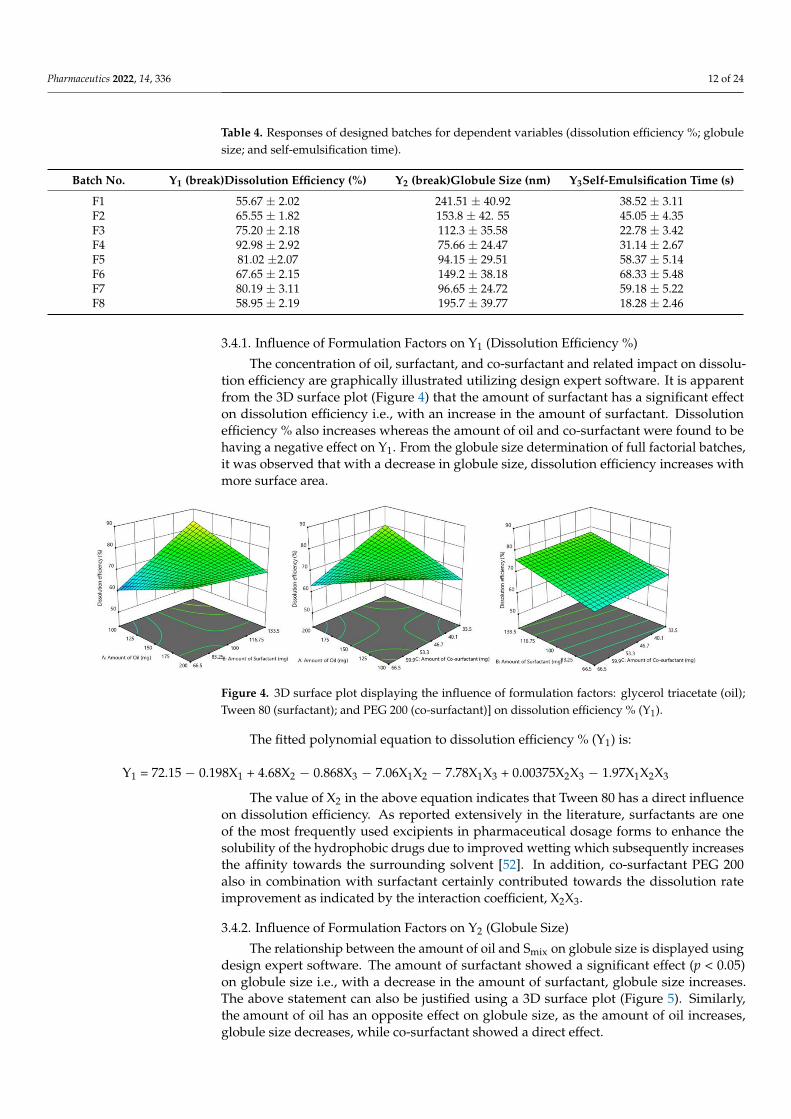
Figure 4. 3D surface plot displaying the influence of formulation factors: glycerol triacetate (oil);Tween 80 (surfactant); and PEG 200 (co-surfactant)] on dissolution efficiency % (Y1).
The fitted polynomial equation to dissolution efficiency % (Y1) is:
Y1 = 72.15 − 0.198X1 + 4.68X2 − 0.868X3 − 7.06X1X2 − 7.78X1X3 + 0.00375X2X3 − 1.97X1X2X3
The value of X2 in the above equation indicates that Tween 80 has a direct influenceon dissolution efficiency. As reported extensively in the literature, surfactants are oneof the most frequently used excipients in pharmaceutical dosage forms to enhance thesolubility of the hydrophobic drugs due to improved wetting which subsequently increasesthe affinity towards the surrounding solvent [52]. In addition, co-surfactant PEG 200also in combination with surfactant certainly contributed towards the dissolution rateimprovement as indicated by the interaction coefficient, X2X3.
3.4.2. Influence of Formulation Factors on Y2 (Globule Size)
The relationship between the amount of oil and Smix on globule size is displayed usingdesign expert software. The amount of surfactant showed a significant effect (p < 0.05)on globule size i.e., with a decrease in the amount of surfactant, globule size increases.The above statement can also be justified using a 3D surface plot (Figure 5). Similarly,the amount of oil has an opposite effect on globule size, as the amount of oil increases,globule size decreases, while co-surfactant showed a direct effect.

Pharmaceutics 2022, 14, 336 13 of 24
Y2 = 139.87 − 5.9X1 − 19.79X2 + 3.71X3 + 32.04X1X2 + 34.80X1X3 + 11.88X2X3 − 0.88X1X2X3
Figure 5. 3D surface plot showing the effect of formulation factors: glycerol triacetate (oil); Tween 80(surfactant); and PEG 200 (co-surfactant)] on globule size (Y2).
The values X1X2, X1X3, X2X3 demonstrate beneficial or synergistic interactions betweenoil–surfactant, surfactant–co-surfactant, and oil–co-surfactant to droplet size. It disclosedthat the average globule size of the emulsion reduced with increased surfactant concentra-tion due to the creation of a larger oil-water interface [53].
3.4.3. Influence of Formulation Factors on Y3 (Self Emulsification Time)
The self-emulsification ability of nanoemulsion is assessed by the time required foremulsification as well as visual observation for transparency. An ideal SNEDDS is expectedto disperse spontaneously and completely without any precipitation of the drug undermild stirring in a simulated gastric environment. The effect of the amount of oil, surfac-tant, and co-surfactant on self-emulsification time is shown by graphical representation.The amount of surfactant showed a significant effect on self-emulsification time i.e., with adecrease in the amount of surfactant, self-emulsification time increases. A similar effectwas observed with the co-surfactant PEG 200 as well. While oil has a direct effect onself-emulsification time, an increase in the amount of oil requires more time to emulsify.The above statement can also be justified using a 3D surface plot (Figure 6).
Y3 = 42.375 + 8.375X1 − 9.875X2 − 1.875X3 − 2.375X1X2 − 5.875X1X3 − 6.125X2X3 − 0.88X1X2X3
Figure 6. 3D surface plot showing the effect of formulation factors: glycerol triacetate (oil); Tween 80(surfactant); and PEG 200 (co-surfactant)] on self-emulsification time (SEF; Y3).
It was demonstrated that all the prepared batches had self-emulsification times < 1 minand the transparent emulsion was observed, thereby confirming the formation of nanoemul-sion. The selected batch (F4) had the lowest self-emulsification time (31.14 ± 2.67 s, Table 4),which might be probably due to the larger surfactant concentration. Surfactant allows rapidtransport of water into globules as it reduces the interfacial force that exists between oil and
Pharmaceutics 2022, 14, 336 14 of 24
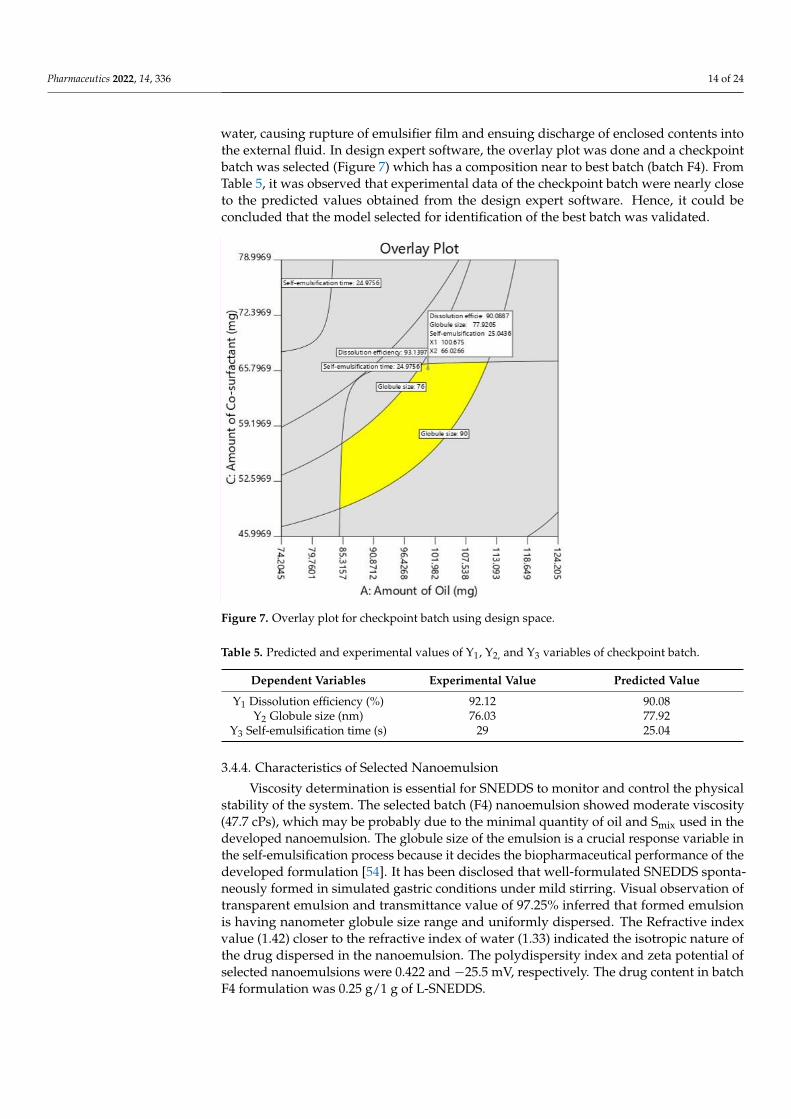
water, causing rupture of emulsifier film and ensuing discharge of enclosed contents intothe external fluid. In design expert software, the overlay plot was done and a checkpointbatch was selected (Figure 7) which has a composition near to best batch (batch F4). FromTable 5, it was observed that experimental data of the checkpoint batch were nearly closeto the predicted values obtained from the design expert software. Hence, it could beconcluded that the model selected for identification of the best batch was validated.
Figure 7. Overlay plot for checkpoint batch using design space.
Table 5. Predicted and experimental values of Y1, Y2, and Y3 variables of checkpoint batch.
Dependent Variables Experimental Value Predicted Value
Y1 Dissolution efficiency (%) 92.12 90.08Y2 Globule size (nm) 76.03 77.92
Y3 Self-emulsification time (s) 29 25.04
3.4.4. Characteristics of Selected Nanoemulsion
Viscosity determination is essential for SNEDDS to monitor and control the physicalstability of the system. The selected batch (F4) nanoemulsion showed moderate viscosity(47.7 cPs), which may be probably due to the minimal quantity of oil and Smix used in thedeveloped nanoemulsion. The globule size of the emulsion is a crucial response variable inthe self-emulsification process because it decides the biopharmaceutical performance of thedeveloped formulation [54]. It has been disclosed that well-formulated SNEDDS sponta-neously formed in simulated gastric conditions under mild stirring. Visual observation oftransparent emulsion and transmittance value of 97.25% inferred that formed emulsionis having nanometer globule size range and uniformly dispersed. The Refractive indexvalue (1.42) closer to the refractive index of water (1.33) indicated the isotropic nature ofthe drug dispersed in the nanoemulsion. The polydispersity index and zeta potential ofselected nanoemulsions were 0.422 and −25.5 mV, respectively. The drug content in batchF4 formulation was 0.25 g/1 g of L-SNEDDS.
Pharmaceutics 2022, 14, 336 15 of 24
3.5. Solidification of L-SNEDDS
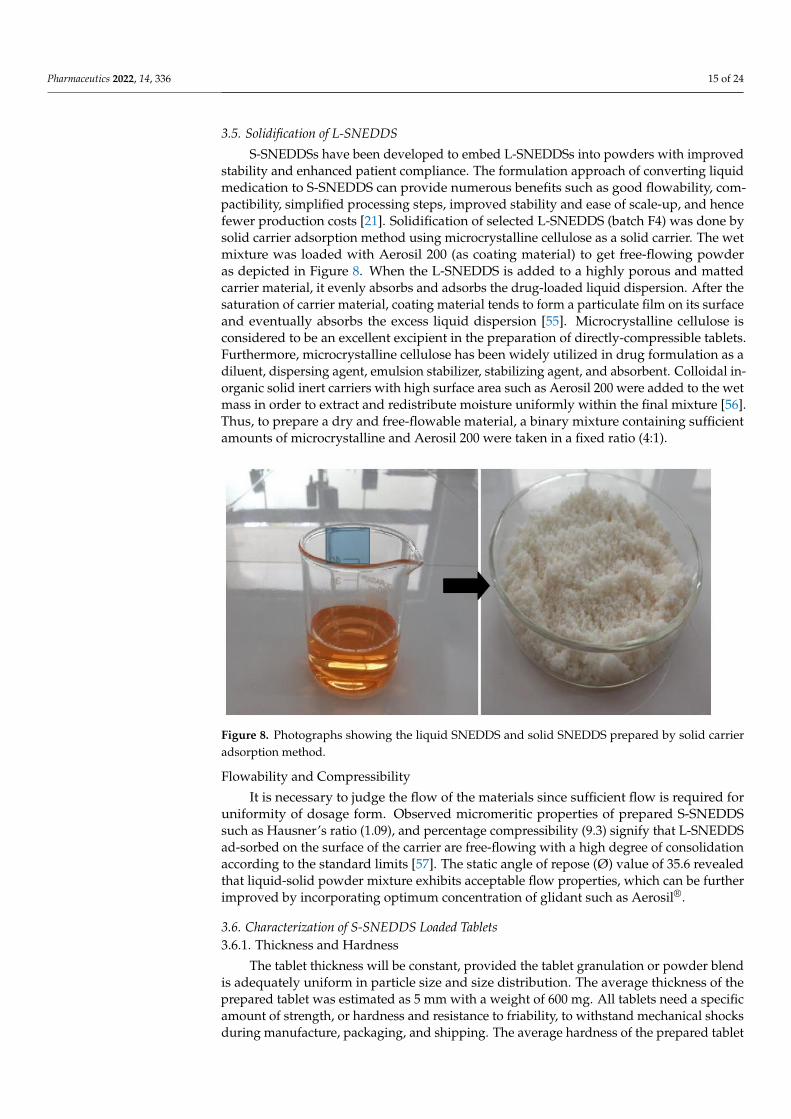
S-SNEDDSs have been developed to embed L-SNEDDSs into powders with improvedstability and enhanced patient compliance. The formulation approach of converting liquidmedication to S-SNEDDS can provide numerous benefits such as good flowability, com-pactibility, simplified processing steps, improved stability and ease of scale-up, and hencefewer production costs [21]. Solidification of selected L-SNEDDS (batch F4) was done bysolid carrier adsorption method using microcrystalline cellulose as a solid carrier. The wetmixture was loaded with Aerosil 200 (as coating material) to get free-flowing powderas depicted in Figure 8. When the L-SNEDDS is added to a highly porous and mattedcarrier material, it evenly absorbs and adsorbs the drug-loaded liquid dispersion. After thesaturation of carrier material, coating material tends to form a particulate film on its surfaceand eventually absorbs the excess liquid dispersion [55]. Microcrystalline cellulose isconsidered to be an excellent excipient in the preparation of directly-compressible tablets.Furthermore, microcrystalline cellulose has been widely utilized in drug formulation as adiluent, dispersing agent, emulsion stabilizer, stabilizing agent, and absorbent. Colloidal in-organic solid inert carriers with high surface area such as Aerosil 200 were added to the wetmass in order to extract and redistribute moisture uniformly within the final mixture [56].Thus, to prepare a dry and free-flowable material, a binary mixture containing sufficientamounts of microcrystalline and Aerosil 200 were taken in a fixed ratio (4:1).
Figure 8. Photographs showing the liquid SNEDDS and solid SNEDDS prepared by solid carrieradsorption method.
Flowability and Compressibility
It is necessary to judge the flow of the materials since sufficient flow is required foruniformity of dosage form. Observed micromeritic properties of prepared S-SNEDDSsuch as Hausner’s ratio (1.09), and percentage compressibility (9.3) signify that L-SNEDDSad-sorbed on the surface of the carrier are free-flowing with a high degree of consolidationaccording to the standard limits [57]. The static angle of repose (Ø) value of 35.6 revealedthat liquid-solid powder mixture exhibits acceptable flow properties, which can be furtherimproved by incorporating optimum concentration of glidant such as Aerosil®.
3.6. Characterization of S-SNEDDS Loaded Tablets3.6.1. Thickness and Hardness
The tablet thickness will be constant, provided the tablet granulation or powder blendis adequately uniform in particle size and size distribution. The average thickness of theprepared tablet was estimated as 5 mm with a weight of 600 mg. All tablets need a specificamount of strength, or hardness and resistance to friability, to withstand mechanical shocksduring manufacture, packaging, and shipping. The average hardness of the prepared tablet
Pharmaceutics 2022, 14, 336 16 of 24
was 3.2 kg/cm2 and the percentage friability estimated was 0.957, and these values arewithin the acceptable limits.
3.6.2. Friability
The friability of tablets should always be less than 1%. The results of friability (%)of prepared tablets were found to be 0.91, which is generally considered acceptable forconventional compressed tablets according to the USP.
3.6.3. Disintegration
This test is carried out to measure the time required to disintegrate within the specifiedtime limit when placed in a suitable liquid medium under suitable experimental conditions.The disintegration time of the prepared tablet was 1 min at 37 ± 1 ◦C.
3.6.4. Drug Content
To evaluate a tablet’s potential for efficacy, the drug content needs to be monitoredfrom tablet to tablet and batch to batch. The drug content of the selected tablet wasestimated to be 95.06%, which is within the pharmacopeial acceptance criteria (95 to 105%of the label strength).
3.6.5. Drug Release
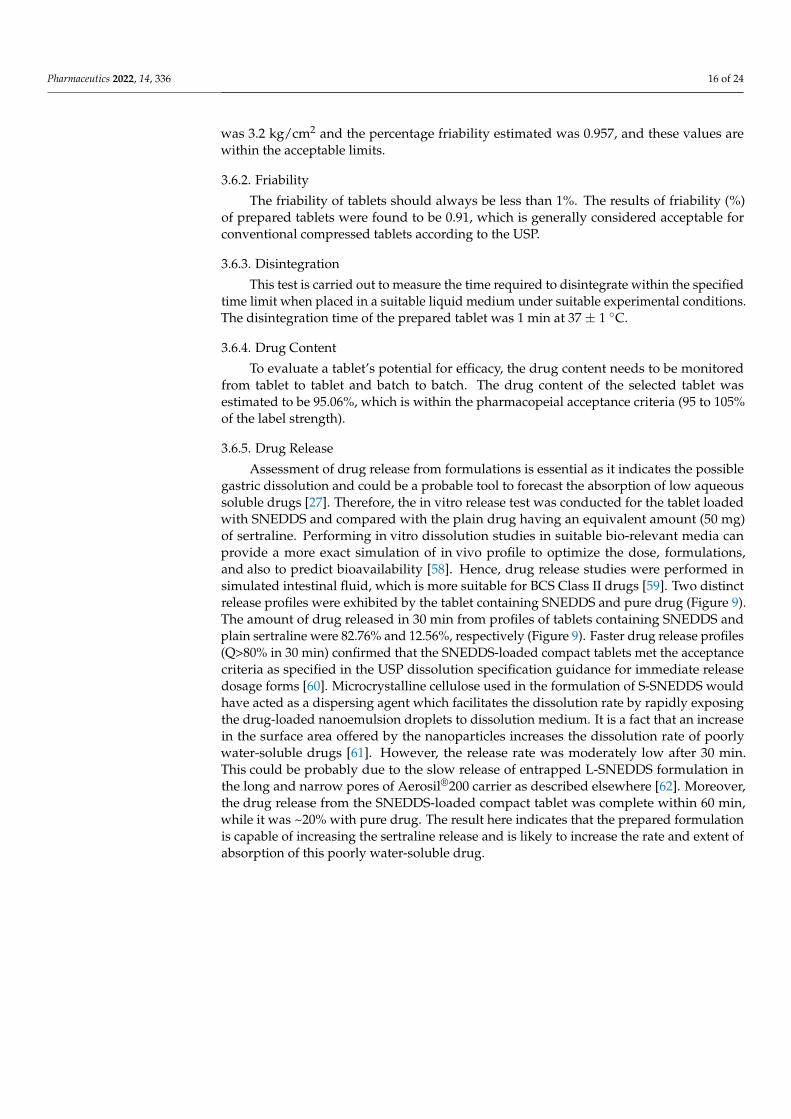
Assessment of drug release from formulations is essential as it indicates the possiblegastric dissolution and could be a probable tool to forecast the absorption of low aqueoussoluble drugs [27]. Therefore, the in vitro release test was conducted for the tablet loadedwith SNEDDS and compared with the plain drug having an equivalent amount (50 mg)of sertraline. Performing in vitro dissolution studies in suitable bio-relevant media canprovide a more exact simulation of in vivo profile to optimize the dose, formulations,and also to predict bioavailability [58]. Hence, drug release studies were performed insimulated intestinal fluid, which is more suitable for BCS Class II drugs [59]. Two distinctrelease profiles were exhibited by the tablet containing SNEDDS and pure drug (Figure 9).The amount of drug released in 30 min from profiles of tablets containing SNEDDS andplain sertraline were 82.76% and 12.56%, respectively (Figure 9). Faster drug release profiles(Q>80% in 30 min) confirmed that the SNEDDS-loaded compact tablets met the acceptancecriteria as specified in the USP dissolution specification guidance for immediate releasedosage forms [60]. Microcrystalline cellulose used in the formulation of S-SNEDDS wouldhave acted as a dispersing agent which facilitates the dissolution rate by rapidly exposingthe drug-loaded nanoemulsion droplets to dissolution medium. It is a fact that an increasein the surface area offered by the nanoparticles increases the dissolution rate of poorlywater-soluble drugs [61]. However, the release rate was moderately low after 30 min.This could be probably due to the slow release of entrapped L-SNEDDS formulation inthe long and narrow pores of Aerosil®200 carrier as described elsewhere [62]. Moreover,the drug release from the SNEDDS-loaded compact tablet was complete within 60 min,while it was ~20% with pure drug. The result here indicates that the prepared formulationis capable of increasing the sertraline release and is likely to increase the rate and extent ofabsorption of this poorly water-soluble drug.
Pharmaceutics 2022, 14, 336 17 of 24
Figure 9. Comparison of release profile of prepared solid self-nanoemulsifying drug delivery system(S-SNEDDS) and sertraline (control). Data represented are mean ± SD (n = 6).
3.6.6. DSC
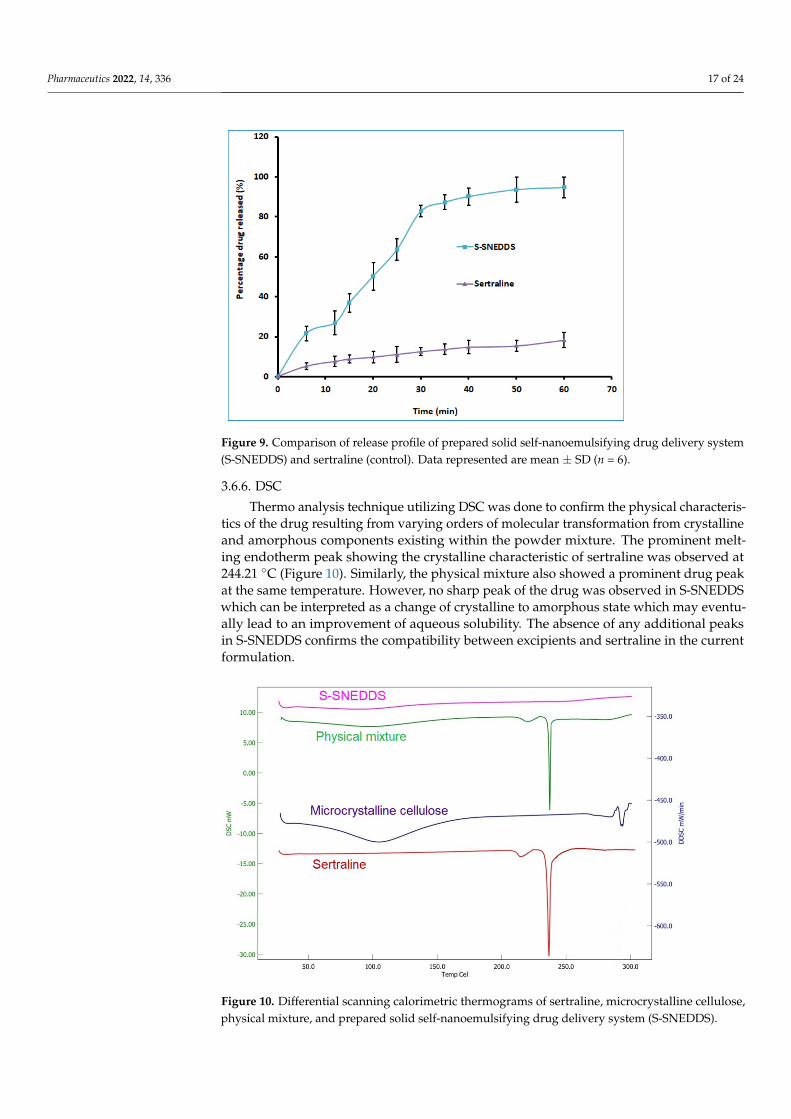
Thermo analysis technique utilizing DSC was done to confirm the physical characteris-tics of the drug resulting from varying orders of molecular transformation from crystallineand amorphous components existing within the powder mixture. The prominent melt-ing endotherm peak showing the crystalline characteristic of sertraline was observed at244.21 ◦C (Figure 10). Similarly, the physical mixture also showed a prominent drug peakat the same temperature. However, no sharp peak of the drug was observed in S-SNEDDSwhich can be interpreted as a change of crystalline to amorphous state which may eventu-ally lead to an improvement of aqueous solubility. The absence of any additional peaksin S-SNEDDS confirms the compatibility between excipients and sertraline in the currentformulation.
Figure 10. Differential scanning calorimetric thermograms of sertraline, microcrystalline cellulose,physical mixture, and prepared solid self-nanoemulsifying drug delivery system (S-SNEDDS).
Pharmaceutics 2022, 14, 336 18 of 24
3.6.7. XRD
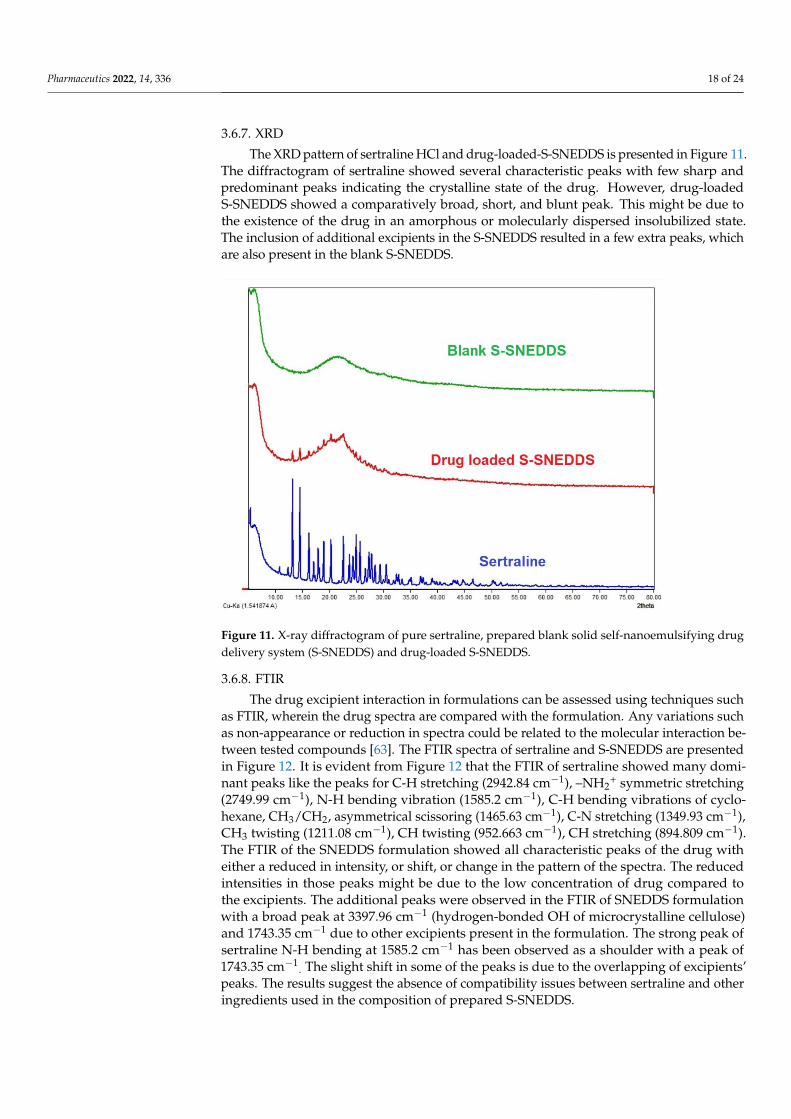
The XRD pattern of sertraline HCl and drug-loaded-S-SNEDDS is presented in Figure 11.The diffractogram of sertraline showed several characteristic peaks with few sharp andpredominant peaks indicating the crystalline state of the drug. However, drug-loadedS-SNEDDS showed a comparatively broad, short, and blunt peak. This might be due tothe existence of the drug in an amorphous or molecularly dispersed insolubilized state.The inclusion of additional excipients in the S-SNEDDS resulted in a few extra peaks, whichare also present in the blank S-SNEDDS.
Figure 11. X-ray diffractogram of pure sertraline, prepared blank solid self-nanoemulsifying drugdelivery system (S-SNEDDS) and drug-loaded S-SNEDDS.
3.6.8. FTIR
The drug excipient interaction in formulations can be assessed using techniques suchas FTIR, wherein the drug spectra are compared with the formulation. Any variations suchas non-appearance or reduction in spectra could be related to the molecular interaction be-tween tested compounds [63]. The FTIR spectra of sertraline and S-SNEDDS are presentedin Figure 12. It is evident from Figure 12 that the FTIR of sertraline showed many domi-nant peaks like the peaks for C-H stretching (2942.84 cm−1), –NH2
+ symmetric stretching(2749.99 cm−1), N-H bending vibration (1585.2 cm−1), C-H bending vibrations of cyclo-hexane, CH3/CH2, asymmetrical scissoring (1465.63 cm−1), C-N stretching (1349.93 cm−1),CH3 twisting (1211.08 cm−1), CH twisting (952.663 cm−1), CH stretching (894.809 cm−1).The FTIR of the SNEDDS formulation showed all characteristic peaks of the drug witheither a reduced in intensity, or shift, or change in the pattern of the spectra. The reducedintensities in those peaks might be due to the low concentration of drug compared tothe excipients. The additional peaks were observed in the FTIR of SNEDDS formulationwith a broad peak at 3397.96 cm−1 (hydrogen-bonded OH of microcrystalline cellulose)and 1743.35 cm−1 due to other excipients present in the formulation. The strong peak ofsertraline N-H bending at 1585.2 cm−1 has been observed as a shoulder with a peak of1743.35 cm−1
. The slight shift in some of the peaks is due to the overlapping of excipients’peaks. The results suggest the absence of compatibility issues between sertraline and otheringredients used in the composition of prepared S-SNEDDS.

Pharmaceutics 2022, 14, 336 19 of 24
Figure 12. Fourier transform infrared spectroscopy of sertraline and prepared solid self-nanoemulsifying drug delivery system (S-SNEDDS).
3.6.9. SEM
The surface features of plain Aerosil 200 (coating material) and selected S-SNEDDSformulation (batch F4) were interpreted utilizing an SEM as illustrated in Figure 13. Aerosil200 seems to be a highly porous material that exists as loose aggregates composed ofcolloidal silicon dioxide particles [33]. The SEM picture of S-SNEDDS suggests a change inmorphology and becomes spherical particles, but twisted, fused, and marginally unevenin appearance. Isolated minor cracks, dents, and pores are also visible on the matrixstructure, which could further enhance the rapid permeation of water and thus allow forrapid dispersibility in the gastrointestinal environment. Further, figures reveal the totaladsorption of L-SNEDDS into the carrier materials which were observed noticed by theabsence of any oil globules in the S-SNEDDS.
Figure 13. Representative scanning electron microscopy photographs of (A) Aerosil 200; and (B)prepared solid self-nanoemulsifying drug delivery system (S-SNEDDS). Scale bar represents 1 µm.
Pharmaceutics 2022, 14, 336 20 of 24
3.7. Oral Bioavailability Studies
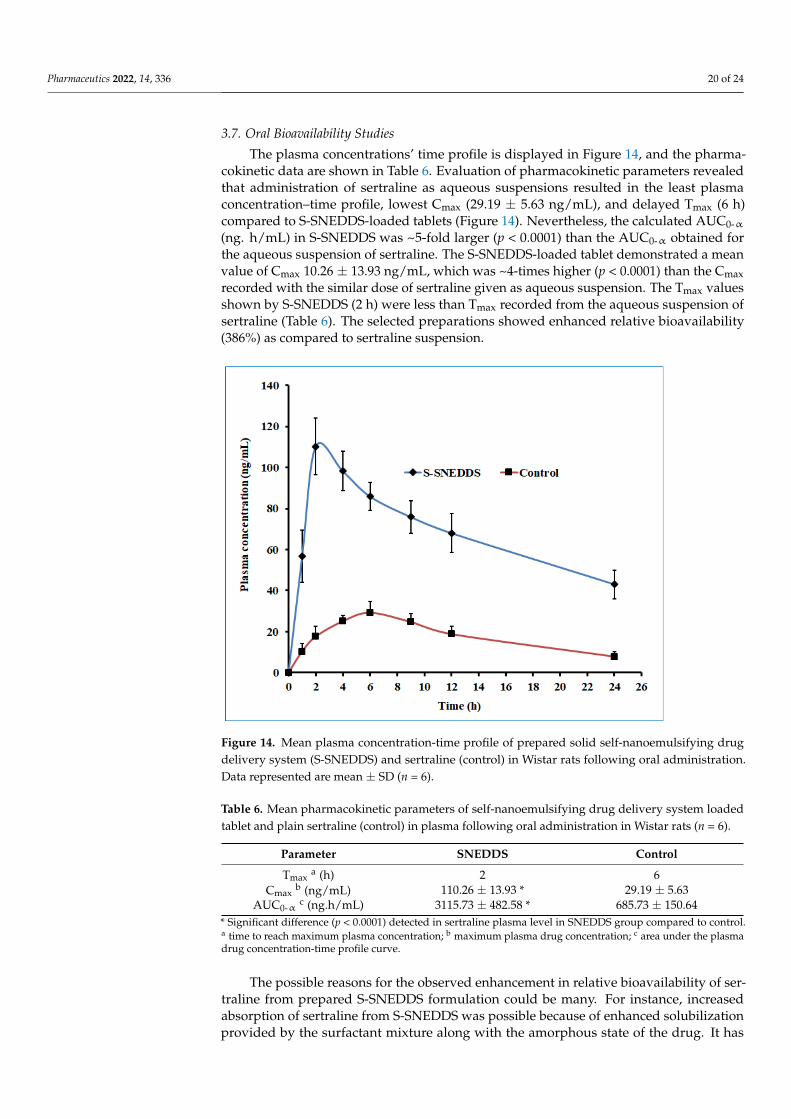
The plasma concentrations’ time profile is displayed in Figure 14, and the pharma-cokinetic data are shown in Table 6. Evaluation of pharmacokinetic parameters revealedthat administration of sertraline as aqueous suspensions resulted in the least plasmaconcentration–time profile, lowest Cmax (29.19 ± 5.63 ng/mL), and delayed Tmax (6 h)compared to S-SNEDDS-loaded tablets (Figure 14). Nevertheless, the calculated AUC0-α(ng. h/mL) in S-SNEDDS was ~5-fold larger (p < 0.0001) than the AUC0-α obtained forthe aqueous suspension of sertraline. The S-SNEDDS-loaded tablet demonstrated a meanvalue of Cmax 10.26 ± 13.93 ng/mL, which was ~4-times higher (p < 0.0001) than the Cmaxrecorded with the similar dose of sertraline given as aqueous suspension. The Tmax valuesshown by S-SNEDDS (2 h) were less than Tmax recorded from the aqueous suspension ofsertraline (Table 6). The selected preparations showed enhanced relative bioavailability(386%) as compared to sertraline suspension.
Figure 14. Mean plasma concentration-time profile of prepared solid self-nanoemulsifying drugdelivery system (S-SNEDDS) and sertraline (control) in Wistar rats following oral administration.Data represented are mean ± SD (n = 6).
Table 6. Mean pharmacokinetic parameters of self-nanoemulsifying drug delivery system loadedtablet and plain sertraline (control) in plasma following oral administration in Wistar rats (n = 6).
Parameter SNEDDS Control
Tmaxa (h) 2 6
Cmaxb (ng/mL) 110.26 ± 13.93 * 29.19 ± 5.63
AUC0-αc (ng.h/mL) 3115.73 ± 482.58 * 685.73 ± 150.64
* Significant difference (p < 0.0001) detected in sertraline plasma level in SNEDDS group compared to control.a time to reach maximum plasma concentration; b maximum plasma drug concentration; c area under the plasmadrug concentration-time profile curve.
The possible reasons for the observed enhancement in relative bioavailability of ser-traline from prepared S-SNEDDS formulation could be many. For instance, increasedabsorption of sertraline from S-SNEDDS was possible because of enhanced solubilizationprovided by the surfactant mixture along with the amorphous state of the drug. It has
Pharmaceutics 2022, 14, 336 21 of 24
been disclosed that the irregular molecular orientation that exists in the amorphous statecauses an improvement of aqueous solubility and therefore enhanced dissolution rate incontrast to their crystalline analog [64]. Different degrees of molecular order can occursimultaneously in S-SNEDDS, leading to the existence of both crystalline and amorphoussystems [64]. However, the characteristics of the greater amorphous component presentin S-SNEDDS could be advantageous and hence enhance the biopharmaceutical perfor-mance of pharmaceutical products [37]. Sertraline S-SNEDDS could form nanoemulsiondroplets spontaneously after dispersion in the gastrointestinal tract and have the capacityto absorb quickly, being a BCS class II compound. Moreover, the nano-sized emulsionglobules have the potential ability to transport drugs through the transcellular route forgastrointestinal absorption.
Similarly, non-ionic surfactant (Tween 80) might have enhanced the solubility of ser-traline through micellar solubilization besides decreasing the interfacial surface tensionand thereby enhancing the permeation of the drug via the epithelial barrier. In addition,the lipidic constituents included in the formulation can solubilize a considerable amountof this lipophilic molecule and promote self-emulsification, besides having the capacity topromote a portion of drug transferred via the intestinal lymphatic system, thus promotinggastrointestinal absorption. Overall, it can be concluded from the in vivo pharmacoki-netic evaluation that prepared S-SNEDDS formulation significantly improved solubility,dissolution, and absorption, which in turn resulted in greater bioavailability of sertraline.
4. Conclusions
To improve the solubility of the poorly water-soluble drug, sertraline, the S-SNEDDSapproach was employed. Initially, screening of nanoemulsion formulation was carried outby examining the influence of the quantity of oil, surfactant, and co-surfactant on disso-lution efficiency, globule size, and self-emulsification time. The selected liquid SNEDDSformulation (batch F4) was converted to a flowable powder using microcrystalline celluloseas a solid carrier and Aerosil 200 as coating material. The powder was compressed intotablet dosage to integrate the bioavailability enhancement of sertraline besides solvingthe formulation challenges typically associated with liquid lipid formulations. A rapidand complete drug release noticed in S-SNEDDS formulation met the acceptance crite-ria specified in the USP dissolution specification guidance for immediate release dosageforms. DSC and XRD data signify the complete transformation of crystalline sertralinein the prepared formulation, which might be contributing towards the improvement ofsolubility and thereby dissolution enhancement of the drug. The FTIR study confirms nointeraction between the drug and excipients used. In vivo data demonstrate a significant(p < 0.0001) difference in the Cmax, and AUC0-α by prepared S-SNEDDS as compared tocontrol, indicating improvement in oral absorption of sertraline. In conclusion, the resultsobtained here demonstrated the feasibility of S-SNEDDS to enhance the oral bioavailabilityand thereby the clinical efficacy of sertraline.
Author Contributions: Conceptualization, A.B.N., B.S., J.S. and S.J.; Data Curation, A.B.N., B.S.,J.S., S.J., B.A. and N.S.; Formal Analysis, A.B.N., B.S., J.S., S.J., M.A.M., K.N.V. and M.A.; FundingAcquisition, A.B.N., J.S., B.A., N.S., M.A.M., K.N.V. and M.A.; Investigation, A.B.N., B.S., J.S., S.J.,B.A., N.S., M.A.M., K.N.V., M.A. and P.S.; Methodology, A.B.N., B.S., J.S., S.J., B.A., N.S., M.A.M.,K.N.V., M.A. and P.S.; Writing—Original Draft Preparation, B.S., N.S., M.A.M., K.N.V., M.A. andP.S.; Writing—Review and Editing, A.B.N., J.S., S.J., B.A. All authors have read and agreed to thepublished version of the manuscript.
Funding: This research was funded by the Deanship of Scientific Research, King Faisal University,grant number 1811021, and the APC was funded by the Deanship of Scientific Research, KingFaisal University.
Institutional Review Board Statement: The study was conducted according to the guidelines of theDeclaration of Helsinki, and approved by the Institutional Ethics Committee of Nirma University(protocol Number IP/PCEU/FAC/29/2021/40; dated 18 September 2021).

Pharmaceutics 2022, 14, 336 22 of 24
Informed Consent Statement: Not applicable.
Data Availability Statement: The data presented in this study are contained within the article.
Acknowledgments: The authors thank the Deanship of Scientific Research at King Faisal Universityfor the financial support of research project number 1811021. We also acknowledge Tameem Alyahianfor the technical assistance.
Conflicts of Interest: The authors declare no conflict of interest.
References1. Sutton, S.C. The use of gastrointestinal intubation studies for controlled release development. Br. J. Clin. Pharmacol. 2009, 68,
342–354. [CrossRef] [PubMed]2. Alhadab, A.A.; Brundage, R.C. Population Pharmacokinetics of Sertraline in Healthy Subjects: A Model-Based Meta-analysis.
AAPS J. 2020, 22, 73. [CrossRef] [PubMed]3. Homayun, B.; Lin, X.; Choi, H.J. Challenges and Recent Progress in Oral Drug Delivery Systems for Biopharmaceuticals.
Pharmaceutics 2019, 11, 129. [CrossRef] [PubMed]4. McRae, A.L.; Brady, K.T. Review of sertraline and its clinical applications in psychiatric disorders. Expert Opin. Pharmacother.
2001, 2, 883–892. [CrossRef]5. Kim, S.J.; Lee, H.K.; Na, Y.G.; Bang, K.H.; Lee, H.J.; Wang, M.; Huh, H.W.; Cho, C.W. A novel composition of ticagrelor by solid
dispersion technique for increasing solubility and intestinal permeability. Int. J. Pharm. 2019, 555, 11–18. [CrossRef]6. Rasenack, N.; Müller, B.W. Dissolution rate enhancement by in situ micronization of poorly water-soluble drugs. Pharm. Res.
2002, 19, 1894–1900. [CrossRef]7. Taniguchi, C.; Kawabata, Y.; Wada, K.; Yamada, S.; Onoue, S. Microenvironmental pH-modification to improve dissolution
behavior and oral absorption for drugs with pH-dependent solubility. Expert Opin. Drug Deliv. 2014, 11, 505–516. [CrossRef]8. Ishikawa, M.; Hashimoto, Y. Improvement in aqueous solubility in small molecule drug discovery programs by disruption of
molecular planarity and symmetry. J. Med. Chem. 2011, 54, 1539–1554. [CrossRef]9. Van Staden, D.; Du Plessis, J.; Viljoen, J. Development of topical/transdermal self-emulsifying drug delivery systems, not as
simple as expected. Sci. Pharm. 2020, 88, 17. [CrossRef]10. Rahman, M.A.; Harwansh, R.K.; Iqbal, Z. Systematic Development of Sertraline Loaded Solid Lipid Nanoparticle (SLN) by
Emulsification-Ultrasonication Method and Pharmacokinetic Study in Sprague-Dawley Rats. Pharm. Nanotechnol. 2019, 7, 162–176.[CrossRef]
11. Nunes, C.D.; Vaz, P.D.; Fernandes, A.C.; Ferreira, P.; Romão, C.C.; Calhorda, M.J. Loading and delivery of sertraline usinginorganic micro and mesoporous materials. Eur. J. Pharm. Biopharm. 2007, 66, 357–365. [CrossRef] [PubMed]
12. Vijaya, R.; Ruckmani, K. In vitro and In vivo characterization of the transdermal delivery of sertraline hydrochloride Films.DARU J. Pharm. Sci. 2011, 19, 424–432.
13. Gupta, A.; Aggarwal, G.; Singla, S.; Arora, R. Transfersomes: A novel vesicular carrier for enhanced transdermal delivery ofsertraline: Development, characterization, and performance evaluation. Sci. Pharm. 2012, 80, 1061–1080. [CrossRef]
14. Kubackova, J.; Holas, O.; Zbytovska, J.; Vranikova, B.; Zeng, G.; Pavek, P.; Mullertz, A. Oligonucleotide Delivery across theCaco-2 Monolayer: The Design and Evaluation of Self-Emulsifying Drug Delivery Systems (SEDDS). Pharmaceutics 2021, 13, 459.[CrossRef] [PubMed]
15. Zhu, Z.; Liu, J.; Yang, Y.; Adu-Frimpong, M.; Ji, H.; Toreniyazov, E.; Wang, Q.; Yu, J.; Xu, X. SMEDDS for improved oralbioavailability and anti-hyperuricemic activity of licochalcone A. J. Microencapsul. 2021, 38, 459–471. [CrossRef]
16. Singh, D. Self-nanoemulsifying Drug Delivery System: A Versatile Carrier for Lipophilic Drugs. Pharm. Nanotechnol. 2021, 9,166–176. [CrossRef] [PubMed]
17. Rasoanirina, B.N.V.; Lassoued, M.A.; Miladi, K.; Razafindrakoto, Z.; Chaâbane-Banaoues, R.; Ramanitrahasimbola, D.; Cornet, M.;Sfar, S. Self-nanoemulsifying drug delivery system to improve transcorneal permeability of voriconazole: In-vivo studies.J. Pharm. Pharmacol. 2020, 72, 889–896. [CrossRef]
18. Buya, A.B.; Beloqui, A.; Memvanga, P.B.; Préat, V. Self-Nano-Emulsifying Drug-Delivery Systems: From the Development to theCurrent Applications and Challenges in Oral Drug Delivery. Pharmaceutics 2020, 12, 1194. [CrossRef]
19. Porter, C.J.; Kaukonen, A.M.; Taillardat-Bertschinger, A.; Boyd, B.J.; O’Connor, J.M.; Edwards, G.A.; Charman, W.N. Use of in vitrolipid digestion data to explain the in vivo performance of triglyceride-based oral lipid formulations of poorly water-solubledrugs: Studies with halofantrine. J. Pharm. Sci. 2004, 93, 1110–1121. [CrossRef]
20. Rahman, M.A.; Harwansh, R.; Mirza, M.A.; Hussain, S.; Hussain, A. Oral lipid based drug delivery system (LBDDS): Formulation,characterization and application: A review. Curr. Drug Deliv. 2011, 8, 330–345. [CrossRef]
21. Abbaspour, M.; Jalayer, N.; Sharif Makhmalzadeh, B. Development and evaluation of a solid self-nanoemulsifying drug deliverysystem for loratadin by extrusion-spheronization. Adv. Pharm. Bull. 2014, 4, 113–119. [CrossRef] [PubMed]
22. McClements, D.J. Nanoemulsions versus microemulsions: Terminology, differences, and similarities. Soft Matter 2012, 8,1719–1729. [CrossRef]
Pharmaceutics 2022, 14, 336 23 of 24
23. Azmi, N.A.N.; Elgharbawy, A.A.; Motlagh, S.R.; Samsudin, N.; Salleh, H.M. Nanoemulsions: Factory for food, pharmaceuticaland cosmetics. Processes 2019, 7, 617. [CrossRef]
24. Gupta, A.; Eral, H.B.; Hatton, T.A.; Doyle, P.S. Nanoemulsions: Formation, properties and applications. Soft Matter 2016, 12,2826–2841. [CrossRef]
25. Prajapat, M.D.; Patel, N.J.; Bariya, A.; Patel, S.S.; Butani, S.B. Formulation and evaluation of self-emulsifying drug delivery systemfor nimodipine, a BCS class II drug. J. Drug Deliv. Sci. Technol. 2017, 39, 59–68. [CrossRef]
26. Sanka, K.; Suda, D.; Bakshi, V. Optimization of solid-self nanoemulsifying drug delivery system for solubility and release profileof clonazepam using simplex lattice design. J. Drug Deliv. Sci. Technol. 2016, 33, 114–124. [CrossRef]
27. Kohli, K.; Chopra, S.; Dhar, D.; Arora, S.; Khar, R.K. Self-emulsifying drug delivery systems: An approach to enhance oralbioavailability. Drug Discov. Today 2010, 15, 958–965. [CrossRef]
28. Khadka, P.; Ro, J.; Kim, H.; Kim, I.; Kim, J.T.; Kim, H.; Cho, J.M.; Yun, G.; Lee, J. Pharmaceutical particle technologies: An approachto improve drug solubility, dissolution and bioavailability. Asian J. Pharm. Sci. 2014, 9, 304–316. [CrossRef]
29. Melis, V.; Usach, I.; Peris, J.E. Determination of sertraline in rat plasma by HPLC and fluorescence detection and its application toin vivo pharmacokinetic studies. J. Sep. Sci. 2012, 35, 3302–3307. [CrossRef]
30. Guideline, I.H.T. Validation of analytical procedures: Text and methodology. Q2 (R1) 2005, 1, 5.31. Shah, J.; Nair, A.B.; Jacob, S.; Patel, R.K.; Shah, H.; Shehata, T.M.; Morsy, M.A. Nanoemulsion based vehicle for effective ocular
delivery of moxifloxacin using experimental design and pharmacokinetic study in rabbits. Pharmaceutics 2019, 11, 230. [CrossRef][PubMed]
32. Akrawi, S.H.; Gorain, B.; Nair, A.B.; Choudhury, H.; Pandey, M.; Shah, J.N.; Venugopala, K.N. Development and optimization ofnaringenin-loaded chitosan-coated nanoemulsion for topical therapy in wound healing. Pharmaceutics 2020, 12, 893. [CrossRef][PubMed]
33. Nasr, A.; Gardouh, A.; Ghorab, M. Novel Solid Self-Nanoemulsifying Drug Delivery System (S-SNEDDS) for Oral Deliveryof Olmesartan Medoxomil: Design, Formulation, Pharmacokinetic and Bioavailability Evaluation. Pharmaceutics 2016, 8, 20.[CrossRef] [PubMed]
34. Shafiq, S.; Shakeel, F.; Talegaonkar, S.; Ahmad, F.J.; Khar, R.K.; Ali, M. Development and bioavailability assessment of ramiprilnanoemulsion formulation. Eur. J. Pharm. Biopharm. 2007, 66, 227–243. [CrossRef]
35. Shah, J.; Vasanti, S.; Anroop, B.; Vyas, H. Enhancement of dissolution rate of valdecoxib by solid dispersions technique with PVPK 30 & PEG 4000: Preparation and in vitro evaluation. J. Incl. Phenom. Macrocycl. Chem. 2009, 63, 69–75.
36. Jakki, R.; Afzal Syed, M.; Kandadi, P.; Veerabrahma, K. Development of a self-microemulsifying drug delivery system ofdomperidone: In vitro and in vivo characterization. Acta Pharm. 2013, 63, 241–251. [CrossRef]
37. Jhaveri, M.; Nair, A.B.; Shah, J.; Jacob, S.; Patel, V.; Mehta, T. Improvement of oral bioavailability of carvedilol by liquisolidcompact: Optimization and pharmacokinetic study. Drug Deliv. Transl. Res. 2020, 10, 975–985. [CrossRef]
38. Jacob, S.; Shirwaikar, A.; Nair, A. Preparation and evaluation of fast-disintegrating effervescent tablets of glibenclamide. DrugDev. Ind. Pharm. 2009, 35, 321–328. [CrossRef]
39. Nair, A.; Gupta, R.; Vasanti, S. In vitro controlled release of alfuzosin hydrochloride using HPMC-based matrix tablets and itscomparison with marketed product. Pharm. Dev. Technol. 2007, 12, 621–625. [CrossRef]
40. Eleftheriadis, G.K.; Mantelou, P.; Karavasili, C.; Chatzopoulou, P.; Katsantonis, D.; Irakli, M.; Mygdalia, A.; Vizirianakis, I.S.;Fatouros, D.G. Development and Characterization of a Self-Nanoemulsifying Drug Delivery System Comprised of Rice Bran Oilfor Poorly Soluble Drugs. AAPS PharmSciTech 2019, 20, 78. [CrossRef]
41. Dalal, R.; Shah, J.; Gorain, B.; Choudhury, H.; Jacob, S.; Mehta, T.A.; Shah, H.; Nair, A.B. Development and Optimization ofAsenapine Sublingual Film Using QbD Approach. AAPS PharmSciTech 2021, 22, 244. [CrossRef] [PubMed]
42. Chaudhary, S.; Nair, A.B.; Shah, J.; Gorain, B.; Jacob, S.; Shah, H.; Patel, V. Enhanced Solubility and Bioavailability of Dolutegravirby Solid Dispersion Method: In Vitro and In Vivo Evaluation—A Potential Approach for HIV Therapy. AAPS PharmSciTech 2021,22, 127. [CrossRef] [PubMed]
43. Sree Harsha, N.; Hiremath, J.G.; Sarudkar, S.; Attimarad, M.; Al-Dhubiab, B.; Nair, A.B.; Venugopala, K.N.; Asif, A.H. Spraydried amorphous form of simvastatin: Preparation and evaluation of the buccal tablet. Indian J. Pharm. Educ. Res. 2020, 54, 46–54.[CrossRef]
44. Nair, A.; Morsy, M.A.; Jacob, S. Dose translation between laboratory animals and human in preclinical and clinical phases of drugdevelopment. Drug Dev. Res. 2018, 79, 373–382. [CrossRef]
45. Satyavert; Gupta, S.; Choudhury, H.; Jacob, S.; Nair, A.B.; Dhanawat, M.; Munjal, K. Pharmacokinetics and tissue distribution ofhydrazinocurcumin in rats. Pharmacol. Rep. 2021, 73, 1734–1743. [CrossRef]
46. Kumar, S.; Yadav Ravulapalli, S.; Kumar Tiwari, S.; Gupta, S.; Nair, A.B.; Jacob, S. Effect of sex and food on the pharmacokineticsof different classes of BCS drugs in rats after cassette administration. Int. J. Pharm. 2021, 610, 121221. [CrossRef]
47. Shen, J.; Bi, J.; Tian, H.; Jin, Y.; Wang, Y.; Yang, X.; Yang, Z.; Kou, J.; Li, F. Preparation and evaluation of a self-nanoemulsifyingdrug delivery system loaded with Akebia saponin D-phospholipid complex. Int. J. Nanomed. 2016, 11, 4919–4929. [CrossRef]
48. Kawakami, K.; Yoshikawa, T.; Moroto, Y.; Kanaoka, E.; Takahashi, K.; Nishihara, Y.; Masuda, K. Microemulsion formulation forenhanced absorption of poorly soluble drugs. I. Prescription design. J. Control. Release 2002, 81, 65–74. [CrossRef]
49. Kreilgaard, M.; Pedersen, E.J.; Jaroszewski, J.W. NMR characterisation and transdermal drug delivery potential of microemulsionsystems. J. Control. Release 2000, 69, 421–433. [CrossRef]
Pharmaceutics 2022, 14, 336 24 of 24
50. Azeem, A.; Rizwan, M.; Ahmad, F.J.; Iqbal, Z.; Khar, R.K.; Aqil, M.; Talegaonkar, S. Nanoemulsion components screening andselection: A technical note. AAPS PharmSciTech 2009, 10, 69–76. [CrossRef]
51. Attwood, D.; Mallon, C.; Ktistis, G.; Taylor, C. A study on factors influencing the droplet size in nonionic oil-in-water microemul-sions. Int. J. Pharm. 1992, 88, 417–422. [CrossRef]
52. Savjani, K.T.; Gajjar, A.K.; Savjani, J.K. Drug solubility: Importance and enhancement techniques. ISRN Pharm. 2012, 2012, 195727.[CrossRef] [PubMed]
53. Joung, H.J.; Choi, M.J.; Kim, J.T.; Park, S.H.; Park, H.J.; Shin, G.H. Development of Food-Grade Curcumin Nanoemulsion and itsPotential Application to Food Beverage System: Antioxidant Property and In Vitro Digestion. J. Food Sci. 2016, 81, N745–N753.[CrossRef] [PubMed]
54. Shah, N.; Carvajal, M.; Patel, C.; Infeld, M.; Malick, A. Self-emulsifying drug delivery systems (SEDDS) with polyglycolyzedglycerides for improving in vitro dissolution and oral absorption of lipophilic drugs. Int. J. Pharm. 1994, 106, 15–23. [CrossRef]
55. Vraníková, B.; Gajdziok, J. Liquisolid systems and aspects influencing their research and development. Acta Pharm. 2013, 63,447–465. [CrossRef] [PubMed]
56. Wang, J.; Trinkle, D.; Derbin, G.; Martin, K.; Sharif, S.; Timmins, P.; Desa, D. Moisture adsorption and desorption properties ofcolloidal silicon dioxide and its impact on layer adhesion of a bilayer tablet formulation. J. Excip. Food Chem. 2016, 5, 1004.
57. Shah, R.B.; Tawakkul, M.A.; Khan, M.A. Comparative evaluation of flow for pharmaceutical powders and granules. AAPSPharmSciTech 2008, 9, 250–258. [CrossRef]
58. Butler, J.; Hens, B.; Vertzoni, M.; Brouwers, J.; Berben, P.; Dressman, J.; Andreas, C.J.; Schaefer, K.J.; Mann, J.; McAllister, M.; et al.In vitro models for the prediction of in vivo performance of oral dosage forms: Recent progress from partnership through theIMI OrBiTo collaboration. Eur. J. Pharm. Biopharm. 2019, 136, 70–83. [CrossRef]
59. Jacob, S.; Nair, A.B. An updated overview with simple and practical approach for developing in vitro-in vivo correlation. DrugDev. Res. 2018, 79, 97–110. [CrossRef]
60. Granero, G.E.; Longhi, M.R.; Mora, M.J.; Junginger, H.E.; Midha, K.K.; Shah, V.P.; Stavchansky, S.; Dressman, J.B.; Barends, D.M.Biowaiver monographs for immediate release solid oral dosage forms: Furosemide. J. Pharm. Sci. 2010, 99, 2544–2556. [CrossRef]
61. Mendes, C.; Buttchevitz, A.; Kruger, J.H.; Caon, T.; de Oliveira Benedet, P.; Lemos-Senna, E.; Silva, M.A.S. Self-NanoemulsifiedDrug Delivery System of Hydrochlorothiazide for Increasing Dissolution Rate and Diuretic Activity. AAPS PharmSciTech 2017, 18,2494–2504. [CrossRef] [PubMed]
62. Agarwal, V.; Siddiqui, A.; Ali, H.; Nazzal, S. Dissolution and powder flow characterization of solid self-emulsified drug deliverysystem (SEDDS). Int. J. Pharm. 2009, 366, 44–52. [CrossRef] [PubMed]
63. Tran, T.T.D.; Tran, P.H.L. Molecular Interactions in Solid Dispersions of Poorly Water-Soluble Drugs. Pharmaceutics 2020, 12, 745.[CrossRef] [PubMed]
64. Hancock, B.C.; Shamblin, S.L.; Zografi, G. Molecular mobility of amorphous pharmaceutical solids below their glass transitiontemperatures. Pharm. Res. 1995, 12, 799–806. [CrossRef] [PubMed]