Durable goods: More sustainable products, better consumer ...
Upload
khangminh22Category
view
0download
0
Mass productionforming of high strength steel with
durable tooling(Duratool)
doi:10.2777/9504
Mass production form
ing of high strength steel with durable tooling (D
uratool)EU
EUR 25329
KI-NA-25329-EN
-N
The use of (advanced) high strength sheet (A)HSS in forming, shearing and punching applications places increasing demands upon tool materials, particularly in terms of wear performance. A range of tool and sheet steel materials has been studied within the Duratoolproject. Tribological tests were used to assess wear and friction in forming. High volume forming, shearing and punching trials were also conducted.
The tribological findings indicate that conventional tool materials do not perform well in terms of adhesive wear or abrasive wear for steels of tensile strengths above 800 MPa and that more advanced tool materials and coatings must be considered. Tool roughness and lubrication should be controlled to minimise adhesive wear.
A finite element model has been developed to predict abrasive tool wear in forming. The model can be used to simulate tool wear and changes in subsequent part geometry. Studies show that changes in part geometry due to tool wear are significant for (A)HSS.
For best performance in shearing, the process should be optimised. A cutting clearance equal to 5 % of sheet thickness and a shear angle of 1 ° is suitable for all sheet strengths. High volume shearing trials show that edge quality is more dependent on sheet ductility than tool wear. High strength steels produce a good edge with small burrs simply due to their reduced ductility, despite incurring increased tool wear.
In punching trials, conventional tool steels were found to work well to 200 000 strokes for low carbon and mid-range high strength steels. For more demanding AHSS grades, only PM tool steels offered acceptable performance.
The results of the project have been summarised in the form of tool selection guidelines.
Studies and reports
Research and Innovation EUR 25329 EN

EUROPEAN COMMISSION Directorate-General for Research and Innovation Directorate G — Industrial Technologies Unit G.5 — Research Fund for Coal and Steel
E-mail: [email protected] [email protected]
Contact: RFCS Publications
European Commission
HOW TO OBTAIN EU PUBLICATIONS Free publications: • via EU Bookshop (http://bookshop.europa.eu);
• at the European Union’s representations or delegations. You can obtain their contact details on the Internet (http://ec.europa.eu) or by sending a fax to +352 2929-42758.
Priced publications: • via EU Bookshop (http://bookshop.europa.eu).
Priced subscriptions (e.g. annual series of the Official Journal of the European Union and reports of cases before the Court of Justice of the European Union): • via one of the sales agents of the Publications Office of the European Union
(http://publications.europa.eu/others/agents/index_en.htm).
B-1049 Brussels
European Commission
Research Fund for Coal and SteelMass production forming of high strength steel
with durable tooling (Duratool)
Louisa Carless-Elliott and Gerard KrusemeijerCorus Technology BV
Wenckebachstraat 1, IJmuiden, THE NETHERLANDS
Dominique KircherArcelor Research SA
Voie Romaine, Maizières-lès-Metz, FRANCE
Irma HeikkilaKIMAB AB
DrottningKristinasvag 48, Stockholm, SWEDEN
Daniel ErikssonSSAB Tunnplåt
AB781 84 Borlänge, SWEDEN
Emile van der HeideTNO Industrie
De Rondom 1, Eindhoven, THE NETHERLANDS
Berne HögmanUddelholm Tooling
AB17 Värmlandslän, Hagfors, SWEDEN
Riccardo PortaCentro Sviluppo Materiali SpA
Via di Castel Romano 100, Rome, ITALY
Grant Agreement RFSR-CT-2003-00032 1 September 2003 to 31 May 2007
Final report
Directorate-General for Research and Innovation
2013 EUR 25329 EN
LEGAL NOTICE
Neither the European Commission nor any person acting on behalf of the Commission is responsible for the use which might be made of the following information.
The views expressed in this publication are the sole responsibility of the authors and do not necessarily reflect the views of the European Commission.
More information on the European Union is available on the Internet (http://europa.eu). Cataloguing data can be found at the end of this publication. Luxembourg: Publications Office of the European Union, 2013 ISBN 978-92-79-24934-1 doi:10.2777/5904 © European Union, 2013 Reproduction is authorised provided the source is acknowledged. Printed in Luxembourg Printed on white chlorine-free paper
Europe Direct is a service to help you find answers to your questions about the European Union
Freephone number (*):00 800 6 7 8 9 10 11
(*) Certain mobile telephone operators do not allow access to 00 800 numbers or these calls may be billed.
3
CONTENTS 1. FINAL SUMMARY 5
1.1 INTRODUCTION 5 1.2 TOOL MATERIALS (WP1) 5 1.3 FORMING PERFORMANCE (WP2 AND WP4) 6 1.4 SHEARING PERFORMANCE (WP3 TASKS 1 AND 3)) 10 1.5 PUNCHING PERFORMANCE (WP3, TASK 2) 12 1.6 ABRASIVE TOOL WEAR MODEL (WP5) 13 1.7 TOOL SELECTION GUIDELINES (WP6) 15
2. INTRODUCTION AND BACKGROUND 17
2.1 BACKGROUND TO THE PROJECT 17 2.2 SOLVING THE PROBLEM OF TOOL WEAR 17 2.3 THE DURATOOL PROJECT 18 2.4 PARTNERS 18 2.5 THE RESEARCH WORK 19
3. WP1 MATERIAL SPECIFICATIONS AND REQUIREMENTS 21
3.1 TASK 1.1: SELECTION OF SHEET MATERIALS 21 3.2 TASK 1.1: SELECTION OF TOOL MATERIALS 21 3.3 TASKS 1.2 AND 1.4 PRODUCTION OF MATERIALS AND TEST SAMPLES 27 3.4 TASK 1.3: DETERMINATION OF SELECTED MATERIAL PROPERTIES 27
4. WP 2 TRIBOLOGICAL ASSESSMENT FOR FORMING APPLICATIONS 29
4.1 TASK 2.1: ANALYSIS OF CRITICAL CONTACT SITUATIONS DURING FORMING 29 4.2 TASK 2.2: SLIDER ON SHEET (TNO) 31 4.3 TASK 2.2: BENDING UNDER TENSION TEST (KIMAB) 40 4.4 TASK 2.3 FRICTIONAL STABILITY OF THE SELECTED SYSTEMS (CORUS) 49 4.5 TASK 2.4: ENHANCED SHEET SURFACES (ARCELOR) 55 4.6 TASK 2.5: ADHESIVE WEAR TESTS (CSM) 60 4.7 TASK 2.6: OVERALL ANALYSIS OF WP2 RESULTS 62
5. WP3 PUNCHING AND SHEARING WITH DURABLE TOOLING 65
5.1 TASK 3.1: REDESIGN AND EVALUATION OF A PUNCHING AND SHEARING TEST 65 5.2 TASK 3.2: HIGH VOLUME PUNCHING 71 5.3 TASK 3.3: HIGH VOLUME SHEARING 79 5.4 SUMMARY OF WP3 WITH RESPECT TO TOOL SELECTION GUIDELINES 83
6. WP4 FORMING WITH WEAR RESISTANT TOOLING 85
6.1 TASK 4.1: EFFECT OF TOOL MATERIALS ON SLIDING BEHAVIOUR [CSM]. 85 6.2 TASK 4.2: DESIGN OF HIGH VOLUME EXPERIMENTS [ARCELOR]. 87 6.3 TASK 4.3: VALIDATION OF THE RESULTS IN A SEMI-INDUSTRIAL ENVIRONMENT [ARCELOR]. 90
7. WP5 FORMING MODEL INCORPORATING TOOL WEAR 95
7.1 TASK 5.1: TOOL WEAR MODEL (CORUS, TNO) 95 7.2 TASK 5.2: STUDY OF THE EFFECT OF DRAW-IN RADIUS WEAR ON PRODUCT GEOMETRY 98 7.3 TASK 5.3: INITIAL VALIDATION OF FORMING SIMULATIONS (CORUS) 101 7.4 TASK 5.3: VALIDATION USING ARCELOR SEMI-INDUSTRIAL TRIAL DATA (CORUS) 104 7.5 TASK 5.4: VISUALISATION OF THE RESULTS IN MS POWERPOINT (CORUS) 105
8. WP6 COMMUNICATION AND ADMINISTRATION 107
8.1 TASK 6.2-3: TOOL SELECTION GUIDELINES 107 8.2 TASK 6.4: HTTP://DURATOOL.C-S-M.IT/ 107
9. CONCLUSIONS 109

4
10. LIST OF FIGURES 111
11. LIST OF TABLES 114
12. LIST OF REFERENCES 115
5
MASS PRODUCTION FORMING OF HIGH STRENGTH STEEL WITH DURABLE TOOLING RFCS Agreement No. RFS-CR-03032 Final report for the period 1st September 2003 – 31st May 2007
1. FINAL SUMMARY
1.1 Introduction
The application of HSS has been shown in FE studies to lead to higher forces, pressures and mechanical loading conditions (Task 2.1). This places increasing demands on tool materials, particularly in terms of their durability and wear performance. A range of tool materials have been studied within DURATOOL using tribological tests to assess wear and friction in forming and in long term tests of shearing and punching performance.
1.2 Tool materials (WP1)
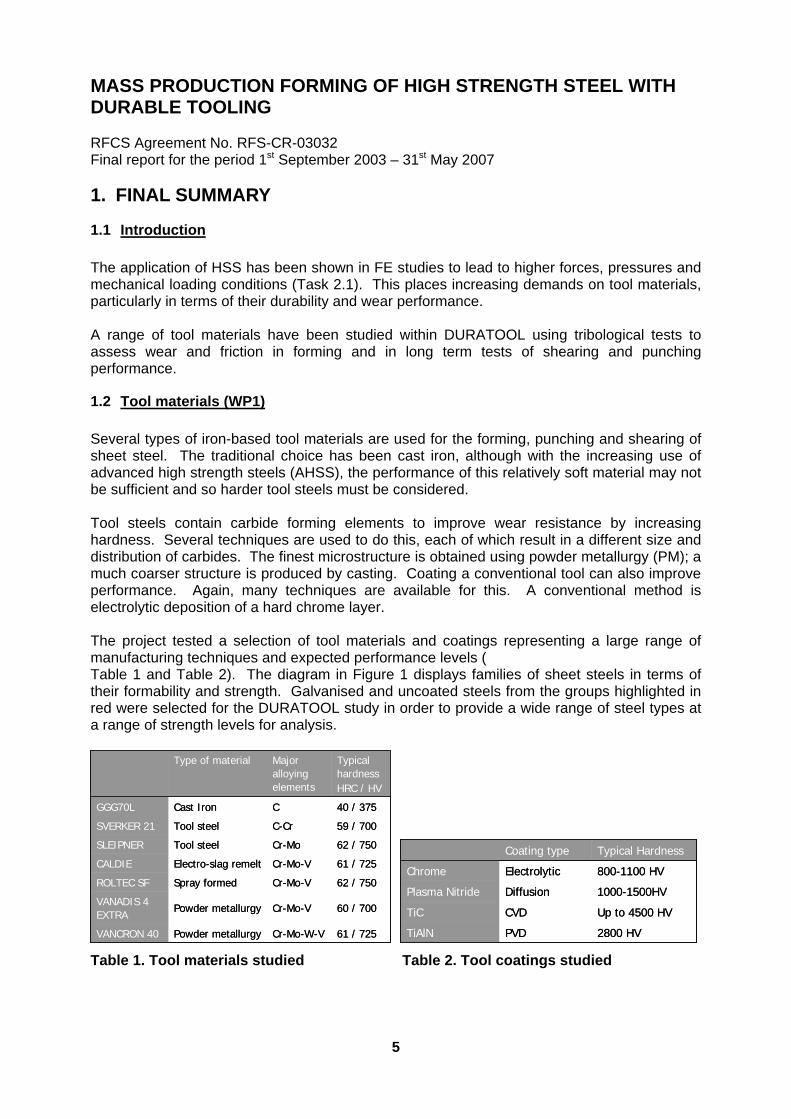
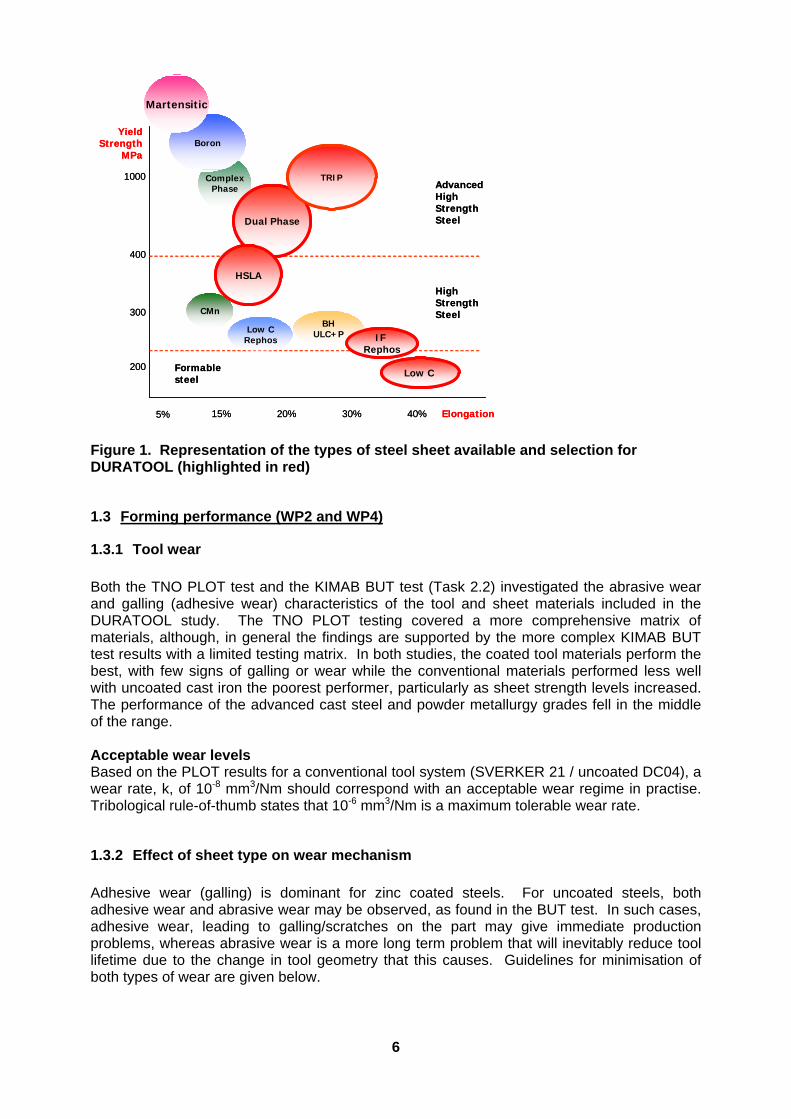
Several types of iron-based tool materials are used for the forming, punching and shearing of sheet steel. The traditional choice has been cast iron, although with the increasing use of advanced high strength steels (AHSS), the performance of this relatively soft material may not be sufficient and so harder tool steels must be considered. Tool steels contain carbide forming elements to improve wear resistance by increasing hardness. Several techniques are used to do this, each of which result in a different size and distribution of carbides. The finest microstructure is obtained using powder metallurgy (PM); a much coarser structure is produced by casting. Coating a conventional tool can also improve performance. Again, many techniques are available for this. A conventional method is electrolytic deposition of a hard chrome layer. The project tested a selection of tool materials and coatings representing a large range of manufacturing techniques and expected performance levels ( Table 1 and Table 2). The diagram in Figure 1 displays families of sheet steels in terms of their formability and strength. Galvanised and uncoated steels from the groups highlighted in red were selected for the DURATOOL study in order to provide a wide range of steel types at a range of strength levels for analysis.
Cr-Mo-W-V
Cr-Mo-V
Cr-Mo-V
Cr-Mo-V
Cr-Mo
C-Cr
C
Major alloying elements
Type of material Typical hardnessHRC / HV
61 / 725Powder metallurgyVANCRON 40
60 / 700Powder metallurgyVANADIS 4 EXTRA
62 / 750Spray formedROLTEC SF
61 / 725Electro-slag remeltCALDIE
62 / 750Tool steelSLEIPNER
59 / 700Tool steelSVERKER 21
40 / 375Cast IronGGG70L
Coating type Typical Hardness
2800 HVPVDTiAlN
Up to 4500 HVCVDTiC
1000-1500HVDiffusionPlasma Nitride
800-1100 HVElectrolyticChrome
Coating type Typical Hardness
2800 HVPVDTiAlN
Up to 4500 HVCVDTiC
1000-1500HVDiffusionPlasma Nitride
800-1100 HVElectrolyticChrome
Table 1. Tool materials studied Table 2. Tool coatings studied
6
Elongation
Yield Strength
MPa
15% 20% 30% 40%
200
1000
400
300
High Strength Steel
Formable steel
Advanced High Strength Steel
ComplexPhase
Dual Phase
Boron
Martensitic
Low C
BHULC+P
TRIP
Low CRephos IF
Rephos
CMn
HSLA
5% Elongation
Yield Strength
MPa
15% 20% 30% 40%
200
1000
400
300
High Strength Steel
Formable steel
Advanced High Strength Steel
ComplexPhase
Dual Phase
Boron
Martensitic
Low C
BHULC+P
TRIP
Low CRephos IF
Rephos
CMn
HSLA
5% Figure 1. Representation of the types of steel sheet available and selection for DURATOOL (highlighted in red)
1.3 Forming performance (WP2 and WP4)
1.3.1 Tool wear
Both the TNO PLOT test and the KIMAB BUT test (Task 2.2) investigated the abrasive wear and galling (adhesive wear) characteristics of the tool and sheet materials included in the DURATOOL study. The TNO PLOT testing covered a more comprehensive matrix of materials, although, in general the findings are supported by the more complex KIMAB BUT test results with a limited testing matrix. In both studies, the coated tool materials perform the best, with few signs of galling or wear while the conventional materials performed less well with uncoated cast iron the poorest performer, particularly as sheet strength levels increased. The performance of the advanced cast steel and powder metallurgy grades fell in the middle of the range. Acceptable wear levels Based on the PLOT results for a conventional tool system (SVERKER 21 / uncoated DC04), a wear rate, k, of 10-8 mm3/Nm should correspond with an acceptable wear regime in practise. Tribological rule-of-thumb states that 10-6 mm3/Nm is a maximum tolerable wear rate.
1.3.2 Effect of sheet type on wear mechanism
Adhesive wear (galling) is dominant for zinc coated steels. For uncoated steels, both adhesive wear and abrasive wear may be observed, as found in the BUT test. In such cases, adhesive wear, leading to galling/scratches on the part may give immediate production problems, whereas abrasive wear is a more long term problem that will inevitably reduce tool lifetime due to the change in tool geometry that this causes. Guidelines for minimisation of both types of wear are given below.
7
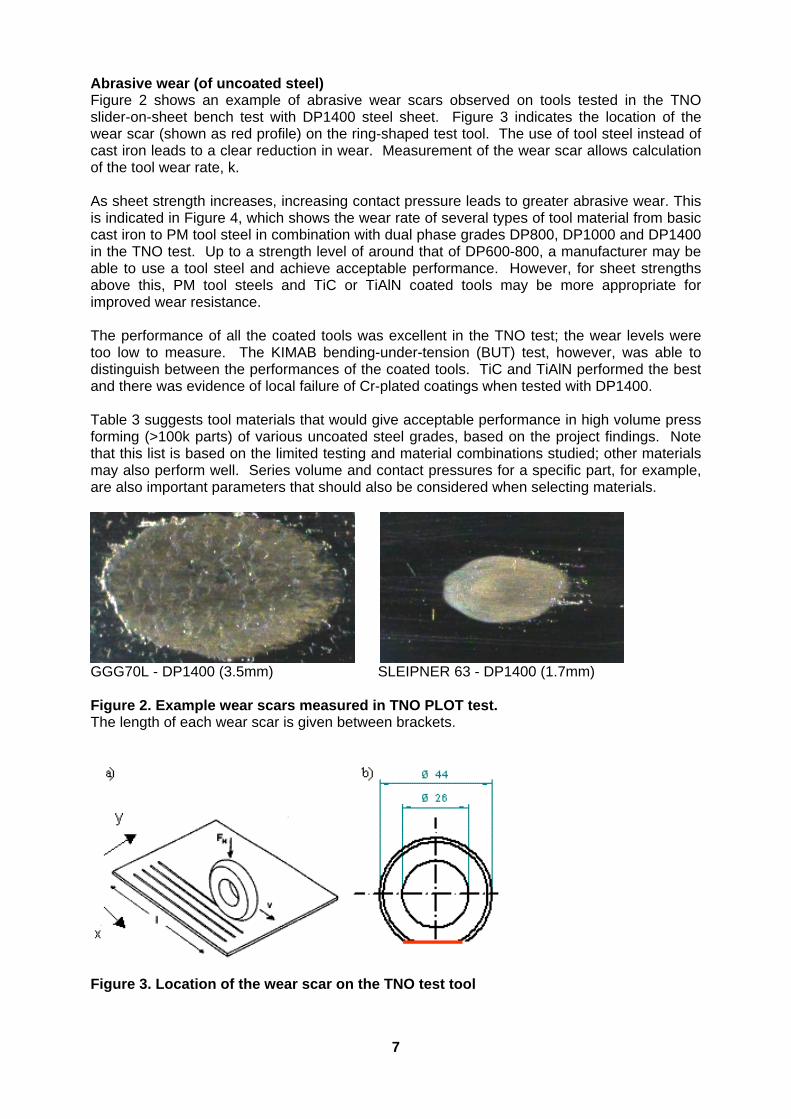
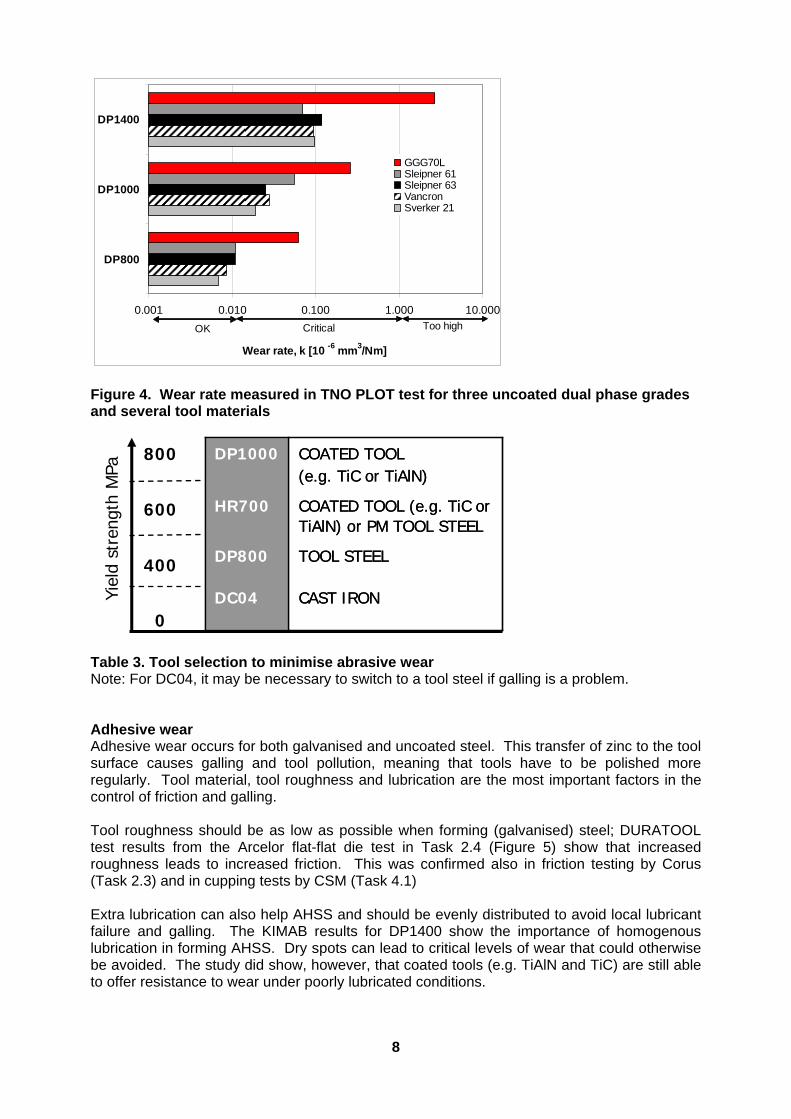
Abrasive wear (of uncoated steel) Figure 2 shows an example of abrasive wear scars observed on tools tested in the TNO slider-on-sheet bench test with DP1400 steel sheet. Figure 3 indicates the location of the wear scar (shown as red profile) on the ring-shaped test tool. The use of tool steel instead of cast iron leads to a clear reduction in wear. Measurement of the wear scar allows calculation of the tool wear rate, k. As sheet strength increases, increasing contact pressure leads to greater abrasive wear. This is indicated in Figure 4, which shows the wear rate of several types of tool material from basic cast iron to PM tool steel in combination with dual phase grades DP800, DP1000 and DP1400 in the TNO test. Up to a strength level of around that of DP600-800, a manufacturer may be able to use a tool steel and achieve acceptable performance. However, for sheet strengths above this, PM tool steels and TiC or TiAlN coated tools may be more appropriate for improved wear resistance. The performance of all the coated tools was excellent in the TNO test; the wear levels were too low to measure. The KIMAB bending-under-tension (BUT) test, however, was able to distinguish between the performances of the coated tools. TiC and TiAlN performed the best and there was evidence of local failure of Cr-plated coatings when tested with DP1400. Table 3 suggests tool materials that would give acceptable performance in high volume press forming (>100k parts) of various uncoated steel grades, based on the project findings. Note that this list is based on the limited testing and material combinations studied; other materials may also perform well. Series volume and contact pressures for a specific part, for example, are also important parameters that should also be considered when selecting materials.
GGG70L - DP1400 (3.5mm) SLEIPNER 63 - DP1400 (1.7mm) Figure 2. Example wear scars measured in TNO PLOT test. The length of each wear scar is given between brackets.
Figure 3. Location of the wear scar on the TNO test tool
8
0.001 0.010 0.100 1.000 10.000
DP800
DP1000
DP1400
Wear rate, k [10 -6 mm3/Nm]
GGG70LSleipner 61Sleipner 63VancronSverker 21
OK Critical Too high
Figure 4. Wear rate measured in TNO PLOT test for three uncoated dual phase grades and several tool materials
DC04
COATED TOOL (e.g. TiC or TiAlN) or PM TOOL STEEL
HR700
TOOL STEELDP800
CAST IRON
COATED TOOL (e.g. TiC or TiAlN)
DP1000
DC04
COATED TOOL (e.g. TiC or TiAlN) or PM TOOL STEEL
HR700
TOOL STEELDP800
CAST IRON
COATED TOOL (e.g. TiC or TiAlN)
DP1000
Yiel
dst
reng
thM
Pa
800
600
400
0
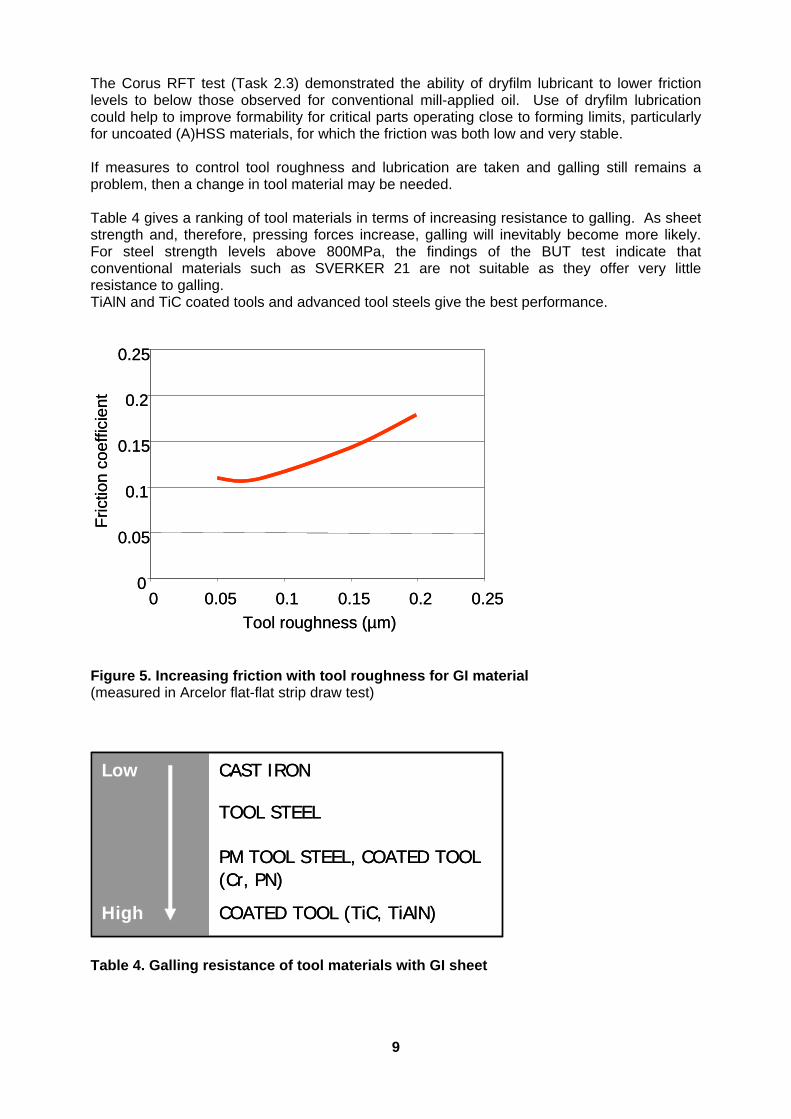
Table 3. Tool selection to minimise abrasive wear Note: For DC04, it may be necessary to switch to a tool steel if galling is a problem. Adhesive wear Adhesive wear occurs for both galvanised and uncoated steel. This transfer of zinc to the tool surface causes galling and tool pollution, meaning that tools have to be polished more regularly. Tool material, tool roughness and lubrication are the most important factors in the control of friction and galling. Tool roughness should be as low as possible when forming (galvanised) steel; DURATOOL test results from the Arcelor flat-flat die test in Task 2.4 (Figure 5) show that increased roughness leads to increased friction. This was confirmed also in friction testing by Corus (Task 2.3) and in cupping tests by CSM (Task 4.1) Extra lubrication can also help AHSS and should be evenly distributed to avoid local lubricant failure and galling. The KIMAB results for DP1400 show the importance of homogenous lubrication in forming AHSS. Dry spots can lead to critical levels of wear that could otherwise be avoided. The study did show, however, that coated tools (e.g. TiAlN and TiC) are still able to offer resistance to wear under poorly lubricated conditions.
9
The Corus RFT test (Task 2.3) demonstrated the ability of dryfilm lubricant to lower friction levels to below those observed for conventional mill-applied oil. Use of dryfilm lubrication could help to improve formability for critical parts operating close to forming limits, particularly for uncoated (A)HSS materials, for which the friction was both low and very stable. If measures to control tool roughness and lubrication are taken and galling still remains a problem, then a change in tool material may be needed. Table 4 gives a ranking of tool materials in terms of increasing resistance to galling. As sheet strength and, therefore, pressing forces increase, galling will inevitably become more likely. For steel strength levels above 800MPa, the findings of the BUT test indicate that conventional materials such as SVERKER 21 are not suitable as they offer very little resistance to galling. TiAlN and TiC coated tools and advanced tool steels give the best performance.
0
0.05
0.1
0.15
0.2
0.25
0 0.05 0.1 0.15 0.2 0.25
Tool roughness (µm)
Fric
tion
co
effi
cie
nt
0
0.05
0.1
0.15
0.2
0.25
0 0.05 0.1 0.15 0.2 0.25
Tool roughness (µm)
Fric
tion
co
effi
cie
nt
Figure 5. Increasing friction with tool roughness for GI material (measured in Arcelor flat-flat strip draw test)
COATED TOOL (TiC, TiAlN) High
PM TOOL STEEL, COATED TOOL (Cr, PN)
TOOL STEEL
CAST IRONLow
COATED TOOL (TiC, TiAlN) High
PM TOOL STEEL, COATED TOOL (Cr, PN)
TOOL STEEL
CAST IRONLow
Table 4. Galling resistance of tool materials with GI sheet
10
1.3.3 Semi-industrial forming trials
The development of wear during forming was studied using a high volume U-bead test at Arcelor. Due to the cost of each set of inserts and the anticipated duration of each trial, the testing matrix had to be limited. Therefore, it was decided to test two different sheet materials: HR60, which is galvanised and on which we should observe adhesive wear, and Docol 1000DP, which is uncoated and should lead to abrasive wear. It was agreed that the trials should run to 10,000 stamped parts for each combination. However, flexibility reserved to make more or less strokes, depending upon the results obtained during the run. Galling It was expected that galling would be observed on galvanised HR60 material formed using SVERKER 21 tools. However, in order to form successful parts using this steel grade, the draw beads had to be removed (reducing blankholder load alone did not work). This led to less severe testing conditions and no adhesive wear developed, even after an extended run of 20000 strokes. Abrasive wear Abrasive wear was measured at a level of around 25µm (+/- 7.5µm) on cast iron draw-beads stamping uncoated DP1000 after 35000 hits. Due to the accuracy of the measurement device, no wear was detected at 10000 or 25000 hits. A harder SVERKER 21 draw-bead was also tested and no wear was measureable after 75000 hits. Based on the relative difference in k-value for GGG70L and SVERKER 21 measured by TNO for DP1000, it could be estimated that 350 000 parts would need to be hit in order to observe a wear level of 25µm, so the result is not surprising. Even more parts would have to be made to see comparable results for VANCRON and coated SLEIPNER TiAlN tools. It should be noted that the addition of extra lubricant into the U-bead forming press would have altered the wear rate of these materials, which was measured by TNO only in an as-received condition. The wear rate would have been lower in the Arcelor trials due to the presence of additional lubrication. Due to the project timetable and the budget initially forecast for the semi-industrial trials (based on 10000 hits for 8 configurations) it will not be possible to go further with the trial matrix planned. 130,000 parts have been stamped already, far beyond the 80 000 anticipated. The remaining stock of DP1000 material is also low. This test also needs to be optimised in order to obtain results within a “reasonable” number of hits. We are unable to use this U-bead trial data for the validation of WP2 and WP5 results as had been anticipated.
1.4 Shearing performance (WP3 Tasks 1 and 3))
1.4.1 Shearing parameters
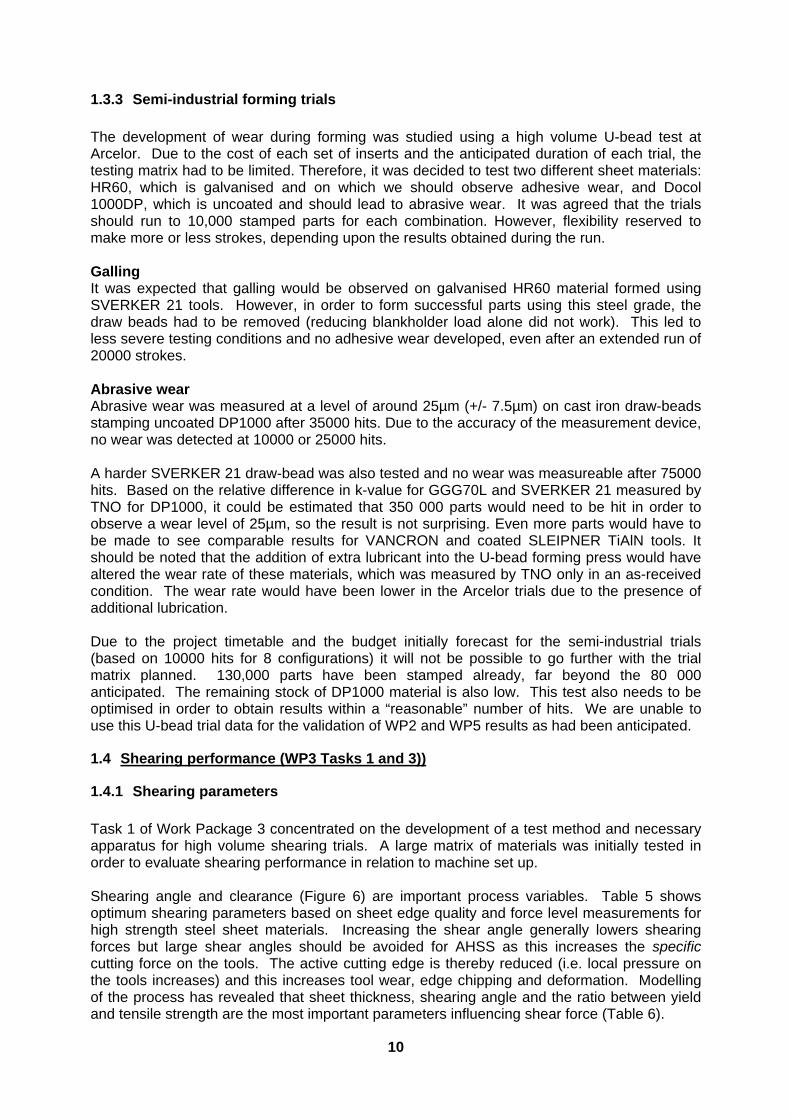
Task 1 of Work Package 3 concentrated on the development of a test method and necessary apparatus for high volume shearing trials. A large matrix of materials was initially tested in order to evaluate shearing performance in relation to machine set up. Shearing angle and clearance (Figure 6) are important process variables. Table 5 shows optimum shearing parameters based on sheet edge quality and force level measurements for high strength steel sheet materials. Increasing the shear angle generally lowers shearing forces but large shear angles should be avoided for AHSS as this increases the specific cutting force on the tools. The active cutting edge is thereby reduced (i.e. local pressure on the tools increases) and this increases tool wear, edge chipping and deformation. Modelling of the process has revealed that sheet thickness, shearing angle and the ratio between yield and tensile strength are the most important parameters influencing shear force (Table 6).
11
Figure 6. Shearing angle α and cutting clearance
1 °SHEAR ANGLE
5% OF THICKNESSCUTTING CLEARANCE
1 °SHEAR ANGLE
5% OF THICKNESSCUTTING CLEARANCE
Table 5. Optimum shearing parameters
SHEAR ANGLE
THICKNESS
YIELD/TENSILE RATIO
SHEAR FORCEVARIABLE
SHEAR ANGLE
THICKNESS
YIELD/TENSILE RATIO
SHEAR FORCEVARIABLE
Table 6. Effect of shear parameters on force Note: Effect of shear angle on specific shear force is also important (in terms of wear), see text.
1.4.2 Shearing performance
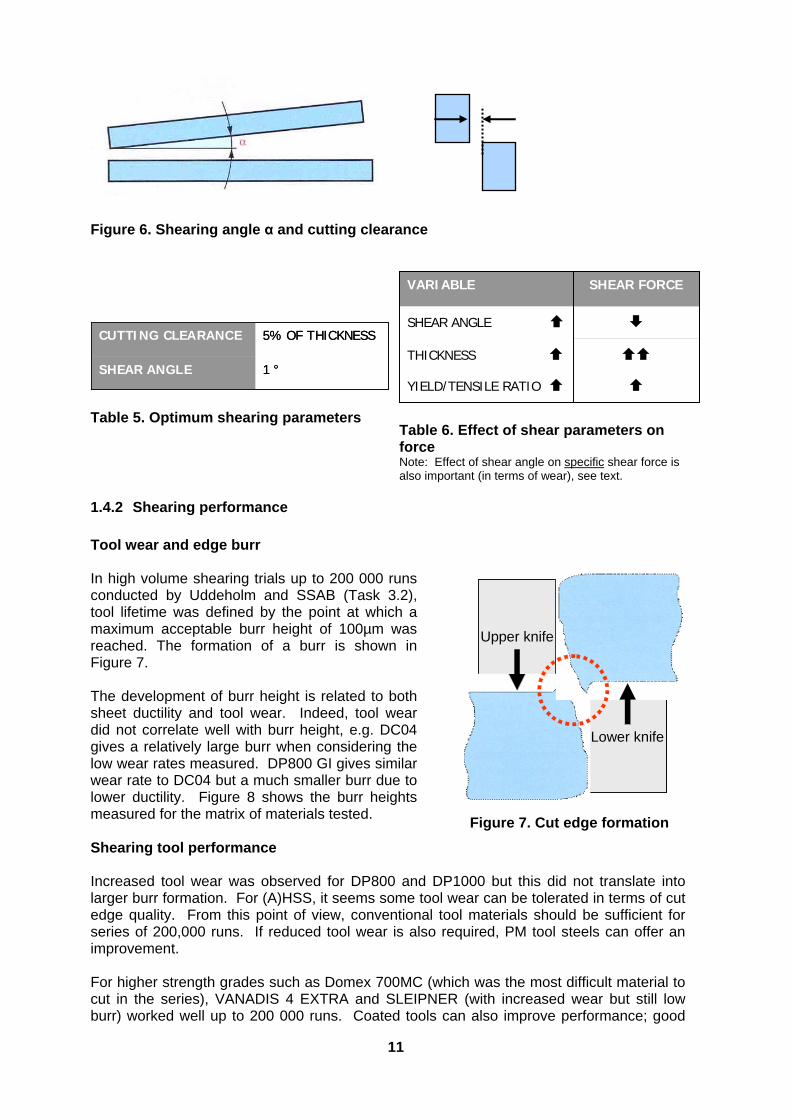
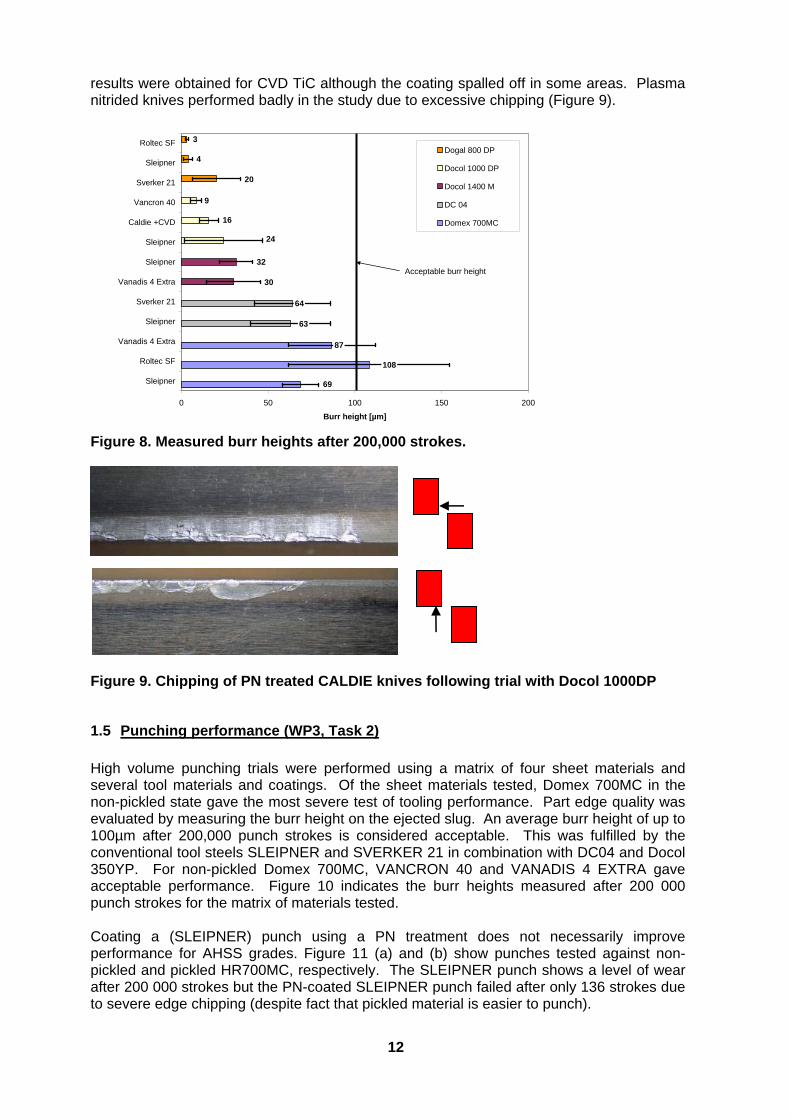
Tool wear and edge burr In high volume shearing trials up to 200 000 runs conducted by Uddeholm and SSAB (Task 3.2), tool lifetime was defined by the point at which a maximum acceptable burr height of 100µm was reached. The formation of a burr is shown in Figure 7. The development of burr height is related to both sheet ductility and tool wear. Indeed, tool wear did not correlate well with burr height, e.g. DC04 gives a relatively large burr when considering the low wear rates measured. DP800 GI gives similar wear rate to DC04 but a much smaller burr due to lower ductility. Figure 8 shows the burr heights measured for the matrix of materials tested. Shearing tool performance Increased tool wear was observed for DP800 and DP1000 but this did not translate into larger burr formation. For (A)HSS, it seems some tool wear can be tolerated in terms of cut edge quality. From this point of view, conventional tool materials should be sufficient for series of 200,000 runs. If reduced tool wear is also required, PM tool steels can offer an improvement. For higher strength grades such as Domex 700MC (which was the most difficult material to cut in the series), VANADIS 4 EXTRA and SLEIPNER (with increased wear but still low burr) worked well up to 200 000 runs. Coated tools can also improve performance; good
Upper knife
Lower knife
Upper knife
Lower knife
Figure 7. Cut edge formation
12
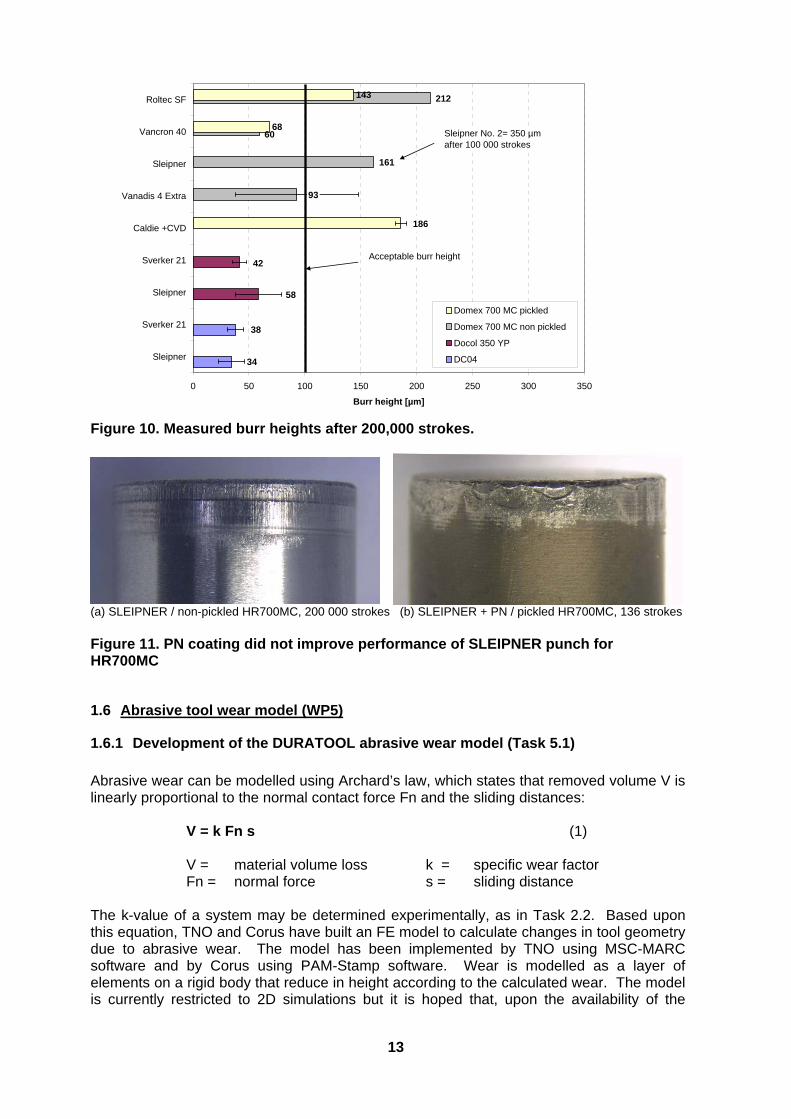
results were obtained for CVD TiC although the coating spalled off in some areas. Plasma nitrided knives performed badly in the study due to excessive chipping (Figure 9).
87
64
69
108
63
30
32
9
16
24
20
4
3
0 50 100 150 200
Sleipner
Roltec SF
Vanadis 4 Extra
Sleipner
Sverker 21
Vanadis 4 Extra
Sleipner
Sleipner
Caldie +CVD
Vancron 40
Sverker 21
Sleipner
Roltec SF
Burr height [µm]
Dogal 800 DP
Docol 1000 DP
Docol 1400 M
DC 04
Domex 700MC
Acceptable burr height
Figure 8. Measured burr heights after 200,000 strokes.
Figure 9. Chipping of PN treated CALDIE knives following trial with Docol 1000DP
1.5 Punching performance (WP3, Task 2)
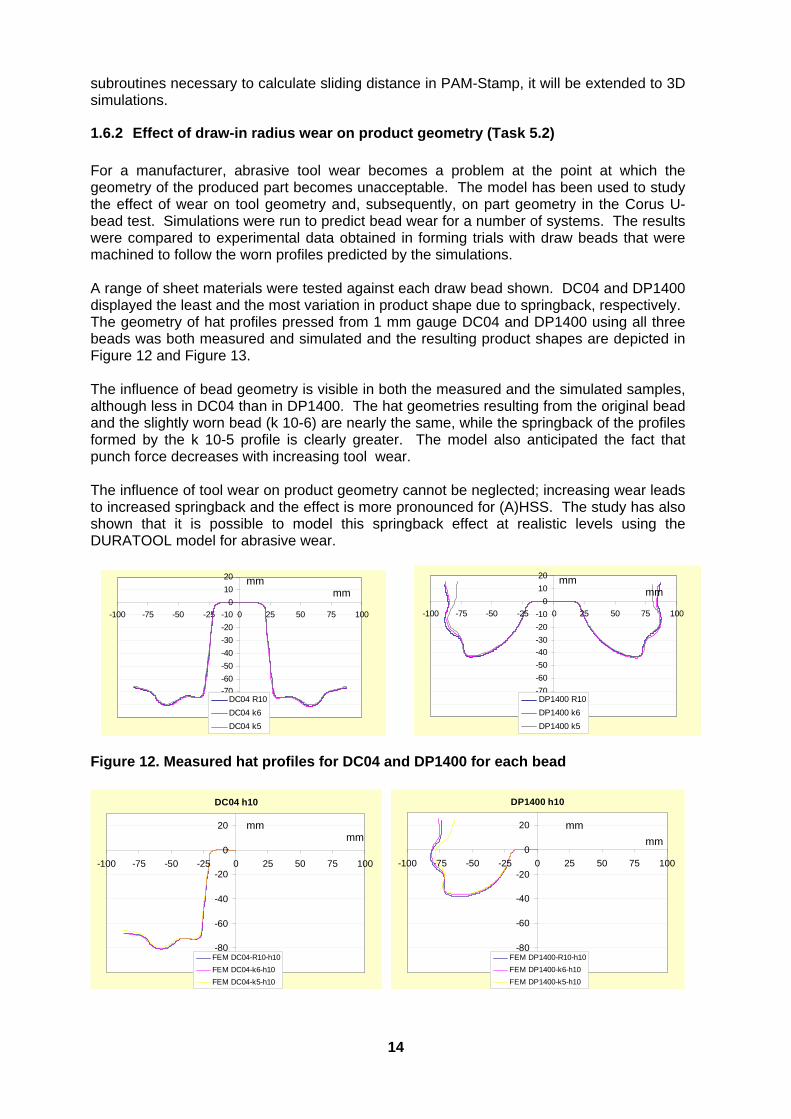
High volume punching trials were performed using a matrix of four sheet materials and several tool materials and coatings. Of the sheet materials tested, Domex 700MC in the non-pickled state gave the most severe test of tooling performance. Part edge quality was evaluated by measuring the burr height on the ejected slug. An average burr height of up to 100µm after 200,000 punch strokes is considered acceptable. This was fulfilled by the conventional tool steels SLEIPNER and SVERKER 21 in combination with DC04 and Docol 350YP. For non-pickled Domex 700MC, VANCRON 40 and VANADIS 4 EXTRA gave acceptable performance. Figure 10 indicates the burr heights measured after 200 000 punch strokes for the matrix of materials tested. Coating a (SLEIPNER) punch using a PN treatment does not necessarily improve performance for AHSS grades. Figure 11 (a) and (b) show punches tested against non-pickled and pickled HR700MC, respectively. The SLEIPNER punch shows a level of wear after 200 000 strokes but the PN-coated SLEIPNER punch failed after only 136 strokes due to severe edge chipping (despite fact that pickled material is easier to punch).
13
68
143
38
34
42
58
93
161
60
212
186
0 50 100 150 200 250 300 350
Sleipner
Sverker 21
Sleipner
Sverker 21
Caldie +CVD
Vanadis 4 Extra
Sleipner
Vancron 40
Roltec SF
Burr height [µm]
Domex 700 MC pickled
Domex 700 MC non pickled
Docol 350 YP
DC04
Sleipner No. 2= 350 µm after 100 000 strokes
Acceptable burr height
Figure 10. Measured burr heights after 200,000 strokes.
(a) SLEIPNER / non-pickled HR700MC, 200 000 strokes (b) SLEIPNER + PN / pickled HR700MC, 136 strokes Figure 11. PN coating did not improve performance of SLEIPNER punch for HR700MC
1.6 Abrasive tool wear model (WP5)
1.6.1 Development of the DURATOOL abrasive wear model (Task 5.1)
Abrasive wear can be modelled using Archard’s law, which states that removed volume V is linearly proportional to the normal contact force Fn and the sliding distances:
V = k Fn s (1) V = material volume loss k = specific wear factor Fn = normal force s = sliding distance
The k-value of a system may be determined experimentally, as in Task 2.2. Based upon this equation, TNO and Corus have built an FE model to calculate changes in tool geometry due to abrasive wear. The model has been implemented by TNO using MSC-MARC software and by Corus using PAM-Stamp software. Wear is modelled as a layer of elements on a rigid body that reduce in height according to the calculated wear. The model is currently restricted to 2D simulations but it is hoped that, upon the availability of the
14
subroutines necessary to calculate sliding distance in PAM-Stamp, it will be extended to 3D simulations.
1.6.2 Effect of draw-in radius wear on product geometry (Task 5.2)
For a manufacturer, abrasive tool wear becomes a problem at the point at which the geometry of the produced part becomes unacceptable. The model has been used to study the effect of wear on tool geometry and, subsequently, on part geometry in the Corus U-bead test. Simulations were run to predict bead wear for a number of systems. The results were compared to experimental data obtained in forming trials with draw beads that were machined to follow the worn profiles predicted by the simulations. A range of sheet materials were tested against each draw bead shown. DC04 and DP1400 displayed the least and the most variation in product shape due to springback, respectively. The geometry of hat profiles pressed from 1 mm gauge DC04 and DP1400 using all three beads was both measured and simulated and the resulting product shapes are depicted in Figure 12 and Figure 13. The influence of bead geometry is visible in both the measured and the simulated samples, although less in DC04 than in DP1400. The hat geometries resulting from the original bead and the slightly worn bead (k 10-6) are nearly the same, while the springback of the profiles formed by the k 10-5 profile is clearly greater. The model also anticipated the fact that punch force decreases with increasing tool wear. The influence of tool wear on product geometry cannot be neglected; increasing wear leads to increased springback and the effect is more pronounced for (A)HSS. The study has also shown that it is possible to model this springback effect at realistic levels using the DURATOOL model for abrasive wear.
-90
-80
-70
-60
-50
-40
-30
-20
-10
0
10
20
-100 -75 -50 -25 0 25 50 75 100
DC04 R10
DC04 k6
DC04 k5 -90
-80
-70
-60
-50
-40
-30
-20
-10
0
10
20
-100 -75 -50 -25 0 25 50 75 100
DP1400 R10
DP1400 k6
DP1400 k5
Figure 12. Measured hat profiles for DC04 and DP1400 for each bead
DC04 h10
-100
-80
-60
-40
-20
0
20
-100 -75 -50 -25 0 25 50 75 100
FEM DC04-R10-h10
FEM DC04-k6-h10
FEM DC04-k5-h10
DP1400 h10
-100
-80
-60
-40
-20
0
20
-100 -75 -50 -25 0 25 50 75 100
FEM DP1400-R10-h10
FEM DP1400-k6-h10
FEM DP1400-k5-h10
mm mm
mm mm
mm mm
mm
mm
15
Figure 13. Simulated hat profiles for DC04 and DP1400 for each bead
1.6.3 Validation of forming simulations (Task 5.3)
The validation of the model requires measurements of wear made on a real tool. For this Arcelor should provide data from Task 4.3. As these test were delayed, Corus made a start in simulating the validation tests and advising Arcelor on where to measure the tools and regarding the number of hits needed. Based upon these simulations, uncoated sheet material DP1000 was chosen for testing in combination with a GGG70L tool material. The simulations led to the conclusions that highest wear would occur at an angle of 35º (that is when defining the top of the bead at 90º and with the sheet moving from 0º (left) to 180º (right)). After 35000 hits (extrapolated from 16900 calculated hits) the wear height at this point would be 36.10-3 mm (worn radius 9.964 mm). A secondary maximum would occur at 100º, of 17.10-3 mm or worn radius = 9.983 mm. Measurements of the Arcelor beads used in the trial show that wear after 35000 was not higher than 25.10-3 mm ± 7.5.10-3 mm, in the 60º area where the wear could be measured. The calculated maximum does not lie within the area that was measured, only the secondary maximum. It is, therefore, not possible to draw any conclusions yet regarding the validity of the model. The fact that the sheet used for the test trials was given extra lubrication and the set up was asymmetric in a way that could not be modelled, already hampered validation. A point that can be confirmed, however, is that measured wear and calculated wear are of the same order of magnitude.
1.7 Tool selection guidelines (WP6)
The results of the project have been summarised in the form of tool selection guidelines (Annex 1, Figure 14). The guidelines start with an introduction to tool steel metallurgy and coating techniques. Selected results and findings of the project highlight issues to consider when selecting materials for forming, shearing and punching applications.
Figure 14. DURATOOL guidelines


17
2. INTRODUCTION AND BACKGROUND The full title of the DURATOOL project is “Mass Production Forming of High Strength Steel using Durable Tooling”. This research project started on 1st September 2003 and is sponsored by the Research Fund for Coal and Steel (RFCS) under contract number RFS-CR-03032. This is the final report.
2.1 Background to the project
Within the steel industry much work has been done in the development of high strength steels. These high strength steels give the automotive industry the possibility to improve the safety and reduce the weight of cars. However, now that the use of high strength steels is becoming more common, it has become clear that the use of high strength steels increases tool wear. An illustrative example of the technical limitations in forming of high strength steel is given in Figure 15, where the lifetime of a cast iron tool set is compared for forming of conventional deep draw steel and for forming of higher strength steels. The examples shows that it is not possible to produce a series of 100,000 parts economically using AHSS; after 1000–1500 products, the tool needs to be taken out of the press, reground/polished and put back in the production line.
Figure 15 Production tool from a car manufacturer
2.2 Solving the problem of tool wear
The main objective of the DURATOOL project is to investigate the best combinations of advanced tool material and coatings to use with different sorts of steel sheet product in forming, punching and shearing for improved wear resistance. These will be presented in the form of material selection guidelines. This will be supported by a new forming model in which abrasive tool wear can be predicted for any given system. The tribological test data collected will be used as input for the model. The ultimate goal of the project is to encourage and enable mass production forming, punching and shearing of high strength steel sheet material in an economic, clean and safe way.
Parts to failure: Low strength deep draw steel > 100,000 AHHS deep draw steel 1000-1500
18
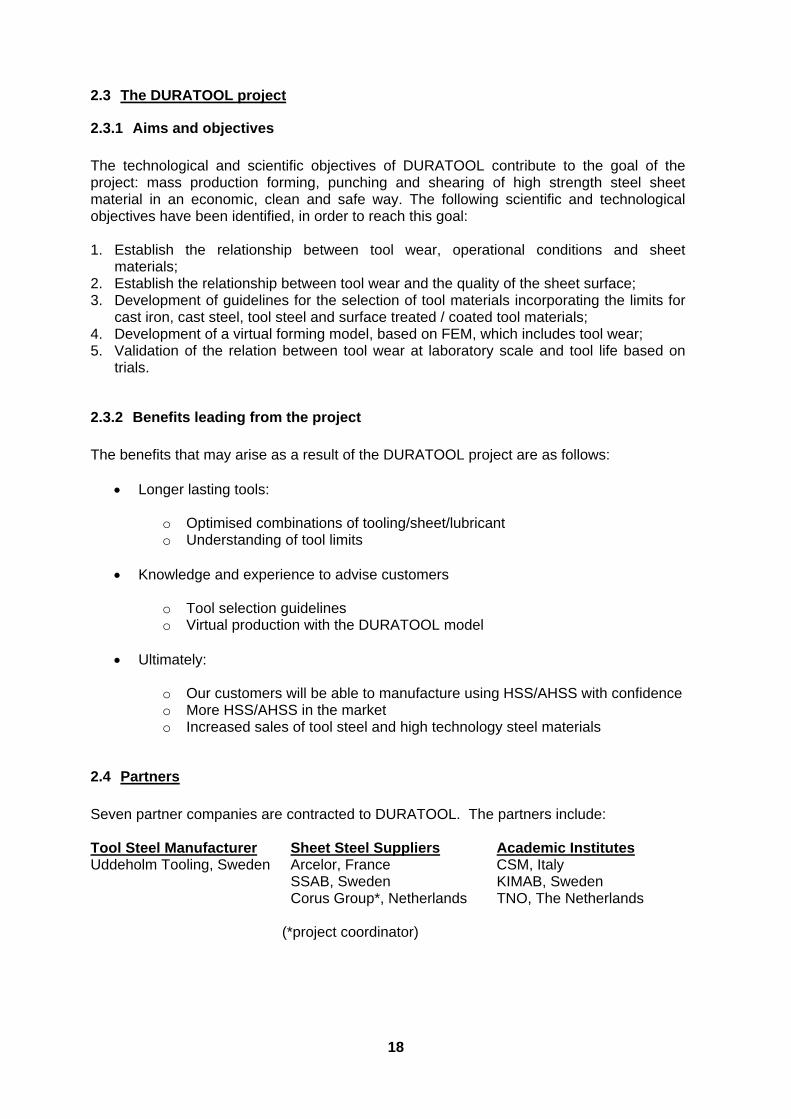
2.3 The DURATOOL project
2.3.1 Aims and objectives
The technological and scientific objectives of DURATOOL contribute to the goal of the project: mass production forming, punching and shearing of high strength steel sheet material in an economic, clean and safe way. The following scientific and technological objectives have been identified, in order to reach this goal: 1. Establish the relationship between tool wear, operational conditions and sheet
materials; 2. Establish the relationship between tool wear and the quality of the sheet surface; 3. Development of guidelines for the selection of tool materials incorporating the limits for
cast iron, cast steel, tool steel and surface treated / coated tool materials; 4. Development of a virtual forming model, based on FEM, which includes tool wear; 5. Validation of the relation between tool wear at laboratory scale and tool life based on
trials.
2.3.2 Benefits leading from the project
The benefits that may arise as a result of the DURATOOL project are as follows:
Longer lasting tools:
o Optimised combinations of tooling/sheet/lubricant o Understanding of tool limits
Knowledge and experience to advise customers
o Tool selection guidelines o Virtual production with the DURATOOL model
Ultimately:
o Our customers will be able to manufacture using HSS/AHSS with confidence o More HSS/AHSS in the market o Increased sales of tool steel and high technology steel materials
2.4 Partners
Seven partner companies are contracted to DURATOOL. The partners include: Tool Steel Manufacturer Sheet Steel Suppliers Academic Institutes Uddeholm Tooling, Sweden Arcelor, France CSM, Italy SSAB, Sweden KIMAB, Sweden Corus Group*, Netherlands TNO, The Netherlands (*project coordinator)
19
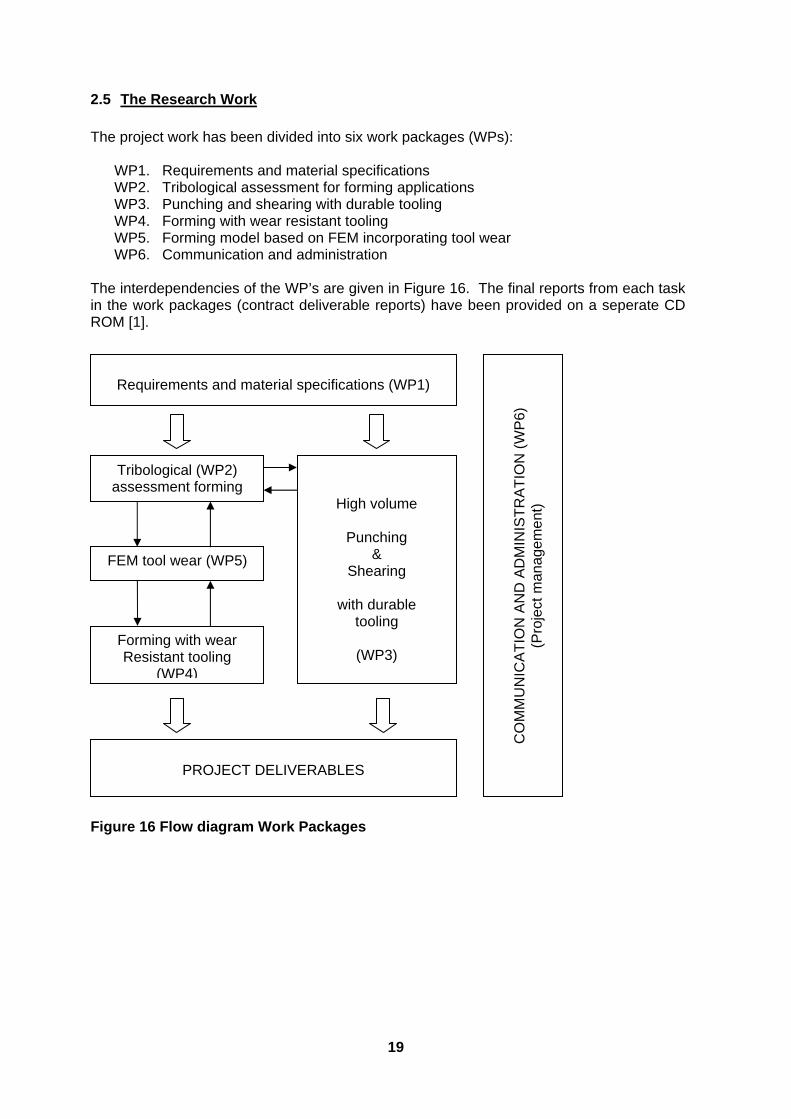
2.5 The Research Work
The project work has been divided into six work packages (WPs):
WP1. Requirements and material specifications WP2. Tribological assessment for forming applications WP3. Punching and shearing with durable tooling WP4. Forming with wear resistant tooling WP5. Forming model based on FEM incorporating tool wear WP6. Communication and administration
The interdependencies of the WP’s are given in Figure 16. The final reports from each task in the work packages (contract deliverable reports) have been provided on a seperate CD ROM [1].
Figure 16 Flow diagram Work Packages
C
OM
MU
NIC
AT
ION
AN
D A
DM
INIS
TR
AT
ION
(W
P6)
(P
roje
ct m
anag
emen
t)
Requirements and material specifications (WP1)
Tribological (WP2) assessment forming
High volume
Punching &
Shearing
with durable tooling
(WP3)
FEM tool wear (WP5)
Forming with wear Resistant tooling
(WP4)
PROJECT DELIVERABLES

21
3. WP1 Material specifications and requirements In Work Package 1, the materials to be tested in the project have been defined, selected and subsequently produced by each manufacturer and distributed to each tester. The materials concerned are:
The steels to be punched, sheared and formed, in sheets or coils The tools which are necessary for these operations The lubricants
The specific objectives of the WP1 are formulated as:
Task 1: Selection of test materials Task 2: Production of materials Task 3: Determination of selected material properties Task 4: Manufacture of test samples
All tasks have been completed. Tasks 1.1 and 1.3 are discussed further below. The deliverable reports for these tasks are presented on the project CD ROM.
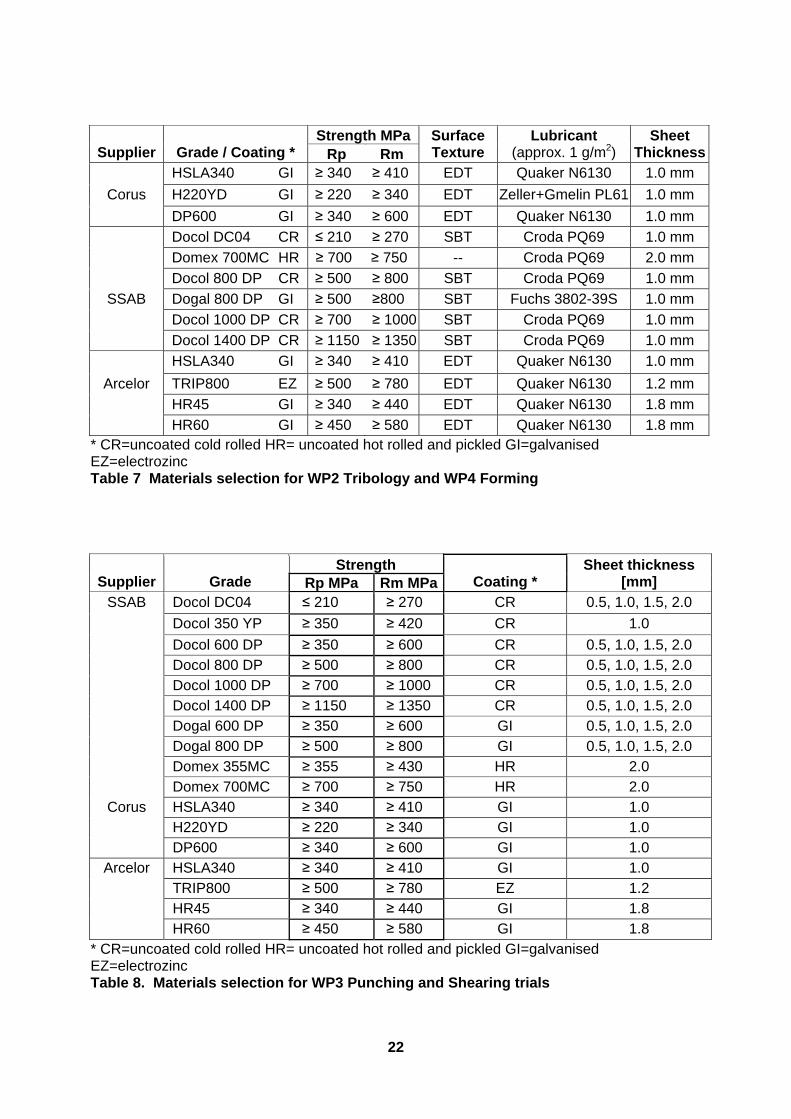
3.1 Task 1.1: Selection of sheet materials
We can distinguish two types of wear: galling (adhesive wear) or abrasive wear: both of these mechanisms can be exacerbated by forming with higher strength steels due to the higher press forces involved. The selection of the steel grades, tool materials and treatments to be used in the DURATOOL project has been made based upon a range of sheet steel strength levels. The steels selected range in tensile strength from 300 to 1400MPa. They include HSLA, DP and TRIP steels in hot rolled, cold rolled and zinc coated (EZ and GI) variants. These will be delivered in sheets or coils, according to testing requirements. The steels selected for WP2 and WP3 are presented in Table 7 and Table 8, respectively. A full table of materials and quantities required by each partner is available on the DURATOOL website.
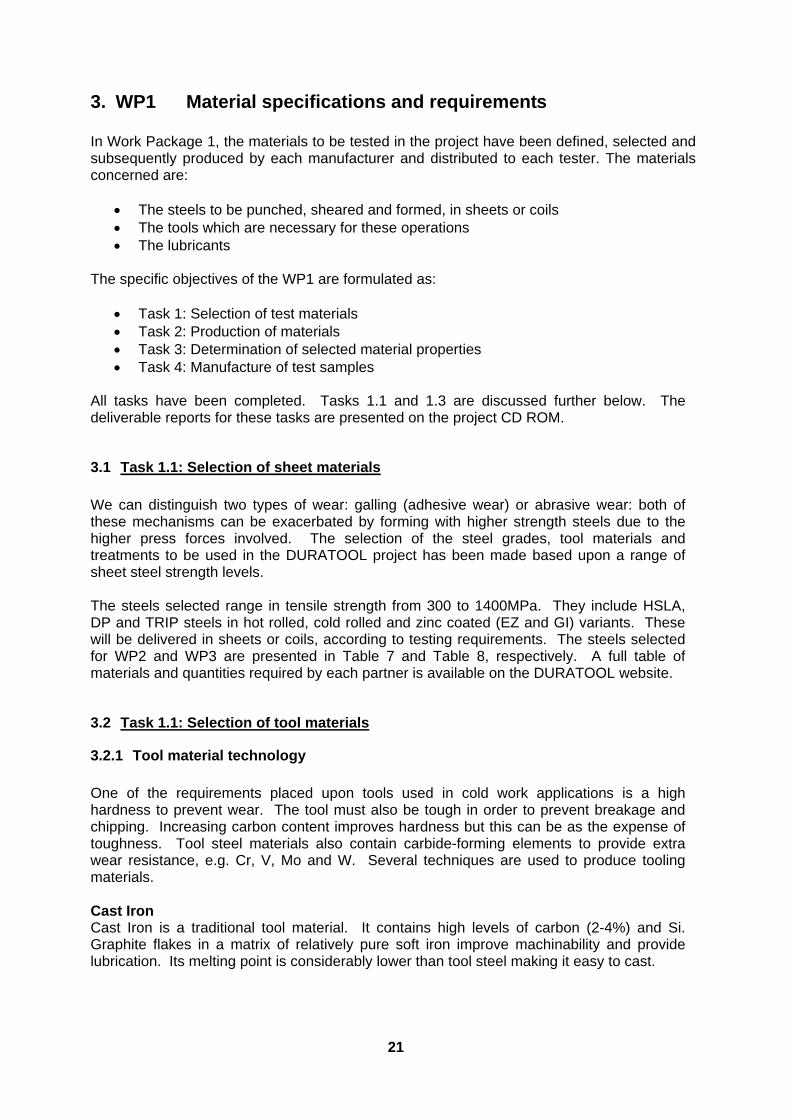
3.2 Task 1.1: Selection of tool materials
3.2.1 Tool material technology
One of the requirements placed upon tools used in cold work applications is a high hardness to prevent wear. The tool must also be tough in order to prevent breakage and chipping. Increasing carbon content improves hardness but this can be as the expense of toughness. Tool steel materials also contain carbide-forming elements to provide extra wear resistance, e.g. Cr, V, Mo and W. Several techniques are used to produce tooling materials. Cast Iron Cast Iron is a traditional tool material. It contains high levels of carbon (2-4%) and Si. Graphite flakes in a matrix of relatively pure soft iron improve machinability and provide lubrication. Its melting point is considerably lower than tool steel making it easy to cast.
22
Supplier
Grade / Coating *
Strength MPa Surface Texture
Lubricant (approx. 1 g/m2)
Sheet ThicknessRp Rm
HSLA340 GI ≥ 340 ≥ 410 EDT Quaker N6130 1.0 mm
Corus H220YD GI ≥ 220 ≥ 340 EDT Zeller+Gmelin PL61 1.0 mm
DP600 GI ≥ 340 ≥ 600 EDT Quaker N6130 1.0 mm
Docol DC04 CR ≤ 210 ≥ 270 SBT Croda PQ69 1.0 mm
Domex 700MC HR ≥ 700 ≥ 750 -- Croda PQ69 2.0 mm
Docol 800 DP CR ≥ 500 ≥ 800 SBT Croda PQ69 1.0 mm
SSAB Dogal 800 DP GI ≥ 500 ≥800 SBT Fuchs 3802-39S 1.0 mm
Docol 1000 DP CR ≥ 700 ≥ 1000 SBT Croda PQ69 1.0 mm
Docol 1400 DP CR ≥ 1150 ≥ 1350 SBT Croda PQ69 1.0 mm
HSLA340 GI ≥ 340 ≥ 410 EDT Quaker N6130 1.0 mm
Arcelor TRIP800 EZ ≥ 500 ≥ 780 EDT Quaker N6130 1.2 mm
HR45 GI ≥ 340 ≥ 440 EDT Quaker N6130 1.8 mm
HR60 GI ≥ 450 ≥ 580 EDT Quaker N6130 1.8 mm * CR=uncoated cold rolled HR= uncoated hot rolled and pickled GI=galvanised EZ=electrozinc Table 7 Materials selection for WP2 Tribology and WP4 Forming
Supplier
Grade
Strength Coating *
Sheet thickness [mm] Rp MPa Rm MPa
SSAB Docol DC04 ≤ 210 ≥ 270 CR 0.5, 1.0, 1.5, 2.0
Docol 350 YP ≥ 350 ≥ 420 CR 1.0
Docol 600 DP ≥ 350 ≥ 600 CR 0.5, 1.0, 1.5, 2.0 Docol 800 DP ≥ 500 ≥ 800 CR 0.5, 1.0, 1.5, 2.0 Docol 1000 DP ≥ 700 ≥ 1000 CR 0.5, 1.0, 1.5, 2.0 Docol 1400 DP ≥ 1150 ≥ 1350 CR 0.5, 1.0, 1.5, 2.0
Dogal 600 DP ≥ 350 ≥ 600 GI 0.5, 1.0, 1.5, 2.0 Dogal 800 DP ≥ 500 ≥ 800 GI 0.5, 1.0, 1.5, 2.0 Domex 355MC ≥ 355 ≥ 430 HR 2.0 Domex 700MC ≥ 700 ≥ 750 HR 2.0
Corus HSLA340 ≥ 340 ≥ 410 GI 1.0 H220YD ≥ 220 ≥ 340 GI 1.0 DP600 ≥ 340 ≥ 600 GI 1.0
Arcelor HSLA340 ≥ 340 ≥ 410 GI 1.0 TRIP800 ≥ 500 ≥ 780 EZ 1.2 HR45 ≥ 340 ≥ 440 GI 1.8 HR60 ≥ 450 ≥ 580 GI 1.8
* CR=uncoated cold rolled HR= uncoated hot rolled and pickled GI=galvanised EZ=electrozinc Table 8. Materials selection for WP3 Punching and Shearing trials
23
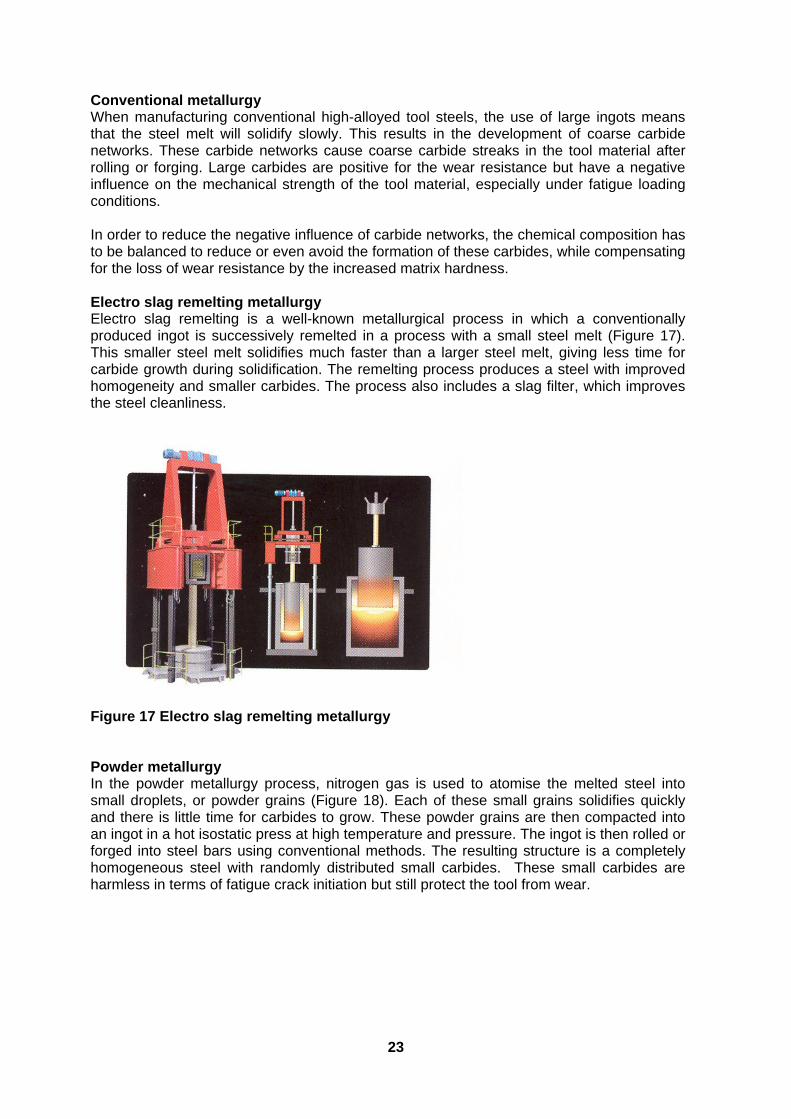
Conventional metallurgy When manufacturing conventional high-alloyed tool steels, the use of large ingots means that the steel melt will solidify slowly. This results in the development of coarse carbide networks. These carbide networks cause coarse carbide streaks in the tool material after rolling or forging. Large carbides are positive for the wear resistance but have a negative influence on the mechanical strength of the tool material, especially under fatigue loading conditions. In order to reduce the negative influence of carbide networks, the chemical composition has to be balanced to reduce or even avoid the formation of these carbides, while compensating for the loss of wear resistance by the increased matrix hardness. Electro slag remelting metallurgy Electro slag remelting is a well-known metallurgical process in which a conventionally produced ingot is successively remelted in a process with a small steel melt (Figure 17). This smaller steel melt solidifies much faster than a larger steel melt, giving less time for carbide growth during solidification. The remelting process produces a steel with improved homogeneity and smaller carbides. The process also includes a slag filter, which improves the steel cleanliness.
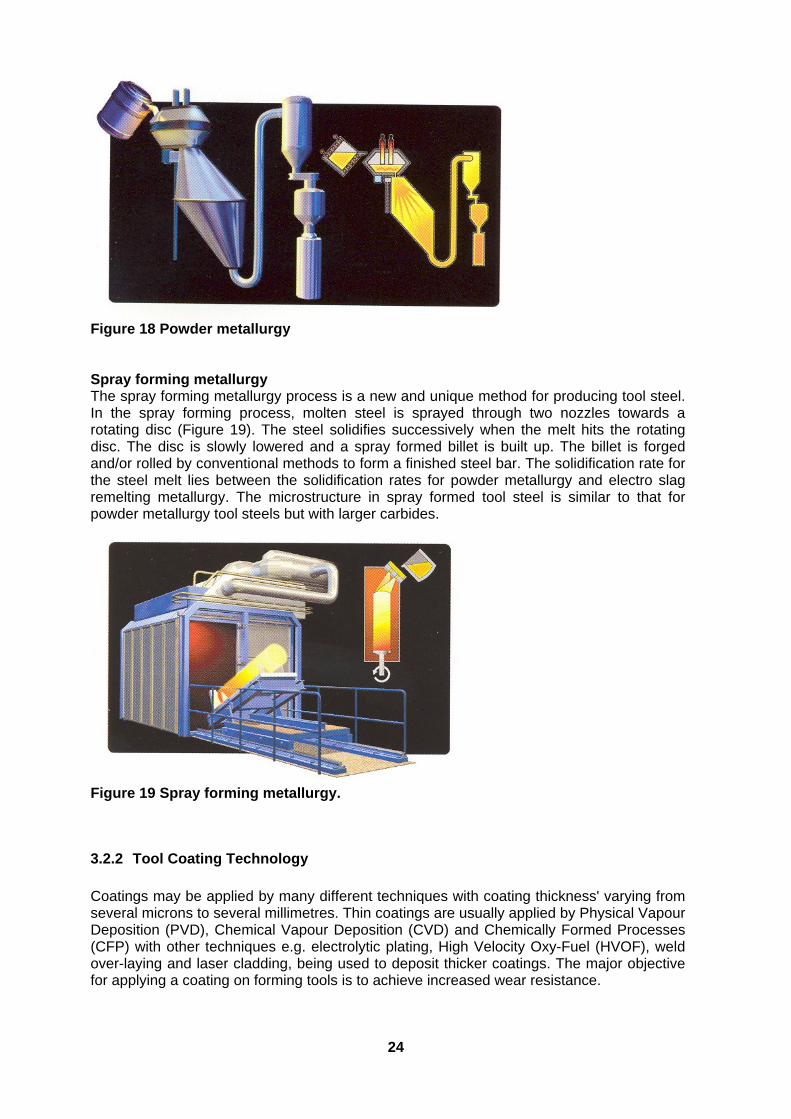
Figure 17 Electro slag remelting metallurgy Powder metallurgy In the powder metallurgy process, nitrogen gas is used to atomise the melted steel into small droplets, or powder grains (Figure 18). Each of these small grains solidifies quickly and there is little time for carbides to grow. These powder grains are then compacted into an ingot in a hot isostatic press at high temperature and pressure. The ingot is then rolled or forged into steel bars using conventional methods. The resulting structure is a completely homogeneous steel with randomly distributed small carbides. These small carbides are harmless in terms of fatigue crack initiation but still protect the tool from wear.
24
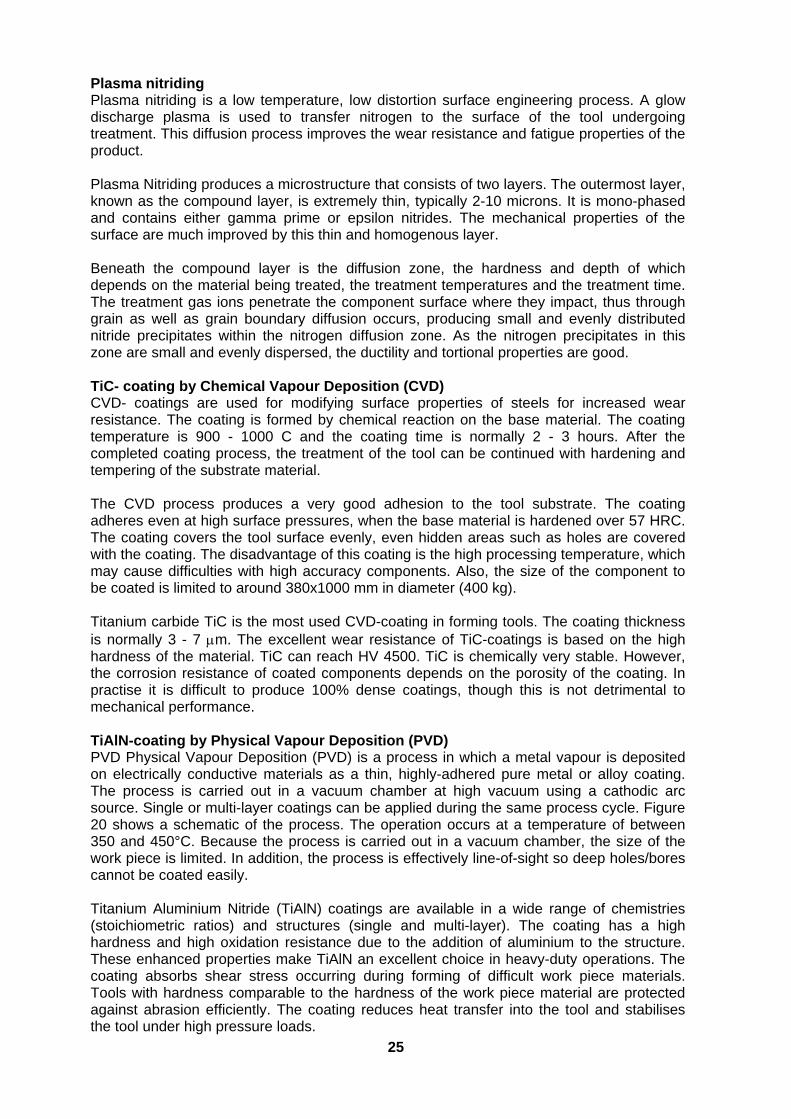
Figure 18 Powder metallurgy Spray forming metallurgy The spray forming metallurgy process is a new and unique method for producing tool steel. In the spray forming process, molten steel is sprayed through two nozzles towards a rotating disc (Figure 19). The steel solidifies successively when the melt hits the rotating disc. The disc is slowly lowered and a spray formed billet is built up. The billet is forged and/or rolled by conventional methods to form a finished steel bar. The solidification rate for the steel melt lies between the solidification rates for powder metallurgy and electro slag remelting metallurgy. The microstructure in spray formed tool steel is similar to that for powder metallurgy tool steels but with larger carbides.
Figure 19 Spray forming metallurgy.
3.2.2 Tool Coating Technology
Coatings may be applied by many different techniques with coating thickness' varying from several microns to several millimetres. Thin coatings are usually applied by Physical Vapour Deposition (PVD), Chemical Vapour Deposition (CVD) and Chemically Formed Processes (CFP) with other techniques e.g. electrolytic plating, High Velocity Oxy-Fuel (HVOF), weld over-laying and laser cladding, being used to deposit thicker coatings. The major objective for applying a coating on forming tools is to achieve increased wear resistance.
25
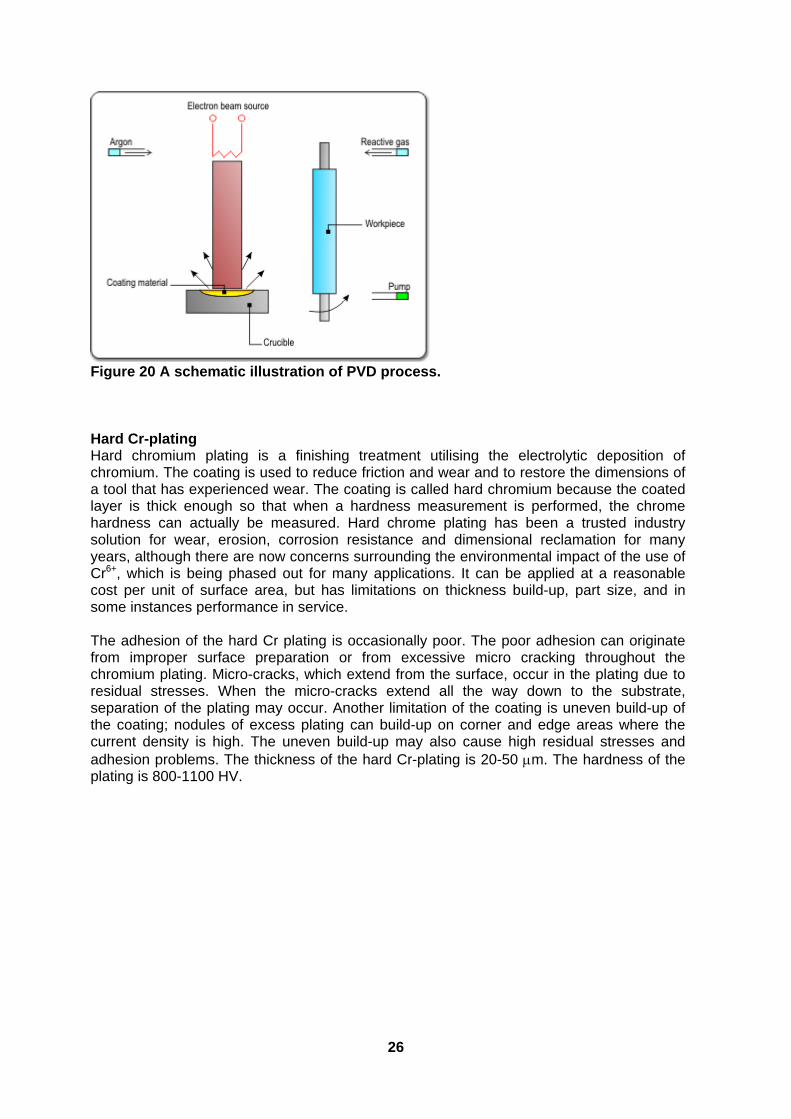
Plasma nitriding Plasma nitriding is a low temperature, low distortion surface engineering process. A glow discharge plasma is used to transfer nitrogen to the surface of the tool undergoing treatment. This diffusion process improves the wear resistance and fatigue properties of the product. Plasma Nitriding produces a microstructure that consists of two layers. The outermost layer, known as the compound layer, is extremely thin, typically 2-10 microns. It is mono-phased and contains either gamma prime or epsilon nitrides. The mechanical properties of the surface are much improved by this thin and homogenous layer. Beneath the compound layer is the diffusion zone, the hardness and depth of which depends on the material being treated, the treatment temperatures and the treatment time. The treatment gas ions penetrate the component surface where they impact, thus through grain as well as grain boundary diffusion occurs, producing small and evenly distributed nitride precipitates within the nitrogen diffusion zone. As the nitrogen precipitates in this zone are small and evenly dispersed, the ductility and tortional properties are good. TiC- coating by Chemical Vapour Deposition (CVD) CVD- coatings are used for modifying surface properties of steels for increased wear resistance. The coating is formed by chemical reaction on the base material. The coating temperature is 900 - 1000 C and the coating time is normally 2 - 3 hours. After the completed coating process, the treatment of the tool can be continued with hardening and tempering of the substrate material. The CVD process produces a very good adhesion to the tool substrate. The coating adheres even at high surface pressures, when the base material is hardened over 57 HRC. The coating covers the tool surface evenly, even hidden areas such as holes are covered with the coating. The disadvantage of this coating is the high processing temperature, which may cause difficulties with high accuracy components. Also, the size of the component to be coated is limited to around 380x1000 mm in diameter (400 kg). Titanium carbide TiC is the most used CVD-coating in forming tools. The coating thickness is normally 3 - 7 m. The excellent wear resistance of TiC-coatings is based on the high hardness of the material. TiC can reach HV 4500. TiC is chemically very stable. However, the corrosion resistance of coated components depends on the porosity of the coating. In practise it is difficult to produce 100% dense coatings, though this is not detrimental to mechanical performance. TiAlN-coating by Physical Vapour Deposition (PVD) PVD Physical Vapour Deposition (PVD) is a process in which a metal vapour is deposited on electrically conductive materials as a thin, highly-adhered pure metal or alloy coating. The process is carried out in a vacuum chamber at high vacuum using a cathodic arc source. Single or multi-layer coatings can be applied during the same process cycle. Figure 20 shows a schematic of the process. The operation occurs at a temperature of between 350 and 450°C. Because the process is carried out in a vacuum chamber, the size of the work piece is limited. In addition, the process is effectively line-of-sight so deep holes/bores cannot be coated easily. Titanium Aluminium Nitride (TiAlN) coatings are available in a wide range of chemistries (stoichiometric ratios) and structures (single and multi-layer). The coating has a high hardness and high oxidation resistance due to the addition of aluminium to the structure. These enhanced properties make TiAlN an excellent choice in heavy-duty operations. The coating absorbs shear stress occurring during forming of difficult work piece materials. Tools with hardness comparable to the hardness of the work piece material are protected against abrasion efficiently. The coating reduces heat transfer into the tool and stabilises the tool under high pressure loads.
26
Figure 20 A schematic illustration of PVD process. Hard Cr-plating Hard chromium plating is a finishing treatment utilising the electrolytic deposition of chromium. The coating is used to reduce friction and wear and to restore the dimensions of a tool that has experienced wear. The coating is called hard chromium because the coated layer is thick enough so that when a hardness measurement is performed, the chrome hardness can actually be measured. Hard chrome plating has been a trusted industry solution for wear, erosion, corrosion resistance and dimensional reclamation for many years, although there are now concerns surrounding the environmental impact of the use of Cr6+, which is being phased out for many applications. It can be applied at a reasonable cost per unit of surface area, but has limitations on thickness build-up, part size, and in some instances performance in service. The adhesion of the hard Cr plating is occasionally poor. The poor adhesion can originate from improper surface preparation or from excessive micro cracking throughout the chromium plating. Micro-cracks, which extend from the surface, occur in the plating due to residual stresses. When the micro-cracks extend all the way down to the substrate, separation of the plating may occur. Another limitation of the coating is uneven build-up of the coating; nodules of excess plating can build-up on corner and edge areas where the current density is high. The uneven build-up may also cause high residual stresses and adhesion problems. The thickness of the hard Cr-plating is 20-50 m. The hardness of the plating is 800-1100 HV.
27
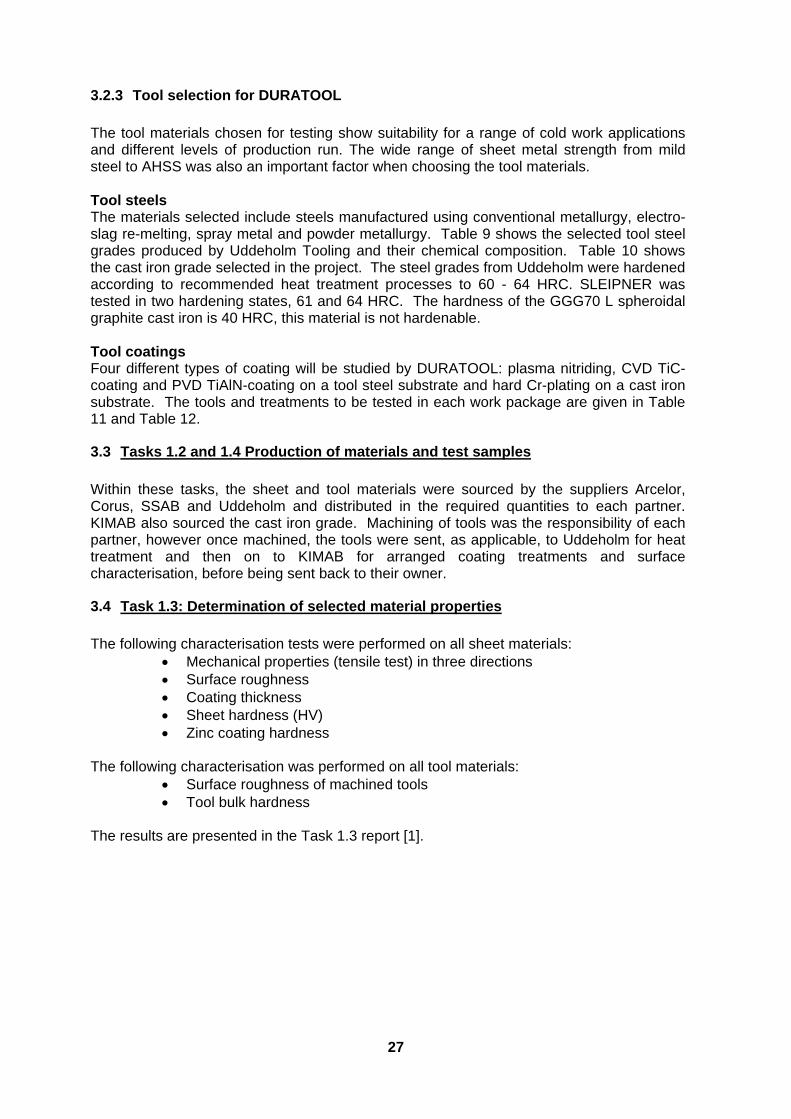
3.2.3 Tool selection for DURATOOL
The tool materials chosen for testing show suitability for a range of cold work applications and different levels of production run. The wide range of sheet metal strength from mild steel to AHSS was also an important factor when choosing the tool materials. Tool steels The materials selected include steels manufactured using conventional metallurgy, electro-slag re-melting, spray metal and powder metallurgy. Table 9 shows the selected tool steel grades produced by Uddeholm Tooling and their chemical composition. Table 10 shows the cast iron grade selected in the project. The steel grades from Uddeholm were hardened according to recommended heat treatment processes to 60 - 64 HRC. SLEIPNER was tested in two hardening states, 61 and 64 HRC. The hardness of the GGG70 L spheroidal graphite cast iron is 40 HRC, this material is not hardenable. Tool coatings Four different types of coating will be studied by DURATOOL: plasma nitriding, CVD TiC-coating and PVD TiAlN-coating on a tool steel substrate and hard Cr-plating on a cast iron substrate. The tools and treatments to be tested in each work package are given in Table 11 and Table 12.
3.3 Tasks 1.2 and 1.4 Production of materials and test samples
Within these tasks, the sheet and tool materials were sourced by the suppliers Arcelor, Corus, SSAB and Uddeholm and distributed in the required quantities to each partner. KIMAB also sourced the cast iron grade. Machining of tools was the responsibility of each partner, however once machined, the tools were sent, as applicable, to Uddeholm for heat treatment and then on to KIMAB for arranged coating treatments and surface characterisation, before being sent back to their owner.
3.4 Task 1.3: Determination of selected material properties
The following characterisation tests were performed on all sheet materials:
Mechanical properties (tensile test) in three directions Surface roughness Coating thickness Sheet hardness (HV) Zinc coating hardness
The following characterisation was performed on all tool materials:
Surface roughness of machined tools Tool bulk hardness
The results are presented in the Task 1.3 report [1].
28
Tool material %C %Si %Mn %Cr %Mo %V %WSVERKER 21 (AISI D2/W.Nr 1.2379) 1.55 0.3 0.4 11.8 0.8 0.8 - SLEIPNER 0.9 0.9 0.5 7.8 2.5 0.5 - CALDIE ESR 0.7 0.2 0.5 5.0 2.3 0.5 - ROLTEC SF 1.4 1.0 0.6 4.6 3.2 3.7 - VANADIS 4 EXTRA PM 1.4 0.4 0.4 4.7 3.5 3.7 - VANCRON 40 PM 3.0* 0.5 0.4 4.5 3.2 8.5 3.7
Table 9 : Composition of Tool steel grades from Uddeholm Tooling AB. ESR=electro slag remelting, SF = spray formed and PM = powder metallurgy. * % (C+N) Tool material %C %Si %Mn %P %S %Ni %Mo %Cu %Mg GGG70 L 3.3-
3.6 1.8-2.4
0.3-0.6
Max 0.05
Max 0.02
0.9-1.2
0.4-0.6
0.8-1.2
0.04-0.07
Table 10 : Composition of cast iron GGG70L.
Sheet metal forming and tribology WP2 & WP4
Variant Tool steel grade Treatment / coating
1 SLEIPNER 60-61 HRC H 2 SLEIPNER H+Plasma Nitride 3 SLEIPNER H+TiC CVD 4 SLEIPNER H+TiAlN PVD 5 VANCRON 60-61 HRC H 6 GGG70L 40 HRC 7 GGG70L Hard Cr 8 SLEIPNER 64 HRC H 9 SVERKER 21 H
Table 11 : Tool materials selection for WP2 Tribology and WP4 Forming H=hardened, PN=plasma nitride, C/PVD=chemical/physical vapour deposition
Punching and Shearing WP3
Variant Tool steel grade Treatment / coating
1 SLEIPNER H 2 SLEIPNER H+PN 3 CALDIE H+PN 4 CALDIE H+CVD(TiC) 5 CALDIE H+PVD(TiN) 6 VANADIS 4 EXTRA H 7 VANCRON H 8 ROLTEC H 9 SVERKER 21 (WN 1.2379) H
Table 12 Tool materials selection for WP3 Punching and Shearing trials H=hardened, PN=plasma nitride, C/PVD=chemical/physical vapour deposition

29
4. WP 2 Tribological assessment for forming applications In this Work Package (WP) the relative attributes of each tool material – sheet material – lubricant combination have been assessed and compared using tribological tests that simulate sheet forming operations. The contractors who performed research in this WP are: TNO, Arcelor, KIMAB, Corus and CSM. The specific objectives of this WP are:
To establish the specific wear rate of the selected systems, or when applicable find the galling characteristics;
To establish the relation between the operational conditions (incl. speed and normal force) and friction for the selected systems;
For that purpose a set of six tasks was defined:
1. Analysis of critical contact situations during mass production forming of high strength steel.
2. Sliding wear resistance / galling behaviour 3. Frictional stability of the selected systems 4. Enhanced sheet surfaces 5. Adhesion tests 6. Overall analysis of the results
4.1 Task 2.1: Analysis of critical contact situations during forming
A comprehensive study of the tribological system during forming of high strength steel has been conducted within this task. The deliverable of this task, i.e. a report with details on relative speed, temperature, normal pressure, deformation mode and tribological performance in qualitative terms, is available [1]. A summary of this report is given below. A specific way of dealing with friction and wear phenomena was introduced in the task report that is based on the systems approach, see DIN 503202. This approach considers three common features of tribological contact situations in sheet metal forming:
the interaction of relatively soft and rough sheet surfaces with hard and smooth tool surfaces;
plastic contact conditions for the sheet surface; always fresh sheet material entering the contact, i.e. no run-in of the sheet surface
The system approach furthermore distinguishes system components, i.e. tool material, sheet material and forming lubricant from operating variables such as sliding velocity, normal pressure and process temperature. The loss output of the system, i.e. friction and wear, will be studied in WP 2. It is shown that friction in general sheet metal forming processes can be described using the Stribeck curve. Application of the range of operating variables indicates that mixed and boundary lubrication are dominant friction regimes in metal forming applications. Wear in sheet metal forming is typically dominated by two wear types: galling and volumetric wear of the forming tool. Both wear types depend largely on the operational conditions and the selected system components. Three cases are analysed in this task and presented in the report:
30
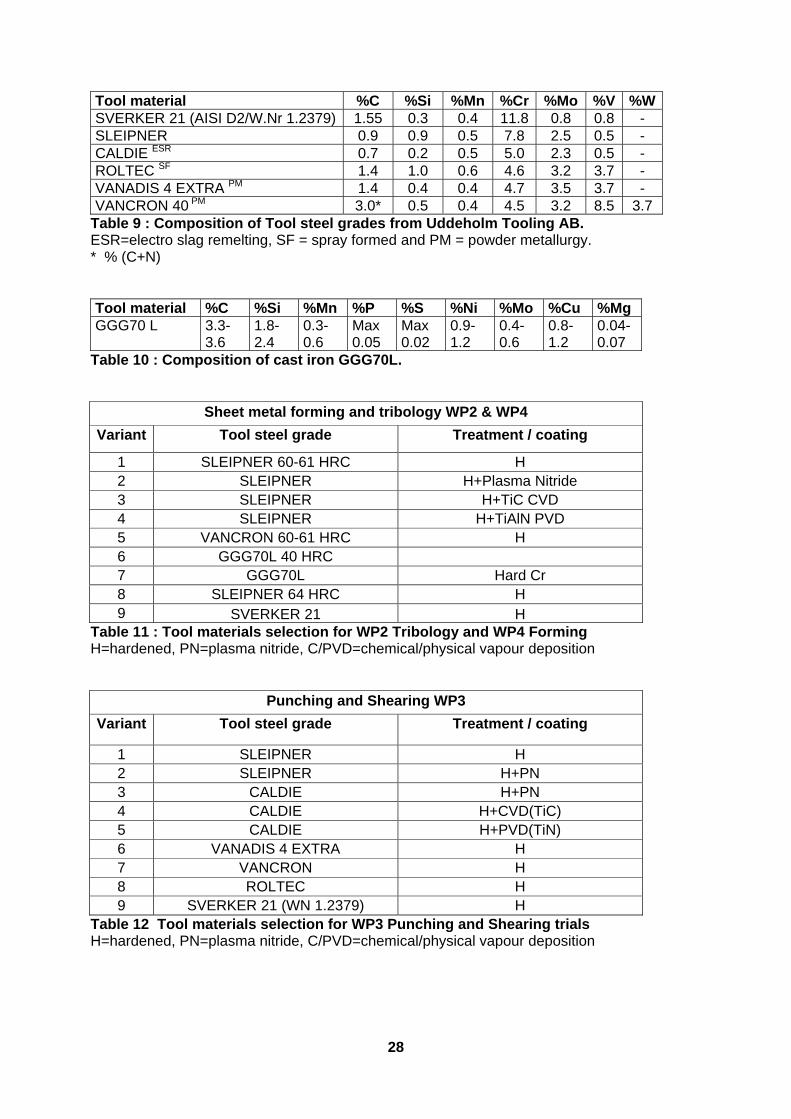
the effect of high strength steel sheet material on the press forces of a central tunnel of a car structure, see Figure 21;
the contact pressure for the slider-on-sheet test and the mechanical loading of tooling used for the U-bead test respectively.
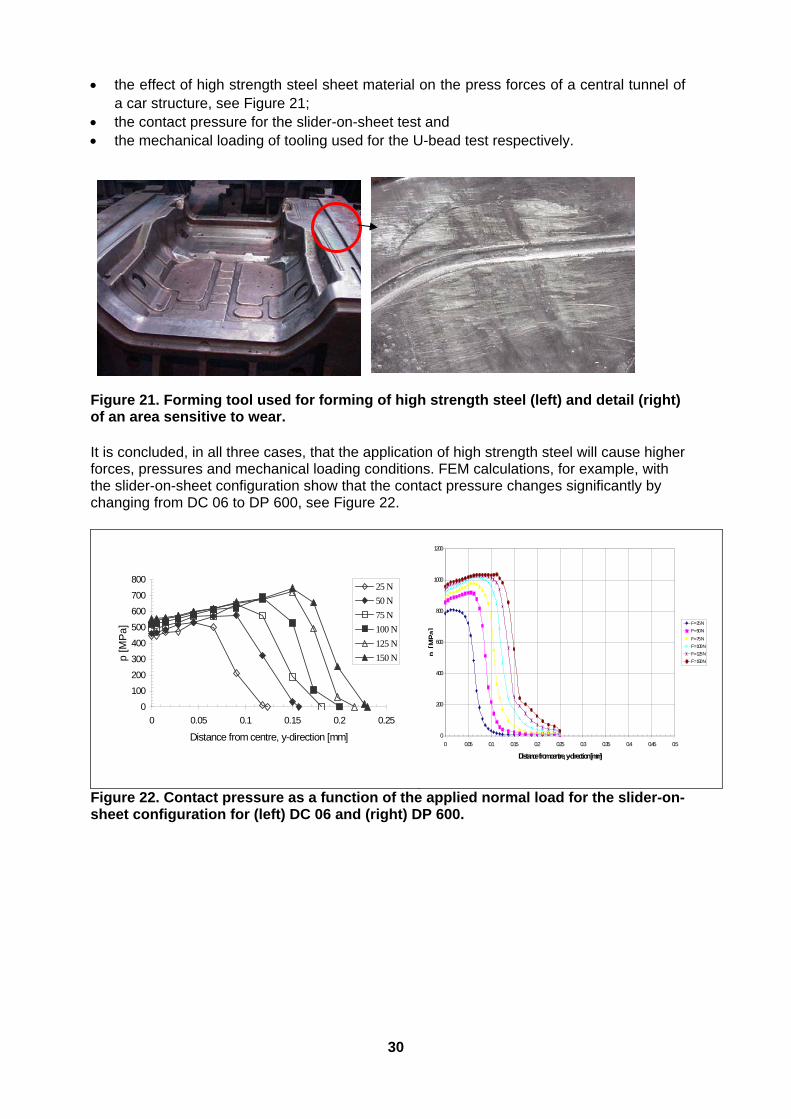
Figure 21. Forming tool used for forming of high strength steel (left) and detail (right) of an area sensitive to wear. It is concluded, in all three cases, that the application of high strength steel will cause higher forces, pressures and mechanical loading conditions. FEM calculations, for example, with the slider-on-sheet configuration show that the contact pressure changes significantly by changing from DC 06 to DP 600, see Figure 22.
Figure 22. Contact pressure as a function of the applied normal load for the slider-on-sheet configuration for (left) DC 06 and (right) DP 600.
0
200
400
600
800
1000
1200
0 0.05 0.1 0.15 0.2 0.25 0.3 0.35 0.4 0.45 0.5
Distance from centre, y-direction [mm]
p[M
Pa
]
F = 25 N
F = 50 N
F = 75 N
F = 100 N
F = 125 N
F = 150 N
0
100
200
300
400
500
600
700
800
0 0.05 0.1 0.15 0.2 0.25
Distance from centre, y-direction [mm]
p [M
Pa]
25 N
50 N
75 N
100 N
125 N
150 N
31
4.2 Task 2.2: Slider on Sheet (TNO)
This section is related to Task 2 ‘Sliding wear resistance / galling behaviour’. This task comprises measuring the wear resistance / galling characteristics using two dedicated tribometers: the TNO slider-on-sheet tribometer and the KIMAB continuous bending under tension tribometer. All tool material – sheet material combinations were tested with the slider-on-sheet tribometer, for a limited set of normal force – sliding speed combinations. Many of the combinations were also evaluated by KIMAB (see section 5.3). KIMAB tested bending and bulk plastic deformation in the tribo contact. Particular attention is paid to the wear type in relation to tool material and surface characteristics.
4.2.1 Slider on sheet test materials
Experiments were conducted with a set of 13 high strength steel sheet materials (Table 7). Roughness measurements with a Mitutoyo Surf test 301 SJ mechanical stylus were conducted to get indicative values for the sheet surface roughness. The results are presented in the Task report [1]. The uncoated sheet materials all have a similar Ra roughness of about 1 μm. The zinc coated sheets show some variation ranging from 0.55 μm for DP 800 GI to 1.75 μm Ra for HSLA340. Hardness measurements at one cross section were done to obtain an indicative value for the bulk hardness and for the hardness of the zinc coating (if present). The bulk hardness values clearly correlate with the yield strength of the material. The minimum value is measured for DC 04, the maximum for DP 1400, respectively 102 and 474 HV. Analysis of the zinc coating in terms of hardness and thickness showed a layer thickness ranging from 8-20 μm and a hardness ranging from 38 – 75 HV0.001. The sliders used for the experiments were made out of commercially available tool materials selected in WP1 (Table 11). The uncoated sliders were polished aiming at a Ra of about 0.05 µm parallel and about 0.05 µm perpendicular to the sliding direction. The resulting roughness of the polished sliders was well within the targeted range. Only the cast iron slider showed a higher roughness perpendicular to the sliding direction, i.e. 0.18 μm. The dimensions of the slider were 44 x 8 mm with a radius of 6 mm perpendicular to the sliding direction. The sheet materials were tested in the as-received condition. For most materials this was possible by redistribution the preservation oil over the sheet with a paper cloth. In two cases additional lubrication was applied to the sheet in order to avoid galling due to dry spots on the sheet surface. In the case of HR 45, experiments were done with standard preservation lubricant N 6130, manufactured by Quaker Chemical. The other case was with 700 MC. Lubricant PQ69, manufactured by Croda, was applied to the sheet surface. The sheets that needed additional lubrication were cleaned with acetone before applying the lubricant to the sheet with a roller. The amount of lubricant used was 4-5 ml/m2.
4.2.2 Test method
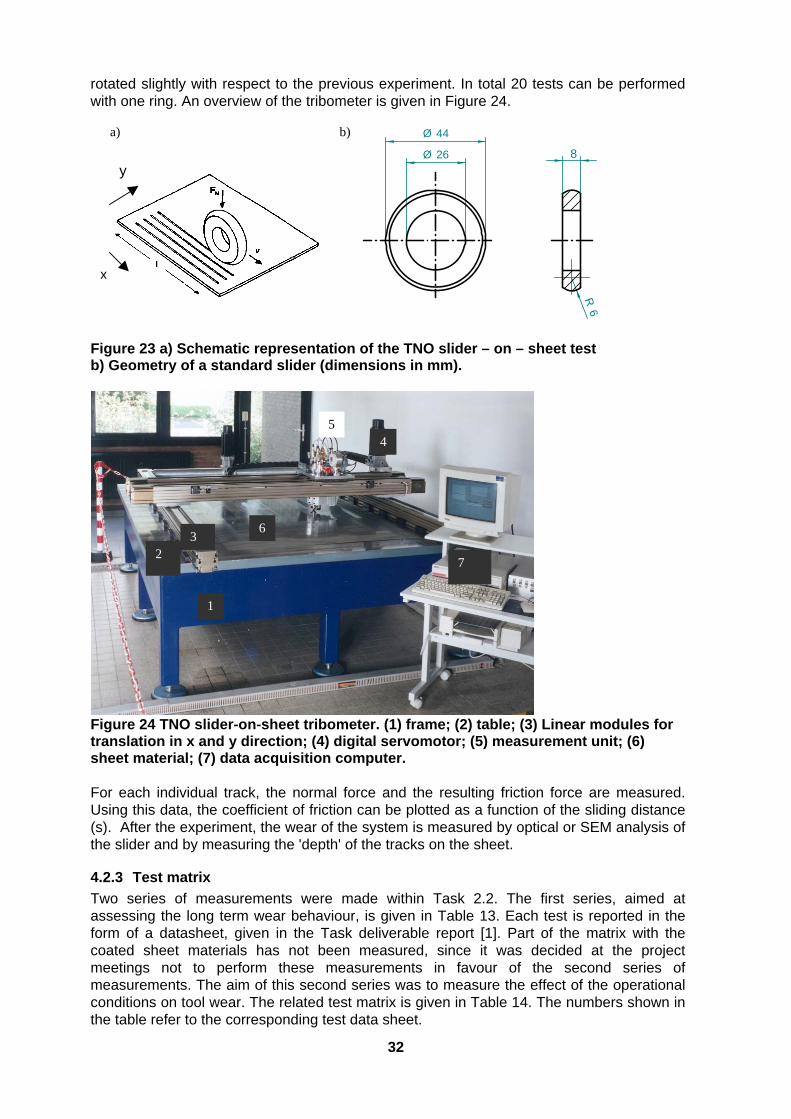
The measurement principle of the TNO Slider-on-sheet tribometer is shown Figure 23.a. A slider of standard geometry, shown in Figure 23b., is pushed against sheet material with a normal force Fn. Then the slider moves in the x-direction, with a sliding speed v. At the end of the track (track length l) the slider is lifted from the sheet and moved over a distance of 1 mm in the y-direction. The slider, still lifted from the sheet, returns to the starting line x = 0. The normal force is re-applied and the next track is made, assuring virgin sheet material in the contact. In this way 1 km sliding distance is realised on one square meter sheet material. Each subsequent test is done on a new spot on the ring, by mounting the slider
32
rotated slightly with respect to the previous experiment. In total 20 tests can be performed with one ring. An overview of the tribometer is given in Figure 24.
y
x
Ø 44
Ø 26
R6
8
a) b)
Figure 23 a) Schematic representation of the TNO slider – on – sheet test b) Geometry of a standard slider (dimensions in mm).
1
23
45
6
7
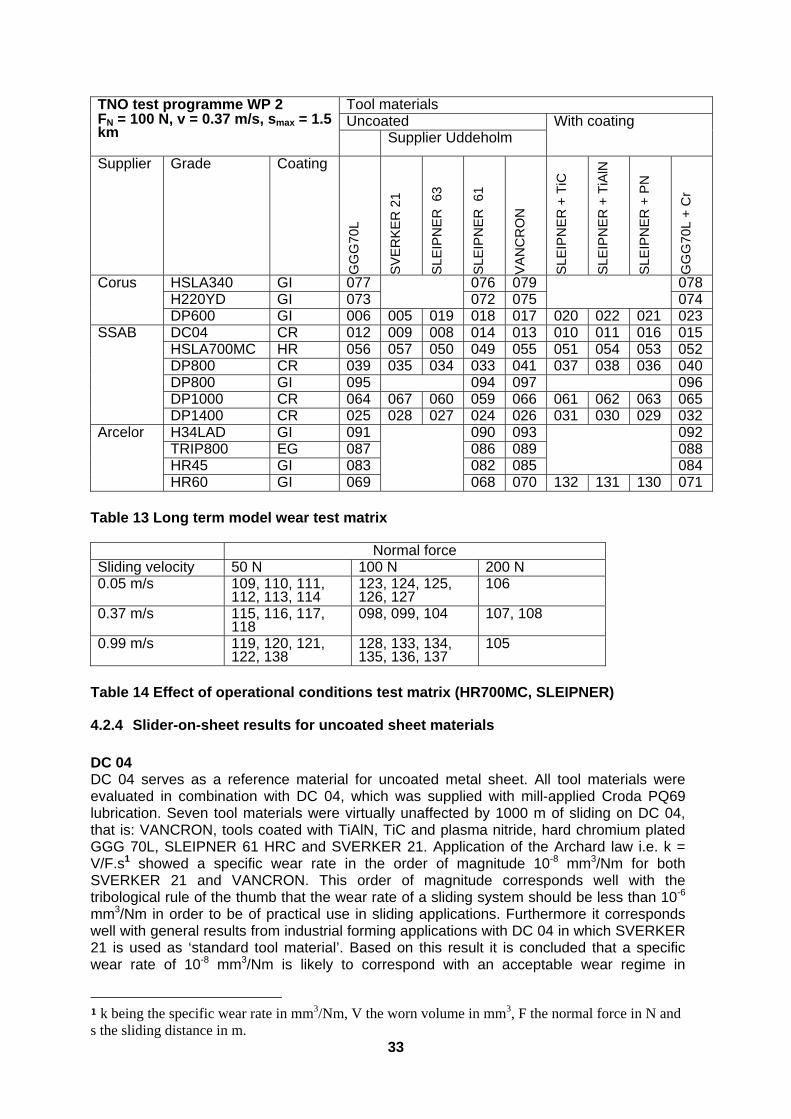
Figure 24 TNO slider-on-sheet tribometer. (1) frame; (2) table; (3) Linear modules for translation in x and y direction; (4) digital servomotor; (5) measurement unit; (6) sheet material; (7) data acquisition computer. For each individual track, the normal force and the resulting friction force are measured. Using this data, the coefficient of friction can be plotted as a function of the sliding distance (s). After the experiment, the wear of the system is measured by optical or SEM analysis of the slider and by measuring the 'depth' of the tracks on the sheet.
4.2.3 Test matrix
Two series of measurements were made within Task 2.2. The first series, aimed at assessing the long term wear behaviour, is given in Table 13. Each test is reported in the form of a datasheet, given in the Task deliverable report [1]. Part of the matrix with the coated sheet materials has not been measured, since it was decided at the project meetings not to perform these measurements in favour of the second series of measurements. The aim of this second series was to measure the effect of the operational conditions on tool wear. The related test matrix is given in Table 14. The numbers shown in the table refer to the corresponding test data sheet.
33
TNO test programme WP 2 FN = 100 N, v = 0.37 m/s, smax = 1.5 km
Tool materialsUncoated With coating
Supplier Uddeholm
Supplier Grade Coating G
GG
70L
SV
ER
KE
R 2
1
SLE
IPN
ER
63
SLE
IPN
ER
61
VA
NC
RO
N
SLE
IPN
ER
+ T
iC
SLE
IPN
ER
+ T
iAlN
SLE
IPN
ER
+ P
N
GG
G70
L +
Cr
Corus HSLA340 GI 077 076 079 078H220YD GI 073 072 075 074DP600 GI 006 005 019 018 017 020 022 021 023
SSAB DC04 CR 012 009 008 014 013 010 011 016 015HSLA700MC HR 056 057 050 049 055 051 054 053 052DP800 CR 039 035 034 033 041 037 038 036 040DP800 GI 095 094 097 096DP1000 CR 064 067 060 059 066 061 062 063 065DP1400 CR 025 028 027 024 026 031 030 029 032
Arcelor H34LAD GI 091 090 093 092TRIP800 EG 087 086 089 088HR45 GI 083 082 085 084HR60 GI 069 068 070 132 131 130 071
Table 13 Long term model wear test matrix Normal forceSliding velocity 50 N 100 N 200 N0.05 m/s 109, 110, 111,
112, 113, 114 123, 124, 125,126, 127
106
0.37 m/s 115, 116, 117, 118
098, 099, 104 107, 108
0.99 m/s 119, 120, 121, 122, 138
128, 133, 134, 135, 136, 137
105
Table 14 Effect of operational conditions test matrix (HR700MC, SLEIPNER)
4.2.4 Slider-on-sheet results for uncoated sheet materials
DC 04 DC 04 serves as a reference material for uncoated metal sheet. All tool materials were evaluated in combination with DC 04, which was supplied with mill-applied Croda PQ69 lubrication. Seven tool materials were virtually unaffected by 1000 m of sliding on DC 04, that is: VANCRON, tools coated with TiAlN, TiC and plasma nitride, hard chromium plated GGG 70L, SLEIPNER 61 HRC and SVERKER 21. Application of the Archard law i.e. k = V/F.s1 showed a specific wear rate in the order of magnitude 10-8 mm3/Nm for both SVERKER 21 and VANCRON. This order of magnitude corresponds well with the tribological rule of the thumb that the wear rate of a sliding system should be less than 10-6 mm3/Nm in order to be of practical use in sliding applications. Furthermore it corresponds well with general results from industrial forming applications with DC 04 in which SVERKER 21 is used as ‘standard tool material’. Based on this result it is concluded that a specific wear rate of 10-8 mm3/Nm is likely to correspond with an acceptable wear regime in
1 k being the specific wear rate in mm3/Nm, V the worn volume in mm3, F the normal force in N and s the sliding distance in m.
34
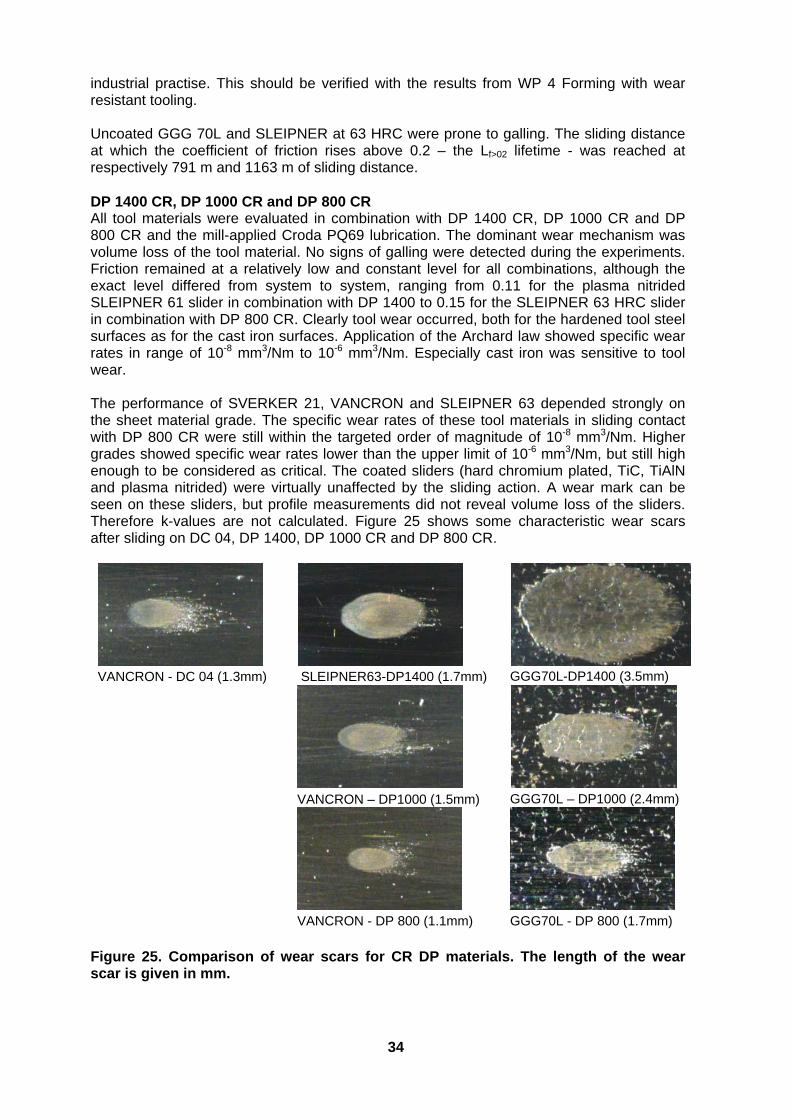
industrial practise. This should be verified with the results from WP 4 Forming with wear resistant tooling. Uncoated GGG 70L and SLEIPNER at 63 HRC were prone to galling. The sliding distance at which the coefficient of friction rises above 0.2 – the Lf>02 lifetime - was reached at respectively 791 m and 1163 m of sliding distance. DP 1400 CR, DP 1000 CR and DP 800 CR All tool materials were evaluated in combination with DP 1400 CR, DP 1000 CR and DP 800 CR and the mill-applied Croda PQ69 lubrication. The dominant wear mechanism was volume loss of the tool material. No signs of galling were detected during the experiments. Friction remained at a relatively low and constant level for all combinations, although the exact level differed from system to system, ranging from 0.11 for the plasma nitrided SLEIPNER 61 slider in combination with DP 1400 to 0.15 for the SLEIPNER 63 HRC slider in combination with DP 800 CR. Clearly tool wear occurred, both for the hardened tool steel surfaces as for the cast iron surfaces. Application of the Archard law showed specific wear rates in range of 10-8 mm3/Nm to 10-6 mm3/Nm. Especially cast iron was sensitive to tool wear. The performance of SVERKER 21, VANCRON and SLEIPNER 63 depended strongly on the sheet material grade. The specific wear rates of these tool materials in sliding contact with DP 800 CR were still within the targeted order of magnitude of 10-8 mm3/Nm. Higher grades showed specific wear rates lower than the upper limit of 10-6 mm3/Nm, but still high enough to be considered as critical. The coated sliders (hard chromium plated, TiC, TiAlN and plasma nitrided) were virtually unaffected by the sliding action. A wear mark can be seen on these sliders, but profile measurements did not reveal volume loss of the sliders. Therefore k-values are not calculated. Figure 25 shows some characteristic wear scars after sliding on DC 04, DP 1400, DP 1000 CR and DP 800 CR.
VANCRON - DC 04 (1.3mm) SLEIPNER63-DP1400 (1.7mm) GGG70L-DP1400 (3.5mm)
VANCRON – DP1000 (1.5mm) GGG70L – DP1000 (2.4mm)
VANCRON - DP 800 (1.1mm) GGG70L - DP 800 (1.7mm)
Figure 25. Comparison of wear scars for CR DP materials. The length of the wear scar is given in mm.
35
Three additional experiments were done with cast iron GGG 70L in combination with DP 800 CR at higher normal forces, in order to study effect of operational conditions on wear. The results, given in Table 15, show that the specific wear rate is rather insensitive to variations in normal force.
Experiment Sliding distance [m]
Normal force [N]
k [mm3/Nm]
039 1000 100 0.06*10-6
042 1000 200 0.07*10-6
044 1000 300 0.06*10-6
046 904 600 0.06*10-6
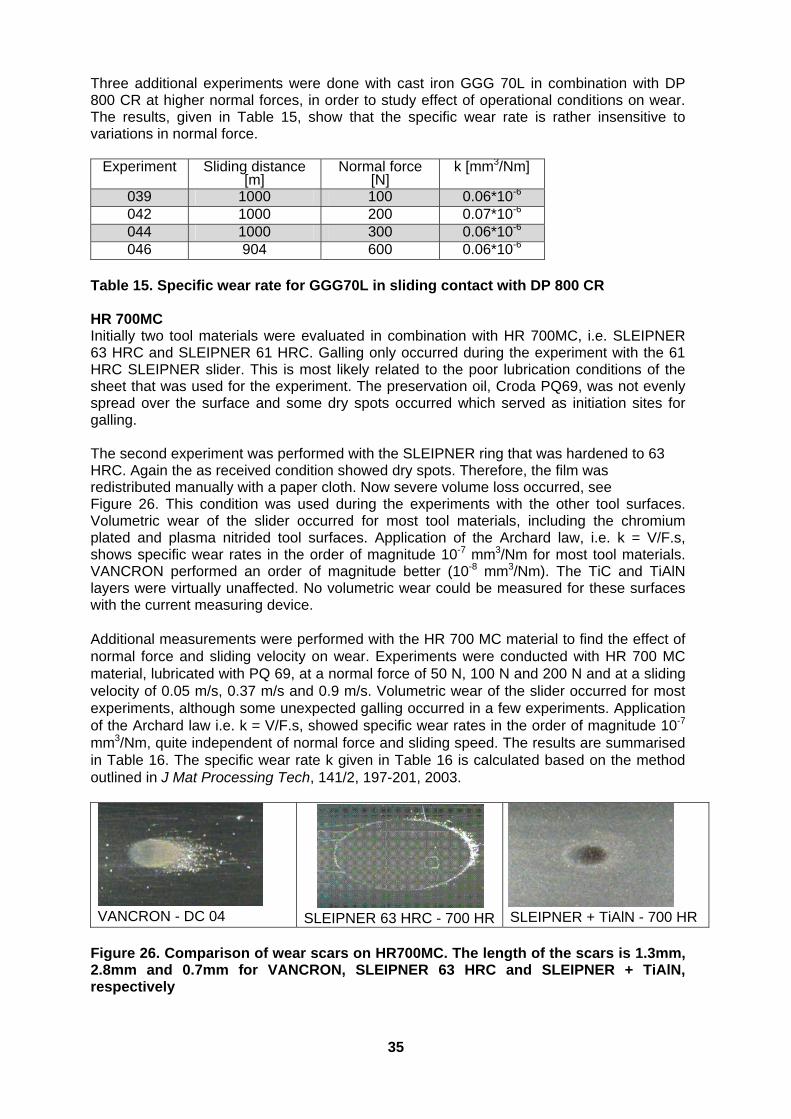
Table 15. Specific wear rate for GGG70L in sliding contact with DP 800 CR HR 700MC Initially two tool materials were evaluated in combination with HR 700MC, i.e. SLEIPNER 63 HRC and SLEIPNER 61 HRC. Galling only occurred during the experiment with the 61 HRC SLEIPNER slider. This is most likely related to the poor lubrication conditions of the sheet that was used for the experiment. The preservation oil, Croda PQ69, was not evenly spread over the surface and some dry spots occurred which served as initiation sites for galling. The second experiment was performed with the SLEIPNER ring that was hardened to 63 HRC. Again the as received condition showed dry spots. Therefore, the film was redistributed manually with a paper cloth. Now severe volume loss occurred, see Figure 26. This condition was used during the experiments with the other tool surfaces. Volumetric wear of the slider occurred for most tool materials, including the chromium plated and plasma nitrided tool surfaces. Application of the Archard law, i.e. k = V/F.s, shows specific wear rates in the order of magnitude 10-7 mm3/Nm for most tool materials. VANCRON performed an order of magnitude better (10-8 mm3/Nm). The TiC and TiAlN layers were virtually unaffected. No volumetric wear could be measured for these surfaces with the current measuring device. Additional measurements were performed with the HR 700 MC material to find the effect of normal force and sliding velocity on wear. Experiments were conducted with HR 700 MC material, lubricated with PQ 69, at a normal force of 50 N, 100 N and 200 N and at a sliding velocity of 0.05 m/s, 0.37 m/s and 0.9 m/s. Volumetric wear of the slider occurred for most experiments, although some unexpected galling occurred in a few experiments. Application of the Archard law i.e. k = V/F.s, showed specific wear rates in the order of magnitude 10-7 mm3/Nm, quite independent of normal force and sliding speed. The results are summarised in Table 16. The specific wear rate k given in Table 16 is calculated based on the method outlined in J Mat Processing Tech, 141/2, 197-201, 2003.
VANCRON - DC 04 SLEIPNER 63 HRC - 700 HR SLEIPNER + TiAlN - 700 HR Figure 26. Comparison of wear scars on HR700MC. The length of the scars is 1.3mm, 2.8mm and 0.7mm for VANCRON, SLEIPNER 63 HRC and SLEIPNER + TiAlN, respectively
36
FN = 50 N FN = 100 N FN = 200 N v = 0.05 m/s w, w, g, w, g, w, w
k = 0.7 10-6 mm3/Nm g, w, w, w, wk = 0.8 10-6 mm3/Nm
g
v = 0.37 m/s w, w, w, w, w k = 0.9 10-6 mm3/Nm
w, w, w, wk = 0.4 10-6 mm3/Nm
w, g
v = 0.99 m/s w, g, w, w, w, w k = 0.6 10-6 mm3/Nm
w, w, g, w, wk = 1.0 10-6 mm3/Nm
g
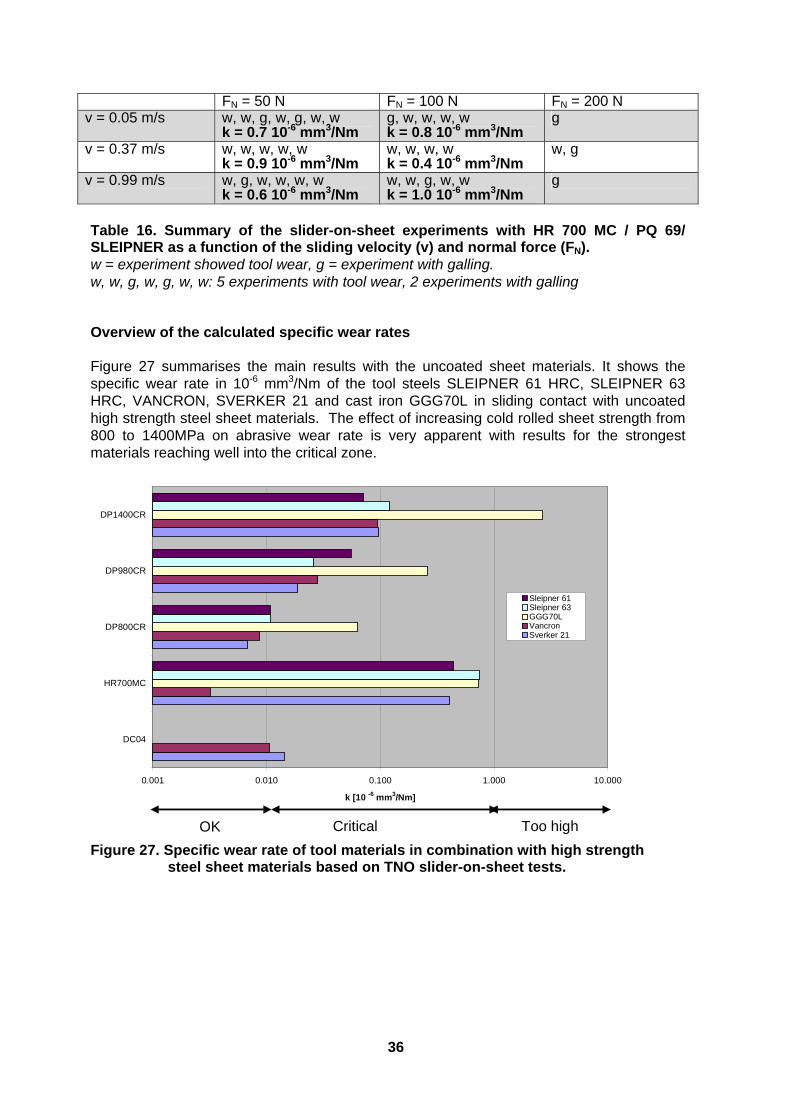
Table 16. Summary of the slider-on-sheet experiments with HR 700 MC / PQ 69/ SLEIPNER as a function of the sliding velocity (v) and normal force (FN). w = experiment showed tool wear, g = experiment with galling. w, w, g, w, g, w, w: 5 experiments with tool wear, 2 experiments with galling Overview of the calculated specific wear rates Figure 27 summarises the main results with the uncoated sheet materials. It shows the specific wear rate in 10-6 mm3/Nm of the tool steels SLEIPNER 61 HRC, SLEIPNER 63 HRC, VANCRON, SVERKER 21 and cast iron GGG70L in sliding contact with uncoated high strength steel sheet materials. The effect of increasing cold rolled sheet strength from 800 to 1400MPa on abrasive wear rate is very apparent with results for the strongest materials reaching well into the critical zone.
0.001 0.010 0.100 1.000 10.000
DC04
HR700MC
DP800CR
DP980CR
DP1400CR
k [10 -6 mm3/Nm]
Sleipner 61Sleipner 63GGG70LVancronSverker 21
OK Critical Too high
Figure 27. Specific wear rate of tool materials in combination with high strength steel sheet materials based on TNO slider-on-sheet tests.

37
4.2.5 Slider-on-sheet results for zinc coated sheet materials
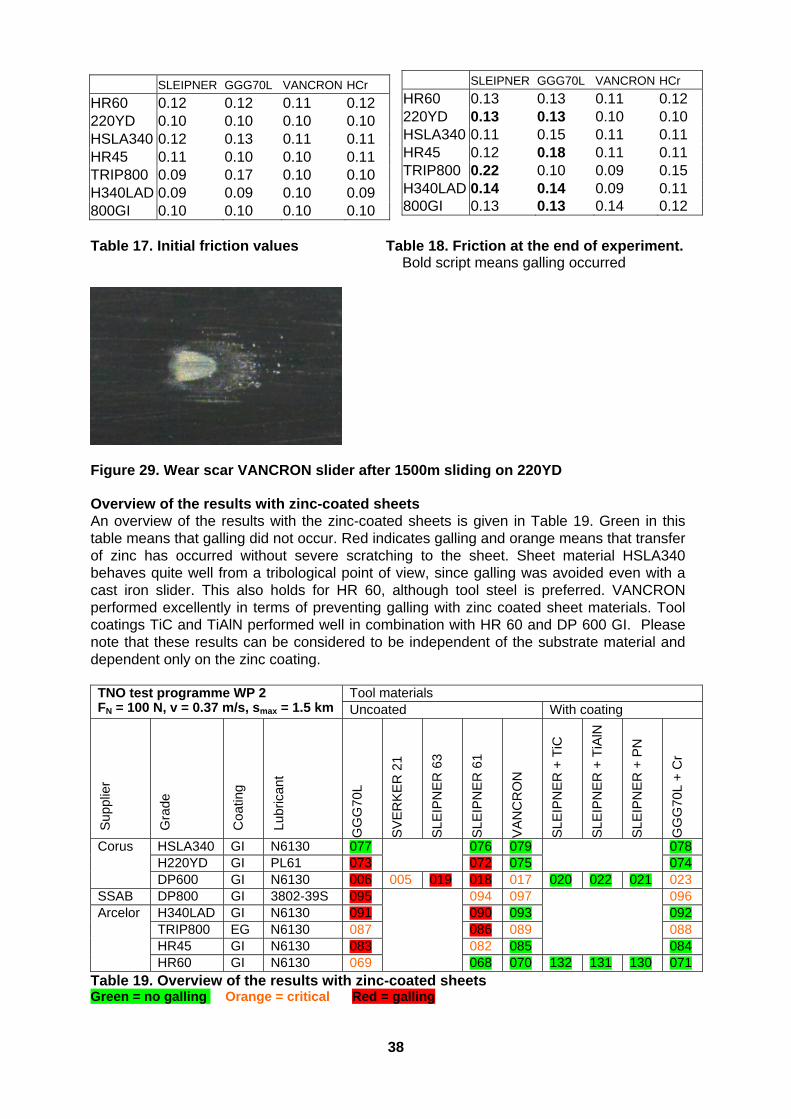
DP 600 GI DP 600 GI serves as a reference material for zinc coated metal sheet. All tool materials were evaluated in combination with DP 600 GI in the as received condition. In all cases material was transferred from the sheet to the wear scar on the slider, see e.g. Figure 28. Figure 28. Wear scar on SLEIPNER 63 after sliding on DP 600 GI (Arrow indicates transferred zinc layer) The friction level at the start of the experiments was rather low, approximately 0.09. Friction remained constant at this level for the sliders made from SVERKER 21, SLEIPNER TiAlN, plasma nitrided SLEIPNER, SLEIPNER TiC and VANCRON. An increase to about 0.11 was measured for the SLEIPNER 61 HRC slider and the hard chromium plated GGG 70L slider. This was accompanied by mild scratching of the sheet surface. An increase to 0.12 and 0.14 was measured for the SLEIPNER 63 HRC and the uncoated GGG70L slider, respectively; these combinations showed signs of galling. Results with zinc coated materials and a limited set of tool materials It was decided at the semester meetings to asses the galling tendencies of H220YD, H340LAD, DP 800 GI, HSLA 340, TRIP 800 EG, HR 45 and HR 60 with a reduced set of tool materials, that is with: SLEIPNER 61 HRC, GGG70L, hard chromium plated GGG 70 L and VANCRON (28 measurements). An overview of the coefficient of friction at the start and at the end of each experiment is given in the tables below. Initital friction levels are quite similar for the tool materials SLEIPNER, GGG70L, VANCRON and hard chromium plated GGG70L Cr, for a given sheet material. Values differ by no more than 0.01, which is typically equal to or less than 10%. Clearly, friction levels are influenced more by the selected sheet material within the set HR 60, 220YD, HSLA 340, HR 45, TRIP 800, H34 LAD and 800 GI. Especially HSLA340 resulted in a relatively high level at the start of the experiment. From Table 14 it can be seen if galling occurred during the experiment. Especially SLEIPNER and uncoated cast iron were sensitive to galling. VANCRON and hard chromium plated cast iron performed well, no signs of galling occurred. A representative image of the wear scar after sliding is given in Figure 29.
38
SLEIPNER GGG70L VANCRON HCr
HR60 0.12 0.12 0.11 0.12220YD 0.10 0.10 0.10 0.10HSLA340 0.12 0.13 0.11 0.11HR45 0.11 0.10 0.10 0.11TRIP800 0.09 0.17 0.10 0.10H340LAD 0.09 0.09 0.10 0.09800GI 0.10 0.10 0.10 0.10 Table 17. Initial friction values Table 18. Friction at the end of experiment. Bold script means galling occurred
Figure 29. Wear scar VANCRON slider after 1500m sliding on 220YD Overview of the results with zinc-coated sheets An overview of the results with the zinc-coated sheets is given in Table 19. Green in this table means that galling did not occur. Red indicates galling and orange means that transfer of zinc has occurred without severe scratching to the sheet. Sheet material HSLA340 behaves quite well from a tribological point of view, since galling was avoided even with a cast iron slider. This also holds for HR 60, although tool steel is preferred. VANCRON performed excellently in terms of preventing galling with zinc coated sheet materials. Tool coatings TiC and TiAlN performed well in combination with HR 60 and DP 600 GI. Please note that these results can be considered to be independent of the substrate material and dependent only on the zinc coating. TNO test programme WP 2 FN = 100 N, v = 0.37 m/s, smax = 1.5 km
Tool materials Uncoated With coating
Sup
plie
r
Gra
de
Coa
ting
Lubr
ican
t
GG
G70
L
SV
ER
KE
R 2
1
SLE
IPN
ER
63
SLE
IPN
ER
61
VA
NC
RO
N
SLE
IPN
ER
+ T
iC
SLE
IPN
ER
+ T
iAlN
SLE
IPN
ER
+ P
N
GG
G70
L +
Cr
Corus HSLA340 GI N6130 077 076 079 078 H220YD GI PL61 073 072 075 074 DP600 GI N6130 006 005 019 018 017 020 022 021 023
SSAB DP800 GI 3802-39S 095 094 097 096 Arcelor H340LAD GI N6130 091 090 093 092
TRIP800 EG N6130 087 086 089 088 HR45 GI N6130 083 082 085 084 HR60 GI N6130 069 068 070 132 131 130 071
Table 19. Overview of the results with zinc-coated sheets Green = no galling Orange = critical Red = galling
SLEIPNER GGG70L VANCRON HCr
HR60 0.13 0.13 0.11 0.12220YD 0.13 0.13 0.10 0.10HSLA340 0.11 0.15 0.11 0.11HR45 0.12 0.18 0.11 0.11TRIP800 0.22 0.10 0.09 0.15H340LAD 0.14 0.14 0.09 0.11800GI 0.13 0.13 0.14 0.12
39
4.2.6 Slider on sheet conclusions
Uncoated sheet materials
1. A specific wear rate of 10-8 mm3/Nm in the TNO slider-on-sheet test is likely to correspond with an acceptable wear regime in practical applications.
2. The dominant wear mechanism for sliding contact at uncoated high strength steel
sheet material is abrasive wear, i.e volumetric wear of the slider.
3. The specific wear rate for GGG70L in combination with DP 800 CR and SLEIPNER 61 in combination with HR 700MC is rather insensitive of normal force and sliding speed. This confirms that k is independent of Fn, the normal force.
4. The specific wear rate of each tool material is presented in Figure 27. 5. The specific wear rate is insensitive to variations in normal force in this test.
Zinc -coated sheet materials
6. The dominant wear mechanism for sliding contact at zinc-coated high strength steel sheet material is adhesive wear (leading to galling).
7. The measured friction levels at the start of experiment are quite similar for the tool
materials SLEIPNER, GGG70L, VANCRON and hard chromium plated GGG70L Cr, for a given sheet material. Values differ max 0.01, which is typically equal or less than 10%.
8. Friction levels are influenced by the selected sheet material. Especially HSLA340
resulted in a relatively high level at the start of the experiment.
9. Especially SLEIPNER and uncoated cast iron were sensitive to galling. VANCRON and hard chromium plated cast iron performed well, no signs of galling occurred.
10. The sensitivity of each tool material to galling is indicated in Table 19.
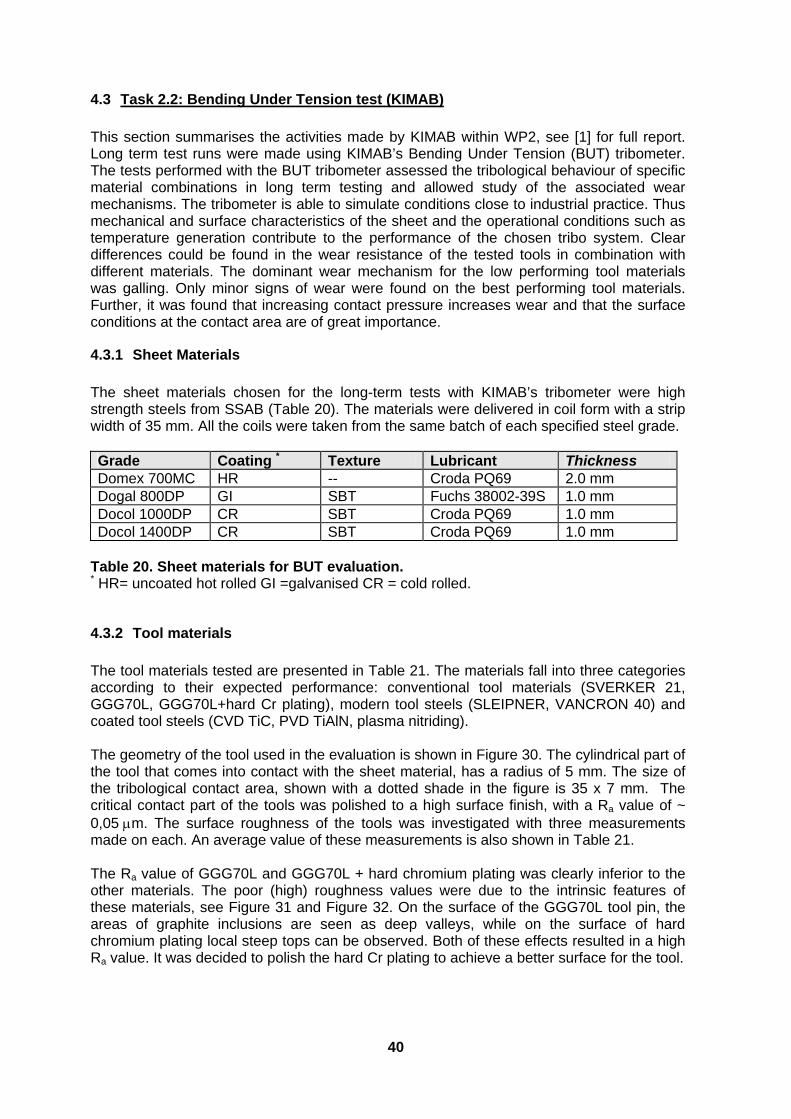
40
4.3 Task 2.2: Bending Under Tension test (KIMAB)
This section summarises the activities made by KIMAB within WP2, see [1] for full report. Long term test runs were made using KIMAB’s Bending Under Tension (BUT) tribometer. The tests performed with the BUT tribometer assessed the tribological behaviour of specific material combinations in long term testing and allowed study of the associated wear mechanisms. The tribometer is able to simulate conditions close to industrial practice. Thus mechanical and surface characteristics of the sheet and the operational conditions such as temperature generation contribute to the performance of the chosen tribo system. Clear differences could be found in the wear resistance of the tested tools in combination with different materials. The dominant wear mechanism for the low performing tool materials was galling. Only minor signs of wear were found on the best performing tool materials. Further, it was found that increasing contact pressure increases wear and that the surface conditions at the contact area are of great importance.
4.3.1 Sheet Materials
The sheet materials chosen for the long-term tests with KIMAB’s tribometer were high strength steels from SSAB (Table 20). The materials were delivered in coil form with a strip width of 35 mm. All the coils were taken from the same batch of each specified steel grade. Grade Coating * Texture Lubricant Thickness Domex 700MC HR -- Croda PQ69 2.0 mm Dogal 800DP GI SBT Fuchs 38002-39S 1.0 mm Docol 1000DP CR SBT Croda PQ69 1.0 mm Docol 1400DP CR SBT Croda PQ69 1.0 mm
Table 20. Sheet materials for BUT evaluation. * HR= uncoated hot rolled GI =galvanised CR = cold rolled.
4.3.2 Tool materials
The tool materials tested are presented in Table 21. The materials fall into three categories according to their expected performance: conventional tool materials (SVERKER 21, GGG70L, GGG70L+hard Cr plating), modern tool steels (SLEIPNER, VANCRON 40) and coated tool steels (CVD TiC, PVD TiAlN, plasma nitriding). The geometry of the tool used in the evaluation is shown in Figure 30. The cylindrical part of the tool that comes into contact with the sheet material, has a radius of 5 mm. The size of the tribological contact area, shown with a dotted shade in the figure is 35 x 7 mm. The critical contact part of the tools was polished to a high surface finish, with a Ra value of ~ 0,05 m. The surface roughness of the tools was investigated with three measurements made on each. An average value of these measurements is also shown in Table 21. The Ra value of GGG70L and GGG70L + hard chromium plating was clearly inferior to the other materials. The poor (high) roughness values were due to the intrinsic features of these materials, see Figure 31 and Figure 32. On the surface of the GGG70L tool pin, the areas of graphite inclusions are seen as deep valleys, while on the surface of hard chromium plating local steep tops can be observed. Both of these effects resulted in a high Ra value. It was decided to polish the hard Cr plating to achieve a better surface for the tool.
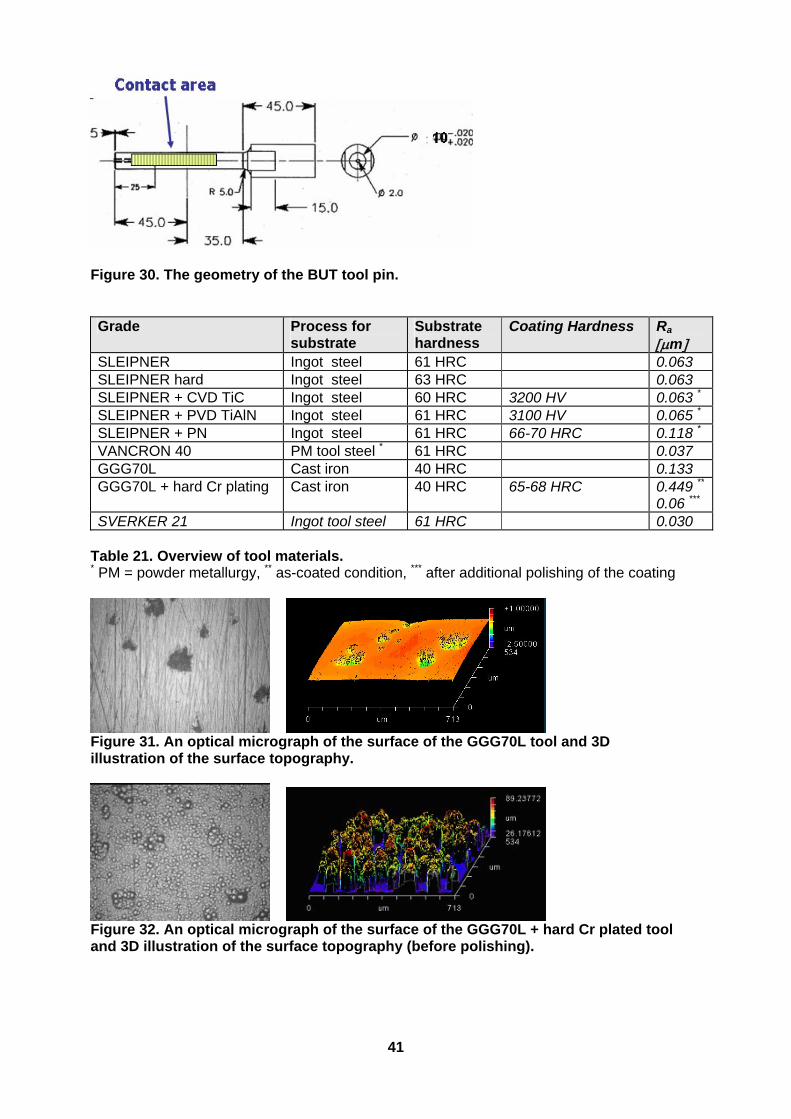
41
Figure 30. The geometry of the BUT tool pin. Grade Process for
substrate Substrate hardness
Coating Hardness Ra m
SLEIPNER Ingot steel 61 HRC 0.063 SLEIPNER hard Ingot steel 63 HRC 0.063 SLEIPNER + CVD TiC Ingot steel 60 HRC 3200 HV 0.063 * SLEIPNER + PVD TiAlN Ingot steel 61 HRC 3100 HV 0.065 * SLEIPNER + PN Ingot steel 61 HRC 66-70 HRC 0.118 * VANCRON 40 PM tool steel * 61 HRC 0.037 GGG70L Cast iron 40 HRC 0.133 GGG70L + hard Cr plating Cast iron 40 HRC 65-68 HRC 0.449 **
0.06 *** SVERKER 21 Ingot tool steel 61 HRC 0.030
Table 21. Overview of tool materials. * PM = powder metallurgy, ** as-coated condition, *** after additional polishing of the coating
Figure 31. An optical micrograph of the surface of the GGG70L tool and 3D illustration of the surface topography.
Figure 32. An optical micrograph of the surface of the GGG70L + hard Cr plated tool and 3D illustration of the surface topography (before polishing).
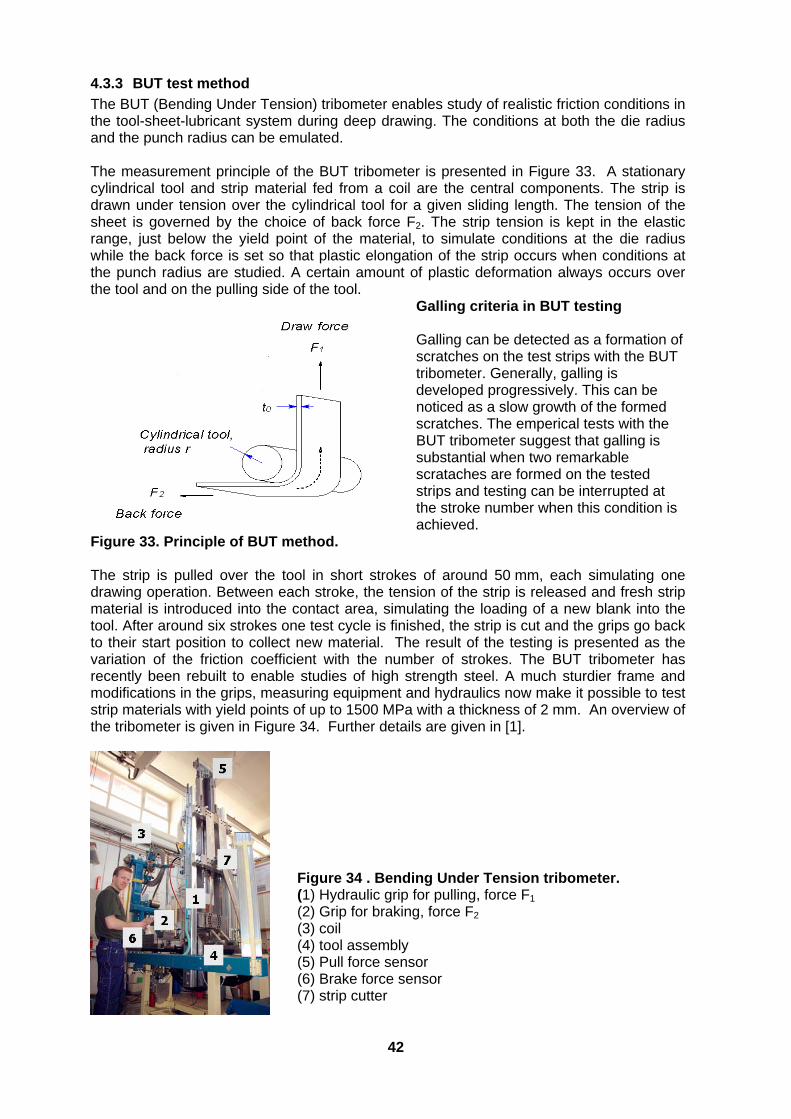
42
4.3.3 BUT test method
The BUT (Bending Under Tension) tribometer enables study of realistic friction conditions in the tool-sheet-lubricant system during deep drawing. The conditions at both the die radius and the punch radius can be emulated. The measurement principle of the BUT tribometer is presented in Figure 33. A stationary cylindrical tool and strip material fed from a coil are the central components. The strip is drawn under tension over the cylindrical tool for a given sliding length. The tension of the sheet is governed by the choice of back force F2. The strip tension is kept in the elastic range, just below the yield point of the material, to simulate conditions at the die radius while the back force is set so that plastic elongation of the strip occurs when conditions at the punch radius are studied. A certain amount of plastic deformation always occurs over the tool and on the pulling side of the tool.
Galling criteria in BUT testing Galling can be detected as a formation of scratches on the test strips with the BUT tribometer. Generally, galling is developed progressively. This can be noticed as a slow growth of the formed scratches. The emperical tests with the BUT tribometer suggest that galling is substantial when two remarkable scrataches are formed on the tested strips and testing can be interrupted at the stroke number when this condition is achieved.
Figure 33. Principle of BUT method. The strip is pulled over the tool in short strokes of around 50 mm, each simulating one drawing operation. Between each stroke, the tension of the strip is released and fresh strip material is introduced into the contact area, simulating the loading of a new blank into the tool. After around six strokes one test cycle is finished, the strip is cut and the grips go back to their start position to collect new material. The result of the testing is presented as the variation of the friction coefficient with the number of strokes. The BUT tribometer has recently been rebuilt to enable studies of high strength steel. A much sturdier frame and modifications in the grips, measuring equipment and hydraulics now make it possible to test strip materials with yield points of up to 1500 MPa with a thickness of 2 mm. An overview of the tribometer is given in Figure 34. Further details are given in [1].
Figure 34 . Bending Under Tension tribometer. (1) Hydraulic grip for pulling, force F1 (2) Grip for braking, force F2 (3) coil (4) tool assembly (5) Pull force sensor (6) Brake force sensor (7) strip cutter
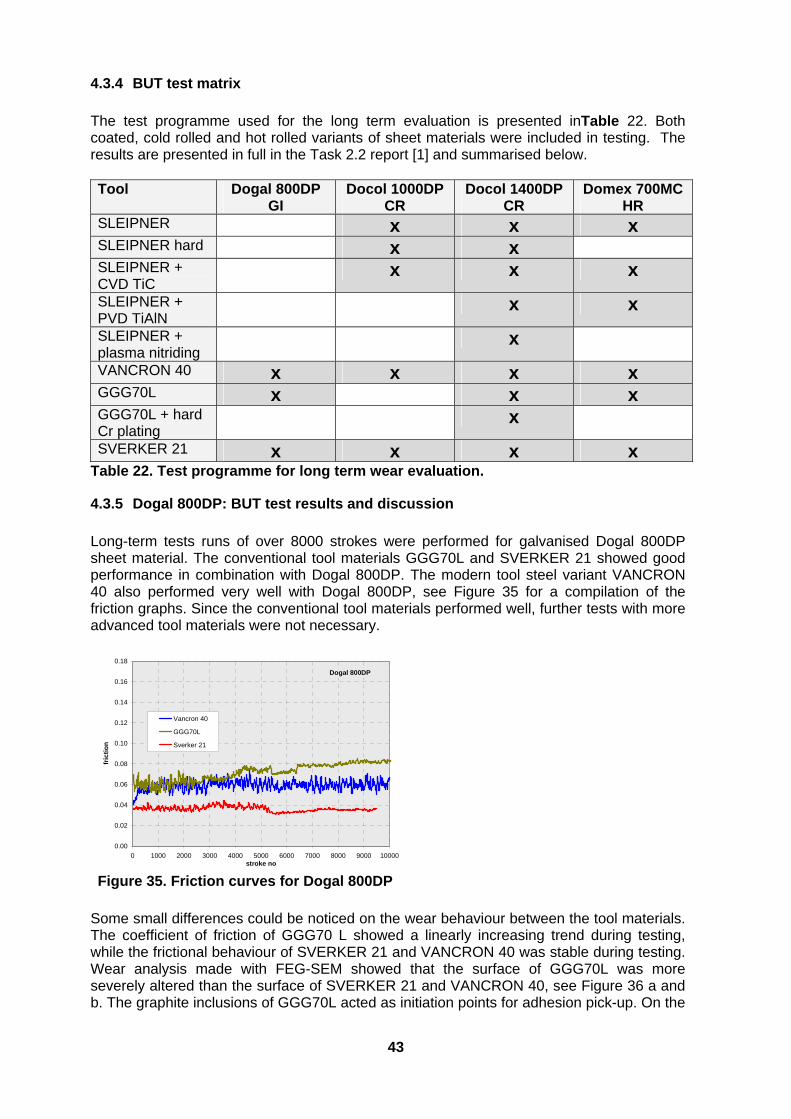
43
4.3.4 BUT test matrix
The test programme used for the long term evaluation is presented inTable 22. Both coated, cold rolled and hot rolled variants of sheet materials were included in testing. The results are presented in full in the Task 2.2 report [1] and summarised below. Tool Dogal 800DP
GI Docol 1000DP
CR Docol 1400DP
CR Domex 700MC
HR SLEIPNER x x x SLEIPNER hard x x SLEIPNER + CVD TiC
x x x
SLEIPNER + PVD TiAlN
x x
SLEIPNER + plasma nitriding
x
VANCRON 40 x x x x GGG70L x x x GGG70L + hard Cr plating
x
SVERKER 21 x x x x Table 22. Test programme for long term wear evaluation.
4.3.5 Dogal 800DP: BUT test results and discussion
Long-term tests runs of over 8000 strokes were performed for galvanised Dogal 800DP sheet material. The conventional tool materials GGG70L and SVERKER 21 showed good performance in combination with Dogal 800DP. The modern tool steel variant VANCRON 40 also performed very well with Dogal 800DP, see Figure 35 for a compilation of the friction graphs. Since the conventional tool materials performed well, further tests with more advanced tool materials were not necessary.
0.00
0.02
0.04
0.06
0.08
0.10
0.12
0.14
0.16
0.18
0 1000 2000 3000 4000 5000 6000 7000 8000 9000 10000stroke no
fric
tio
n
Vancron 40
GGG70L
Sverker 21
Dogal 800DP
Figure 35. Friction curves for Dogal 800DP
Some small differences could be noticed on the wear behaviour between the tool materials. The coefficient of friction of GGG70 L showed a linearly increasing trend during testing, while the frictional behaviour of SVERKER 21 and VANCRON 40 was stable during testing. Wear analysis made with FEG-SEM showed that the surface of GGG70L was more severely altered than the surface of SVERKER 21 and VANCRON 40, see Figure 36 a and b. The graphite inclusions of GGG70L acted as initiation points for adhesion pick-up. On the
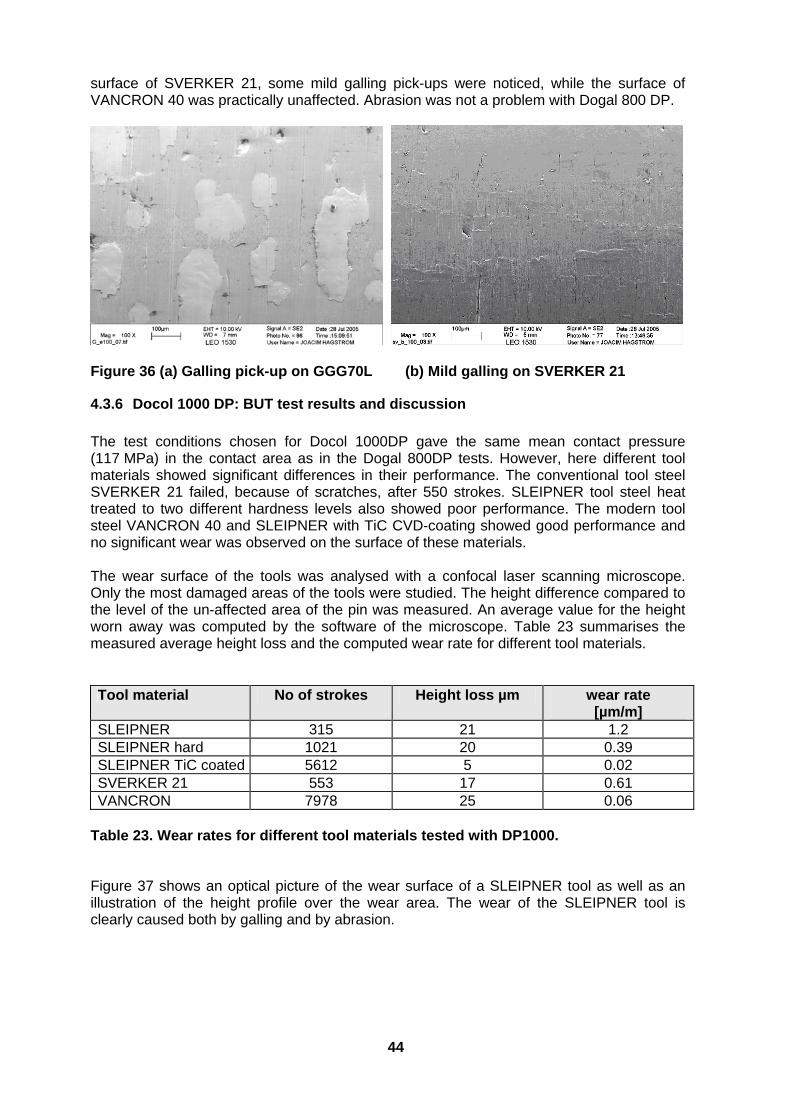
44
surface of SVERKER 21, some mild galling pick-ups were noticed, while the surface of VANCRON 40 was practically unaffected. Abrasion was not a problem with Dogal 800 DP.
Figure 36 (a) Galling pick-up on GGG70L (b) Mild galling on SVERKER 21
4.3.6 Docol 1000 DP: BUT test results and discussion
The test conditions chosen for Docol 1000DP gave the same mean contact pressure (117 MPa) in the contact area as in the Dogal 800DP tests. However, here different tool materials showed significant differences in their performance. The conventional tool steel SVERKER 21 failed, because of scratches, after 550 strokes. SLEIPNER tool steel heat treated to two different hardness levels also showed poor performance. The modern tool steel VANCRON 40 and SLEIPNER with TiC CVD-coating showed good performance and no significant wear was observed on the surface of these materials. The wear surface of the tools was analysed with a confocal laser scanning microscope. Only the most damaged areas of the tools were studied. The height difference compared to the level of the un-affected area of the pin was measured. An average value for the height worn away was computed by the software of the microscope. Table 23 summarises the measured average height loss and the computed wear rate for different tool materials. Tool material No of strokes Height loss µm wear rate
[µm/m] SLEIPNER 315 21 1.2 SLEIPNER hard 1021 20 0.39 SLEIPNER TiC coated 5612 5 0.02 SVERKER 21 553 17 0.61 VANCRON 7978 25 0.06
Table 23. Wear rates for different tool materials tested with DP1000. Figure 37 shows an optical picture of the wear surface of a SLEIPNER tool as well as an illustration of the height profile over the wear area. The wear of the SLEIPNER tool is clearly caused both by galling and by abrasion.
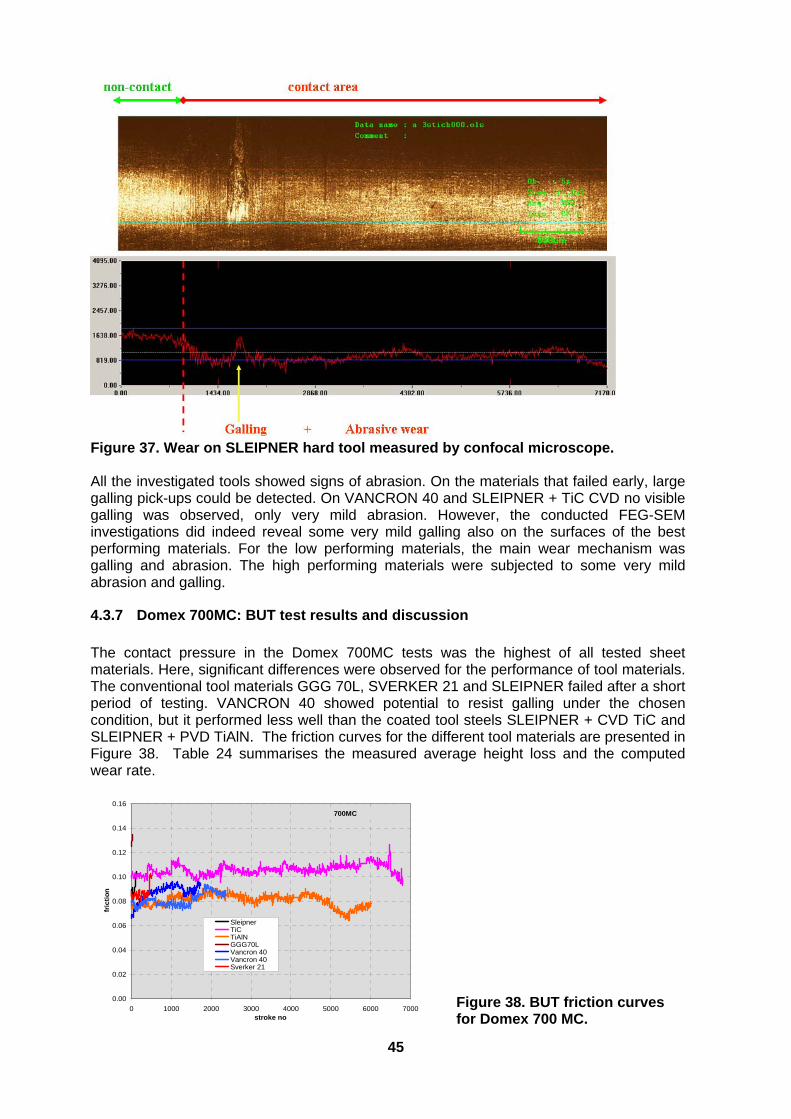
45
Figure 37. Wear on SLEIPNER hard tool measured by confocal microscope. All the investigated tools showed signs of abrasion. On the materials that failed early, large galling pick-ups could be detected. On VANCRON 40 and SLEIPNER + TiC CVD no visible galling was observed, only very mild abrasion. However, the conducted FEG-SEM investigations did indeed reveal some very mild galling also on the surfaces of the best performing materials. For the low performing materials, the main wear mechanism was galling and abrasion. The high performing materials were subjected to some very mild abrasion and galling.
4.3.7 Domex 700MC: BUT test results and discussion
The contact pressure in the Domex 700MC tests was the highest of all tested sheet materials. Here, significant differences were observed for the performance of tool materials. The conventional tool materials GGG 70L, SVERKER 21 and SLEIPNER failed after a short period of testing. VANCRON 40 showed potential to resist galling under the chosen condition, but it performed less well than the coated tool steels SLEIPNER + CVD TiC and SLEIPNER + PVD TiAlN. The friction curves for the different tool materials are presented in Figure 38. Table 24 summarises the measured average height loss and the computed wear rate.
0.00
0.02
0.04
0.06
0.08
0.10
0.12
0.14
0.16
0 1000 2000 3000 4000 5000 6000 7000stroke no
fric
tio
n
SleipnerTiCTiAlNGGG70LVancron 40Vancron 40Sverker 21
700MC
Figure 38. BUT friction curves for Domex 700 MC.
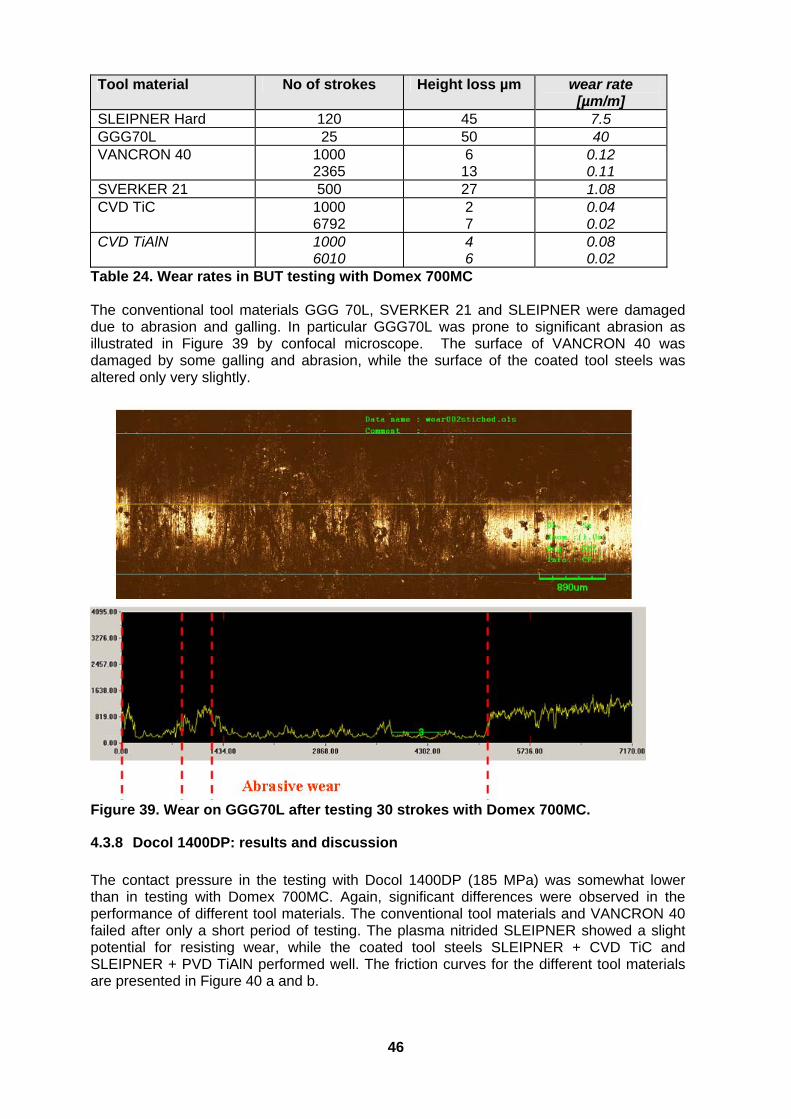
46
Tool material No of strokes Height loss µm wear rate [µm/m]
SLEIPNER Hard 120 45 7.5 GGG70L 25 50 40 VANCRON 40 1000
2365 6 13
0.12 0.11
SVERKER 21 500 27 1.08 CVD TiC 1000
6792 2 7
0.04 0.02
CVD TiAlN 1000 6010
4 6
0.08 0.02
Table 24. Wear rates in BUT testing with Domex 700MC The conventional tool materials GGG 70L, SVERKER 21 and SLEIPNER were damaged due to abrasion and galling. In particular GGG70L was prone to significant abrasion as illustrated in Figure 39 by confocal microscope. The surface of VANCRON 40 was damaged by some galling and abrasion, while the surface of the coated tool steels was altered only very slightly.
Figure 39. Wear on GGG70L after testing 30 strokes with Domex 700MC.
4.3.8 Docol 1400DP: results and discussion
The contact pressure in the testing with Docol 1400DP (185 MPa) was somewhat lower than in testing with Domex 700MC. Again, significant differences were observed in the performance of different tool materials. The conventional tool materials and VANCRON 40 failed after only a short period of testing. The plasma nitrided SLEIPNER showed a slight potential for resisting wear, while the coated tool steels SLEIPNER + CVD TiC and SLEIPNER + PVD TiAlN performed well. The friction curves for the different tool materials are presented in Figure 40 a and b.
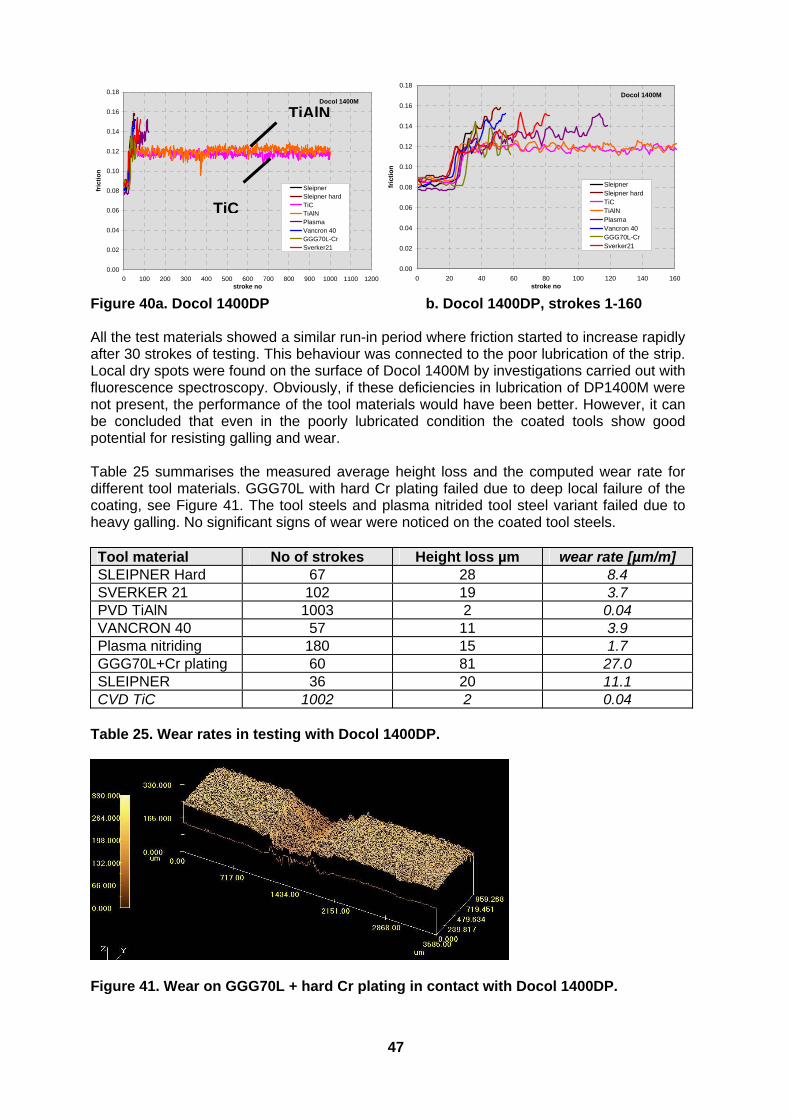
47
0.00
0.02
0.04
0.06
0.08
0.10
0.12
0.14
0.16
0.18
0 100 200 300 400 500 600 700 800 900 1000 1100 1200stroke no
fric
tio
n
SleipnerSleipner hardTiCTiAlNPlasmaVancron 40GGG70L-CrSverker21
Docol 1400M
0.00
0.02
0.04
0.06
0.08
0.10
0.12
0.14
0.16
0.18
0 20 40 60 80 100 120 140 160stroke no
fric
tio
n
SleipnerSleipner hardTiCTiAlNPlasmaVancron 40GGG70L-CrSverker21
Docol 1400M
Figure 40a. Docol 1400DP b. Docol 1400DP, strokes 1-160 All the test materials showed a similar run-in period where friction started to increase rapidly after 30 strokes of testing. This behaviour was connected to the poor lubrication of the strip. Local dry spots were found on the surface of Docol 1400M by investigations carried out with fluorescence spectroscopy. Obviously, if these deficiencies in lubrication of DP1400M were not present, the performance of the tool materials would have been better. However, it can be concluded that even in the poorly lubricated condition the coated tools show good potential for resisting galling and wear. Table 25 summarises the measured average height loss and the computed wear rate for different tool materials. GGG70L with hard Cr plating failed due to deep local failure of the coating, see Figure 41. The tool steels and plasma nitrided tool steel variant failed due to heavy galling. No significant signs of wear were noticed on the coated tool steels. Tool material No of strokes Height loss µm wear rate [µm/m] SLEIPNER Hard 67 28 8.4 SVERKER 21 102 19 3.7 PVD TiAlN 1003 2 0.04 VANCRON 40 57 11 3.9 Plasma nitriding 180 15 1.7 GGG70L+Cr plating 60 81 27.0 SLEIPNER 36 20 11.1 CVD TiC 1002 2 0.04
Table 25. Wear rates in testing with Docol 1400DP.
Figure 41. Wear on GGG70L + hard Cr plating in contact with Docol 1400DP.
TiAlN
TiC
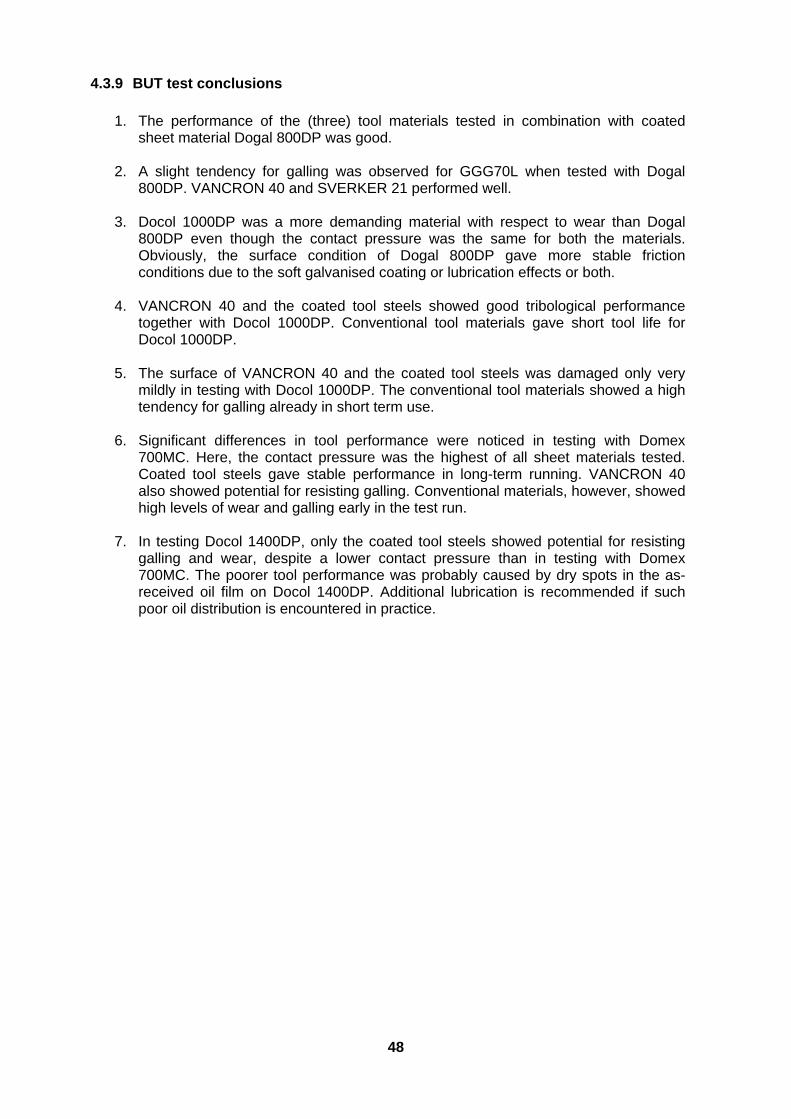
48
4.3.9 BUT test conclusions
1. The performance of the (three) tool materials tested in combination with coated
sheet material Dogal 800DP was good. 2. A slight tendency for galling was observed for GGG70L when tested with Dogal
800DP. VANCRON 40 and SVERKER 21 performed well. 3. Docol 1000DP was a more demanding material with respect to wear than Dogal
800DP even though the contact pressure was the same for both the materials. Obviously, the surface condition of Dogal 800DP gave more stable friction conditions due to the soft galvanised coating or lubrication effects or both.
4. VANCRON 40 and the coated tool steels showed good tribological performance
together with Docol 1000DP. Conventional tool materials gave short tool life for Docol 1000DP.
5. The surface of VANCRON 40 and the coated tool steels was damaged only very
mildly in testing with Docol 1000DP. The conventional tool materials showed a high tendency for galling already in short term use.
6. Significant differences in tool performance were noticed in testing with Domex
700MC. Here, the contact pressure was the highest of all sheet materials tested. Coated tool steels gave stable performance in long-term running. VANCRON 40 also showed potential for resisting galling. Conventional materials, however, showed high levels of wear and galling early in the test run.
7. In testing Docol 1400DP, only the coated tool steels showed potential for resisting
galling and wear, despite a lower contact pressure than in testing with Domex 700MC. The poorer tool performance was probably caused by dry spots in the as-received oil film on Docol 1400DP. Additional lubrication is recommended if such poor oil distribution is encountered in practice.
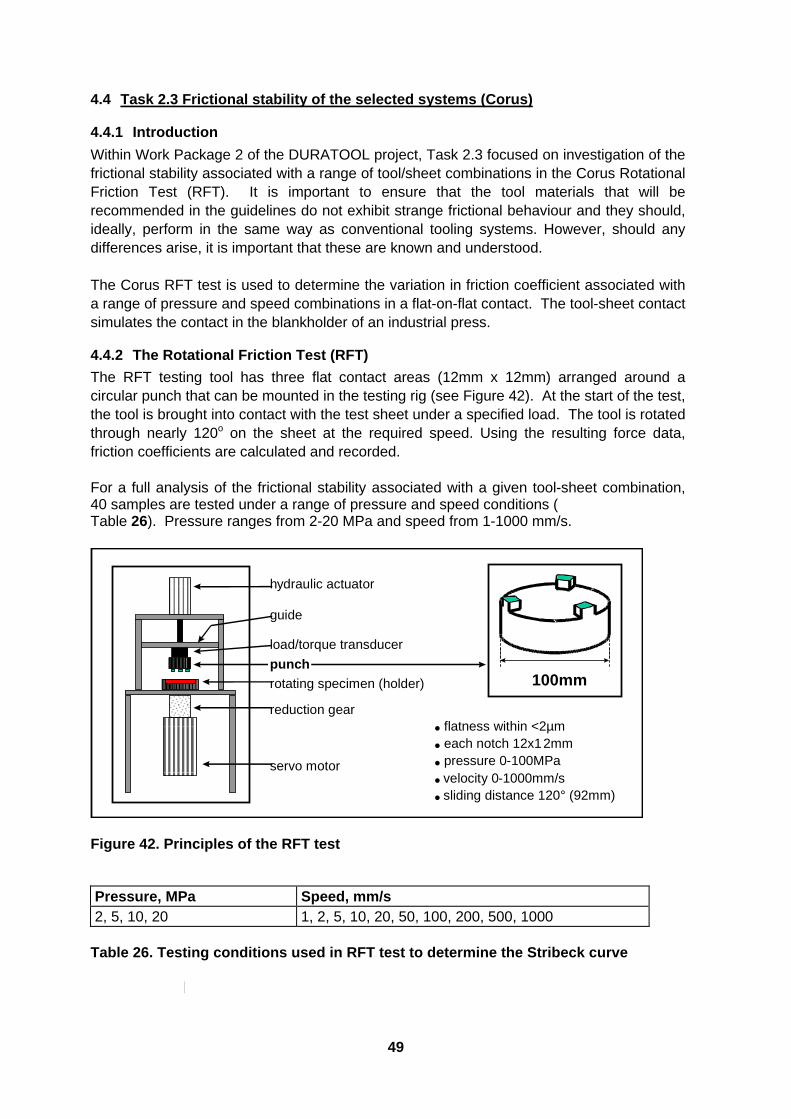
49
4.4 Task 2.3 Frictional stability of the selected systems (Corus)
4.4.1 Introduction
Within Work Package 2 of the DURATOOL project, Task 2.3 focused on investigation of the frictional stability associated with a range of tool/sheet combinations in the Corus Rotational Friction Test (RFT). It is important to ensure that the tool materials that will be recommended in the guidelines do not exhibit strange frictional behaviour and they should, ideally, perform in the same way as conventional tooling systems. However, should any differences arise, it is important that these are known and understood. The Corus RFT test is used to determine the variation in friction coefficient associated with a range of pressure and speed combinations in a flat-on-flat contact. The tool-sheet contact simulates the contact in the blankholder of an industrial press.
4.4.2 The Rotational Friction Test (RFT)
The RFT testing tool has three flat contact areas (12mm x 12mm) arranged around a circular punch that can be mounted in the testing rig (see Figure 42). At the start of the test, the tool is brought into contact with the test sheet under a specified load. The tool is rotated through nearly 120o on the sheet at the required speed. Using the resulting force data, friction coefficients are calculated and recorded. For a full analysis of the frictional stability associated with a given tool-sheet combination, 40 samples are tested under a range of pressure and speed conditions ( Table 26). Pressure ranges from 2-20 MPa and speed from 1-1000 mm/s.
load/torque transducer
h ydraulic actuator
reduction gear
servo motor
punch
guide
rotating specimen (holder) 100mm
• flatness within <2µm
• each notch 12x1 2mm
• pressure 0 - 100MPa
• velocity 0 - 1000mm/s
• sliding distance 120° (92mm)
Figure 42. Principles of the RFT test Pressure, MPa Speed, mm/s 2, 5, 10, 20 1, 2, 5, 10, 20, 50, 100, 200, 500, 1000
Table 26. Testing conditions used in RFT test to determine the Stribeck curve
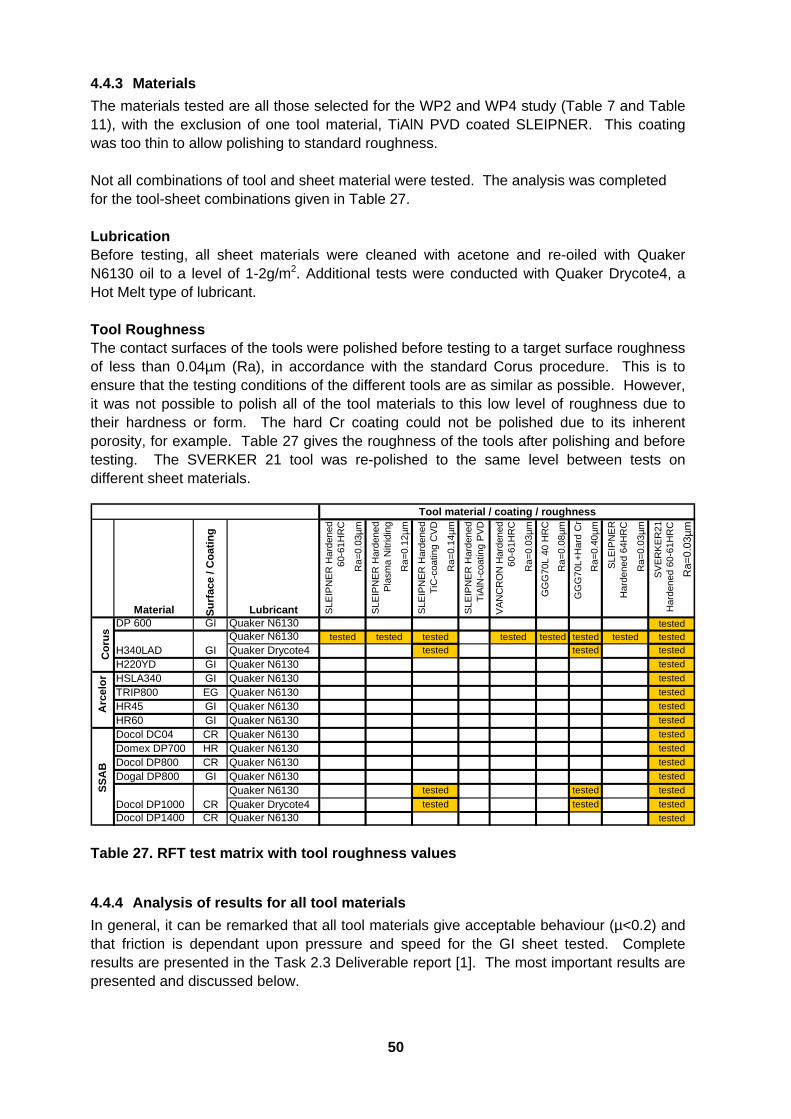
50
4.4.3 Materials
The materials tested are all those selected for the WP2 and WP4 study (Table 7 and Table 11), with the exclusion of one tool material, TiAlN PVD coated SLEIPNER. This coating was too thin to allow polishing to standard roughness. Not all combinations of tool and sheet material were tested. The analysis was completed for the tool-sheet combinations given in Table 27. Lubrication Before testing, all sheet materials were cleaned with acetone and re-oiled with Quaker N6130 oil to a level of 1-2g/m2. Additional tests were conducted with Quaker Drycote4, a Hot Melt type of lubricant. Tool Roughness The contact surfaces of the tools were polished before testing to a target surface roughness of less than 0.04µm (Ra), in accordance with the standard Corus procedure. This is to ensure that the testing conditions of the different tools are as similar as possible. However, it was not possible to polish all of the tool materials to this low level of roughness due to their hardness or form. The hard Cr coating could not be polished due to its inherent porosity, for example. Table 27 gives the roughness of the tools after polishing and before testing. The SVERKER 21 tool was re-polished to the same level between tests on different sheet materials.
Table 27. RFT test matrix with tool roughness values
4.4.4 Analysis of results for all tool materials
In general, it can be remarked that all tool materials give acceptable behaviour (µ<0.2) and that friction is dependant upon pressure and speed for the GI sheet tested. Complete results are presented in the Task 2.3 Deliverable report [1]. The most important results are presented and discussed below.
Material Su
rfac
e / C
oat
ing
Lubricant SLE
IPN
ER
Har
dene
d 60
-61H
RC
Ra=
0.03
µm
SLE
IPN
ER
Har
dene
d P
lasm
a N
itrid
ing
Ra=
0.12
µm
SLE
IPN
ER
Har
dene
d T
iC-c
oatin
g C
VD
Ra=
0.14
µm
SLE
IPN
ER
Har
dene
d T
iAlN
-coa
ting
PV
D
VA
NC
RO
N H
arde
ned
60-6
1HR
C
Ra=
0.03
µm
GG
G70
L 40
HR
C
Ra=
0.08
µm
GG
G70
L+H
ard
Cr
Ra=
0.40
µm
SLE
IPN
ER
H
arde
ned
64H
RC
Ra=
0.03
µm
SV
ER
KE
R21
H
arde
ned
60-6
1HR
C
Ra=
0.03
µm
DP 600 GI Quaker N6130Quaker N6130Quaker Drycote4
H220YD GI Quaker N6130HSLA340 GI Quaker N6130TRIP800 EG Quaker N6130HR45 GI Quaker N6130HR60 GI Quaker N6130Docol DC04 CR Quaker N6130Domex DP700 HR Quaker N6130Docol DP800 CR Quaker N6130Dogal DP800 GI Quaker N6130
Quaker N6130Quaker Drycote4
Docol DP1400 CR Quaker N6130
H340LAD GI
Docol DP1000 CRtested
tested
tested tested tested
tested
tested
tested
tested
tested
S
SA
B
tested
tested
tested
tested
tested
A
rcel
or
tested
tested testedtested
testedtested tested tested tested tested tested tested tested
Tool material / coating / roughness
C
oru
s
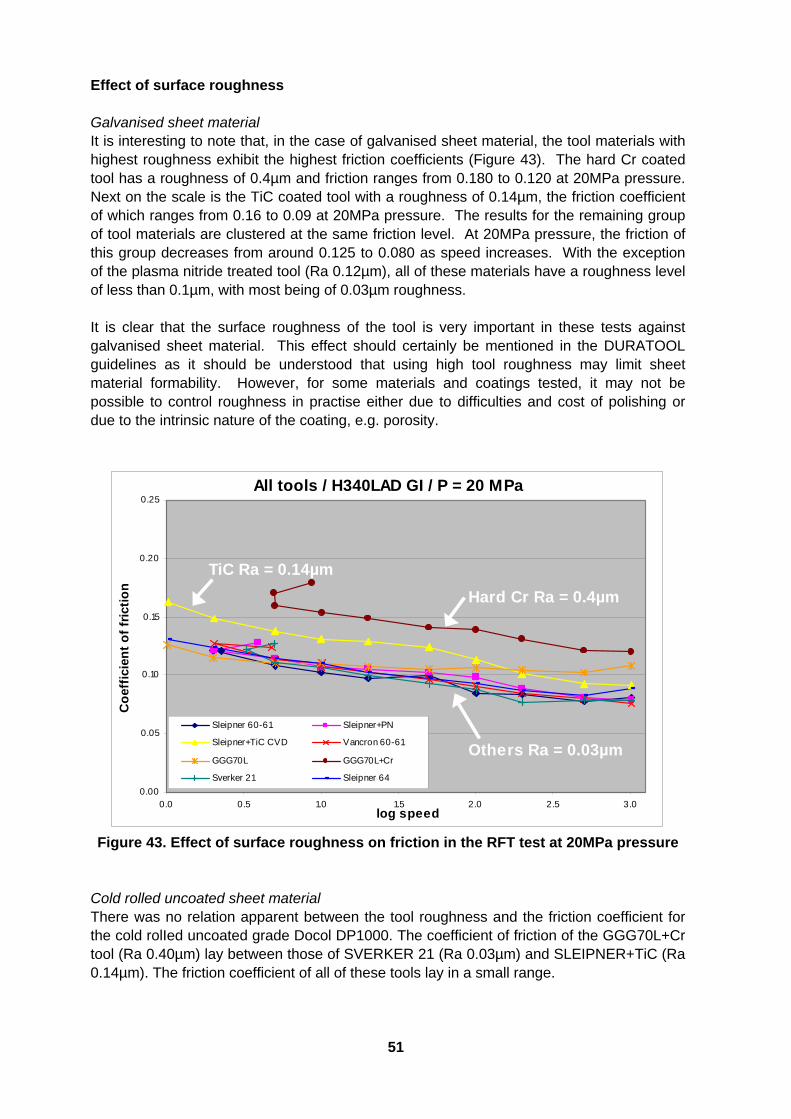
51
Effect of surface roughness Galvanised sheet material It is interesting to note that, in the case of galvanised sheet material, the tool materials with highest roughness exhibit the highest friction coefficients (Figure 43). The hard Cr coated tool has a roughness of 0.4µm and friction ranges from 0.180 to 0.120 at 20MPa pressure. Next on the scale is the TiC coated tool with a roughness of 0.14µm, the friction coefficient of which ranges from 0.16 to 0.09 at 20MPa pressure. The results for the remaining group of tool materials are clustered at the same friction level. At 20MPa pressure, the friction of this group decreases from around 0.125 to 0.080 as speed increases. With the exception of the plasma nitride treated tool (Ra 0.12µm), all of these materials have a roughness level of less than 0.1µm, with most being of 0.03µm roughness. It is clear that the surface roughness of the tool is very important in these tests against galvanised sheet material. This effect should certainly be mentioned in the DURATOOL guidelines as it should be understood that using high tool roughness may limit sheet material formability. However, for some materials and coatings tested, it may not be possible to control roughness in practise either due to difficulties and cost of polishing or due to the intrinsic nature of the coating, e.g. porosity.
All tools / H340LAD GI / P = 20 MPa
0.00
0.05
0.10
0.15
0.20
0.25
0.0 0.5 1.0 1.5 2.0 2.5 3.0log speed
Co
effi
cien
t o
f fr
icti
on
Sleipner 60-61 Sleipner+PN
Sleipner+TiC CVD Vancron 60-61
GGG70L GGG70L+Cr
Sverker 21 Sleipner 64
Hard Cr Ra = 0.4µm
TiC Ra = 0.14µm
Others Ra = 0.03µm
Figure 43. Effect of surface roughness on friction in the RFT test at 20MPa pressure
Cold rolled uncoated sheet material There was no relation apparent between the tool roughness and the friction coefficient for the cold rolIed uncoated grade Docol DP1000. The coefficient of friction of the GGG70L+Cr tool (Ra 0.40µm) lay between those of SVERKER 21 (Ra 0.03µm) and SLEIPNER+TiC (Ra 0.14µm). The friction coefficient of all of these tools lay in a small range.
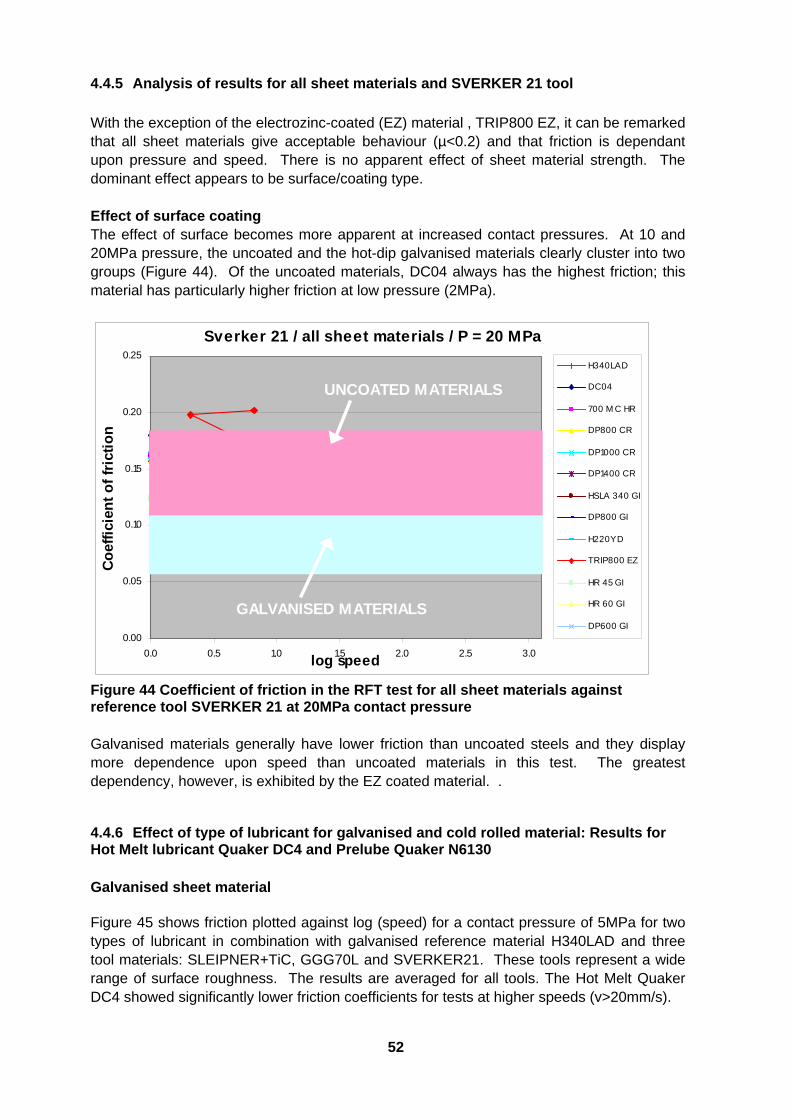
52
4.4.5 Analysis of results for all sheet materials and SVERKER 21 tool
With the exception of the electrozinc-coated (EZ) material , TRIP800 EZ, it can be remarked that all sheet materials give acceptable behaviour (µ<0.2) and that friction is dependant upon pressure and speed. There is no apparent effect of sheet material strength. The dominant effect appears to be surface/coating type. Effect of surface coating The effect of surface becomes more apparent at increased contact pressures. At 10 and 20MPa pressure, the uncoated and the hot-dip galvanised materials clearly cluster into two groups (Figure 44). Of the uncoated materials, DC04 always has the highest friction; this material has particularly higher friction at low pressure (2MPa).
Sverker 21 / all sheet materials / P = 20 MPa
0.00
0.05
0.10
0.15
0.20
0.25
0.0 0.5 1.0 1.5 2.0 2.5 3.0log speed
Co
effi
cien
t o
f fr
icti
on
H340LAD
DC04
700 M C HR
DP800 CR
DP1000 CR
DP1400 CR
HSLA 340 GI
DP800 GI
H220YD
TRIP800 EZ
HR 45 GI
HR 60 GI
DP600 GI
UNCOATED MATERIALS
GALVANISED MATERIALS
Figure 44 Coefficient of friction in the RFT test for all sheet materials against reference tool SVERKER 21 at 20MPa contact pressure Galvanised materials generally have lower friction than uncoated steels and they display more dependence upon speed than uncoated materials in this test. The greatest dependency, however, is exhibited by the EZ coated material. .
4.4.6 Effect of type of lubricant for galvanised and cold rolled material: Results for Hot Melt lubricant Quaker DC4 and Prelube Quaker N6130
Galvanised sheet material Figure 45 shows friction plotted against log (speed) for a contact pressure of 5MPa for two types of lubricant in combination with galvanised reference material H340LAD and three tool materials: SLEIPNER+TiC, GGG70L and SVERKER21. These tools represent a wide range of surface roughness. The results are averaged for all tools. The Hot Melt Quaker DC4 showed significantly lower friction coefficients for tests at higher speeds (v>20mm/s).
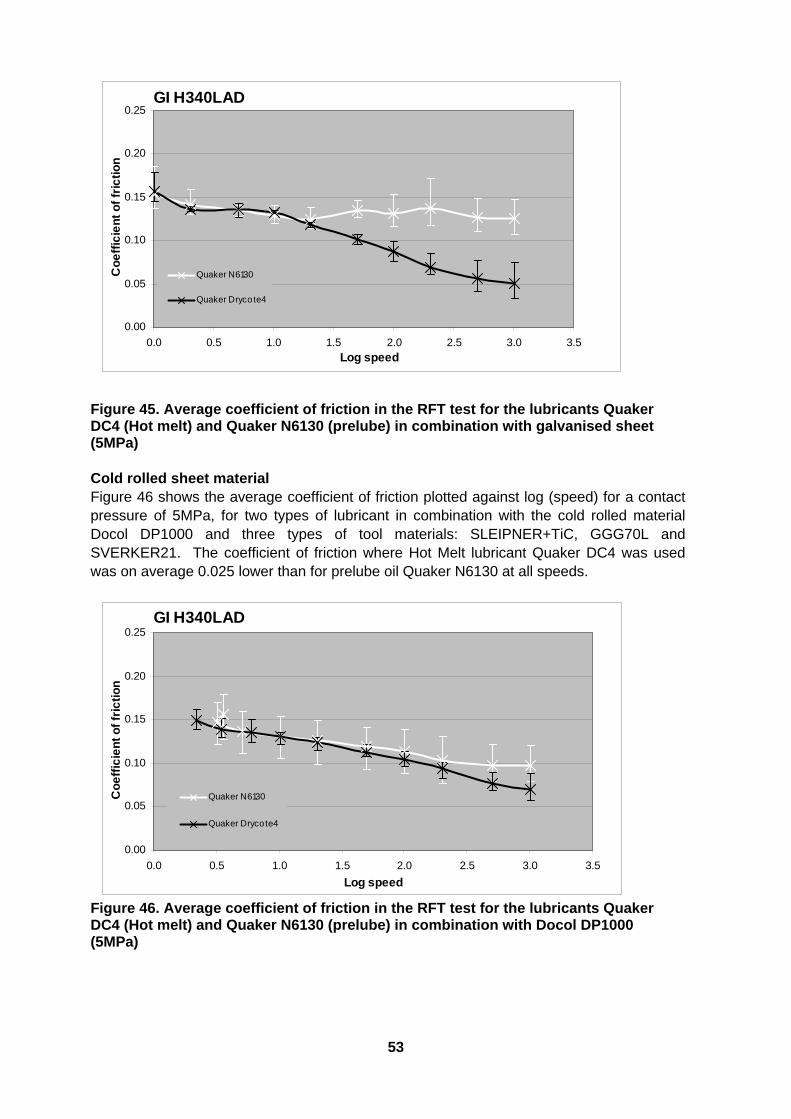
53
GI H340LAD
0.00
0.05
0.10
0.15
0.20
0.25
0.0 0.5 1.0 1.5 2.0 2.5 3.0 3.5Log speed
Co
eff
icie
nt
of
fric
tio
n
Quaker N6130
Quaker Drycote4
Figure 45. Average coefficient of friction in the RFT test for the lubricants Quaker DC4 (Hot melt) and Quaker N6130 (prelube) in combination with galvanised sheet (5MPa) Cold rolled sheet material Figure 46 shows the average coefficient of friction plotted against log (speed) for a contact pressure of 5MPa, for two types of lubricant in combination with the cold rolled material Docol DP1000 and three types of tool materials: SLEIPNER+TiC, GGG70L and SVERKER21. The coefficient of friction where Hot Melt lubricant Quaker DC4 was used was on average 0.025 lower than for prelube oil Quaker N6130 at all speeds.
GI H340LAD
0.00
0.05
0.10
0.15
0.20
0.25
0.0 0.5 1.0 1.5 2.0 2.5 3.0 3.5
Log speed
Co
eff
icie
nt
of
fric
tio
n
Quaker N6130
Quaker Drycote4
Figure 46. Average coefficient of friction in the RFT test for the lubricants Quaker DC4 (Hot melt) and Quaker N6130 (prelube) in combination with Docol DP1000 (5MPa)

54
4.4.7 Summary of RFT conclusions
All tools tested perform in an acceptable friction range for press forming Reducing tool surface roughness reduces friction for galvanised materials All sheet materials perform in the expected friction range when tested against
SVERKER 21 Galvanised materials exhibited lower friction than uncoated materials against SVERKER
21 The Hot Melt lubricant Quaker DC4 in combination with cold rolled material Docol
DP1000 gives a significant lower coefficient of friction than the prelube Quaker N6130
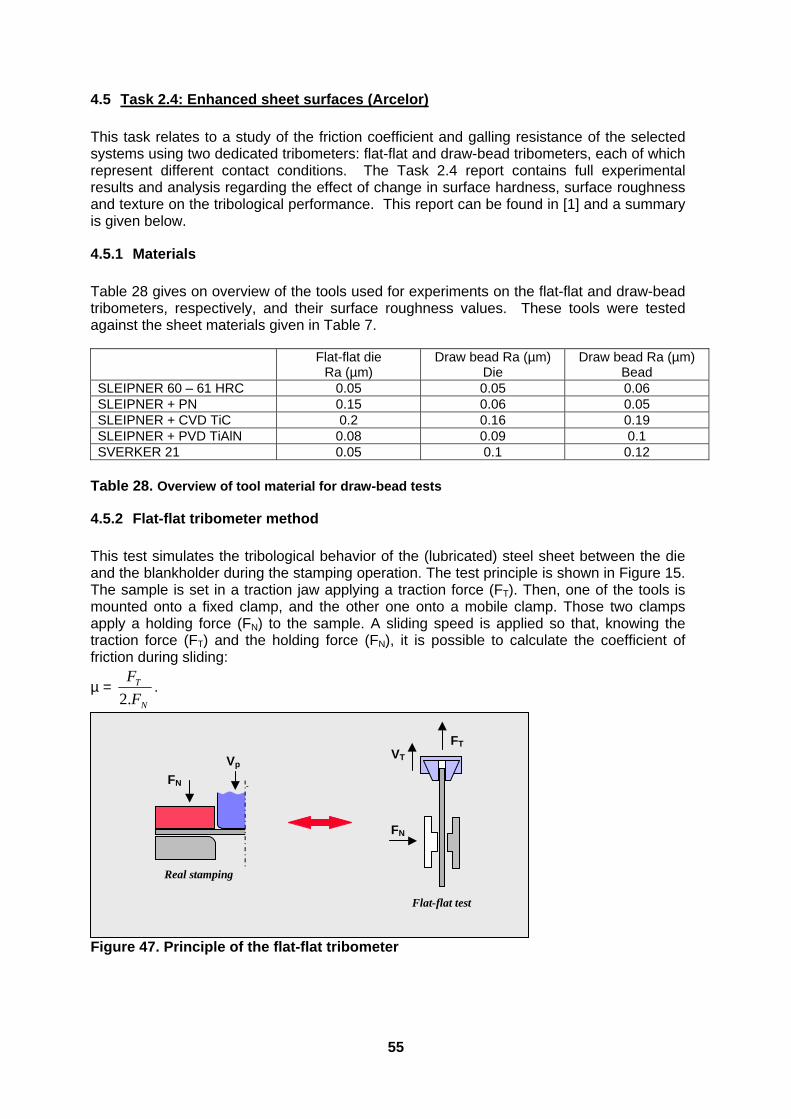
55
4.5 Task 2.4: Enhanced sheet surfaces (Arcelor)
This task relates to a study of the friction coefficient and galling resistance of the selected systems using two dedicated tribometers: flat-flat and draw-bead tribometers, each of which represent different contact conditions. The Task 2.4 report contains full experimental results and analysis regarding the effect of change in surface hardness, surface roughness and texture on the tribological performance. This report can be found in [1] and a summary is given below.
4.5.1 Materials
Table 28 gives on overview of the tools used for experiments on the flat-flat and draw-bead tribometers, respectively, and their surface roughness values. These tools were tested against the sheet materials given in Table 7. Flat-flat die
Ra (µm) Draw bead Ra (µm)
Die Draw bead Ra (µm)
Bead SLEIPNER 60 – 61 HRC 0.05 0.05 0.06 SLEIPNER + PN 0.15 0.06 0.05 SLEIPNER + CVD TiC 0.2 0.16 0.19 SLEIPNER + PVD TiAlN 0.08 0.09 0.1 SVERKER 21 0.05 0.1 0.12
Table 28. Overview of tool material for draw-bead tests
4.5.2 Flat-flat tribometer method
This test simulates the tribological behavior of the (lubricated) steel sheet between the die and the blankholder during the stamping operation. The test principle is shown in Figure 15. The sample is set in a traction jaw applying a traction force (FT). Then, one of the tools is mounted onto a fixed clamp, and the other one onto a mobile clamp. Those two clamps apply a holding force (FN) to the sample. A sliding speed is applied so that, knowing the traction force (FT) and the holding force (FN), it is possible to calculate the coefficient of friction during sliding:
µ = N
T
F
F
.2.
FN
Vp
FN
VT FT
Real stamping
Flat-flat test
Figure 47. Principle of the flat-flat tribometer

56
4.5.3 Draw-bead test
The draw-bead test apparatus is very similar to that of the flat-flat test. Only the tools change, as shown in Figure 48. The apparatus and the principles of both tests are quite similar, but the loading levels are very different. It is much more severe in the draw-bead test. The initial aim of the draw-bead test is to study the powdering (coating loss) by measuring the mass loss of the sample. Indeed, the sample coating can be affected by the friction against the tool and by bending and unbending when going trough the draw-bead. It is also possible to assess the behaviour of a steel grade in a draw-bead in terms of both friction and bending-unbending force.
FN
FT
VT
Stamping with draw-bead
Punch
Die
FN Vp
Blankholder
Draw-bead test
Figure 48. Principle of the draw-bead tribometer
4.5.4 Flat-flat tribometer results
Figure 49 shows a typical example of the results, this figure shows those for the SVERKER 21 tool. The curves are grouped by sheet type and smoothed for easier understanding. Table 29 gives the average friction coefficient for each tool/sheet combination tested.
Figure 49. Friction coefficient vs. Pressure curves for all 13 sheet materials tested with the Uncoated SVERKER 21 (tool roughness Ra~ 0,05µm) in flat-flat test

57
Grade Coating Sverker SpleinerSpleiner
PNSpleiner
TiAlNSpleiner
TiC
DOMEX 700 Bare 0.13 0.13 0.13 0.14 0.16
DC04 Bare 0.14 0.14 0.15 0.16 0.13
DP800 Bare 0.13 0.13 0.14 0.14 0.15
DP1000 Bare 0.13 0.14 0.14 0.14 0.15
DP1400 Bare 0.13 0.13 0.13 0.13 0.13
TRIP800 EZ 0.18 0.16 0.23 0.15 0.23
DP800Dogal GI 0.11 0.10 0.13 0.12 0.18
HSLA340(C) GI 0.13 0.12 0.16 0.12 0.18
H220YD GI 0.12 0.12 0.16 0.11 0.17
DP600 GI 0.13 0.12 0.16 0.12 0.17
HSLA340(A) GI 0.11 0.11 0.14 0.12 0.21
HR45 GI 0.09 0.10 0.13 0.10 0.19
HR60 GI 0.11 0.11 0.13 0.10 0.19 Table 29. Average friction coefficient in the flat-flat test Summary of results for uncoated steel sheet products The friction coefficient of the uncoated steels is always relatively constant whatever the tool material and the pressure value. It is always about 0.15, and the values are quite gathered (scattering is small). It is the reason why surface parameters were not shown to have a real influence on friction behaviour (see below). Summary of the results for GI coated products The mean friction coefficient values of the GI-coated sheets are more scattered, even for a given tool material. It varies with the sheet material; the tool material and the contact pressure. However, it seems that it is not the tool material that is influencing the friction coefficient but more the tool roughness. Indeed, it seems that the friction coefficient of GI-coated sheets increases with an increasing roughness. The following graph (Figure 50) shows that the correlation is remarkable: it shows the evolution of the friction coefficient with the Ra-value of the tool for different pressure values (each point is an average and the stick-slip is excluded).
Figure 50. Influence of the tool roughness on the friction coefficient on GI-coated sheet
0
0.05
0.1
0.15
0.2
0.25
0 0.05 0.1 0.15 0.2 0.25
Ra value (tool)
Fri
ctio
n c
oef
fici
ent
µ (P=20MPa)
µ (P=40MPa)
µ (P=60MPa)
µ (P=80MPa)
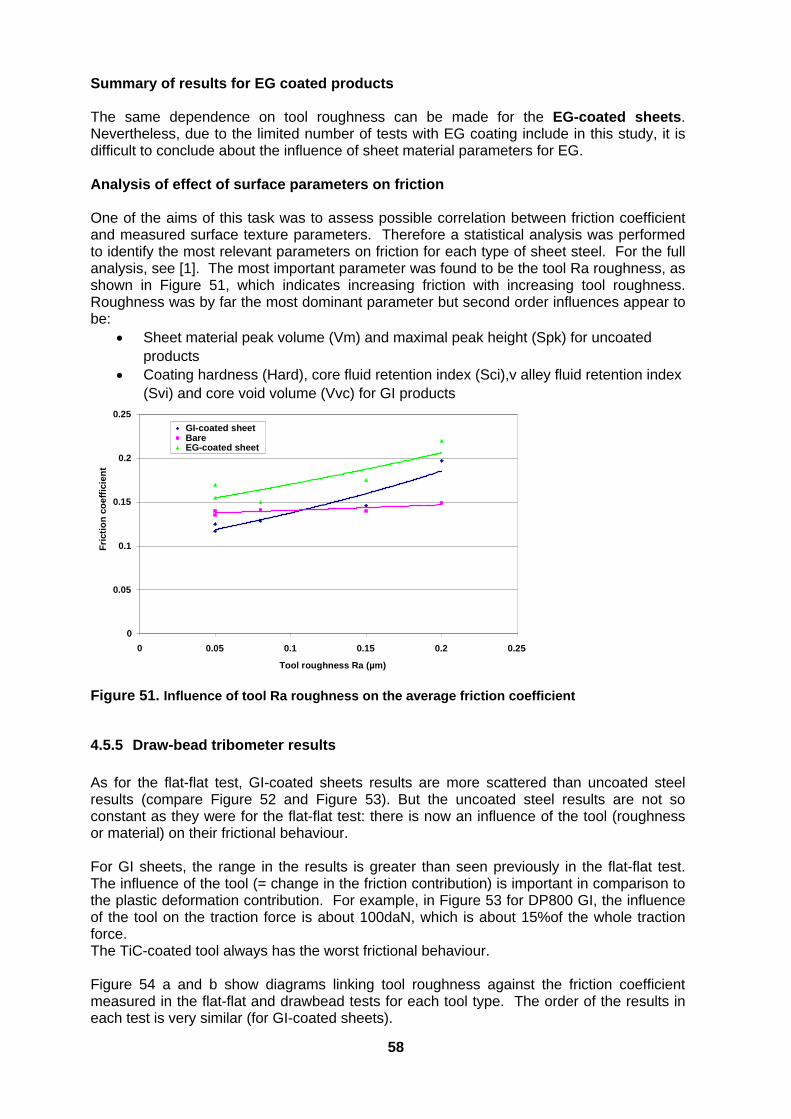
58
Summary of results for EG coated products The same dependence on tool roughness can be made for the EG-coated sheets. Nevertheless, due to the limited number of tests with EG coating include in this study, it is difficult to conclude about the influence of sheet material parameters for EG. Analysis of effect of surface parameters on friction One of the aims of this task was to assess possible correlation between friction coefficient and measured surface texture parameters. Therefore a statistical analysis was performed to identify the most relevant parameters on friction for each type of sheet steel. For the full analysis, see [1]. The most important parameter was found to be the tool Ra roughness, as shown in Figure 51, which indicates increasing friction with increasing tool roughness. Roughness was by far the most dominant parameter but second order influences appear to be:
Sheet material peak volume (Vm) and maximal peak height (Spk) for uncoated products
Coating hardness (Hard), core fluid retention index (Sci),v alley fluid retention index (Svi) and core void volume (Vvc) for GI products
0
0.05
0.1
0.15
0.2
0.25
0 0.05 0.1 0.15 0.2 0.25
Tool roughness Ra (µm)
Fri
ctio
n c
oef
fici
ent
GI-coated sheet Bare EG-coated sheet
Figure 51. Influence of tool Ra roughness on the average friction coefficient
4.5.5 Draw-bead tribometer results
As for the flat-flat test, GI-coated sheets results are more scattered than uncoated steel results (compare Figure 52 and Figure 53). But the uncoated steel results are not so constant as they were for the flat-flat test: there is now an influence of the tool (roughness or material) on their frictional behaviour. For GI sheets, the range in the results is greater than seen previously in the flat-flat test. The influence of the tool (= change in the friction contribution) is important in comparison to the plastic deformation contribution. For example, in Figure 53 for DP800 GI, the influence of the tool on the traction force is about 100daN, which is about 15%of the whole traction force. The TiC-coated tool always has the worst frictional behaviour. Figure 54 a and b show diagrams linking tool roughness against the friction coefficient measured in the flat-flat and drawbead tests for each tool type. The order of the results in each test is very similar (for GI-coated sheets).
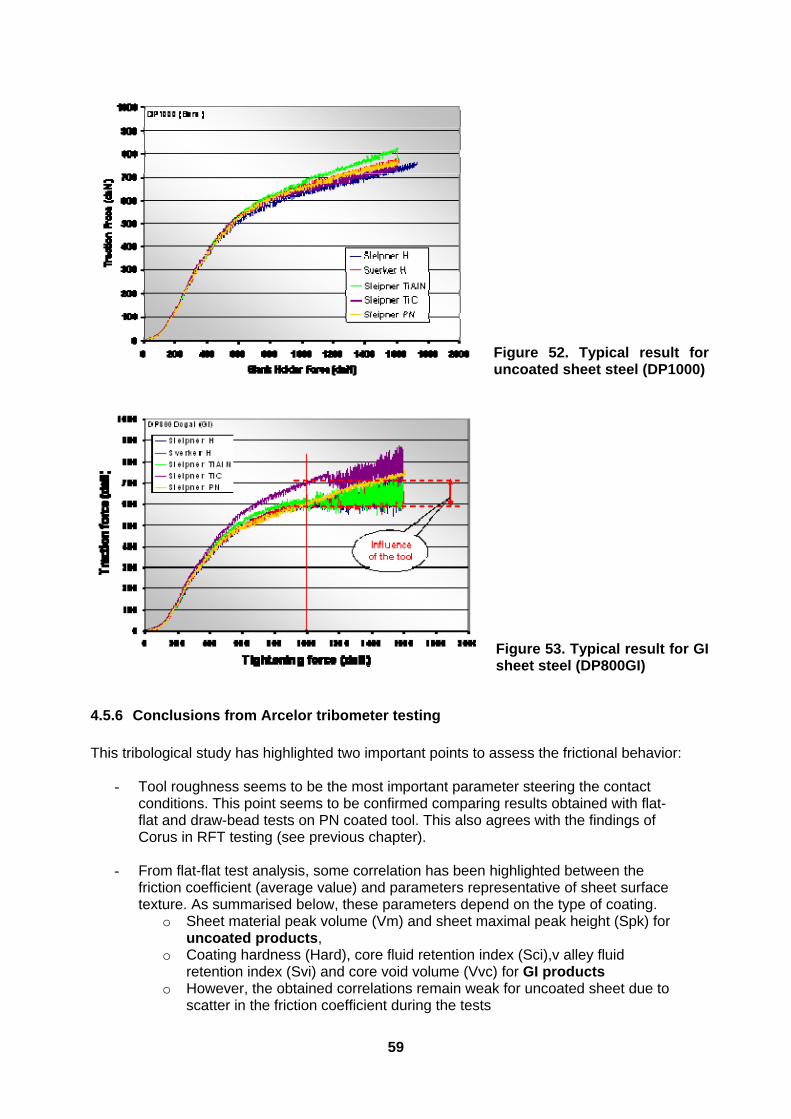
59
Figure 52. Typical result for uncoated sheet steel (DP1000)
Figure 53. Typical result for GI sheet steel (DP800GI)
4.5.6 Conclusions from Arcelor tribometer testing
This tribological study has highlighted two important points to assess the frictional behavior:
- Tool roughness seems to be the most important parameter steering the contact conditions. This point seems to be confirmed comparing results obtained with flat-flat and draw-bead tests on PN coated tool. This also agrees with the findings of Corus in RFT testing (see previous chapter).
- From flat-flat test analysis, some correlation has been highlighted between the
friction coefficient (average value) and parameters representative of sheet surface texture. As summarised below, these parameters depend on the type of coating.
o Sheet material peak volume (Vm) and sheet maximal peak height (Spk) for uncoated products,
o Coating hardness (Hard), core fluid retention index (Sci),v alley fluid retention index (Svi) and core void volume (Vvc) for GI products
o However, the obtained correlations remain weak for uncoated sheet due to scatter in the friction coefficient during the tests
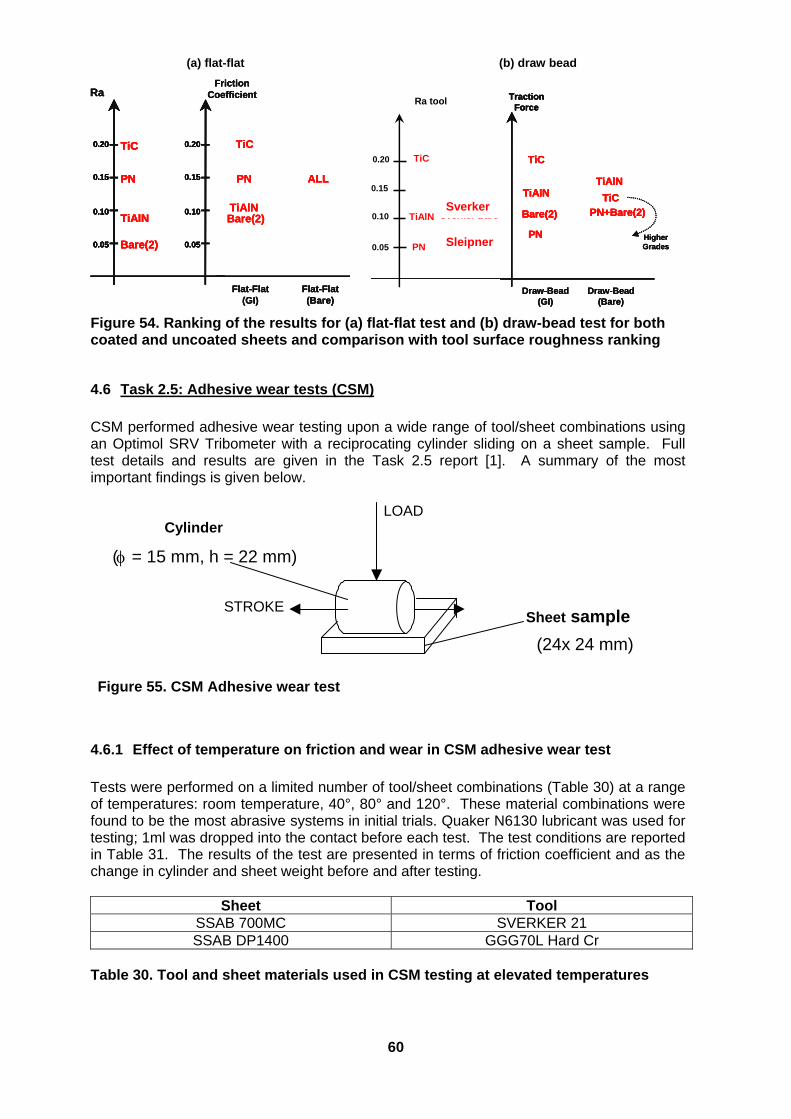
60
Ra
Bare(2)0.05
0.15
0.10
0.20
TiAlN
PN
TiC
FrictionCoefficient
0.05
0.15
0.10
0.20
Flat-Flat(GI)
Flat-Flat(Bare)
Bare(2)TiAlN
PN
TiC
ALL
Ra
Bare(2)0.05
0.15
0.10
0.20
TiAlN
PN
TiC
Ra
Bare(2)0.05
0.15
0.10
0.20
TiAlN
PN
TiC
Bare(2)0.05
0.15
0.10
0.20
0.05
0.15
0.10
0.20
TiAlN
PN
TiC
FrictionCoefficient
0.05
0.15
0.10
0.20
Flat-Flat(GI)
Flat-Flat(Bare)
Bare(2)TiAlN
PN
TiC
ALL
FrictionCoefficient
0.05
0.15
0.10
0.20
0.05
0.15
0.10
0.20
Flat-Flat(GI)
Flat-Flat(Bare)
Bare(2)TiAlN
PN
TiC
ALL
HigherGrades
oncient
lat-Flat(GI)
Flat-Flat(Bare)
are(2)AlN
PN
TiC
ALL
Draw-Bead(Bare)
Draw-Bead(GI)
Bare(2)
TiAlN
PN
TiC
TiAlN
PN+Bare(2)
TiC
TractionForce
HigherGradesHigherGrades
oncient
lat-Flat(GI)
Flat-Flat(Bare)
are(2)AlN
PN
TiC
ALL
oncient
lat-Flat(GI)
Flat-Flat(Bare)
are(2)AlN
PN
TiC
ALL
Draw-Bead(Bare)
Draw-Bead(GI)
Bare(2)
TiAlN
PN
TiC
TiAlN
PN+Bare(2)
TiC
TractionForce
Draw-Bead(Bare)
Draw-Bead(GI)
Bare(2)
TiAlN
PN
TiC
TiAlN
PN+Bare(2)
TiC
TractionForce
Bare(2)
TiAlN
PN
TiC
TiAlN
PN+Bare(2)
TiC
TractionForce
Ra tool
0.05
0.10
0.15
0.20
PN Spleiner Bare
Sverker Bare TiAlN
TiC
Figure 54. Ranking of the results for (a) flat-flat test and (b) draw-bead test for both coated and uncoated sheets and comparison with tool surface roughness ranking
4.6 Task 2.5: Adhesive wear tests (CSM)
CSM performed adhesive wear testing upon a wide range of tool/sheet combinations using an Optimol SRV Tribometer with a reciprocating cylinder sliding on a sheet sample. Full test details and results are given in the Task 2.5 report [1]. A summary of the most important findings is given below.
Figure 55. CSM Adhesive wear test
4.6.1 Effect of temperature on friction and wear in CSM adhesive wear test
Tests were performed on a limited number of tool/sheet combinations (Table 30) at a range of temperatures: room temperature, 40°, 80° and 120°. These material combinations were found to be the most abrasive systems in initial trials. Quaker N6130 lubricant was used for testing; 1ml was dropped into the contact before each test. The test conditions are reported in Table 31. The results of the test are presented in terms of friction coefficient and as the change in cylinder and sheet weight before and after testing.
Sheet Tool SSAB 700MC SVERKER 21 SSAB DP1400 GGG70L Hard Cr
Table 30. Tool and sheet materials used in CSM testing at elevated temperatures
Sheet sample
(24x 24 mm)
Cylinder
( = 15 mm, h = 22 mm)
STROKE
LOAD
Sleipner
Sverker
(a) flat-flat (b) draw bead
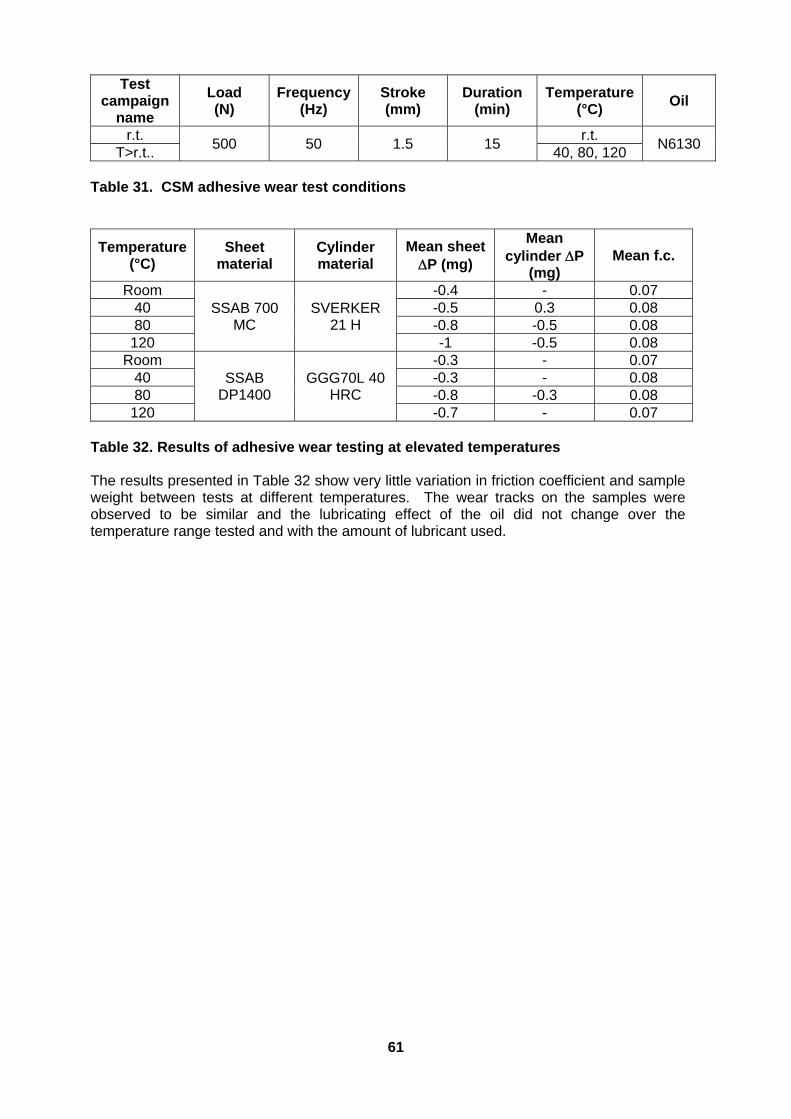
61
Test campaign
name
Load (N)
Frequency(Hz)
Stroke (mm)
Duration (min)
Temperature (°C)
Oil
r.t. 500 50 1.5 15
r.t. N6130
T>r.t.. 40, 80, 120 Table 31. CSM adhesive wear test conditions
Temperature (°C)
Sheet material
Cylinder material
Mean sheet P (mg)
Mean cylinder P
(mg) Mean f.c.
Room SSAB 700
MC SVERKER
21 H
-0.4 - 0.07 40 -0.5 0.3 0.08 80 -0.8 -0.5 0.08 120 -1 -0.5 0.08
Room SSAB
DP1400 GGG70L 40
HRC
-0.3 - 0.07 40 -0.3 - 0.08 80 -0.8 -0.3 0.08 120 -0.7 - 0.07
Table 32. Results of adhesive wear testing at elevated temperatures The results presented in Table 32 show very little variation in friction coefficient and sample weight between tests at different temperatures. The wear tracks on the samples were observed to be similar and the lubricating effect of the oil did not change over the temperature range tested and with the amount of lubricant used.
62
4.7 Task 2.6: Overall analysis of WP2 results
The application of HSS has been shown in FE studies to lead to higher forces, pressures and mechanical loading conditions (Task 2.1). This places increasing demands on tool materials, particularly in terms of their durability and wear performance.
4.7.1 Tool wear
Both the TNO PLOT test and the KIMAB BUT test investigated the abrasive wear and galling (adhesive wear) characteristics of the tool and sheet materials included in the DURATOOL study. The TNO PLOT testing covered a more comprehensive matrix of materials, although, in general the findings are supported by the more complex KIMAB BUT test results with a limited testing matrix. In both studies, the coated tool materials perform the best, with few signs of galling or wear while the conventional materials peformed less well with uncoated cast iron the poorest performer, particularly as sheet strength levels increased. The performance of the advanced cast steel and powder metallurgy grades fell in the middle of the range. Acceptable wear levels Based on the PLOT results for a conventional tool system (SVERKER 21 / uncoated DC04), a wear rate, k, of 10-8 mm3/Nm should correspond with an acceptable abrasive wear regime in practise. Triboloigical rule-of-thumb states that 10-6 mm3/Nm is a maximum tolerable wear rate. Effect of sheet strength on wear level It was found that sheet materials of tensile strengths up to 800MPa can perform well with conventional tool materials but that more advanced materials need to be considered for sheet materials stronger than this to improve wear performance to acceptable levels. Figure 27 shows clearly the effect of increasing dual phase steel strength upon abrasive wear rate, with results for DP1400 and conventional tool materials reaching well into the critical range. The performance of the coated tools was excellent in the TNO test; the wear levels were too low to measure and so are not indicated on Figure 27. The KIMAB bending-under-tension (BUT) test, however, was able to distinguish between the performance of the coated tools. TiC and TiAlN performed the best but there was evidence of local failure of Cr-plated coatings when tested with DP1400. Effect of sheet type on wear mechanism Adhesive wear (galling) is dominant for zinc coated steels. For uncoated steels, both adhesive wear and abrasive wear may be observed, as found in the BUT test. In such cases, adhesive wear, leading to galling/scratches on the part may give immediate production problems, whereas abrasive wear is a more long term problem that will inevitably reduce tool lifetime due to the change in tool geometry that this causes.
4.7.2 Effect of tool (roughness) and sheet on friction
The results of Corus and Arcelor testing show the importance of tool surface roughness on friction levels. This appears to be the dominating parameter and increasing Ra roughness leads directly to increased friction, particularly for galvanised steels. The type of tool material in the contact appears to be a minor factor, friction was not affected by the tool material type unless galling occurred. Friction levels are, however, influenced by the sheet material type. Where galling does not occur, friction is lower for galvanised steels than for uncoated steels.
4.7.3 Lubrication
The KIMAB results for DP1400 show the importance of homogenous lubrication in forming AHSS. Dry spots can lead to critical levels of wear that could otherwise be avoided. The
63
study did show, however, that coated tools (e.g. TiAlN and TiC) are still able to offer resistance to wear under poorly lubricated conditions. The Corus RFT test demonstrated the ability of dryfilm lubricant to lower friction levels to below those observed for conventional mill-applied oil. Use of dryfilm lubrication could help to improve formability for critical parts operating close to forming limits, particularly for uncoated (A)HSS materials, for which the friction was both low and very stable.Temperatures up to 120° did not affect oil and thus friction/wear in the CSM adhesive wear test.

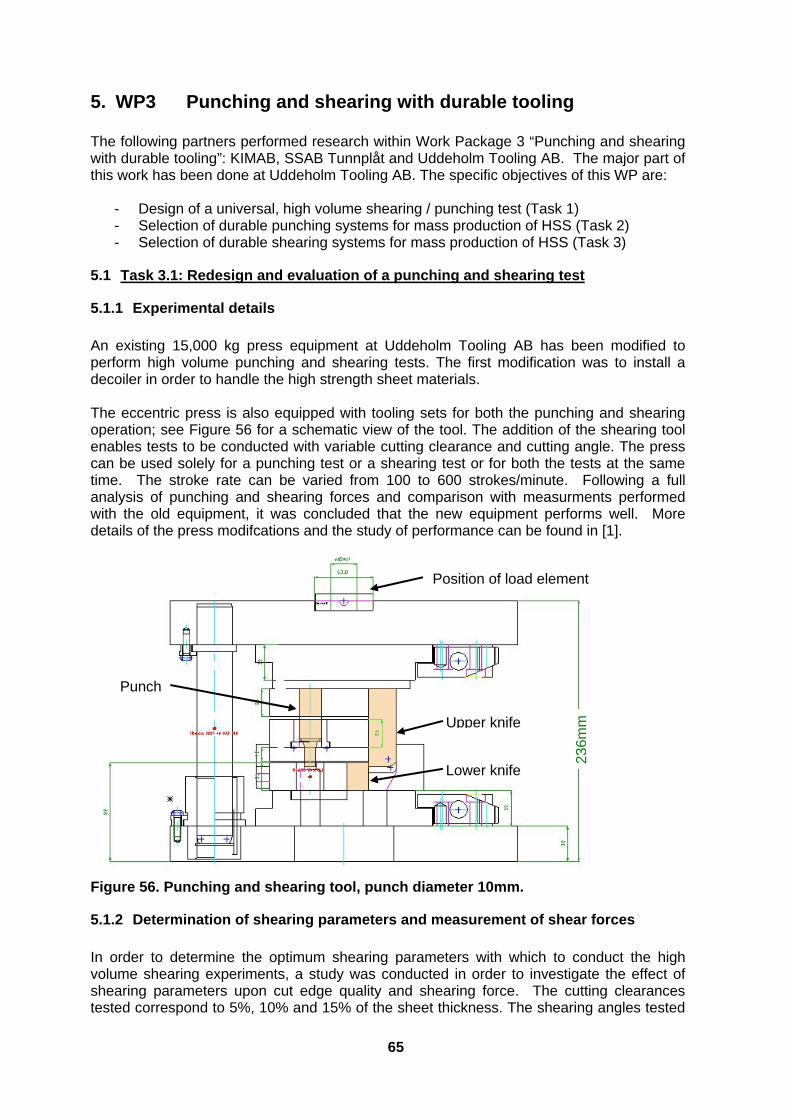
65
5. WP3 Punching and shearing with durable tooling The following partners performed research within Work Package 3 “Punching and shearing with durable tooling”: KIMAB, SSAB Tunnplåt and Uddeholm Tooling AB. The major part of this work has been done at Uddeholm Tooling AB. The specific objectives of this WP are:
- Design of a universal, high volume shearing / punching test (Task 1) - Selection of durable punching systems for mass production of HSS (Task 2) - Selection of durable shearing systems for mass production of HSS (Task 3)
5.1 Task 3.1: Redesign and evaluation of a punching and shearing test
5.1.1 Experimental details
An existing 15,000 kg press equipment at Uddeholm Tooling AB has been modified to perform high volume punching and shearing tests. The first modification was to install a decoiler in order to handle the high strength sheet materials. The eccentric press is also equipped with tooling sets for both the punching and shearing operation; see Figure 56 for a schematic view of the tool. The addition of the shearing tool enables tests to be conducted with variable cutting clearance and cutting angle. The press can be used solely for a punching test or a shearing test or for both the tests at the same time. The stroke rate can be varied from 100 to 600 strokes/minute. Following a full analysis of punching and shearing forces and comparison with measurments performed with the old equipment, it was concluded that the new equipment performs well. More details of the press modifcations and the study of performance can be found in [1].
Figure 56. Punching and shearing tool, punch diameter 10mm.
5.1.2 Determination of shearing parameters and measurement of shear forces
In order to determine the optimum shearing parameters with which to conduct the high volume shearing experiments, a study was conducted in order to investigate the effect of shearing parameters upon cut edge quality and shearing force. The cutting clearances tested correspond to 5%, 10% and 15% of the sheet thickness. The shearing angles tested
Position of load element
Upper knife
Lower knife
Punch
236m
m
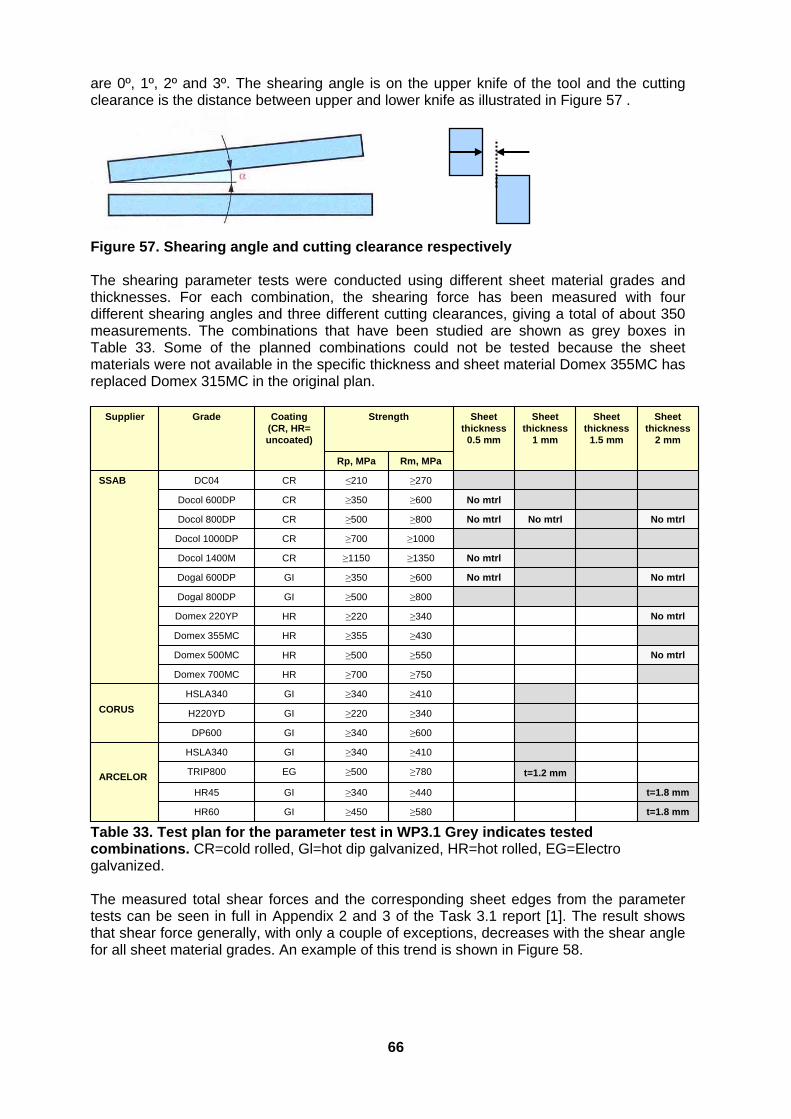
66
are 0º, 1º, 2º and 3º. The shearing angle is on the upper knife of the tool and the cutting clearance is the distance between upper and lower knife as illustrated in Figure 57 .
Figure 57. Shearing angle and cutting clearance respectively The shearing parameter tests were conducted using different sheet material grades and thicknesses. For each combination, the shearing force has been measured with four different shearing angles and three different cutting clearances, giving a total of about 350 measurements. The combinations that have been studied are shown as grey boxes in Table 33. Some of the planned combinations could not be tested because the sheet materials were not available in the specific thickness and sheet material Domex 355MC has replaced Domex 315MC in the original plan.
Rm, MPaRp, MPa
≥450
≥340
≥500
≥340
≥340
≥220
≥340
≥700
≥500
≥355
≥220
≥500
≥350
≥1150
≥700
≥500
≥350
≤210
Strength
GI
GI
EG
GI
GI
GI
GI
HR
HR
HR
HR
GI
GI
CR
CR
CR
CR
CR
Coating(CR, HR=uncoated)
t=1.8 mm≥580HR60
t=1.8 mm≥440HR45
t=1.2 mm≥780TRIP800
≥410HSLA340
ARCELOR
≥600DP600
≥340H220YD
≥410HSLA340
CORUS
≥750Domex 700MC
No mtrl≥550Domex 500MC
≥430Domex 355MC
No mtrl≥340Domex 220YP
≥800Dogal 800DP
No mtrlNo mtrl≥600Dogal 600DP
No mtrl≥1350Docol 1400M
≥1000Docol 1000DP
No mtrlNo mtrlNo mtrl≥800Docol 800DP
No mtrl≥600Docol 600DP
≥270DC04SSAB
Sheet thickness
2 mm
Sheet thickness
1.5 mm
Sheet thickness
1 mm
Sheet thickness
0.5 mm
GradeSupplier
Table 33. Test plan for the parameter test in WP3.1 Grey indicates tested combinations. CR=cold rolled, Gl=hot dip galvanized, HR=hot rolled, EG=Electro galvanized. The measured total shear forces and the corresponding sheet edges from the parameter tests can be seen in full in Appendix 2 and 3 of the Task 3.1 report [1]. The result shows that shear force generally, with only a couple of exceptions, decreases with the shear angle for all sheet material grades. An example of this trend is shown in Figure 58.
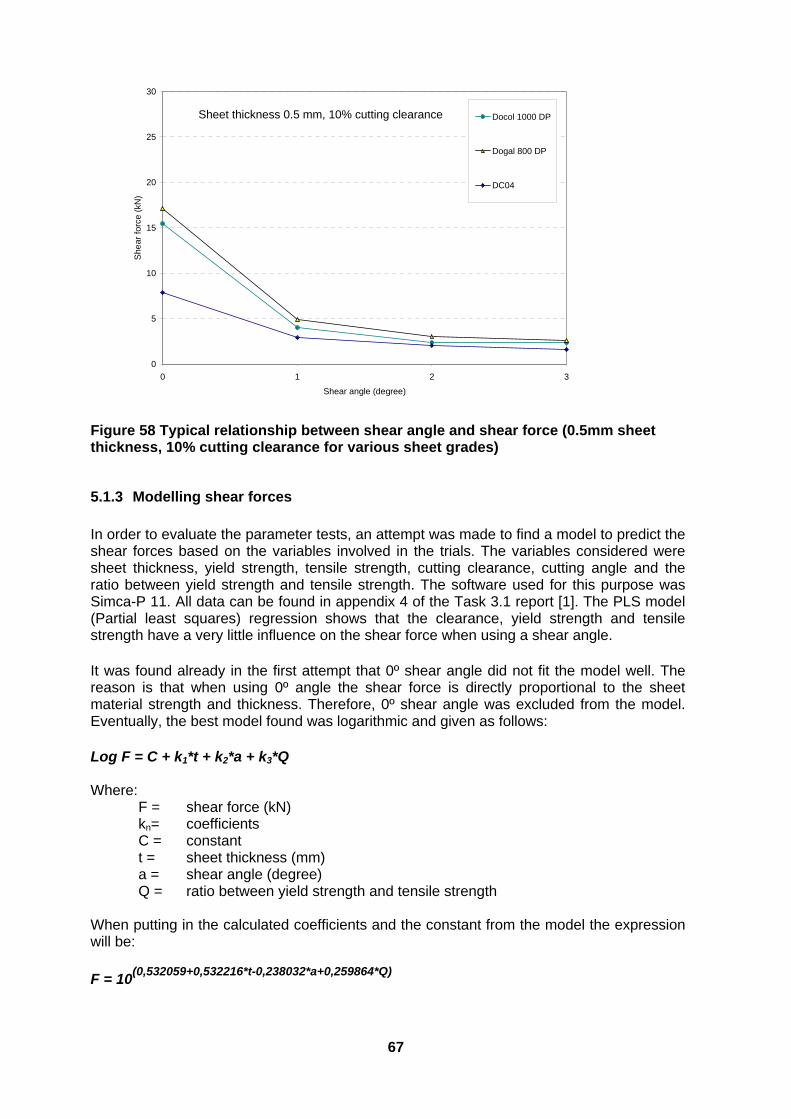
67
0
5
10
15
20
25
30
0 1 2 3
Shear angle (degree)
She
ar f
orce
(kN
)
Docol 1000 DP
Dogal 800 DP
DC04
Sheet thickness 0.5 mm, 10% cutting clearance
Figure 58 Typical relationship between shear angle and shear force (0.5mm sheet thickness, 10% cutting clearance for various sheet grades)
5.1.3 Modelling shear forces
In order to evaluate the parameter tests, an attempt was made to find a model to predict the shear forces based on the variables involved in the trials. The variables considered were sheet thickness, yield strength, tensile strength, cutting clearance, cutting angle and the ratio between yield strength and tensile strength. The software used for this purpose was Simca-P 11. All data can be found in appendix 4 of the Task 3.1 report [1]. The PLS model (Partial least squares) regression shows that the clearance, yield strength and tensile strength have a very little influence on the shear force when using a shear angle.
It was found already in the first attempt that 0º shear angle did not fit the model well. The reason is that when using 0º angle the shear force is directly proportional to the sheet material strength and thickness. Therefore, 0º shear angle was excluded from the model. Eventually, the best model found was logarithmic and given as follows:
Log F = C + k1*t + k2*a + k3*Q Where: F = shear force (kN)
kn= coefficients C = constant t = sheet thickness (mm) a = shear angle (degree) Q = ratio between yield strength and tensile strength When putting in the calculated coefficients and the constant from the model the expression will be:
F = 10(0,532059+0,532216*t-0,238032*a+0,259864*Q)
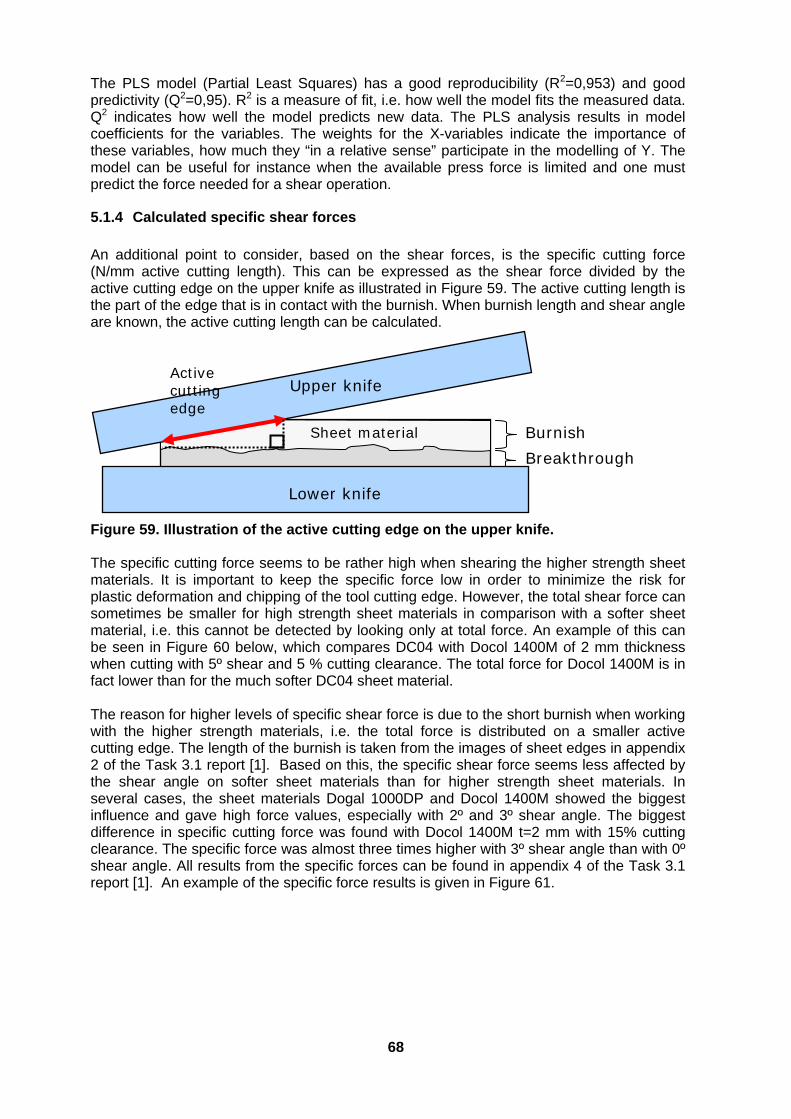
68
The PLS model (Partial Least Squares) has a good reproducibility (R2=0,953) and good predictivity (Q2=0,95). R2 is a measure of fit, i.e. how well the model fits the measured data. Q2 indicates how well the model predicts new data. The PLS analysis results in model coefficients for the variables. The weights for the X-variables indicate the importance of these variables, how much they “in a relative sense” participate in the modelling of Y. The model can be useful for instance when the available press force is limited and one must predict the force needed for a shear operation.
5.1.4 Calculated specific shear forces
An additional point to consider, based on the shear forces, is the specific cutting force (N/mm active cutting length). This can be expressed as the shear force divided by the active cutting edge on the upper knife as illustrated in Figure 59. The active cutting length is the part of the edge that is in contact with the burnish. When burnish length and shear angle are known, the active cutting length can be calculated.
Figure 59. Illustration of the active cutting edge on the upper knife. The specific cutting force seems to be rather high when shearing the higher strength sheet materials. It is important to keep the specific force low in order to minimize the risk for plastic deformation and chipping of the tool cutting edge. However, the total shear force can sometimes be smaller for high strength sheet materials in comparison with a softer sheet material, i.e. this cannot be detected by looking only at total force. An example of this can be seen in Figure 60 below, which compares DC04 with Docol 1400M of 2 mm thickness when cutting with 5º shear and 5 % cutting clearance. The total force for Docol 1400M is in fact lower than for the much softer DC04 sheet material. The reason for higher levels of specific shear force is due to the short burnish when working with the higher strength materials, i.e. the total force is distributed on a smaller active cutting edge. The length of the burnish is taken from the images of sheet edges in appendix 2 of the Task 3.1 report [1]. Based on this, the specific shear force seems less affected by the shear angle on softer sheet materials than for higher strength sheet materials. In several cases, the sheet materials Dogal 1000DP and Docol 1400M showed the biggest influence and gave high force values, especially with 2º and 3º shear angle. The biggest difference in specific cutting force was found with Docol 1400M t=2 mm with 15% cutting clearance. The specific force was almost three times higher with 3º shear angle than with 0º shear angle. All results from the specific forces can be found in appendix 4 of the Task 3.1 report [1]. An example of the specific force results is given in Figure 61.
Burnish Breakthrough
Lower knife
Upper knife Active cutting edge
Sheet material

69
Figure 60. Shear forces when working with DC04 and Docol 1400M respectively, thickness 2 mm and 5% cutting clearance.
100
300
500
700
900
1100
1300
1500
1700
0 1 2 3
Shear angle (degree)
Sp
ecif
ic f
orc
e (N
/mm
)
Docol 1400 M
Docol 1000 DP
TRIP 800
Docol 800 DP
Dogal 800 DP
Docol 600 DP
Dogal 600 DP
DP 600
HSLA 340
H340
H220 YD
DC04
5% cutting clearance, thickness 1 mm
Figure 61. Example of change in specific force with shear angle for a range of steels (5% clearance, 1mm thickness)
Shear force (N)
Tool displacement (mm)
Docol 1400M36 kN
Shear force (N)
Tool displacement (mm)
Shear force (N)
Tool displacement (mm)
Docol 1400M36 kN
DC0437,8 kN
Shear force (N)
Tool displacement (mm)
DC0437,8 kN
Shear force (N)
Tool displacement (mm)
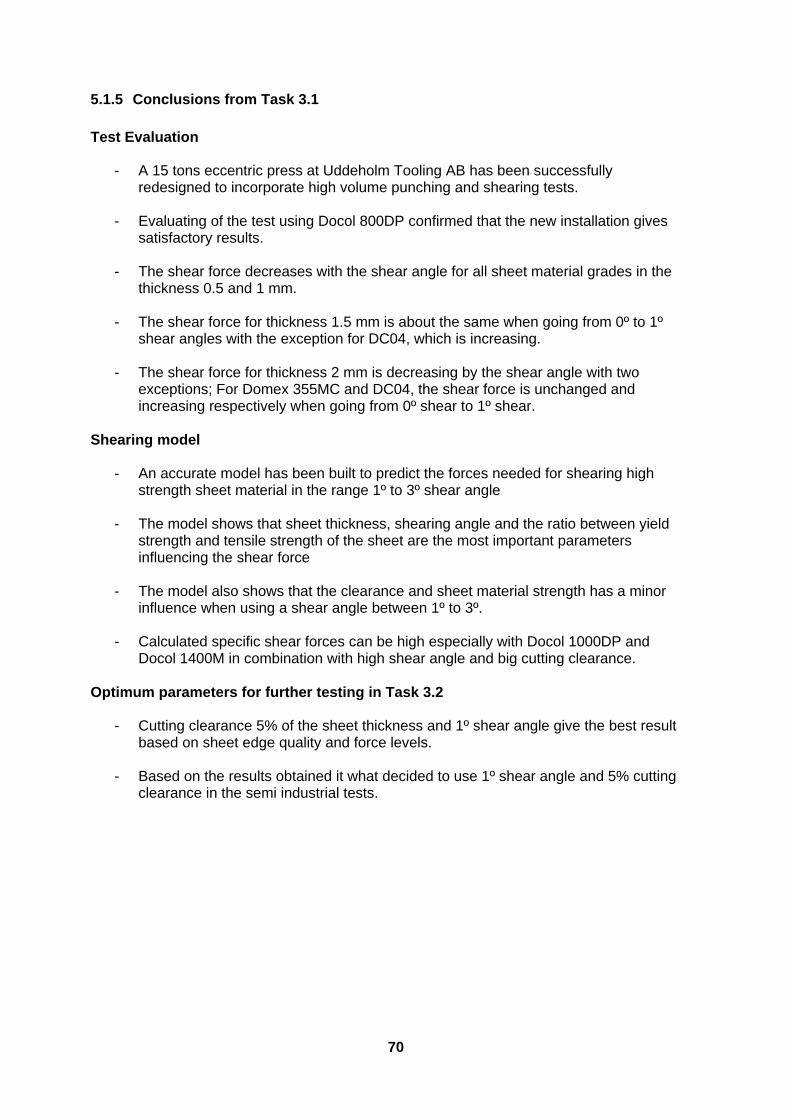
70
5.1.5 Conclusions from Task 3.1
Test Evaluation
- A 15 tons eccentric press at Uddeholm Tooling AB has been successfully redesigned to incorporate high volume punching and shearing tests.
- Evaluating of the test using Docol 800DP confirmed that the new installation gives
satisfactory results.
- The shear force decreases with the shear angle for all sheet material grades in the thickness 0.5 and 1 mm.
- The shear force for thickness 1.5 mm is about the same when going from 0º to 1º
shear angles with the exception for DC04, which is increasing.
- The shear force for thickness 2 mm is decreasing by the shear angle with two exceptions; For Domex 355MC and DC04, the shear force is unchanged and increasing respectively when going from 0º shear to 1º shear.
Shearing model
- An accurate model has been built to predict the forces needed for shearing high strength sheet material in the range 1º to 3º shear angle
- The model shows that sheet thickness, shearing angle and the ratio between yield
strength and tensile strength of the sheet are the most important parameters influencing the shear force
- The model also shows that the clearance and sheet material strength has a minor
influence when using a shear angle between 1º to 3º.
- Calculated specific shear forces can be high especially with Docol 1000DP and Docol 1400M in combination with high shear angle and big cutting clearance.
Optimum parameters for further testing in Task 3.2
- Cutting clearance 5% of the sheet thickness and 1º shear angle give the best result based on sheet edge quality and force levels.
- Based on the results obtained it what decided to use 1º shear angle and 5% cutting
clearance in the semi industrial tests.

71
5.2 Task 3.2: High Volume Punching
5.2.1 Test program
The tests conducted in the high volume punching program were made using the sheet materials and tool combinations shown in Table 34. 1mm thickness DC04 and Docol 350YP was tested, whereas 2mm Domex 700MC was used. For sheet material Domex 700MC (pickled) different tool surface treatments were also tested. The punch was made from the tool material to be investigated but the die material in all tests was AISI A2. The tests for Domex 700MC used sheet material with two different surface conditions, pickled and non pickled (sourced by mistake). The non pickled material gave significantly higher tool wear than the pickled variant. The higher punch wear from Domex 700MC was expected as this sheet material has the highest strength and was also thicker than the other two grades. For the non pickled material, VANADIS 4 EXTRA gave the lowest tool wear and for the pickled material VANCRON 40 gave the lowest tool wear. Not all combinations with Domex 700MC could be tested as the test matrix had to be divided due to the different sheet surface conditions.
5.2.2 Test conditions
The duration of high volume punch testing was limited to 200,000 strokes. The die diameter was set to 10 mm, with cutting clearance equal to 6% of the sheet thickness for DC04 and Docol 350YP. For Domex 700MC the cutting clearance was 12% of the sheet thickness. A bigger cutting clearance is typical when punching thicker and higher strength materials. The cutting clearance is adjusted by the diameter of the punch. The punching speed was 200 strokes per minute. Wear of the cutting tools is evaluated by conducting two dimensional profile measurements on several areas of the tool. The equipment used is a Talysurf 4 surface profile meter in which the stylus is guided by a prism allowing measurement on the prismatic surface over the edge and further on the end surface of the punch. Every deviation from this prism is registered as an area in µm2. An average of four profiles around the punch is considered as the punch wear. The principle of the wear measurement is illustrated in Figure 62. Wear progress was evaluated at the start of the tests and after 100,000 and 200,000 strokes. The punch forces were measured at the start and after every 20,000 strokes. The measurement of punch force is described in the Task 3.1 report [1]. Part edge quality was evaluated by measuring the burr height on the ejected slug. The height was averaged over eight measurements. An average burr height of maximum 100 µm after 200,000 strokes is considered acceptable. Part quality was checked at start of testing and after every 50,000 strokes. The equipment used for burr height measurement is shown in Figure 63.
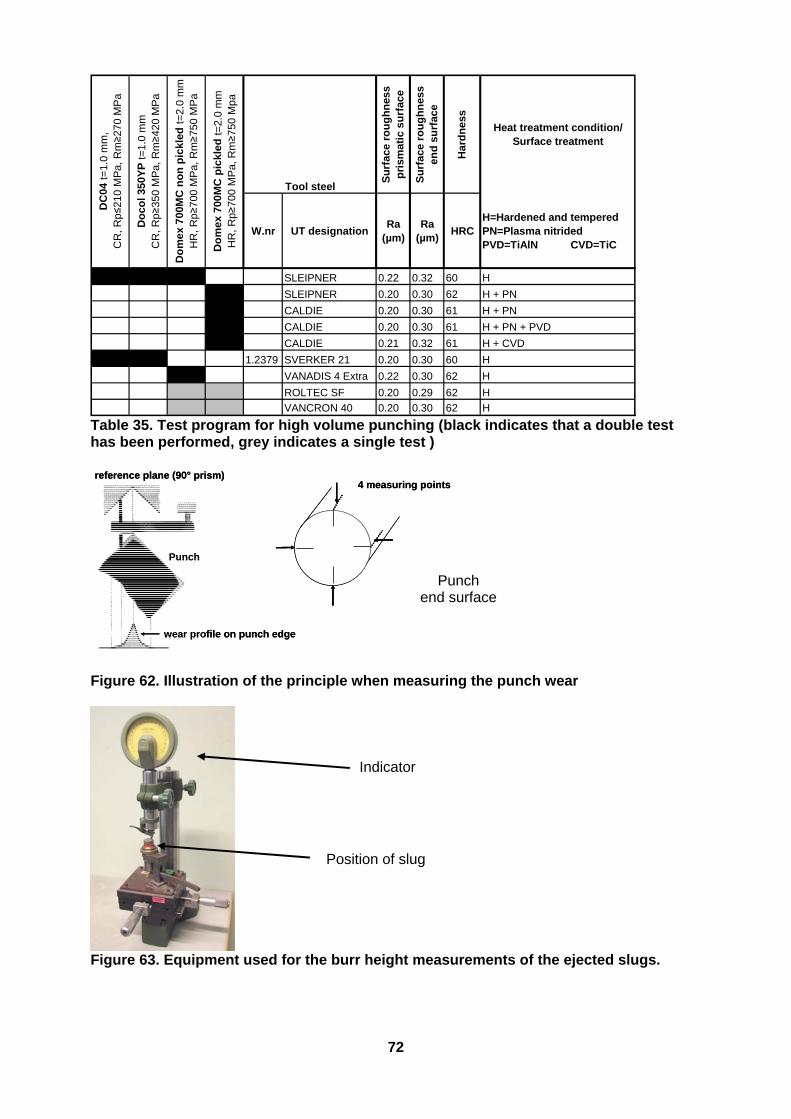
72
Su
rfa
ce r
ou
gh
nes
s p
rism
atic
su
rfac
e
Su
rfa
ce r
ou
gh
nes
s en
d s
urf
ace
Har
dn
ess
Heat treatment condition/ Surface treatment
W.nr UT designationRa
(µm)Ra
(µm)HRC
H=Hardened and tempered PN=Plasma nitrided PVD=TiAlN CVD=TiC
SLEIPNER 0.22 0.32 60 H
SLEIPNER 0.20 0.30 62 H + PN
CALDIE 0.20 0.30 61 H + PN
CALDIE 0.20 0.30 61 H + PN + PVD
CALDIE 0.21 0.32 61 H + CVD
1.2379 SVERKER 21 0.20 0.30 60 H
VANADIS 4 Extra 0.22 0.30 62 H
ROLTEC SF 0.20 0.29 62 H
VANCRON 40 0.20 0.30 62 H
Tool steel
Do
mex
700
MC
pic
kle
d t
=2.
0 m
mH
R,
Rp≥
700
MP
a, R
m≥7
50 M
pa
Do
me
x 7
00M
C n
on
pic
kled
t=
2.0
mm
HR
, Rp≥7
00 M
Pa,
Rm≥7
50
MP
a
Do
co
l 350
YP
t=
1.0
mm
CR
, R
p≥35
0 M
Pa
, Rm≥4
20 M
Pa
DC
04 t=
1.0
mm
, C
R,
Rp≤
210
MP
a, R
m≥2
70 M
Pa
Table 35. Test program for high volume punching (black indicates that a double test has been performed, grey indicates a single test )
wear profile on punch edge
Punch
reference plane (90° prism)4 measuring points
wear profile on punch edge
Punch
reference plane (90° prism)4 measuring points
Figure 62. Illustration of the principle when measuring the punch wear
Figure 63. Equipment used for the burr height measurements of the ejected slugs.
Indicator
Position of slug
Punch end surface
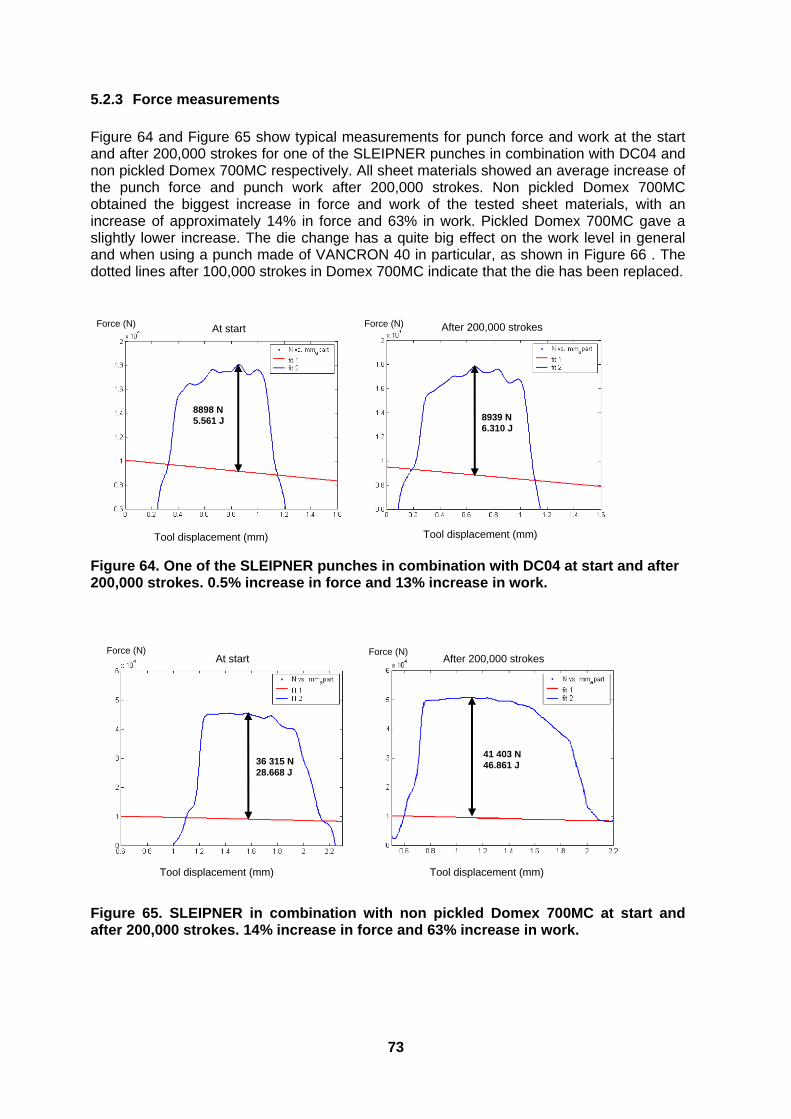
73
5.2.3 Force measurements
Figure 64 and Figure 65 show typical measurements for punch force and work at the start and after 200,000 strokes for one of the SLEIPNER punches in combination with DC04 and non pickled Domex 700MC respectively. All sheet materials showed an average increase of the punch force and punch work after 200,000 strokes. Non pickled Domex 700MC obtained the biggest increase in force and work of the tested sheet materials, with an increase of approximately 14% in force and 63% in work. Pickled Domex 700MC gave a slightly lower increase. The die change has a quite big effect on the work level in general and when using a punch made of VANCRON 40 in particular, as shown in Figure 66 . The dotted lines after 100,000 strokes in Domex 700MC indicate that the die has been replaced.
Figure 64. One of the SLEIPNER punches in combination with DC04 at start and after 200,000 strokes. 0.5% increase in force and 13% increase in work.
Figure 65. SLEIPNER in combination with non pickled Domex 700MC at start and after 200,000 strokes. 14% increase in force and 63% increase in work.
Tool displacement (mm)
Force (N) Force (N)
41 403 N 46.861 J
Tool displacement (mm)
36 315 N 28.668 J
At start After 200,000 strokes
Tool displacement (mm)
Force (N) Force (N)
8939 N 6.310 J
8898 N 5.561 J
At start After 200,000 strokes
Tool displacement (mm)
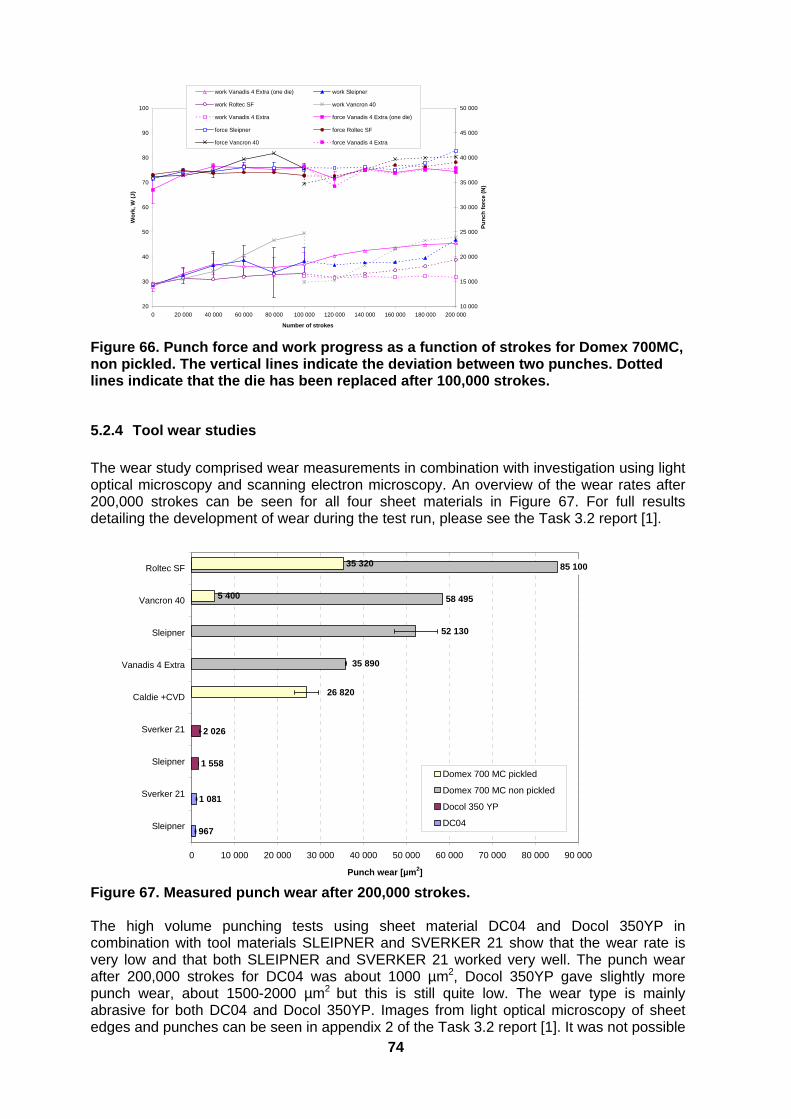
74
20
30
40
50
60
70
80
90
100
0 20 000 40 000 60 000 80 000 100 000 120 000 140 000 160 000 180 000 200 000
Number of strokes
Wo
rk, W
(J
)
10 000
15 000
20 000
25 000
30 000
35 000
40 000
45 000
50 000
Pu
nc
h f
orc
e (N
)
work Vanadis 4 Extra (one die) work Sleipner
work Roltec SF work Vancron 40
work Vanadis 4 Extra force Vanadis 4 Extra (one die)
force Sleipner force Roltec SF
force Vancron 40 force Vanadis 4 Extra
Figure 66. Punch force and work progress as a function of strokes for Domex 700MC, non pickled. The vertical lines indicate the deviation between two punches. Dotted lines indicate that the die has been replaced after 100,000 strokes.
5.2.4 Tool wear studies
The wear study comprised wear measurements in combination with investigation using light optical microscopy and scanning electron microscopy. An overview of the wear rates after 200,000 strokes can be seen for all four sheet materials in Figure 67. For full results detailing the development of wear during the test run, please see the Task 3.2 report [1].
967
1 081
1 558
2 026
58 495
85 100
5 400
35 320
52 130
35 890
26 820
0 10 000 20 000 30 000 40 000 50 000 60 000 70 000 80 000 90 000
Sleipner
Sverker 21
Sleipner
Sverker 21
Caldie +CVD
Vanadis 4 Extra
Sleipner
Vancron 40
Roltec SF
Punch wear [µm2]
Domex 700 MC pickled
Domex 700 MC non pickled
Docol 350 YP
DC04
Figure 67. Measured punch wear after 200,000 strokes. The high volume punching tests using sheet material DC04 and Docol 350YP in combination with tool materials SLEIPNER and SVERKER 21 show that the wear rate is very low and that both SLEIPNER and SVERKER 21 worked very well. The punch wear after 200,000 strokes for DC04 was about 1000 µm2, Docol 350YP gave slightly more punch wear, about 1500-2000 µm2 but this is still quite low. The wear type is mainly abrasive for both DC04 and Docol 350YP. Images from light optical microscopy of sheet edges and punches can be seen in appendix 2 of the Task 3.2 report [1]. It was not possible

75
to see any visual differences in wear between SLEIPNER and SVERKER 21 punches after tests with DC04 and Docol 350YP. The tests on sheet material Domex 700MC had to be split in two parts due to the different surface conditions on the sheet material. The aim was to make 200,000 strokes with one die per punch but this was not possible due to the high wear from the non pickled Domex 700MC. The dies were, therefore, replaced after 100,000 strokes for all punch tests except for the first one in Domex 700MC. This was not done in the first test because the high wear rate of the die was not then known. This punch test used one of the VANADIS 4 EXTRA punches. This test is highlighted in the figure of results in [1]. The wear type from Domex 700MC is a combination of edge chipping, abrasive wear and galling. The test with one of the SLEIPNER punches had to be stopped after 100,000 strokes for non-pickled Domex 700MC due to the very high wear rate observed, >60,000 µm2. This means that for the first half of the test up to 100,000 strokes an average wear rate from two SLEIPNER punches is presented whereas the second half of the wear curve is given by only from one punch. Figure 68 shows both the SLEIPNER punch that ran to 200,000 strokes and the SLEIPNER punch that had to be stopped after 100,000 strokes respectively. A reason for this variation in performance could not be found. The die change had a minor effect on the punch wear when comparing the two VANADIS 4 EXTRA punches. Figure 69 shows the punch wear on the VANADIS 4 EXTRA punch using one die after 200,000 strokes for non pickled Domex 700MC. Some edge chipping, abrasive wear and galling can be observed on the prismatic surface of the punch. VANADIS 4 EXTRA obtained the lowest wear rate for non-pickled Domex 700MC. The wear rates when punching pickled Domex 700MC were significantly lower, especially with the punch made of VANCRON 40. The best result among punches with a surface treatment was for CVD TiC coated Caldie but the measured wear rate is far more than for uncoated VANCRON 40. The wear on the CVD TiC coated Caldie punch was located at the cutting edge where the coating started to come off after 100,000 strokes. Plasma nitrided punches did not perform at all well and the tests had to be stopped after less than 200 strokes due to severe edge chipping. The two punches with combined Plasma nitride and PVD TiAlN treatment managed to perform 80,000 and 100,000 strokes respectively before severe edge chipping.
Figure 68. Scanning electron microscope image of the SLEIPNER punch after 200,000 strokes (left) and another SLEIPNER punch stopped after 100,000 strokes (right). Both tested in combination with non pickled Domex 700MC.
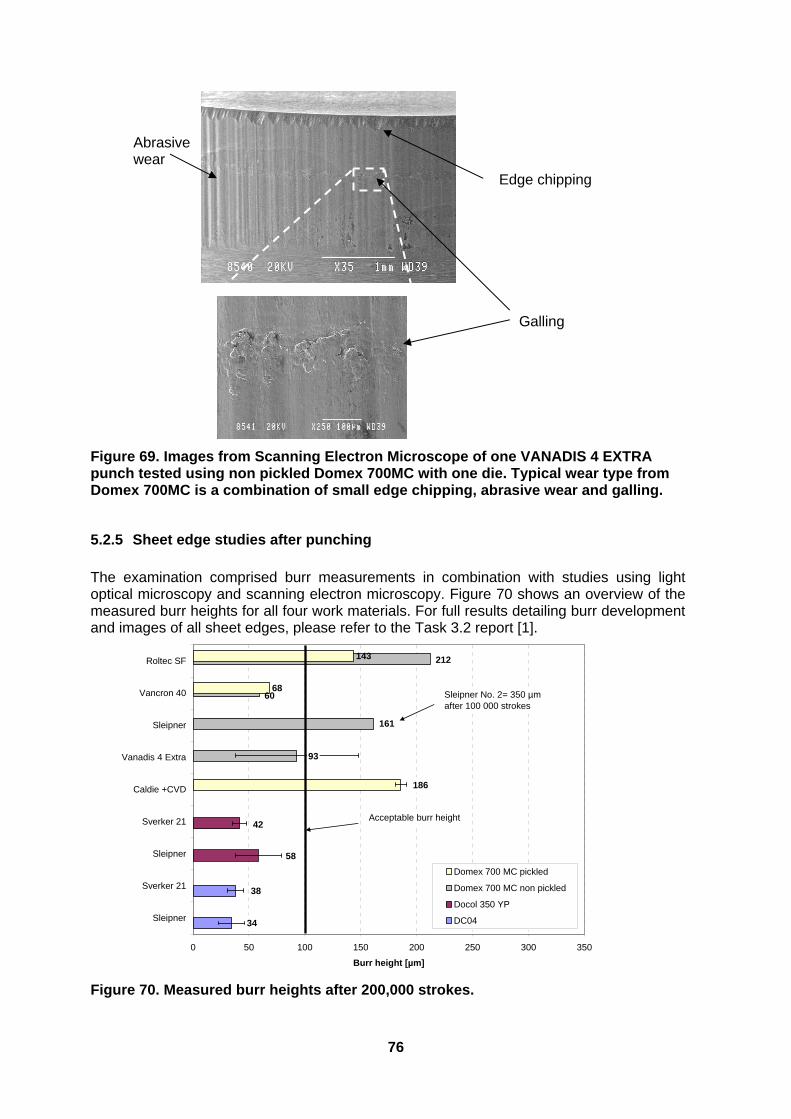
76
Figure 69. Images from Scanning Electron Microscope of one VANADIS 4 EXTRA punch tested using non pickled Domex 700MC with one die. Typical wear type from Domex 700MC is a combination of small edge chipping, abrasive wear and galling.
5.2.5 Sheet edge studies after punching
The examination comprised burr measurements in combination with studies using light optical microscopy and scanning electron microscopy. Figure 70 shows an overview of the measured burr heights for all four work materials. For full results detailing burr development and images of all sheet edges, please refer to the Task 3.2 report [1].
68
143
38
34
42
58
93
161
60
212
186
0 50 100 150 200 250 300 350
Sleipner
Sverker 21
Sleipner
Sverker 21
Caldie +CVD
Vanadis 4 Extra
Sleipner
Vancron 40
Roltec SF
Burr height [µm]
Domex 700 MC pickled
Domex 700 MC non pickled
Docol 350 YP
DC04
Sleipner No. 2= 350 µm after 100 000 strokes
Acceptable burr height
Figure 70. Measured burr heights after 200,000 strokes.
Edge chipping
Abrasive wear
Galling
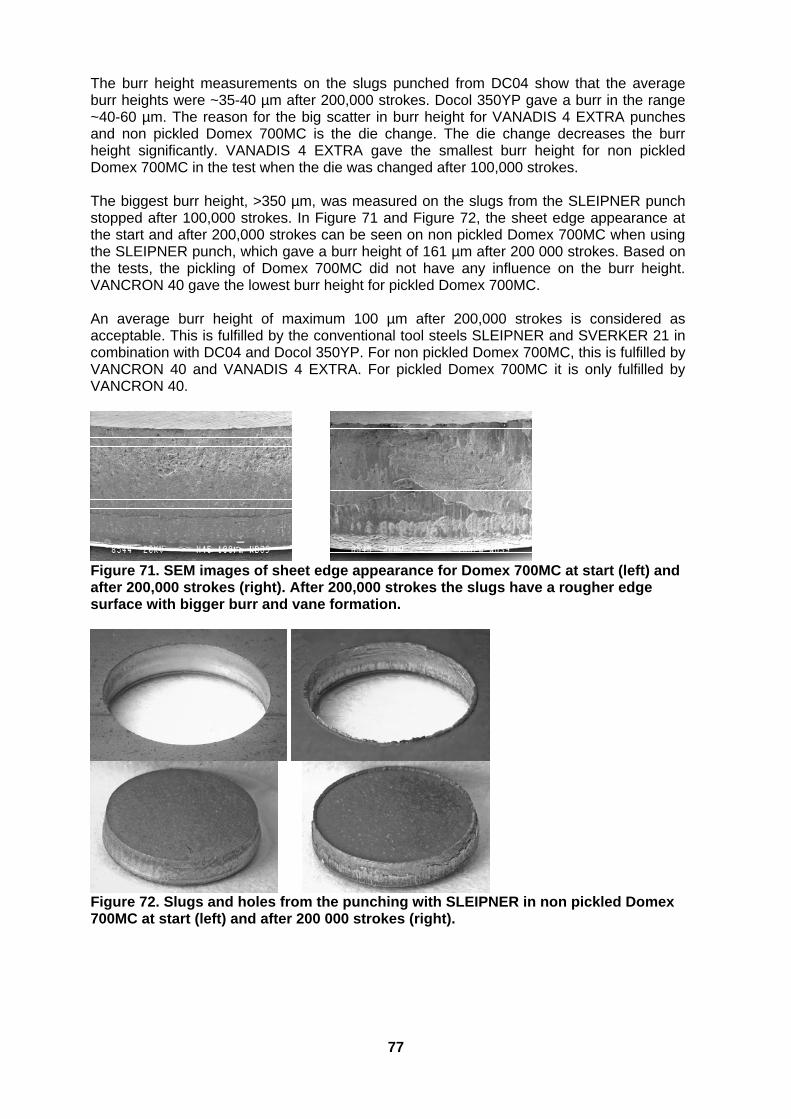
77
The burr height measurements on the slugs punched from DC04 show that the average burr heights were ~35-40 µm after 200,000 strokes. Docol 350YP gave a burr in the range ~40-60 µm. The reason for the big scatter in burr height for VANADIS 4 EXTRA punches and non pickled Domex 700MC is the die change. The die change decreases the burr height significantly. VANADIS 4 EXTRA gave the smallest burr height for non pickled Domex 700MC in the test when the die was changed after 100,000 strokes. The biggest burr height, >350 µm, was measured on the slugs from the SLEIPNER punch stopped after 100,000 strokes. In Figure 71 and Figure 72, the sheet edge appearance at the start and after 200,000 strokes can be seen on non pickled Domex 700MC when using the SLEIPNER punch, which gave a burr height of 161 µm after 200 000 strokes. Based on the tests, the pickling of Domex 700MC did not have any influence on the burr height. VANCRON 40 gave the lowest burr height for pickled Domex 700MC. An average burr height of maximum 100 µm after 200,000 strokes is considered as acceptable. This is fulfilled by the conventional tool steels SLEIPNER and SVERKER 21 in combination with DC04 and Docol 350YP. For non pickled Domex 700MC, this is fulfilled by VANCRON 40 and VANADIS 4 EXTRA. For pickled Domex 700MC it is only fulfilled by VANCRON 40.
Figure 71. SEM images of sheet edge appearance for Domex 700MC at start (left) and after 200,000 strokes (right). After 200,000 strokes the slugs have a rougher edge surface with bigger burr and vane formation.
Figure 72. Slugs and holes from the punching with SLEIPNER in non pickled Domex 700MC at start (left) and after 200 000 strokes (right).

78
5.2.6 Conclusions from Task 3.2
The most tests have been conducted using Domex 700MC because this was the most difficult material to punch. The following conclusions could be drawn:
- DC04 is the easiest material to punch followed by 350YP and 700MC - It was expected that 700MC is the most difficult to punch as it was the thickest
material with the highest strength - Conventional punch materials SLEIPNER and SVERKER 21 work well in
combination with DC04 and 350YP, there was no need to test powder steels, sprayformed steel or coatings for these sheet materials
- 700MC gives very high punch tool wear especially in a non-pickled condition - VANADIS 4 EXTRA gave the lowest punch tool wear for non-pickled 700MC
- VANCRON 40 gave the lowest punch tool wear for pickled 700MC followed by
Caldie +CVD - VANCRON 40 gave the lowest burr height for 700MC after 200 000 strokes - Pickling affected punch wear greatly but not burr height - When punching pickled 700MC, the dies had to be changed after 100 000 strokes,
this reduced burr height and punch work but did not affect punch wear or punch force
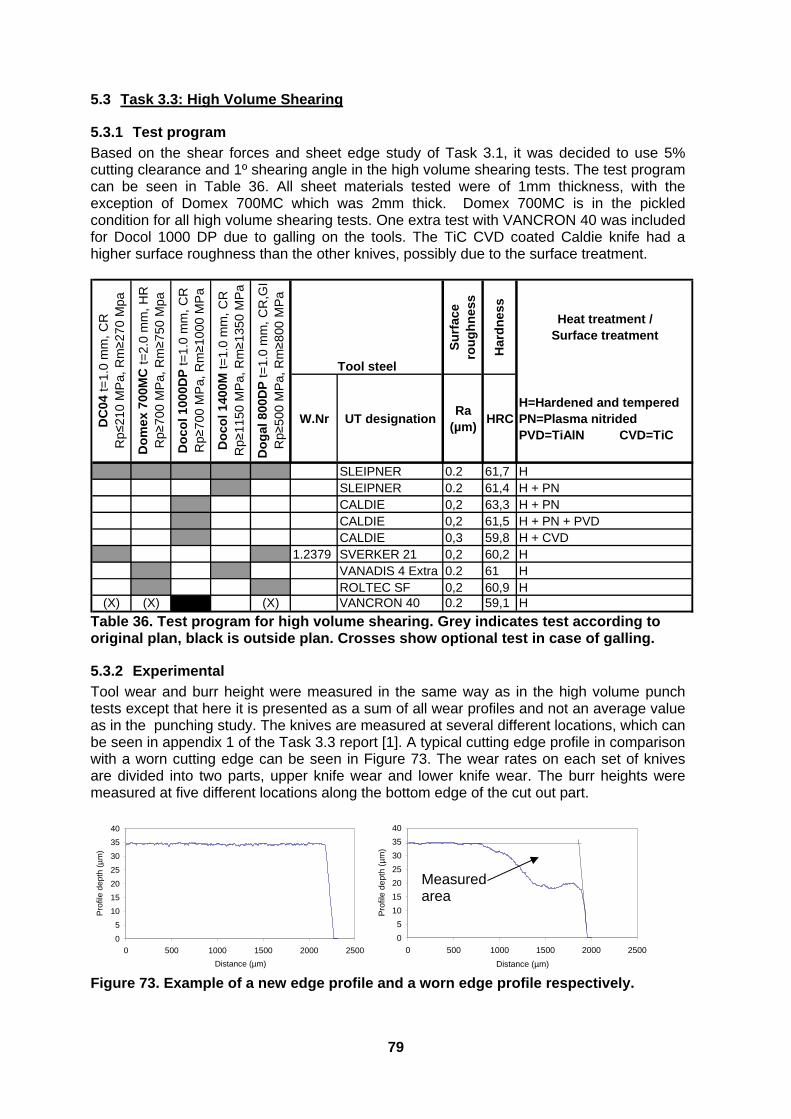
79
5.3 Task 3.3: High Volume Shearing
5.3.1 Test program
Based on the shear forces and sheet edge study of Task 3.1, it was decided to use 5% cutting clearance and 1º shearing angle in the high volume shearing tests. The test program can be seen in Table 36. All sheet materials tested were of 1mm thickness, with the exception of Domex 700MC which was 2mm thick. Domex 700MC is in the pickled condition for all high volume shearing tests. One extra test with VANCRON 40 was included for Docol 1000 DP due to galling on the tools. The TiC CVD coated Caldie knife had a higher surface roughness than the other knives, possibly due to the surface treatment.
Su
rfac
e ro
ug
hn
ess
Har
dn
ess
Heat treatment / Surface treatment
W.Nr UT designationRa
(µm)HRC
H=Hardened and tempered PN=Plasma nitrided PVD=TiAlN CVD=TiC
SLEIPNER 0.2 61,7 HSLEIPNER 0.2 61,4 H + PNCALDIE 0,2 63,3 H + PNCALDIE 0,2 61,5 H + PN + PVDCALDIE 0,3 59,8 H + CVD
1.2379 SVERKER 21 0,2 60,2 HVANADIS 4 Extra 0.2 61 HROLTEC SF 0,2 60,9 H
(X) (X) (X) VANCRON 40 0.2 59,1 H
Tool steel
Do
gal
800
DP
t=1.
0 m
m, C
R,G
IR
p≥50
0 M
Pa,
Rm≥8
00 M
Pa
Do
col 1
400M
t=1.
0 m
m, C
RR
p≥11
50 M
Pa,
Rm≥1
350
MP
a
Do
col 1
000D
P t=
1.0
mm
, CR
Rp≥
700
MP
a, R
m≥1
000
MP
a
Do
mex
700
MC
t=2.
0 m
m, H
RR
p≥70
0 M
Pa,
Rm≥7
50 M
pa
DC
04 t=
1.0
mm
, CR
Rp≤
210
MP
a, R
m≥2
70 M
pa
Table 36. Test program for high volume shearing. Grey indicates test according to original plan, black is outside plan. Crosses show optional test in case of galling.
5.3.2 Experimental
Tool wear and burr height were measured in the same way as in the high volume punch tests except that here it is presented as a sum of all wear profiles and not an average value as in the punching study. The knives are measured at several different locations, which can be seen in appendix 1 of the Task 3.3 report [1]. A typical cutting edge profile in comparison with a worn cutting edge can be seen in Figure 73. The wear rates on each set of knives are divided into two parts, upper knife wear and lower knife wear. The burr heights were measured at five different locations along the bottom edge of the cut out part.
0
5
10
15
20
25
30
35
40
0 500 1000 1500 2000 2500
Distance (µm)
Pro
file
dep
th (
µm
)
0
5
10
15
20
25
30
35
40
0 500 1000 1500 2000 2500
Distance (µm)
Pro
file
dep
th (
µm
)
Figure 73. Example of a new edge profile and a worn edge profile respectively.
Measured area
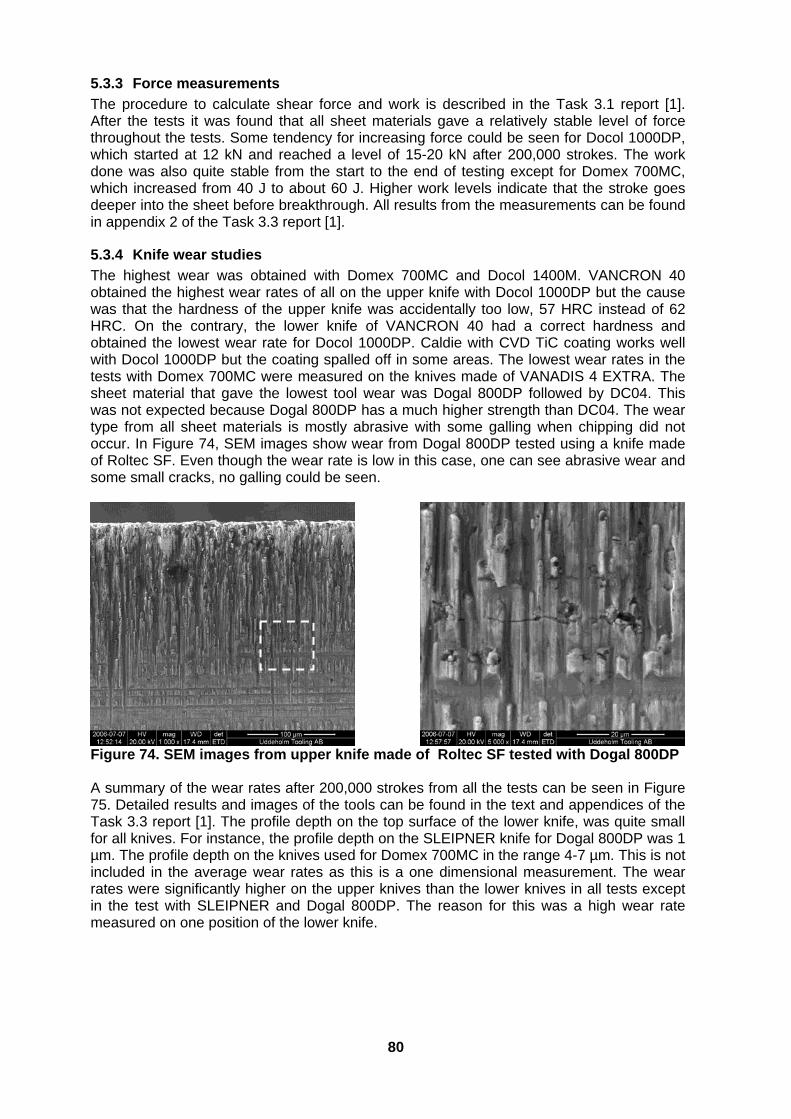
80
5.3.3 Force measurements
The procedure to calculate shear force and work is described in the Task 3.1 report [1]. After the tests it was found that all sheet materials gave a relatively stable level of force throughout the tests. Some tendency for increasing force could be seen for Docol 1000DP, which started at 12 kN and reached a level of 15-20 kN after 200,000 strokes. The work done was also quite stable from the start to the end of testing except for Domex 700MC, which increased from 40 J to about 60 J. Higher work levels indicate that the stroke goes deeper into the sheet before breakthrough. All results from the measurements can be found in appendix 2 of the Task 3.3 report [1].
5.3.4 Knife wear studies
The highest wear was obtained with Domex 700MC and Docol 1400M. VANCRON 40 obtained the highest wear rates of all on the upper knife with Docol 1000DP but the cause was that the hardness of the upper knife was accidentally too low, 57 HRC instead of 62 HRC. On the contrary, the lower knife of VANCRON 40 had a correct hardness and obtained the lowest wear rate for Docol 1000DP. Caldie with CVD TiC coating works well with Docol 1000DP but the coating spalled off in some areas. The lowest wear rates in the tests with Domex 700MC were measured on the knives made of VANADIS 4 EXTRA. The sheet material that gave the lowest tool wear was Dogal 800DP followed by DC04. This was not expected because Dogal 800DP has a much higher strength than DC04. The wear type from all sheet materials is mostly abrasive with some galling when chipping did not occur. In Figure 74, SEM images show wear from Dogal 800DP tested using a knife made of Roltec SF. Even though the wear rate is low in this case, one can see abrasive wear and some small cracks, no galling could be seen.
Figure 74. SEM images from upper knife made of Roltec SF tested with Dogal 800DP A summary of the wear rates after 200,000 strokes from all the tests can be seen in Figure 75. Detailed results and images of the tools can be found in the text and appendices of the Task 3.3 report [1]. The profile depth on the top surface of the lower knife, was quite small for all knives. For instance, the profile depth on the SLEIPNER knife for Dogal 800DP was 1 µm. The profile depth on the knives used for Domex 700MC in the range 4-7 µm. This is not included in the average wear rates as this is a one dimensional measurement. The wear rates were significantly higher on the upper knives than the lower knives in all tests except in the test with SLEIPNER and Dogal 800DP. The reason for this was a high wear rate measured on one position of the lower knife.
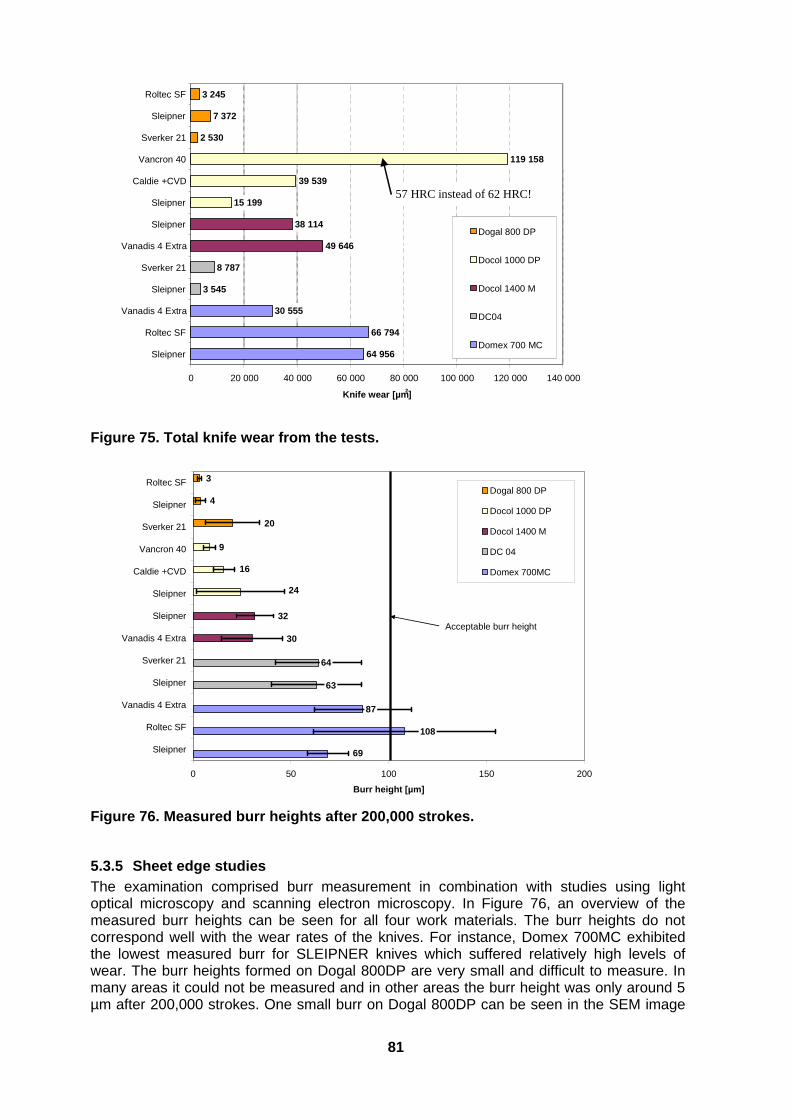
81
64 956
66 794
30 555 3 545
8 787
49 646
38 114
2 530 7 372
3 245
15 199 39 539
119 158
0 20 000 40 000 60 000 80 000 100 000 120 000 140 000
Sleipner Roltec SF
Vanadis 4 Extra Sleipner
Sverker 21 Vanadis 4 Extra
Sleipner Sleipner
Caldie +CVD Vancron 40 Sverker 21
Sleipner Roltec SF
Knife wear [µm2]
Dogal 800 DP
Docol 1000 DP
Docol 1400 M
DC04
Domex 700 MC
57 HRC instead of 62 HRC!
Figure 75. Total knife wear from the tests.
87
64
69
108
63
30
32
9
16
24
20
4
3
0 50 100 150 200
Sleipner
Roltec SF
Vanadis 4 Extra
Sleipner
Sverker 21
Vanadis 4 Extra
Sleipner
Sleipner
Caldie +CVD
Vancron 40
Sverker 21
Sleipner
Roltec SF
Burr height [µm]
Dogal 800 DP
Docol 1000 DP
Docol 1400 M
DC 04
Domex 700MC
Acceptable burr height
Figure 76. Measured burr heights after 200,000 strokes.
5.3.5 Sheet edge studies
The examination comprised burr measurement in combination with studies using light optical microscopy and scanning electron microscopy. In Figure 76, an overview of the measured burr heights can be seen for all four work materials. The burr heights do not correspond well with the wear rates of the knives. For instance, Domex 700MC exhibited the lowest measured burr for SLEIPNER knives which suffered relatively high levels of wear. The burr heights formed on Dogal 800DP are very small and difficult to measure. In many areas it could not be measured and in other areas the burr height was only around 5 µm after 200,000 strokes. One small burr on Dogal 800DP can be seen in the SEM image
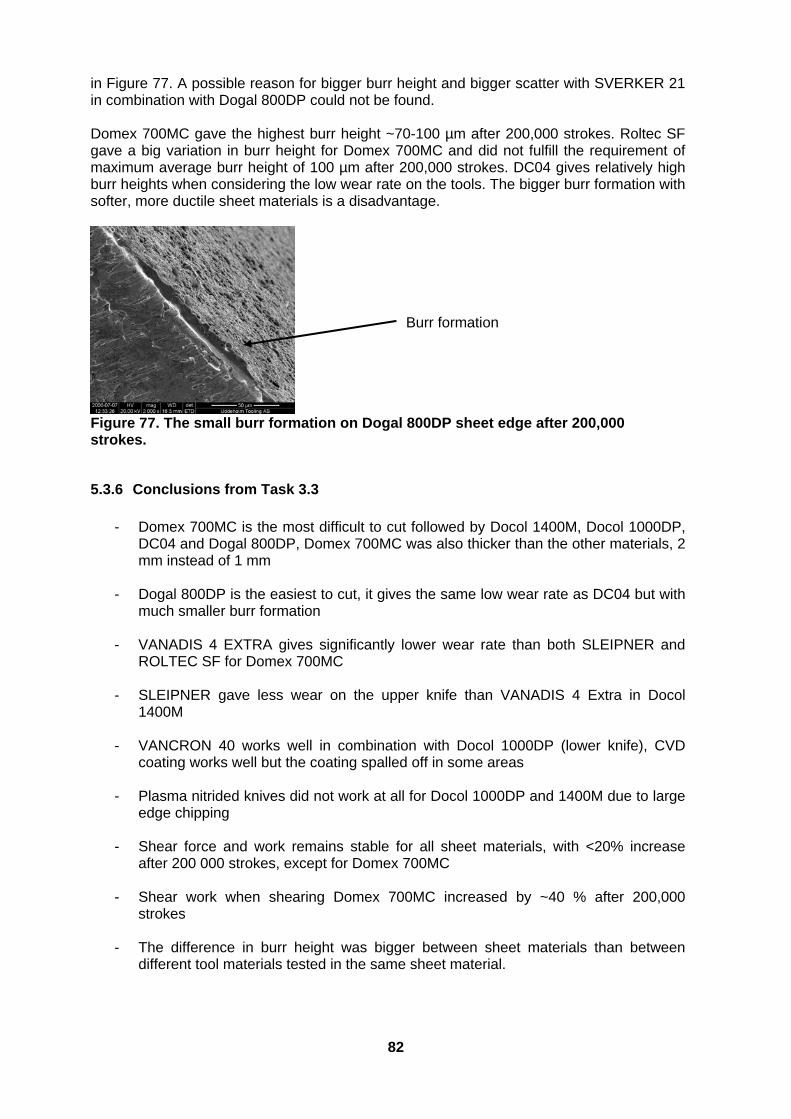
82
in Figure 77. A possible reason for bigger burr height and bigger scatter with SVERKER 21 in combination with Dogal 800DP could not be found. Domex 700MC gave the highest burr height ~70-100 µm after 200,000 strokes. Roltec SF gave a big variation in burr height for Domex 700MC and did not fulfill the requirement of maximum average burr height of 100 µm after 200,000 strokes. DC04 gives relatively high burr heights when considering the low wear rate on the tools. The bigger burr formation with softer, more ductile sheet materials is a disadvantage.
Figure 77. The small burr formation on Dogal 800DP sheet edge after 200,000 strokes.
5.3.6 Conclusions from Task 3.3
- Domex 700MC is the most difficult to cut followed by Docol 1400M, Docol 1000DP,
DC04 and Dogal 800DP, Domex 700MC was also thicker than the other materials, 2 mm instead of 1 mm
- Dogal 800DP is the easiest to cut, it gives the same low wear rate as DC04 but with
much smaller burr formation
- VANADIS 4 EXTRA gives significantly lower wear rate than both SLEIPNER and ROLTEC SF for Domex 700MC
- SLEIPNER gave less wear on the upper knife than VANADIS 4 Extra in Docol
1400M - VANCRON 40 works well in combination with Docol 1000DP (lower knife), CVD
coating works well but the coating spalled off in some areas
- Plasma nitrided knives did not work at all for Docol 1000DP and 1400M due to large edge chipping
- Shear force and work remains stable for all sheet materials, with <20% increase
after 200 000 strokes, except for Domex 700MC - Shear work when shearing Domex 700MC increased by ~40 % after 200,000
strokes
- The difference in burr height was bigger between sheet materials than between different tool materials tested in the same sheet material.
Burr formation

83
5.4 Summary of WP3 with respect to tool selection guidelines
Task 3.1 Shearing parameters
- Cutting clearance equal to 5% of the sheet thickness and 1º shear angle give the best result based on sheet edge quality and force levels for high strength sheet materials
- Big shear angles should be avoided for high strength sheet materials as it increases
the specific cutting force on the tools, which increases the risk of plastic deformation and edge chipping.
- Sheet thickness, shearing angle and the ratio between yield strength and tensile
strength of the sheet are the most important parameters influencing the shear force. Task 3.2 High Volume punching
- Conventional punch material as SLEIPNER and SVERKER 21 work well in combination with DC04 and 350YP
- Powder metallurgy steels are recommended for punching DOMEX 700MC (pickled
and non-pickled) for series of 200 000 strokes, e.g. VANADIS 4 EXTRA or VANCRON 40
- The die material AISI A2 is not good enough for punching Domex 700MC for series
of 200,000 Task 3.3 High volume shearing
- It is not necessary to use powder steels, sprayformed steels or coatings when shearing in Dogal 800DP with a serial length up to 200,000.
- SLEIPNER and VANADIS 4 EXTRA work well for Domex 700MC up to a serial
length of 200,000.
- VANCRON 40 is recommendable as tool material for Docol 1000DP - Plasma nitrided tools should be avoided

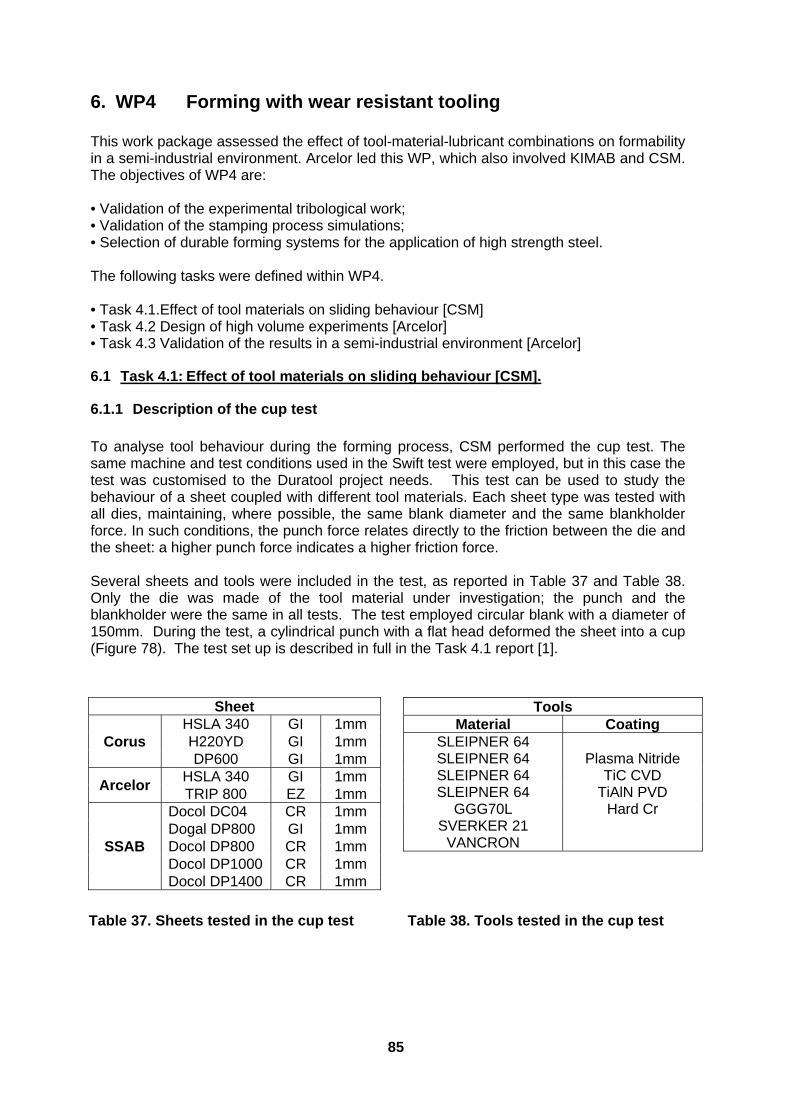
85
6. WP4 Forming with wear resistant tooling This work package assessed the effect of tool-material-lubricant combinations on formability in a semi-industrial environment. Arcelor led this WP, which also involved KIMAB and CSM. The objectives of WP4 are: • Validation of the experimental tribological work; • Validation of the stamping process simulations; • Selection of durable forming systems for the application of high strength steel. The following tasks were defined within WP4. • Task 4.1.Effect of tool materials on sliding behaviour [CSM] • Task 4.2 Design of high volume experiments [Arcelor] • Task 4.3 Validation of the results in a semi-industrial environment [Arcelor]
6.1 Task 4.1: Effect of tool materials on sliding behaviour [CSM].
6.1.1 Description of the cup test
To analyse tool behaviour during the forming process, CSM performed the cup test. The same machine and test conditions used in the Swift test were employed, but in this case the test was customised to the Duratool project needs. This test can be used to study the behaviour of a sheet coupled with different tool materials. Each sheet type was tested with all dies, maintaining, where possible, the same blank diameter and the same blankholder force. In such conditions, the punch force relates directly to the friction between the die and the sheet: a higher punch force indicates a higher friction force. Several sheets and tools were included in the test, as reported in Table 37 and Table 38. Only the die was made of the tool material under investigation; the punch and the blankholder were the same in all tests. The test employed circular blank with a diameter of 150mm. During the test, a cylindrical punch with a flat head deformed the sheet into a cup (Figure 78). The test set up is described in full in the Task 4.1 report [1].
Sheet
Corus HSLA 340 GI 1mm H220YD GI 1mm DP600 GI 1mm
Arcelor HSLA 340 GI 1mm TRIP 800 EZ 1mm
SSAB
Docol DC04 CR 1mm Dogal DP800 GI 1mm Docol DP800 CR 1mm Docol DP1000 CR 1mm Docol DP1400 CR 1mm
Tools Material Coating
SLEIPNER 64 SLEIPNER 64 Plasma Nitride SLEIPNER 64 TiC CVD SLEIPNER 64 TiAlN PVD
GGG70L Hard Cr SVERKER 21
VANCRON
Table 37. Sheets tested in the cup test Table 38. Tools tested in the cup test
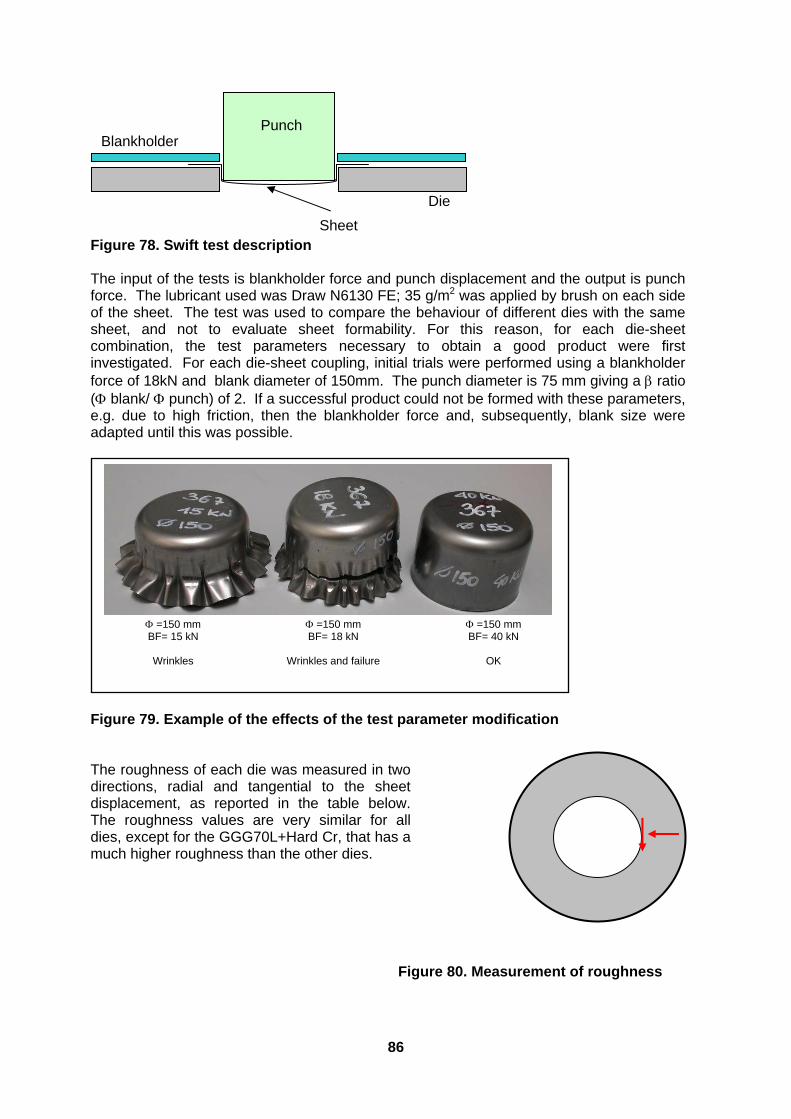
86
Figure 78. Swift test description The input of the tests is blankholder force and punch displacement and the output is punch force. The lubricant used was Draw N6130 FE; 35 g/m2 was applied by brush on each side of the sheet. The test was used to compare the behaviour of different dies with the same sheet, and not to evaluate sheet formability. For this reason, for each die-sheet combination, the test parameters necessary to obtain a good product were first investigated. For each die-sheet coupling, initial trials were performed using a blankholder force of 18kN and blank diameter of 150mm. The punch diameter is 75 mm giving a ratio ( blank/ punch) of 2. If a successful product could not be formed with these parameters, e.g. due to high friction, then the blankholder force and, subsequently, blank size were adapted until this was possible.
Figure 79. Example of the effects of the test parameter modification The roughness of each die was measured in two directions, radial and tangential to the sheet displacement, as reported in the table below. The roughness values are very similar for all dies, except for the GGG70L+Hard Cr, that has a much higher roughness than the other dies.
Figure 80. Measurement of roughness
=150 mm BF= 15 kN
Wrinkles
=150 mm BF= 18 kN
Wrinkles and failure
=150 mm BF= 40 kN
OK
Punch
Die
Blankholder
Sheet
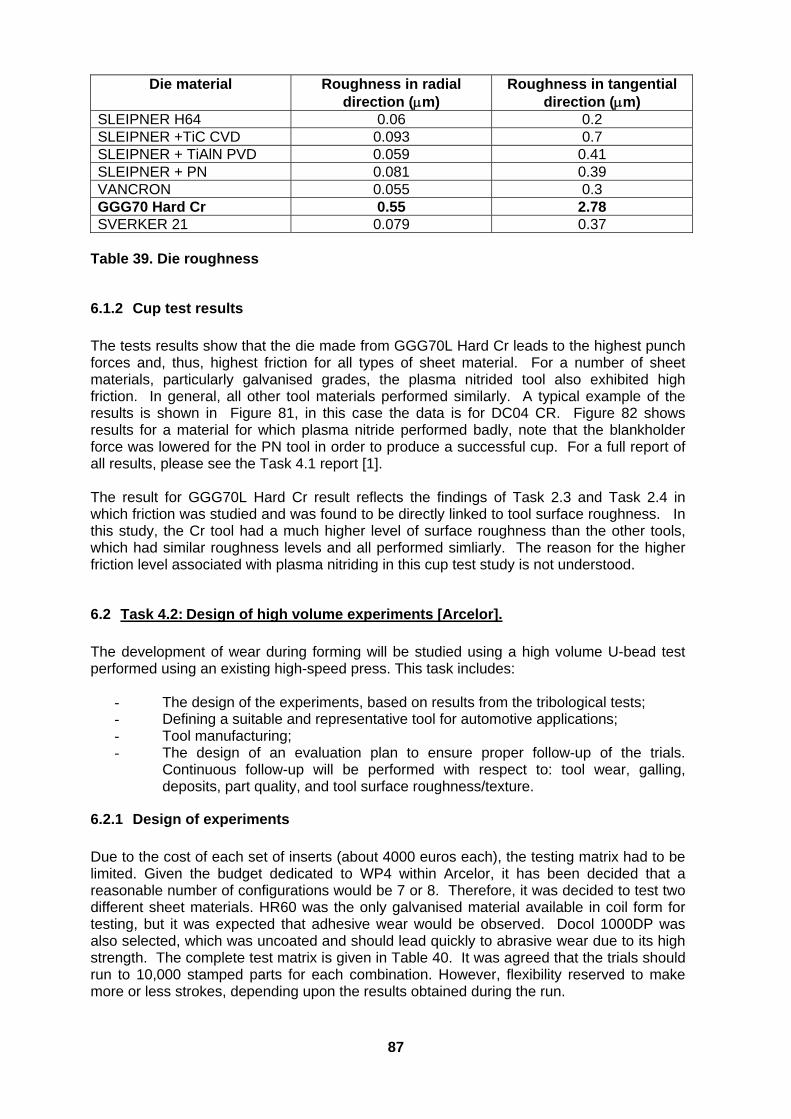
87
Die material Roughness in radial direction (m)
Roughness in tangential direction (m)
SLEIPNER H64 0.06 0.2 SLEIPNER +TiC CVD 0.093 0.7 SLEIPNER + TiAlN PVD 0.059 0.41 SLEIPNER + PN 0.081 0.39 VANCRON 0.055 0.3 GGG70 Hard Cr 0.55 2.78 SVERKER 21 0.079 0.37
Table 39. Die roughness
6.1.2 Cup test results
The tests results show that the die made from GGG70L Hard Cr leads to the highest punch forces and, thus, highest friction for all types of sheet material. For a number of sheet materials, particularly galvanised grades, the plasma nitrided tool also exhibited high friction. In general, all other tool materials performed similarly. A typical example of the results is shown in Figure 81, in this case the data is for DC04 CR. Figure 82 shows results for a material for which plasma nitride performed badly, note that the blankholder force was lowered for the PN tool in order to produce a successful cup. For a full report of all results, please see the Task 4.1 report [1]. The result for GGG70L Hard Cr result reflects the findings of Task 2.3 and Task 2.4 in which friction was studied and was found to be directly linked to tool surface roughness. In this study, the Cr tool had a much higher level of surface roughness than the other tools, which had similar roughness levels and all performed simliarly. The reason for the higher friction level associated with plasma nitriding in this cup test study is not understood.
6.2 Task 4.2: Design of high volume experiments [Arcelor].
The development of wear during forming will be studied using a high volume U-bead test performed using an existing high-speed press. This task includes:
- The design of the experiments, based on results from the tribological tests; - Defining a suitable and representative tool for automotive applications; - Tool manufacturing; - The design of an evaluation plan to ensure proper follow-up of the trials.
Continuous follow-up will be performed with respect to: tool wear, galling, deposits, part quality, and tool surface roughness/texture.
6.2.1 Design of experiments
Due to the cost of each set of inserts (about 4000 euros each), the testing matrix had to be limited. Given the budget dedicated to WP4 within Arcelor, it has been decided that a reasonable number of configurations would be 7 or 8. Therefore, it was decided to test two different sheet materials. HR60 was the only galvanised material available in coil form for testing, but it was expected that adhesive wear would be observed. Docol 1000DP was also selected, which was uncoated and should lead quickly to abrasive wear due to its high strength. The complete test matrix is given in Table 40. It was agreed that the trials should run to 10,000 stamped parts for each combination. However, flexibility reserved to make more or less strokes, depending upon the results obtained during the run.
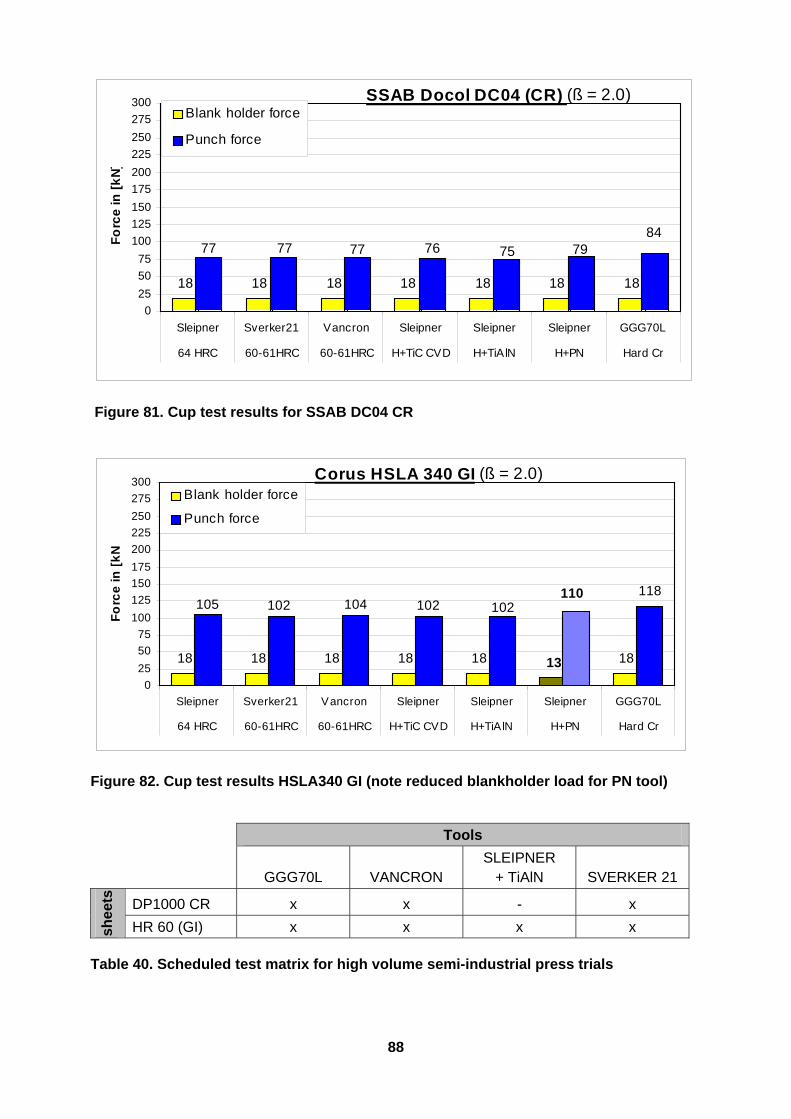
88
SSAB Docol DC04 (CR) (ß = 2.0)
18 18 18 18 18 18 18
847576777777 79
0
25
50
75
100
125
150
175
200
225
250
275
300
Sleipner Sverker21 Vancron Sleipner Sleipner Sleipner GGG70L
64 HRC 60-61HRC 60-61HRC H+TiC CVD H+TiAlN H+PN Hard Cr
Fo
rce
in [
kN
]Blank holder force
Punch force
Figure 81. Cup test results for SSAB DC04 CR
Corus HSLA 340 GI (ß = 2.0)
18 18 18 18 18 18
118
13
105 102 104 102 102110
0
25
50
75
100
125
150
175
200
225
250
275
300
Sleipner Sverker21 Vancron Sleipner Sleipner Sleipner GGG70L
64 HRC 60-61HRC 60-61HRC H+TiC CVD H+TiAlN H+PN Hard Cr
Fo
rce
in [
kN
Blank holder force
Punch force
Figure 82. Cup test results HSLA340 GI (note reduced blankholder load for PN tool) Tools
GGG70L VANCRON SLEIPNER
+ TiAlN SVERKER 21
shee
ts
DP1000 CR x x - x
HR 60 (GI) x x x x
Table 40. Scheduled test matrix for high volume semi-industrial press trials
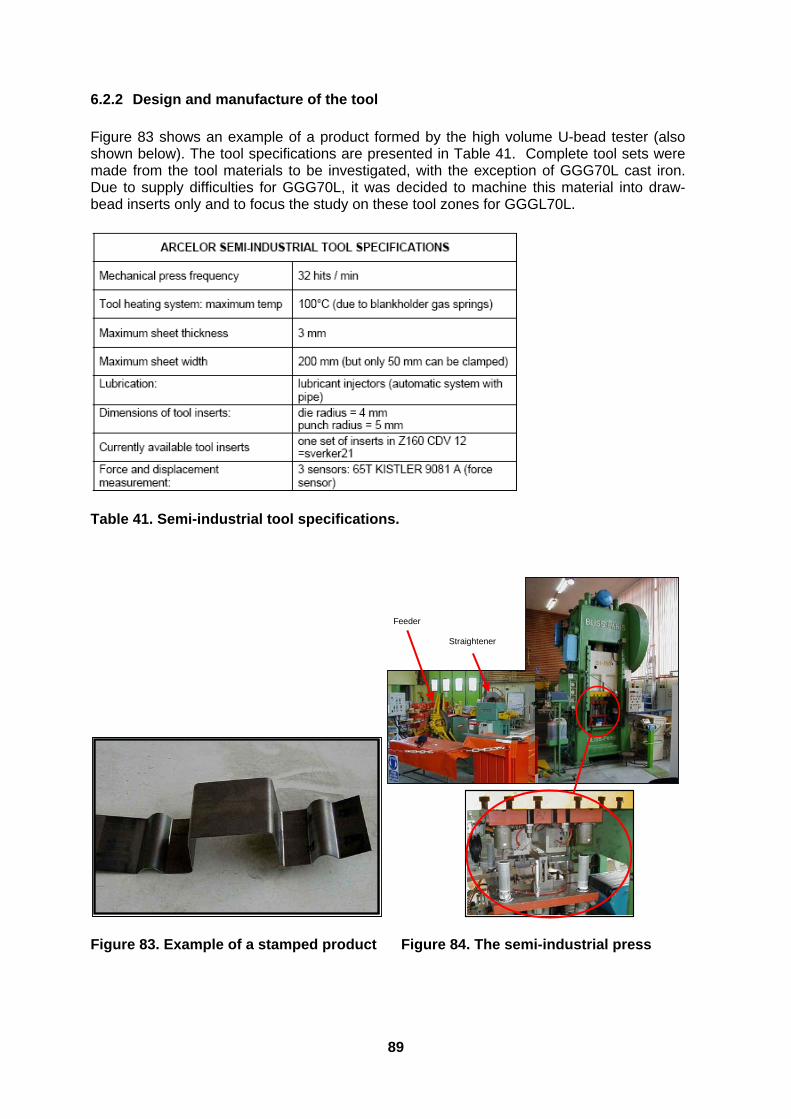
89
6.2.2 Design and manufacture of the tool
Figure 83 shows an example of a product formed by the high volume U-bead tester (also shown below). The tool specifications are presented in Table 41. Complete tool sets were made from the tool materials to be investigated, with the exception of GGG70L cast iron. Due to supply difficulties for GGG70L, it was decided to machine this material into draw-bead inserts only and to focus the study on these tool zones for GGGL70L.
Table 41. Semi-industrial tool specifications.
Feeder
Straightener
Figure 83. Example of a stamped product Figure 84. The semi-industrial press
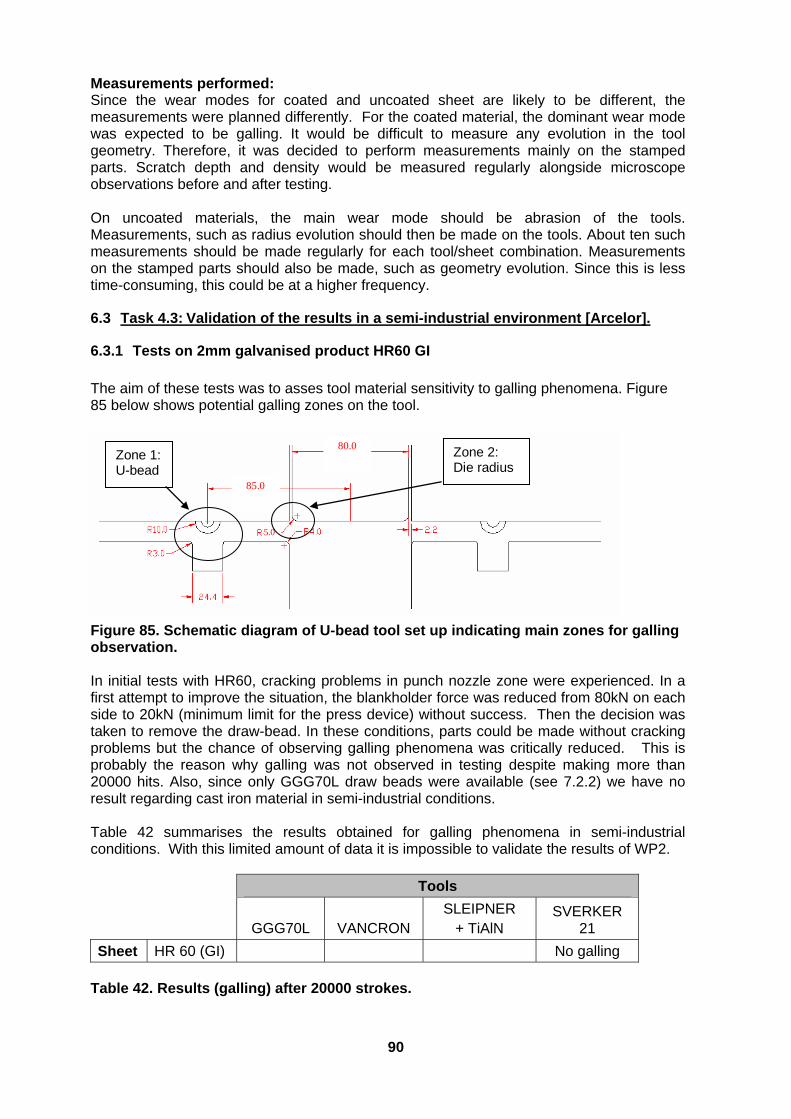
90
Measurements performed: Since the wear modes for coated and uncoated sheet are likely to be different, the measurements were planned differently. For the coated material, the dominant wear mode was expected to be galling. It would be difficult to measure any evolution in the tool geometry. Therefore, it was decided to perform measurements mainly on the stamped parts. Scratch depth and density would be measured regularly alongside microscope observations before and after testing. On uncoated materials, the main wear mode should be abrasion of the tools. Measurements, such as radius evolution should then be made on the tools. About ten such measurements should be made regularly for each tool/sheet combination. Measurements on the stamped parts should also be made, such as geometry evolution. Since this is less time-consuming, this could be at a higher frequency.
6.3 Task 4.3: Validation of the results in a semi-industrial environment [Arcelor].
6.3.1 Tests on 2mm galvanised product HR60 GI
The aim of these tests was to asses tool material sensitivity to galling phenomena. Figure 85 below shows potential galling zones on the tool.
80.0
85.0
5.0
Zone 1: U-bead
Zone 2: Die radius
Figure 85. Schematic diagram of U-bead tool set up indicating main zones for galling observation. In initial tests with HR60, cracking problems in punch nozzle zone were experienced. In a first attempt to improve the situation, the blankholder force was reduced from 80kN on each side to 20kN (minimum limit for the press device) without success. Then the decision was taken to remove the draw-bead. In these conditions, parts could be made without cracking problems but the chance of observing galling phenomena was critically reduced. This is probably the reason why galling was not observed in testing despite making more than 20000 hits. Also, since only GGG70L draw beads were available (see 7.2.2) we have no result regarding cast iron material in semi-industrial conditions. Table 42 summarises the results obtained for galling phenomena in semi-industrial conditions. With this limited amount of data it is impossible to validate the results of WP2. Tools
GGG70L VANCRON SLEIPNER
+ TiAlN SVERKER
21
Sheet HR 60 (GI) No galling
Table 42. Results (galling) after 20000 strokes.
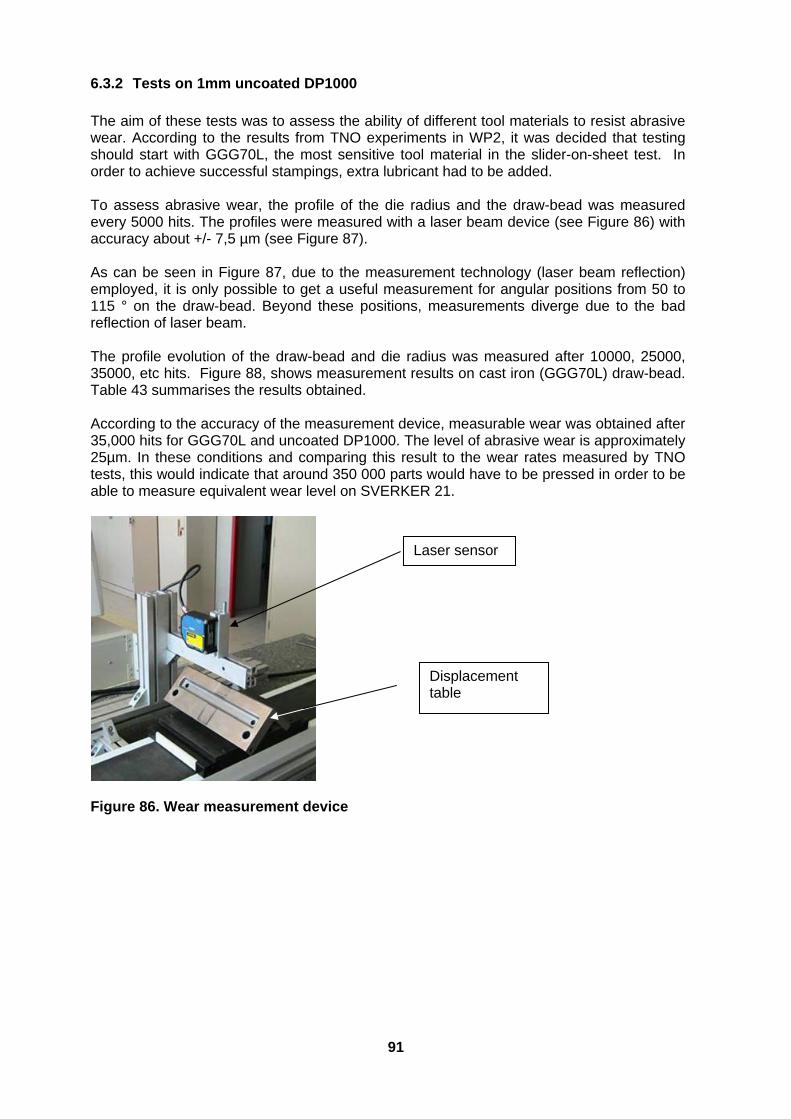
91
6.3.2 Tests on 1mm uncoated DP1000
The aim of these tests was to assess the ability of different tool materials to resist abrasive wear. According to the results from TNO experiments in WP2, it was decided that testing should start with GGG70L, the most sensitive tool material in the slider-on-sheet test. In order to achieve successful stampings, extra lubricant had to be added. To assess abrasive wear, the profile of the die radius and the draw-bead was measured every 5000 hits. The profiles were measured with a laser beam device (see Figure 86) with accuracy about +/- 7,5 µm (see Figure 87). As can be seen in Figure 87, due to the measurement technology (laser beam reflection) employed, it is only possible to get a useful measurement for angular positions from 50 to 115 ° on the draw-bead. Beyond these positions, measurements diverge due to the bad reflection of laser beam. The profile evolution of the draw-bead and die radius was measured after 10000, 25000, 35000, etc hits. Figure 88, shows measurement results on cast iron (GGG70L) draw-bead. Table 43 summarises the results obtained. According to the accuracy of the measurement device, measurable wear was obtained after 35,000 hits for GGG70L and uncoated DP1000. The level of abrasive wear is approximately 25µm. In these conditions and comparing this result to the wear rates measured by TNO tests, this would indicate that around 350 000 parts would have to be pressed in order to be able to measure equivalent wear level on SVERKER 21.
Figure 86. Wear measurement device
Laser sensor
Displacement table
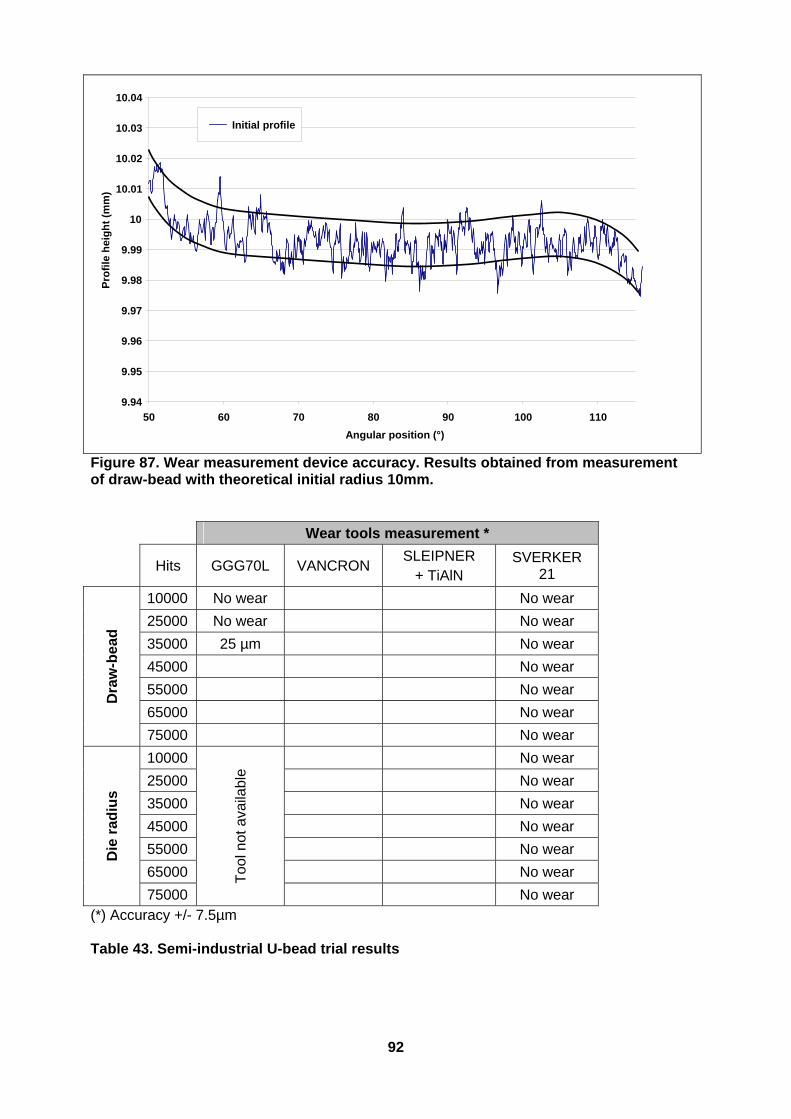
92
Figure 87. Wear measurement device accuracy. Results obtained from measurement of draw-bead with theoretical initial radius 10mm. Wear tools measurement *
Hits GGG70L VANCRON
SLEIPNER + TiAlN
SVERKER 21
Dra
w-b
ead
10000 No wear No wear
25000 No wear No wear
35000 25 µm No wear
45000 No wear
55000 No wear
65000 No wear
75000 No wear
Die
rad
ius
10000
Too
l not
ava
ilabl
e
No wear
25000 No wear
35000 No wear
45000 No wear
55000 No wear
65000 No wear
75000 No wear (*) Accuracy +/- 7.5µm Table 43. Semi-industrial U-bead trial results
9.94
9.95
9.96
9.97
9.98
9.99
10
10.01
10.02
10.03
10.04
50 60 70 80 90 100 110 Angular position (°)
Pro
file
hei
gh
t (m
m)
Initial profile
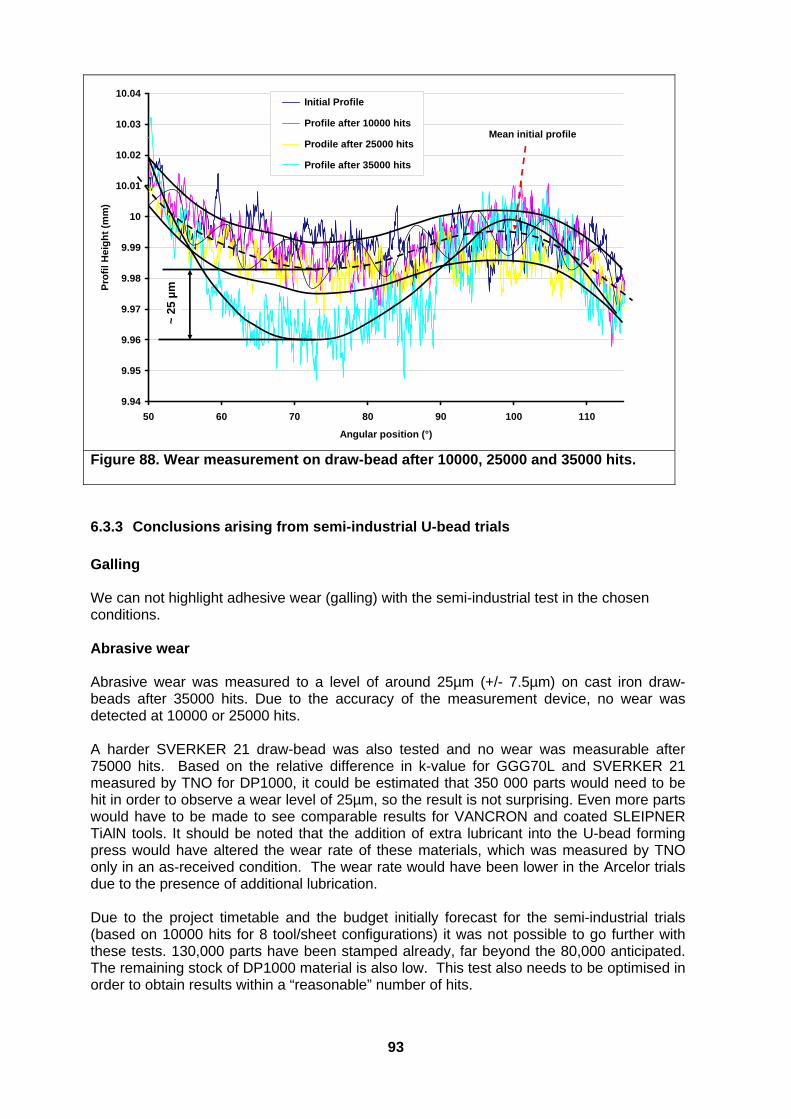
93
9.94
9.95
9.96
9.97
9.98
9.99
10
10.01
10.02
10.03
10.04
50 60 70 80 90 100 110
Angular position (°)
Pro
fil
Hei
gh
t (m
m)
Initial Profile
Profile after 10000 hits
Prodile after 25000 hits
Profile after 35000 hits~
25
µm
Mean initial profile
Figure 88. Wear measurement on draw-bead after 10000, 25000 and 35000 hits.
6.3.3 Conclusions arising from semi-industrial U-bead trials
Galling We can not highlight adhesive wear (galling) with the semi-industrial test in the chosen conditions. Abrasive wear Abrasive wear was measured to a level of around 25µm (+/- 7.5µm) on cast iron draw-beads after 35000 hits. Due to the accuracy of the measurement device, no wear was detected at 10000 or 25000 hits. A harder SVERKER 21 draw-bead was also tested and no wear was measurable after 75000 hits. Based on the relative difference in k-value for GGG70L and SVERKER 21 measured by TNO for DP1000, it could be estimated that 350 000 parts would need to be hit in order to observe a wear level of 25µm, so the result is not surprising. Even more parts would have to be made to see comparable results for VANCRON and coated SLEIPNER TiAlN tools. It should be noted that the addition of extra lubricant into the U-bead forming press would have altered the wear rate of these materials, which was measured by TNO only in an as-received condition. The wear rate would have been lower in the Arcelor trials due to the presence of additional lubrication. Due to the project timetable and the budget initially forecast for the semi-industrial trials (based on 10000 hits for 8 tool/sheet configurations) it was not possible to go further with these tests. 130,000 parts have been stamped already, far beyond the 80,000 anticipated. The remaining stock of DP1000 material is also low. This test also needs to be optimised in order to obtain results within a “reasonable” number of hits.

95
7. WP5 Forming model incorporating tool wear
The objective of work package 5 (Forming model based on Finite Element Method incorporating tool wear) is to build a FEM-based forming model, which will show the effect of tool material selection on part geometry as a function of the amount of products made. This work was be performed by TNO and Corus. Four tasks have been defined within WP5:
Task 5.1 Tool Wear module
Task 5.2 Experimental validation of predicted effect of draw-in radius wear on product geometry
Task 5.3 Validation of forming simulations with tool wear module
Task 5.4 Visualisation of the results in a MS Windows application
7.1 Task 5.1: Tool wear model (Corus, TNO)
7.1.1 Background
Abrasive wear of a tool is generally defined as removal of material by the sliding action a hard and/or rough sheet surface. In this study, abrasive wear is modelled using Archard’s law, which is the most common and most proven method to calculate material loss. It states that the removed volume V is linearly proportional to the normal contact force Fn and the sliding distance s:
V = k Fn s (1) V = material volume loss k = specific wear factor Fn = normal force s = sliding distance
The k-value may be determined experimentally by dedicated tests or calculated using models that predict or describe how material is taken away on the micro-scale. The change in tool geometry can be determined using the local height (or depth) h of the material volume removed. This is equal to the removed (lost) material volume per area:
h = V/A = k (Fn/A) s = k G s (2)
G = local contact stress. A = considered local area If the contact stress G varies during a deep-drawing process and the specific wear rate is assumed to be constant, the wear depth can be calculated as follows: h = k Vrel(t) G(t) dt (3) Vrel (t) = relative velocity between sheet and tool for a given position on the tool surface It should be remarked that the relative velocity results from both the straining of the sheet material as well as the drawing in of the blank. In a numerical incremental deep drawing simulation, the total wear depth will be the summation of the wear depth per increment (time step). The incremental wear depth is a function of the normal contact stress (calculated from the nodal force and distance to adjacent nodes), relative velocity and increment time.
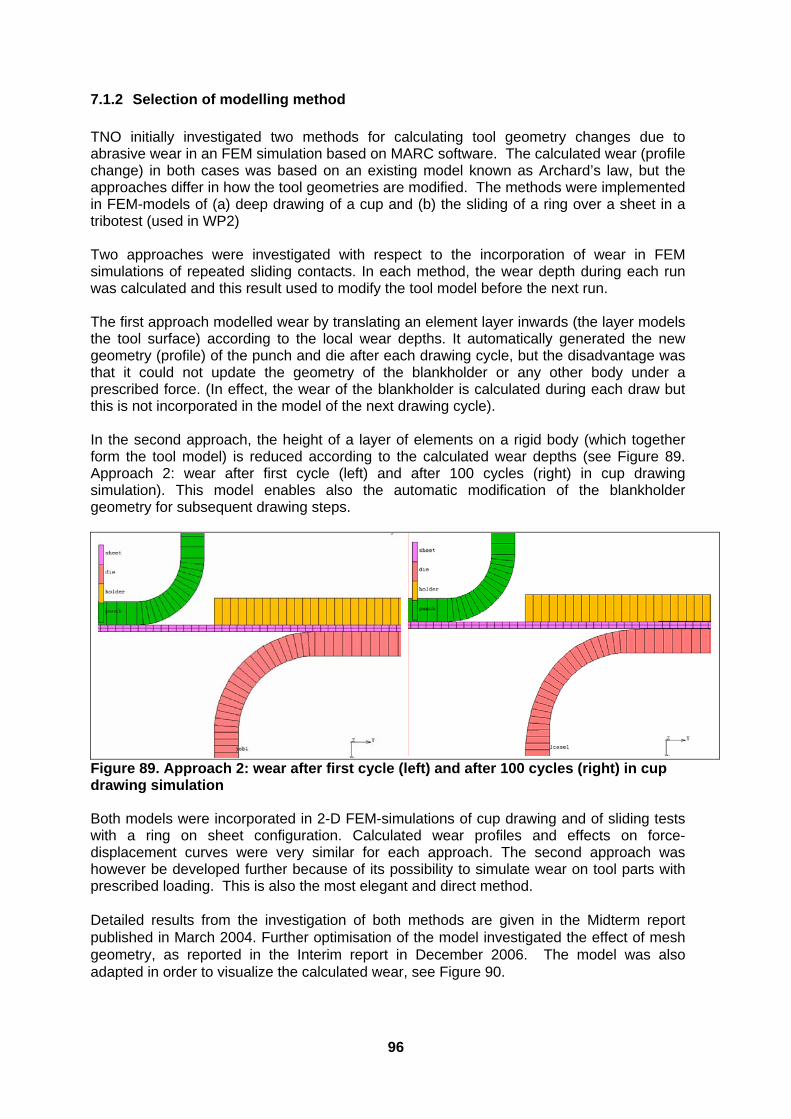
96
7.1.2 Selection of modelling method
TNO initially investigated two methods for calculating tool geometry changes due to abrasive wear in an FEM simulation based on MARC software. The calculated wear (profile change) in both cases was based on an existing model known as Archard’s law, but the approaches differ in how the tool geometries are modified. The methods were implemented in FEM-models of (a) deep drawing of a cup and (b) the sliding of a ring over a sheet in a tribotest (used in WP2) Two approaches were investigated with respect to the incorporation of wear in FEM simulations of repeated sliding contacts. In each method, the wear depth during each run was calculated and this result used to modify the tool model before the next run. The first approach modelled wear by translating an element layer inwards (the layer models the tool surface) according to the local wear depths. It automatically generated the new geometry (profile) of the punch and die after each drawing cycle, but the disadvantage was that it could not update the geometry of the blankholder or any other body under a prescribed force. (In effect, the wear of the blankholder is calculated during each draw but this is not incorporated in the model of the next drawing cycle). In the second approach, the height of a layer of elements on a rigid body (which together form the tool model) is reduced according to the calculated wear depths (see Figure 89. Approach 2: wear after first cycle (left) and after 100 cycles (right) in cup drawing simulation). This model enables also the automatic modification of the blankholder geometry for subsequent drawing steps.
Figure 89. Approach 2: wear after first cycle (left) and after 100 cycles (right) in cup drawing simulation Both models were incorporated in 2-D FEM-simulations of cup drawing and of sliding tests with a ring on sheet configuration. Calculated wear profiles and effects on force-displacement curves were very similar for each approach. The second approach was however be developed further because of its possibility to simulate wear on tool parts with prescribed loading. This is also the most elegant and direct method. Detailed results from the investigation of both methods are given in the Midterm report published in March 2004. Further optimisation of the model investigated the effect of mesh geometry, as reported in the Interim report in December 2006. The model was also adapted in order to visualize the calculated wear, see Figure 90.
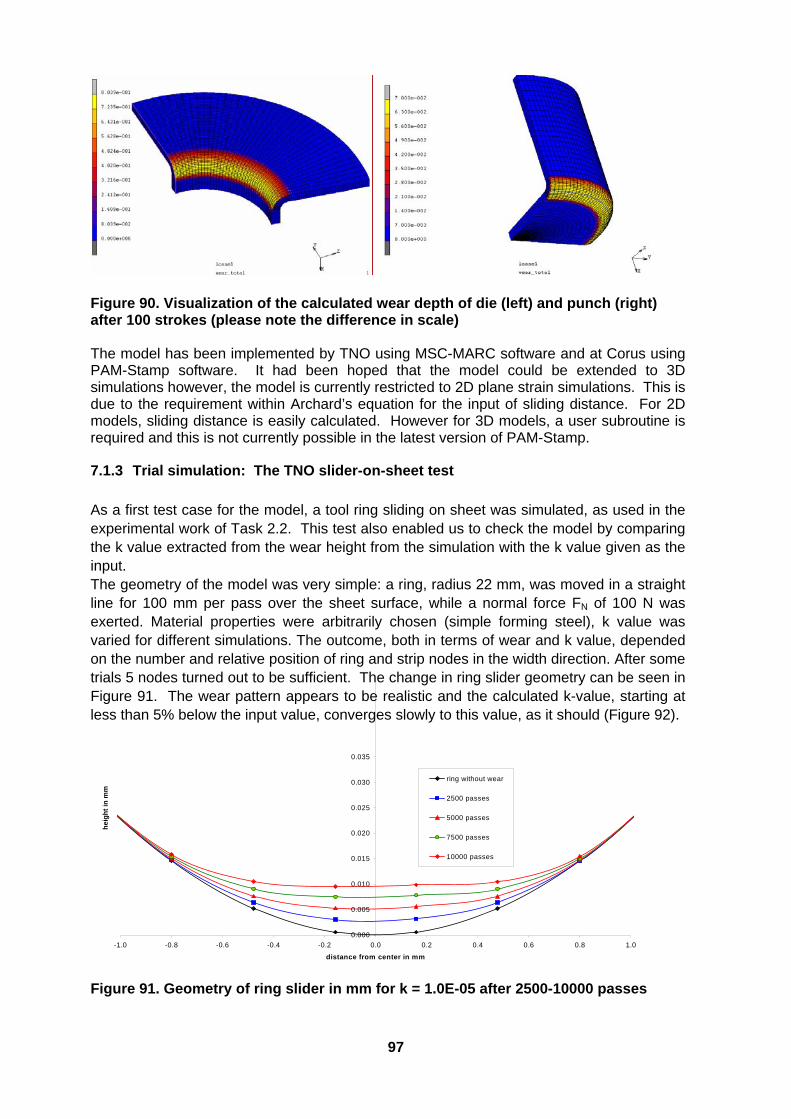
97
Figure 90. Visualization of the calculated wear depth of die (left) and punch (right) after 100 strokes (please note the difference in scale) The model has been implemented by TNO using MSC-MARC software and at Corus using PAM-Stamp software. It had been hoped that the model could be extended to 3D simulations however, the model is currently restricted to 2D plane strain simulations. This is due to the requirement within Archard’s equation for the input of sliding distance. For 2D models, sliding distance is easily calculated. However for 3D models, a user subroutine is required and this is not currently possible in the latest version of PAM-Stamp.
7.1.3 Trial simulation: The TNO slider-on-sheet test
As a first test case for the model, a tool ring sliding on sheet was simulated, as used in the experimental work of Task 2.2. This test also enabled us to check the model by comparing the k value extracted from the wear height from the simulation with the k value given as the input. The geometry of the model was very simple: a ring, radius 22 mm, was moved in a straight line for 100 mm per pass over the sheet surface, while a normal force FN of 100 N was exerted. Material properties were arbitrarily chosen (simple forming steel), k value was varied for different simulations. The outcome, both in terms of wear and k value, depended on the number and relative position of ring and strip nodes in the width direction. After some trials 5 nodes turned out to be sufficient. The change in ring slider geometry can be seen in Figure 91. The wear pattern appears to be realistic and the calculated k-value, starting at less than 5% below the input value, converges slowly to this value, as it should (Figure 92).
0.000
0.005
0.010
0.015
0.020
0.025
0.030
0.035
-1.0 -0.8 -0.6 -0.4 -0.2 0.0 0.2 0.4 0.6 0.8 1.0
distance from center in mm
he
igh
t in
mm
ring without wear
2500 passes
5000 passes
7500 passes
10000 passes
Figure 91. Geometry of ring slider in mm for k = 1.0E-05 after 2500-10000 passes
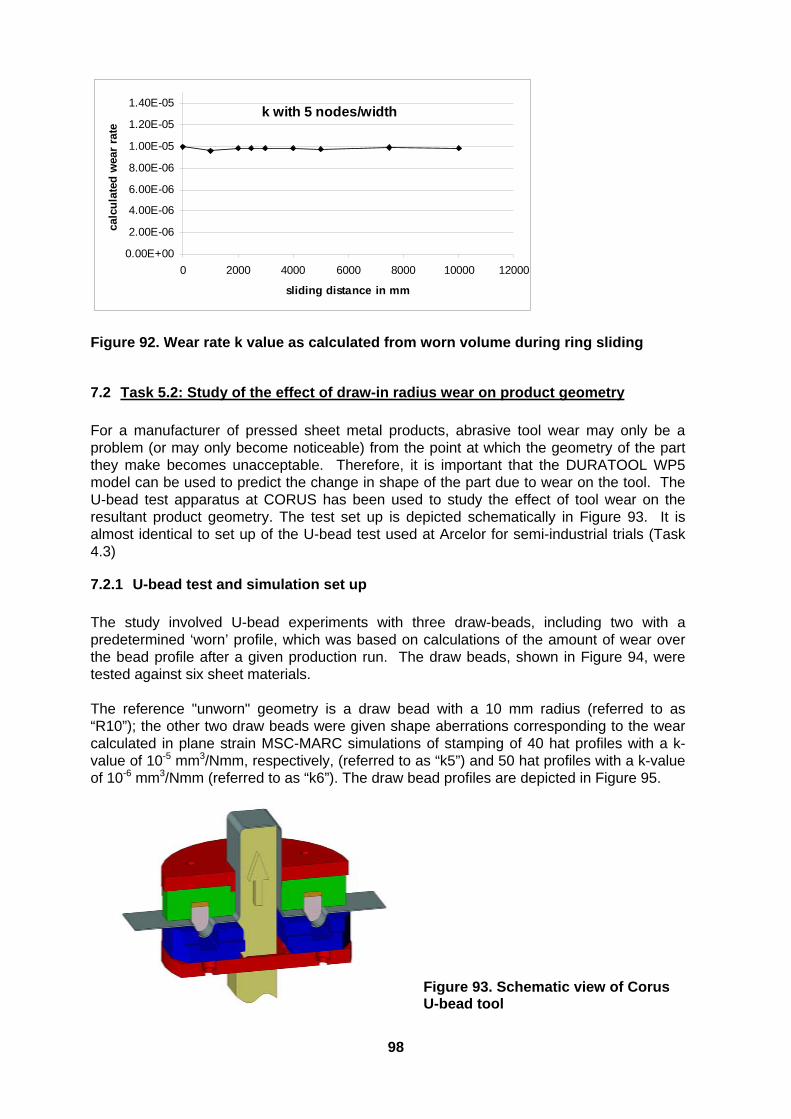
98
k with 5 nodes/width
0.00E+00
2.00E-06
4.00E-06
6.00E-06
8.00E-06
1.00E-05
1.20E-05
1.40E-05
0 2000 4000 6000 8000 10000 12000
sliding distance in mm
calc
ula
ted
wea
r ra
te
Figure 92. Wear rate k value as calculated from worn volume during ring sliding
7.2 Task 5.2: Study of the effect of draw-in radius wear on product geometry
For a manufacturer of pressed sheet metal products, abrasive tool wear may only be a problem (or may only become noticeable) from the point at which the geometry of the part they make becomes unacceptable. Therefore, it is important that the DURATOOL WP5 model can be used to predict the change in shape of the part due to wear on the tool. The U-bead test apparatus at CORUS has been used to study the effect of tool wear on the resultant product geometry. The test set up is depicted schematically in Figure 93. It is almost identical to set up of the U-bead test used at Arcelor for semi-industrial trials (Task 4.3)
7.2.1 U-bead test and simulation set up
The study involved U-bead experiments with three draw-beads, including two with a predetermined ‘worn’ profile, which was based on calculations of the amount of wear over the bead profile after a given production run. The draw beads, shown in Figure 94, were tested against six sheet materials. The reference "unworn" geometry is a draw bead with a 10 mm radius (referred to as “R10”); the other two draw beads were given shape aberrations corresponding to the wear calculated in plane strain MSC-MARC simulations of stamping of 40 hat profiles with a k-value of 10-5 mm3/Nmm, respectively, (referred to as “k5”) and 50 hat profiles with a k-value of 10-6 mm3/Nmm (referred to as “k6”). The draw bead profiles are depicted in Figure 95.
Figure 93. Schematic view of Corus U-bead tool
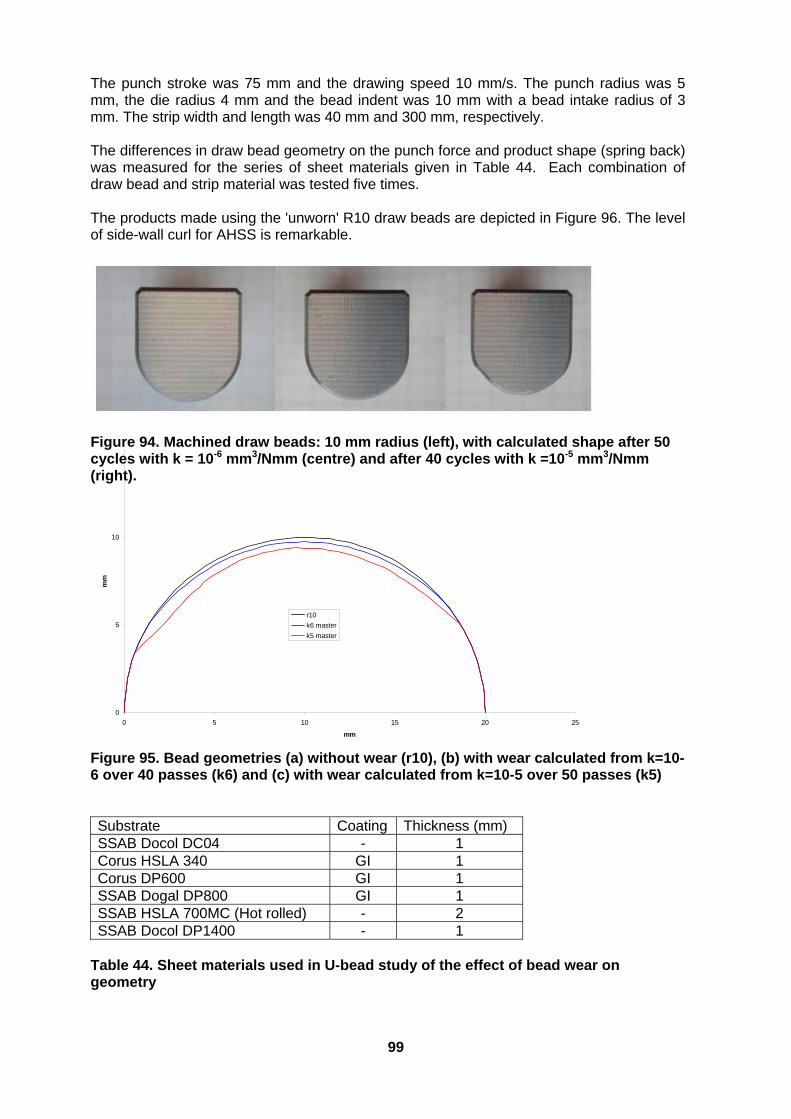
99
The punch stroke was 75 mm and the drawing speed 10 mm/s. The punch radius was 5 mm, the die radius 4 mm and the bead indent was 10 mm with a bead intake radius of 3 mm. The strip width and length was 40 mm and 300 mm, respectively. The differences in draw bead geometry on the punch force and product shape (spring back) was measured for the series of sheet materials given in Table 44. Each combination of draw bead and strip material was tested five times. The products made using the 'unworn' R10 draw beads are depicted in Figure 96. The level of side-wall curl for AHSS is remarkable.
Figure 94. Machined draw beads: 10 mm radius (left), with calculated shape after 50 cycles with k = 10-6 mm3/Nmm (centre) and after 40 cycles with k =10-5 mm3/Nmm (right).
0
5
10
0 5 10 15 20 25
mm
mm
r10
k6 master
k5 master
Figure 95. Bead geometries (a) without wear (r10), (b) with wear calculated from k=10-6 over 40 passes (k6) and (c) with wear calculated from k=10-5 over 50 passes (k5) Substrate Coating Thickness (mm) SSAB Docol DC04 - 1 Corus HSLA 340 GI 1 Corus DP600 GI 1 SSAB Dogal DP800 GI 1 SSAB HSLA 700MC (Hot rolled) - 2 SSAB Docol DP1400 - 1
Table 44. Sheet materials used in U-bead study of the effect of bead wear on geometry
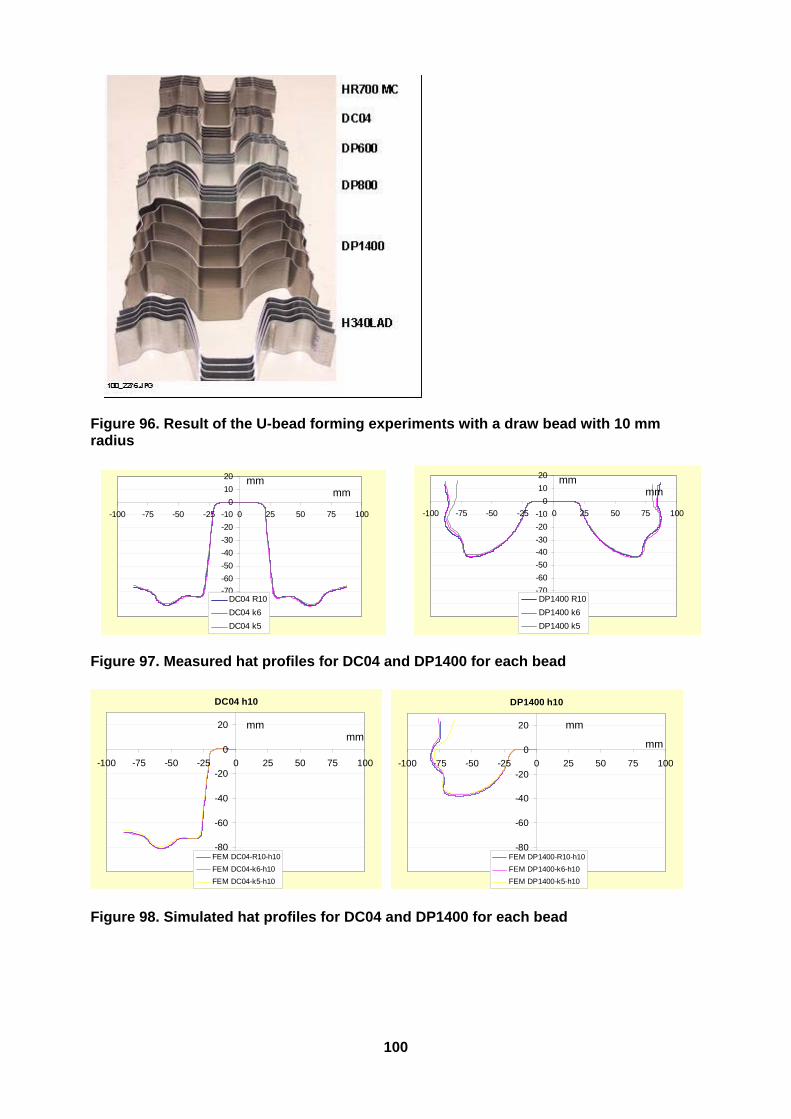
100
Figure 96. Result of the U-bead forming experiments with a draw bead with 10 mm radius
-90
-80
-70
-60
-50
-40
-30
-20
-10
0
10
20
-100 -75 -50 -25 0 25 50 75 100
DC04 R10
DC04 k6
DC04 k5 -90
-80
-70
-60
-50
-40
-30
-20
-10
0
10
20
-100 -75 -50 -25 0 25 50 75 100
DP1400 R10
DP1400 k6
DP1400 k5
Figure 97. Measured hat profiles for DC04 and DP1400 for each bead
DC04 h10
-100
-80
-60
-40
-20
0
20
-100 -75 -50 -25 0 25 50 75 100
FEM DC04-R10-h10
FEM DC04-k6-h10
FEM DC04-k5-h10
DP1400 h10
-100
-80
-60
-40
-20
0
20
-100 -75 -50 -25 0 25 50 75 100
FEM DP1400-R10-h10
FEM DP1400-k6-h10
FEM DP1400-k5-h10 Figure 98. Simulated hat profiles for DC04 and DP1400 for each bead
mm mm
mm mm
mm mm
mm
mm
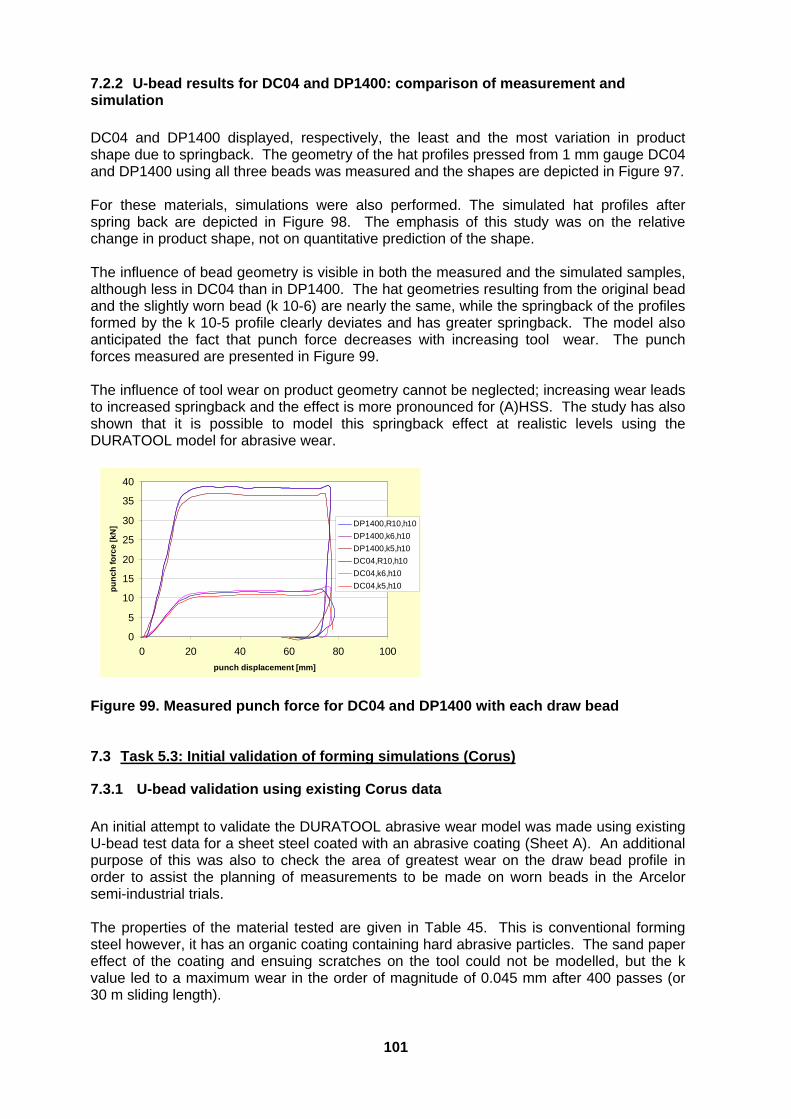
101
7.2.2 U-bead results for DC04 and DP1400: comparison of measurement and simulation
DC04 and DP1400 displayed, respectively, the least and the most variation in product shape due to springback. The geometry of the hat profiles pressed from 1 mm gauge DC04 and DP1400 using all three beads was measured and the shapes are depicted in Figure 97. For these materials, simulations were also performed. The simulated hat profiles after spring back are depicted in Figure 98. The emphasis of this study was on the relative change in product shape, not on quantitative prediction of the shape. The influence of bead geometry is visible in both the measured and the simulated samples, although less in DC04 than in DP1400. The hat geometries resulting from the original bead and the slightly worn bead (k 10-6) are nearly the same, while the springback of the profiles formed by the k 10-5 profile clearly deviates and has greater springback. The model also anticipated the fact that punch force decreases with increasing tool wear. The punch forces measured are presented in Figure 99. The influence of tool wear on product geometry cannot be neglected; increasing wear leads to increased springback and the effect is more pronounced for (A)HSS. The study has also shown that it is possible to model this springback effect at realistic levels using the DURATOOL model for abrasive wear.
0
5
10
15
20
25
30
35
40
0 20 40 60 80 100
punch displacement [mm]
pu
nc
h fo
rce
[kN
] DP1400,R10,h10
DP1400,k6,h10
DP1400,k5,h10
DC04,R10,h10
DC04,k6,h10
DC04,k5,h10
Figure 99. Measured punch force for DC04 and DP1400 with each draw bead 7.3 Task 5.3: Initial validation of forming simulations (Corus)
7.3.1 U-bead validation using existing Corus data
An initial attempt to validate the DURATOOL abrasive wear model was made using existing U-bead test data for a sheet steel coated with an abrasive coating (Sheet A). An additional purpose of this was also to check the area of greatest wear on the draw bead profile in order to assist the planning of measurements to be made on worn beads in the Arcelor semi-industrial trials. The properties of the material tested are given in Table 45. This is conventional forming steel however, it has an organic coating containing hard abrasive particles. The sand paper effect of the coating and ensuing scratches on the tool could not be modelled, but the k value led to a maximum wear in the order of magnitude of 0.045 mm after 400 passes (or 30 m sliding length).
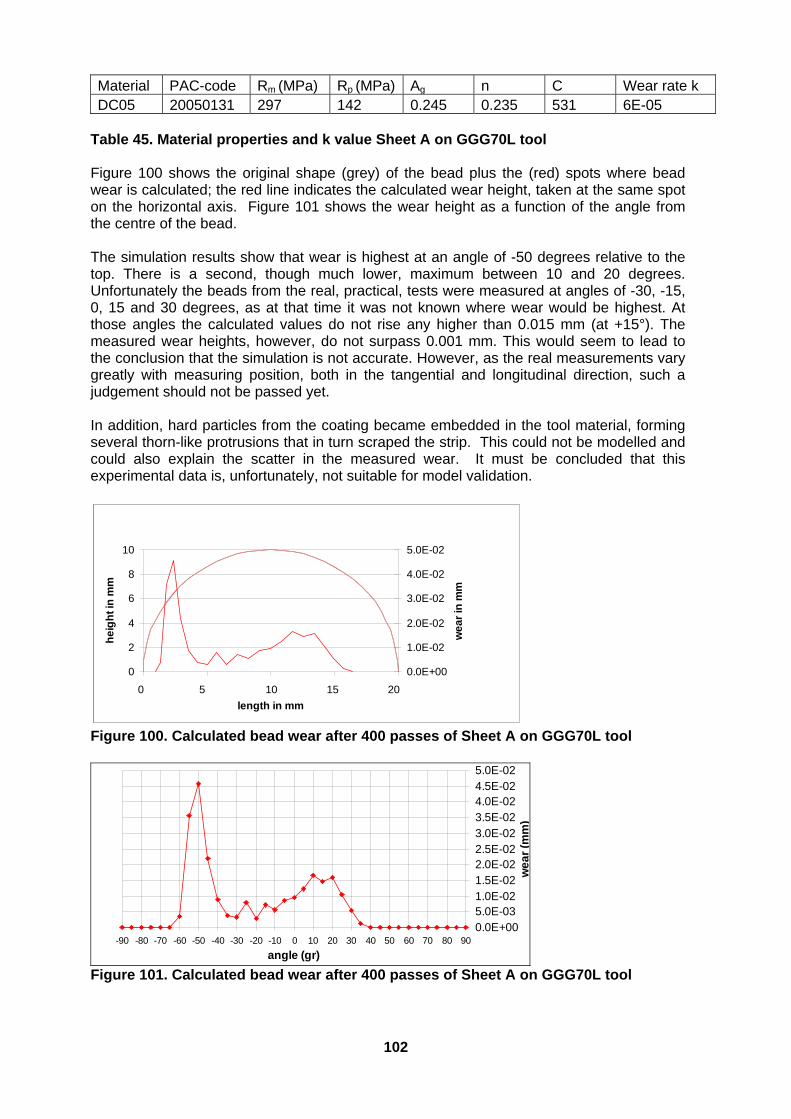
102
Material PAC-code Rm (MPa) Rp (MPa) Ag n C Wear rate k DC05 20050131 297 142 0.245 0.235 531 6E-05
Table 45. Material properties and k value Sheet A on GGG70L tool Figure 100 shows the original shape (grey) of the bead plus the (red) spots where bead wear is calculated; the red line indicates the calculated wear height, taken at the same spot on the horizontal axis. Figure 101 shows the wear height as a function of the angle from the centre of the bead. The simulation results show that wear is highest at an angle of -50 degrees relative to the top. There is a second, though much lower, maximum between 10 and 20 degrees. Unfortunately the beads from the real, practical, tests were measured at angles of -30, -15, 0, 15 and 30 degrees, as at that time it was not known where wear would be highest. At those angles the calculated values do not rise any higher than 0.015 mm (at +15°). The measured wear heights, however, do not surpass 0.001 mm. This would seem to lead to the conclusion that the simulation is not accurate. However, as the real measurements vary greatly with measuring position, both in the tangential and longitudinal direction, such a judgement should not be passed yet. In addition, hard particles from the coating became embedded in the tool material, forming several thorn-like protrusions that in turn scraped the strip. This could not be modelled and could also explain the scatter in the measured wear. It must be concluded that this experimental data is, unfortunately, not suitable for model validation.
0
2
4
6
8
10
-60 -55 -50 -45 -40
length in mm
he
igh
t in
mm
0.0E+00
1.0E-02
2.0E-02
3.0E-02
4.0E-02
5.0E-02
we
ar
in m
m
0 5 10 15 20
0
2
4
6
8
10
-60 -55 -50 -45 -40
length in mm
he
igh
t in
mm
0.0E+00
1.0E-02
2.0E-02
3.0E-02
4.0E-02
5.0E-02
we
ar
in m
m
0 5 10 15 20
Figure 100. Calculated bead wear after 400 passes of Sheet A on GGG70L tool
0.0E+005.0E-031.0E-021.5E-022.0E-022.5E-023.0E-023.5E-024.0E-024.5E-025.0E-02
-90 -80 -70 -60 -50 -40 -30 -20 -10 0 10 20 30 40 50 60 70 80 90
angle (gr)
we
ar
(mm
)
Figure 101. Calculated bead wear after 400 passes of Sheet A on GGG70L tool
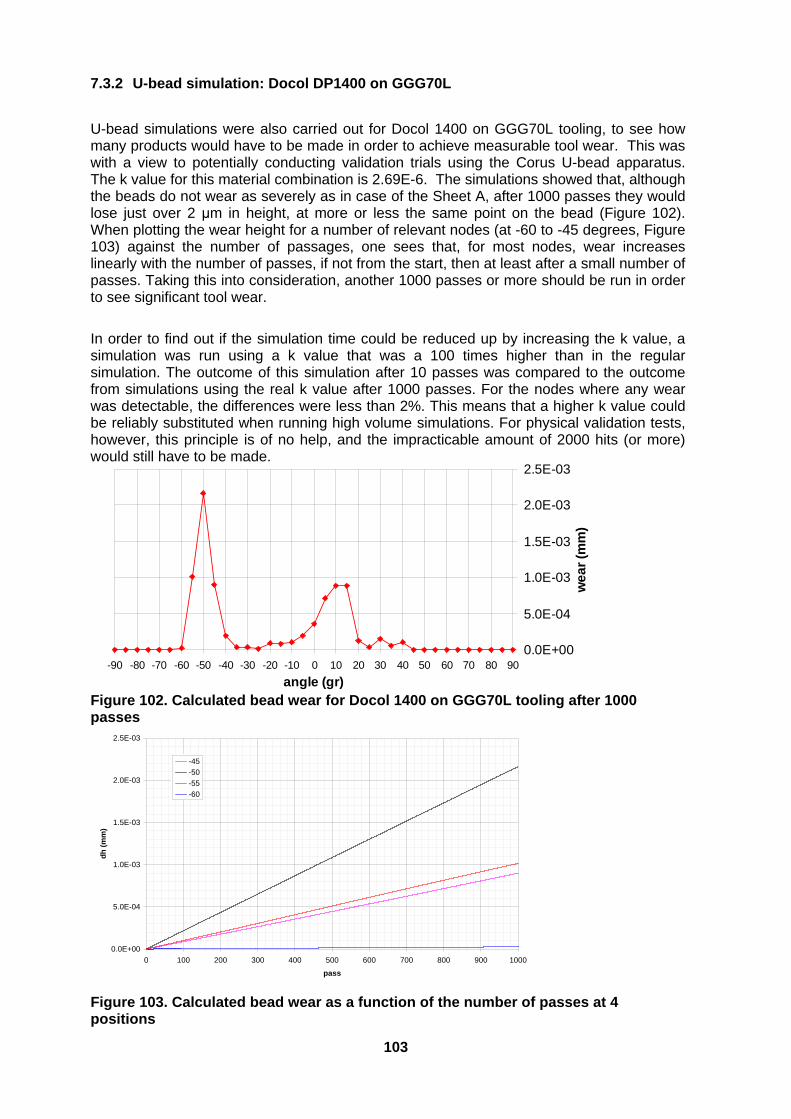
103
7.3.2 U-bead simulation: Docol DP1400 on GGG70L
U-bead simulations were also carried out for Docol 1400 on GGG70L tooling, to see how many products would have to be made in order to achieve measurable tool wear. This was with a view to potentially conducting validation trials using the Corus U-bead apparatus. The k value for this material combination is 2.69E-6. The simulations showed that, although the beads do not wear as severely as in case of the Sheet A, after 1000 passes they would lose just over 2 μm in height, at more or less the same point on the bead (Figure 102). When plotting the wear height for a number of relevant nodes (at -60 to -45 degrees, Figure 103) against the number of passages, one sees that, for most nodes, wear increases linearly with the number of passes, if not from the start, then at least after a small number of passes. Taking this into consideration, another 1000 passes or more should be run in order to see significant tool wear.
In order to find out if the simulation time could be reduced up by increasing the k value, a simulation was run using a k value that was a 100 times higher than in the regular simulation. The outcome of this simulation after 10 passes was compared to the outcome from simulations using the real k value after 1000 passes. For the nodes where any wear was detectable, the differences were less than 2%. This means that a higher k value could be reliably substituted when running high volume simulations. For physical validation tests, however, this principle is of no help, and the impracticable amount of 2000 hits (or more) would still have to be made.
0.0E+00
5.0E-04
1.0E-03
1.5E-03
2.0E-03
2.5E-03
-90 -80 -70 -60 -50 -40 -30 -20 -10 0 10 20 30 40 50 60 70 80 90
angle (gr)
we
ar
(mm
)
Figure 102. Calculated bead wear for Docol 1400 on GGG70L tooling after 1000 passes
0.0E+00
5.0E-04
1.0E-03
1.5E-03
2.0E-03
2.5E-03
0 100 200 300 400 500 600 700 800 900 1000
pass
dh
(m
m)
-45
-50
-55
-60
Figure 103. Calculated bead wear as a function of the number of passes at 4 positions
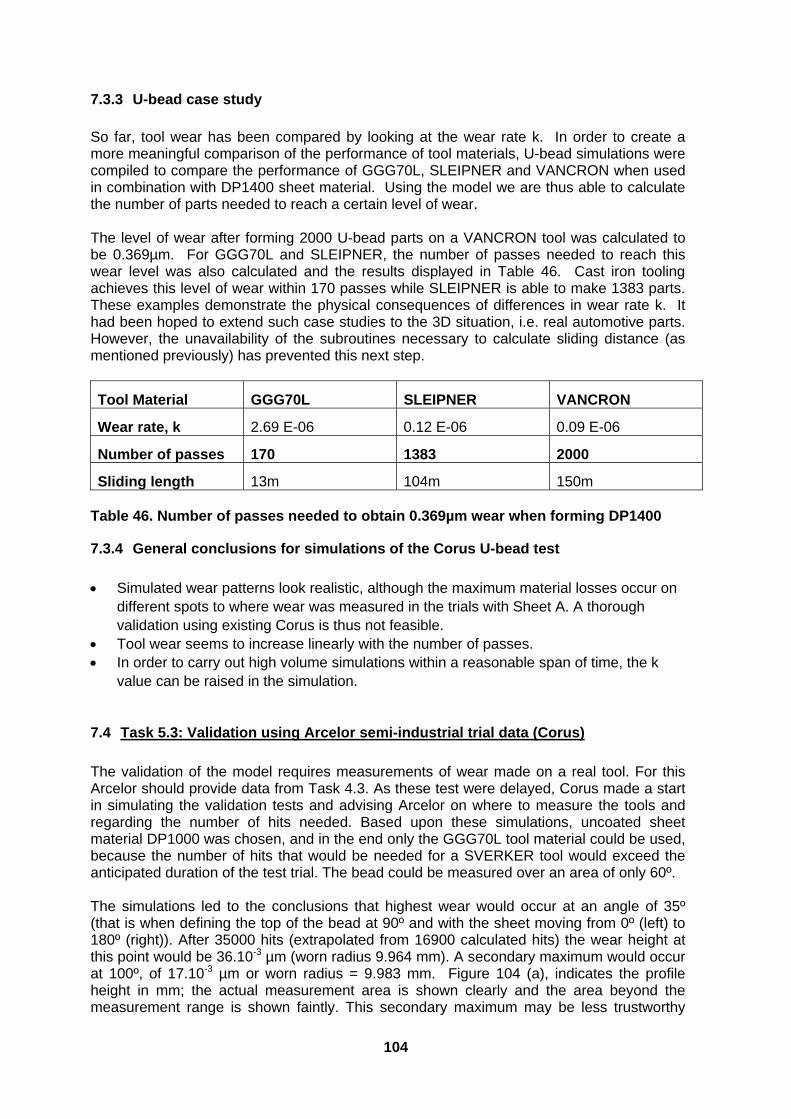
104
7.3.3 U-bead case study
So far, tool wear has been compared by looking at the wear rate k. In order to create a more meaningful comparison of the performance of tool materials, U-bead simulations were compiled to compare the performance of GGG70L, SLEIPNER and VANCRON when used in combination with DP1400 sheet material. Using the model we are thus able to calculate the number of parts needed to reach a certain level of wear. The level of wear after forming 2000 U-bead parts on a VANCRON tool was calculated to be 0.369µm. For GGG70L and SLEIPNER, the number of passes needed to reach this wear level was also calculated and the results displayed in Table 46. Cast iron tooling achieves this level of wear within 170 passes while SLEIPNER is able to make 1383 parts. These examples demonstrate the physical consequences of differences in wear rate k. It had been hoped to extend such case studies to the 3D situation, i.e. real automotive parts. However, the unavailability of the subroutines necessary to calculate sliding distance (as mentioned previously) has prevented this next step.
Tool Material GGG70L SLEIPNER VANCRON
Wear rate, k 2.69 E-06 0.12 E-06 0.09 E-06
Number of passes 170 1383 2000
Sliding length 13m 104m 150m Table 46. Number of passes needed to obtain 0.369µm wear when forming DP1400
7.3.4 General conclusions for simulations of the Corus U-bead test
Simulated wear patterns look realistic, although the maximum material losses occur on
different spots to where wear was measured in the trials with Sheet A. A thorough validation using existing Corus is thus not feasible.
Tool wear seems to increase linearly with the number of passes. In order to carry out high volume simulations within a reasonable span of time, the k
value can be raised in the simulation.
7.4 Task 5.3: Validation using Arcelor semi-industrial trial data (Corus)
The validation of the model requires measurements of wear made on a real tool. For this Arcelor should provide data from Task 4.3. As these test were delayed, Corus made a start in simulating the validation tests and advising Arcelor on where to measure the tools and regarding the number of hits needed. Based upon these simulations, uncoated sheet material DP1000 was chosen, and in the end only the GGG70L tool material could be used, because the number of hits that would be needed for a SVERKER tool would exceed the anticipated duration of the test trial. The bead could be measured over an area of only 60º. The simulations led to the conclusions that highest wear would occur at an angle of 35º (that is when defining the top of the bead at 90º and with the sheet moving from 0º (left) to 180º (right)). After 35000 hits (extrapolated from 16900 calculated hits) the wear height at this point would be 36.10-3 µm (worn radius 9.964 mm). A secondary maximum would occur at 100º, of 17.10-3 µm or worn radius = 9.983 mm. Figure 104 (a), indicates the profile height in mm; the actual measurement area is shown clearly and the area beyond the measurement range is shown faintly. This secondary maximum may be less trustworthy

105
due to its low value and ensuing numerical inaccuracies. When the Arcelor beads were measured (Figure 104 (b) and Task 4.3) it seems that the wear after 35000 was not higher than 25.10-3 mm ± 7.5.10-3 mm, in the 60º area where the wear could be measured. The calculated maximum does not lie within the area that was measured, only the secondary maximum. It is, therefore, not possible to draw any conclusions yet regarding the validity of the model. The fact that the sheet used for the test trials was given extra lubrication and the set up was asymmetric in a way that could not be modelled, already hampered validation. A point that can be confirmed, however, is that measured wear and calculated wear are of the same order of magnitude.
9.94
9.95
9.96
9.97
9.98
9.99
10.00
10.01
10.02
10.03
10.04
0 10 20 30 40 50 60 70 80 90 100 110 120 130 140 150 160 170 180
angular position
wea
r (m
m)
(a) Calculated profile height/angle on bead (90º = top, left side = incoming sheet)
9.94
9.95
9.96
9.97
9.98
9.99
10
10.01
10.02
10.03
10.04
50 60 70 80 90 100 110
Angular position (°)
Pro
fil
He
igh
t (m
m)
Initial Profile
Profile after 10000 hits
Prodile after 25000 hits
Profile after 35000 hits
~ 2
5 µ
m
Mean initial profile
(b) Measured profile height (mm in relation to 10 mm radius)
Figure 104. Simulated and measured draw bead profiles in U-bead trials
7.5 Task 5.4: Visualisation of the results in MS Powerpoint (Corus)
A MS Powerpoint presentation (Figure 105) has been created to introduce and demonstrate the DURATOOL abrasive wear model. The presentation can be found on the DURATOOL CD ROM [1]. Short films embedded in the presentation demonstrate the model in action. Notes accompany each page to enable a reader to understand what is shown on each slide. The presentation also includes a summary of the findings of work package 5, e.g. the effect of wear on deep drawing and product shape.
Figure 105. DURATOOL presentation

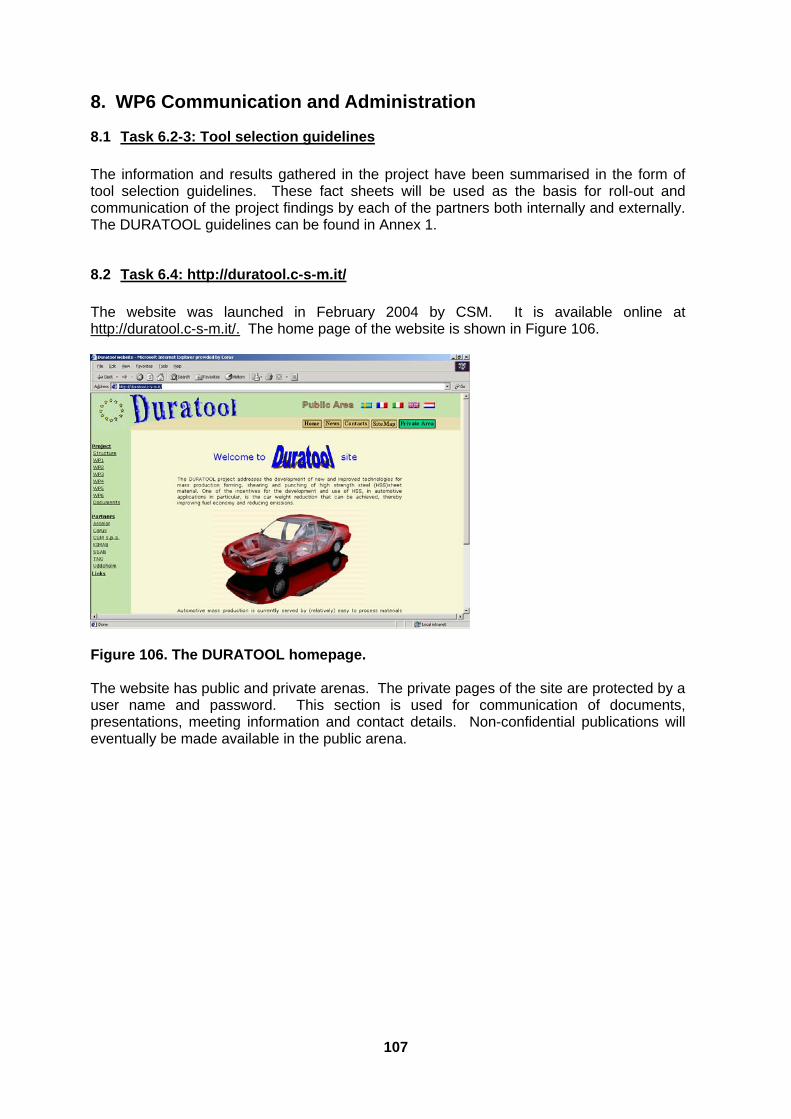
107
8. WP6 Communication and Administration
8.1 Task 6.2-3: Tool selection guidelines
The information and results gathered in the project have been summarised in the form of tool selection guidelines. These fact sheets will be used as the basis for roll-out and communication of the project findings by each of the partners both internally and externally. The DURATOOL guidelines can be found in Annex 1.
8.2 Task 6.4: http://duratool.c-s-m.it/
The website was launched in February 2004 by CSM. It is available online at http://duratool.c-s-m.it/. The home page of the website is shown in Figure 106.
Figure 106. The DURATOOL homepage. The website has public and private arenas. The private pages of the site are protected by a user name and password. This section is used for communication of documents, presentations, meeting information and contact details. Non-confidential publications will eventually be made available in the public arena.

109
9. CONCLUSIONS The use of (advanced) high strength sheet (A)HSS steels leads to higher forces, pressures and mechanical loading conditions in forming, shearing and punching applications. This places increasing demands upon tool materials, particularly in terms of their durability and wear performance. A range of tool and sheet steel materials, from the conventional to the most advanced, has been studied within the DURATOOL project. Tribological tests were used to assess wear and friction in forming for a large matrix of materials. High volume forming, shearing and punching trials were conducted on a more limited range. It is very disappointing that the results of high volume forming trials were unable to be used in the validation of the tribological and modelling work. The tribological findings of the project indicate that conventional tool materials do not perform well in terms of abrasive wear or adhesive wear for steels of tensile strengths above 800MPa and that more advanced/harder tool materials must be considered. Powder metallurgy grades and tool coatings such as TiC and TiAlN offer much improved wear resistance in such cases. Tool roughness and lubrication should be controlled to minimise adhesive wear. A finite element model has been developed to predict abrasive tool wear in forming, based upon Archard’s law. The model can be used to simulate and predict tool wear and changes in subsequent part geometry in 2D situations. It is hoped that the model can be extended to 3D situations soon. Studies using a U-bead product have shown that the changes in part geometry due to tool wear are significant for (A)HSS; the effect of wear on part springback is more pronounced as sheet strength increases. For best possible performance in shearing, the process set up should be optimised. A cutting clearance equal to 5% of sheet thickness and a shear angle of 1° is suitable for all sheet strengths, based on a study of shear forces and edge quality. High volume shearing trials show that shear edge quality is more dependent on sheet ductility than tool wear. High strength steels, therefore, produce a good edge with small burrs simply due to their reduced ductility, despite incurring increased tool wear. This implies that conventional tool materials may be sufficient for shearing (A)HSS. If reduced tool wear is also required, PM tool steels offer improved performance. In high volume punching trials, conventional tool steels were found to work well to 200 000 strokes for low carbon and mid-range high strength steels. For more demanding AHSS grades, only PM tool steels offered acceptable performance. Other types of advanced tool steels failed, as did a plasma nitride coated tool. The results of the project have been summarised in the form of tool selection guidelines (Annex 1). The guidelines start with an introduction to various tool steel and coating technologies. Selected results of the project are used to highlight issues to consider when selecting tool materials for forming, shearing and punching applications. The document will form the basis for dissemination of the results by the partners both internally and externally.

111
10. LIST OF FIGURES Figure 1. Representation of the types of steel sheet available and selection for
DURATOOL (highlighted in red) ................................................................................... 6 Figure 2. Example wear scars measured in TNO PLOT test. ........................................... 7 Figure 3. Location of the wear scar on the TNO test tool ................................................. 7 Figure 4. Wear rate measured in TNO PLOT test for three uncoated dual phase
grades and several tool materials ................................................................................ 8 Figure 5. Increasing friction with tool roughness for GI material .................................... 9 Figure 6. Shearing angle α and cutting clearance .......................................................... 11 Figure 7. Cut edge formation ............................................................................................ 11 Figure 8. Measured burr heights after 200,000 strokes. ................................................. 12 Figure 9. Chipping of PN treated CALDIE knives following trial with Docol 1000DP .. 12 Figure 10. Measured burr heights after 200,000 strokes. ............................................... 13 Figure 11. PN coating did not improve performance of SLEIPNER punch for
HR700MC ...................................................................................................................... 13 Figure 12. Measured hat profiles for DC04 and DP1400 for each bead ........................ 14 Figure 13. Simulated hat profiles for DC04 and DP1400 for each bead ........................ 15 Figure 14. DURATOOL guidelines ................................................................................... 15 Figure 15 Production tool from a car manufacturer ....................................................... 17 Figure 16 Flow diagram Work Packages .......................................................................... 19 Figure 17 Electro slag remelting metallurgy .................................................................... 23 Figure 18 Powder metallurgy ............................................................................................ 24 Figure 19 Spray forming metallurgy. ................................................................................ 24 Figure 20 A schematic illustration of PVD process. ....................................................... 26 Figure 21. Forming tool used for forming of high strength steel (left) and detail (right)
of an area sensitive to wear. ....................................................................................... 30 Figure 22. Contact pressure as a function of the applied normal load for the slider-on-
sheet configuration for (left) DC 06 and (right) DP 600. ........................................... 30 Figure 23 a) Schematic representation of the TNO slider – on – sheet test ................. 32 Figure 24 TNO slider-on-sheet tribometer. (1) frame; (2) table; (3) Linear modules for
translation in x and y direction; (4) digital servomotor; (5) measurement unit; (6) sheet material; (7) data acquisition computer. ......................................................... 32
Figure 25. Comparison of wear scars for CR DP materials. The length of the wear scar is given in mm. .................................................................................................... 34
Figure 26. Comparison of wear scars on HR700MC. The length of the scars is 1.3mm, 2.8mm and 0.7mm for VANCRON, SLEIPNER 63 HRC and SLEIPNER + TiAlN, respectively .................................................................................................................. 35
Figure 27. Specific wear rate of tool materials in combination with high strength ..... 36 Figure 28. Wear scar on SLEIPNER 63 after sliding on DP 600 GI (Arrow indicates
transferred zinc layer) ................................................................................................. 37 Figure 29. Wear scar VANCRON slider after 1500m sliding on 220YD ......................... 38 Figure 30. The geometry of the BUT tool pin. .................................................................. 41 Figure 31. An optical micrograph of the surface of the GGG70L tool and 3D
illustration of the surface topography. ...................................................................... 41 Figure 32. An optical micrograph of the surface of the GGG70L + hard Cr plated tool
and 3D illustration of the surface topography (before polishing). .......................... 41 Figure 33. Principle of BUT method. ................................................................................ 42 Figure 34 . Bending Under Tension tribometer. .............................................................. 42 Figure 35. Friction curves for Dogal 800DP ..................................................................... 43 Figure 36 (a) Galling pick-up on GGG70L (b) Mild galling on SVERKER 21 .......... 44 Figure 37. Wear on SLEIPNER hard tool measured by confocal microscope. ............. 45 Figure 38. BUT friction curves for Domex 700 MC. ......................................................... 45 Figure 39. Wear on GGG70L after testing 30 strokes with Domex 700MC. .................. 46 Figure 40a. Docol 1400DP b. Docol 1400DP, strokes 1-160 ............................ 47
112
Figure 41. Wear on GGG70L + hard Cr plating in contact with Docol 1400DP. ............ 47 Figure 42. Principles of the RFT test ................................................................................ 49 Figure 43. Effect of surface roughness on friction in the RFT test at 20MPa pressure
....................................................................................................................................... 51 Figure 44 Coefficient of friction in the RFT test for all sheet materials against
reference tool SVERKER 21 at 20MPa contact pressure ......................................... 52 Figure 45. Average coefficient of friction in the RFT test for the lubricants Quaker
DC4 (Hot melt) and Quaker N6130 (prelube) in combination with galvanised sheet (5MPa) ........................................................................................................................... 53
Figure 46. Average coefficient of friction in the RFT test for the lubricants Quaker DC4 (Hot melt) and Quaker N6130 (prelube) in combination with Docol DP1000 (5MPa) ........................................................................................................................... 53
Figure 47. Principle of the flat-flat tribometer .................................................................. 55 Figure 48. Principle of the draw-bead tribometer ............................................................ 56 Figure 49. Friction coefficient vs. Pressure curves for all 13 sheet materials tested
with the Uncoated SVERKER 21 (tool roughness Ra~ 0,05µm) in flat-flat test ...... 56 Figure 50. Influence of the tool roughness on the friction coefficient on GI-coated
sheet ............................................................................................................................. 57 Figure 51. Influence of tool Ra roughness on the average friction coefficient ............ 58 Figure 52. Typical result for uncoated sheet steel (DP1000) ......................................... 59 Figure 53. Typical result for GI sheet steel (DP800GI) .................................................... 59 Figure 54. Ranking of the results for (a) flat-flat test and (b) draw-bead test for both
coated and uncoated sheets and comparison with tool surface roughness ranking .......................................................................................................................... 60
Figure 55. CSM Adhesive wear test .................................................................................. 60 Figure 56. Punching and shearing tool, punch diameter 10mm. ................................... 65 Figure 57. Shearing angle and cutting clearance respectively ...................................... 66 Figure 58 Typical relationship between shear angle and shear force (0.5mm sheet
thickness, 10% cutting clearance for various sheet grades) .................................. 67 Figure 59. Illustration of the active cutting edge on the upper knife. ........................... 68 Figure 60. Shear forces when working with DC04 and Docol 1400M respectively,
thickness 2 mm and 5% cutting clearance. ............................................................... 69 Figure 61. Example of change in specific force with shear angle for a range of steels
(5% clearance, 1mm thickness) .................................................................................. 69 Figure 62. Illustration of the principle when measuring the punch wear ..................... 72 Figure 63. Equipment used for the burr height measurements of the ejected slugs. . 72 Figure 64. One of the SLEIPNER punches in combination with DC04 at start and after
200,000 strokes. 0.5% increase in force and 13% increase in work. ...................... 73 Figure 65. SLEIPNER in combination with non pickled Domex 700MC at start and
after 200,000 strokes. 14% increase in force and 63% increase in work. ............... 73 Figure 66. Punch force and work progress as a function of strokes for Domex 700MC,
non pickled. The vertical lines indicate the deviation between two punches. Dotted lines indicate that the die has been replaced after 100,000 strokes. ......... 74
Figure 67. Measured punch wear after 200,000 strokes. ................................................ 74 Figure 68. Scanning electron microscope image of the SLEIPNER punch after 200,000
strokes (left) and another SLEIPNER punch stopped after 100,000 strokes (right). Both tested in combination with non pickled Domex 700MC. ................................. 75
Figure 69. Images from Scanning Electron Microscope of one VANADIS 4 EXTRA punch tested using non pickled Domex 700MC with one die. Typical wear type from Domex 700MC is a combination of small edge chipping, abrasive wear and galling. .......................................................................................................................... 76
Figure 70. Measured burr heights after 200,000 strokes. ............................................... 76 Figure 71. SEM images of sheet edge appearance for Domex 700MC at start (left) and
after 200,000 strokes (right). After 200,000 strokes the slugs have a rougher edge surface with bigger burr and vane formation. .......................................................... 77
Figure 72. Slugs and holes from the punching with SLEIPNER in non pickled Domex 700MC at start (left) and after 200 000 strokes (right). ............................................. 77
113
Figure 73. Example of a new edge profile and a worn edge profile respectively. ........ 79 Figure 74. SEM images from upper knife made of Roltec SF tested with Dogal 800DP
....................................................................................................................................... 80 Figure 75. Total knife wear from the tests. ...................................................................... 81 Figure 76. Measured burr heights after 200,000 strokes. ............................................... 81 Figure 77. The small burr formation on Dogal 800DP sheet edge after 200,000 .......... 82 Figure 78. Swift test description ....................................................................................... 86 Figure 79. Example of the effects of the test parameter modification .......................... 86 Figure 80. Measurement of roughness ............................................................................ 86 Figure 81. Cup test results for SSAB DC04 CR ............................................................... 88 Figure 82. Cup test results HSLA340 GI (note reduced blankholder load for PN tool) 88 Figure 83. Example of a stamped product Figure 84. The semi-industrial press ... 89 Figure 85. Schematic diagram of U-bead tool set up indicating main zones for galling
observation. ................................................................................................................. 90 Figure 86. Wear measurement device .............................................................................. 91 Figure 87. Wear measurement device accuracy. Results obtained from measurement
of draw-bead with theoretical initial radius 10mm. .................................................. 92 Figure 88. Wear measurement on draw-bead after 10000, 25000 and 35000 hits. ....... 93 Figure 89. Approach 2: wear after first cycle (left) and after 100 cycles (right) in cup
drawing simulation ...................................................................................................... 96 Figure 90. Visualization of the calculated wear depth of die (left) and punch (right)
after 100 strokes (please note the difference in scale) ............................................ 97 Figure 91. Geometry of ring slider in mm for k = 1.0E-05 after 2500-10000 passes..... 97 Figure 92. Wear rate k value as calculated from worn volume during ring sliding ..... 98 Figure 93. Schematic view of Corus U-bead tool ............................................................ 98 Figure 94. Machined draw beads: 10 mm radius (left), with calculated shape after 50
cycles with k = 10-6 mm3/Nmm (centre) and after 40 cycles with k =10-5 mm3/Nmm (right). ........................................................................................................................... 99
Figure 95. Bead geometries (a) without wear (r10), (b) with wear calculated from k=10-6 over 40 passes (k6) and (c) with wear calculated from k=10-5 over 50 passes (k5) ................................................................................................................................ 99
Figure 96. Result of the U-bead forming experiments with a draw bead with 10 mm radius .......................................................................................................................... 100
Figure 97. Measured hat profiles for DC04 and DP1400 for each bead ...................... 100 Figure 98. Simulated hat profiles for DC04 and DP1400 for each bead ...................... 100 Figure 99. Measured punch force for DC04 and DP1400 with each draw bead ......... 101 Figure 100. Calculated bead wear after 400 passes of Sheet A on GGG70L tool ...... 102 Figure 101. Calculated bead wear after 400 passes of Sheet A on GGG70L tool ...... 102 Figure 102. Calculated bead wear for Docol 1400 on GGG70L tooling after 1000
passes ......................................................................................................................... 103 Figure 103. Calculated bead wear as a function of the number of passes at 4
positions ..................................................................................................................... 103 Figure 104. Simulated and measured draw bead profiles in U-bead trials ................. 105 Figure 105. DURATOOL presentation ............................................................................ 105 Figure 106. The DURATOOL homepage. ........................................................................ 107
114
11. LIST OF TABLES Table 1. Tool materials studied Table 2. Tool coatings studied ........................... 5 Table 3. Tool selection to minimise abrasive wear ........................................................... 8 Table 4. Galling resistance of tool materials with GI sheet .............................................. 9 Table 5. Optimum shearing parameters ........................................................................... 11 Table 6. Effect of shear parameters on force .................................................................. 11 Table 7 Materials selection for WP2 Tribology and WP4 Forming ............................... 22 Table 8. Materials selection for WP3 Punching and Shearing trials ............................ 22 Table 9 : Composition of Tool steel grades from Uddeholm Tooling AB. .................... 28 Table 10 : Composition of cast iron GGG70L. ................................................................. 28 Table 11 : Tool materials selection for WP2 Tribology and WP4 Forming ................... 28 Table 12 Tool materials selection for WP3 Punching and Shearing trials ................... 28 Table 13 Long term model wear test matrix .................................................................... 33 Table 14 Effect of operational conditions test matrix (HR700MC, SLEIPNER) ............. 33 Table 15. Specific wear rate for GGG70L in sliding contact with DP 800 CR ............... 35 Table 16. Summary of the slider-on-sheet experiments with HR 700 MC / PQ 69/
SLEIPNER as a function of the sliding velocity (v) and normal force (FN). ............ 36 Table 17. Initial friction values Table 18. Friction at the end of experiment.
Bold script means galling occurred ........................................................................... 38 Table 19. Overview of the results with zinc-coated sheets ............................................ 38 Table 20. Sheet materials for BUT evaluation. ................................................................ 40 Table 21. Overview of tool materials. ............................................................................... 41 Table 22. Test programme for long term wear evaluation. ............................................. 43 Table 23. Wear rates for different tool materials tested with DP1000. .......................... 44 Table 24. Wear rates in BUT testing with Domex 700MC ............................................... 46 Table 25. Wear rates in testing with Docol 1400DP. ....................................................... 47 Table 26. Testing conditions used in RFT test to determine the Stribeck curve ......... 49 Table 27. RFT test matrix with tool roughness values ................................................... 50 Table 28. Overview of tool material for draw-bead tests ................................................ 55 Table 29. Average friction coefficient in the flat-flat test ................................................ 57 Table 30. Tool and sheet materials used in CSM testing at elevated temperatures .... 60 Table 31. CSM adhesive wear test conditions ................................................................ 61 Table 32. Results of adhesive wear testing at elevated temperatures .......................... 61 Table 33. Test plan for the parameter test in WP3.1 Grey indicates tested
combinations. CR=cold rolled, Gl=hot dip galvanized, HR=hot rolled, EG=Electro galvanized. ................................................................................................................... 66
The tests conducted in the high volume punching program were made using the sheet materials and tool combinations shown in Table 34. 1mm thickness DC04 and Docol 350YP was tested, whereas 2mm Domex 700MC was used. For sheet material Domex 700MC (pickled) different tool surface treatments were also tested. The punch was made from the tool material to be investigated but the die material in all tests was AISI A2. The tests for Domex 700MC used sheet material with two different surface conditions, pickled and non pickled (sourced by mistake). The non pickled material gave significantly higher tool wear than the pickled variant. ............................................................................................................. 71
Table 35. Test program for high volume punching (black indicates that a double test ....................................................................................................................................... 72
Table 36. Test program for high volume shearing. Grey indicates test according to original plan, black is outside plan. Crosses show optional test in case of galling. ....................................................................................................................................... 79
Table 37. Sheets tested in the cup test ............................................................................ 85 Table 38. Tools tested in the cup test .............................................................................. 85 Table 39. Die roughness .................................................................................................... 87 Table 40. Scheduled test matrix for high volume semi-industrial press trials ............. 88
115
Table 41. Semi-industrial tool specifications. ................................................................. 89 Table 42. Results (galling) after 20000 strokes. .............................................................. 90 Table 43. Semi-industrial U-bead trial results ................................................................. 92 Table 44. Sheet materials used in U-bead study of the effect of bead wear on
geometry ....................................................................................................................... 99 Table 45. Material properties and k value Sheet A on GGG70L tool ........................... 102 Table 46. Number of passes needed to obtain 0.369µm wear when forming DP1400
..................................................................................................................................... 104
12. LIST OF REFERENCES 1 DURATOOL CD ROM, contains all task deliverable reports, CD provided with each copy of the final report and also available online at CIRCA 2 DIN 50320: Verschleiss – Begriffe, Systemanalyse von Verschleissvorgängen, Gliederung des Verschleissgebietes, Beuth Verlag, Berlin, 1979


European Commission EUR 25329 — Mass production forming of high strength steel with durable tooling (Duratool) Luxembourg: Publications Office of the European Union 2013 — 115 pp. — 21 × 29.7 cm ISBN 978-92-79-24934-1doi:10.2777/9504

EUROPEAN COMMISSION Directorate-General for Research and Innovation Directorate G — Industrial Technologies Unit G.5 — Research Fund for Coal and Steel
E-mail: [email protected] [email protected]
Contact: RFCS Publications
European Commission 1049 Bruxelles/Brussel, BELGIQUE/BELGIË
HOW TO OBTAIN EU PUBLICATIONS Free publications: • via EU Bookshop (http://bookshop.europa.eu);
• at the European Union’s representations or delegations. You can obtain their contact details on the Internet (http://ec.europa.eu) or by sending a fax to +352 2929-42758.
Priced publications: • via EU Bookshop (http://bookshop.europa.eu).
Priced subscriptions (e.g. annual series of the Official Journal of the European Union and reports of cases before the Court of Justice of the European Union): • via one of the sales agents of the Publications Office of the European Union
(http://publications.europa.eu/others/agents/index_en.htm).
Mass productionforming of high strength steel with
durable tooling(Duratool)
doi:10.2777/9504
Mass production form
ing of high strength steel with durable tooling (D
uratool)EU
EUR 25329
KI-NA-25329-EN
-N
The use of (advanced) high strength sheet (A)HSS in forming, shearing and punching applications places increasing demands upon tool materials, particularly in terms of wear performance. A range of tool and sheet steel materials has been studied within the Duratoolproject. Tribological tests were used to assess wear and friction in forming. High volume forming, shearing and punching trials were also conducted.
The tribological findings indicate that conventional tool materials do not perform well in terms of adhesive wear or abrasive wear for steels of tensile strengths above 800 MPa and that more advanced tool materials and coatings must be considered. Tool roughness and lubrication should be controlled to minimise adhesive wear.
A finite element model has been developed to predict abrasive tool wear in forming. The model can be used to simulate tool wear and changes in subsequent part geometry. Studies show that changes in part geometry due to tool wear are significant for (A)HSS.
For best performance in shearing, the process should be optimised. A cutting clearance equal to 5 % of sheet thickness and a shear angle of 1 ° is suitable for all sheet strengths. High volume shearing trials show that edge quality is more dependent on sheet ductility than tool wear. High strength steels produce a good edge with small burrs simply due to their reduced ductility, despite incurring increased tool wear.
In punching trials, conventional tool steels were found to work well to 200 000 strokes for low carbon and mid-range high strength steels. For more demanding AHSS grades, only PM tool steels offered acceptable performance.
The results of the project have been summarised in the form of tool selection guidelines.
Studies and reports
Research and Innovation EUR 25329 EN
Copyright © 2022 FDOKUMEN